the most successful regional aircraft programs in history
TRANSCRIPT

The most successfulRegional Aircraft programs in history.
Regional Aircraft … The Way Forward
Presented by Mike LewisSeptember 26, 2006
2
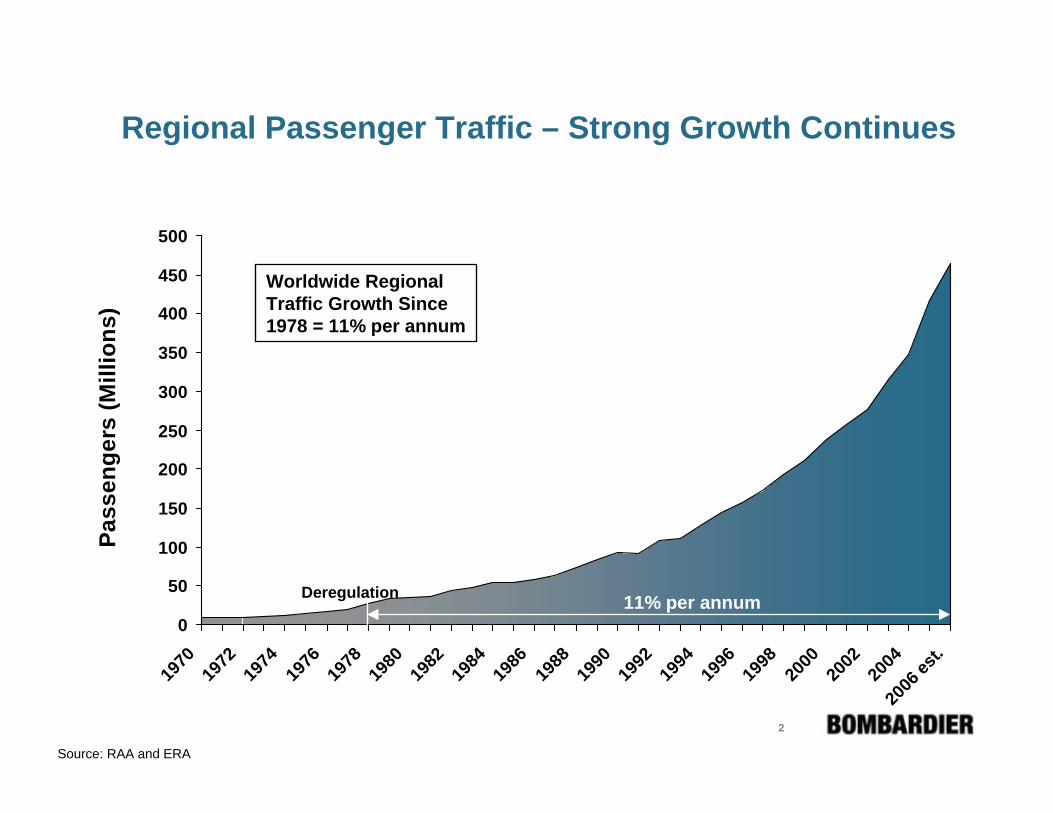
Regional Passenger Traffic – Strong Growth Continues
0
50
100
150
200
250
300
350
400
450
500
1970
1972
1974
1976
1978
1980
1982
1984
1986
1988
1990
1992
1994
1996
1998
2000
2002
2004
2006
est.
Pass
enge
rs (M
illio
ns)
11% per annum
Worldwide Regional Traffic Growth Since 1978 = 11% per annum
Deregulation
Source: RAA and ERA
3
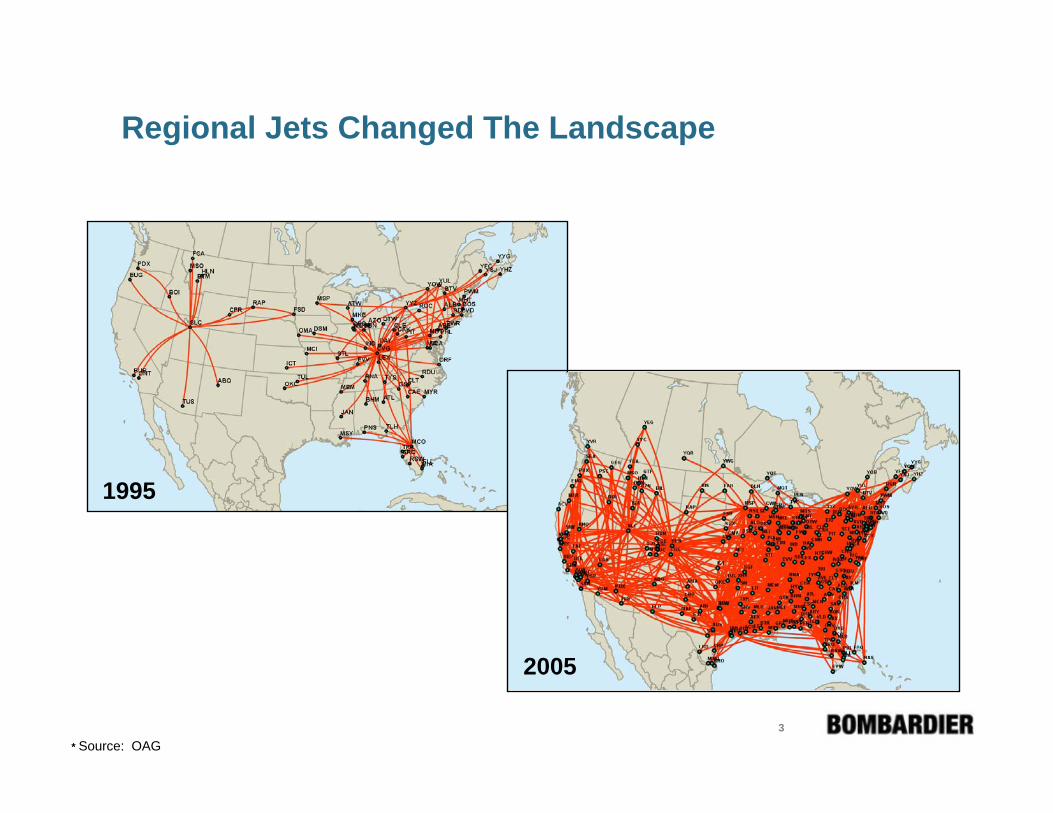
1995
* Source: OAG
2005
Regional Jets Changed The Landscape
4
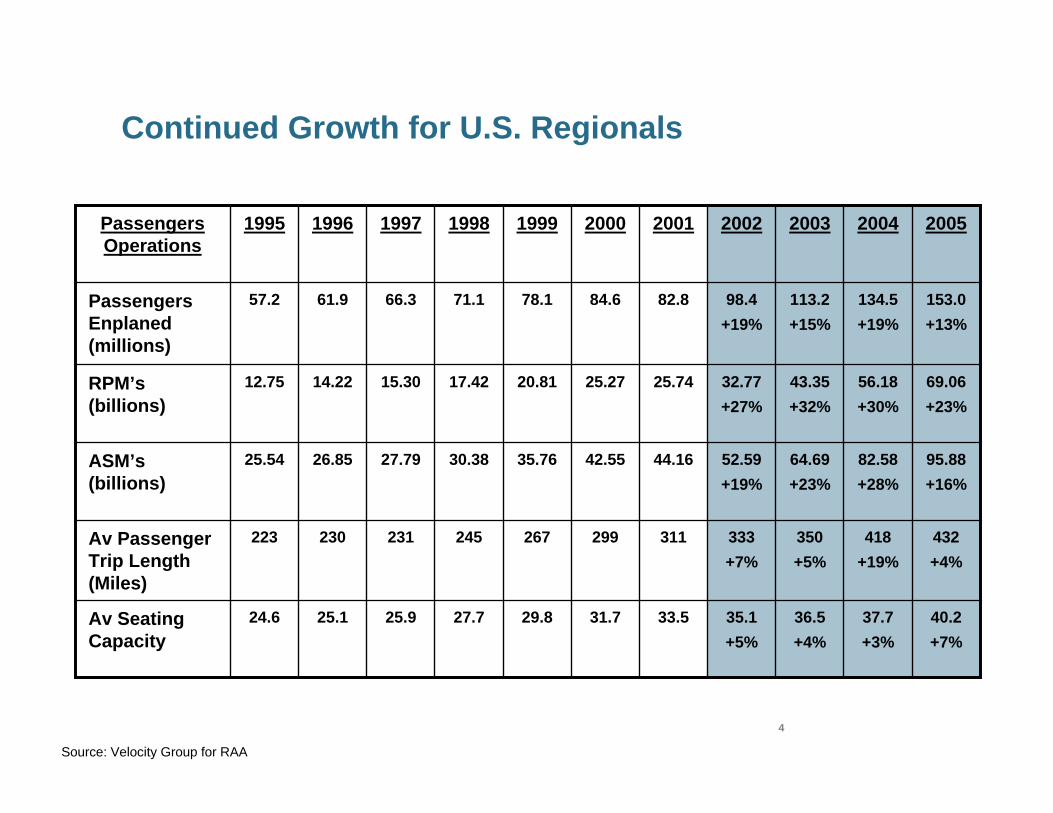
Continued Growth for U.S. Regionals
40.2+7%
432+4%
95.88+16%
69.06+23%
153.0+13%
2005
35.1+5%
333+7%
52.59+19%
32.77+27%
98.4+19%
2002
36.5+4%
350+5%
64.69+23%
43.35+32%
113.2+15%
2003
37.7+3%
33.531.729.827.725.925.124.6Av Seating Capacity
418+19%
311299267245231230223Av Passenger Trip Length (Miles)
25.54
12.75
57.2
1995
26.85
14.22
61.9
1996
27.79
15.30
66.3
1997
30.38
17.42
71.1
1998
82.58+28%
44.1642.5535.76ASM’s(billions)
56.18+30%
25.7425.2720.81RPM’s(billions)
134.5+19%
82.884.678.1Passengers Enplaned (millions)
2004200120001999Passengers Operations
Source: Velocity Group for RAA

5
50-seat Regional Jets are an integral part of airlines’ networks
Source: OAG
0
500
1,000
1,500
2,000
2,500
3,000
3,500
20 30 50 70 90 110
130
150
170
190
210
230
250
270
290
310
330
350
370
390
410
430
450+
20002005
Average Seats per Departure
No. of Markets
Worldwide Scheduled Non-stop Markets by Average Seats Offered
• No sign of significant fleet withdrawal
• Short term surplus aircraft are expected to go back into the system
6
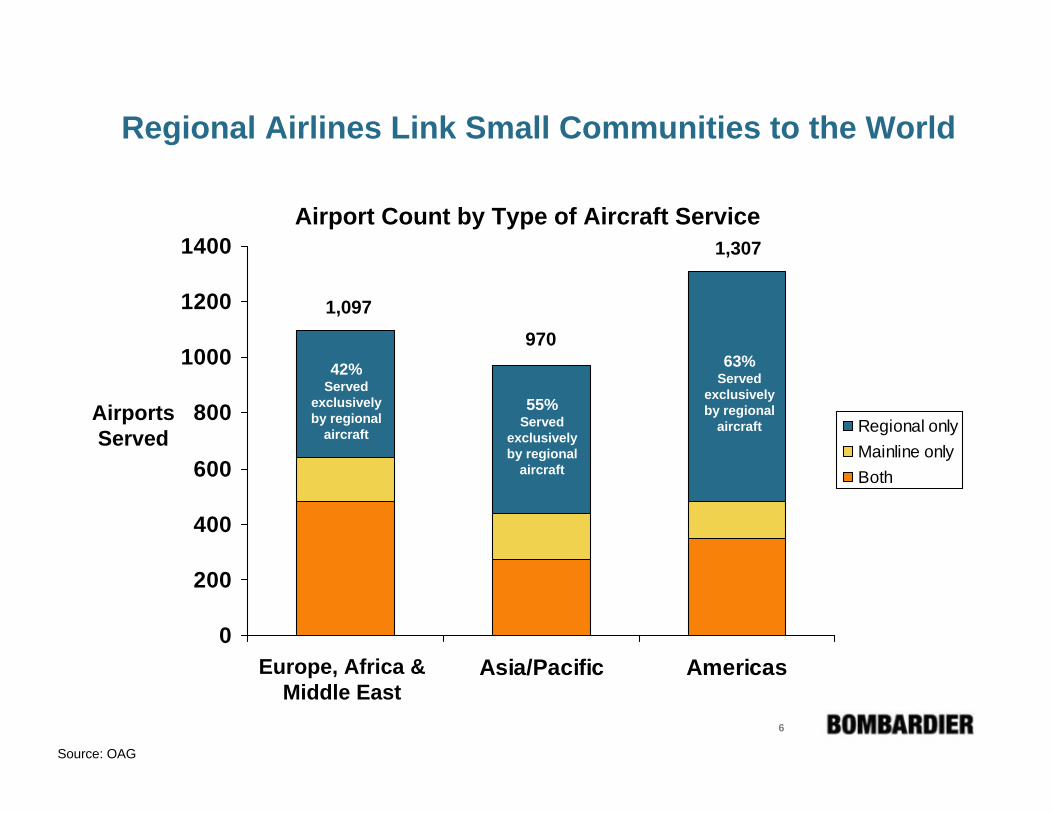
Regional Airlines Link Small Communities to the World
0
200
400
600
800
1000
1200
1400
Eurpoe, Africa &Middle East
Asia/Pacific Americas
Regional onlyMainline onlyBoth
1,097
1,307
Source: OAG
Airports Served
Airport Count by Type of Aircraft Service
97042%
Served exclusively by regional
aircraft
55%Served
exclusively by regional
aircraft
63%Served
exclusively by regional
aircraft
Europe, Africa &Middle East

7
Regional Airlines and Low Cost Carriers Are Part of the Same Market Dynamic
91%83% 84%
76% 71% 66% 61% 59% 57%
7% 9%11% 13% 16%
19% 20% 21%
3% 10% 7% 14% 16% 18% 20% 21% 22%5%
1980 1985 1990 1995 2000 2002 2003 2004 2005
Network Regionals Low Cost
Historical Distribution of U.S. Domestic Passenger Enplanements
Source: Velocity Group for RAA

8
Airline Challenges are Intensifying
4.0¢
8.3¢
1978 1983 1988 1993 1998 2003
55¢
163¢
1995 1997 1999 2001 2003 2005
Source: ATA, cents per US gallon US carrier average yield in 1978 cents
Increasing cost of jet fuel
Decreasing passenger yield
9.3¢
12.1¢
8.6¢ 8.2¢
1990 1991 1992 1993 1994 1995 1996 1997 1998 1999 2000 2001 2002 2003 2004
Network carrier
Low cost carrier
US DOT Form 41
Diverging CASM gap

9
6¢
8¢
10¢
12¢
14¢
16¢
$0 $5 $10 $15 $20 $25
As Major Carriers Drop Their Small NarrowbodiesThey Outsource the Routes to Regional Partners
Aircraft Unit Cost Comparison (500 nm Sector)
Cos
t per
sea
t-mile
(US¢
)
Cost per mile (US$)
Low Fare Carriers
Regional Carriers
Assumptions: US operating environment and fuel price @ $1.80 per US gallon
Outsourced Routes
Network Carriers110 Seaters
130 Seaters
150 Seaters
50 Seaters
70 Seaters
90 Seaters
2005 US Domestic Yield Curve
180 Seaters

10
The Capacity Growth and Outsourcing Trends Are Evident in Reported Figures
16.2% 16.8% 18.1% 19.6% 20.0% 22.4%
35.3
35.9
36.4
36.8
37.5
38.0
2000 2001 2002 2003 2004 2005
83.8% 83.2% 81.9% 80.4% 80.0% 77.6%
170.9
172.0
173.0 173.2
174.1
174.8
2000 2001 2002 2003 2004 2005
Regional Aircraft Market Share and Average Seat Capacity
Mainline Aircraft Market Share and Average Seat Capacity
Average seats per departureTotal seats offered
Source: OAG, US & Europe data ONLY

11
Industry Instability Will Continue Until Segmentation Share Equilibrium Is Reached
Networks will match their operating costs to the premium the passenger is willing to pay:
Restructure - labor- productivity- schedule- distribution- simplification
Route Transfer to Regional Partners- scope- cost
Operating Costs Are The Key
Network Carriers57%
Network Carriers33%
Regional Airlines
21%
Low Cost Carriers
22%
Regional Airlines
33%
Low Cost Carriers
33%
Today EquilibriumN
etw
ork
Car
riers
Where Will It End Up ?
12
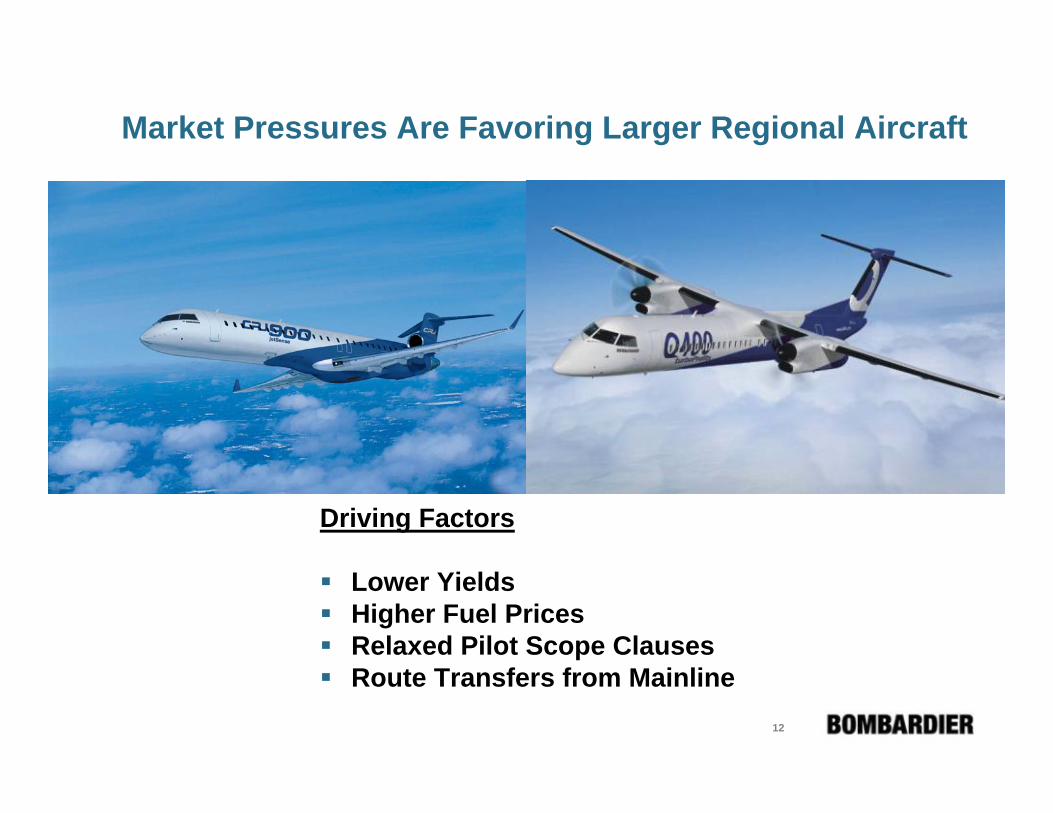
Market Pressures Are Favoring Larger Regional Aircraft
Driving Factors
Lower YieldsHigher Fuel PricesRelaxed Pilot Scope ClausesRoute Transfers from Mainline
13
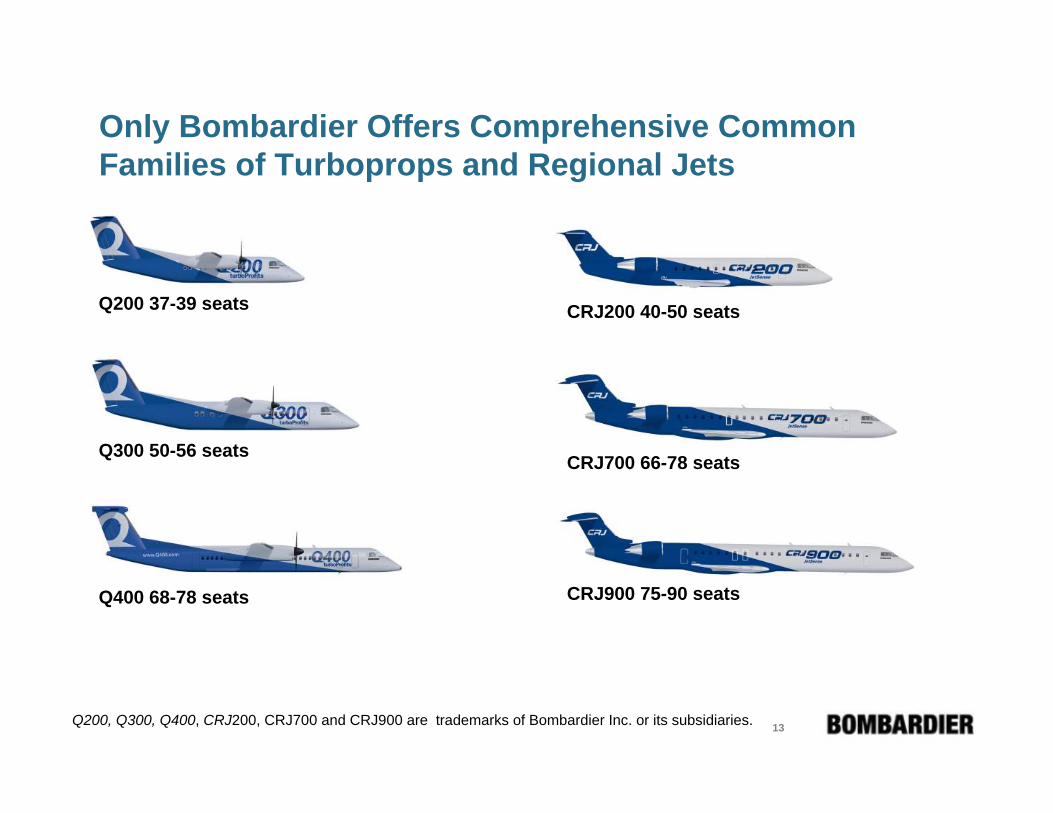
Only Bombardier Offers Comprehensive Common Families of Turboprops and Regional Jets
Q200, Q300, Q400, CRJ200, CRJ700 and CRJ900 are trademarks of Bombardier Inc. or its subsidiaries.
Q200 37-39 seats
Q300 50-56 seats
Q400 68-78 seats
CRJ200 40-50 seats
CRJ700 66-78 seats
CRJ900 75-90 seats

14
Bombardier Has Lead the Market Over Five yearsGross Orders in the 20-99 Seat Regional Market
72%
51%58% 60%
50%42%
28%
49%42% 40%
50%58%
2001 2002 2003 2004 2005 2006 Ytd
Bombardier Others
Note: Data includes order conversions between programs. Does not include corporate shuttle aircraft.
At September 27, 2006
15
Regional Jet Market & Programs
16
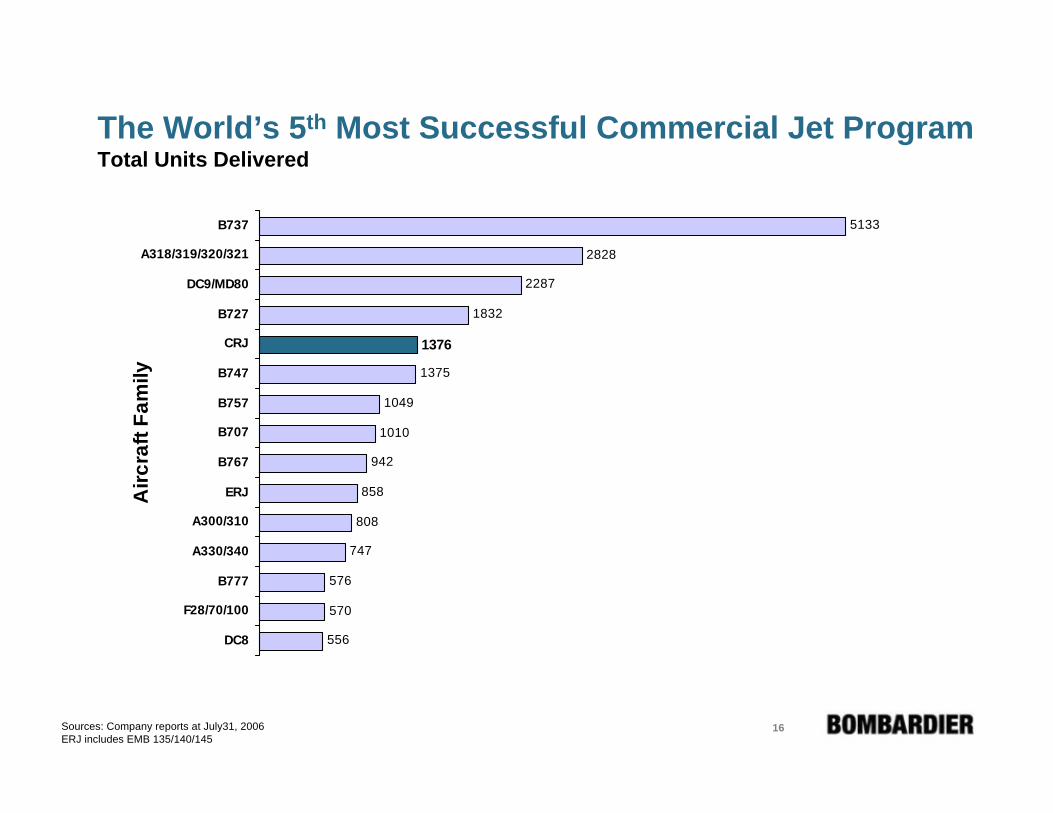
556
570
576
747
808
858
942
1010
1049
1832
2287
2828
5133
1376
1375
DC8
F28/70/100
B777
A330/340
A300/310
ERJ
B767
B707
B757
B747
CRJ
B727
DC9/MD80
A318/319/320/321
B737
Airc
raft
Fam
ilyThe World’s 5th Most Successful Commercial Jet ProgramTotal Units Delivered
Sources: Company reports at July31, 2006ERJ includes EMB 135/140/145

17
45 Customers Worldwide
Diverse Customer Base for the CRJ Series

18
Bombardier CRJ Series Sales StatusAs of July 31, 2006
29255284CRJ700*
731,3761,449Total
4359102CRJ900
01515CRJ705
11,0471,048CRJ100/200/440*
BacklogDelivered Aircraft
Firm Aircraft
* Includes Corporate variants of the CRJ (Orders and deliveries include 26 CRJ200 and seven CRJ700.)
19
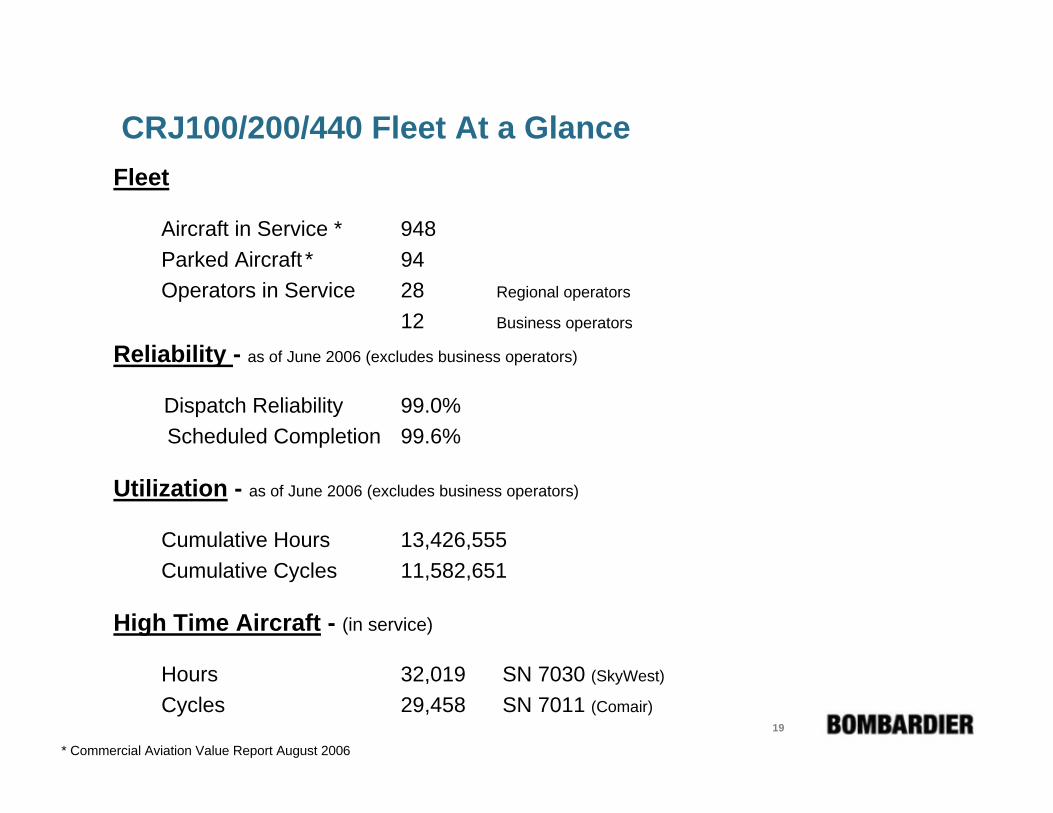
CRJ100/200/440 Fleet At a Glance Fleet
Aircraft in Service * 948Parked Aircraft * 94Operators in Service 28 Regional operators
12 Business operators
Reliability - as of June 2006 (excludes business operators)
Dispatch Reliability 99.0%Scheduled Completion 99.6%
Utilization - as of June 2006 (excludes business operators)
Cumulative Hours 13,426,555Cumulative Cycles 11,582,651
High Time Aircraft - (in service)
Hours 32,019 SN 7030 (SkyWest)
Cycles 29,458 SN 7011 (Comair)
* Commercial Aviation Value Report August 2006
20
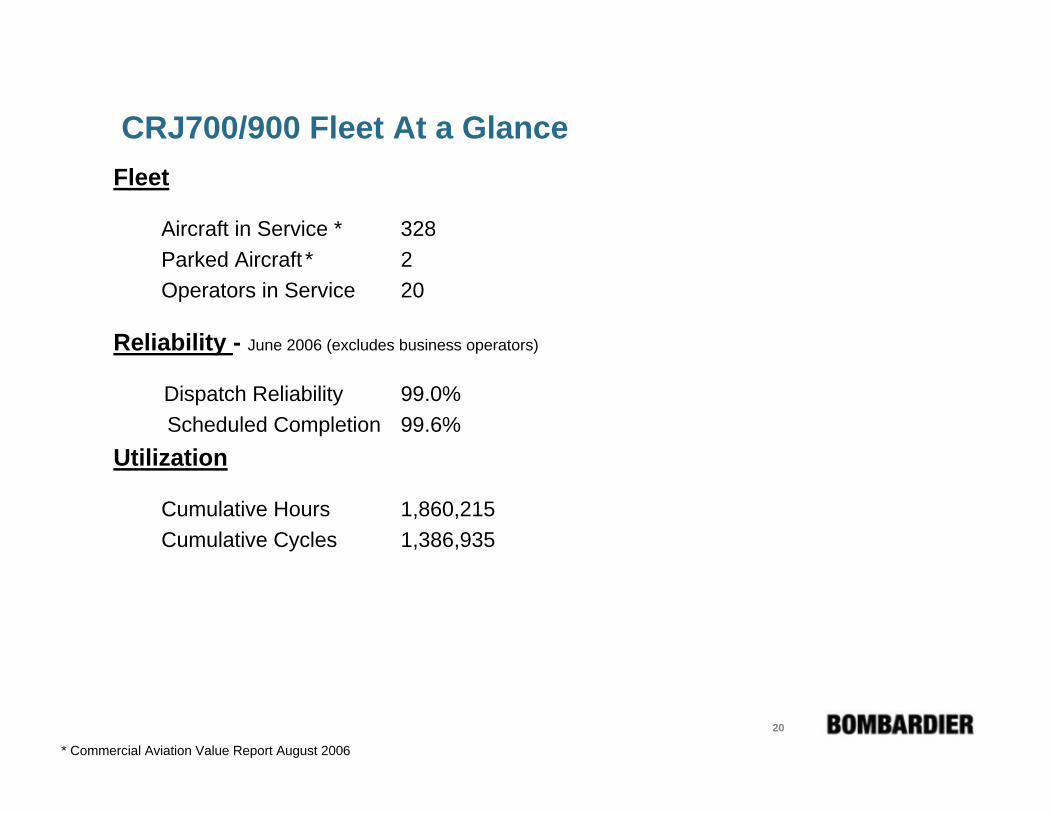
CRJ700/900 Fleet At a Glance Fleet
Aircraft in Service * 328Parked Aircraft * 2Operators in Service 20
Reliability - June 2006 (excludes business operators)
Dispatch Reliability 99.0%Scheduled Completion 99.6%
Utilization
Cumulative Hours 1,860,215Cumulative Cycles 1,386,935
* Commercial Aviation Value Report August 2006

21
Large RJs Compete Effectively With Narrowbodies on a Cost Per Seat Basis
500 nm Sector Operating Cost per Seat-Mile Comparison
Major CarriersRegional Carriers
TOC
DOC
Assumptions: US operating environment and fuel price @ $1.80 per US gallon
TOC
DOC
13.6¢
11.3¢
9.7¢8.9¢
15.0¢
13.7¢
12.1¢
10.5¢
8.2¢ 7.8¢7.2¢
6.5¢6.6¢7.1¢8.1¢
9.1¢
CRJ200 CRJ700 CRJ900 CRJ900X 100-SeatJet
130-SeatJet
150-SeatJet
180-SeatJet
22
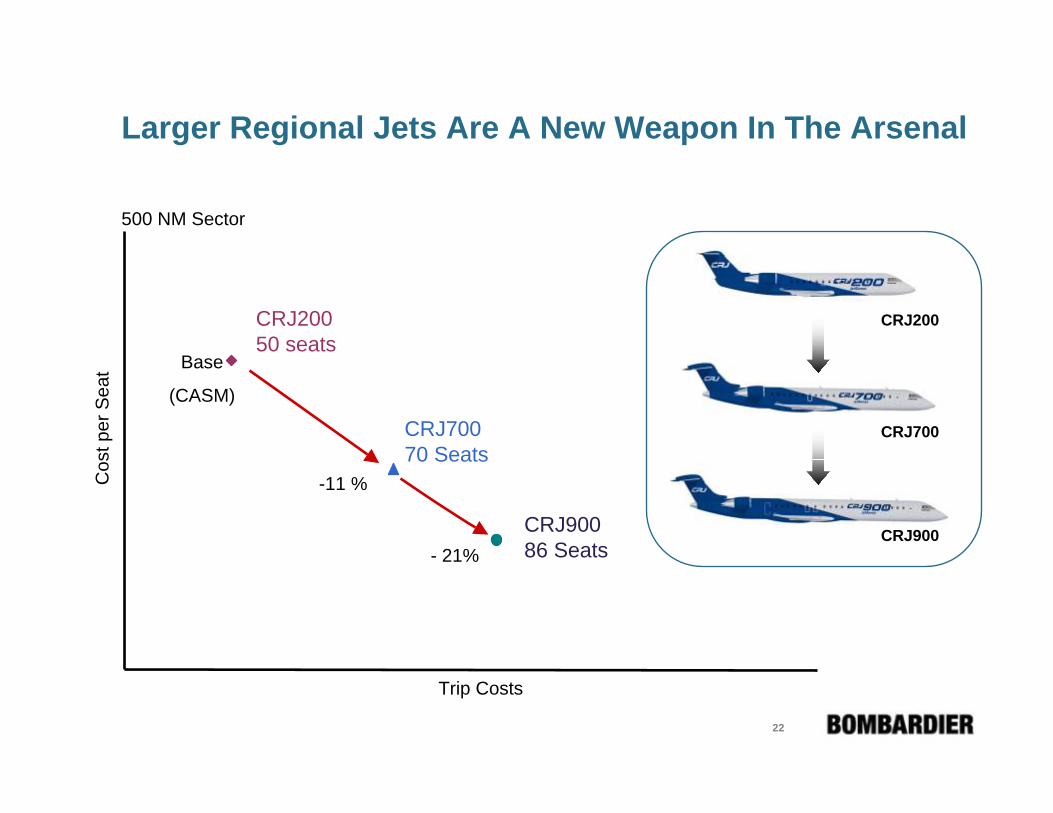
Larger Regional Jets Are A New Weapon In The Arsenal
Trip Costs
Cos
t per
Sea
t
CRJ20050 seats
CRJ70070 Seats
CRJ90086 Seats
-11 %
- 21%CRJ900
CRJ700
CRJ200
500 NM Sector
Base
(CASM)

23
The CRJ900 Continues to Gain Momentum
Over 100 firm orders in the past 30 months

24
Turboprop Market & Programs

25
Bombardier Q Series Dash 8 Sales StatusAs of July 31, 2006
496100Q200
82749831Total
60125185Q400
18229247Q300
0299299Q100
BacklogDelivered Aircraft
Firm Aircraft
26
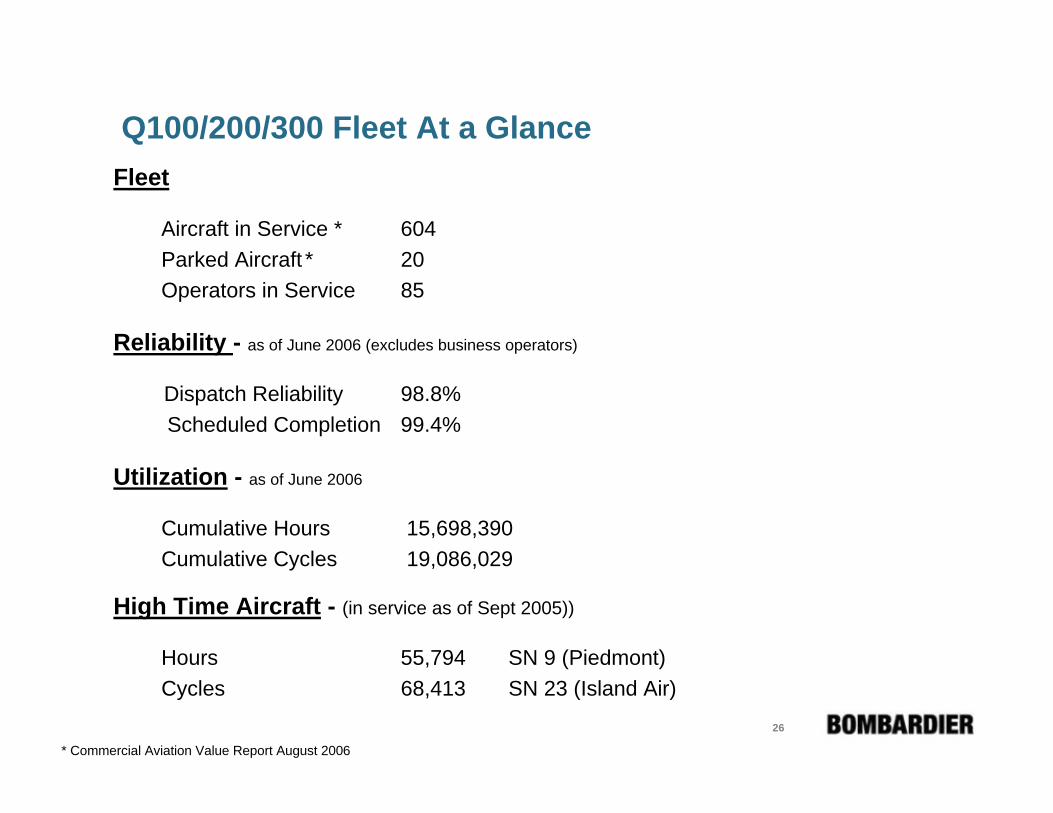
Q100/200/300 Fleet At a GlanceFleet
Aircraft in Service * 604Parked Aircraft * 20Operators in Service 85
Reliability - as of June 2006 (excludes business operators)
Dispatch Reliability 98.8%Scheduled Completion 99.4%
Utilization - as of June 2006
Cumulative Hours 15,698,390Cumulative Cycles 19,086,029
High Time Aircraft - (in service as of Sept 2005))
Hours 55,794 SN 9 (Piedmont)Cycles 68,413 SN 23 (Island Air)
* Commercial Aviation Value Report August 2006

27
Q400 Fleet At a Glance Fleet
Aircraft in Service* 125Parked Aircraft * 0Operators in Service 16
Reliability - as of July 2006 (excludes business operators)
Dispatch Reliability 98.7%Scheduled Completion 99.6%
Utilization - as of July 2006 (excludes business operators)
Cumulative Hours 819,102Cumulative Cycles 914,585
* Commercial Aviation Value Report August 2006
28
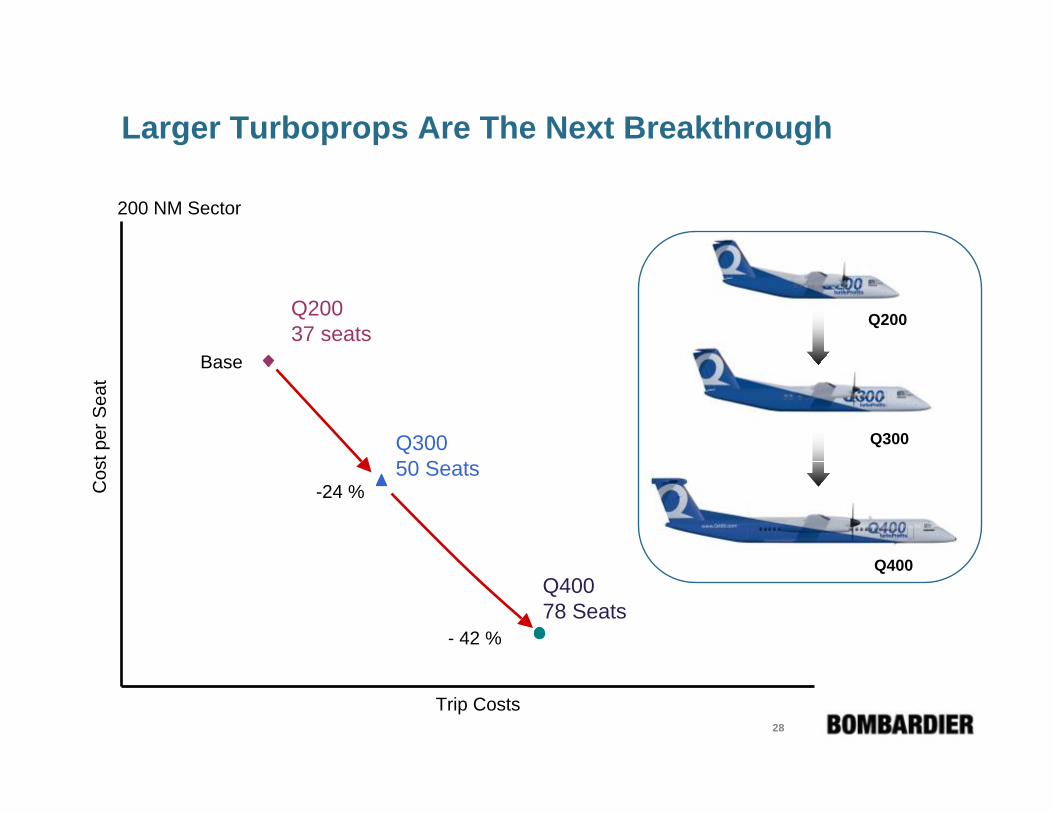
Larger Turboprops Are The Next Breakthrough
Trip Costs
Cos
t per
Sea
t
Q20037 seats
Q30050 Seats
Q40078 Seats
-24 %
- 42 %
Q200
Q300
Q400
200 NM Sector
Base
29
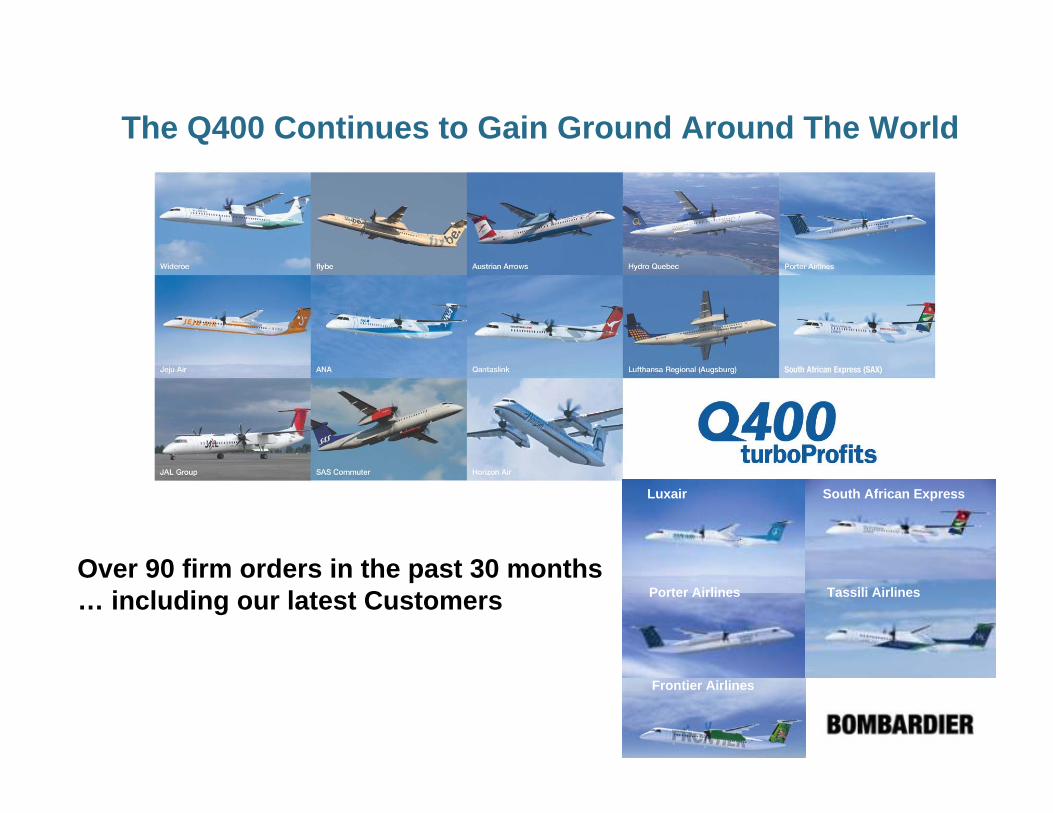
The Q400 Continues to Gain Ground Around The World
Over 90 firm orders in the past 30 months … including our latest Customers
Luxair South African Express
Porter Airlines Tassili Airlines
Frontier Airlines
30
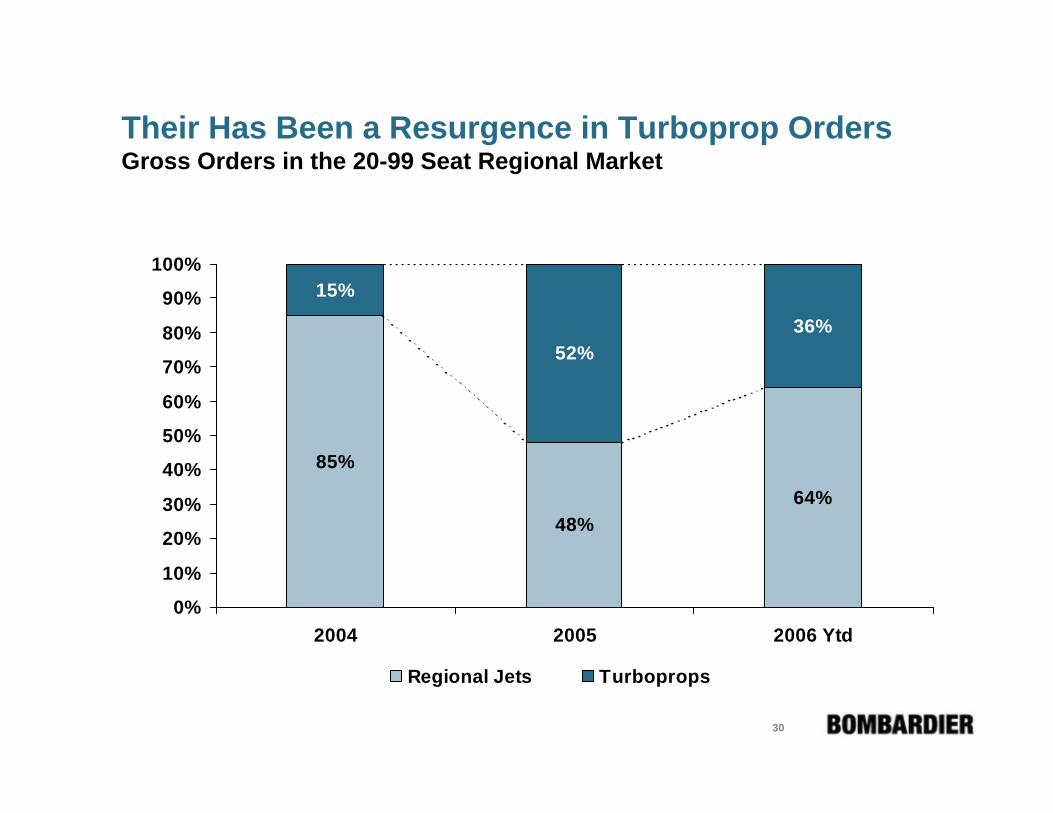
Their Has Been a Resurgence in Turboprop OrdersGross Orders in the 20-99 Seat Regional Market
85%
48%64%
15%
52%36%
0%
10%
20%
30%
40%
50%
60%
70%
80%
90%
100%
2004 2005 2006 Ytd
Regional Jets Turboprops
31
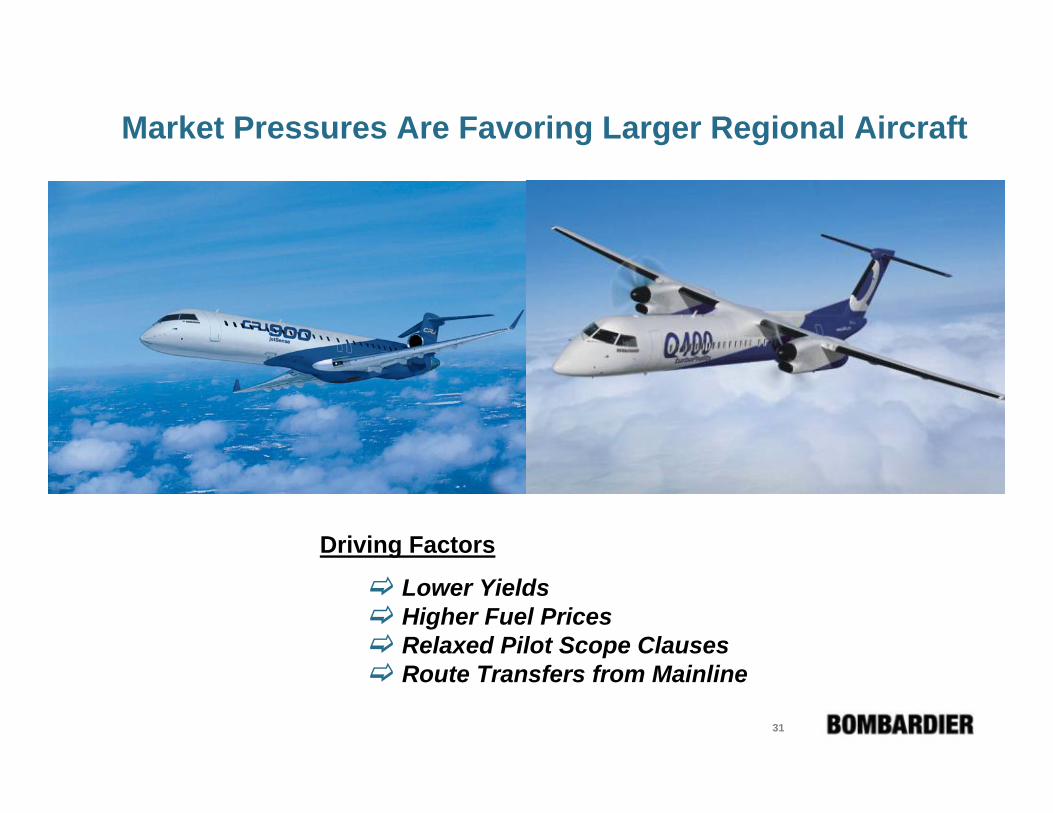
Market Pressures Are Favoring Larger Regional Aircraft
Driving Factors
Lower YieldsHigher Fuel PricesRelaxed Pilot Scope ClausesRoute Transfers from Mainline
32
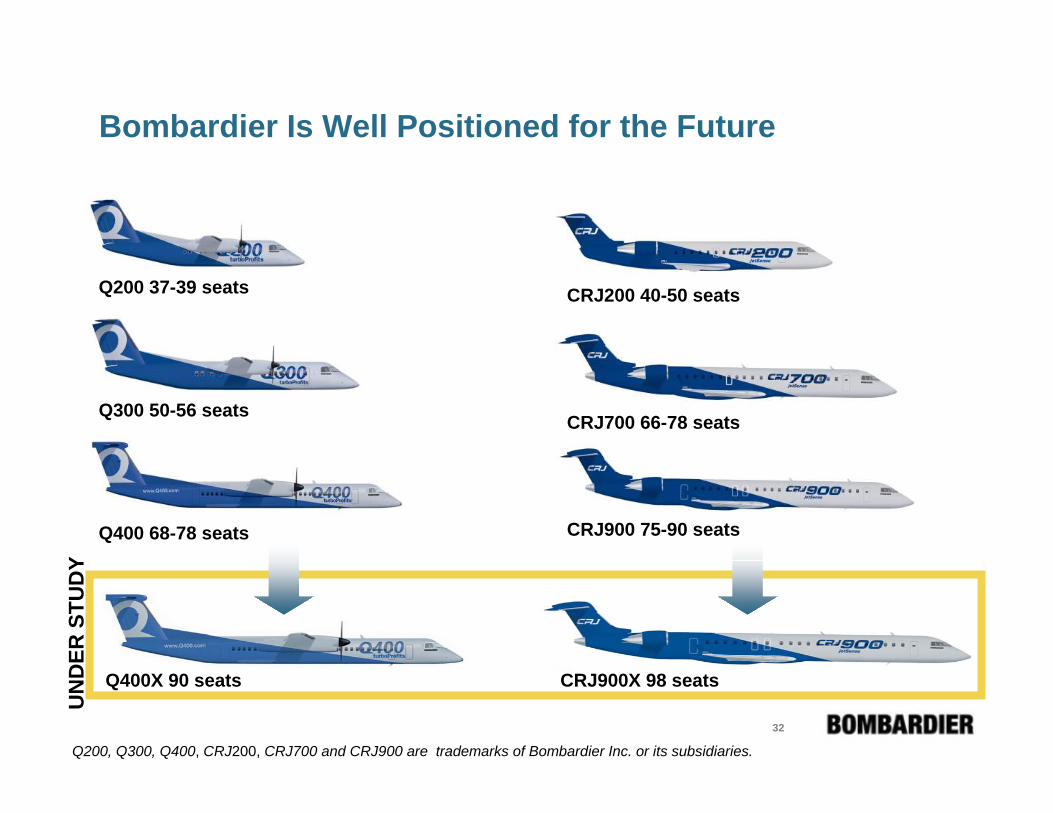
Bombardier Is Well Positioned for the Future
Q200 37-39 seats
Q300 50-56 seats
Q400 68-78 seats
CRJ200 40-50 seats
CRJ700 66-78 seats
CRJ900 75-90 seats
Q200, Q300, Q400, CRJ200, CRJ700 and CRJ900 are trademarks of Bombardier Inc. or its subsidiaries.
CRJ900X 98 seatsQ400X 90 seats
UN
DER
STU
DY

33
Regional Aircraft Strategy Going Forward
Capitalize on surging turboprop volume and forecasted “next wave” of large CRJ orders to strengthen our backlog
Aggressively pursue cost reduction initiatives including lean manufacturing, supply base rationalization and low cost manufacturing strategies
Continue to capitalize on our strong platforms and introduce new derivatives to meet market needs

34
Information contained in this document is proprietary to Bombardier Inc., Bombardier Aerospace, Regional Aircraft (“Bombardier”). This document must not be reproduced or shared with, or distributed to, any third party in whole or in part without Bombardier’s prior written consent.
This document is submitted for informational purposes only; is not part of any proposal; and creates no contractual commitment. Bombardier provides the information contained in this document on an ‘as is, where is’ basis and makes no representation or warranty of any kind regarding the applicability or reliability of any of such information with respect to any use whatsoever to be made of it by the recipient.
Any information of a technical nature contained in this document may contain inaccuracies and is subject to change and should never be relied upon for operational use.
Disclaimer