the mother tongue-based multilingual education...
TRANSCRIPT
The Mother Tongue-Based
Multilingual Education (EMBLI) Pilot
Program Endline Assessment
Executive Summary
Stephen L. Walter, PhD – Assessment Consultant
October 2016
Timor-Leste

EMBLI Endline Assessment – Executive Summary October 2016 1
The EMBLI Endline Assessment Executive Summary
Stephen L. Walter, PhD – Assessment Consultant
The background
The country of Timor-Leste is one of the world’s newest countries, having gained full independence in 2002. The country occupies approximately half of the island of Timor with a population of 1.2 million and a land areas of 14,609 sq. km. (www.bbc.com).
Timor-Leste is also a linguistically diverse country with over 20 different languages spoken by the population of the country. Tetun Dili and Portuguese are established as official languages—Portuguese because of the colonial heritage and Tetun Dili because it is the most widely spoken, with between 50 and 90 percent of the population (depending on the source one consults) f the country having at least some knowledge of the language. Many of these, however, have learned Tetun Dili as a second language. Those who speak Tetun Dili as their first or best language are generally found in and around the capital city and to a lesser extent in the other cities of the country. Standard schools use both official languages as means of instruction.
In many of the rural and less accessible regions of the country, children are much less likely to speak Tetun Dili or Portuguese beyond, perhaps, a few common phrases and greetings. This raises a very fundamental educational question; If children do not speak the languages of education when they begin their schooling, how much will they learn in school? This question is being encountered not solely in Timor-Leste but in much of the world, even in many developed countries, due to large-scale immigration. In the last 25 years, this problem—commonly referred to as the ‘language-of-instruction’ issue—has led to substantial experimentation and research on how best to meet the educational needs of children who do not speak the primary language of education when they begin school. The result is growing recognition in the international education community that the language of instruction issue has very significant implications for achieving educational success. Many national educators and policy-makers, however, remain cautious or even skeptical. Some await more convincing evidence of the positive impact of using local languages for instructional purposes. Others are concerned about the possible financial, political, or technical challenges which can arise if local languages are used for instructional purposes.
In Timor-Leste, leaders began wrestling with the issue of language of instruction more than 5 years ago. The result was the launch of an experimental pilot project in 2012 (known as EMBLI Mother Tongue Based Multilingual Education) to test the viability of using non-official national languages as languages of instruction in early basic education. Three languages—one each in Lautem (Fataluku), Manatuto (Galolen) and Oe-cusse (Baikeno)—were selected as experimental languages of instruction. Work began on the development of instructional materials, teachers were trained, and teaching began in 2013. Two preschools and two primary schools were selected in each district1 to participate in the pilot based on a consultative process with local authorities and parents. At the end of three years, the pilot was to be carefully evaluated to measure the educational effectiveness of the experimental
1 One school in Manatuto dropped out shortly after being selected.
EMBLI Endline Assessment – Executive Summary October 2016 2
program. This document is a summary report of the findings of this assessment. The complete and more detailed report will be submitted in October 2016.
The Endline Assessment
The design for the endline assessment included the following components:
1. Testing of student achievement 2. Interviews with key stakeholders 3. Visits to schools 4. Use of a public opinion survey to gather information on language attitudes
This summary report includes only results from Part 1, the testing of student achievement.
The design for the testing of student achievement was as follows:
a. Use of two distinct instruments: 1. EGRA (same as the one used by the World Bank in 2009). EGRA is an
instrument designed to test progress in learning to read. The EGRA assessment is done orally one-on-one with the learner and was administered to children in the last year of preschool, Grade 1 and Grade 2.
2. The Curriculum-based Assessment (CBA). The CBA is a paper-based objective assessment designed to test for knowledge and achievement in reading, math, Tetun language and Portuguese language. The CBA can be given to all children in a classroom at the same time and was administered only to Grade 2 children since it assumed at least a basic ability to read.
b. The assessment sample
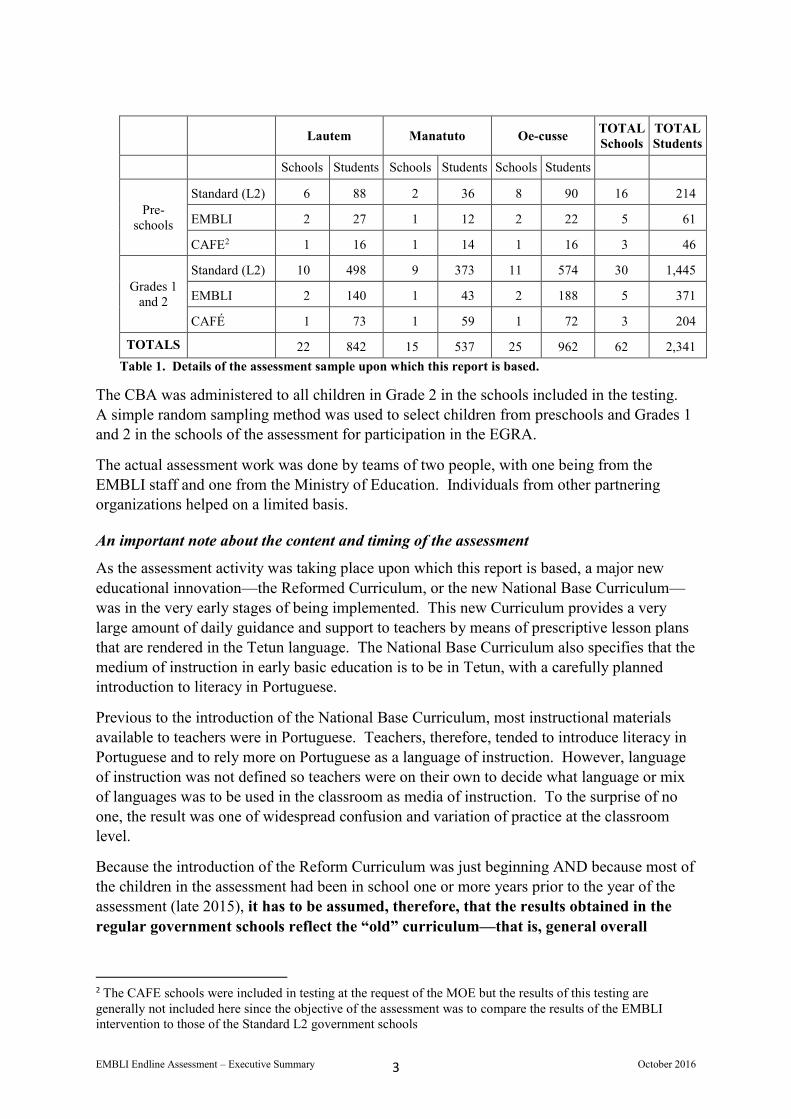
The details of the assessment sample are given in the following table. All of the EMBLI schools were included in the assessment. Standard government schools (“L2”) were randomly selected from a pool of eligible schools (i.e. linguistic situation similar to those of the EMBLI schools, where the majority of the students’ first language was not Tetun or Portuguese) for inclusion in the study.
EMBLI Endline Assessment – Executive Summary October 2016 3
Lautem Manatuto Oe-cusse TOTAL Schools
TOTAL Students
Schools Students Schools Students Schools Students
Pre-schools
Standard (L2) 6 88 2 36 8 90 16 214
EMBLI 2 27 1 12 2 22 5 61
CAFE2 1 16 1 14 1 16 3 46
Grades 1 and 2
Standard (L2) 10 498 9 373 11 574 30 1,445
EMBLI 2 140 1 43 2 188 5 371
CAFÉ 1 73 1 59 1 72 3 204
TOTALS 22 842 15 537 25 962 62 2,341 Table 1. Details of the assessment sample upon which this report is based.
The CBA was administered to all children in Grade 2 in the schools included in the testing. A simple random sampling method was used to select children from preschools and Grades 1 and 2 in the schools of the assessment for participation in the EGRA.
The actual assessment work was done by teams of two people, with one being from the EMBLI staff and one from the Ministry of Education. Individuals from other partnering organizations helped on a limited basis.
An important note about the content and timing of the assessment
As the assessment activity was taking place upon which this report is based, a major new educational innovation—the Reformed Curriculum, or the new National Base Curriculum—was in the very early stages of being implemented. This new Curriculum provides a very large amount of daily guidance and support to teachers by means of prescriptive lesson plans that are rendered in the Tetun language. The National Base Curriculum also specifies that the medium of instruction in early basic education is to be in Tetun, with a carefully planned introduction to literacy in Portuguese.
Previous to the introduction of the National Base Curriculum, most instructional materials available to teachers were in Portuguese. Teachers, therefore, tended to introduce literacy in Portuguese and to rely more on Portuguese as a language of instruction. However, language of instruction was not defined so teachers were on their own to decide what language or mix of languages was to be used in the classroom as media of instruction. To the surprise of no one, the result was one of widespread confusion and variation of practice at the classroom level.
Because the introduction of the Reform Curriculum was just beginning AND because most of the children in the assessment had been in school one or more years prior to the year of the assessment (late 2015), it has to be assumed, therefore, that the results obtained in the regular government schools reflect the “old” curriculum—that is, general overall
2 The CAFE schools were included in testing at the request of the MOE but the results of this testing are generally not included here since the objective of the assessment was to compare the results of the EMBLI intervention to those of the Standard L2 government schools
EMBLI Endline Assessment – Executive Summary October 2016 4
educational practice in place during the years prior to the launch of the new National Base Curriculum.
Findings from the assessment
The report of findings is divided into three major sections. The first section is a report of test results. The second section is a review of those contextual factors (rates of absenteeism, location of schools, patterns of preschool attendance, etc) in the specific setting of Timor-Leste which shaped or influenced the observed test results. The third section is an initial investigation of cost effectiveness of key features of learning achievement in Grade 2.
Understanding the influence of these contextual factors is important for several reasons. First, some of the factors can be ‘managed’ so that educational results can be improved. Second, having a good understanding of the impact of contextual factors leads to more informed and defensible policy formation at the highest levels of government. Third, when it is possible or likely that the schools or children included in the assessment are not equally affected by influential contextual factors, then it is essential to evaluate the observed outcomes in light of this known variation in context.
The following example illustrates this point. Educational testing done in one country in Africa revealed very low levels of learning. Careful follow-up research found that many of the children showing reduced learning had very specific nutritional deficits (missing specific minerals and vitamins) due to food scarcities during the dry season. Giving children mineral supplements markedly improved learning outcomes. If policy makers had decided to deal with the problem of low test results by giving the teachers more training, making more textbooks available, or lengthening the instructional day, they would have used up resources but not solved the underlying contextual factor causing the low performance.
A fourth possible factor is somewhat more sensitive but nonetheless important. Major donors all know that context influences educational outcomes and take these factors into consideration when making their own decisions about assistance.
Section 1: The Test Results
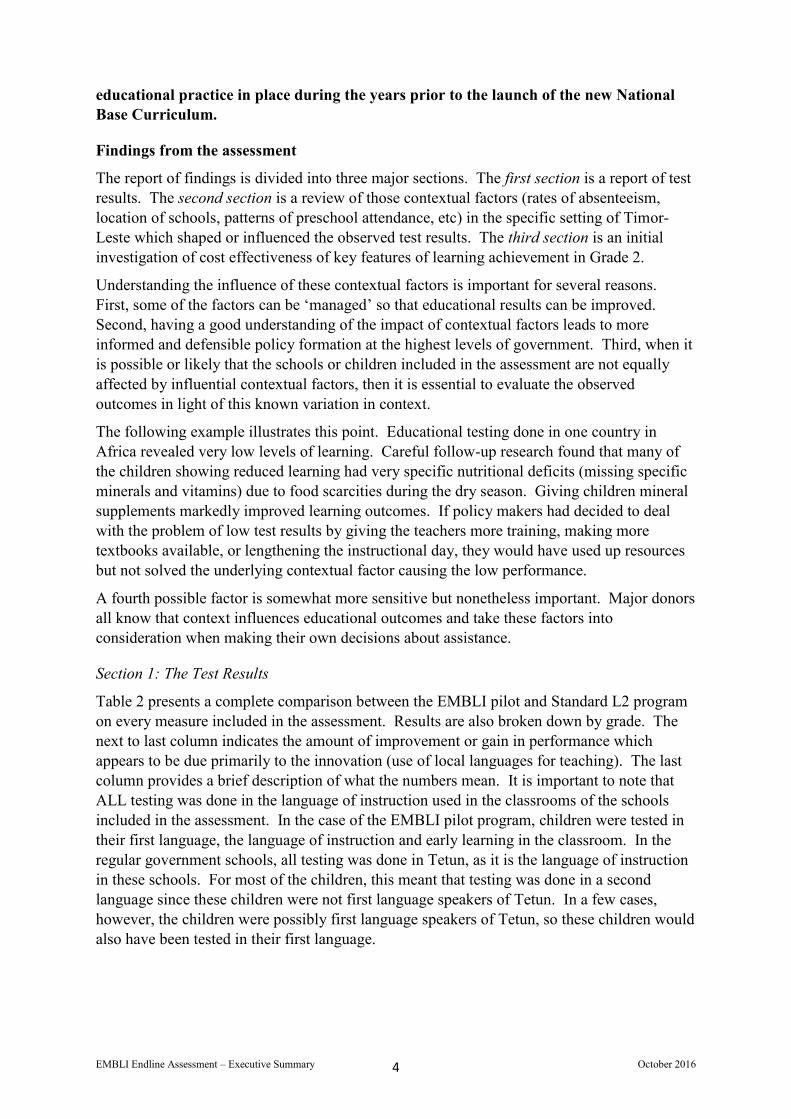
Table 2 presents a complete comparison between the EMBLI pilot and Standard L2 program on every measure included in the assessment. Results are also broken down by grade. The next to last column indicates the amount of improvement or gain in performance which appears to be due primarily to the innovation (use of local languages for teaching). The last column provides a brief description of what the numbers mean. It is important to note that ALL testing was done in the language of instruction used in the classrooms of the schools included in the assessment. In the case of the EMBLI pilot program, children were tested in their first language, the language of instruction and early learning in the classroom. In the regular government schools, all testing was done in Tetun, as it is the language of instruction in these schools. For most of the children, this meant that testing was done in a second language since these children were not first language speakers of Tetun. In a few cases, however, the children were possibly first language speakers of Tetun, so these children would also have been tested in their first language.
EMBLI Endline Assessment – Executive Summary October 2016 5
Assessment Measure Grade Standard (L2)
EMBLI (L1)
Percent Improvement
Description of Improvement
PS B 10.05 40.67 305 4 times higher Letter ID Grade 1 22.40 51.46 130 2.3 times higher Grade 2 41.74 64.21 54 50 percent higher PS B 0.39 26.66 6,684 67 times higher Word Recognition Grade 1 6.83 41.68 510 6 times higher Grade 2 27.21 60.19 121 2.2 times higher PS B 0.18 14.66 8,136 82 times higher Non-words Grade 1 5.79 30.66 430 5 times higher Grade 2 21.19 45.26 114 2 times higher PS B 0.05 15.08 30,060 301 times higher Text reading Grade 1 6.81 29.76 337 4.3 times higher Grade 2 26.88 58.40 117 2 times higher PS B 0.23 15.85 6,791 68 times higher Reading Comprehension Grade 1 8.73 35.96 312 4 times higher Grade 2 22.31 65.07 192 3 times higher PS B 2.18 22.58 936 10 times higher Overall EGRA Grade 1 10.11 37.91 275 almost 4 times higher Grade 2 27.88 58.63 110 2 times higher Reading (CBA) Grade 2 50.27 73.67 47 50 percent higher Math (CBA) Grade 2 22.06 51.86 135 2.3 times higher Tetun Lang. (CBA) Grade 2 41.99 76.91 83 almost twice as high Portuguese Lang. (CBA) Grade 2 39.78 74.63 88 almost twice as high Oveall CBA Grade 2 36.01 65.87 83 almost twice as high
Table 2. Direct comparison of EMBLI and Standard (L2) schools on all measures of assessment.
Several comments about the table need to be made. First, the reader will note that the level of improvement or gain in the preschools in the EMBLI program is extremely large—more than 300 times in one case. This has happened for two reasons. First, there is clearly minimal learning in some of the Standard L2 schools, probably because the children in the preschools understand little of the teacher’s instruction so learn little. Second, it is a matter of math—comparing really small numbers to somewhat bigger numbers results in huge apparent gains because the small numbers represent almost no achievement.
The second important fact comes from comparing preschool scores in the EMBLI program with Grade 2 results in the Standard program. This comparison indicates that on some measures the two scores are about the same and on others, the performance of the EMBLI preschool children would place them about half way between the achievement of Grade 1 and Grade 2 children in the Standard program. Academically, the EMBLI program appears to accelerate children’s academic development by 1.5 to 2 years.
The following sections present some of the results in graphical form to further highlight the relative effectiveness of each program.
EMBLI Endline Assessment – Executive Summary October 2016 6
The EGRA
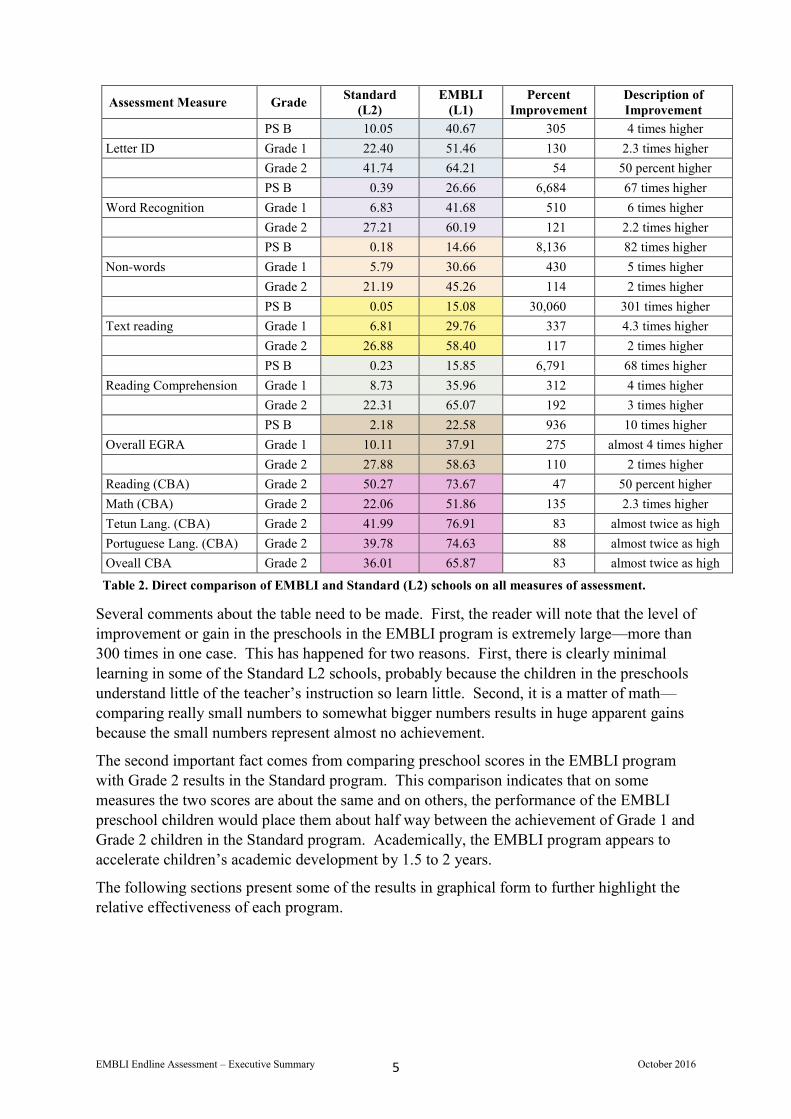
Figure 1 compares the performance of Grade 2 children in the EMBLI schools with those in the Standard government schools (L2). The Grade 2 results are shown here because the performance of the two programs is most similar at this level.
Figure 1. Comparison of Grade 2 children from EMBLI and the Standard L2 schools on the subtests of EGRA.
Overall, the EMBLI program produced performance gains of approximately 100 percent on the EGRA assessment. In the field of education, gains of this kind are rarely seen. Educational innovators are usually happy to seen gains of 5-10 percent. Especially important is the difference observed in the category Reading Comprehension as this is the fundamental objective of reading instruction—learning to read. In this category, we observe that the average level of reading comprehension in the EMBLI program is close to three times as great as that of the standard public schools which rely upon Tetun and Portuguese as languages of instruction.
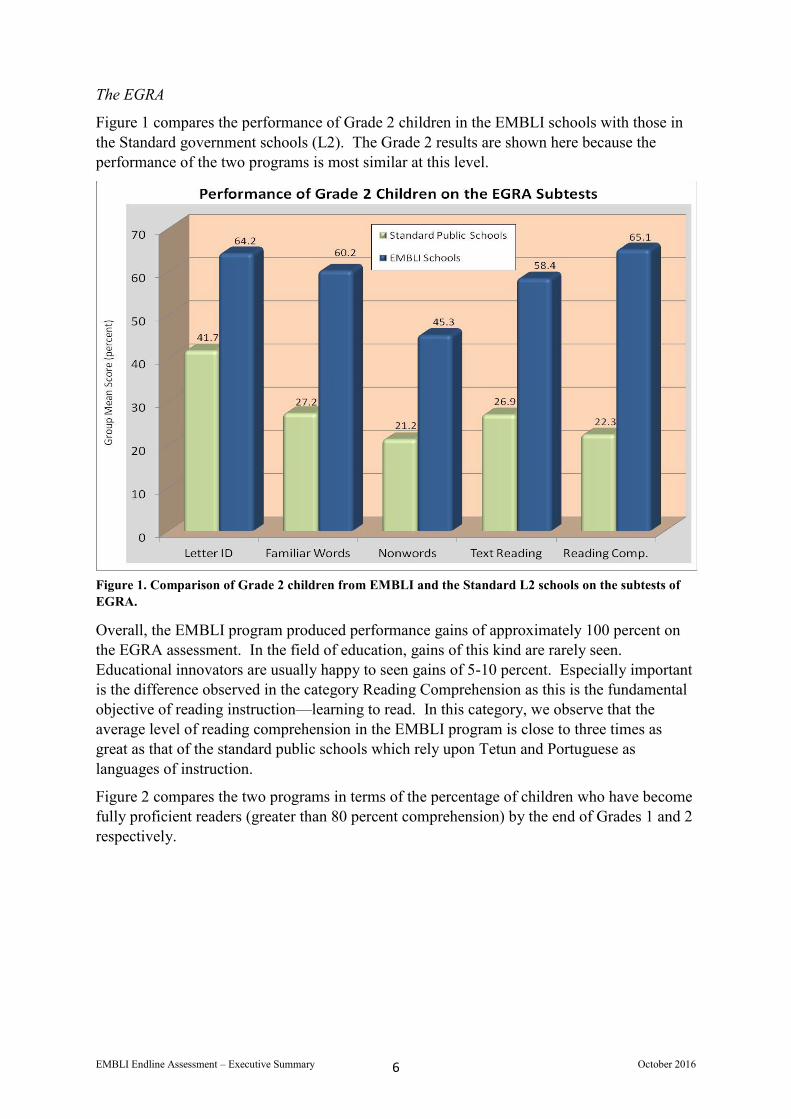
Figure 2 compares the two programs in terms of the percentage of children who have become fully proficient readers (greater than 80 percent comprehension) by the end of Grades 1 and 2 respectively.
EMBLI Endline Assessment – Executive Summary October 2016 7
Figure 2. Percentage of children in each program who have become fully proficient readers.
It is commonly observed in many countries that children often do not learn to read until Grade 4 or Grade 5. However, Figure 2 provides convincing evidence that children can become proficient readers by the end of Grade 2 using the first language of the child and appropriate and available strategies.
The Curriculum-based Assessment (CBA)
The objective of the CBA was to test overall progress in mastering the content of the curriculum for Grade 2 students. The results are shown in Figure 3 (next page) for each of the subtests of the assessment. Again, all testing was done in the language of instruction—Tetun in the regular public schools and local language (mother tongue) in the EMBLI schools.
EMBLI Endline Assessment – Executive Summary October 2016 8
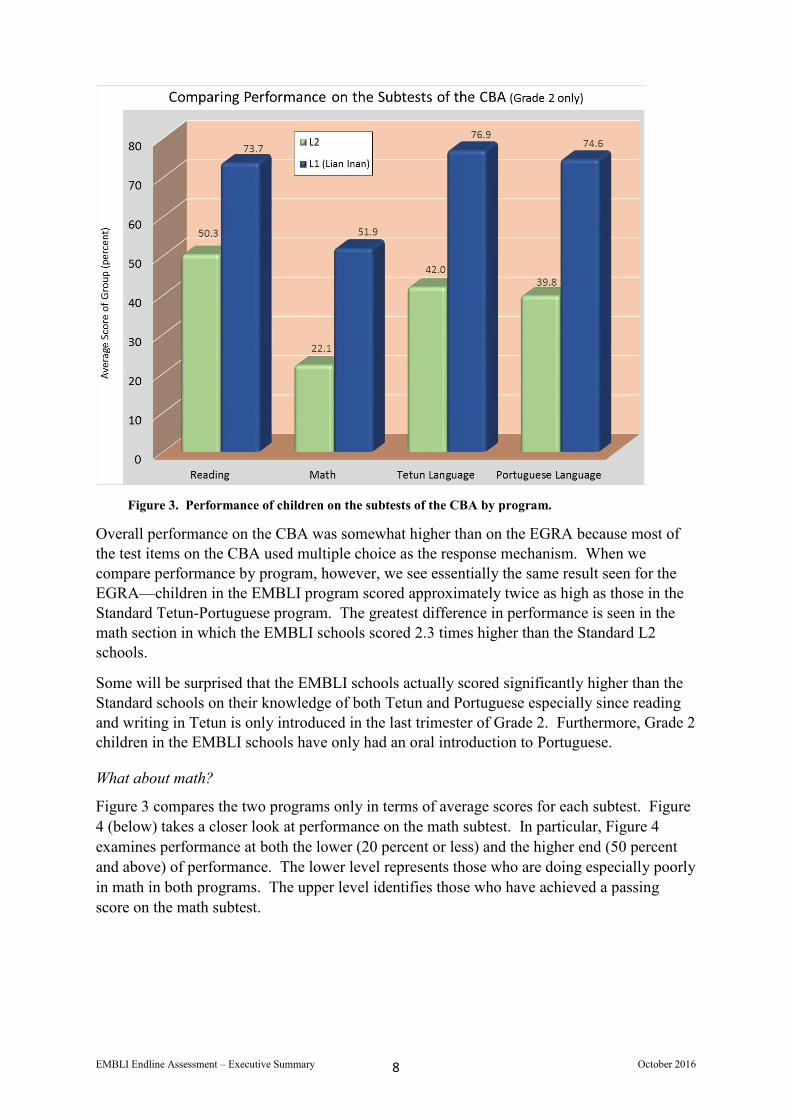
Figure 3. Performance of children on the subtests of the CBA by program.
Overall performance on the CBA was somewhat higher than on the EGRA because most of the test items on the CBA used multiple choice as the response mechanism. When we compare performance by program, however, we see essentially the same result seen for the EGRA—children in the EMBLI program scored approximately twice as high as those in the Standard Tetun-Portuguese program. The greatest difference in performance is seen in the math section in which the EMBLI schools scored 2.3 times higher than the Standard L2 schools.
Some will be surprised that the EMBLI schools actually scored significantly higher than the Standard schools on their knowledge of both Tetun and Portuguese especially since reading and writing in Tetun is only introduced in the last trimester of Grade 2. Furthermore, Grade 2 children in the EMBLI schools have only had an oral introduction to Portuguese.
What about math?
Figure 3 compares the two programs only in terms of average scores for each subtest. Figure 4 (below) takes a closer look at performance on the math subtest. In particular, Figure 4 examines performance at both the lower (20 percent or less) and the higher end (50 percent and above) of performance. The lower level represents those who are doing especially poorly in math in both programs. The upper level identifies those who have achieved a passing score on the math subtest.
EMBLI Endline Assessment – Executive Summary October 2016 9
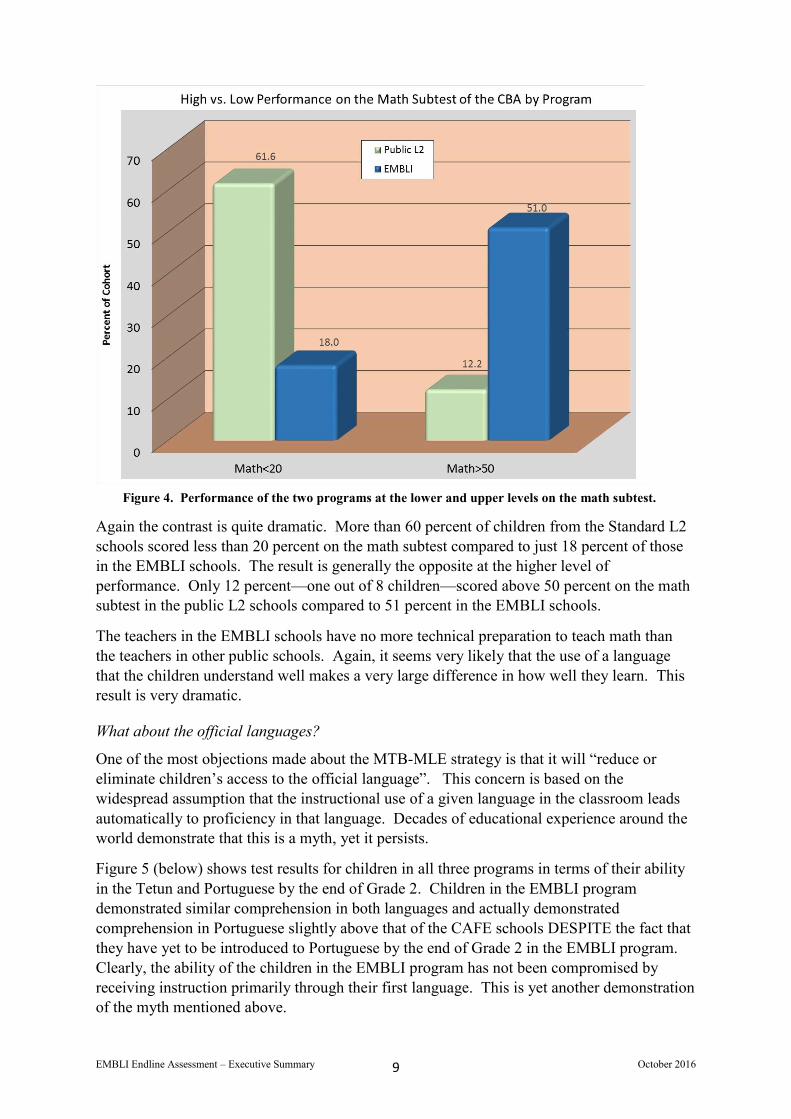
Figure 4. Performance of the two programs at the lower and upper levels on the math subtest.
Again the contrast is quite dramatic. More than 60 percent of children from the Standard L2 schools scored less than 20 percent on the math subtest compared to just 18 percent of those in the EMBLI schools. The result is generally the opposite at the higher level of performance. Only 12 percent—one out of 8 children—scored above 50 percent on the math subtest in the public L2 schools compared to 51 percent in the EMBLI schools.
The teachers in the EMBLI schools have no more technical preparation to teach math than the teachers in other public schools. Again, it seems very likely that the use of a language that the children understand well makes a very large difference in how well they learn. This result is very dramatic.
What about the official languages?
One of the most objections made about the MTB-MLE strategy is that it will “reduce or eliminate children’s access to the official language”. This concern is based on the widespread assumption that the instructional use of a given language in the classroom leads automatically to proficiency in that language. Decades of educational experience around the world demonstrate that this is a myth, yet it persists.
Figure 5 (below) shows test results for children in all three programs in terms of their ability in the Tetun and Portuguese by the end of Grade 2. Children in the EMBLI program demonstrated similar comprehension in both languages and actually demonstrated comprehension in Portuguese slightly above that of the CAFE schools DESPITE the fact that they have yet to be introduced to Portuguese by the end of Grade 2 in the EMBLI program. Clearly, the ability of the children in the EMBLI program has not been compromised by receiving instruction primarily through their first language. This is yet another demonstration of the myth mentioned above.
EMBLI Endline Assessment – Executive Summary October 2016 10
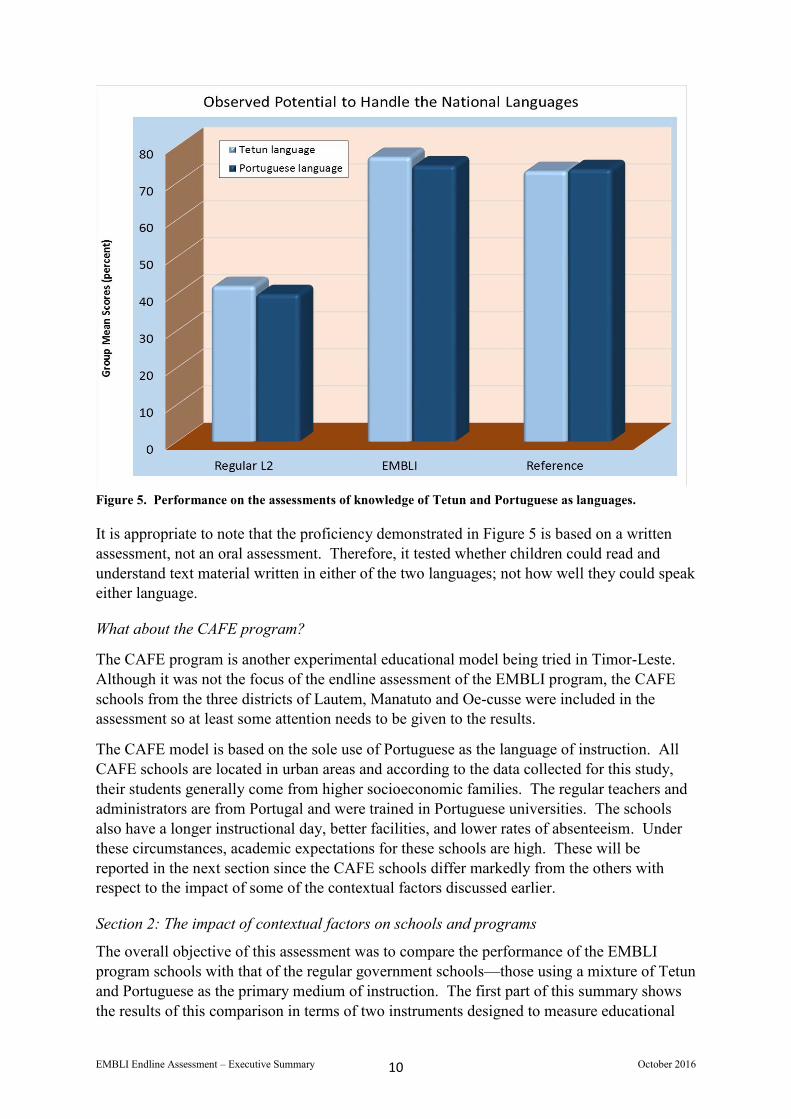
Figure 5. Performance on the assessments of knowledge of Tetun and Portuguese as languages.
It is appropriate to note that the proficiency demonstrated in Figure 5 is based on a written assessment, not an oral assessment. Therefore, it tested whether children could read and understand text material written in either of the two languages; not how well they could speak either language.
What about the CAFE program?
The CAFE program is another experimental educational model being tried in Timor-Leste. Although it was not the focus of the endline assessment of the EMBLI program, the CAFE schools from the three districts of Lautem, Manatuto and Oe-cusse were included in the assessment so at least some attention needs to be given to the results.
The CAFE model is based on the sole use of Portuguese as the language of instruction. All CAFE schools are located in urban areas and according to the data collected for this study, their students generally come from higher socioeconomic families. The regular teachers and administrators are from Portugal and were trained in Portuguese universities. The schools also have a longer instructional day, better facilities, and lower rates of absenteeism. Under these circumstances, academic expectations for these schools are high. These will be reported in the next section since the CAFE schools differ markedly from the others with respect to the impact of some of the contextual factors discussed earlier.
Section 2: The impact of contextual factors on schools and programs
The overall objective of this assessment was to compare the performance of the EMBLI program schools with that of the regular government schools—those using a mixture of Tetun and Portuguese as the primary medium of instruction. The first part of this summary shows the results of this comparison in terms of two instruments designed to measure educational
EMBLI Endline Assessment – Executive Summary October 2016 11
(cognitive) achievement. Late in the design process, the same assessment was extended to schools in the CAFE program.
Once analysis began, it became very clear that there were some fundamental differences between the three programs which seemed likely to change the nature of the comparisons. This problem was anticipated in the design of the assessment so that relevant data were gathered on a range of variables known or expected to impact results such as preschool attendance, absenteeism, socioeconomic status, gender, location of the schools, etc. This is not an exhaustive list. Other known issues include teacher quality (we had no good way to measure this), time on task (hard to measure), classroom instructional practices (requires extensive direct observation to assess), parental engagement (hard to measure), etc.
This section reports what we learned about the impact of the various contextual variables. After reporting the impact of each factor “in isolation”, we then show the results of the assessment of the primary innovation in focus—mother tongue based multilingual education—when the various contextual influences are “neutralized” or made constant for all programs.
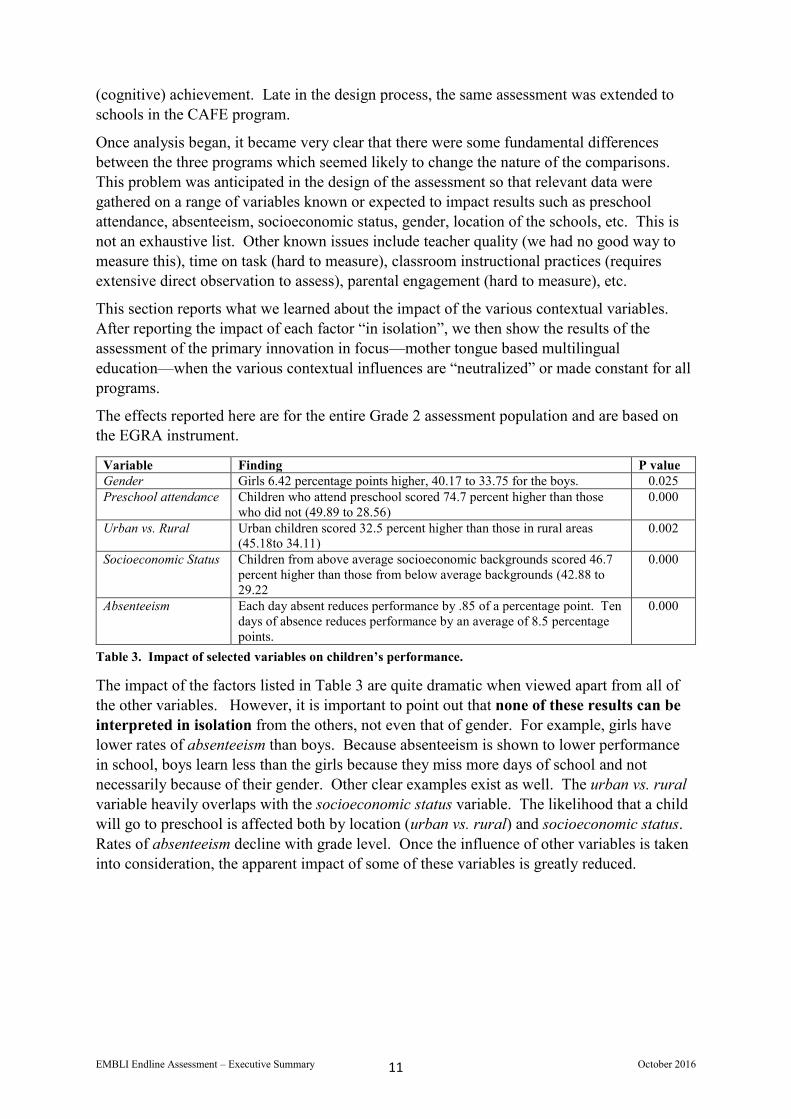
The effects reported here are for the entire Grade 2 assessment population and are based on the EGRA instrument.
Variable Finding P value Gender Girls 6.42 percentage points higher, 40.17 to 33.75 for the boys. 0.025 Preschool attendance Children who attend preschool scored 74.7 percent higher than those
who did not (49.89 to 28.56) 0.000
Urban vs. Rural Urban children scored 32.5 percent higher than those in rural areas (45.18to 34.11)
0.002
Socioeconomic Status Children from above average socioeconomic backgrounds scored 46.7 percent higher than those from below average backgrounds (42.88 to 29.22
0.000
Absenteeism Each day absent reduces performance by .85 of a percentage point. Ten days of absence reduces performance by an average of 8.5 percentage points.
0.000
Table 3. Impact of selected variables on children’s performance.
The impact of the factors listed in Table 3 are quite dramatic when viewed apart from all of the other variables. However, it is important to point out that none of these results can be interpreted in isolation from the others, not even that of gender. For example, girls have lower rates of absenteeism than boys. Because absenteeism is shown to lower performance in school, boys learn less than the girls because they miss more days of school and not necessarily because of their gender. Other clear examples exist as well. The urban vs. rural variable heavily overlaps with the socioeconomic status variable. The likelihood that a child will go to preschool is affected both by location (urban vs. rural) and socioeconomic status. Rates of absenteeism decline with grade level. Once the influence of other variables is taken into consideration, the apparent impact of some of these variables is greatly reduced.
EMBLI Endline Assessment – Executive Summary October 2016 12
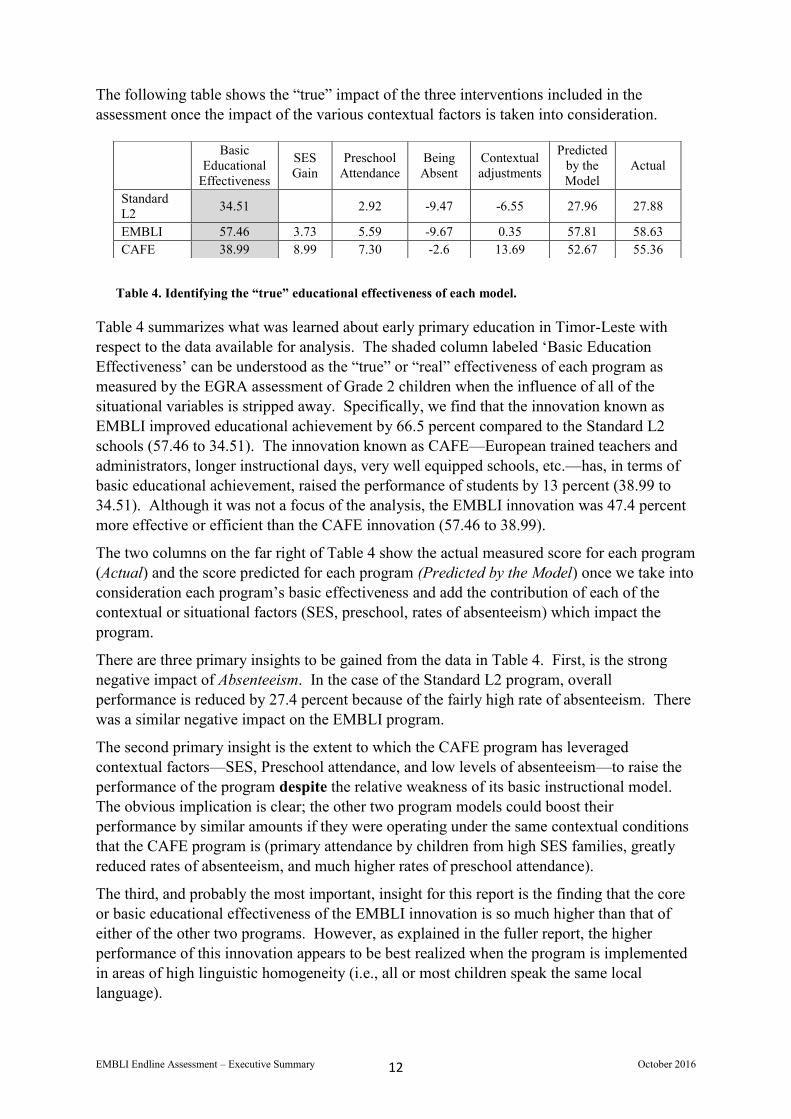
The following table shows the “true” impact of the three interventions included in the assessment once the impact of the various contextual factors is taken into consideration.
Table 4. Identifying the “true” educational effectiveness of each model.
Table 4 summarizes what was learned about early primary education in Timor-Leste with respect to the data available for analysis. The shaded column labeled ‘Basic Education Effectiveness’ can be understood as the “true” or “real” effectiveness of each program as measured by the EGRA assessment of Grade 2 children when the influence of all of the situational variables is stripped away. Specifically, we find that the innovation known as EMBLI improved educational achievement by 66.5 percent compared to the Standard L2 schools (57.46 to 34.51). The innovation known as CAFE—European trained teachers and administrators, longer instructional days, very well equipped schools, etc.—has, in terms of basic educational achievement, raised the performance of students by 13 percent (38.99 to 34.51). Although it was not a focus of the analysis, the EMBLI innovation was 47.4 percent more effective or efficient than the CAFE innovation (57.46 to 38.99).
The two columns on the far right of Table 4 show the actual measured score for each program (Actual) and the score predicted for each program (Predicted by the Model) once we take into consideration each program’s basic effectiveness and add the contribution of each of the contextual or situational factors (SES, preschool, rates of absenteeism) which impact the program.
There are three primary insights to be gained from the data in Table 4. First, is the strong negative impact of Absenteeism. In the case of the Standard L2 program, overall performance is reduced by 27.4 percent because of the fairly high rate of absenteeism. There was a similar negative impact on the EMBLI program.
The second primary insight is the extent to which the CAFE program has leveraged contextual factors—SES, Preschool attendance, and low levels of absenteeism—to raise the performance of the program despite the relative weakness of its basic instructional model. The obvious implication is clear; the other two program models could boost their performance by similar amounts if they were operating under the same contextual conditions that the CAFE program is (primary attendance by children from high SES families, greatly reduced rates of absenteeism, and much higher rates of preschool attendance).
The third, and probably the most important, insight for this report is the finding that the core or basic educational effectiveness of the EMBLI innovation is so much higher than that of either of the other two programs. However, as explained in the fuller report, the higher performance of this innovation appears to be best realized when the program is implemented in areas of high linguistic homogeneity (i.e., all or most children speak the same local language).
Basic
Educational Effectiveness
SES Gain
Preschool Attendance
Being Absent
Contextual adjustments
Predicted by the Model
Actual
Standard L2 34.51 2.92 -9.47 -6.55 27.96 27.88
EMBLI 57.46 3.73 5.59 -9.67 0.35 57.81 58.63 CAFE 38.99 8.99 7.30 -2.6 13.69 52.67 55.36
EMBLI Endline Assessment – Executive Summary October 2016 13
Some readers may be curious as to why the predicted score for the CAFE schools is quite a bit less than the actual score compared to that of the other two programs. The reason is quite simple. The CAFE schools are located only in urban areas. Entering the variable of urbanicity into the model distorted the model for two reasons. First, the EMBLI schools perform at a significantly higher level in rural than in urban areas, thus ‘contradicting’ the behavior of the other two programs. Second, the CAFE schools had no rural presence so predictions about the performance of the CAFE schools in rural areas would be purely hypothetical.
For the sake of perspective, however, we can estimate the overall impact of the variable of urbanicity using the Standard L2 schools since these are scattered between rural and urban areas. Doing so in a full model which includes all of the other variables included above suggests that this variable has a very large effect, with schools in urban areas having approximately a 11 percentage point advantage over their rural peers. This suggests the possibility that the “true” educational effectiveness of the CAFE schools may actually be below that of the Standard L2 schools. As noted, however, this is suppositional since there are no CAFE schools in rural areas.
What about variation among teachers and schools?
In many countries it is common to find extreme variation among schools. This is true in Timor-Leste as well though the variation is mostly observed in the Standard L2 schools. The EMBLI and the CAFE schools show much less variation among themselves. The CAFE schools show little variation probably because they are all in urban areas. The EMBLI schools show a smaller amount of variation with rural schools actually scoring higher than urban schools though the sample size (number of schools) is small.
In the case of the regular government schools, the extreme variation is strongly associated with location—urban vs. rural areas—with the rural schools clearly performing at a much lower level. It is critical, however, to keep in mind that the schools in rural areas are also more likely to be attended by children speaking a language other than Tetun or Portuguese, while Tetun or Portuguese is much more likely to be understood or spoken by children in urban areas. Obviously, Tetun-speaking children are more likely to benefit from Tetun-medium instruction.
Section 3: Costs and Cost Analysis
Good policy decisions in education require a thoughtful balance between ideology, quality of service and cost. Ignoring one or more of these factors almost always leads, sooner or later, to an undesirable outcome. For example, many African nations have made (low) cost a top priority in education. The result is extremely poor outcomes. In 1988, the state of California in the US made an ideological choice to apply an English-only model to its schools statewide. In 17 years, the state went from being one of the top ranked states to almost dead last (49 out of 50).
The EMBI endline study gathered data from three (3) different educational models in Timor-Leste: the regular government program which is becoming a Tetun-medium program, the CAFE program which is a special Portuguese-medium program, and EMBLI which is a mother-tongue medium program aimed at children who speak neither Tetun nor Portuguese when they come to school. Earlier sections of this Executive Summary have presented overall findings on the educational performance of these programs. In this section, we
EMBLI Endline Assessment – Executive Summary October 2016 14
provide a short cost analysis of elements of the three programs. Doing so provides a more complete understanding of the cost-benefit characteristics of each program for all stakeholders.
Analyses in this area may be framed in terms of “wastage” (money spent for which there is no result), “real” or “unit” cost (what must be spent to achieve a desired outcome) and “return on investment” (assigning value at some level—personal or national—to the long term benefits which can be traced to the original investment in education). In this summary document, we give brief examples of only the first two of these from the Timor-Leste data.
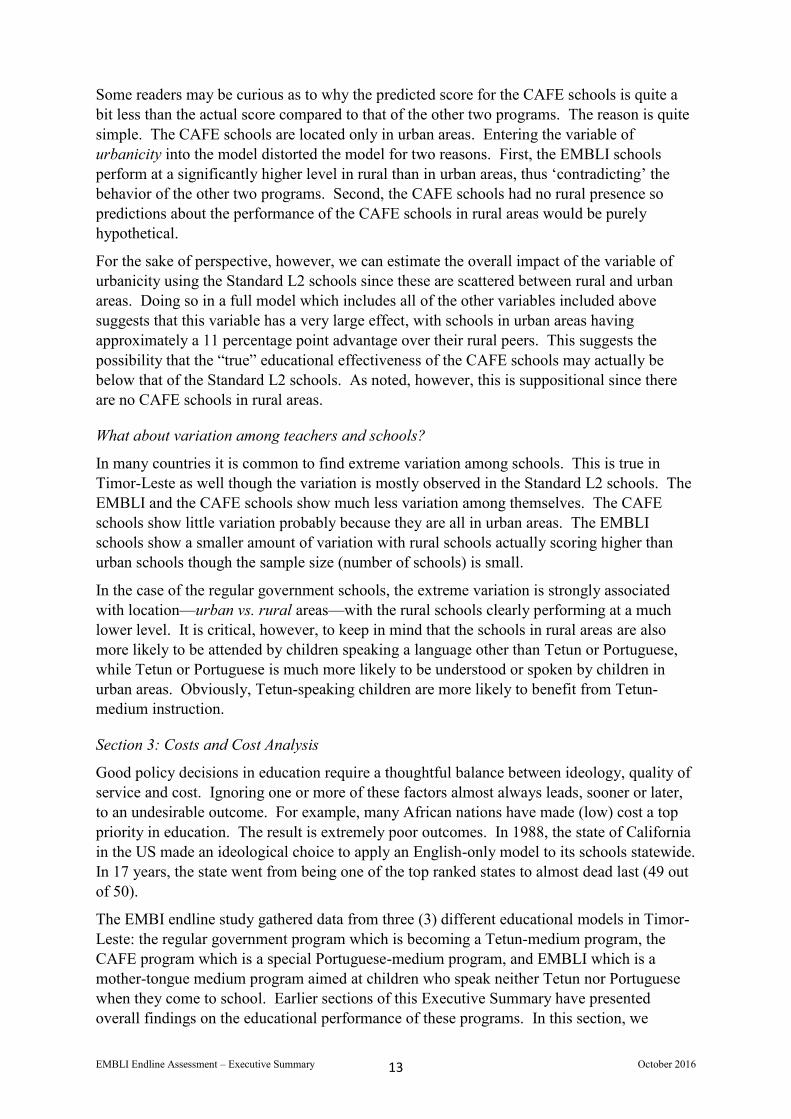
Wastage in math instruction and learning. It is common to think of reading and math as very different and unrelated subjects. This is misleading. Learning math is more closely tied to reading than we realize. In the endline assessment data for Grade 2, we found that 12 percent of students from the regular government schools had become good readers, 23 percent from the CAFE program and 60 percent of the EMBLI students had become good readers (80 percent reading comprehension or higher). We also found that good readers—regardless of program—scored 15 to 20 percentage points higher on the math assessment. Cost analysts then reason that this higher level is the normal or expected level of performance in math with failure to reach this level being assigned to a failure to learn to read adequately. Or, in terms of cost, we say, ‘the money spent to achieve this level of proficiency in math was wasted’ because so many failed to achieve at the target level. The following figure shows what this wastage looks like.
Figure 6. Estimating the cost of instructional inefficiencies in teaching math.
In the model used to estimate the cost of math instruction for Grade 2 students, we assigned 20 percent of instructional time to this subject. In the case of the CAFE program, we could then estimate this amount at $500 per child per year. If $384 per child is ‘wasted’ because of a failure to make expected progress, we would then conclude that we had a wastage rate of
EMBLI Endline Assessment – Executive Summary October 2016 15
76.8 percent. Figure 6 projects the amount of this wastage when/if the respective model were in place as a national model.
Real or Unit Cost. If a person has a business making bricks and finds that 15 percent of the bricks formed actually break when they are being fired, then those bricks cannot be sold because they are broken. Instead, the business owner adds the cost of the broken bricks to the cost of the good bricks in order to know what price to set on his bricks to make some money.
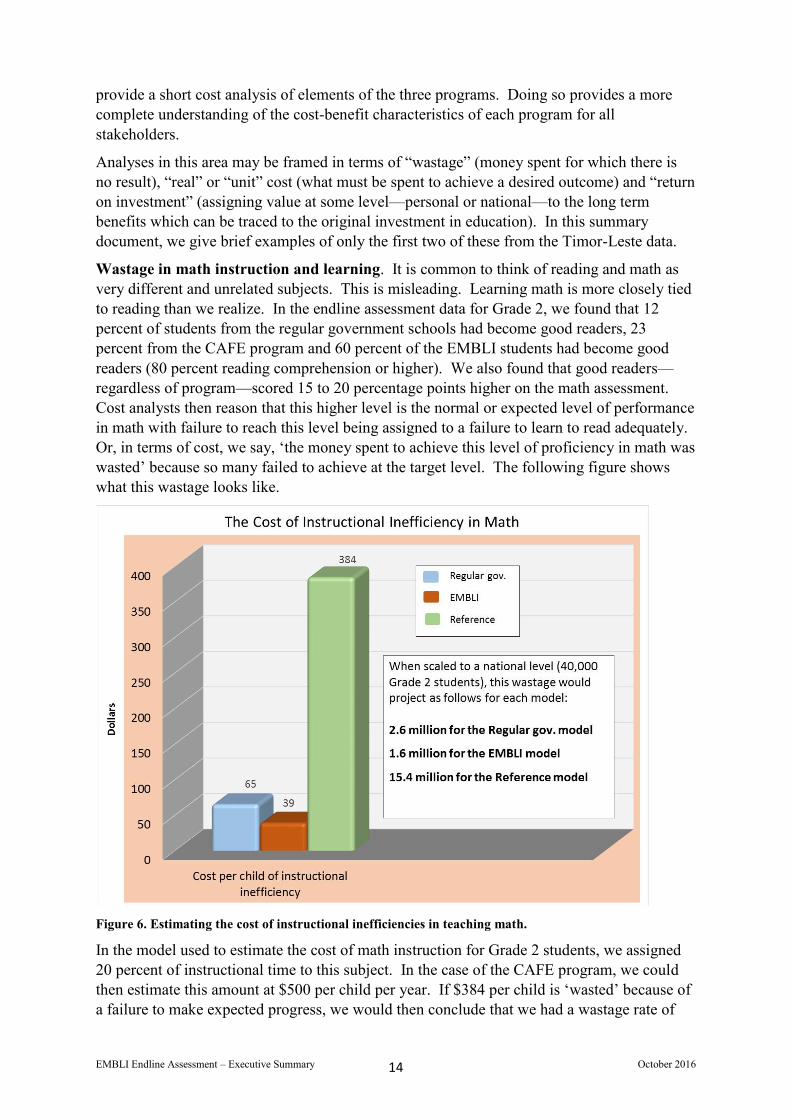
The same principle can be applied to education. If a child goes to school for a year but fails to learn anything and drops out, the money spent “educating” that child is lost. Rather than treating this money spent as being “gone”, economists allocate the total amount spent to the successful students (just like the brick maker). Figure 7 shows the cost implications when we apply this basic principle to developing good readers in Grade 2.
Figure 7. The unit cost of developing good readers in Grade 2 in each program.
When we allocate all of the costs of developing readers in Grade 2 in teach program to those who actually became good readers, we get the results shown in Figure 7. The cost to develop a good reader in the regular government program is pretty high at $1,233, but it is vastly higher in the CAFE program at $4,367 per successful reader. If we go a step further and project this cost at a national level under the assumption that each of the models had become the national model, we then get an estimate of the cost to develop good readers at the Grade 2 level nationwide. The cost for the CAFE model is very high—174 million dollars—about 3.5 times that of the regular government program and 13 times higher than that of the EMBLI model.
Cast in terms of cost effectiveness, the existing government schools are actually more efficient than the CAFE schools at producing good readers at a fixed cost. Of course, we
EMBLI Endline Assessment – Executive Summary October 2016 16
have to recognize that these results extend only through Grade 2. It remains to be seen what will happen in the higher grades through we do have a body of theory and research indicating that teaching children to read only in a second or foreign language has a low rate of success.
Conclusion
The EMBLI program has produced very strong results, nearly doubling the academic performance of children attending these schools. Further, it has demonstrated that it can accelerate the academic readiness of children to perform in the higher grades. Finally, it has demonstrated strong effectiveness in rural areas where educational results in Timor-Leste tend to be the weakest. If Timor-Leste wishes to significantly improve educational outcomes in low-performing rural areas, the EMBLI model appears to be an especially appropriate choice. When we also take into consideration the cost effectiveness of this program, it becomes even more attractive.
As noted earlier in the summary, the regular L2 schools are in the process of introducing a major educational intervention. It will be very interesting to find out how much this innovation improves the educational effectiveness of those schools.
The full report—in the section labeled Reflections—identifies a substantial list of other factors which are clearly affecting educational outcomes including such factors as the need for further language development in Tetun, instructional quality, length of instructional day, school management, content mastery by teachers, etc. The interested reader is referred to the full report for a more complete discussion of these topics.