the mpumalanga economic development growth path · the mpumalanga economic growth and development...
TRANSCRIPT

Mpumalanga Economic Growth &
Development Path (Final Draft)
“Towards a more equitable and inclusive economy”
October 2011

TABLE OF CONTENTS
CONTENTS: PAGE
1. EXECUTIVE SUMMARY .......................................................................................................................1
2. MPUMALANGA SITUATIONAL ANALYSIS ..........................................................................................6
2.1 Population.....................................................................................................................................6
2.1.1 Provincial Labour Market Characteristics ..............................................................................7
2.1.2 Reducing unemployment.......................................................................................................9
2.2 Inequality ....................................................................................................................................12
2.2.1 Reducing inequality..............................................................................................................12
2.3 Poverty ........................................................................................................................................13
2.3.1 Reducing poverty .................................................................................................................14
2.3.2 Human Development Index (HDI)........................................................................................15
2.4 Resource Analysis........................................................................................................................15
2.4.1 Land......................................................................................................................................16
2.4.2 Water ...................................................................................................................................21
2.4.3 Biodiversity ..........................................................................................................................25
2.4.4 Transport Infrastructure ......................................................................................................27
2.4.5 Electricity..............................................................................................................................30
2.5 Information Communication Technology (ICT)...........................................................................33
2.6 Human Capital.............................................................................................................................35
2.7 Sector Analysis of the Provincial Economy .................................................................................35
2.7.1 Provincial Gross Domestic Product (GDP)............................................................................35
2.7.2 Contribution to national and provincial economy...............................................................36
2.7.3 Sectoral contribution and growth........................................................................................36
2.7.4 Contribution to Regional Gross Geographic Product...........................................................41
2.7.5 Mining ..................................................................................................................................43
2.7.6 Manufacturing .....................................................................................................................45
2.7.7 Trade ....................................................................................................................................46
2.7.8 Tourism sector .....................................................................................................................46
2.7.9 Community services.............................................................................................................47
3. OVERVIEW OF THE NATIONAL GROWTH PATH AND PROVINCIAL APPLICATIONS AND
IMPLICATIONS .................................................................................................................................48
3.1 Global Economic Situation ..........................................................................................................48
i
3.2 National Economic Performance and Outlook ...........................................................................49
3.3 National Labour Market..............................................................................................................49
3.4 Main Challenges South Africa Faces ...........................................................................................50
3.4.1 Structures of Production and Control..................................................................................51
3.4.2 Structural Changes in the Provincial Space Economy..........................................................54
3.5 The National Growth Path as a fulcrum to remedying the challenge ........................................54
3.6 Sectors to Support Employment Creation outlined In the National Growth Path .....................55
3.7 Job drivers ...................................................................................................................................56
3.7.1 Infrastructure .......................................................................................................................56
3.7.2 Main Economic Sectors........................................................................................................57
3.7.3 Seizing the Potential of New Economies .............................................................................57
3.7.4 Investing in Social Capital and Public services .....................................................................57
3.7.5 Spatial Development............................................................................................................58
3.8 Macroeconomic and Microeconomic Interventions...................................................................58
4. THE MPUMALANGA ECONOMIC GROWTH AND DEVELOPMENT PATH.........................................60
4.1. Strategic objectives ....................................................................................................................60
4.2 Mpumalanga in the next ten years .............................................................................................60
4.3 Job drivers ...................................................................................................................................60
4.3.1 Infrastructure as a job driver for job creation and catalyst for development.....................61
4.3.2 Main Economic Sectors........................................................................................................61
4.3.3 Sectors Seizing the Potential for New Economies ...............................................................72
4.3.4 Investing in Social Capital & the Public Service ...................................................................74
4.3.5 Spatial Development............................................................................................................75
5. STRATEGIC INTERVENTIONS ............................................................................................................77
5.1 Principles for unlocking growth and employment......................................................................77
5.1.1 Broad Based Black Economic Empowerment (BBBEE) ........................................................77
5.1.2 Strategic Procurement .........................................................................................................77
5.1.3 Labour and Skills Development............................................................................................78
5.1.4 Inclusive and Shared Growth of the Economy.....................................................................79
5.1.5 Cooperatives ........................................................................................................................79
5.1.6 Small Micro Enterprises (SME’s) ..........................................................................................80
5.1.7 Finance and Funding ............................................................................................................81
5.2 High level interventions for the Growth Path to work ...............................................................82
5.2.1 Land Claims ..........................................................................................................................82
ii

5.2.2 Water Allocation ..................................................................................................................82
5.2.3 Transport and Logistics ........................................................................................................82
5.2.4 Electricity..............................................................................................................................82
5.2.5 Policy & Regulations.............................................................................................................82
5.2.6 Communication....................................................................................................................82
5.3 Sustainability of the Mpumalanga Economic Growth and Development Path (MEGDP) ..........83
5.3.1 Provincial Spatial Development Plan ...................................................................................83
5.3.2 Provincial Infrastructure Development Plan........................................................................83
5.3.3 Provincial Industrial Plan (IPAP 2 as a strategy)...................................................................83
5.3.4 Provincial Water Management Plan ....................................................................................83
5.3.5 Energy Distribution Plan ......................................................................................................83
5.3.6 Provincial Skills Development Plan ......................................................................................84
5.3.7 Environmental Plan..............................................................................................................84
5.4 Institutional Arrangements.........................................................................................................84
5.5 Monitoring and Evaluation .........................................................................................................84
6. CONCLUSION ....................................................................................................................................85
7. REFERENCES......................................................................................................................................87
iii

ABBREVIATIONS AND ACRONYMS
BEE Black economic empowerment BRICS Brazil, Russia, India ,China & South Africa COGTA Department of Cooperative Governance and Traditional Affairs DARDLA Department of Agriculture, Rural Development and Land Administration DBSA Development Bank of South Africa DED Department of Economic Development DEDET Department of Economic Development, Environment and Tourism DoF Department of Finance DPWR&T Department of Public Works, Roads and Transport EMF Environmental Management Framework EPWP Expanded Public Works Programme ESR Educator‐school ratio EXCO Executive Committee GEAR Growth Employment And Redistribution GVA Gross Value Added IEC Industrial and Economic Cluster IPAP 2 Industrial Policy Action Plan LER Learner‐educator ratio LSR Learner‐school ratio MEGDP Mpumalanga Economic Growth and Development Path MP Mpumalanga Province MPG Mpumalanga Province Government MTEF Medium Term Expenditure Framework MTSF Medium Term Strategic Framework PDC Provincial Development Council PGDS Provincial Growth and Development Strategy PIC Public Investment Commissioners PMC Provincial Management Committee RDP Reconstruction and Development Programme SASSA South African Social Services Agency SIC Standard Industry Codes SOE State owned enterprises StatsSA Statistics South Africa TSA Tourism Satellite Accounts UN United Nations WTTC World Travel and Tourism Council
iv

1. EXECUTIVE SUMMARY
Introduction
Mpumalanga is a province rich in resources, people and heritage. Large‐scale joblessness, poverty and inequality however, compromise the Province’s triple bottom line agenda, i.e. addressing the social; economic and environmental needs of its citizens. The Province is committed to local economic development, which promotes shared and inclusive growth via the creation of decent local jobs and sustainable livelihoods. This document provides a detailed framework for the realisation of these objectives.
The economic growth and development path highlighted in this document illustrates the current economic landscape of Mpumalanga with a view to future economic growth and development.
This dynamic (will evolve with time) and strategic (will inform future growth) document captures:
• Key comparative and competitive advantages of the province;
• Economic triggers which will have a positive impact on Low‐skill labour absorbing job creation, Domestic beneficiation of raw materials and Local content and supply into production processes;
• Growth trajectories which are strategically linked to sustainability and new economies; and
• Strategic interventions (projects, programmes or policies) which will positively support and contribute to the province’s strategic objectives.
The Provincial Economic landscape
The first chapter of this Economic Growth and Development Path provides a high‐level overview of the current economic landscape of Mpumalanga Province (MP). Mpumalanga has a youthful population with approximately 64% of the population consisting of economically active people (15 to 34 years of age). This provides significant human resources for future economic growth and sustainability.
The labour market characteristics however paint a concerning picture. From the 1st quarter of 2009, MP has been shedding jobs at a faster rate than the country as a whole.
• Approximately 72% of the population is under 34 years of age.
• Sectors such as Agriculture have lost approximately 20% of jobs between the 1st quarter of 2009 and 2010.
• According to the 2007 Community Survey, approximately 23% of the population has no schooling.
• Manufacturing represents the largest sector in the Province (21%) by value add, closely followed by Mining (19%)
• The primary, secondary and tertiary sectors contribute 22.3%, 28.1% and 49.6% respectively.
1
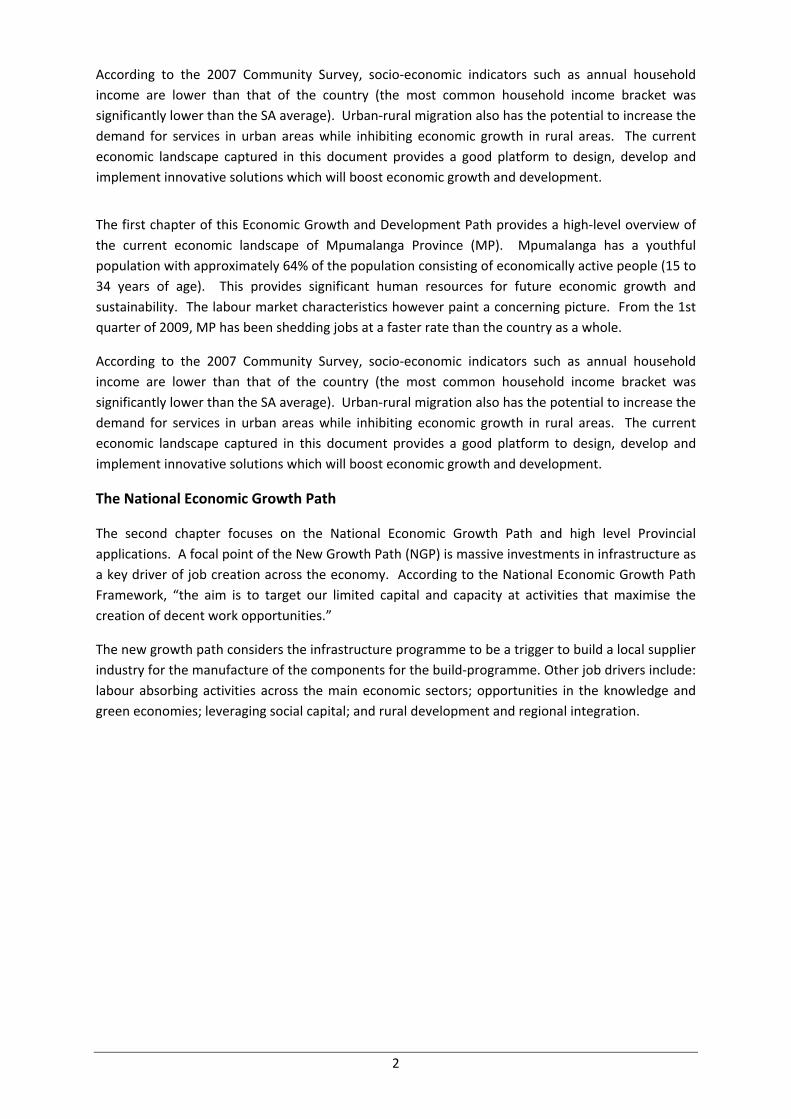
According to the 2007 Community Survey, socio‐economic indicators such as annual household income are lower than that of the country (the most common household income bracket was significantly lower than the SA average). Urban‐rural migration also has the potential to increase the demand for services in urban areas while inhibiting economic growth in rural areas. The current economic landscape captured in this document provides a good platform to design, develop and implement innovative solutions which will boost economic growth and development.
The first chapter of this Economic Growth and Development Path provides a high‐level overview of the current economic landscape of Mpumalanga Province (MP). Mpumalanga has a youthful population with approximately 64% of the population consisting of economically active people (15 to 34 years of age). This provides significant human resources for future economic growth and sustainability. The labour market characteristics however paint a concerning picture. From the 1st quarter of 2009, MP has been shedding jobs at a faster rate than the country as a whole.
According to the 2007 Community Survey, socio‐economic indicators such as annual household income are lower than that of the country (the most common household income bracket was significantly lower than the SA average). Urban‐rural migration also has the potential to increase the demand for services in urban areas while inhibiting economic growth in rural areas. The current economic landscape captured in this document provides a good platform to design, develop and implement innovative solutions which will boost economic growth and development.
The National Economic Growth Path
The second chapter focuses on the National Economic Growth Path and high level Provincial applications. A focal point of the New Growth Path (NGP) is massive investments in infrastructure as a key driver of job creation across the economy. According to the National Economic Growth Path Framework, “the aim is to target our limited capital and capacity at activities that maximise the creation of decent work opportunities.”
The new growth path considers the infrastructure programme to be a trigger to build a local supplier industry for the manufacture of the components for the build‐programme. Other job drivers include: labour absorbing activities across the main economic sectors; opportunities in the knowledge and green economies; leveraging social capital; and rural development and regional integration.
2

Figure 1: Key Sectors in MEGDP identifies the following sectors, which will assist in job creation:
Figure 1: Key Sectors in MEGDP
The National Economic Growth Path highlighted above closely informs the Mpumalanga Province’s Economic Growth and Development Path (MEGDP). The focus of job creation in the Agricultural, Manufacturing, Infrastructure and Mining sectors was previously driven by significant growth in skilled, knowledge, information and service jobs (non‐labour absorbing) and a decline in low skilled, process and manual work (labour absorbing) jobs. Mpumalanga’s Economic Growth and Development Path will therefore focus on reversing this trend towards a shared and inclusive economy.
Mpumalanga Province’s Economic Growth and Development Path (MEGDP)
Mpumalanga has taken an innovative approach to the development of its Economic and Development Growth Path. Although, the MEGDP is closely aligned to the National Strategy, it however takes into consideration Mpumalanga’s province‐specific comparative and competitive advantages and the linkages to key provincial strategic objectives. The primary objective of the MEGDP is to foster economic growth that creates jobs, reduce poverty and inequality in the Province. The growth path is anchored on a number of parameters including sector development, Inclusive & shared growth, spatial distribution, regional integration, sustainable human development and environmental sustainability with clearly defined strategic targets over the medium to long term.
3

Table 1: Key opportunities per sector in the MEGDP (these are examples of high impact projects and not an exhaustive list):
KEY OPPORTUNITIES IN MP ECONOMIC SECTORS SECTOR AREAS OF STRATEGIC OPPORTUNITES
Charcoal Production New ventures into community forestry plantations Expansion of Ngodwana Plant Expand Packaging Industry
Forestry
Bio‐mass plant at Lomati Mill Agriculture Bio‐energy production from sugar cane off‐cuts
SMME and Cooperatives development Beneficiation (centralised mining refinery) Re‐treatment of sub‐economic deposits & dumps
Mining
Mining of dimension stone Eskom New Build Programme (Kusile Project) Re‐commissioning of Camden, Komati & Grootvlei power stations
Energy
Alternative energy production
Establish capacity for manufacture of smokeless stoves (vesto) Establish a manufacturing plant to manufacture solar cells, then modules. Establish a Centre of Competence for high level skills and high technology focusing on Furniture, Steel and Tooling
Manufacturing
Innovation Centre (industry sectors e.g. leather/general goods Tourism and cultural Promotion of wildlife, nature, entertainment, adventure tourism, industrial,
township tourism, and cultural heritage Bio‐mass converters for extraction of renewable energy & charcoal Green Economy Establish Hydro‐power plant Broadband deployment Information and
Communication Technology (ICT)
Business Process Outsourcing and Off‐shoring
Promotion of cooperatives, non‐governmental organizations, stokvels, burial societies, etc HIV control and Management
Investing in Social capital and Public Service
Building a critical mass of skills Rural Development: Identify First and second order nodal development potential for crowding in investment Provision of infrastructure & housing
Spatial Development
Regional & International Co‐operation: Strategic partnerships with other countries on the continent( strong link & niche role) on many areas such as tourism, agriculture, ICT and transport and logistics, etc. New rail development Revitalize rail freight New Air freight and passenger airport
Infrastructure Development
Industrial Infrastructure Development of SEZ in Govan Mbeki
Strategic Interventions to unlock and support the MEGDP
The last section of the MEGDP focuses on specific strategic interventions which, unlock and support the realisation of the initiatives noted in Mpumalanga’s economic growth and Development Path. Some of the key interventions include:
4

• Effective and efficient BBBEEE which empowers previously disadvantaged to positively contribute to the economy;
• Skills development and capacity which is linked to the identified growth trajectories;
• Reducing the cost of doing business in MP and barriers to entry;
• Increasing MPs competitive advantages and creating appropriate investment incentives;
• Support to Cooperatives and SMMEs to ensure sustained development;
• Project financing; and
• Provision of conducive Infrastructure for economic growth and development (land claims, water licences, communications, etc).
Concluding remarks
The MEGDP is a dynamic ‘living’ document which will evolve over the next 10 years as the economy develops and key opportunities which are aligned to the Provinces strategic objectives are identified.
The focal point of this Economic Growth and Development Path is the creation of decent labour absorbing jobs which will have positive direct, indirect and induced effects on the Provincial economy and the living standards of its people. Our president Jacob Zuma captured this well in his inaugural State of the Nation Address in June 2009, when he said:
“It is my pleasure and honour to highlight the key elements of our programme of action. The creation of decent work will be at the centre of our economic policies and will influence our investment attraction and job creation initiatives. In line with our undertakings, we have to forge ahead to
promote a more inclusive economy.”
5

2. MPUMALANGA SITUATIONAL ANALYSIS
2.1 Population
The mid‐year population estimates for 2010 indicate that Mpumalanga’s population was 3 617 600.
This is 7.2% of the South African population and makes Mpumalanga the 6th most populous
province, ahead of the North West, Free State and Northern Cape.
Females constituted 1.85 million or 51.2 per cent of the provincial population distribution and males
1.76 million (48.8 per cent). The youth cohort (0‐34 years) made up 71.9 per cent of the total
population in the province whilst the age group 15‐34 makes up 63.4 percent of the provincial
population. The age cohort of 10‐14 years represented the most populous age cohort with 429 300
individuals or some 11.9 per cent of the provincial population. Nationally the most populous age
cohort was the 15‐19 years group that represented some 10.5 per cent of the population.
Figure 2: Population Pyramid for South Africa & Mpumalanga
South Africa
3,000,000 1,500,000 0 1,500,000 3,000,000
0‐45‐9
10‐1415‐1920‐2425‐2930‐3435‐3940‐4445‐4950‐5455‐5960‐6465‐6970‐7475‐7980+
Female Male
Mpumalanga
250,000 125,000 0 125,000 250,000
0‐45‐910‐1415‐1920‐2425‐2930‐3435‐3940‐4445‐4950‐5455‐5960‐6465‐6970‐7475‐7980+
Female Male
Youth (0-34 years) = 71.9% of total population
Youth (0-34 years) = 68.6% of total population
51.2% 48.8% 51 3% 48.7%
Data Source: Statistics South Africa‐Mid Year Population Estimates 2010: Own Calculations
The youthful nature of the population is typical to developing economies. It requires a growth and
development agenda that puts an emphasis on the youth for future sustainability. The fact that the
most populous age group for Mpumalanga is lower than that of national, has implications for where
to put more emphasis in terms of interventions and resources in areas such as education, health as
well as social grants as compared to national. Timely interventions within the youth will reap better
long term gains for provincial growth and development.
The population growth rate of South Africa and Mpumalanga declined over the period 2002 to 2010.
During this period, the average annual population growth rate for Mpumalanga was 0.9 per cent
6
compared with the 1.2 per cent recorded nationally. In Mpumalanga, although females outnumber
males, the population growth rate of males exceeded that of females in each of the nine years. The
average annual population growth rate for males was 1.0 percent and that for females was 0.7
percent.
2.1.1 Provincial Labour Market Characteristics
Job creation underpins the Mpumalanga Economic Growth and Development Path (MEGDP). A clear
understanding of the Provincial labour market characteristics will assist in identifying potential
structural challenges in the labour market and possible interventions, which will foster employment
creation.
The general labour market characteristics in Mpumalanga are captured in tables 1 and 2 below. The
employment data below is shown in comparison to South Africa as a whole. This is done in order to
provide a benchmark given the high attrition rate of jobs during the 2008 economic down‐turn.
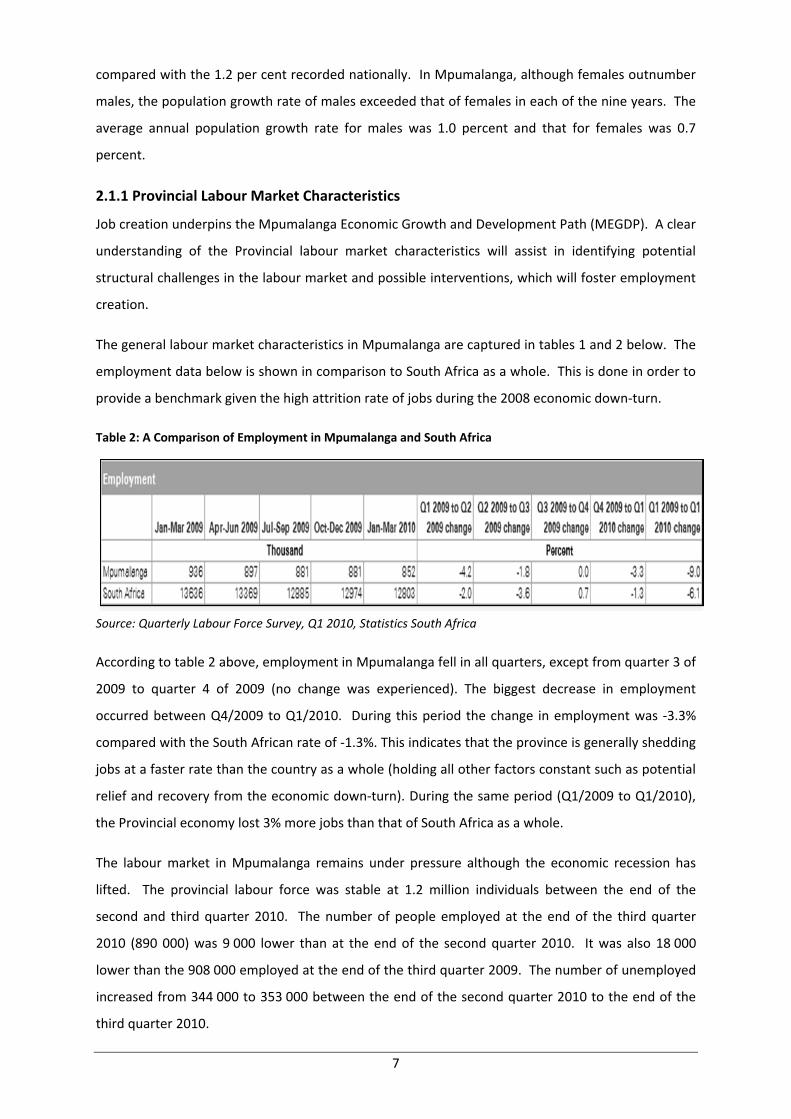
Table 2: A Comparison of Employment in Mpumalanga and South Africa
Source: Quarterly Labour Force Survey, Q1 2010, Statistics South Africa
According to table 2 above, employment in Mpumalanga fell in all quarters, except from quarter 3 of
2009 to quarter 4 of 2009 (no change was experienced). The biggest decrease in employment
occurred between Q4/2009 to Q1/2010. During this period the change in employment was ‐3.3%
compared with the South African rate of ‐1.3%. This indicates that the province is generally shedding
jobs at a faster rate than the country as a whole (holding all other factors constant such as potential
relief and recovery from the economic down‐turn). During the same period (Q1/2009 to Q1/2010),
the Provincial economy lost 3% more jobs than that of South Africa as a whole.
The labour market in Mpumalanga remains under pressure although the economic recession has
lifted. The provincial labour force was stable at 1.2 million individuals between the end of the
second and third quarter 2010. The number of people employed at the end of the third quarter
2010 (890 000) was 9 000 lower than at the end of the second quarter 2010. It was also 18 000
lower than the 908 000 employed at the end of the third quarter 2009. The number of unemployed
increased from 344 000 to 353 000 between the end of the second quarter 2010 to the end of the
third quarter 2010.
7

Table 3: Employment by Sector in Mpumalanga
Source: Quarterly Labour Force Survey, Q1 2010, Statistics South Africa
Employment in the informal (non‐agricultural) sector dropped by 9% from quarter 1 of 2009 to Q1
quarter 1 of 2010.The largest year on year percentage change was in the agricultural sector. This
sector experienced a decrease in employment of 19.8% over the given time period.
Mpumalanga contributed 6.9 per cent to the national number of employed. The trade sector
(wholesale and retail trade) employed the largest share of individuals in the province at 24.0 per
cent. Community and social services (18.9 per cent) was the second biggest employer followed by
finance (10.0 per cent) and manufacturing (9.1 per cent). The sectors that contributed the least
were transport (4.7 per cent) and utilities (2.4 per cent).
The occupational profile of Mpumalanga was heavily skewed towards semi‐ and unskilled
occupations. The share of highly educated or skilled occupations (managers and professionals) was
only 9.4 per cent. The share of the category of elementary occupations (unskilled or semi‐skilled)
was 26.2 per cent.
Disaggregation according to gender reveals that more males (57.7 per cent) than females (42.3 per
cent) were employed in Mpumalanga. The age group of 30‐34 years was the highest represented
among the number of employed with a share of 18.5 per cent. The youth cohort (15‐34 years) made
up some 45.9 per cent of the number of employed.
According to Statistics South Africa’s QLFS, 56.1 per cent of the employed found themselves
employed in the urban areas of the province, whereas the remainder (43.9 per cent) worked in rural
areas. The local municipality with the highest number of employed was Mbombela, followed by
Emalahleni and Govan Mbeki.
The unemployment rate in Mpumalanga was 25.5 per cent at the end of the third quarter 2009 and
increased to 28.4 per cent at the end of the third quarter 2010. This was higher than the national
8

average, which was recorded at 25.3 per cent at the end of the third quarter 2010. Mpumalanga,
recorded the second highest unemployment rate among the nine provinces after Free State
(29.5 per cent). The province contributed some 8.0 per cent to the national number of unemployed.
The unemployment rate of females (32.0 per cent) was 6.5 percentage points higher than that of
males (25.5 per cent) in the province. Females, with 177 400, contributed some 50.3 per cent to the
total number of employed, although only contributing 44.6 per cent to the labour force. The age
group of 20‐24 years was the highest represented among the number of unemployed with a share of
29.0 per cent. The youth cohort (15‐34 years) with 258 000 unemployed individuals made up nearly
three quarters (73.2 per cent) of the number of unemployed. The unemployment rate of the youth
cohort was 38.7 per cent, some 10.3 percentage points higher than the provincial average
unemployment rate.
Geographically, the number of unemployed was skewed towards rural areas with 55.2 per cent of
the unemployed in the province found there. The unemployment rate of rural areas at 33.3 per cent
was higher than the provincial rate as well as that of urban areas (24.0 per cent). The local
municipality with the highest number of unemployed was Dr JS Moroka, whilst Emakhazeni was the
municipality with the least number of employed. Although not official, it is calculated that Dr JS
Moroka (58.2 per cent) had the highest unemployment rate whilst Thaba Chweu (9.7 per cent) had
the lowest unemployment rate.
A worrying reality is the long term nature of unemployment in the province with some 70.4 per cent
of the unemployed in Mpumalanga that have been seeking employment for one year and longer.
This was marginally higher than the corresponding national figure of 65.8 per cent, a figure that
emphasises the notion of the systemic and entrenched nature of unemployment in the country.
2.1.2 Reducing unemployment
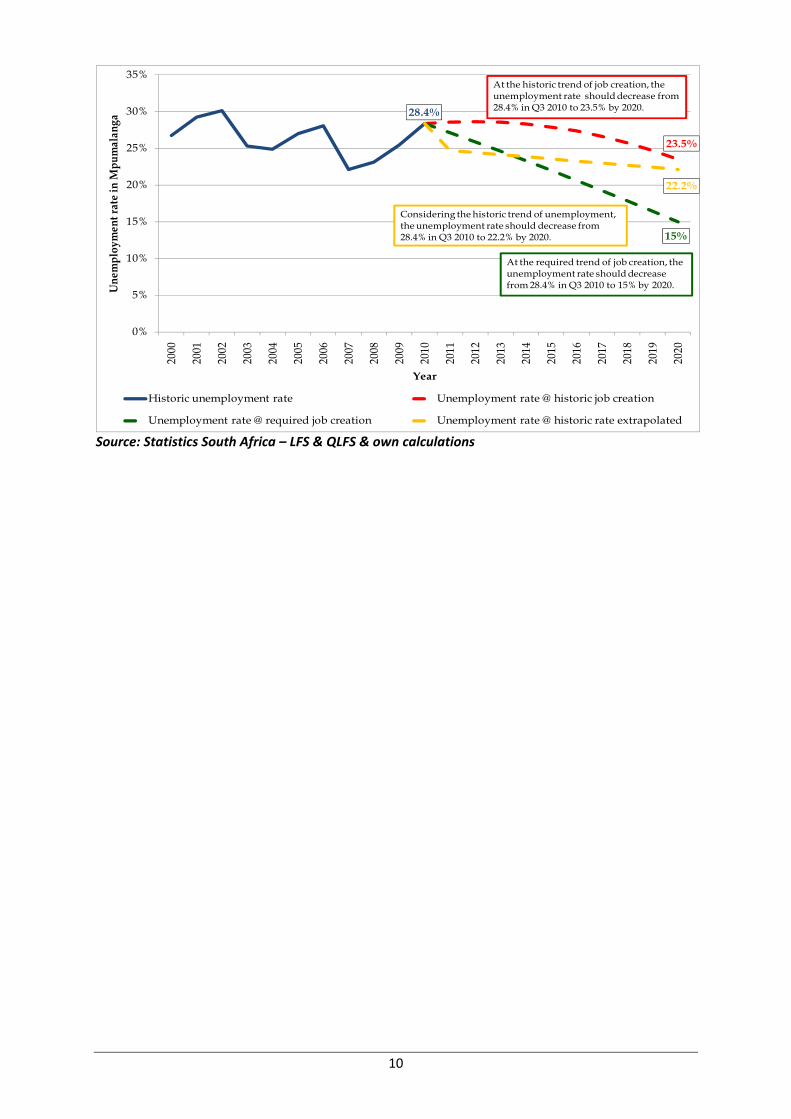
Three scenarios were modelled to determine where the provincial unemployment rate could be in
the next 10 years, based on historic data. Figure 1 depicts the historic data up to 2010 and the three
scenarios up to 2020. The broken yellow line portrays a continuance of the unemployment rate’s
historic trend in Mpumalanga. According to this scenario the unemployment rate will gradually
decline to approximately 22.2 per cent by 2020. Should, however, the historic job creation trend
(broken red line) continue into the future, the unemployment rate can be expected to hover around
23.5 per cent by 2020. However, the overarching aim, both nationally and provincially, is to
decrease the unemployment rate to 15 per cent within 10 years. This is shown by the broken green
line and is referred to as the required job creation trend.
Figure 3: Historic and forecasted unemployment rate in Mpumalanga, 2000‐2020
9
28.4%
23.5%
15%
22.2%
0%
5%
10%
15%
20%
25%
30%
35%
2000
2001
2002
2003
2004
2005
2006
2007
2008
2009
2010
2011
2012
2013
2014
2015
2016
2017
2018
2019
2020
Une
mpl
oym
ent r
ate
in M
pum
alan
ga
Year
Historic unemployment rate Unemployment rate @ historic job creation
Unemployment rate @ required job creation Unemployment rate @ historic rate extrapolated
At the historic trend of job creation, the unemployment rate should decrease from 28.4% in Q3 2010 to 23.5% by 2020.
Considering the historic trend of unemployment, the unemployment rate should decrease from 28.4% in Q3 2010 to 22.2% by 2020.
At the required trend of job creation, the unemployment rate should decrease from 28.4% in Q3 2010 to 15% by 2020.
Source: Statistics South Africa – LFS & QLFS & own calculations
10

Figure 4: Historic and forecasted employment numbers in Mpumalanga, 2000‐2020
1 609 656
890 000
1 204 406
-
200 000
400 000
600 000
800 000
1 000 000
1 200 000
1 400 000
1 600 000
1 800 000
2000
2001
2002
2003
2004
2005
2006
2007
2008
2009
2010
2011
2012
2013
2014
2015
2016
2017
2018
2019
2020
Num
ber o
f em
ploy
ed in
Mpu
mal
anga
Year
Employed @ required trend Employed @ historic trend
At the historic trend of job creation, the number of employed is expected to increase by 314 406 in 10 years, or on average by some 31 440 per year.
At the required trend of job creation, the number of employed need to increase by 719 656 in 10 years, or on average by some 71 966 per year.
Source: Statistics South Africa – LFS & QLFS & own calculations
Over the 10‐year period from 2000 to 2010, Mpumalanga did not experience jobless economic
growth. This stems from the fact that the number of employed increased from 818 000 in 2000 to
890 000 by the end of the third quarter of 2010 (Figure 4). By extrapolating this historic job creation
trend into the future it can be expected that the number of employed will increase to 1.2 million by
2020. Under normal conditions based on historic trends, the Mpumalanga economy is expected to
create 314 406 jobs in the next decade. By following this trend, coupled with moderate increases in
the economically active population, the unemployment rate of 23.5 per cent as shown in Figure 1
may be reached by 2020.
Should the province, however, aim for an unemployment rate of 15 per cent by 2020 a much higher
rate of job creation is necessary. This required number of new jobs is depicted as the red area in
Figure 4. According to the outcome of the modelling scenario, 719 656 new jobs is necessary to
reach 1.6 million jobs by 2020 and subsequently an unemployment rate of 15 per cent. This
represents an average increase of 6.1 per cent in the number of employed per annum.
The above analysis of the labour market characteristics provide a clear context as to which sectors
and targets groups the MEGDP should focus on in order to aggressively create new jobs.
11
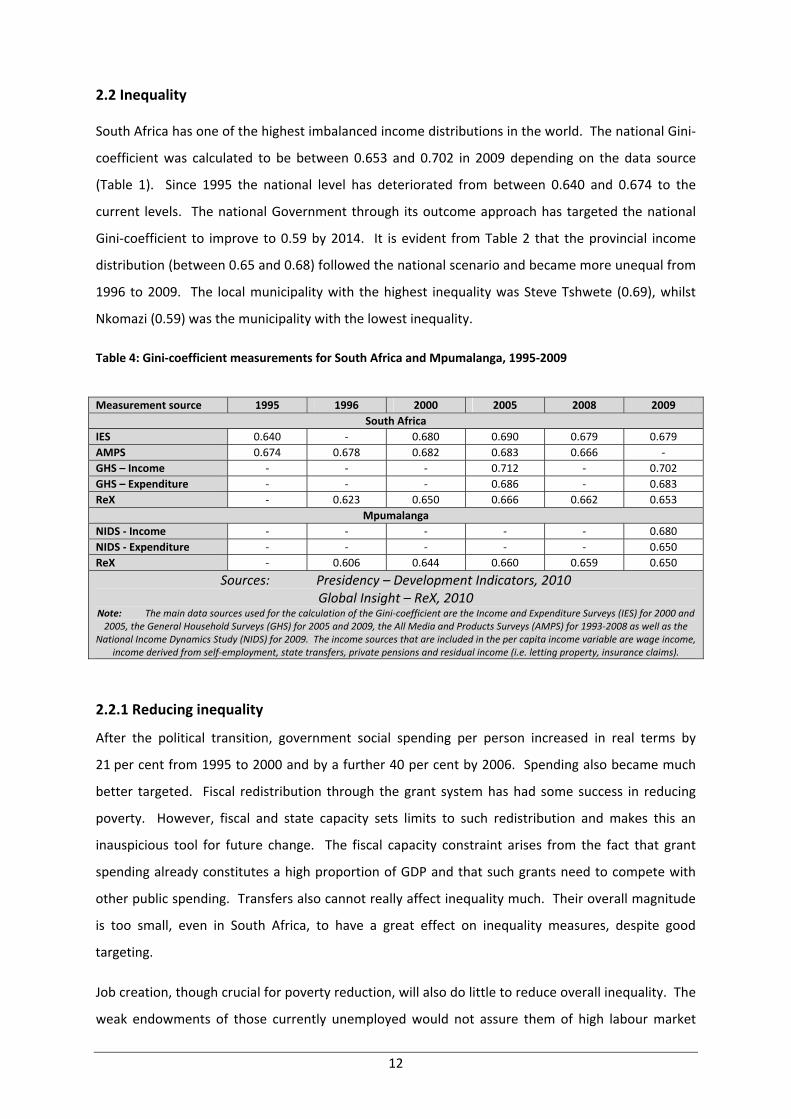
2.2 Inequality
South Africa has one of the highest imbalanced income distributions in the world. The national Gini‐
coefficient was calculated to be between 0.653 and 0.702 in 2009 depending on the data source
(Table 1). Since 1995 the national level has deteriorated from between 0.640 and 0.674 to the
current levels. The national Government through its outcome approach has targeted the national
Gini‐coefficient to improve to 0.59 by 2014. It is evident from Table 2 that the provincial income
distribution (between 0.65 and 0.68) followed the national scenario and became more unequal from
1996 to 2009. The local municipality with the highest inequality was Steve Tshwete (0.69), whilst
Nkomazi (0.59) was the municipality with the lowest inequality.
Table 4: Gini‐coefficient measurements for South Africa and Mpumalanga, 1995‐2009
Measurement source 1995 1996 2000 2005 2008 2009
South Africa IES 0.640 ‐ 0.680 0.690 0.679 0.679 AMPS 0.674 0.678 0.682 0.683 0.666 ‐ GHS – Income ‐ ‐ ‐ 0.712 ‐ 0.702 GHS – Expenditure ‐ ‐ ‐ 0.686 ‐ 0.683 ReX ‐ 0.623 0.650 0.666 0.662 0.653
Mpumalanga NIDS ‐ Income ‐ ‐ ‐ ‐ ‐ 0.680 NIDS ‐ Expenditure ‐ ‐ ‐ ‐ ‐ 0.650 ReX ‐ 0.606 0.644 0.660 0.659 0.650
Sources: Presidency – Development Indicators, 2010 Global Insight – ReX, 2010
Note: The main data sources used for the calculation of the Gini‐coefficient are the Income and Expenditure Surveys (IES) for 2000 and 2005, the General Household Surveys (GHS) for 2005 and 2009, the All Media and Products Surveys (AMPS) for 1993‐2008 as well as the
National Income Dynamics Study (NIDS) for 2009. The income sources that are included in the per capita income variable are wage income, income derived from self‐employment, state transfers, private pensions and residual income (i.e. letting property, insurance claims).
2.2.1 Reducing inequality
After the political transition, government social spending per person increased in real terms by
21 per cent from 1995 to 2000 and by a further 40 per cent by 2006. Spending also became much
better targeted. Fiscal redistribution through the grant system has had some success in reducing
poverty. However, fiscal and state capacity sets limits to such redistribution and makes this an
inauspicious tool for future change. The fiscal capacity constraint arises from the fact that grant
spending already constitutes a high proportion of GDP and that such grants need to compete with
other public spending. Transfers also cannot really affect inequality much. Their overall magnitude
is too small, even in South Africa, to have a great effect on inequality measures, despite good
targeting.
Job creation, though crucial for poverty reduction, will also do little to reduce overall inequality. The
weak endowments of those currently unemployed would not assure them of high labour market
12

earning. Thus even if they were employed, it would probably be at low wages, thus leaving wage
and hence aggregate inequality high and little affected. In the absence of improved education,
direct interventions to artificially change labour market outcomes also hold little prospect of
improving poverty and distribution and may reduce the efficient functioning of the labour market,
with various possible side‐effects.
Decomposition analysis shows that most income inequality originates in the labour market, through
the distribution of jobs and the wage formation processes. Thus change in South African inequality
must start with a reduction of inequality in wage earnings. Without more equal labour market
outcomes, aggregate inequality will remain high and will undoubtedly encourage further direct
labour market interventions in an attempt to affect distributional outcomes. Thus the labour market
is at the heart of inequality, and central to labour market inequality is the quality of education. To
reduce income inequality substantially requires a different wage pattern based on better human
capital for the bulk of the population.
2.3 Poverty
Poverty income is defined as the minimum income needed to sustain a household and varies
according to the size of the household. For example, the monthly poverty income in 2009 for a
household of four, as calculated by the Bureau for Market Research (BMR), was R2 440 and R3 396
for a household of six. The poverty rate then is the percentage of people living in households with
an income less than the poverty income.
In 2009, Mpumalanga’s poverty rate of 46.8 per cent was higher than the national rate of 41.3 per
cent. Mpumalanga’s poverty rate was the fourth highest (worst) among the nine provinces. It was
estimated that 1.75 million of Mpumalanga’s citizens lived in households with an income less than
the poverty income. Over the 13‐year period from 1996 to 2009, the poverty rate in Mpumalanga
deteriorated (increased) by 0.8 percentage point, which was more than the 0.4 percentage points at
which the poverty rate increased by nationally.
Among the local municipalities, Mbombela (253 500) registered the largest number of poor
individuals followed by Nkomazi (245 500) and Bushbuckridge (221 000). Mkhondo (70.4 per cent)
recorded the highest poverty rate, whereas Emalahleni (30.1 per cent) recorded the lowest poverty
rate. A shortcoming of the poverty rate as an indicator of poverty is that it does not give any
indication of the depth of poverty i.e. how far the poor households are below the poverty income
level. Here, the poverty gap proves useful in that it measures the difference between each poor
household’s income and the poverty line. It thus measures the depth of poverty of each poor
household. The aggregate poverty gap is calculated by summing the poverty gaps of each poor
13

household. It is thus equivalent to the total amount by which the incomes of poor households need
to be raised each year to bring all households up to the poverty line and hence out of poverty.
According to this dimension of poverty measurement, the poverty gap in Mpumalanga was
R5.6 billion in 2009. As might be expected from a country experiencing an economic recession the
poverty gap in South Africa increased (deteriorated) by 1.6 per cent between 2008 and 2009.
Mpumalanga’s (4.4 per cent) poverty gap increased the fastest, marginally ahead of Gauteng that
deteriorated by 4.2 per cent. Over the 13‐year period under review, the national poverty gap
deteriorated by 7.9 per cent annually. Mpumalanga’s increase was even worse with a 10.0 per cent
annual deterioration between 1996 and 2009. Bushbuckridge registered the largest poverty gap
with a value of R1.3 billion followed by Dr JS Moroka (R1.2 billion), whereas the poverty gap in
Emakhazeni (R41 million) was the smallest)
Another indicator of poverty levels is the percentage of people living on less than a dollar (US$) a
day. In Mpumalanga, this indicator showed much improvement from a rate of 4.7 per cent in 1996
to 0.9 per cent of the population in 2009. The national figure was slightly better at 0.8 per cent in
2009, however the improvement over the 13‐year period was not as large as in the province.
2.3.1 Reducing poverty
In order to reduce the province’s poverty rate from the 2009 level of 47.8 per cent to 25 per cent in
10 years it was calculated that on average 62 100 individuals need to be taken out of poverty
annually for the next 10 years. This equates to approximately 18 400 households whose combined
earnings needs to increase to at least the poverty line every year. It is important to note that once
at this minimum level of the poverty line, the households must be kept at that minimum level for the
remainder of the 10 year period.
In monetary terms the noted number of individuals will require a combined R218 million in the first
year to meet or exceed the poverty line. At 0.8 per cent of Mpumalanga’s provincial budget it may
seem small enough to even consider funding it from government coffers, however, to meet the 2020
poverty rate target of 25 per cent they need to be kept at the poverty line again the following year
together with the next 62 100 individuals. Cumulatively, by 2020 some 620 000 individuals or
185 000 households need be kept at the minimum poverty line with a combined R2.2 billion (8.4 per
cent of Mpumalanga provincial budget).
SASSA, currently distributes social assistance grants in Mpumalanga in the order of R6 billion per
annum to approximately 1 million beneficiaries and, whilst adding more or increasing the monetary
value of individual grants is possible, it appears unsustainable in the long run. It is therefore more
desirable that at least one person in each the 185 000 households benefit from one of the 719 656
14
jobs calculated in the unemployment scenario’s. Together with focusing on job creation, through
tools such as public works programmes and employment guarantee schemes, the provincial
government can focus on infrastructure and service provision as well as education and skills
attainment of people in poverty.
2.3.2 Human Development Index (HDI)
HDI level equal to SA by 2020: South Africa’s HDI was calculated to be 0.56 in 2009 and that of
Mpumalanga 0.50. At the current rate of improvement South Africa’s HDI score will be 0.64 by
2020, whereas Mpumalanga’s HDI will be 0.57. To equal South Africa’s HDI level in 2020 three
indicators must improve as follows over next 10 years:
2.3.2.1 Literacy level
Over the period 1996‐2009, 40 045 more individual became literate per annum ‐ an improvement of
some 2.1 per cent per annum. In order to catch up to South Africa’s level of HDI by 2020, it is
necessary to achieve an improvement of 3.7 per cent per annum over the period 2010‐2020. In
other words, 62 671 more individuals need to become literate per annum to achieve the goal. Such
an improvement necessitates either a doubling of the current expenditure or doubling the efficiency
and effectiveness of interventions that improves basic literacy.
2.3.2.2 Life expectancy
Over the period 2004‐2009, the life expectancy in the province improved by 0.2 per cent per annum.
In order to catch up to South Africa’s level of HDI by 2020, it is necessary to achieve an improvement
of 0.7 per cent per annum over the period 2010‐2020. Such an improvement necessitates either
three times more expenditure or tripling the efficiency and effectiveness of interventions that
improves life expectancy.
2.3.2.3 Per capita income
Over the period 1996‐2009, the per capita income in Mpumalanga improved by 2.3 per cent per
annum or some R346 annually. In order to catch up to South Africa’s level of HDI by 2020, it is
necessary to achieve an improvement of 4.9 per cent per annum or some R1 110 annually. Such an
improvement necessitates either a doubling of the expenditure or doubling the efficiency and
effectiveness of interventions that create sustainable jobs. Should the employment growth of
70 000 net jobs per annum therefore materialise over the next 10 years, the improvement should be
sufficient to help Mpumalanga catch up to South Africa’s level of HDI.
2.4 Resource Analysis
It is imperative to recognise that for any meaningful growth and development, certain fundamentals
need to be in place and these include natural resources such as land, water and biodiversity;
15

material resources such as electricity, road and rail infrastructure, ICT and financial services; human
resources such as skills, education, research and development. An analysis of these resources in the
case of Mpumalanga is outlined as follows:
2.4.1 Land
Land Utilization
The Mpumalanga Province covers an area of 76,495 km2 (7,649,460 ha), or 6.3% of the country.
Agriculture is the largest land user, utilising approximately 68% of the Province. Cultivation using
15% and grazing 53% of the land cover. Nature reserves cover 19% and forestry plantations 9% of
the Province. The remaining part of the Province is used by human settlements, water bodies (dams
and pans) and mines.
Figure 5: Land Cover Patterns
Source: MINTEK 2009
16

The primary land use requirements in Mpumalanga are for agricultural production, mining,
industries, forestation, ecotourism, private game farming, and protected areas for nature
conservation (Figure 5). The Province is dominated by vast open areas of natural vegetation which
accounts for around 71% of the total land area in the Province. The extent of transformed land
and/or degraded land is reportedly relatively small. Most of the converted land is under some form
of cultivation (26%), including commercial plantations, which comprise 8% of the total area of
Mpumalanga. Urban areas only comprise about 1.25% of the Province which is relatively small.
The continued expansion of agricultural, mining and industrial activities in the Province have
impacted on the biodiversity of the region through land clearing, deterioration of soil quality,
erosion and contamination. Since land is a limited resource, demand for land will become more
competitive in the years to come and measures have to be put in place to regulate and balance
economic growth priorities, with population growth requirements and the preservation of the
environment.
It must be noted that about 70% of all the arable land in the province is under claim. There is a need
to pay attention to the land reform legislation to expedite all the backlogs in land claim in the
province. The question of land availability is a serious concern in the province and land remains one
of the critical means of production, and should be given attention. The ownership patterns of
strategic land in the province are in private hands. This inhibits the state’s capacity to influence
development aimed at the poor and previously disadvantaged. There is a need for the province to
embark on a process of empowering the state by proactively acquiring strategic land and use it as a
tool to foster economic development. The maps below show the land claims in the province per
district.
17
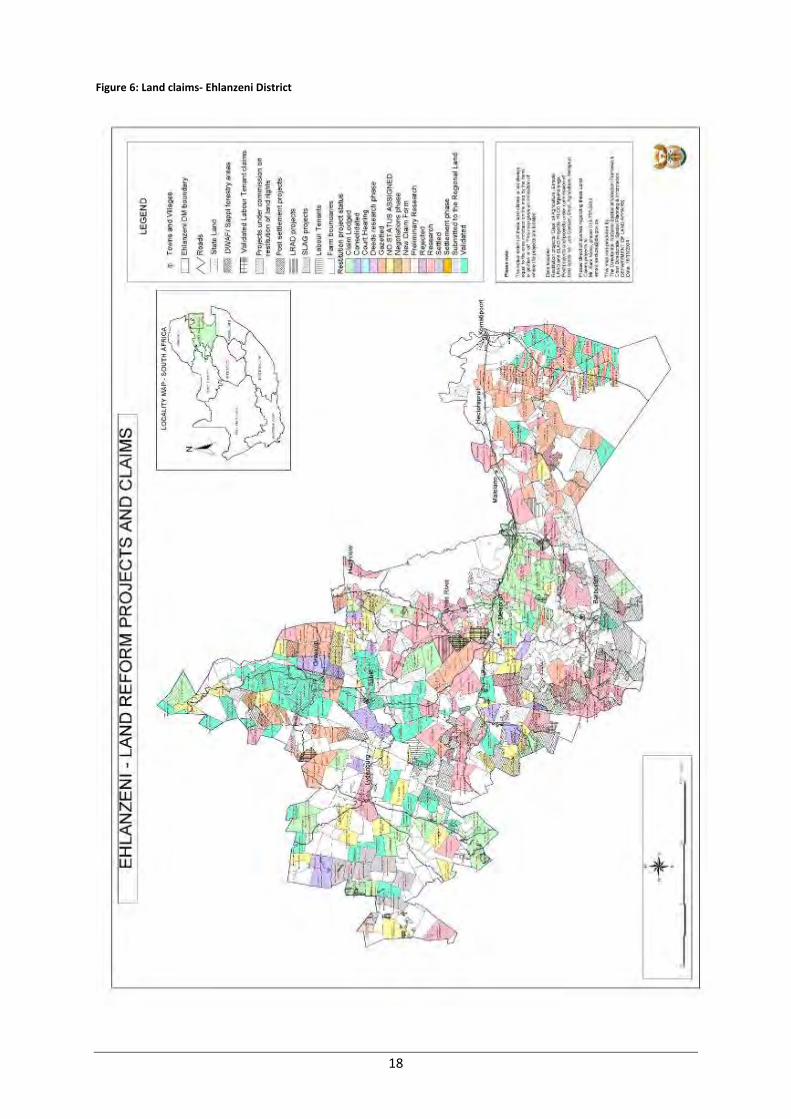
Figure 6: Land claims‐ Ehlanzeni District
18

Figure 7: Land claims‐ Nkangala District
19

Figure 8: Land claims‐ Nkangala District
20

Land tenure on traditional land is also a key challenge that needs to be addressed. Land tenure
reforms in rural areas could unlock dormant capital and be an incentive as well as a source of
empowerment for communities.
2.4.2 Water
As a semi‐arid country, South Africa is faced with a critical situation with regard to its water
resources. The long‐term preservation and sustainability of ecosystems, communities and economic
activities depends on the continued availability and accessibility to fresh water sources, principally
obtained through rainfall (precipitation), surface flow (rivers) and groundwater. According to the
Department of Water Affairs (DWA) maintains that all three of these sources, which are intimately
linked in the hydrological cycle, are currently under stress.
The annual precipitation varies from less than 500 mm in the eastern Lowveld and 700 mm in the
western Highveld to more than 1 100 mm in the escarpment. Water is acknowledged by the
Provincial Government as a scarce resource and there is concern that there has been a general
decrease in water quality and quantity over the past few years. Water quality indicators indicate an
increase in surface water nutrients which portray a potential for enrichment, which could
compromise riverine eco‐systems and human health. The most significant impacts on water quality
are a result of mining, malfunctioning sewage treatment works and soil erosion from various
practices especially agriculture and urban and rural development projects.
With regards to water quantity, the water resources in all the catchments in the Mpumalanga
Province, with the exception of the Sabie River and upper Usutu, are over committed with current
demands on the available water outstripping the water available in the system. New development
initiatives must consider the water availability prior to engaging in unsustainable developments with
high water demands.
Mpumalanga is the source of four of Southern Africa’s major river systems with as much as 53% of
the Province drained by the Olifants River System, the Orange River System (Vaal River), Nkomati
River System (Crocodile, Sabie, Sand and Komati Rivers) and the Pongola River System (Usutu River).
Water resources are controlled and regulated within four Water Management Areas (WMAs) – the
Olifants, Nkomati, Usutu and Upper Vaal WMAs. The Mpumalanga provincial boundary runs
variously through each of these WMA. The entire Inkomati WMA sits within the provincial boundary
whereas approximately 50% of the Olifants WMA (the southern portion) resides within
Mpumalanga. Around 15% of the upper Vaal WMA (the upstream Vaal Dam sub‐WMA) and 20% of
21
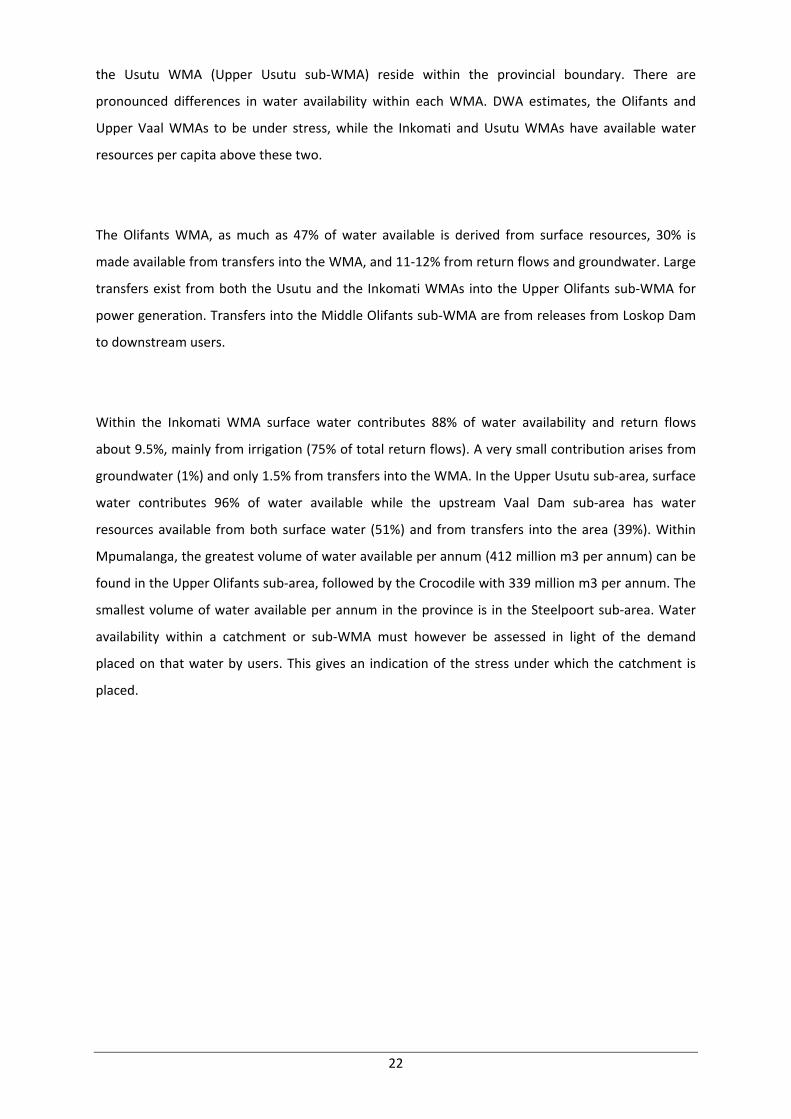
the Usutu WMA (Upper Usutu sub‐WMA) reside within the provincial boundary. There are
pronounced differences in water availability within each WMA. DWA estimates, the Olifants and
Upper Vaal WMAs to be under stress, while the Inkomati and Usutu WMAs have available water
resources per capita above these two.
The Olifants WMA, as much as 47% of water available is derived from surface resources, 30% is
made available from transfers into the WMA, and 11‐12% from return flows and groundwater. Large
transfers exist from both the Usutu and the Inkomati WMAs into the Upper Olifants sub‐WMA for
power generation. Transfers into the Middle Olifants sub‐WMA are from releases from Loskop Dam
to downstream users.
Within the Inkomati WMA surface water contributes 88% of water availability and return flows
about 9.5%, mainly from irrigation (75% of total return flows). A very small contribution arises from
groundwater (1%) and only 1.5% from transfers into the WMA. In the Upper Usutu sub‐area, surface
water contributes 96% of water available while the upstream Vaal Dam sub‐area has water
resources available from both surface water (51%) and from transfers into the area (39%). Within
Mpumalanga, the greatest volume of water available per annum (412 million m3 per annum) can be
found in the Upper Olifants sub‐area, followed by the Crocodile with 339 million m3 per annum. The
smallest volume of water available per annum in the province is in the Steelpoort sub‐area. Water
availability within a catchment or sub‐WMA must however be assessed in light of the demand
placed on that water by users. This gives an indication of the stress under which the catchment is
placed.
22

Figure 9: Water management areas under stress
Source: MINTEK 2009
According to DWA, Water use in South Africa is dominated by irrigation. This is also true for
Mpumalanga as 46% of its water is required for irrigation. This demand for water is localised in a
23
few of the WMAs, as is the demand for water for power generation. Water use for agricultural
purposes is unevenly distributed throughout the WMAs. The second largest requirement for water is
for ‘transfers out’. Water resources in Mpumalanga are therefore important in supplying water to
neighbouring catchments and WMAs. The issue of water sharing, both internationally with
Mozambique and Swaziland as well as internally (between provinces) is extremely important, and
one which requires careful management. The issue of water trading as well as water use licensing
need to be given attention for the Mpumalanga government to realise its growth trajectory.
Use of water in the urban sector in Mpumalanga is slightly less (8%) than the requirements for the
whole of South Africa (11%), while the requirements of the industrial, forestry and mining sectors
are the same as those of South Africa (8%).
It is evident that in the Olifants WMA, irrigation is the biggest single user of water resources while
power generation (dominant in the Upper Olifants) accounts for about 17% of total requirements,
then mining, urban and rural. Sixty percent of irrigation requirements are from the Middle Olifants
sub‐area and 20% from the Lower Olifants. Almost all (82%) of water for power generation is
required in the Upper Olifants sub‐area, with the remainder in the Vaal sub‐area. As much as 97% of
transfers out of the Olifants WMA occur from the Upper Olifants sub‐area.
In the Inkomati WMA, irrigation is the biggest single user of water resources, followed by
afforestation – which accounts for 17% of the WMAs water requirements. Irrigation and
afforestation are the biggest users of water in the Komati West, Crocodile and Sabie sub‐areas.
Around 46% and 38% of total irrigation requirements are from the Crocodile and Komati North sub‐
areas, respectively. Irrigation requirements in the Komati North area are followed by transfers out.
This amounts to 35 million m3 per annum which flows into Mozambique. Transfers to the Olifants
WMA from Komati West are for use in power generation. Transfers out of the Crocodile sub‐area
flow across the border to Mozambique (28 million m3 per annum).
The Upper Usutu sub‐WMA is dominated with large transfers to the Upper Olifants sub‐area for use
in power generation. Afforestation accounts for 23% of total water resources required in the area,
followed by irrigation and the urban‐rural sectors. In the Upstream Vaal Dam sub‐area, mining
accounts for 38% of total water requirements. This is followed by the urban sector, requirements for
power generation and transfers out, which each account for 15% of total requirements.
Requirements for irrigation follow with 11% (DWA).
24
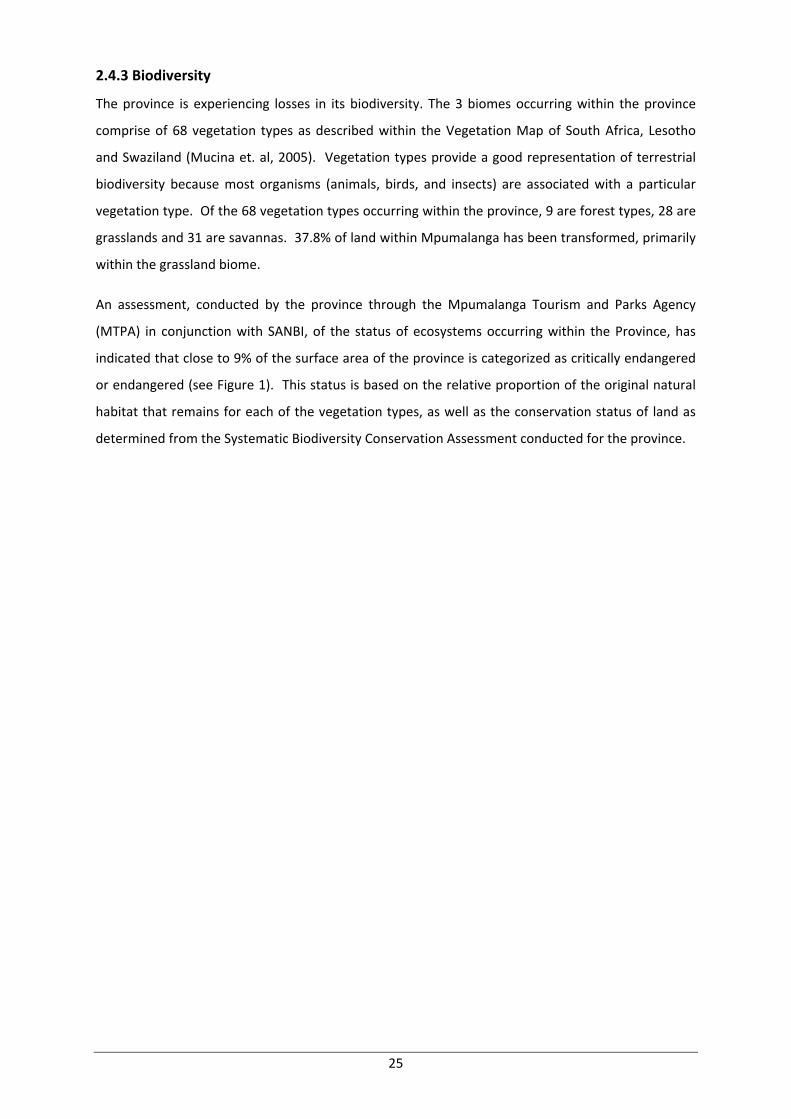
2.4.3 Biodiversity
The province is experiencing losses in its biodiversity. The 3 biomes occurring within the province
comprise of 68 vegetation types as described within the Vegetation Map of South Africa, Lesotho
and Swaziland (Mucina et. al, 2005). Vegetation types provide a good representation of terrestrial
biodiversity because most organisms (animals, birds, and insects) are associated with a particular
vegetation type. Of the 68 vegetation types occurring within the province, 9 are forest types, 28 are
grasslands and 31 are savannas. 37.8% of land within Mpumalanga has been transformed, primarily
within the grassland biome.
An assessment, conducted by the province through the Mpumalanga Tourism and Parks Agency
(MTPA) in conjunction with SANBI, of the status of ecosystems occurring within the Province, has
indicated that close to 9% of the surface area of the province is categorized as critically endangered
or endangered (see Figure 1). This status is based on the relative proportion of the original natural
habitat that remains for each of the vegetation types, as well as the conservation status of land as
determined from the Systematic Biodiversity Conservation Assessment conducted for the province.
25

Figure 10: Biodiversity
2.4.3.1 Protection Status
Most of the threatened ecosystems occur within the grassland biome. The threatened ecosystems
are moderately too highly transformed and are also poorly protected within formal conservation
areas. The main drivers of transformation of the vegetation types/ecosystem have been as a result
of forestry and agriculture. The proposed future expansion of mining operations within the
Mpumalanga Highveld is also likely to further threaten the ecosystem status of vegetation types
within this region and to pose a serious threat to water quality within pristine catchments.
A total of 18.1% of the province is under formal biodiversity protection within national parks,
provincial parks or private reserves. Much of this protected land/conservation land is located within
the Kruger National Park (KNP) (12%). Thus the protection status for vegetation types (primarily
savanna) occurring within the KNP, is high, whilst other ecosystems, such as grasslands remain
largely unprotected (only 2.4% of grasslands protected). Overall 6.1% of the province outside of the
KNP, is formally protected (MPAES, 2009). Figure 10 shows the protection status of the various
vegetation types relative to their national protection targets. The majority of the grassland
vegetation types are afforded no protection at all, or with less than 5% of their targets protected. It
is in these areas that many of the countries coal reserves currently lie.
26

2.4.4 Transport Infrastructure
Mpumalanga offers an established and advanced transport infrastructure and modes of transport to
move people, goods and services between the main centres of the Province, the country and
globally .The transport infrastructure in the province include road, rail and air transport.
2.4.4.1 Roads
The two main transport infrastructures in the province are the Maputo Development Corridor (MDC)
that runs from Gauteng province to the port city of Maputo in Mozambique and the coal haulage
routes mainly within the Gert Sibande and Nkangala district municipalities.
The MDC acts mainly as a trade route from the economic hub of South Africa in Gauteng to the port
of Maputo, which links to international markets. It acts secondly as a commuter route between
Gauteng province and Mpumalanga as well as Mozambique. It also acts as a tourism route from
Gauteng Province to Mozambique. The coal haulage route is firstly a network that supplies coal to
the power stations and secondly, supplies coal to the Richards Bay Coal Terminal (RCBT) for export
At present, the road network in Mpumalanga comprises 7 000 km of paved roads and 9 000 km of
gravel roads. A condition survey conducted around 2005 revealed that around 25% of the paved
road network is in a poor condition compared to approximately 20% of the gravel road network that
is in a poor condition. Of this, 2 000 km are included in the greater total of 3 000 km of the paved
road network where the surfacing is old and requires resealing to prevent moisture ingress and
arrest further deterioration. A major contributor to the deterioration of the paved road network is a
dramatic increase in coal haulage by road, mostly in the Gert Sibande District Municipality south of
the N4, as well from increased freight transport arising from outside of South Africa (Zimbabwe and
Mozambique). In 2007, overloading in the area on the section of the N4 between Pretoria and the
South African/Mozambique border stood at 30‐35% with the average number of trucks travelling
along the N4, the R25 and R104 corridor amounting to 2 500. The road is designed for about 1 650
trucks. The current utilisation of the road network throughout Mpumalanga is about 5 000 coal
trucks per day.
The Mpumalanga provincial government has rebuilt and upgraded some of the critical coal haulage
road networks, which in most cases required an additional two structural layers to be added to the
roads. The long term strategic approach to the coal haulage challenge undertaken is to:
• Define a Coal Network Grid which will be ring‐fenced and coal movements restricted to this
network. Any movement of coal outside this network will be penalised. End‐users of the coal will
27

have to construct private roads to interface with the grid should this network prove inadequate
to move coal to their required locations;
• Introduce and step up a dedicated freight vehicle overload control enforcement capacity; and
• Increase investment in rail infrastructure to minimise the impact of coal freight on the road.
In addition to bulk transportation, the road network is utilised by private vehicle owners, buses and
shuttles and mini‐bus taxis commuting within and between other provinces and countries adjacent
to Mpumalanga.
2.4.4.2 Rail
Transnet and the Passenger Rail Agency of South Africa (PRASA) control South Africa’s rail network.
The Mpumalanga rail system covers a distance of 2 233 km and generates the most freight traffic in
South Africa enabling the Province to play an important strategic economic role in the national
economy. The most important lines are the Pretoria‐Maputo and the Johannesburg‐Durban lines (of
which portions run through the Province). The remainder of the Province is generally fairly served in
terms of rail infrastructure which serves most of the urban nodes. The Moloto Rail Development
Corridor project will expand the rail system of the province.
Products that are transported within and outside of the Province include coal, fuel and chemicals,
timber, iron and chrome ore, fruit, maize, animal feed, wholesale and retail goods, steel, building
supplies, fertiliser and consumer goods. On the Mpumalanga to Richards Bay line minerals, grain and
fuel are transported.
Management and control of the rail network in Mpumalanga is the responsibility of the
Mpumalanga Freight Logistic Forum (MFLF). It becomes imperative from a rail perspective to
Implement a seamless rail service from Gauteng to Maputo. The province needs to engage and work
together with the rail partners of neighbouring countries through Transnet. The expedition of the
rail line stabilisation in order to increase the export volumes through the Maputo harbour should be
given immediate attention. We need to promote the restoration of rail reliability and to
communicate progress on the rail seamless service agreements; promote the movement of rail
friendly cargo currently on road back to rail in an orderly manner.
In addition to freight transportation, the rail network is also used for commuter services. The
Shosholoza Meyl offers regular passenger rail services between Johannesburg and Komatipoort.
Amongst others, stops include Malelane, Nelspruit, Middelberg and Pretoria. More luxurious tourist
trains travel to Mpumalanga’s game reserves from Gauteng, the Cape, KwaZulu‐Natal, Mozambique
and Swaziland. Over the past few years, government has contributed an estimated R884 million to
28
the remodelling and refurbishment of rail commuter stations. The private sector provided
investment of about R1.6 billion in more than 120 projects on land and properties adjacent to and
surrounding rail commuter stations.
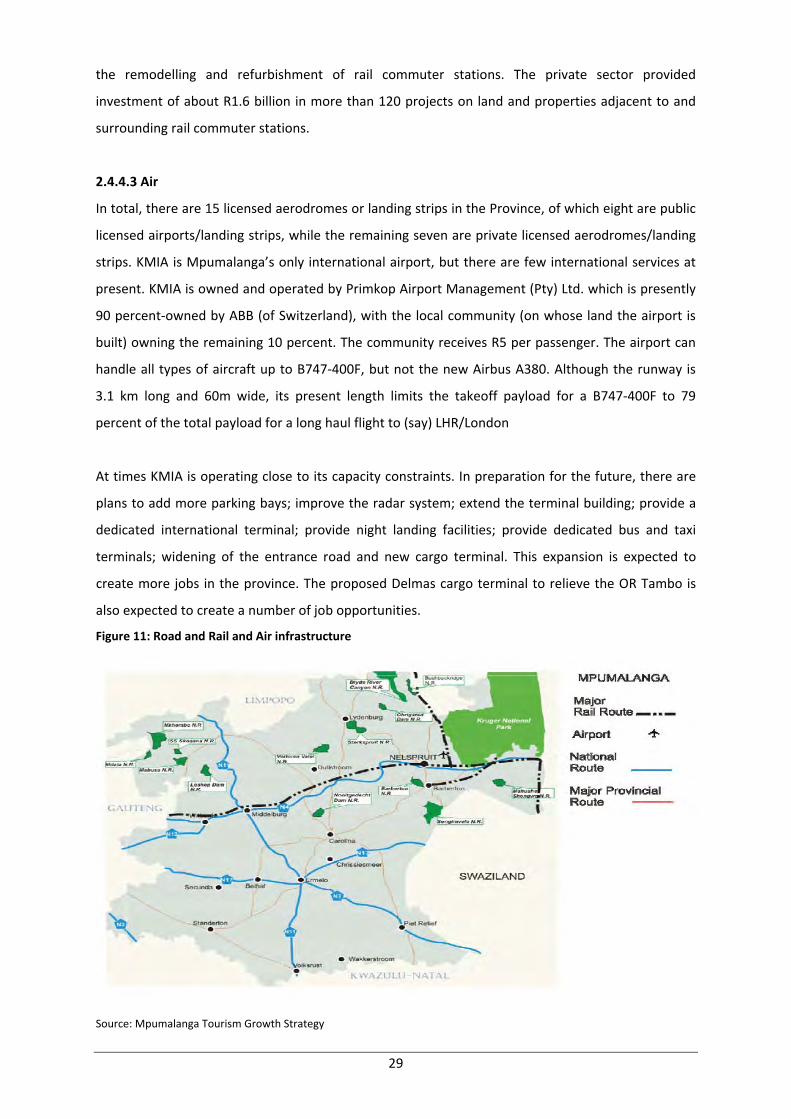
2.4.4.3 Air
In total, there are 15 licensed aerodromes or landing strips in the Province, of which eight are public
licensed airports/landing strips, while the remaining seven are private licensed aerodromes/landing
strips. KMIA is Mpumalanga’s only international airport, but there are few international services at
present. KMIA is owned and operated by Primkop Airport Management (Pty) Ltd. which is presently
90 percent‐owned by ABB (of Switzerland), with the local community (on whose land the airport is
built) owning the remaining 10 percent. The community receives R5 per passenger. The airport can
handle all types of aircraft up to B747‐400F, but not the new Airbus A380. Although the runway is
3.1 km long and 60m wide, its present length limits the takeoff payload for a B747‐400F to 79
percent of the total payload for a long haul flight to (say) LHR/London
At times KMIA is operating close to its capacity constraints. In preparation for the future, there are
plans to add more parking bays; improve the radar system; extend the terminal building; provide a
dedicated international terminal; provide night landing facilities; provide dedicated bus and taxi
terminals; widening of the entrance road and new cargo terminal. This expansion is expected to
create more jobs in the province. The proposed Delmas cargo terminal to relieve the OR Tambo is
also expected to create a number of job opportunities.
Figure 11: Road and Rail and Air infrastructure
Source: Mpumalanga Tourism Growth Strategy
29
Contribution of the sector
In terms of provincial contribution to national GVA, Mpumalanga with a 6.1 per cent share occupied
sixth place among the nine provinces in 2009. Transport and Communications contributed 9.7 per
cent to the provincial economy in terms of GVA in 2009. In 2009, Ehlanzeni (38.5 per cent) was
followed closely by Nkangala (36.6 per cent) in terms of provincial transport GVA contribution, with
Gert Sibande in third position (24.8 per cent).
The expected future annual average growth of 4.4 per cent from 2009 to 2014 should be the highest
among the nine sectors and higher than the provincial economy’s forecasted 3.2 per cent growth.
The employment elasticity of transport was calculated to be 0.32 over the period 1996 to 2009.
Transport was the third most labour productive sector in the provincial context. The transport
sector exhibited a low level of labour intensity because of the high capital outlay that is required of
business. In light of the low employment elasticity and the low level of labour absorption and
despite high growth expectations, the transport sector is not expected to be a driver of employment
growth. Mpumalanga with a 4.5 per cent share, occupied sixth place among the nine provinces in
2009, the same position as in 1996. The construction sector was the smallest contributor to the
provincial economy with a 2.5 per cent share of Mpumalanga’s GVA in 2009. Ehlanzeni was the
major contributor to the construction sector of the province with a share of 41.2 per cent with
Nkangala (32.0 per cent) and Gert Sibande (26.8 per cent) second and third, respectively.
Challenges
Mpumalanga has a road infrastructure that varies in state from good to extreme disrepair. The
backlog in roads infrastructure maintenance is a major challenge and has negative implications for
commerce and industry. The farming industry is particularly affected by the state of rural access
roads as transport costs affects competitiveness. The lack of good surfaced roads into many of the
rural nodes could seriously hamper the future tourism development of these areas. The province
also does not have adequate train stations which is vital for expanding rail services to all parts of the
province.
2.4.5 Electricity
Due to its large coal deposits, the generation of electricity through coal‐fired power stations in South
Africa takes place primarily in Mpumalanga. Of the 24 power generation facilities owned by Eskom in
the country, 13 are coal‐fired power stations. Eleven of the currently operational coal‐fired power
stations in the country are situated in Mpumalanga and contribute roughly 76% of the total
electricity generated in South Africa. In addition, the three Eskom return‐to‐service (RTS) coal‐fired
power stations are also situated in Mpumalanga.
30
The use of coal for energy production results in both the primary environmental impacts associated
with the mining and removal of coal for use in coal fired power stations in the province, as well as
the secondary impacts resulting from the burning of this coal for energy production. The coal
deposits in the Springs‐Witbank belt are steadily being mined out and are said to have a future life
span of no more than 30 years.
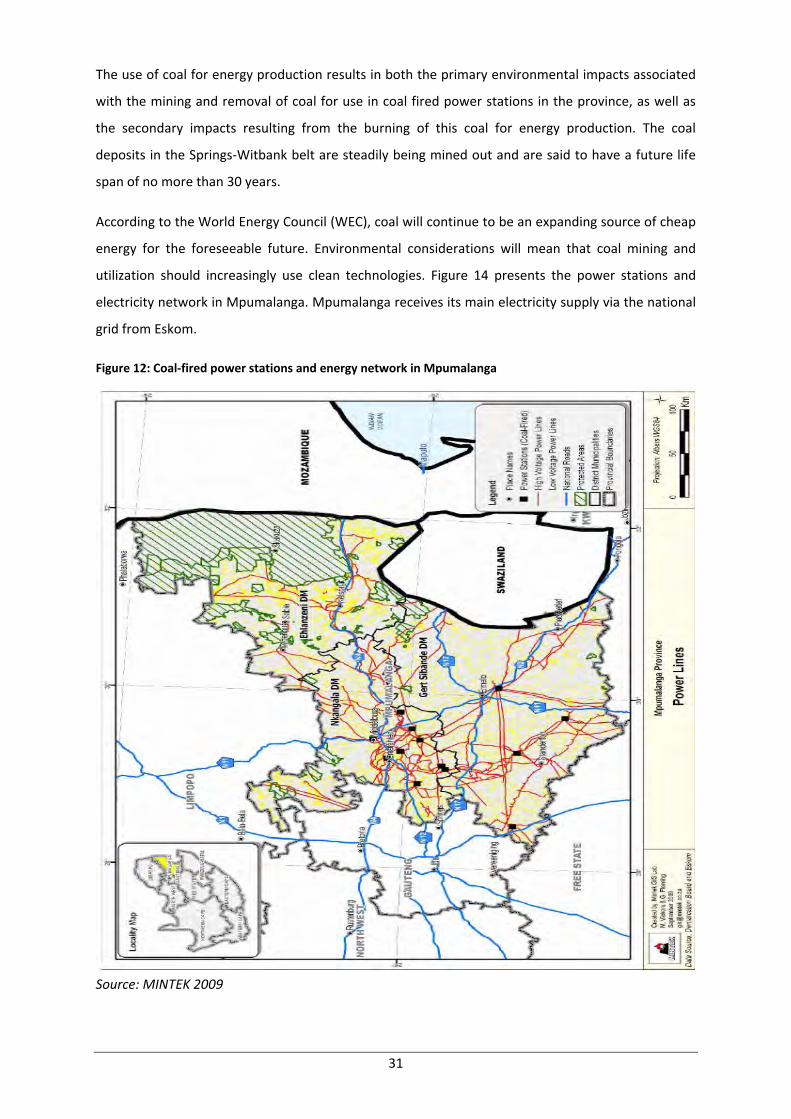
According to the World Energy Council (WEC), coal will continue to be an expanding source of cheap
energy for the foreseeable future. Environmental considerations will mean that coal mining and
utilization should increasingly use clean technologies. Figure 14 presents the power stations and
electricity network in Mpumalanga. Mpumalanga receives its main electricity supply via the national
grid from Eskom.
Figure 12: Coal‐fired power stations and energy network in Mpumalanga
Source: MINTEK 2009
31

Clean Coal Technologies (CCTs) will be fully implemented in South Africa when new mines and power
stations, needed to supply more power to the grid, are developed and built. CCTs aim to control and
reduce solid, liquid and gaseous emissions, improve operating efficiency and will identify methods
for the effective utilisation of combustion by‐products. South Africa, a member of the International
Energy Agency Clean Coal Science (CCS) Agreement since April 2003, has access to all the CCS
resources and projects. Given the right technology, coal will no longer be a threat to the
environment, but will remain the world’s major energy resource (DME, 2006).
Mpumalanga is also a beneficiary of the Eskom expansion programme with a new Eskom mega
power station which is under construction named Kusile. The construction of Kusile presents the
province with a number of economic opportunities. The provision of the new power station will
ensure that the power shortages experienced by the country in 2008 does not occur in future and
that will ensure a conducive business environment for the country and Mpumalanga.
Contribution of the Sector
In terms of provincial contribution to national utilities GVA, Mpumalanga with a 14.4 per cent share
occupied third place among the nine provinces in 2009 and held a comparative advantage over the
national sector. However, the sector only contributed 4.7 per cent to the total GVA of Mpumalanga
in 2009. The majority of economic activity in the provincial utilities sector was recorded in Nkangala
with a GVA contribution of 72.0 per cent in 2009. Gert Sibande (25.3 per cent) and Ehlanzeni
(2.7 per cent) added the remainder to provincial utilities GVA.
The future growth, that is expected to be around 3.7 per cent per annum, will exceed the provincial
economy’s forecasted 3.2 per cent growth from 2009 to 2014. The employment elasticity of utilities
(0.50) was the third lowest among the nine sectors. The utilities sector recorded the highest labour
productivity in the provincial context. The utilities sector exhibited a low level of labour intensity
due to the capital intensive nature of processes. This fact, together with the relatively low
employment elasticity should only result in marginal employment contribution despite its relatively
high labour productivity.
Challenges
The transportation of coal for power generation has a major impact to the provincial road network
especially in the Highveld. The generation of electricity through coal‐fired power stations produces
pollutants such as particulates, sulphur dioxide and nitrogen oxides. Emissions from coal‐fired power
stations are a serious concern for Mpumalanga as they cause impaired air quality in areas close to
and away from the emission source and much of the demand for electricity in the country thus
generates ambient air quality impacts that are felt largely in Mpumalanga and the surrounding
32
areas. Coal combustion can also contribute to acid rain and run‐off from mining can contaminate
groundwater, while waste coal may spontaneously ignite.
Coal intensive activities contribute to large‐scale water and air pollution, including significant carbon
dioxide emissions, which contribute to global warming. In addition to power generation, coal
combustion in stoves and coal heated boilers in hospitals and factories contribute to low‐level coal‐
related atmospheric pollution. Such use of coal for domestic and industrial purposes also adds to the
environmental impacts associated with commercial energy production from coal‐fired power
stations in the province. Other environmental impacts associated with energy production include air
pollution from synthetic fuel production and vehicle emissions, pollution and health impacts
associated with the use of leaded petrol, and oil and fuel spills and leaks can contaminate surface
and groundwater.
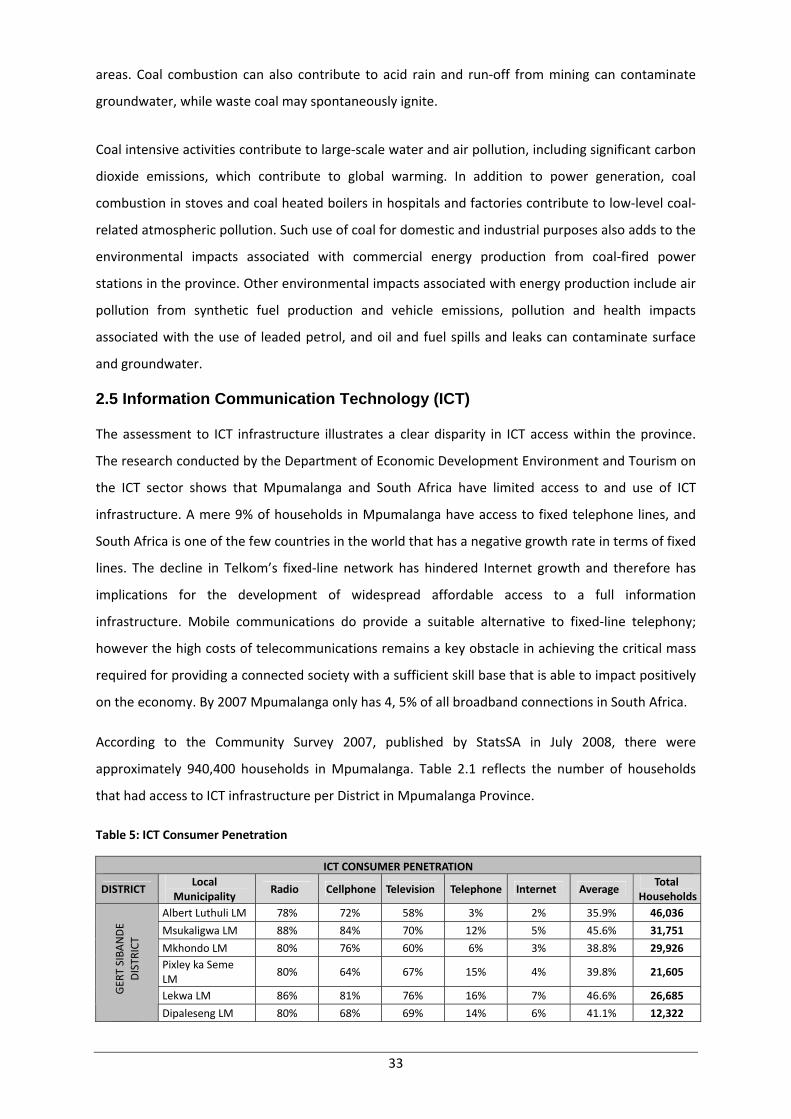
2.5 Information Communication Technology (ICT)
The assessment to ICT infrastructure illustrates a clear disparity in ICT access within the province.
The research conducted by the Department of Economic Development Environment and Tourism on
the ICT sector shows that Mpumalanga and South Africa have limited access to and use of ICT
infrastructure. A mere 9% of households in Mpumalanga have access to fixed telephone lines, and
South Africa is one of the few countries in the world that has a negative growth rate in terms of fixed
lines. The decline in Telkom’s fixed‐line network has hindered Internet growth and therefore has
implications for the development of widespread affordable access to a full information
infrastructure. Mobile communications do provide a suitable alternative to fixed‐line telephony;
however the high costs of telecommunications remains a key obstacle in achieving the critical mass
required for providing a connected society with a sufficient skill base that is able to impact positively
on the economy. By 2007 Mpumalanga only has 4, 5% of all broadband connections in South Africa.
According to the Community Survey 2007, published by StatsSA in July 2008, there were
approximately 940,400 households in Mpumalanga. Table 2.1 reflects the number of households
that had access to ICT infrastructure per District in Mpumalanga Province.
Table 5: ICT Consumer Penetration
ICT CONSUMER PENETRATION
DISTRICT Local
Municipality Radio Cellphone Television Telephone Internet Average
Total Households
Albert Luthuli LM 78% 72% 58% 3% 2% 35.9% 46,036
Msukaligwa LM 88% 84% 70% 12% 5% 45.6% 31,751
Mkhondo LM 80% 76% 60% 6% 3% 38.8% 29,926 Pixley ka Seme LM
80% 64% 67% 15% 4% 39.8% 21,605
Lekwa LM 86% 81% 76% 16% 7% 46.6% 26,685 GER
T SIBA
NDE
DISTR
ICT
Dipaleseng LM 80% 68% 69% 14% 6% 41.1% 12,322
33

ICT CONSUMER PENETRATION Local Total
DISTRICT Radio Cellphone Television Telephone Internet Average Municipality Households
Govan Mbeki LM 77% 77% 64% 15% 7% 43.1% 79,191
Delmas LM 77% 80% 70% 10% 6% 42.7% 15,129
Emalahleni LM 80% 81% 62% 15% 5% 43.1% 105,594 Steve Tshwete LM
86% 82% 73% 20% 8% 48.0% 50,449
Emakhazeni LM 85% 83% 60% 15% 2% 43.1% 12,127
Thembisile LM 83% 83% 70% 4% 0% 41.1% 65,394
NKA
NGALA
DISTR
ICT
Dr JS Moroka LM 81% 77% 70% 4% 1% 39.7% 56,874
Thaba Chweu LM 70% 77% 54% 8% 4% 37.5% 28,259
Mbombela LM 79% 79% 67% 10% 5% 42.4% 137,353
Umjindi LM 75% 75% 59% 13% 4% 39.9% 18,768
EHLA
NZENI
DISTR
ICT
Nkomazi LM 72% 76% 54% 4% 3% 35.7% 78,252
MPUMALANGA 78% 77% 64% 9% 4% 33% 940,404
Source: Own study 2009
The situation depicted by table 5 above needs to be changed as Information opens up more
possibilities and opportunities for people. Information and knowledge empower people to become
more self‐sufficient. ICTs make information acquisition and management easier and more efficient,
and open up possibilities for universal access to knowledge and markets. The specific advantages of
using ICTs include:
a) Access to information for private and professional decision‐making: ICTs expand the range of
choices and opportunities by facilitating greater access to economic, educational and
development‐related information;
b) Reduction of geography and distance as a factor in social and economic participation: research is
much easier with ICTs, especially through the Internet; it could assist businesses about market
information and empower communities with much needed knowledge.
c) Access to opportunities: ICTs empower individuals, businesses, especially SMEs, local and
community groups, women and marginalized or disenfranchised people or groups to do what
they do, only better. With ICTs and the capacity to use ICTs, these groups can access the same
information that government and large corporations use. Access to information can help level
the playing field by increasing participation in economic and human development activities and
in those applications that depend on information, such as markets;
d) Greater ability to learn: distance learning permits students to get accreditations online from
recognized universities;
e) Greater environmental awareness: information about the weather and the environment is more
readily available. It can help to predict and prepare for environmental perturbations and
catastrophes.
34

f) More awareness of factors affecting individual well‐being; Greater ability to influence and
participate in decision‐making; Transaction processing: ICTs speed up and ease transactions of
all types, and are especially important for business and government transactions; and
g) Improved trade: ICTs enhance and facilitate trade. ICTs make markets more efficient. Commerce
is enabled and extended. With ICTs, all markets have the potential of being international or of
being selective, depending on their requirements.
2.6 Human Capital
The new growth path advocate for improvements in education and skill levels and further hold that
they are a fundamental prerequisite for achieving many of the set goals. General education must
equip all South Africans to participate in our democracy and economy, and higher education must do
more to meet the needs of broad‐based development. The growth path also requires a radical
review of the training system to address shortfalls in artisanal and technical skills. The growth path
also requires a radical review of the training system to address shortfalls in artisanal and technical
skills. The Draft National Human Resource Strategy for South Africa addresses these goals. There are
proposals on meeting shortfalls in the important economic skills such as, Target at least 30 000
additional engineers by 2014, Target at least 50 000 additional artisans by 2015, Improve skills in
every job and target 1, 2 million workers for certified on‐the‐job skills improvement programmes
annually from 2013, Information and communications technology (ICT) skills taught in all secondary
schools, and to Finalise the National Skills Development Strategy.
The Mpumalanga situation is no different from what the entire country is experiencing in this aspect
and as a result, the provincial government is a process of finalising a HRD strategy for the province
which will align to the National Human Resource strategy with further alignment to the National
Skills Development Strategy. The HRD strategy for Mpumalanga will also pay attention to the issue
of HIV/AIDS as it impacts negatively on the skills base. Mpumalanga has the second highest
prevalence of HIV/AIDS after KwaZulu‐Natal.
2.7 Sector Analysis of the Provincial Economy
2.7.1 Provincial Gross Domestic Product (GDP)
In 2009, Mpumalanga contributed R169.9 billion in current prices and R114.7 billion at constant
2005 prices to the GDP of South Africa. Mpumalanga’s contribution was the fifth largest among the
nine provinces and registered a marginal decrease from a 6.9 per cent contribution in 1996, to
6.4 per cent in 2009. The provincial economy has not outperformed the national economy in terms
of GDP growth since 1999. The economic recession that stretched from the end of 2008 until
midway through 2009, resulted in both South Africa and Mpumalanga recording negative GDP
growth for 2009 of 1.7 per cent.
35

The average annual growth rate for the country and Mpumalanga over the period 1996 to 2009 was
3.2 per cent and 2.6 per cent, respectively. Expectations are that the economies of South Africa and
Mpumalanga grew by 2.8 per cent and 2.1 per cent, respectively, in 2010 after the contraction in
2009. Looking towards the future, the forecasted annual average growth rates for South Africa and
Mpumalanga from 2009 to 2014 is 3.5 per cent and 3.2 per cent, respectively. According to
expectations, Gert Sibande is expected to record annual average growth from 2009‐2014 of 3.5 per
cent followed by Nkangala (3.1 per cent) and Ehlanzeni (3.0 per cent).
2.7.2 Contribution to national and provincial economy
In 2009, the province was a substantial role‐player in the national mining and utilities (mainly
electricity) sectors, with respective shares of 20.0 per cent and 14.4 per cent. The contribution by
mining (from 17.3 per cent to 20.0 per cent), manufacturing (from 6.7 per cent to 7.7 per cent),
transport (from 6.0 per cent to 6.1 per cent) and community services (from 4.7 per cent to 4.9 per
cent) increased between 1996 and 2009, whilst the other sectors’ contribution to the national figure,
declined.
Nkangala District was the largest contributor to the provincial economy’s Gross Value Addition
(GVA), with a share of 39.9 per cent in 2009. This was due mainly to the district’s considerable
contributions to the province’s utilities (71.9 per cent) and mining (67.9 per cent) sectors in 2009.
The generation of electricity from coal mining therefore makes Nkangala District a leader in the
mining and utilities sectors. Gert Sibande District, with a 31.2 per cent share in 2009, was the second
largest contributor to the provincial economy. In 2009, Gert Sibande was the main contributor to
Mpumalanga’s manufacturing (54.8 per cent) and agriculture sectors (41.3 per cent). This
manufacturing was almost entirely due to SASOL’s activities in Govan Mbeki local municipality.
Ehlanzeni District was in third place adding 28.9 percent in 2009 to the provincial economy. Its
strength was in the province’s community services (45.2 per cent) and trade (44.9 per cent) sectors.
2.7.3 Sectoral contribution and growth
In 2009, the primary sector in Mpumalanga contributed 22.2 per cent, secondary sector 27.3 per
cent and tertiary sector 50.5 per cent to the provincial GVA. This relatively large dependence on the
primary sector stood in contrast to the national primary sector’s small contribution of 8.5 per cent in
2009. Nationally, the secondary industries added 22.5 per cent and the tertiary sector 69.0 per cent
in 2009. This structural difference between the provincial and national economy explains partly why
the province currently achieves lower growth than the country as a whole. Provincially, the primary
sector grew only by a modest 0.9 per cent annually over the 13 year period under review. This is in
contrast to the provincial tertiary sector that achieved average annual growth of 3.6 per cent per
annum.
36
In 2009, the three largest contributors to the provincial economy were manufacturing (20.1 per
cent), mining (18.6 per cent) and community services (16.4 per cent). This was slightly different
from 1996, when mining (24.1 per cent) was the leading sector followed by manufacturing (18.6 per
cent) and community services (17.1 per cent). The manufacturing sector dominated the district
economy of Gert Sibande in 2009 with a 32.8 per cent share. Mining activities dominated the
Nkangala economy as it added 29.7 per cent to the district’s economy in 2009. The largest
contributing sector in Ehlanzeni in 2009 was community services with a share of 27.3 per cent.
In 2010, the leading sectors in terms of GVA growth should be manufacturing (5.0 per cent) and
trade (4.6 per cent). Over the period 2009‐2014, it is expected that transport will record the highest
average annual GVA growth of 4.4 per cent per annum followed by manufacturing (3.8 per cent) and
utilities (3.7 per cent).
When combining forecasted growth and forecasted GVA share, manufacturing (1.0 per cent) and
trade (0.6 per cent) sectors can be regarded as the main drivers of the provincial GVA growth for
2010. Community services (0.4 per cent) and transport (0.4 per cent) are expected to aid provincial
growth to a lesser degree, whereas agriculture is expected to hold provincial growth back in 2010.
2.7.3.1 Agriculture & Forestry
The agricultural sector plays an essential role in the fight against poverty and securing food security
for the people of Mpumalanga. The role of agriculture in supplying employment to unskilled
workers, ensuring food security to rural people as well as stimulating other sectors in the value‐chain
such as manufacturing and trade makes it an important sector towards the attainment of growth
and development.
The current land utilization by agriculture is determined by the natural resources, such as soils,
water and climate, and land ownership. Land utilized for commercial farming is about 90% of the
total farm land whilst for small‐scale/emerging farming is less than 10%.
In terms of agricultural production, summer cereals and legumes (sunflower seed, sorghum, dry
beans, soy beans, potatoes, cotton and maize) dominate the Highveld region, while subtropical and
citrus fruit and sugar are grown extensively in the Lowveld. Fruit farming includes apples, peaches,
citrus, nuts and subtropical fruit such as mangoes, litchis, and avocado pears. Mpumalanga is also
well known for intensive and extensive beef production and the production of other animal produce
such as chickens, eggs and pork. For the most part, dry land farming is utilised in agricultural
production in the Highveld, with intensive irrigation activities taking place in the Loskop area near
Groblersdal and in the Lowveld area adjacent to the Crocodile and Komati Rivers. Considerable
potential for increased agro‐processing exists in the Province, but this is constrained by access to
water resources. The maps below show agriculture production in the province;
37

Figure 13: Agriculture and Forestry
38
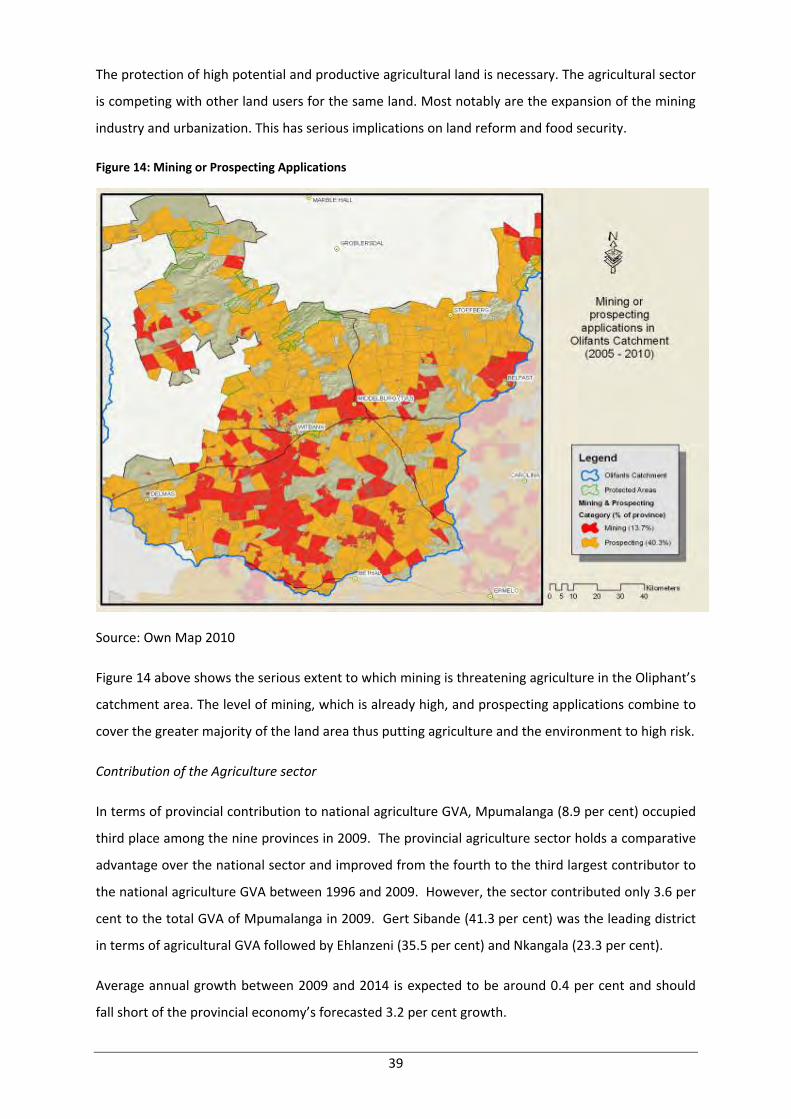
The protection of high potential and productive agricultural land is necessary. The agricultural sector
is competing with other land users for the same land. Most notably are the expansion of the mining
industry and urbanization. This has serious implications on land reform and food security.
Figure 14: Mining or Prospecting Applications
Source: Own Map 2010
Figure 14 above shows the serious extent to which mining is threatening agriculture in the Oliphant’s
catchment area. The level of mining, which is already high, and prospecting applications combine to
cover the greater majority of the land area thus putting agriculture and the environment to high risk.
Contribution of the Agriculture sector
In terms of provincial contribution to national agriculture GVA, Mpumalanga (8.9 per cent) occupied
third place among the nine provinces in 2009. The provincial agriculture sector holds a comparative
advantage over the national sector and improved from the fourth to the third largest contributor to
the national agriculture GVA between 1996 and 2009. However, the sector contributed only 3.6 per
cent to the total GVA of Mpumalanga in 2009. Gert Sibande (41.3 per cent) was the leading district
in terms of agricultural GVA followed by Ehlanzeni (35.5 per cent) and Nkangala (23.3 per cent).
Average annual growth between 2009 and 2014 is expected to be around 0.4 per cent and should
fall short of the provincial economy’s forecasted 3.2 per cent growth.
39
The economic contribution of the agricultural sector can grow through research to improved farming
techniques; improved cultivars; higher productivity; skills development; increased value adding and
agro‐processing.
Employment in the sector
The agriculture sector exhibited a high level of labour intensity, but low labour productivity. For
agriculture to be an employment driver, interventions will need to change its employment elasticity
from negative to positive.
Challenges in the sector
The agricultural sector is threatened by various internal and external constraints. Some of the
constraints are the poor conditions of the rural road infrastructure, ownership of land, land reform
failures, mining activities, urbanization, climate change, access to finances, water availability, lack of
agro‐processing and markets, human capacity, governance and marginal soils.
2.7.3.2 Forestry
Mpumalanga is the country’s major forestry production area and accounted for 22.8% of South
Africa’s forestry and logging GVA in 2009. Forestry and logging, as a subcomponent of agriculture,
added some 1.4% to Mpumalanga’s total GVA in 2009. About 39 of the 148 primary processing
plants in the country are located in the Province, including the continent’s largest integrated pulp
and paper mill at Ngodwana, and softwood mill. Over R9.5 billion is invested in the province’s
forestry industry. The Provincial Growth and Development Strategy stresses the very low growth per
annum in formal employment opportunities, at 1.2% per annum, when there is a 4.6% per annum
growth in the labour force. The Province struggles to provide enough formal employment
opportunities and this has resulted in a high increase in the number of unemployed people. The
need for additional development opportunities, including forestry as an important primary
employer, must be viewed in this context.
Mpumalanga Province has extensive commercial forests and sophisticated processing plants dealing
with everything from sawn logs, pulp and paper to board. The province has South Africa’s biggest
sawmill and its largest panel and board plant, as well as the biggest integrated pulp and paper mill in
Africa. Whilst forestry and logging contributed 1.4% to Mpumalanga’s GVA in 2009, downstream
production of wood and wood products, as a subcomponent of manufacturing, added another 1.1%
to the province’s GVA in 2009 and is an important part of the manufacturing profile of the province.
In light of its importance to the province’s economy, the tough times experienced by the forestry
and paper sector in 2009 were a cause for concern. Since 2003, reduced demand for paper is
something that companies in the sector have become accustomed to. The sharp dip in demand for
40
timber, however, has come as something of a shock. York Timbers, employer of about 3,500 people
in Mpumalanga, entered into discussions with unions about the possibility of closing three of its
eight processing plants in mid‐2009. Paper and packaging giant Mondi reduced paper production at
its KwaZulu‐Natal plant and shut down several mills and machines in Europe. Shares of companies in
the sector fell sharply for the six‐month period to December 2008. Two factors will help the sector
weather difficult times. Firstly, the nationwide programme of spending on infrastructure will
increase timber demand, particularly by the construction industry. This boom includes spending for
rail, road and port upgrades and is set to continue for some years. The second factor that will help
this sector is the fact that old coal mines are being reopened and new ones commissioned.
Contribution of the Mpumalanga Forestry Sector
The Province has the ideal climate and topography for forests. The north‐eastern sector of the
province around Sabie and Graskop is regarded as the hub of the industry, but commercial forests
are also found along the province’s eastern border with Swaziland. It is the national leader in terms
of total hectares under forest (514,000) and export earnings from within the sector. Mpumalanga
accounts for 40% of the total forestry income of the country. About 11% of the province is forested,
with 4% of that being natural forest. The 7% of the province that is commercially run represents 40%
of South Africa’s commercial forest stock. Softwood accounts for 315,382 hectares with hardwood
hectares totalling 199,448. Private companies own 75% of the province’s wood and 706 new
hectares were planted by private concerns in 2008. York Timbers owns and leases 86,900 hectares
across the province. The company’s plywood plant in Sabie is an important part of the processing
industry.
Mondi’s softwood sawmill in the same town is South Africa’s largest of its type, while the same title
can be attached to the panel and board plant run by Sonae Novobord. Sappi owns and manages
235,000 hectares in Mpumalanga, 44% of the company’s South African holdings. Of the company’s
sawmills, the Lomati Sawmill in Barberton is one of the busiest, with an annual sawn‐timber capacity
of 85,000 cubic metres. Its products are used for structural timber, furniture and construction. The
commercial forest sector offers attractive business opportunities for small‐scale entrepreneurs,
particularly growers, contractors and saw‐millers. In addition, the pulp and paper industry in the
province creates income opportunities for waste‐paper vendors.
2.7.4 Contribution to Regional Gross Geographic Product
Forestry is one of the sectors identified as a key growth area in terms of the Accelerated and Shared
Growth Initiative of South Africa (AsgiSA), which aims to reduce poverty and unemployment and
help the country achieve an economic growth rate of 6% per annum. South Africa earned R14.2‐
billion from forestry exports in 2009, but imports cost R12.1‐billion.
41

The forestry sector comprises every link in the chain from forestry and logging to sawmilling and the
manufacture of wood products and pulp and paper. The province is at the forefront of the country’s
manufacturing capability in areas such as sawn timber, chipboard, furniture and manufactured wood
products for the building industry. Pulp and paper are the main industry exports, along with sawn
lumber, woodchips and wattle extract.
The major export markets are the Far East, Europe and the UK. Black empowerment group Vuka
Forestry Holdings has grown its holdings in the sector in recent years in terms of hectares under
forest and by acquiring trading companies. The Council for Scientific and Industrial Research’s (CSIR)
forestry research unit is at the forefront of the drive to improve tree breeds and, in association with
Sappi Saiccor, researches all aspects of the industry. Project Hybrid Resources aims to improve saw
timber and the Pine Platform programme (with York Timbers and Merensky Timber and Lumber) has
successfully created new genetic resource.
Figure 15: The provincial sector’s contribution to the regional GGP
1.4%
1.3%
0.4%
0.6%
0.2%
1.1%
2.4%
0.3%
0.6%
2.0%
0.0%
0.5%
1.0%
1.5%
2.0%
2.5%
3.0%
Mpumalanga KwaZulu‐Natal Limpopo Eastern Cape Western Cape
Percen
tage
con
tribution
Province
Forestry Forestry products
Source: Global Insight – ReX, January 2011
With reference to the preceding illustration, it is recorded that Mpumalanga’s forestry industry as a
whole has the highest rate of contribution to regional GVA at 1.4%, while forest products contribute
1.1% to regional GVA. The provincial contributions indicate that it is important to further develop
the forestry sector in order to exploit the potential in this sector. The figure above depicts that
Mpumalanga has the highest proportion of forestry, however, the manufacturing activities for the
42

forestry products are lower. Therefore, it means that Mpumalanga must improve on the production
of forestry products within the province, thus will result in the creation of job opportunities.
Ownership patterns
In Mpumalanga Province 75% (383,862 ha) of forests plantations are owned by the private sector
and 25% (125,528 ha) by the public. The contributing factor, to a larger share of the private sector
ownership is land purchases by larger companies. Although ownership is dominated by the private
sector, there are many farmers who participate in the forestry industry; many black farmers have
entered the forestry industry, largely under contract to the big companies. Most of these farmers
are dependent on these companies and are not able to operate freely in a competitive market.
Employment
According to the Forestry South Africa (FSA) statistics, the forestry plantation sub‐sector is the
highest contributor to employment in the forest industry in South Africa. It is estimated that the
Forestry sector had a total of 77,000 direct jobs and 462,000 indirect jobs in the Province prior to
2008. The sector is estimated to be at 24 400 direct jobs and 146 300 indirect jobs in 2011.
Challenges in the sector
In studying the sector a number of challenges were identified which include Land claims and Lack of
access, inadequate allocation of water, Lack of skills within the forest sector, Fire damages, Lack of
business support systems for small players, etc.
2.7.5 Mining
Mpumalanga is endowed with precious metals (platinum, gold), precious stones (diamond, beryl,
emerald), non‐ferrous and base metals (copper, zinc, lead, cobalt, molybdenum, tungsten, tin),
ferrous and related metals (chrome, iron, manganese, nickel, silicon, titanium, vanadium), energy
minerals (coal, torbanite, uranium) and various industrial minerals (aggregate, alumino‐silicates,
asbestos, clay, corundum, dimension stone, fluorspar, graphite, limestone, magnesite, silica, talc).
This diversity of resources has contributed to the emergence of significant downstream linkages,
most notably to the establishment of heavy industrial activities such as power stations, steel making
operations, paper mills, and chemical plants. Such industries have been critical in facilitating
additional linkage development by attracting related and supporting industries and hence,
contributing to a greater role of secondary and tertiary activities in the Province.
43
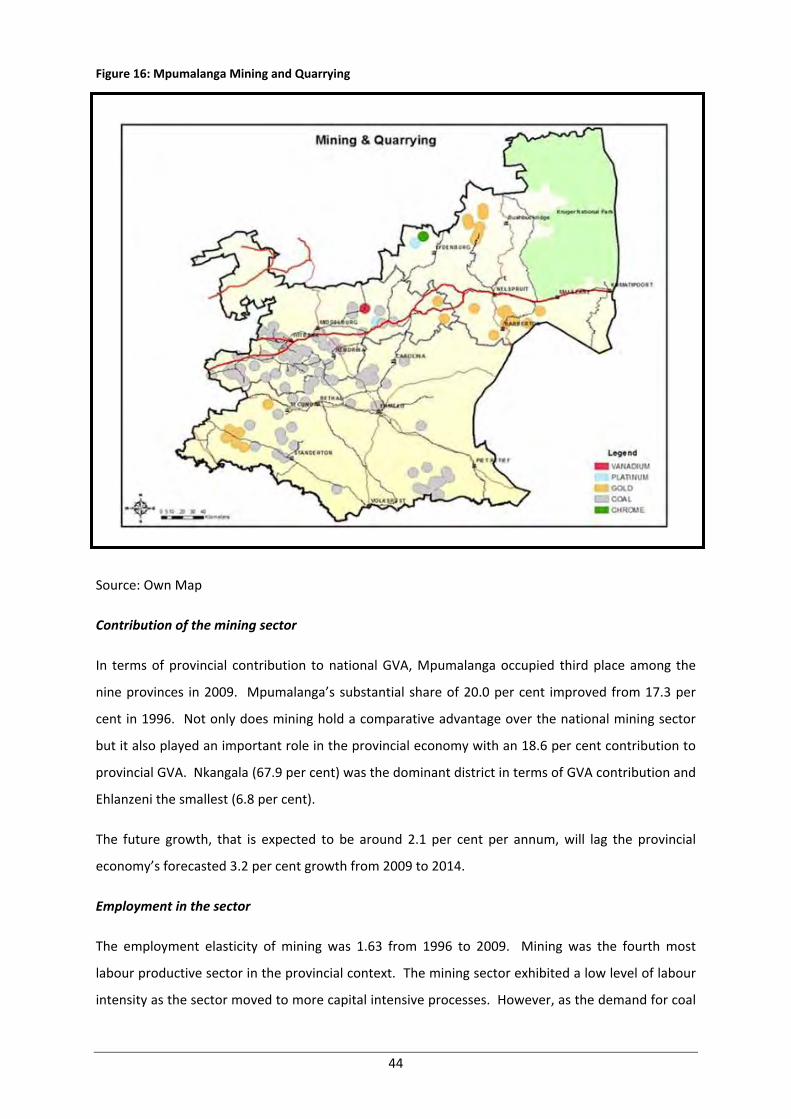
Figure 16: Mpumalanga Mining and Quarrying
Source: Own Map
Contribution of the mining sector
In terms of provincial contribution to national GVA, Mpumalanga occupied third place among the
nine provinces in 2009. Mpumalanga’s substantial share of 20.0 per cent improved from 17.3 per
cent in 1996. Not only does mining hold a comparative advantage over the national mining sector
but it also played an important role in the provincial economy with an 18.6 per cent contribution to
provincial GVA. Nkangala (67.9 per cent) was the dominant district in terms of GVA contribution and
Ehlanzeni the smallest (6.8 per cent).
The future growth, that is expected to be around 2.1 per cent per annum, will lag the provincial
economy’s forecasted 3.2 per cent growth from 2009 to 2014.
Employment in the sector
The employment elasticity of mining was 1.63 from 1996 to 2009. Mining was the fourth most
labour productive sector in the provincial context. The mining sector exhibited a low level of labour
intensity as the sector moved to more capital intensive processes. However, as the demand for coal
44

and other minerals in the province is set to remain strong in the near future, the resultant GVA
growth should stimulate healthy employment growth through the strong employment elasticity.
The impact of the economic recession on mining employment was clear to observe. While South
Africa’s mining labour force shrunk with 7.8 per cent between the fourth quarter of 2008 and the
fourth quarter of 2009, Mpumalanga’s mining labour force declined by 15.3 per cent or some 9 000
jobs. Other provinces such as the Eastern Cape (‐66.7 per cent) recorded even higher losses, whilst
the mining labour force in others, such as Limpopo, increased by 19.0 per cent.
Challenges in the sector
Mining activities are associated with pollution and loss of fertility of soil after mining in the province
and this is of great concern. This is a threat to food security if not properly managed. The other
major challenge is water contamination due to mining activities, there are no rehabilitation
programmes to cater for post mining .mining if not properly monitored has a potential to
compromise future tourism opportunities as it degrade the heritage of the province. A number of
challenges that relate to mining were identified and they include skills shortage, minimal
enforcement and compliance to mining legislation, social labour plans not properly crafted to
benefit communities, local employment being a challenge, shortage of infrastructure for human
settlement and the degradation of roads infrastructure due to mining activities etc. The South
African Mining Sector is not only faced with high level of shortage of critical skills, there are other
negative factors such as the scourge of HIV/AIDS hat might affect the sector negatively
2.7.6 Manufacturing
In terms of provincial contribution to national GVA, Mpumalanga occupied fifth place among the
nine provinces in 2009. Mpumalanga’s share was 7.7 per cent in 2009, slightly higher than the
shares recorded in 2001 (7.0 per cent) and 1996 (6.7 per cent). Manufacturing was the largest
contributor to the provincial economy with a 20.1 per cent share of Mpumalanga’s GVA in 2009.
Manufacturing activities were predominantly situated in Gert Sibande (55.5 per cent) followed by
Nkangala with a 25.7 per cent contribution to provincial manufacturing GVA.
The expected future growth of 3.8 per cent per annum from 2009 to 2014 will be higher than the
provincial economy’s forecasted 3.2 per cent growth. The employment elasticity of manufacturing
was calculated to be 0.56 over the period 1996 to 2009. Manufacturing was the fifth most labour
productive sector in the provincial context. The manufacturing sector exhibited a low level of labour
intensity as the industry is characterised by capital intensive processes. Therefore, despite the drive
to expand the province’s manufacturing sector, the manufacturing sector is not expected to
contribute as much to employment growth as it will to economic growth.
45
2.7.7 Trade
Mpumalanga, with a 5.3 per cent share, occupied seventh place among the nine provinces in 2009,
the same position as in 1996 although its share was marginally lower than the 5.6 per cent
registered then. The sector contributed 11.1 per cent to the total GVA of Mpumalanga in 2009 – the
fifth largest sector in the province. The district with the largest contribution to provincial trade GVA
in 2009 was Ehlanzeni with a 44.9 per cent share. Nkangala added 29.6 per cent whist Gert
Sibande’s share was 25.4 per cent.
The forecasted growth of 3.5 per cent per annum between 2009 and 2014 is expected to be the
fourth highest among the nine sectors in Mpumalanga. The employment elasticity of the trade
sector (2.00) was the highest among the nine sectors. The trade sector was only the seventh most
labour productive industry in the provincial context. The trade sector exhibited a high level of labour
intensity because of the labour intensive nature of business enterprises in the sector. Despite the
sector’s relatively low labour productivity, it is likely that the sector will remain an important
employment driver due to its size, healthy economic growth and favourable employment elasticity.
2.7.8 Tourism sector
In South Africa, as is the convention internationally, the tourism sector is not measured as a sector in
its own right in national accounts, because tourism is not a clearly defined industry in the SIC. This is
because industries are classified according to the goods and services they produce, while tourism is a
consumption‐based concept that depends on the status of the consumer.
Tourism was therefore the first economic activity to use worldwide Satellite Account standards to
measure its impact on national economies – as approved by the United Nations (UN) in March 2000.
A Satellite Account is a term developed by the UN to measure the size of economic sectors that are
not defined as industries in national accounts.
However, since full tourism satellite accounts (TSA), as measured by Statistics South Africa, take
considerable time and resources to develop, the World Travel and Tourism Council (WTTC), an
independent body, produces simulated TSAs on an annual basis. For example, the first Draft
Tourism Satellite Account for South Africa, 2005 was only released in May 2009, whereas the WTTC
annually releases its simulated TSAs.
According to the WTTC, South Africa's tourism industry was simulated to have contributed some
2.9 per cent to GDP in 2009. South Africa's 389 000 tourism industry jobs accounted for 2.9 per cent
of total employment in 2009 and are forecasted to total 462 000 jobs or 2.9 per cent of the total by
2020. In other words the tourism industry generates one in every 34 jobs across the entire
employment spectrum. The current lack of sufficient baseline data of tourism supply on a provincial
46
level makes an assessment of the supply side, and therefore a similar exercise such as the TSA for
South Africa on a provincial basis, impossible. Therefore the only official tourism data, on a
provincial level, are of tourist arrivals/visits, bed‐nights spend and tourism expenditure.
According to Tourism South Africa’s Annual Report 2009, Mpumalanga was the third most visited
province by foreign visitors in 2009 with a share of 14 per cent of total foreign arrivals. This was up
from 13.4 per cent of total arrivals in 2008. Of this 1 390 755 foreign tourists in the province,
76.6 per cent were from land markets (i.e. Mozambique and Swaziland) and 23.4 per cent from air
markets. Mpumalanga, however, captured only 6.7 per cent of the total bed‐nights spent by all
foreign tourists in South Africa. This was lower than the 7.2 per cent in 2008, although the province
remained in fourth position overall. Of this 4.8 million bed‐nights spent in the province in 2009,
53.9 per cent were by tourists from land markets and 46.1 per cent from air markets. Over
128.4 million bed‐nights were spent nationally by domestic tourists in 2009, of which Mpumalanga
contributed 5.6 per cent or some 7.2 million bed‐nights. Despite declining from a 6.8 per cent share
of domestic bed‐nights in 2008, the province remained in sixth position nationally.
2.7.9 Community services
In terms of provincial contribution to national GVA, Mpumalanga was placed second from last
among the nine provinces in 2009. Mpumalanga’s undersized share of 4.9 per cent was slightly
higher than the 4.7 per cent it contributed in 1996. Despite the small national contribution, the
sector was the third largest sector provincially with a 16.4 per cent contribution to the total GVA of
Mpumalanga in 2009. The districts’ GVA contribution was dominated by Ehlanzeni with a 45.2 per
cent share of provincial GVA. Nkangala was second and Gert Sibande third with contributions of
32.2 per cent and 22.6 per cent, respectively.
Future growth, that is expected to be around 3.4 per cent per annum, will exceed the provincial
economy’s forecasted annual average 3.2 per cent growth from 2009 to 2014. The employment
elasticity of community services (1.60) was the third highest of all nine sectors. In the provincial
context, only three other sectors performed lower in terms of labour productivity. The community
services sector exhibited a high level of labour intensity. Despite the low labour productivity
registered, the high labour absorption potential as well as the evidence deduced from the high
employment elasticity it is likely that the sector will be an important employment driver.
47

3. OVERVIEW OF THE NATIONAL GROWTH PATH AND PROVINCIAL
APPLICATIONS AND IMPLICATIONS
In this section, an overview of the National Growth Path is detailed. There are several areas that are
covered:
• Global Economic Situation;
• National Economic Outlook and Performance;
• National Labour Market;
• Main Challenges that SA faces;
• The National Growth Path as a fulcrum to remedying the challenge;
• Sectors to Support Employment Creation outlined In the National Growth Path;
• Job Drivers; and
• Macroeconomic and Microeconomic Interventions.
3.1 Global Economic Situation
The global economy continues to recover from the global crisis that erupted in 2008. However
economic growth thus far is uneven and fragile. Most advanced, as well as a few emerging,
economies still face major adjustments, including the need to strengthen household balance sheets,
stabilise and reduce high public debt and reform their financial sectors. By contrast, in emerging and
developing economies, cautious policies implemented partly in response to previous crises have
contributed to a significantly improved medium‐term growth outlook.
However, activity in these emerging and developing economies, particularly those in emerging Asia,
remains dependent on demand in advanced economies. In this setting, the following trend can be
seen.
Table 6: Global Economic Trends
Year Global Economic Growth Output of Emerging Economies Advanced Economies
2010 4.8 % 7.1 % 2.7 %
2011 4.2 % 6.4 % 2.2%
The trends displayed in Table 6: Global Economic Trends, also incorporate a temporary slowdown
during the second half of 2010 and the first half of 2011.
Sustained and healthy recovery rests on two rebalancing acts. The first being an internal rebalancing
task in advanced economies, through the strengthening of private demand and allowing for fiscal
consolidation. The second is an external rebalancing, with an increase in net exports in deficit
countries and a decrease in net exports in surplus countries, notably emerging Asia.
48

If global growth threatens to slow appreciably more than expected, advanced economies could
postpone some of the planned fiscal consolidation. Meanwhile, key emerging economies will need
to further develop domestic sources of growth, with the support of greater exchange rate flexibility.
3.2 National Economic Performance and Outlook
As can be expected from an open economy such as South Africa, the domestic economy has tracked
global growth relatively closely since 1994. Although South Africa did not suffer a banking crisis, the
country nevertheless experienced the pain of global recession and the fragile economic recovery
endured elsewhere. Unfortunately our forecasted growth rates for the near future, are not in line
with those of many of the emerging and developing economies, but are more in line with those of
the advanced economies.
The South African economy experienced a decline in gross domestic product (GDP) of 1.7 per cent in
2009 and a loss of employment estimated at close to a million jobs. In the first six months of 2010,
the productive sectors of the economy confirmed that the domestic economy emerged from the
global recession at the end of 2009 with relatively healthy growth in economic value addition.
However, the momentum of growth in manufacturing and mining in the second half of the year
appears to have slowed somewhat. The current expectations by the national government as well as
the International Monetary Fund (IMF) are that overall economic growth of 3.0 per cent can be
expected in 2010, rising to 3.5 per cent in 2011 and 4.4 per cent by 2013. The South African Reserve
Bank (SARB) expects that growth in 2010 will be in the region of 2.8 per cent, increasing to 3.2 per
cent in 2011. Employment and private investment, as historically lagging indicators, are expected to
rise gradually as growth accelerates.
3.3 National Labour Market
The labour force comprises of all the employed and the unemployed population in the province. The
South African labour market still endures hardship from the recent recession and, despite economic
recovery in GDP terms, evidence of employment as a lagging indicator is clear.
This is evident in that the national labour force shrunk by 91 000 between the end of the second
quarter 2010 and the end of the third quarter 2010. Further to the decline in the national labour
force, 86 000 jobs were shed in the national economy over the same period. Although the South
African economy, in terms of GDP growth, emerged from the recession in the third quarter of 2009,
the labour market shed a total of 158 000 jobs since then. The resultant unemployment rate
increased (worsened) from 25.2 per cent in the second quarter 2010 to 25.3 per cent in the third
quarter 2010. In other words, 1 in every 4 members of the national labour force was unemployed at
the end of the third quarter 2010.
49
3.4 Main Challenges South Africa Faces
The central and most pressing challenge that is faced by the country are unemployment, poverty
and inequality. In examining economic trends it shows that the economy has been growing at
reasonable growth rate since 1994 to 2008 and such growth has not been able to address the above
mentioned challenges. Despite improved growth, the economy remained one of the most
inequitable in the world.
The background to the new growth path includes:
• Unemployment (12.8 million in employment; 6.1 million either unemployed or too discouraged
to seek work); and
• Inequality (a Gini‐coefficient rising from 0.64 to 0.69); the reduction in the employment intensity
of the economy since 1970; and youth unemployment. At least 500 000 jobs per year on a
sustained basis over at least a ten year period will be required to make a serious breakthrough in
reducing unemployment.
There are structural constraints in the economy, including:
• Declines in mining and agriculture employment;
• Insufficient beneficiation;
• Low savings rate;
• Investment concentrated either in capital‐intensive or energy‐intensive sectors;
• Bottlenecks and backlogs in infrastructure;
• Skills shortages;
• Current account deficit in a resource boom;
• Reliance on short‐term inflows;
• Consumption‐driven growth;
• Increasing financialization of the economy; and
• Strengthening of retail and the real economy (manufacturing and agriculture) squeezed between
the two.
Mpumalanga, and South Africa as a whole, is faced with the task of replacing apartheid divisions,
inequality and impoverishment with a more equitable and inclusive economy. The government has
been committed to drive towards national emancipation that is in a very real way bound up with
economic emancipation.
50

Apartheid deprived the majority their due in the country's wealth; skills were suppressed and
poverty and starvation remains a stark reality to the majority. The correction of these centuries‐old
economic injustices lies at the very core of government programmes. South Africa’s deep
inequalities result from the exclusionary and divided economic and social systems established under
apartheid. These systems privileged a minority by depriving the majority of access to assets,
including land and finance; quality education and certified skills; decent government services; and
access to market institutions. They aimed both to reduce the majority to poorly paid wage labour
and to limit migration into the cities. That in turn provided more opportunities and state resources
for the minority.
The exclusionary systems established under apartheid continue to influence the economy. In the late
‘00s less than half the working‐age population earned an income from work. That contrasts with the
international norm of around two thirds. In the former Bantustan regions, only a third of working‐
age people were employed. The International Labour Organisation found that South Africa ranked
amongst the ten countries with the lowest levels of employment worldwide.
3.4.1 Structures of Production and Control
Ultimately, the structure of ownership of capital lies at the heart of any understanding of the
economy and especially of inequality. By definition, there is a dialectical relationship between capital
relations (in the sense of who owns and controls economic activity) and the production structure.
The specific nature of ownership both reflects and shapes investment and production decisions. In
turn, those decisions determine employment opportunities and economic growth.
Apartheid entrenched structures of production and ownership characterised by dependence on
mining‐based exports and heavily concentrated ownership. After 1994, this situation was modified
by growth in the financial industry and newly deregulated service sectors; declining profitability in
manufacturing and in the contribution to the GDP of gold mining and agriculture; and increased
state support for black capital.
Through the years from 1994, exports based on the mining value chain, including heavy coal‐based
chemicals from SASOL and refined metals, accounted for half of all national exports although less
than 10% of employment and 20% of total value added. Mining economies like Mpumalanga are
typically highly concentrated, since most mining requires large producers. In addition, the system
left South Africa with very limited production by small and micro enterprises compared to other
middle‐income countries. Domestic mining capital has largely reintegrated into international capital
groups. The process has fragmented the historic conglomerate structure of mining and moved
centres of control overseas. We need to analyse the implications of this for the province’s long‐term
growth and competitiveness.
51

While mining exports remained critical after 1994, most growth in value added occurred in finance,
communications, retail and business services. These four sectors accounted for two thirds of South
Africa’s economic growth between 1994 and 2009. Growth in construction and mining‐based
construction was somewhat faster than in business services and retail, but the sectors themselves
remained relatively small.
From the 1980s, the profitability of finance and communications rose rapidly. In contrast, the
profitability of agriculture and manufacturing declined. The share of finance, communications and
construction in profits (that is, net operating surplus) climbed from 19% in 1994 to 31% in 2009. The
share of mining rose from 6% to 14%, but the share of manufacturing and agriculture dropped from
32% to 12%. (Calculated from Quantec EasyData standardised industry series). Concentration
remains pronounced in basic chemicals and metal refining, finance, retail and telecommunications.
The resulting monopoly pricing on key inputs and wage goods makes the economy more inefficient
and raises the cost of employment. Yet regulation proves politically difficult because these sectors
are important for emerging black capital.
State capital including the Development Finance Institutions and the Public Investment
Commissioners (PIC), in effect, the SOEs and parts of the public service function as a path into
business for black entrepreneurs. Conflicting mandates result as they try to balance demands for
narrow BEE, improved service delivery and commercial sustainability. In order to confront these
challenges effectively, we must therefore simultaneously accelerate economic growth and transform
the quality of that growth to create decent work. The skewed patterns of ownership and production,
the spatial legacies of our apartheid past and the tendencies of the economy towards inequality,
dualism and marginalization will not recede automatically as economic growth accelerates.
Therefore, decisive action, led by government, is required to thoroughly and urgently transform the
economic patterns of the present in order to realise our goals. This requires that accelerated growth
take place in the context of an effective strategy of redistribution that builds a new and more
equitable growth path.
Looking at global trends it becomes imperative that there is a general shift in the long term, from a
resource based to a knowledge economy. Skills are a prerequisite for the knowledge economy. It is
also important to acknowledge, as a country, past mistakes that prohibited growth and
development. These oversights include the tendency to hang to a mineral based economy, normally
referred to as the mineral energy complex economy (MEC) when we should have diversified our
economy and beneficiated long ago. Little has happened regarding investments on research and
52
development despite the evidence that countries that prioritized research and development, like
South Korea, have managed to grow their economies significantly. Korea researched the motor
industry and they developed the Hyundai brand, which is worldwide brand today. Hyundai recently
sponsored the FIFA World Cup. It is important for the country and most importantly for South Africa
to find its niche in world markets through research and development. The Asian Tigers grew their
economies at the back of the knowledge based sectors which they properly researched.
The government of Mpumalanga has in fact done a lot of work in the past, guided by some of the
frameworks discussed above and others to ensure growth and development in the province. Some
initiatives that were pursued by the provincial government included investing in high impact projects
such as the corridors, and other infrastructure programmes. There were a number of foreign
missions to attract investors to the province. However, it is critical to note that this growth did not
translate into the general improvement of the socio‐economic conditions of the people of the
province. Unemployment remained high and inequality persisted and it is against this backdrop that
government must take up the challenge of “doing things differently”. While there has always been
an emphasis on agriculture as a sector that can create jobs, especially considering that we are a rural
province, it is important to note that we have missed an opportunity in this sector. The interventions
put in place were insufficient considering that we now import a lot of the agricultural products that
we used to produce in the past.
We also failed to select our investment options shrewdly, considering that all the sectors have
investment requirements. In shaping our economic growth path it becomes important to carefully
prioritize the sectors that can potentially grow the economy of the province. The sectors and
programmes that are prioritized in the new growth path should be labour absorbing and have
regional impact.
Whilst there are many gains that the country and the provincial government have made, there were
limited efforts towards investing in broadband infrastructure which is central to the creation of a
conducive business environment. We have not succeeded in developing the skills base required by
the economy. The issue of HIV/AIDS is a major challenge as it impact negatively on the skills base.
We have not succeeded well in developing clear government programmes to create employment in
the past, and these are some of the challenges that the growth path seek to address. We have been
slow in dealing with procurement challenges that are geared towards supporting SMME’s and
Cooperatives. Our approach to development has remained disintegrated and this has resulted in a
number of challenges in the past, i.e. houses have been built in areas where there are no amenities
and at areas distant from any economic activity. We did not pay much attention on balancing our
53

economic activities with environmental sustainability. We have also not defined Mpumalanga’s
niche in world markets and there is a pressing need to do so in this era which government has
declared as an epoch of Job creation.
3.4.2 Structural Changes in the Provincial Space Economy
The key structural changes that have taken place over the past three decades in Mpumalanga are:
• Decline in the mining in terms of jobs;
• Decline of manufacturing in terms of jobs but growth in output; and
• Growth in terms of both jobs and output in the tertiary or services sector.
These changes have been characterised by:
• Continued erosion in commodity prices;
• Diminishing demand for low skilled jobs as a result of competitive international investment;
• Pressure where labour intensive manufacturing is being re‐directed to low cost labour nations;
• Growth in high technology or knowledge based manufacturing and decline in simple
manufactures; and
• Growth in services, particularly services in finance and retail.
These structural changes have dramatically shaped the nature of jobs. There has been growth in skilled, knowledge, information and service jobs and decline in low skilled, process and manual work. In other words, there has been job growth in “thinking” and service jobs and decline in process or manual work.
Those regions in Mpumalanga that are able to develop wealth creating initiatives (driven by exports), while complementing this with consumption led growth (driven by population growth) will perform best in economic terms in the foreseeable future.
3.5 The National Growth Path as a fulcrum to remedying the challenge
The focus of the Growth Path is to improve the labour absorption of the economy (the jobs yields of
each billion rand of investment and each one percent of growth in GDP), to reduce carbon emissions
and to strengthen the link between science and technology on the one hand and growth and jobs on
the other.
The New Growth Path seeks to provide bold, imaginative and effective strategies to create the
millions of new jobs South Africa needs. It also lay out a dynamic vision for how we can collectively
achieve a more developed, democratic, cohesive and equitable economy and society over the
medium term, in the context of sustained growth. The strategy sets out critical markers for
employment creation and growth and identifies where viable changes in the structure and character
of production can generate a more inclusive and greener economy over the medium to long run. To
that end, it combines macroeconomic and microeconomic interventions.
54

3.6 Sectors to Support Employment Creation outlined in the National Growth Path
Government will prioritise efforts to support employment creation in the following sectors.
Figure 17: Prioritisation of Government Efforts
55

3.7 Job drivers
The Growth path identifies five job drivers and the above mentioned opportunities will take
advantage of the potential of new approaches in the jobs drivers. In many areas of the jobs drivers,
departments have already initiated strategies to support employment creation; in others, they are
currently reviewing their policies and programmes.
The New Growth Path builds on existing work. For each of the jobs drivers, targets have been set for
employment creation.
Figure 18: Job Drivers
3.7.1 Infrastructure
In relation to infrastructure, the national growth path estimates 250 000 jobs a year that can be
created in energy, transport, water and communications infrastructure and in housing, through to
2015. According to the national growth path the jobs are in four activities: construction of new
infrastructure; operation of the new facilities; expanded maintenance; and the manufacture of
components for the infrastructure programme. In addition to these four activities, the impact of the
massive infrastructure programme on job creation across the economy (the “multiplier effect”) will
be substantial.
The second Integrated Resource Plan for electricity (IRP2) will play an important role in improving
economic efficiency and to reduce emissions. Areas like the energy sector, the future upscaling of
electricity capacity partly from renewable sources and from nuclear power will see jobs being
created. Greater emphasis will also be placed on the expansion of rail transport, and water
infrastructure to give effect to other economic activities such as agriculture. There will be significant
56
investments to infrastructure to support broad‐based growth and rising competitiveness linked to a
coherent and sustainable strategy on rural development.
3.7.2 Main Economic Sectors
The National Growth Path targets opportunities for 300 000 households in agricultural smallholder
schemes plus 145 000 jobs in agro‐processing by 2020, while there is potential to upgrade conditions
for 660 000 farm workers. Initial projections by the Industrial Development Corporation (IDC)
suggest that mining can add 140 000 additional jobs by 2020, and 200 000 by 2030, not counting the
downstream and side‐stream effects. Much of manufacturing is included under other jobs drivers,
but IPAP2 targets 350 000 jobs by 2020 in the industries not covered elsewhere. High level services
can create over 250 000 jobs directly just in tourism and business services, with many more possible
in the cultural industries.
It also sets out a range of practical measures at sectoral level to achieve these employment targets
with a special focus on restructuring land reform, Accelerating exploitation of mineral reserves,
Refocusing the beneficiation strategy to support fabrication, Phasing support for manufacturing and
strengthening measures to expand the tourism infrastructure and services.
3.7.3 Seizing the Potential of New Economies
The new growth path puts technological innovation at the core for sustainable employment creation
The New Growth Path targets 300 000 additional direct jobs by 2020 to green the economy, with 80
000 in manufacturing and the rest in construction, operations and maintenance of new
environmentally friendly infrastructure. The potential for job creation rises to well over 400 000 by
2030.Additional jobs will be created by expanding the existing public employment schemes to
protect the environment, as well as in production of bio‐fuels. A further 100 000 new jobs are
targeted by 2020 in the knowledge intensive sectors of ICT, higher education, healthcare, mining‐
related technologies, pharmaceuticals and biotechnology.
The strategies outlined in the growth path to achieve the targets are Comprehensive support for
energy efficiency and renewable energy as required by the IRP2, Public employment and recycling
schemes geared to greening the economy, Stronger programmes, institutions and systems to diffuse
new technologies to SMEs and households; Greater support for R&D and reduced cost of and
improve access to broadband.
3.7.4 Investing in Social Capital and Public services
According to the new growth path the social will be an important aspect of job creation, the social
economy is described to include myriad not‐for‐profit institutions that provide goods and services,
including coops, non‐governmental organisations (NGOs) and stokvels. A number of 260 000 new
57
employment opportunities are anticipated if the sector grows. The public service can also generate
100 000 jobs in health, education and policing by 2020 even if it grows by only 1% a year, as well as
substantial opportunities through public employment schemes.
3.7.5 Spatial Development
Government will step up its efforts to provide public infrastructure and housing in rural areas, both
to lower the costs of economic activity and to foster sustainable communities. Rural development
programmes can achieve a measurable improvement in livelihoods for 500 000 households, as well
as stimulating employment in other sectors. With regards to Regional development it envisaged that
increased exports to SADC alone can generate almost 60 000 additional direct jobs by 2015 and
around 150 000 by 2020. South Africa cannot succeed with regional development without strong
partnerships with other countries on the continent.
3.8 Macroeconomic and Microeconomic Interventions
The growth path on the macroeconomic stance argue for a looser monetary policy and a more
restrictive fiscal policy fiscal policy backed by microeconomic measures to contain inflationary
pressures and enhance competitiveness.
The package entails the following:
• The monetary policy stance will continue to target low and stable inflation but will do more to
support a more competitive exchange rate and reduced investment costs through lower real
interest rates;
• Additional and larger purchases of foreign currency flowing into South Africa, as a result of
foreign direct investment and portfolio inflows, in order to counter appreciation of the rand as
required;
• Greater restraint in fiscal policy to slow inflation despite easier monetary policy. A counter‐
cyclical fiscal stance through the business cycle will manage demand in support of a more
competitive currency while achieving critical public spending goals; and
• Mobilisation of resources to finance growth path priorities, particularly jobs, skills and
infrastructure.
The microeconomic package involves ten programmes to control inflationary pressures and
inefficiencies combined with more pro‐active strategies to support an inclusive economy, social
equity and regional development. Microeconomic measures to control inflationary pressures
include:
• Competition policy as discussed below, targeting monopoly pricing on wage goods and basic
industrial inputs;
58
• A review of administered prices to ensure that they do not increase above inflation without
compelling reasons; and
• Targeted, efficient and sustainable interventions to contain other volatile and/or rapidly rising
costs, such as private healthcare and spikes in basic food items.
Proposals to introduce National Health Insurance, for instance, should reduce the share of the GDP
spent on health, which is now extraordinarily high for a middle‐income economy, while improving
access for the majority. Measures to support long‐term competitiveness also include a range of
measures discussed below, including skills development, vigorous implementation of IPAP2, small
business support and labour‐market interventions. They also require reduced red tape and
bureaucratic delays as well as competitive pricing of broadband and ports and more efficient rail
links to the coast.
The Ten policy areas have been identified, are an Active industrial policy, Rural development policy,
Competition policy, Stepping up education and skills development, Enterprise development: Broad‐
based Black Economic Empowerment (BBBEE), Labour policies, Technology policy, Developmental
trade policies and Policies for African development. Some of these have very direct impacts on
provinces and municipalities. The most important aspect is for provinces to strengthen their
contribution to the national employment generation goals that have been set and to also forge
cooperation in the way national and provincial government work with each other. There is a need to
develop a common vision and strategic unity.
59

4. THE MPUMALANGA ECONOMIC GROWTH AND DEVELOPMENT PATH
4.1. Strategic objectives
The primary objective of the Mpumalanga Economic Growth and Development Path (MEGDP) is to
foster economic growth that creates jobs, reduce poverty and inequality in the Province. The
growth path is anchored on a number of parameters including sector development, Inclusive &
shared growth, spatial distribution, regional integration, sustainable human development and
environmental sustainability.
4.2 Mpumalanga in the next ten years
This section of the MEGDP captures expected movements in key economic and socio‐economic
variables over the next ten years. As can be noted below, many of the socio‐economic variables
have a high correlation (inverse relationship) with employment growth, i.e. the creation of decent
jobs should have a significant impact on the reduction of poverty, income inequality,
unemployment, etc.
a) According the latest statistics, the unemployment rate in Mpumalanga is standing at
approximately 28 %. As the Province we are aiming at reducing the unemployment rate to 15%
by 2020. According to the analysis conducted, this means that the Province has to create
approximately 719 000 jobs over a period of ten years, that is, moving from 890 000 currently
employed people to 1 609 656 employed people in the next ten years
b) With regard to poverty, the Province will increase the income level of 620 000 individuals above
the poverty line by 2020.
c) Increase the Human Development Index (HDI) from the current level of 0.50 to a higher level
over the next ten years. The Province will increase the literacy level from the current 40 000 per
annum individuals to 63 000 individuals per annum, increase the percentage of life expectancy
from 51 years to 62 years.
d) Relating to inequality, the Province will reduce the Gini‐coefficient from 0,65 to 0,55 by 2020.
e) For the province to realise these broad targets indicated above, the provincial economy has to
grow at the rate of between 5 and 7 percent per annum.
4.3 Job drivers
The following job drivers will be utilised to secure a strong and sustainable growth in the next
decade.
60

i. Infrastructure for Employment & Development
ii. Job Creation in Economic Sectors
• Agriculture and forestry
• Mining and energy
• Manufacturing and beneficiation
• Tourism and cultural industries
iii. Seizing the Potential for New Economies
• Green Industries
• Information and Communication Technology
iv. Investing in Social Capital & the Public Service
v. Spatial Development
• Rural Development
• Regional and International Co‐operation
4.3.1 Infrastructure as a job driver for job creation and catalyst for development
Infrastructure development is one of the key drivers for economic growth and job creation. All the
sectors that have been discussed above rely, in the main, on infrastructure development for their
own growth and development. Investment in massive infrastructure development by both
government and the private sector will go a long way in terms of unlocking opportunities for
economic growth and development, including the massive growth in jobs. In essence, for the
Economic Growth and Development Path to succeed, infrastructure development will be critical. The
jobs will come from the physical layout of the infrastructure itself as well as the economic activities
that will take place as a result of such infrastructure.
The Mpumalanga Infrastructure Development Plan (MIDP) will guide the Province with regard to the
rollout of infrastructure projects. The Plan covers both the economic and social infrastructure. The
Expanded Public Works Programme will feature high during the roll‐out of the Infrastructure Plan.
4.3.2 Main Economic Sectors
The Sectors to support economic growth and employment creation in the province with particular
emphasis on beneficiation and diversification are:
4.3.2.1 Agriculture and Forestry
i. Agriculture
The contribution of the agricultural sector to GDP by Mpumalanga has been declining in the past ten years or so and consequently shedding jobs in the process.
61

However, analysis shows that, despite this declining trend in production and job absorption over time, this sector is still not performing to its optimal level yet. There is potential for growth and generation of more jobs. The figure below illustrates the numerous indirect benefits of research with regards to employment growth.
Figure 19: Benefits of Agricultural Research
Opportunities in the agricultural sector
Agricultural jobs will be generated from existing opportunities in crop and animal production, including the entire value chain.
In the Lowveld area, largely the Ehlanzeni district, focus will be placed on the production of sugarcane, nuts, vegetables, citrus and sub‐tropical fruits.
In the Highveld area, which includes Gert Sibande and Nkangala districts, crops that will be prioritised are summer grains, oilseeds and deciduous fruits. Animal production will also be given special attention in these districts.
In the light of these opportunities, the province is targeting to create approximately 27 000 jobs in this sector in the next ten years. However, there are certain bottlenecks that will need to be resolved.
Constraints to be addressed
To exploit these opportunities optimally, there are bottlenecks that will require urgent attention. This includes, primarily:
• Inadequate water for irrigation
Water is a scarce resource in the province. Unfortunately, for sustainable development to take place in the province, adequate water will be required. Agriculture and mining are the major consumers of water currently. However, to exploit the opportunities in the agricultural sector for growth and job creation, additional allocation of water will be imperative for irrigation, especially for small‐scale farmers.
• Outstanding land claims
Access to land for economic growth and development is critical in the province. Some of the prime land for this purpose is still under claim. It is lying fallow because the claimant and business could
62
not invest in it due to high risk. This has a negative impact on economic growth and development, including job creation. Therefore, a speedy process to settle all claimed land could assist in releasing land for growth and job creation.
• Access to land
Land is one of the most important factors of production. Land distribution is still skewed in the province. The land reform legislation, policies, strategies and programmes initiated thus far have failed to accelerate the distribution of land as expected. Of critical importance is that, if we have to bring more people in the mainstream economy, the process of land distribution has to turbo‐charged. This will allow growth of small‐scale farmers and agri‐businesses in the agricultural sector, subsequently economic growth, development and job creation.
• Competition between mining and arable land
The agricultural sector is competing with other land users for the same land. Most notably are the expansion of the mining industry and urbanization. This has serious implications on land reform and food security. The protection of high potential and productive agricultural land is necessary because of its sustainability in terms of food security, growth and job opportunities.
4.3.2.2 Key areas for intervention to facilitate growth and job creation in the agricultural sector
• Massive drive on infrastructure development. This includes, among other things: dams, irrigation, farm roads, silos , pack houses, mechanisation, electricity and infrastructure for agro‐processing;
• Massive drive in skills development;
• Comprehensive support to small‐scale farmers and agri‐businesses;
• Fast‐track the settlement of the outstanding land claims;
• Optimal utilisation of restituted and distributed land;
• Increase acquisition of agricultural land for the previously disadvantaged and;
• Revisit current legislation to create balanced development in areas of competition between mining and farming
4.3.2.3 Forestry
Mpumalanga is one of the country’s major areas in forestry production and accounts for 22.8%% of the country’s forestry GVA. Mpumalanga further accounts for 40% of the total forestry income of the country. This sector is currently employing 24 400 people in sustainable jobs and contributing to 46 300 indirect jobs.
The north‐eastern part of the province, that is, around Sabie and Graskop, is regarded as the hub of the commercial forest, including the Mkhondo municipality and the adjacent areas bordering Swaziland. The industry is extensively commercialised and run sophisticated processing plants, ranging from sawn logs to pulp and paper, and board production.
63
The commercial forest sector offers attractive business opportunities for small‐scale entrepreneurs, particularly growers, contractors and saw‐millers. In addition, the pulp and paper industry in the province creates income opportunities for waste‐paper vendors.
Opportunities in the forestry sector
The forestry sector presents opportunities that have the potential for economic growth and job creation. These opportunities range from community forestry to charcoal production, forestation, industrial forestry, multiple‐use forestry and forestry protection.
• Community forestry
Community forestry has the potential to contribute substantially towards sustainable development, poverty alleviation and job creation, particularly in rural areas. The Whitepaper on Sustainable Development defines community forestry as forestry designed and applied to meet social and environmental needs of local households. It is a policy that fosters community‐driven development.
• Charcoal production
According to the study conducted by the Department of Water Affairs and Forestry on charcoal production, it is argued that the production of charcoal is concentrated in the Natal midlands and the South‐ Eastern areas of Mpumalanga. The study also showed that there is a growing demand for charcoal in South Africa. Therefore, this opportunity of charcoal production is seen as ideal for SMMEs development. Some large charcoal producers have also shown an interest in forming joint ventures with small‐scale producers to secure huge charcoal supplies on a regular basis. They are often prepared to provide funding, training and the initial investment required for small‐scale production plants.
• Afforestation
A forestation is the conversion of bare or cultivated land into forest. The White Paper on Sustainable Forest Development, as assessment by the Department of Water Affairs, indicates that most of the land which is suitable for afforestation lies in Mpumalanga, KwaZulu‐Natal and the Eastern Cape. This provides Mpumalanga with a window of opportunity to take full advantage of exploiting its underutilized land. The increase or enhancing of new afforestation is a good mechanism of increasing round‐wood supply.
• Industrial forestry
Industrial forestry includes large planted forests, established for the purpose of supplying raw materials to the mining sector, construction and other industrial markets. Wood as raw material also provides value adding opportunities. Most of South Africa’s wood demand is met predominantly from industrial forest plantations. Common industries based on wood/forestry include the pulp and paper sector, which have proved to be internationally competitive.
• Multiple use forestry
64

Multiple use forestry occurs in cases that forestland is utilized for purposes other than wood supply. These products include non‐wood or minor forest products and the utilization of forests for recreation and tourism. This also presents good opportunity for job creation.
• Forest protection
Protection of the conservation and commercial value of forests necessitates protection of forest areas from potentially harmful effects of diseases, weeds, pests (including feral animals), chemicals and wildfire. Government gives high priority to the protection of public forests from these agents. Further, since public and private lands are closely linked, active protection of public forests needs to be coordinated with appropriate action on private lands. Therefore, this area of work also presents opportunities for job creation.
Given these opportunities in this industry, the province is targeting to create 4500 jobs by 2020. Like in the agricultural sector, there also some constraints that has to be resolved in this industry.
Constraints to be addressed
• Inadequate water for forestry expansion
Mpumalanga has an immediate opportunity to create 750 sustainable jobs and a significant number of indirect jobs. These jobs could be generated from 15 000 ha which is readily available in the Province. However, non‐availability of water is a serious bottleneck limiting the expansion of the forestry industry.
• Land claims
The slow rate of settling land claims under forestry limits prospects for economic growth and job creation in the industry. Addressing this challenge will create more opportunities for land claimants and agri‐businesses.
Key areas for intervention to facilitate growth and job creation in the forestry sector
1. Resolve water issues to foster expansion in the forestry industry
2. Accelerate settlement of land claims under forestry
3. Comprehensive support to SMMEs, particularly cooperatives.
4. Invest in infrastructure
4.3.2.4 Mining and energy industries
1) Mining
Mining industry remains one of the important economic sectors in the Province for economic growth
and job creation. Studies show that Mpumalanga Province is endowed with a variety of mineral
65
resources. Among others, the Province is blessed with gold deposits in the areas of Leandra, Kinross,
Evander, Sabie, Pilgrim’s Rest, Graskop and the Barberton Mountain Land.
It is the largest producer of coal and represents 76.6% of coal production in South Africa followed by
Free State at 8%, Limpopo at 7.5% and KwaZulu‐Natal at 1.4%. It is also the third largest coal
exporting region in the world. It is the largest producer of ferrochrome and represents 75% of
ferrochrome production in South Africa followed by North West at 18%, KwaZulu Natal at 3%,
Limpopo at 3% and Gauteng at 1%.
It is having deposits of granite, gabbro, marble and verdite. Granite operations are located in the
eastern part of the Province near Nelspruit as well as in the middle clustered around Belfast and
Emalahleni. Mpumalanga Province is the largest producer of ferrochrome and represents 75% of
ferrochrome production in South Africa followed by North West at 18%, KwaZulu Natal at 3%,
Limpopo at 3% and Gauteng at 1%. Mpumalanga is also possessing platinum deposits which are at
edges of the Eastern Limb of the Bushveld Complex in the Roossenekal area. Platinum is also
recovered at the Nkomati Nickel mine near Machadodorp.
Opportunities in the mining industry
Recent studies conducted by the Province show that opportunities in the mining industry will come
from these key commodities comprising of coal; chrome; gold; and dimension stones, now of recent
is platinum. These commodities are critical for growing the economy and creating jobs as are easily
accessible as deposits are located close to or at surface, whether in dumps or un‐mined deposits.
They are in high demand in the local market and hence there is a level of market demand that
continuously persists; and the capital outlay required for some projects are not excessively high to
preclude pursuing.
Strategic procurement
The studies further show that in recent years the largest cause for the emergence of new enterprises
has been the changes made in procurement patterns. The significance of this is captured in the
Mining Charter where rural enterprise development and procurement objectives are both noted as
two areas where transformation will occur.
Corporate Social Investment Activities
Another conduit for enterprise development and job creation involves Corporate Social Investment
activities by mining companies operating in Mpumalanga. These companies interface at several
66
levels with adjacent communities and with businesses. As a result, they provide a range of
opportunities for upliftment and entrepreneurship development.
Statutory regulation under the Mineral and Petroleum Resources Development Act is one of the
important instruments that is assisting in this regard. The Act compels mines to have Social and
Labour Plans approved by the Department of Mineral Resources (DMR) in terms of which socio‐
economic developments undertaken by the mines are to be in line with the Integrated Development
Plans (IDP) of local municipalities where mines are situated. In essence, it supports activities geared
towards the growth of SMMEs, community participation and BBBEE arising from Corporate Social
Investment initiatives by major mining companies operating in the Mpumalanga Province.
Beneficiation
The development of a centralized mining refinery may be important to act as a centre where
consolidation of production can occur. Currently the large Rand Refinery in springs, Gauteng,
processes most of the output and spare capacity at this refinery acts as a means to deter further
refinery installation. However, small scale refineries could be beneficial if local output is to be used
for further beneficiation.
Retreatment of sub‐economic deposits and dumps
The retreatment of sub‐economic deposits and dumps can be considered for local development.
Most mines (predominantly coal mines and some gold mines) have stockpiles of sub‐economic coal
ore that, when treated at smaller scales, can be made viable due to different operational
requirements. The coal deposits in Mpumalanga are predominantly used locally for energy
production, the expansion of the energy sector presents many job opportunities. However some
small niche markets are available (metallurgical coal or washed coal for unique uses) can be
explored. This can particularly encouraged around small high grade deposits that are typically
overlooked by larger companies. Consolidation of the output of smaller operators can be done to
achieve better economies of scale. This can be centralised with Provincial support. The ashes from
coal can be used for cement making.
Mining of dimension stone
Dimension stone mining is labour intensive and the increase of export infrastructure (dimension
stone mines are closely linked to international demand) within the province will lead to an increase
in mining operations. One of the lucrative components of dimension stone mining lay in the profit
pools that exist around transport. The transporting of dimension stone, from the province to the
largest markets in Gauteng can provide numerous SMME opportunities. Export via Maputo may
67

present a unique opportunity to move dimension stone outside of the Transnet infrastructure which
is not specifically geared to low volume exports of such products.
Reprocessing waste for road paving around municipal buildings that is both labour‐intensive and
creates an attractive civic space.
Given these opportunities in the Mining industry, the province is targeting to create 39000 jobs by
2020
Constraints to be addressed
Below are some of the critical barriers to advancing mineral development in the Province:
Figure 20: Critical Barriers to mineral development
Key areas for intervention to facilitate growth and job creation in the mining industry
• Upgrading and maintenance of the coal haulage network
• Increase the level of higher skilled graduates
• Expand the water network and increase reliance on water transfer schemes
• Increase South Africa’s base load and improve alternate energy supply
• Establishment of a mining supplier park to enhance enterprise development in the province
• Resolve land claims to release land for development
• Comprehensive support to small‐scale mining enterprises to exploit opportunities presented by corporate social investment initiatives, retreatment of sub‐economic deposits and dumps, and dimension stones.
68
2) Energy industry
The generation of electricity through coal‐fired power stations in South Africa takes place primarily
in Mpumalanga. Of the 24 power generation facilities owned by Eskom in the country, 13 are coal‐
fired power stations. Eleven of the currently operational coal‐fired power stations in the country are
situated in Mpumalanga and contribute roughly 76% of the total electricity generated in South
Africa. In addition, the three Eskom return‐to‐service (RTS) coal‐fired power stations are also
situated in Mpumalanga. This industry is also contributing directly and indirectly to economic
growth and job creation.
• Opportunities in the energy industry
Eskom is in the processes of building new generation and transmission capacity. It is argued that
South Africa would require additional 20 000 MW by 2020. The following initiatives taken by Eskom
present opportunities for economic growth and job creation:
• The New Build Programme
The New Build Programme involves three massive projects, namely, Medupi in Lephalale, Kusile in
Delmas, and Ingula in Ladysmith. These projects will:
o Contribute to economic growth of the country and create employment opportunities
o Empower the industrial development
o Ensure the continuous supply of power in grid
o Build capacity and confidence for the future needs of the country
o Provide opportunities for new technologies in renewable energy
• Social Corporate Investment
Eskom has a section 21 company, The Eskom Development Foundation, responsible for executing
Corporate Social Investment (CSI) initiatives on their behalf. The CSI programme contributes towards
the improvement of the quality of life of communities where Eskom operates. It supports social and
economic projects that primarily focus on initiatives for education, skills development, poverty
alleviation and job creation. In Mpumalanga, the Foundation has granted overall funding of over
R11.8m over the last four years, impacting over 200 000 people.
• Re‐commissioning of old power station
The re‐commissioning of old power stations presents opportunities for economic growth and job
creation, particularly in your forward and backward linkages.
Constraints to be addressed
69
• Inadequate water supply for expanding power generation
• Negative impact of coal mining and coal‐fired power stations on environment and underground water
• Inadequate infrastructure to unlock economic growth and job creation opportunities
• Shortage of skills, particularly engineers, artisans and project managers
Key areas for intervention to facilitate growth and job creation in the energy sector
1. Resolve water supply bottlenecks
2. Invest in infrastructure, that is, dams, power stations, roads, rail, etc
3. Enhance the requisite skills
4. Comprehensive support to SMMEs to exploit opportunities presented by Eskom
3) Manufacturing and Beneficiation
Analysis shows that Mpumalanga has seen increasing prominence of secondary and tertiary
activities over primary activities in the sectoral composition of the Province’s GDP. The
manufacturing sector is also one of the largest contributors to the economy of Mpumalanga and is
projected to remain the largest earner in the economy, followed by mining and quarrying and,
community and government services, trade and finance. In terms of employments figures for the
third quarter 2010, manufacturing is further shown as one of the biggest absorbers of employment
after trade (24%), community services (19%), Finance (10%), manufacturing (9%) and construction
(8%).
Evidently, the manufacturing sector remains critical to economic growth and job creation in the
province. The province has engaged private sector to beneficiate some of their products in the
province in order to enhance job creation. Industry have cautioned government that beneficiation in
its nature (high skills, technology) is not labour absorbing but cannot be ignored in looking at
multiplier effect.
Opportunities in the manufacturing sector
Given the mineral resources that the Province is endowed with, investment in the manufacturing
sector could increase its current capacity and contribute to economic growth and job creation,
particularly if more focus is given to beneficiation and agro‐processing. In the ferrochrome industry,
there is potential for a new smelter to be established in the Province which can create a number of
job opportunities. This industry has readily available markets locally and internationally. The
extension of the value chain into the Province will be encouraged as it will result to more jobs. The
availability of critical inputs will support this.
The massive expansion and rejuvenation programmes of the largest manufacturing plants (Sasol,
SAPPI) in the province provide an opportunity for jobs in the province. The manufacturing of
packaging boxes to transport fruits and vegetables is another area of opportunity.
The province is targeting to create 47 000 jobs in the next ten years in the Manufacturing Sector.
70

Constraints to be addressed
• Infrastructure development
• Access to funding
• Non‐availability of requisite skills
Key areas for intervention to facilitate growth and job creation in the manufacturing sector
• Target sectors that ensure beneficiation
• Enhance skills development, especially in the areas of engineering, artisan, business and project
management.
• Recruit technology and skills from outside our borders as beneficiation require high level skills
and technology
• Invest in industrial infrastructure to encourage enterprise development
• Provide comprehensive support to SMMEs development
• Partner with the Department of Science and Technology and other institutions such as the
institutions of higher learning to research areas of the economy which we can benefit
communities.
4.3.2.5 Tourism and cultural industries
Tourism and cultural industries are other important sectors of the provincial economy. These
industries also contribute meaningfully towards economic growth and job creation. The wealth of
natural and cultural resources that Mpumalanga possesses provides it with a base upon which to
develop a sustainable industry. This will include attractions such as the world renowned Kruger
National Park with its diversity of wildlife, the world’s 3rd largest canyon – Blyde River Canyon,
breathtaking vistas from the Bulembu Mountains, a diversity of flora and the world’s oldest exposed
rocks in Barberton, Wetlands and much more.
The Mpumalanga Tourism Growth Strategy (2007) argues that Mpumalanga has the potential to be a
premier international and domestic tourism destination if it could translate this resource base into a
significant tourism industry.
Opportunities in the tourism and cultural industries
Analysis from the Mpumalanga Tourism Growth Strategy shows that the tourism products of
Mpumalanga could be diversified and expanded to cover a wide range of product market segment.
The following key areas have the potential for economic growth and job creation:
• Wildlife & nature tourism,
• Activity & adventure tourism,
• Resort tourism, sports tourism,
• Residential tourism,
• Conference & meetings,
• Leisure/entertainment,
• Industrial & township tourism, and
• Cultural heritage
Constraints to be addressed
71

To grow the tourism and cultural industries to higher levels and create more jobs, reducing poverty
and inequality, the following constraints will have to be addressed:
• Infrastructure for different tourism products
• Skills shortage
• Funding
Key areas for intervention to facilitate growth and job creation in the tourism and cultural industries
Broadening and diversifying the primarily nature‐based tourism product offerings of Mpumalanga
into more main‐stream segments of the market such as sports events, business/conference
meetings, theme/amusement park, and subsequently grow the economy that create jobs, the
following key interventions will be critical:
• Sustained investment in all aspects of the industry – new products, destination marketing, human capital development in the service industry
• Investing in economic infrastructure, e.g., airport, International Conference Center, Sports Academy, roads for tourism routes, etc.
• Comprehensive support to SMMEs to exploit opportunities in the tourism and cultural industries.
4.3.3 Sectors Seizing the Potential for New Economies
The focus on new economies in Mpumalanga will be placed on the green economy and Information,
Communication and Technology. Looking at the economic situation of the Province, these two areas
of work will provide Province with new opportunities for economic growth and development.
4.3.3.1 The Green Economy
The use of coal for energy production results in both primary environmental impacts associated with
mining and removal of coal for use in coal fired power stations in the province, as well as the
secondary impacts resulting from the burning of this coal for energy production. Coal intensive
activities contribute to large‐scale water and air pollution, including significant carbon dioxide
emissions, which contribute to global warming.
While energy is key for the socio‐economic developmental objectives of the Province, it is obvious
that there has not been enough focus on renewable energy development as a key aspect of this
developmental agenda. In order to adequately address the information gaps and to allow the
Province to meet its integrated energy needs for sustainable socio‐economic development, there is a
need for research to be conducted on a number of key areas with a view of developing an Integrated
Renewable Energy Plan for the Province. This will include research work in areas such solar energy;
biomass (bagasse; wood‐waste (saw‐dust, wood off‐cuts, etc.) and putrescible waste (including
municipal solid waste, abattoir waste) and Hydro‐power.
72

The sugar industry is a unique position to generate power from bagasse and as a results their plants
are running from own production, and the forestry industry is running from biomass and therefore
the tariff issue needs to be sorted out by NERSA so that the independent power producers can
produce for the Eskom grid.
The work on Bio‐fuels in the Province has already set the scene for extensive research for other
sources of renewable energy.
Due to the green economy being a new sector, the MEGDP will incorporate relevant projects over
the next ten years. The starting point will be to develop an integrated Clean and Green
Development Strategy, which will be anchored around job creation. The green strategy will assist
the Province to determine its existing baseline with regards to the seven green sectors and the most
feasible green projects given Mpumalanga’s climate and developmental needs.
The province will develop the following integrated green sector profiles:
Figure 21: Seven Integrated Green Sectors
73

Given the Province’s comparative and competitive advantages in different sectors identified in this MEGDP, the green economy will be mainstreamed to ensure that economic growth is sustainable; creates ‘green’ jobs and reduces the emission of green house gases.
4.3.3.2 Information, Communication and Technology (ICT)
The South African government has noted the potential to leverage Information and Communications
Technologies (ICTs) to facilitate and promote growth in the economy and the country. The
Mpumalanga Provincial Government (MPG) acknowledges that there is a worldwide shift from a
natural‐resource based economy to innovation and the knowledge Economy and that ICTs are a
powerful enabler that, if correctly harnessed and deployed, can result in the development of many
sectors in the Province.
The era of the information revolution necessitates that the Mpumalanga Provincial Government
should take advantage of technology in the design of its programmes and this will result in
significant improvements in business opportunities, household income, quality of life, time saving as
well as general access to sources of information and knowledge.
Constraints to be addressed
The ICT sector in Mpumalanga has seen slow growth over the years due to a number of factors
which include a combination of the following:
• The lack of a more competitive telecommunications landscape that offers reduced, competitive
pricing to consumers
• The lack of ICT skills development in the province
• Access to ICT infrastructure
Key areas for intervention to facilitate growth and job creation in the green economy and ICT
include:
• Invest in research for new technologies to promote green economy
• Invest in infrastructure for ICT development
• Train and assist SMME’s to provide them with the necessary tools for moving their businesses
on‐line
4.3.4 Investing in Social Capital & the Public Service
The Mpumalanga provincial government will invest in social capital in a manner that promotes social
cohesion. The social economy is expected to create jobs in the province and this sector need to be
encouraged to grow. The social economy includes myriad not‐for‐profit institutions that provide
goods and services, including coops, non‐governmental organisations (NGOs), burial societies,
74
stokvels as well as sports and cultural activities. The growth path for South Africa spell it out clear
that government will have to support the social economy initiatives and that would include
assistance with marketing, bookkeeping, technological and financial services and training and the
Mpumalanga government will also promote all activities that support the social economy.
The Mpumalanga provincial government will ensure a stable public service that is equipped towards
the delivery of a developmental state agenda. The public service is also expected to create job
opportunities especially in health and education (i.e. SMME’s including cooperatives to supply food
and linen in hospitals and schools) as well as substantial opportunities through public employment
schemes. Jobs will be created through paving of streets, construction of houses for human
settlements as well as the maintenance of infrastructure in the province.
The government will promote community‐led development in its quest to invest in social capital. Any
development initiative in the province should adhere to the principle of communities deciding their
developmental agenda as opposed to government deciding for communities. The role of the
government of Mpumalanga will be to play a facilitation role when it comes to community
development. The government will support communities to turn ideas into bankable business plans
and for funding. The province will put in place an incentive programme designed to ensure private
sector participate in community economic initiatives.
Key to government quest for investing in the social capital is capacity building which is anchored on
training and Basic Education with firm foundation on values, numeracy and literacy, building a
critical mass of skills, entrepreneurial skills development. These elements are critical for the social
economy and further programmes to expose young people to work experience through internships
in the private and public sectors will be undertaken. The efforts to fight and management of HIV and
AIDS, TB and other diseases will be intensified.
4.3.5 Spatial Development
4.3.5.1 Rural Development
Mpumalanga is a rural Province. The majority of the people who live in rural areas are very poor. The
unemployment level is very high and most of the people are illiterate. Access to basic services is still
a huge challenge. The income levels are also low since most of them rely on government grants and
remittance from those working at urban areas. Government has placed rural development as one of
its key priorities. The Comprehensive Rural Development Programme is a tool that government is
utilising to intervene in rural areas.
75
While this programme is meant to improve the lives of the people, it has also a huge potential for
economic growth and job creation, especially in the area of infrastructure development (both
economic and social infrastructure).
This programme will be utilised largely to bring the 620 000 individuals above the poverty line in the
next ten years. The province will undertake the following:
• Build infrastructure and linkages of small industrial activities in the rural nodes to the closest
established Economic Clusters
• Special incentives to business for investment in rural areas
• Harmonised Spatial Development Frameworks (SDF’s) of Municipalities to Provincial Integrated
Spatial Framework (ISF).
4.3.5.2 Regional and international cooperation
The proximity of Mozambique, Swaziland and other SADC countries, including the memoranda of
understanding signed with a number of overseas countries, provides Mpumalanga with trade,
investment and tourism opportunities. With regard to our neighbouring countries, road, rail and air
infrastructure is key in terms of facilitating trade and other economic opportunities. The province
will focus in the region, Africa and overseas countries for trade and investment. The province will
further investigate and position itself to benefit from the admission of South Africa to BRIC block the
Oceania and other blocks that provides an opportunity for Mpumalanga to expand her trade
footprint.
76
5. STRATEGIC INTERVENTIONS
5.1 Principles for unlocking growth and employment
The following principles provide guidance on mechanisms that will contribute to unlocking the
economic growth and employment potential inherent in our key sectors as follows:
5.1.1 Broad Based Black Economic Empowerment (BBBEE)
The Mpumalanga provincial government will cultivate aggressive Empowerment drives on means of
ownership, production & management through undertaking policy reviews as economic
empowerment policies seem to have a flaw as they are not legally binding. The government through
policy instruments will look at ways of enforcing economic empowerment policies that will ensure
compliance. The Mpumalanga provincial government in collaboration with private sector through
vigorous engagements will agree on transformation targets for local people. The private sector
during the consultative process committed to dealing with the issues of ownership and employment
equity in their respective spaces.
The provincial government working closely with national government will participate in the social
labour plans for the mines as they are not currently being followed up and the province has little say
in this issue to ensure people where mines are operating benefit.
5.1.2 Strategic Procurement
The government, led by the provincial treasury, will revise procurement policies emanating from the
reformed PPPFA. The procurement subject is at the core of ensuring an inclusive and Shared Growth
of the Economy. Other measures would include ensuring that provincial procurement policies
compel government to procure goods and a service from “local” SMME’s including Cooperatives as a
priority. Payment for services procured will be processed in a period of between 14 to 30 days. The
government through the consultation process of the MEGDP has engaged industry on Procurement
plans for the private sector to ensure procurement practices that benefits SMMEs and cooperatives,
and this campaign will be ongoing. Companies asserted that they were willing to commit to
procurement from local (provincial) suppliers and assist in developing supplier industry.
In the light of issues raised around procurement during the consultations including that local
SMME’s and Cooperatives in the province are unable to supply products needed by industry,
government and big business will finalize a strategy on targeted procurement to benefit local
business. The province will develop a shared database, which will ensure that service providers have
one registration point and this will ensure spreading of business opportunities. The province will
77
finalise the cooperatives procurement policy linked to PPPFA which set a target of 30% of total
procurement to be from cooperatives in the province by 2020.
5.1.3 Labour and Skills Development
The work on the MEGDP reveal that the majority of the population of Mpumalanga is the youth
which of course confirm that the province has a sizable labour pool, however the challenge is the
skills factor. The province will undertake a drive to skill this pool through reviving the FTE colleges
and reform their curriculum to respond to the needs of the economy. Province will also work closely
with the private sector in skilling this pool and some of the measures will include utilising industry’s
facilities as such offers were made by industry during consultation processes(sugar and mining
industries availed facilities to collaborate with government). The university, tertiary hospital,
colleges of agriculture, restructured MRTT all provide opportunities for skills development. The
province in its quest to gradually shift towards the knowledge economy will become an exporter of
skills in the future (long term).
The province will also work out incentive packages for companies operating in the province and
those that seek to invest in Mpumalanga that employ/absorb/skill the local labour pool particularly
youth and women. The province will ensure that skilled labour is available working together with
industry. The following are some of the sector specific HRD opportunities identified in the province,
Agro ‐ processing, Agro ‐ products, Infrastructure Development, wood products, Tourism, SMME arts
and crafts, Services (e.g., wholesale, banking, insurance, security, repair and maintenance, etc.),
Stainless steel, Chemical and chemical products, Water reclamation environmental rehabilitation,
animal /crop science and further opportunities include:
• The availability of SETA funding to drive skills development in the province e.g. through
learnerships. Both the funding for capacity building and the required legislative framework
exist;
• Introduction of a Provincial Institute for Higher Education (PIHE) or university in the province;
and
• Implementation of the HRD strategy to create the basis for coordinated, integrated and
sustainable HRD planning in the province.
• Deployment to rural areas for pre‐determined professions upon completion of training
The Province will position itself to benefit from these opportunities by implementing key skills
development programmes around these areas. The HRD strategy takes into account these strategic
demands and shapes the HRD model that best suites these demands. In addition, the National Skills
Fund, (NSF), Innovation Fund (NRF), and SETA project funding initiatives are human resource
development funding windows that have been identified and require equal levels of coherency,
78
focus and provincial coordination in order to maximise the gains for the province: The provincial
human resource strategy will define scope for skills development.
5.1.4 Inclusive and Shared Growth of the Economy
Province will pay more focus on Reducing the cost and ease of doing business).The province, the
municipalities in particular will proactively seek to acquire strategic land and rezone it as a tool to
foster economic development. Key also on the agenda the province will address the turnaround time
for business application processing by introducing 1‐stop processing centre for business as a central
point for acquiring business rights. Province will undertake a drive to align by‐laws for all
municipalities which will foster standardization and its key for attracting investments (eliminate
different requirement in different municipalities).
The government will promote initiatives that are geared towards increasing competiveness to create
a conducive business environment and attracting more businesses to operate in Mpumalanga by
putting in place the following fundamentals:
• Offer business incentives (municipalities will play a key role in reducing electricity tariffs, rates
charges, etc
• Finalize investment framework/strategy for Mpumalanga
• Need to spread government opportunities
• Government to provide base funding (Development fund establishment)
• Develop SME’s policies and provide support, mentoring and aftercare for SME’s by funding
providers
• Good governance practices
• Investments in infrastructure
5.1.5 Cooperatives
Cooperatives in South Africa have been viewed as a vehicle for large‐scale labour absorption.
Although the potential for cooperatives is great, their experiences have been challenging. Taking the
lowest figure (906,739), cooperatives account for 0.29% of total business development and
contribute 0.33% to the gross domestic product (GDP) in South Africa (dti 2009: 42), and the
employment of only 37,638 people (dti 2009:58). Despite the potential inherent in cooperatives the
focus from national government that they currently enjoy, they are in reality still making an
extremely small contribution to economic growth and employment when compared with the
informal sector of micro businesses in South Africa.
79
The revised draft Cooperatives Development Strategy suggests the following approach to supporting
the cooperative sector:
• Focus on increasing the survival rate: support existing co‐operatives and rehabilitate ailing ones
rather than establishing new co‐operatives.
• Provide front‐loaded technical support via a dedicated co‐operatives unit in DEDET
• Facilitate business linkages with the Private Sector
• Implement effective monitoring systems in order to better understand the causes for failure and
inform interventions that directly address these issues.
The province will explore possibilities of establishing a Cooperatives Bank that will be linked to the
Mpumalanga Economic Growth Agency (MEGA) and this will ensure access to funding by
cooperatives which is one of the major challenges. The government will appoint sector specific
mentors who will provide technical assistance to the cooperatives so as to sustain their businesses.
Cooperatives specialists from other countries where cooperative movements are making strides
(India, Indonesia, and Thailand etc) will be invited to come to the province and share their
experiences in growing the sector.
In the view that agriculture is an important sector of our economy which has been showing a decline
in recent years, the province will consider appointing an agriculture cooperative specialist, to
specifically look at cooperatives in the agriculture sector .The province will undertake initiatives to
mobilize primary cooperatives in conjunction with Department of Agriculture Rural Development
and Land Administration (DARDLA). In benchmarking from other countries that are successful in the
area of cooperatives, the province will explore possibilities to establish a cooperatives college
offering diplomas, this college can have a service level Agreement with an established University for
quality delivery of cooperatives training programme. The province will pay a special focus on
initiatives that promotes youth and women cooperatives.
Provincial Co‐operatives Strategy defines scope for co‐operatives development.
5.1.6 Small Micro Enterprises (SME’s)
SMEs nationally, as well as in the province, have suffered a series of challenges, which are well
documented. Based on data from ASEAN’s Secretariat data, SMEs generate between 50 percent and
95 percent of employment, make up 30 percent to 53 percent of the total GDP, and 19 to 31 percent
of total exports in ASEAN. SMEs can play an important role in South Africa judging by what is
happening in other parts of the world, including countries such as Thailand, Singapore, and
Indonesia etc. SMEs have also been proven to be resilient and dynamic. Mpumalanga will invite
SMME specialists from these countries to work with the province.
80

Mpumalanga will build a parallel SMME & cooperatives based second economy in support of this
growth path. The government of Mpumalanga will focus on lowering the costs of doing business for
SMME’s in the province, as high costs of doing business result to the failure of their businesses.
Government will ensure that a range of support mechanism are available including start‐ups and will
further ensure that existing SMME’s take advantage of identified business opportunities in identified
sectors. Government will facilitate collaborative action to enhance small business competitiveness,
through ensuring certain enablers are in place such as affirmative procurement led by government
and linkage to supplier industry for infrastructure. The current incubation period for SMME’s by
government agencies that provide this kind of service is shorter and produces SMME’s that are not
ready and therefore government will explore possibilities to prolong incubation periods to at least
5years. The Provincial SMME Strategy will define strategy for SMME development.
5.1.7 Finance and Funding
If we are to proceed that the Mpumalanga Economic Growth Path consists of the Province’s capital
infrastructure which is providing the basis for economic, social and environmental development,
then it is essential to have adequate funding available. It is also a fact that government alone is not
able to provide such funding and it is therefore necessary to involve private sector to broaden the
sources of development funding through various models.
It will be important however to have properly identified, viable and bankable projects packaged.
Funding models are to act as guidelines for different development projects on how to source
financing for the implementation and maintenance of such projects. Funding models are not
universal since the implementation environment of individual projects may differ, thus requiring
adjustment to different models. In summary, the above principles focus on job creation will have to
be aggressively pursued and emphasizes on the following:
• Investment in youth programmes to deal with high unemployment among the youth.
• The rollout of the EPWP 2 with support for emergence of self supporting enterprises.
• Sustained support for SMME’s and Cooperatives in selected and prioritized sectors.
• Industry diversification.
• Increased labour and regulatory efficiency. This will require up‐skilling of workers and significant
increase in productivity ratio. Government employees need to set example.
81

5.2 High level interventions for the Growth Path to work
In consultation with stakeholders on the MEDGP, the key interventions which were emphasised that
province need to focus on in order to give effect to the Growth Path include the following:
5.2.1 Land Claims
This issue featured prominently and stakeholders asserted that there was little or no progress in
settling land claims which also has an impact on their plans. This issue was cited to be at the core of
development and needed to be resolved urgently.
5.2.2 Water Allocation
This issue also featured significantly in most engagements and it was recommended that
government need to relook water licensing as there are glaring inconsistencies /restrictions in
relation to water allocation.
5.2.3 Transport and Logistics
Almost all stakeholders cited this issue to be a major challenge and they all registered that the
transportation costs take a significant portion of their budgets. Higher costs of tires, fuel and the
state of roads was a high concern and government is urged to revitalise and expand the rail network
to deal with this challenge.
5.2.4 Electricity
While other companies especially in the forestry and the sugar industry produce their own electricity
and they serve enormous cost on electricity charges, most companies rely on the Eskom supply
which tariffs were said to be extremely high by a sizable proportion of the stakeholders and
requested government to intervene.
5.2.5 Policy & Regulations
Some government policies were said to be ambiguous and unworkable in certain instances and
recommended a clear policy on allocation of land for agriculture and mining activities, water rights,
and clear policy stance on nationalisation as mixed messages causes uncertainty in the mining
industry and affecting ability to make decisions on long term investments. Resituated land not being
used correctly was another issue that was raised. There was a proposal for the Provincial
Development Council (PDC) as part of the institutional arrangements.
5.2.6 Communication
To clear mistrust between stakeholders it was registered that there was a need for more regular
engagements (through sector forums) to build trust between government, business and labour.
82
5.3 Sustainability of the Mpumalanga Economic Growth and Development Path (MEGDP)
For the MEGDP to realise its objectives, it has to be supported by the following plans:
5.3.1 Provincial Spatial Development Plan
In relation to the economy of space, the province will finalise the review of the provincial spatial Development Plan. This plan will guide future development in the province and remedy previous spatial patterns propagated by the apartheid government which alienated certain population groups from areas that are economic viable and has economic activity.
5.3.2 Provincial Infrastructure Development Plan
The Plan is designed to reduce uncertainty for businesses by outlining the Government's intentions for infrastructure development over the long term. The Plan will be directional and directive, that is, it will provides a framework for infrastructure development as well as a programme of action with a detailed list of projects.
The Plan will set out a vision that by 2020 Mpumalanga’s infrastructure is resilient, coordinated and contributes to economic growth and increased quality of life. This plan is premised on improved performance of infrastructure which in turn would accelerate economic performance. The province will ensure linkage and alignment to the revenue envelope to ensure and eradicate “wish lists” and to make a visible difference in infrastructure.
5.3.3 Provincial Industrial Plan (IPAP 2 as a strategy)
The Mpumalanga industrial plan will be aligned to the IPAP 2 and a deliberate government effort to alter the structure and distribution of industrial activity to promote economic growth and development as well as job creation. Within this context, the Provincial Industrial Development Strategy provides a framework for state‐led plans and interventions designed to build the productive capability to place the province on a more equitable and labour absorptive growth trajectory.
5.3.4 Provincial Water Management Plan
The province views water as a strategic resource, which no economic activity can take place in the Mpumalanga without. The province will work closely with the Department of Water Affairs in developing the plan.
The Provincial comprehensive water management plan will contain water management programs that will prioritise water conservation and identify water conservation opportunities. The plan will include clear information on water uses and allocation in the province, current water consumption and its costs and future allocation of water to improve economic growth.
5.3.5 Energy Distribution Plan
The Country‘s energy plan includes work on the country's electricity distribution structure, and the fast‐tracking of electricity projects by independent power producers. Mpumalanga’s energy plan will prioritise working closely with the sugar industry on baggase, the forestry industry on biomass, Hydro and other forms of energy sources to supplement the Eskom grid as electricity is key for economic activity particularly industrialisation.
83

5.3.6 Provincial Skills Development Plan
Skills development is a major prerequisite for the economy, to this end the Province will develop and improve the skills of the Mpumalanga workforce (skills needs of industry / economic sectors) through a provincial skills development plan which will identify the scarce skills requirement for the province and advance measures to breed those skills working hand in hand with industry. The skills development plan will be centered on sustainable human development paying special focus on the following:
• Basic Education with firm foundation on values, numeracy and literacy
• Building a critical mass of skills
• Entrepreneurial skills development
• Trade skills and higher level skills development for industry needs o Emphasize skills development and certified training (work with industry to mentor & match
skills with economy requirements)
5.3.7 Environmental Plan
The province is taking an approach of paying attention to development that does not compromise the environment which has an impact on future generations. The Environmental plan will advance measures that seek to protect the environment.
The province will finalise an environmental plan which will respond to the loss of biodiversity which the province is currently faced with. The plan will focus on biodiversity conservation in the province by ensuring all practices whether by government or private sector/ industry takes into account the conservation of biodiversity.
5.4 Institutional Arrangements
The recent Outcome‐Based Approach introduced by government provides institutional arrangement adequate enough to support the implementation of the MEGDP. The Implementation Fora, as indicated by the Approach, provide the necessary platform for consultation and joint decision making on issues that affect all stakeholders. The Implementation Fora that deal with economic issues and led by the different Members of the Executive Committee will be responsible for driving the economic development agenda of the Province. Government will set up sector forums that will follow up with stakeholders on regular basis as this emerged during the consultations on the MEGDP.
5.5 Monitoring and Evaluation
The Office of the Premier will be responsible for the Monitoring and Evaluation of the implementation of the MEGDP. However, it will be working together with Departments, municipalities, private sector, labour and communities in the monitoring of the implementation plans related to this growth path.
84
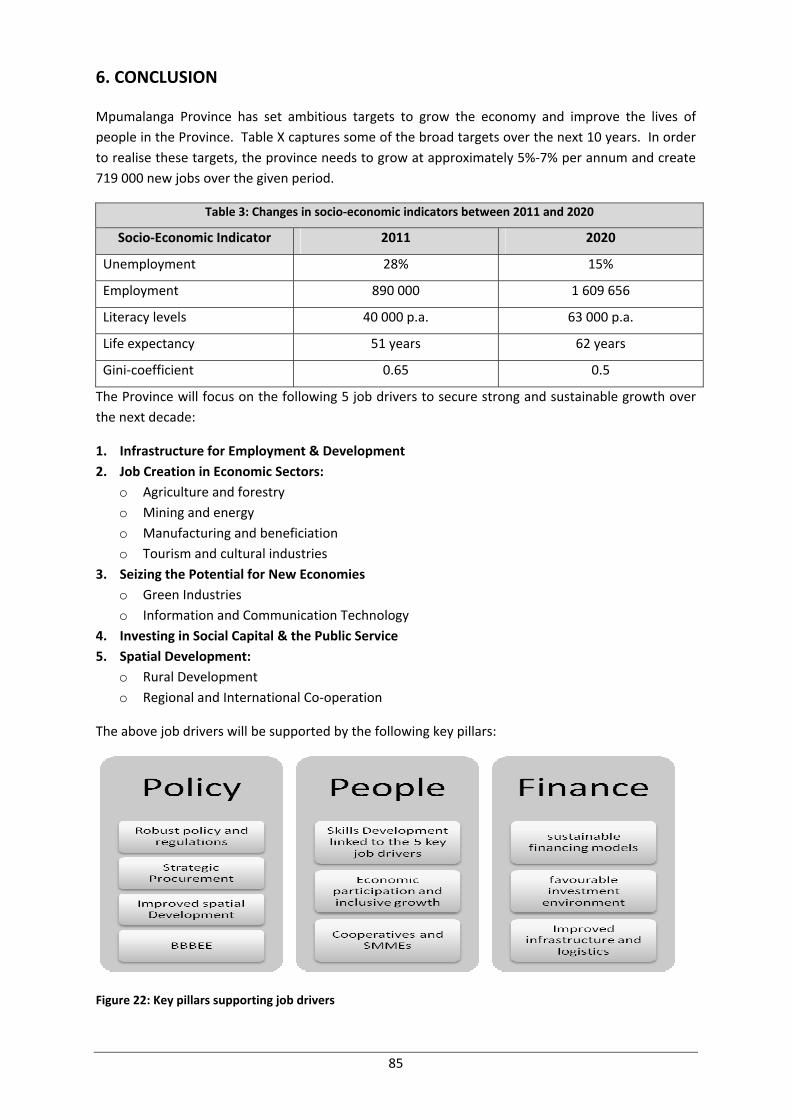
6. CONCLUSION
Mpumalanga Province has set ambitious targets to grow the economy and improve the lives of people in the Province. Table X captures some of the broad targets over the next 10 years. In order to realise these targets, the province needs to grow at approximately 5%‐7% per annum and create 719 000 new jobs over the given period.
Table 3: Changes in socio‐economic indicators between 2011 and 2020
Socio‐Economic Indicator 2011 2020
Unemployment 28% 15%
Employment 890 000 1 609 656
Literacy levels 40 000 p.a. 63 000 p.a.
Life expectancy 51 years 62 years
Gini‐coefficient 0.65 0.5
The Province will focus on the following 5 job drivers to secure strong and sustainable growth over the next decade:
1. Infrastructure for Employment & Development 2. Job Creation in Economic Sectors:
o Agriculture and forestry o Mining and energy o Manufacturing and beneficiation o Tourism and cultural industries
3. Seizing the Potential for New Economies o Green Industries o Information and Communication Technology
4. Investing in Social Capital & the Public Service 5. Spatial Development:
o Rural Development o Regional and International Co‐operation
The above job drivers will be supported by the following key pillars:
Figure 22: Key pillars supporting job drivers
85

The Mpumalanga Economic Growth and Development Path is a dynamic ‘living’ document which will evolve over the next 10 years as the Provincial economy develops. Key opportunities which are aligned to the Province’s strategic objectives but are not currently captured will be incorporated into the MEGDP over time. The MEGDP will be carefully monitored and evaluated in a systematic manner over the given period to measure progress in the identified job drivers as well as to refine the Growth Path over time.
86
7. REFERENCES
Bureau for Market Research (BMR). 2009.
Department of Economic Development. 2010. The New Growth Path: The Framework. Pretoria.
Department of Finance. 2009. Socio‐Economic Review and Outlook of Mpumalanga. Mpumalanga Province.
Department of Finance. 2010. Socio‐Economic Review and Outlook of Mpumalanga. Mpumalanga Province.
Department of Trade and Industry (DTI), 2007. National Industrial Policy Framework. The DTI. Pretoria. 2007.
Department of Trade and Industry (DTI), 2010. Economic Sectors and Employment Cluster. 2010/11 ‐ 2012/13 Industrial Policy Action Plan. The DTI. Pretoria. February 2010.
Department of Trade and Industry (DTI), 2011. Industrial Policy Action Plan 2011/12‐2013/14. Economic Sectors and Employment Cluster: February 2011.
Department of Trade and Industry (DTI). 2006. Regional Industrial Development Strategy. Pretoria.
Global Insight ‐ Regional Explorer, 2010.
Mpumalanga Department of Economic Development, Environment and Tourism (DEDET), 2009. Mpumalanga Final Draft BBBEE Strategy. 2009.
Mpumalanga Department of Economic Development, Environment and Tourism (DEDET), 2009. Mpumalanga Final Draft Co‐operatives Strategy. 2009.
Mpumalanga Department of Economic Development, Environment and Tourism (DEDET), 2009. Mpumalanga Final Draft SMME Development Strategy. 2009.
Mpumalanga Provincial Government, 2008. Final Draft Provincial Economic Development Strategy: A Strategy for Globally Competitive Provincial Economy. Mpumalanga Province. 2008.
Mpumalanga Provincial Government. 2004‐2014. Provincial Growth and Development Strategy, 2004‐2014 (2008 Review). Mpumalanga Province
Mpumalanga Provincial Government. 2009. Draft Information and Communication Technology Strategy. Mpumalanga Province.
Mpumalanga Provincial Government. 2010. Draft Forestry Development Strategy. Mpumalanga Province.
Mpumalanga Provincial Government. 2009. Draft Mineral Development Strategy. Mpumalanga Province.
Mpumalanga Tourism and Parks Agency. 2007. Mpumalanga Tourism Growth Strategy. Mpumalanga Province.
Quantec EasyData. 2009 & 2010. Pretoria.
87

Statistics South Africa. 2010. Quarterly Labour Force Survey, Q1 2010, Statistics South Africa. Pretoria.
Statistics South Africa. 2010. Statistics South Africa‐Mid Year Population Estimates 2010. Pretoria.
The Presidency. 2010. The Development Indicators, 2010. Pretoria.
88