the national academies of sciences, engineering, and ...nas-sites.org › revellelecture › files...
TRANSCRIPT
XVIII / ROGER REVELLE COMMEMORATIVE LECTURE PRESENTED BY THE OCEAN STUDIES BOARD
T H E N A T I O N A L A C A D E M I E S O F S C I E N C E S , E N G I N E E R I N G , A N D M E D I C I N E
‘‘here be monsters’’
FEATURED SPEAKER Dr. Dawn WrightENVIRONMENTAL SYSTEMS RESEARCH INSTITUTE (Esri) AND OREGON STATE UNIVERSITY

32

W W W . N A T I O N A L - A C A D E M I E S . O R G
32
The National Academy of Engineering was estab-lished in 1964 under the charter of the National Academy of Sciences to bring the practices of engi-neering to advising the nation. Members are elected by their peers for extraordinary contributions to en-gineering. Dr. C. D. Mote, Jr., is president.
The National Academy of Medicine (formerly the Institute of Medicine) was established in 1970 under the charter of the National Academy of Sci-ences to advise the nation on medical and health issues. Members are elected by their peers for dis-
tinguished contributions to medicine and health. Dr. Victor J. Dzau is president.
The three Academies work together as the Nation-al Academies of Sciences, Engineering, and Medicine to provide independent, objective analysis and advice to the nation and conduct other activities to solve complex problems and inform public policy deci-sions. The National Academies also encourage educa-tion and research, recognize outstanding contributions to knowledge, and increase public understanding in matters of science, engineering, and medicine.
The National Academy of Sciences was established in 1863 by an Act of Congress, signed by President Lincoln, as a private, nongovernmental institution
to advise the nation on issues related to science and tech-nology. Members are elected by their peers for outstanding contributions to research. Dr. Marcia K. McNutt is president.
The National Academy of Sciences

ROGER REVELLEFor almost half a century, Roger Revelle was a leader in the field of oceanography. Revelle trained as a geologist at Pomona College and the University of California, Berkeley. In 1936, he received his Ph.D. in ocean-ography from the University of California, Berke-ley. As a young naval officer, he helped persuade the Navy to create the Office of Naval Research (ONR) to support basic research in oceanogra-phy and was the first head of ONR’s geophysics branch. Revelle served for 12 years as the Direc-tor of Scripps (1950–1961, 1963–1964), where he built up a fleet of research ships and initiated a decade of expeditions to the deep Pacific that chal-lenged existing geological theory.
Revelle’s early work on the carbon cycle sug-gested that the sea could not absorb all the carbon dioxide released from burning fossil fuels. He or-ganized the first continual measurement of atmo-spheric carbon dioxide, an effort led by Charles
Keeling, resulting in a long-term record that has been essential to current research on global climate change. With Hans
Suess, he published the seminal paper demonstrating the connection between in-
creasing atmospheric carbon dioxide and burning of fossil fuels. Revelle kept the issue of increas-ing carbon dioxide levels before the public and spearheaded efforts to investigate the mechanisms and consequences of climate change. Revelle left Scripps for critical posts as Science Advisor to the Department of the Interior (1961–1963) and as the first Director of the Center for Population Studies at Harvard (1964–1976). Revelle applied his knowl-edge of geophysics, ocean resources, and popula-tion dynamics to the world’s most vexing prob-lems: poverty, malnutrition, security, and education.
In 1957, Revelle became a member of the Na-tional Academy of Sciences to which he devoted many hours of volunteer service. He served as a member of the Ocean Studies Board, the Board
2016 OCEAN STUDIES BOARD MEMBERS Larry A. Mayer, Chair, University of New Hampshire, Durham | E. Virginia Armbrust, University of Washington, Seattle | Kevin R. Arrigo, Stanford University, California | Claudia Benitez-Nelson, University of South Carolina, Columbia | Rita R. Colwell, University of Maryland, College Park | Sarah W. Cooksey, State of Delaware, Dover | James A. Estes, University of California, Santa Cruz | David Halpern, Jet Propulsion Laboratory, Pasadena, California | Patrick Heimbach, University of Texas, Austin | Susan E. Humphris, Woods Hole Oceanographic Institution, Woods Hole, Massachusetts | Bonnie J. McCay, Rutgers University, New Brunswick, New Jersey | S. Bradley Moran, University of Alaska, Fairbanks | Steven A. Murawski, University of South Florida, St. Petersburg | John A. Orcutt, Scripps
On behalf of the Ocean Studies Board at the National Acad-emies of Sciences, Engineering, and Medicine, we would like to welcome you to the Eighteenth Annual Roger Revelle Com-memorative Lecture. This lecture was created by the Ocean Studies Board in honor of Dr. Roger Revelle to highlight the important links between the ocean sciences and public policy.
54
Dear Lecture Participant:

on Atmospheric Sciences and Climate, and many committees. He also chaired a number of influen-tial Academy studies on subjects ranging from the environmental effects of radiation to understanding sea-level change.
SMITHSONIAN’S NATIONAL MUSEUM OF NATURAL HISTORY The Ocean Studies Board is pleased to have the opportunity to present the Revelle Lecture in co-operation with the Smithsonian National Museum of Natural History through our partnership with the Smithsonian Science Education Center. The museum maintains and preserves the world’s most extensive collection of natural history specimens and human artifacts and supports scientific re-search, educational programs, and exhibitions. The museum is part of the Smithsonian Institution, the world’s largest museum and research complex. Dr. Kirk R. Johnson is the director.
The Smithsonian Science Education Center (SSEC) was founded in 1985 by the National Acad-emy of Sciences and the Smithsonian Institution and continues today as a successful unit of the Smithso-nian Institution. The mission of the SSEC is to de-velop STEM literate students from early childhood through the workplace. The SSEC does this through the implementation of a truly systemic approach that engages participants at every level, from students and classroom teachers up through the highest levels of district, state, national and international leadership.
TONIGHT’S LECTUREIn her lecture this evening, Dr. Dawn Wright,
Chief Scientist of the Environmental Systems Re-search Institute (Esri), will provide a brief history
of how the ocean has been mapped with ships, satellites, and intuition. In her lecture, Dr. Wright will also explain how modern-day mapping sys-tems have become increasingly intelligent. These systems are changing what we measure, how we analyze, what predictions we make, how we plan and regulate, how we design, how we evaluate and ultimately how we manage it all. And yet there re-main compelling challenges in coping with both the overabundance and paucity of data in the ocean, its multidimensionality, and how to make it accessible to the myriad audiences in great need of it.
SPONSORSHIPThe Ocean Studies Board thanks the National Oce-anic and Atmospheric Administration, the National Science Foundation, the National Aeronautics and Space Administration, the Office of Naval Re-search, and the U.S. Geological Survey. This lecture series would not be possible without their gener-ous support. The Board also extends gratitude to the Smithsonian Science Education Center and the Smithsonian Institution for their continued partner-ship in hosting the lecture at the National Museum of Natural History.
We hope you enjoy tonight’s event.
Institution of Oceanography, La Jolla, California | H. Tuba Özkan-Haller, Oregon State University, Corvallis | Martin D. Smith, Duke University, Durham, North Carolina | Margaret Spring, Monterey Bay Aquarium, Monterey, California | Don Walsh, International Maritime Incorporated, Myrtle Point, Oregon | Douglas Wartzok, Florida International University, Miami | Lisa D. White, University of California, Berkeley and San Francisco State University | Robert S. Winokur, Michigan Tech Research Institute, Silver Spring, Maryland / OSB STAFF MEMBERS | Susan Roberts, Director | Stacee Karras, Program Officer | Emily Twigg, Associate Program Officer | Pamela Lewis, Administrative Coordinator | Allie Phillips, Program Assistant | Shubha Banskota, Financial Associate | James Heiss, Postdoctoral Fellow
Larry Mayer, CHAIR, OCEAN STUDIES BOARD
Susan Roberts, DIRECTOR, OCEAN STUDIES BOARD
54

76

76
Dawn’s research interests include geographic in-formation science; ocean informatics and cyber-infrastructure; benthic terrain and habitat charac-terization; and the processing and interpretation of high-resolution bathymetry, video, and underwa-ter photographic images. She has authored or co-authored more than 150 articles and 10 books on marine GIS, hydrothermal activity and tectonics of mid-ocean ridges, and marine data modeling. Dawn has participated in over 20 oceanographic research expeditions worldwide, including 10 legs of the Ocean Drilling Program, three dives in the deep submergence vehicle Alvin and two dives in Pisces V. Her fieldwork has taken her to some of the most geologically active regions of the planet, including the East Pacific Rise, the Mid-Atlantic Ridge, the Juan de Fuca Ridge, the Tonga Trench, and volca-noes under the Japan Sea and the Indian Ocean.
Dawn’s recent advisory board service includes the Science Advisory Boards of NOAA and the EPA, the Science Advisory Council of Conserva-
tion International, the Blue Ribbon Panel of the Global Partnership for Oceans, and many journal editorial boards. She served on the U.S. National Academy of Sciences Ocean Studies Board from 2007-2013. Dawn was the recipient of an NSF Ear-ly Career Award in 1995, was awarded a Fulbright to Ireland in 2004, the OSU Milton Harris Award for Excellence in Basic Research in 2005, and elected a Fellow National to the Explorers Club in 2013. In 2007 the Council for Advancement and Support of Education (CASE) and the Carn-egie Foundation for the Advancement of Teach-ing named her Oregon Professor of the Year. She is also a Fellow of the AAAS and the Geological Society of America, as well as a fellow of Stanford University’s Leopold Leadership Program. Dawn holds an Individual Interdisciplinary Ph.D. in Physical Geography and Marine Geology from the University of California, Santa Barbara, an M.S. in Oceanography from Texas A&M, and a B.S. cum laude in Geology from Wheaton College (Illinois).
In October 2011 Dr. Dawn Wright was appointed Chief Scientist of the Environmental Systems Research Institute (aka “Esri”), a world-leading geographic information system (GIS) soft-
ware, research and development company, after 17 years as a professor of geography and oceanography at Oregon State University. As chief scientist of Esri, Dawn works directly with the CEO on strengthening the scientific foundation for Esri software and services, while also rep-resenting Esri to the national and international scientific community. She maintains an affiliated faculty appointment within the College of Earth, Ocean, and Atmospheric Sciences at Oregon State University.
Dr. Dawn Wright

98
A Brief History of Mapping in the Ocean
Scientists aboard the HMS Challenger (during a global ex-pedition from 1872-1876 that laid the foundation for modern oceanography), conducted the first systematic survey of the ocean floor (aka bathymetric sur-vey), establishing that the global ocean floor was not the flat, fea-tureless plain first hypothesized (Corfield, 2003). The survey was accomplished by leadline, where a large piece lead was lowered to the ocean floor by rope in order to measure the water depth at that location. In the 1920s, the Ger-man ship Meteor conducted the first detailed bathymetric survey
H umankind has been mapping the oceans for hundreds of years, with one of the earliest examples being the “stick charts” comprised of pieces of wood, coco-
nut fronds, and cowrie shells, as devised the ancient Marshall Islanders to navigate their part of the Western Pacific Ocean via canoes (Lewis, 1994; Figure 1). These charts are signifi-cant in the history of cartography because they are the first known representation of ocean swells, including how the is-lands disrupted those wave patterns, and thus provided an aid to navigation (Finney, 1998). This traditional knowledge of the ocean had existed for centuries, but was not described by Western societies until the 1860s (Lewis, 1994; Finney, 1998).
FIGURE 1. A navigational “stick chart” from the Marshall Islands, made of wood, coconut fibers and cowrie shells, with the fibers representing the crests of ocean swells. Chart is on display at the Berkeley Art Museum and Pacific Film Archive, Uni-versity of California, Berkeley. Photo by Jim Heaphy and reproduced under Cre-ative Commons License CC BY-SA 3.0 by Cullen328 via Wikimedia Commons.

98
of the South Atlantic Ocean floor by way of early SONAR (SOund Navigation And Ranging). As the acronym suggests, the depth of the water is determined by emit-ting pulses of sound from an in-strument, listening for the echo, and calculating the depth by way of the pulse’s travel time to its target and back, considering the speed of sound in water in vary-ing salinities, temperatures, and pressures. Fast forward to World War II and the navies of the Unit-ed States, Great Britain, Ger-many, and Japan were leaders in further developing the capabilities of SONAR for knowledge of the enemy, as well as of the ocean.
By the 1950s and 1960s the provision of single, focused, high-frequency, short wavelength sound beams (aka, single beam SONAR) had become an invalu-able tool for mapping not only the ocean floor, but also detecting specific targets within the water column such as marine mammals or large schools of fish. In 1968 (Figure 2), the Austrian landscape panoramist and cartographer Heinrich Berann, working in col-laboration with marine cartog-rapher Marie Tharp and marine geophysicist Bruce Heezen paint-ed the Atlantic Ocean floor, the first in a series of physiographic maps of the ocean floor, a work which culminated in Heezen and Tharp’s famous 1977 World Ocean Floor Panorama. This 1977 map revealed for the first time the globe-encircling mid-
ocean ridge system of volcanoes and earthquakes, as well as a host of other features that turned Earth science on its head. As has been recounted in numerous sources (e.g., Doel et al., 2006; Landa, 2010; North, 2010; Felt, 2012) the early maps of Marie Tharp helped to turn Bruce Heezen away from the expanding Earth hypothesis and correctly toward
the theories of continental drift and plate tectonics. Tharp’s work in particular has been called “one of the most remarkable achieve-ments in modern cartography” (North, 2010; Felt, 2012).
While a leadline approach yielded an estimated 1,000-2,000 soundings per survey, and the single-beam approach, 500,000-700,000, the modern multibeam
FIGURE 2. 1968 map of the Atlantic Ocean Floor based on a large compilation of deep ocean soundings by Bruce Heezen and Marie Tharp, painted by Heinrich Berann, for the National Geographic Magazine. Image courtesy of Ken Field, International Cartographic Association.

1110
systems of the 1970s and 1980s, yielded as many 1 million per survey (Blondel and Murton, 1997). The work of Sandwell et al. (2003) and Smith and Sandwell (1994; 1997) provided yet another significant advance by combining shipboard depth soundings gathered from thou-sands of individual surveys, with estimates of bathymetry derived from the Earth’s gravity field as measured in space by satellite-based altimeters (where mea-surements of the “bumps” in sea surface height are remarkably ac-
curate in mimicking the topogra-phy of large crustal features such as deep ocean trenches, fracture zones, and mountain ranges).
The individual shipboard survey is still at the heart of marine science and marine re-source management because of the superior level of detail that can be acquired. This modern higher-resolution mapping of the oceans is still accomplished with mapping systems located beneath a ship, but may also be linked to underwater video or photography collected from vehicles towed
behind a ship, and further collat-ed to samples and measurements collected from an instrument or vehicle launched away from a ship or operating independently on the ocean floor, as well as to sensors mounted on marine mammals (Wright et al., 2007; Wright 2014; Figure 3). The re-sulting maps continue to reveal the bathymetry of the oceans for science, navigation, finding of lost objects, and pinpointing of hazards due to sea level rise and coastal flooding, but there also maps of the temperature
FIGURE 3. An illustration of the broad variety of the ships, vehicles, platforms, and sensors used now and looking 20 years into the future for understanding how the oceans work, and how we need to manage, and protect it. From National Re-search Council (2011).

1110
and salinity of the ocean water itself that help us track El Niño events and storm systems; the abundance, diversity and over-all health of hundreds of species of ocean life (including those in commercial fisheries); the speed and direction of currents and tsu-namis; and so much more (Na-tional Research Council, 2004; Wright, 2014).
Much of the general public focuses on more traditional uses of ocean maps such as nautical charts that provide aids to navi-gation, tide predictions, and lo-cations of hazards such as shoals and shipwrecks. The mapping of the oceans for science, for sustainability, and for the sci-ence of sustainability requires not only the accurate collection of measurements, but the use of these measurements for analysis, visualization, and policy deci-sion-making. Further, it requires new and different products that are interactive, even immersive, as well as maps incorporating live data streams and numerical models. Ultimately, how do we create maps that make the world a better place by addressing the world’s biggest problems such as conservation, resource manage-ment (including fisheries), pol-lution tracking, disaster aid and relief, climate change mitigation and adaptation, and design of human uses of coastal and deep ocean space to more closely follow natural systems (e.g., McHarg, 1995; Steinitz, 2012)?
New Innovations
Maps have evolved into “intelli-gent web maps” that encapsulate the rich knowledge that used to be embedded only in a desktop geographic information system (GIS), largely disconnected from the web. But now, these maps – and the data from which they are built – commonly reside in Software as a Service (SaaS) infrastructures, aka “the cloud,” creating a veritable data and web services nervous system for the planet. For instance, using only a web browser, the user can choose from data residing on a local ma-chine, but also from any number data services and web mapping services worldwide that are freely available on the Internet. As such, just about anyone can access plat-forms to make maps; to combine their maps with other layers to create new maps; and to share these maps via e-mail, phones, tablets, and similar devices, or to embed them in applications, web sites, or blogs. The maps can be accessed by a variety of free, easy-to-use viewers or open ap-
plication programming interfaces (APIs) that are designed express-ly for the Internet, are scalable, modifiable, and interchangeable between different kinds of soft-ware. This is an evolutionary step in the dissemination and accessibility of oceanographic knowledge and is a key building block for making oceanographic information pervasive and widely accessible to everyone.
These new maps are also smarter because of numerical recipes that will automatically update and provide map symbols of the correct color, size, and style as new data become available. Some map platforms enable the user to view mapped distribu-tions of marine habitats, energy resources, and infrastructure, and then using these as a reference, sketch on the screen the boundar-ies of potential marine protected areas (e.g., Malcolm et al., 2012; White et al., 2012; Collie et al., 2013; Strickland-Munro et al., 2016). The smart map can adjust accordingly, automatically sav-
But what is a ”map” in the modern, 21st century context? It’s no longer just the paper map on one’s wall or in the glove compartment of a
car. Indeed, we now find ourselves inhabiting a “Digi-tal Earth” composed of technologies from satellites to wristwatches that monitor, map, model, and man-age virtually everything around us (Wright, 2015a).

1312
ing this design that can be shared with other stakeholders either in the room or on the Internet, via threaded discussion windows ad-jacent to the mapping interface, hopefully as a step toward shared consensus of the efficacy of this new management area (e.g., Paul et al., 2012; Stelzenmuller et al., 2013).
By linking geographic coor-dinates with extensive databases and sophisticated spatial analysis algorithms in GIS, these maps
do more than feature pushpins, pop-ups, or static lines. As noted by Grenley (2016), “the map of the future is [also] an intelligent image,” with visual and acoustic imagery from ships, satellites, aircraft, and drones at its core, along with strong analytic and modeling features. These smart maps process events through both space and time via statistics and numerical models that are used to predict currents, sea water tem-peratures, salinity, water levels,
sea state, and other parameters in real-time. They can send alerts to desktops or mobile devices if something enters an area of inter-est, and are thus of critical use for storm surge warnings, rescue operations, abatement of marine pollution, ship routing, integrated coastal zone management, ap-proval processes of offshore fa-cilities, or in the design of new marine protected areas. Geospa-tial tools that generate distribu-tive flow lines from one source
FIGURE 4. Visualization of the high volume of commercial shipping activity into and out of ports rimming the Pacific Ocean. Green bars represent shipping traffic of 1 million vessels, yellow 20 million, and red 50 million+. Lengths of bars represent amount of growth to those numbers over a 10-year period. The data were analyzed using an open-source collection of GIS tools for the spatial analysis of big data (https://esri.github.io/gis-tools-for-hadoop/). Visualization by Mansour Raad and Sajit Thomas, Esri. Interactive, online version available at http://coolmaps.esri.com/BigData/ShippingGlobe (best with the Chrome web browser running WebGL).

1312
to many destination points can be used to create “flow maps” that show the movement of goods or people from one place to another. These smart maps are changing what we measure, how we ana-lyze, what predictions we make, how we plan, how we design, how we evaluate and ultimately
how we manage the Earth Sys-tem. As these processes are in-creasingly taking place in the cloud, mapping is becoming more open, without the need for cum-bersome desktop hardware and software with their steep, long learning curves.
To capture the dynamics
of the oceans, it is necessary to move mapping into the realm of the multidimensional, where the two geospatial dimensions of longitude (x) and latitude (y) are combined with a third dimension of depth (z), a fourth dimension of time (t), and/or a fifth dimen-sion, consisting of measurements
FIGURE 5. A map of typhoons in the Western Pacific during the record-breaking typhoon season of 2005, seeking to visualize the life cycle of the event and compare one storm to another to find unique details and overall patterns. 3D symbols depict the unique signature of every storm. This map shows wind speed as cylinder height and barometric pres-sure as cylinder color along with speed of travel, total distance traveled, and storm duration. Visualization by Nathan Shephard, Esri. Interactive, online version available at http://www.esri.com/products/maps-we-love/pacific-typhoons.

15
from a specific ocean instrument or the iterative results of models that may go forward or back-ward in time (Li and Gold, 2004; Wright et al., 2007). Such multi-dimensionality is critical for the mapping of natural phenomena such as currents, tides, shorelines, ice movements, El Niño/La Niña effects, and biotic distributions, as well as anthropogenic features such as navigational obstacles or maritime boundaries that appear and disappear, shipping activity in and out of ports (Figure 4), and much more. The oceans present so many multidimensional chal-lenges, especially because they are very hard to access at full depth from sea surface to sea
floor. Satellites and light detection and ranging (LiDAR) sensors, for example, cannot “see” all the way through the water in all places. As a result, only 8-15% of the oceans are mapped in the same detail as on land (e.g., Wessel and Chan-dler, 2011; Picard et al., 2017; Smith et al., 2017).
There are all manner of amaz-ing three-dimensional (3D) visu-alization and animation tools that heighten our understanding of how the oceans work, as well as how dangerous they can be. Fig-ure 5 shows a new way to visual-ize the major typhoons that raged throughout the Western Pacific in August 2005, along with the variation in their intensity and
thus danger to human life. From a more analytical standpoint, the in-telligence of maps in 3D is allow-ing us to slice our data in both the horizontal and vertical directions, as well as by data values. Thus, we are not just seeing a static im-age, but instead we’re working with an entire database that is as-sociated with each “voxel” (short for volume element, as “pixel” is short for picture element). This allows for powerful spatial analy-sis (for example, k-means statis-tical clustering of point measure-ments in the oceans to identify and map environmentally-distinct 3D regions within the water col-umn – termed “candidate ecosys-tems” by Sayre et al., 2017).
But Here be Monsters: Can we Tame Them?
Despite the growing intelligence of mapping sys-tems, “there be monsters” – the major research challenges that continue to confound us. For
example, how do we best cope with both the over-abundance and the paucity of ocean data (i.e., “big data” and “dark data”), as well as its multidimensional-ity? How do we best address these major issues to cre-ate open and effective access to ocean science that will contribute to the global public good and ultimately to the sustainability of Planet Ocean? How do we increase not only the resilience of communities to climate change but the resilience of digital data and maps that they rely on?
14

15
BIG DATA
We are in an era of regional- to global-scale observation and simulation of the oceans. As an example, from the world of ocean observatories, Figure 3 (NRC, 2011), provides a glimpse of the technology of today, as well as ~20 years into the future. These observatories produce the so-called “big data,” defined in Gantz and Rainsel (2012) as “a new generation of technolo-gies and architectures, designed to economically extract value from very large volumes of a wide variety of data by enabling high-velocity capture, discovery, and/or analysis.” Big data, with its three main characteristics of volume, velocity, and variety, are in turn leading to a new sci-ence that deals with the issues associated with the inundation of data from satellites, sensors, and other measuring systems (Al-der, 2015; Seife, 2015; Wright 2015a). These issues are certain-ly challenging computer science, but they are also squarely in the crosshairs of geographic informa-tion science, geospatial data sci-ence, image science, analytical cartography, and other fields that underlie modern, intelligent map-ping systems. Indeed, the lack of a complete understanding about the nature of data in both space and time (i.e., both velocity and variety) leads to problematic data models, inefficient data struc-tures, and erroneous hypotheses
(Yuan and Hornsby, 2008; Wright and Wang, 2011; Wright, 2015a). And yet a paradigm shift is afoot that is driving an evolution from desktop and server enterprise so-lutions into a Software as a Ser-vice (SaaS) model in the cloud, and mapping applications (espe-cially GIS) are building upon that important shift.
The variety or structural variability of data for and from mapping may be among the most compelling problems for the ocean science and manage-ment communities (e.g., Paolo et al., 2016). Data are coming from multiple sources and types (pho-tos, video, audio, text, scientific observations, scientific models), multiple perspectives (govern-ments, military, industry, non-governmental organizations or NGOs, etc.), which in turn have their various cultures for con-tributing and visualizing data. Although the number and type of ocean mapping applications continue to grow, there still exist overall inconsistencies in ocean data models, formats, standards, tools, services, and terminology.
Tackling these problems has largely been in the realm of aca-demia and federal agencies, but there is a new ocean data indus-try that is evolving to help meet these needs. It is estimated that: (1) 80% of the decision-making processes in ocean science and business depend on data collec-tion, management, processing, and distribution; (2) according-
ly, the data acquisition market is over $80 billion, including ships, buoys, satellites, robots, ship-to-shore communications; and further (3) the data management market is estimated at $5 bil-lion, including software and as-sociated costs (Rainer Sternfeld, PlanetOS, pers. comm., April 23, 2013). As explained in detail in Hoegh-Guldberg et al. (2013), this is fodder for effective pub-lic-private partnerships (PPPs) among academia, government, industry, and NGOs, especially when society is searching for sustainable solutions to multi-tiered environmental challenges.
One such example of a suc-cessful PPP around big data is the Ecological Marine Units (EMU) project officially com-missioned by the Group on Earth Observations (GEO). GEO is an intergovernmental partnership of 101 nations, the European Commission, and 106 organiza-tions collaborating to build the Global Earth Observation Sys-tem of Systems (GEOSS; Group on Earth Observations, 2005 and 2017; Walters and Scholes, 2017). The EMU delineates the oceans into thirty-seven physical-ly- and chemically-distinct volu-metric regions, from the ocean surface all the way down to the ocean floor (Figure 6; Sayre et al., 2017). Additional information such as species abundance, pri-mary productivity, direction and velocity of currents, seafloor geo-morphology, and much more are
14

1716
being digitally attached to these units in the second phase of the project. The aim is to provide sci-entific support for the design of new marine protected areas, for ocean planning and management, and for enabling the understand-ing of impacts to ecosystems from climate change and other disturbances.
This big data project is com-prised of an unprecedented set of 52 million data points, set in a mapping coordinate system, and having been collected over a 50-year period as derived from NO-AA’s World Ocean Atlas (Garcia et al., 2013; Locarmini et al., 2013; Zweng et al., 2013; Garcia et al., 2014).
OPEN SCIENCE
As compelling as big data (and small data) are, there is also the challenge of “dark data.” As apt-ly stated by Mascarelli (2009): “More and more often these days, a research project’s success is measured not just by the pub-lications it produces, but also by the data it makes available to the wider community. Research can-not flourish if data are not pre-served and made accessible. All concerned must act according-ly.” As discussed in the sections above, the massive amounts of data produced using modern digi-tal technologies (including map-ping technologies) has enormous
potential for science and its appli-cations in public policy, the non-profit sector, and business. But how should this deluge be shared and managed to support innova-tive and productive research that also reflects public values?
Many organizations such as the Research Data Alliance (RDA), the Federation of Earth Science Information Partners (ESIP), and specifically for the oceans community, the Inter-governmental Oceanographic Data and Information Exchange (IODE) of UNESCO’s Inter-governmental Oceanographic Commission, the Ocean Data In-teroperability Platform, the Inter-disciplinary Earth Data Alliance
FIGURE 6. Example of a visualization approach taken to represent a new classification for the ocean known as ecological marine units (EMUs) in three dimensions mapped over space. The region shown is largely off the east coast of Japan in the Pacific Ocean. Although the EMUs are mapped as a continuous surface, representing them in 3D is facilitated using columnar stacks, allowing visualization of EMUs beneath the ocean surface at evenly-spaced locations. In the coastal zone, EMUs are single or few, whereas offshore there are more and deeper EMUs. Visualization by Sean Breyer and Keith Van Graafeiland, both of Esri.

1716
of Columbia University and the Biological & Chemical Ocean-ography Data Management Of-fice of the Woods Hole Oceano-graphic Institution, the National Science Foundation’s EarthCube initiative, and many more, have fully dedicated themselves to fostering a data-centric “counter culture.” For example, not only the tables, figures, statistics, and printed maps in published papers are readily accessible, but the ac-tual digital datasets themselves. This further pertains to not only data from the laboratory, but also to data collected in the field in sci-ences such as geology, ecology, archaeology, and certainly ocean-ography (McNutt et al., 2016).
These organizations are de-veloping best practices for fully cataloging and provisioning the data using the same persistent identifiers in force for published papers, such as Digital Object Identifiers (DOIs). RDA is also leading the way in fostering PPPs focusing on data use and data quality. The IODE has been fo-cused for many years on organiz-ing oceanographic data and infor-mation management at the global level, with globally agreed-upon standards and practices for the free open exchange of data, in-cluding maps and GIS data, and to make everything available quickly, easily and with the high-est quality. This is particularly due to the fact that poor-quality data will lead to poor policy ad-vice and thus to poor decision-
making (Glover et al., 2010; Or-ganisation for Economic Co-op-eration and Development, 2015).
Perhaps most importantly, many organizations are exercis-ing the FAIR principle (Findable, Accessible, Interoperable, Re-usable) as part of several pillars of “open science” (e.g., Organisa-tion for Economic Co-operation and Development, 2015), with regard to the “what” (scientific publications, research data and materials, digital apps, source code), the “who” (scientists, com-panies, the public), and the “why” (re-asserting science as a global public good). And particularly in local government circles where scientific data is used for public policy, there are efforts to move map data (i.e., geospatial data) from that of an underdeveloped or undervalued asset within an open data framework to that of a first-class data type, on par with spreadsheets (Civic Analytics Network, 2017).
DIGITAL RESILIENCE AND STORYTELLING
Another “monster,” if you will, is the challenge of keeping data resilient as well as open and ac-cessible. For example, if map-ping and information tools and the data they are based upon are to help communities to adapt to and be resilient to climate change, it stands to reason that they must be resilient themselves. Wright (2015a) makes the case that stan-
dard definitions of resilience (e.g., the ability to deal with changes or threats; the capacity for absorbing disturbance, stress, or catastro-phe; the ability to recover quickly to a prior desired state) can and should apply to digital data and mapping systems too. As such, if these systems are accessible, interchangeable, operational, and up-to-date, they are resilient.
Wright (2015a and 2015b) discusses as many as eight ideas toward a digital resilience, with some relating to the open science discussion above in terms of:
• fostering better reproducibility through the citation of data via DOIs, especially in journals that require data not just to be avail-able but to be re-usable;
• practicing interoperability and crosswalking via the integration of data with a host of scientific tools and libraries; and
• sharing not just data and not just computer code but how these should be best deployed. In other words, sharing workflows and use cases.
Another recommendation for digital resilience is to adopt the practice of storytelling as a means of science communication. Espe-cially for those seeking to make their science matter to policy, this involves taking the knowl-edge developed within academia writ large and transmitting it into

1918
mainstream society in ways that elicit significant action (Baron, 2010; Wright 2015a). Indeed, as scientists we are often encour-aged not to publish our work until it constitutes a complete “story.” There are ways to take this to a different audience with different mediums, especially to take ad-vantage of the power of maps and geography to educate, inform, and inspire people to action.
For example, Figure 7 is an example of a “story map,” a new medium provided as a series of free apps for sharing not only
maps and associated data sets, photos, videos, even sounds, but for telling a specific and compel-ling story by way of that content (Wright et al., 2014). Scientists are learning how to combine smart web maps to synthesize the data and a primary interpretative message so as to inform, educate, and inspire about a wide variety of ocean science and policy is-sues. Figure 7 tells the story of a workshop conducted by the US Coast Guard and NOAA navi-gation managers to help stake-holders in Jacksonville, Florida
review existing anchorage areas and propose new areas for im-proved navigation safety. During the workshop the group used the smart web maps to evaluate auto-matic identification system (AIS) vessel tracking data, bathymetry, and anchorage data. This quickly revealed major lanes of shipping traffic and allowed the group to collaboratively propose new anchorages in safer areas away from dense shipping traffic, but also in areas deep enough to ac-commodate larger ships. The story map provides a digital
FIGURE 7. Example of a story map used in a US Coast Guard/NOAA workshop. Panning or zooming in one of the map panels synchronizes the same map scale and location for the other two, so that users can simultaneously examine vessel anchoring patterns (left), vessel traffic patterns (middle), and water depth (right) in order to propose the safest new anchor-age areas. Link to story map available from http://esriurl.com/ocnstories.
1918
story book or lasting record of their data and approaches for use in subsequent efforts but also a
communication tool for the Jack-sonville Port Authority, the Flori-da Department of Transportation,
field scientists, hydrographic sur-veyors, recreational boaters, and local politicians.
Toward Sustainability
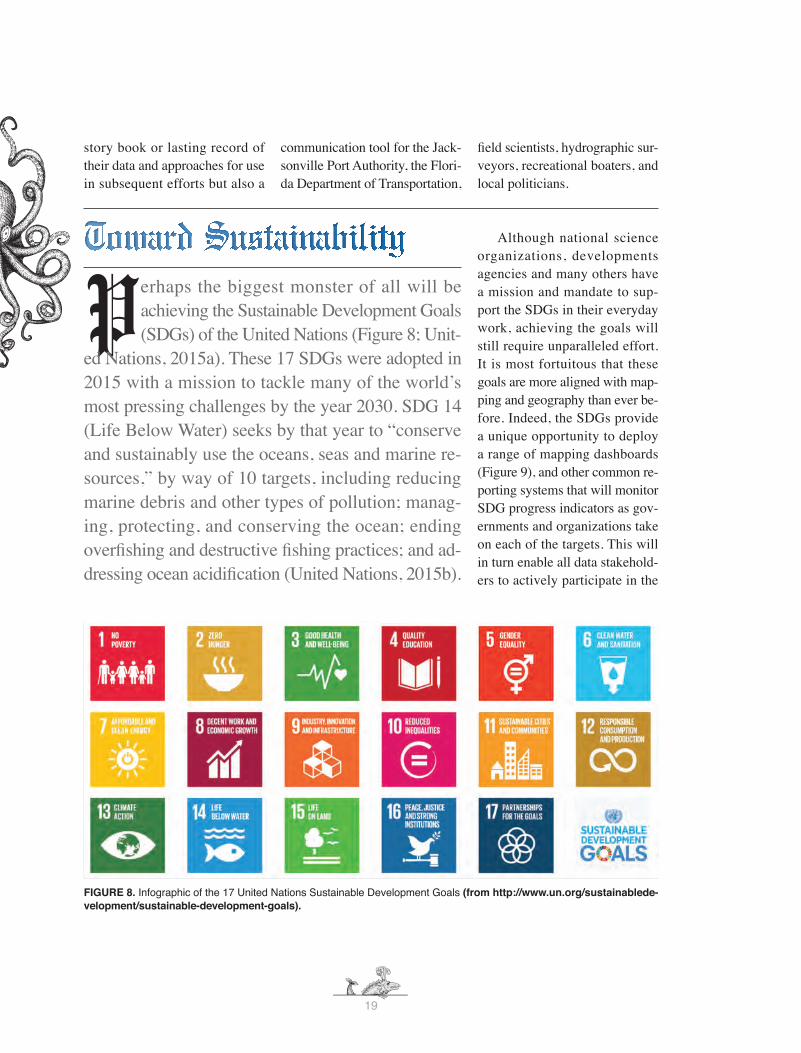
Perhaps the biggest monster of all will be achieving the Sustainable Development Goals (SDGs) of the United Nations (Figure 8; Unit-
ed Nations, 2015a). These 17 SDGs were adopted in 2015 with a mission to tackle many of the world’s most pressing challenges by the year 2030. SDG 14 (Life Below Water) seeks by that year to “conserve and sustainably use the oceans, seas and marine re-sources,” by way of 10 targets, including reducing marine debris and other types of pollution; manag-ing, protecting, and conserving the ocean; ending overfishing and destructive fishing practices; and ad-dressing ocean acidification (United Nations, 2015b).
Although national science organizations, developments agencies and many others have a mission and mandate to sup-port the SDGs in their everyday work, achieving the goals will still require unparalleled effort. It is most fortuitous that these goals are more aligned with map-ping and geography than ever be-fore. Indeed, the SDGs provide a unique opportunity to deploy a range of mapping dashboards (Figure 9), and other common re-porting systems that will monitor SDG progress indicators as gov-ernments and organizations take on each of the targets. This will in turn enable all data stakehold-ers to actively participate in the
FIGURE 8. Infographic of the 17 United Nations Sustainable Development Goals (from http://www.un.org/sustainablede-velopment/sustainable-development-goals).

progress, no doubt with healthy debate along the way, with direct access to authoritative informa-tion that is near-real-time and cross-comparable, and useful for prioritization of activities and programs across the human and physical landscape.
Smart mapping provides the framework and the process for creating a smarter world. It brings together all the data. It integrates the data. It manages the data. It brings data from the abstract into a visualization that is more easily understood and can be used to in-form the world. GIS can organize SDG information into various types of layers that can be visual-
ized, analyzed, and combined to help us better understand the is-sues facing future development. GIS delivers a platform that can be used for the observation, track-ing, and management of shared SDGs worldwide—an integrated global goals GIS. This creates a development nervous system for the planet that will integrate data across disciplines, support the evaluation of planetary health using global measures for SDGs, identify the results and impacts of development interventions, and be a platform for communication and understanding.
The time scales at which ocean issues develop and can be
addressed (e.g., sea level rise, ocean acidification, coral bleach-ing, loss of biodiversity) often stretch over decades – or centu-ries – whereas political cycles and management regimes often last for only a few months or years. As we move from swells to soundings to sustainability, it is hoped that the mapping tech-nologies we can now bring to bear will help erase the discon-nect between the time scales of problem development and policy response. Let us keep working with the innovations in mapping and information toward long-term solutions despite shifting governance and priorities.
FIGURE 9. A GIS dashboard commissioned by the UN to aid in the implementation and management of the SDGs, in this case for displaying progress on Goal 14, Target 1 about reducing marine pollution of all kinds, including marine debris. Interactive, online version available at http://github.com/Esri/sdg-dash.
2120

REFERENCES | Alder, J.R., and S.W. Hostetler. 2015. Web based visualization of large climate data sets. Environmental Modelling & Software 68:175–180. | Baron, N. 2010. Escape from the Ivory Tower: A Guide to Making Your Science Matter, second ed., Island Press, Washington, DC. | Blondel, P., and B. J. Murton. 1997. Handbook of Seafloor Sonar Imagery. John Wiley & Sons, Chichester, UK, 314 pp. | Civic Analytics Network. 2017. An Open Letter to the Open Data Community. http://bit.ly/2m1Uvjo. | Collie, J.S., W.L. Adamowicz, M.W. Beck, B. Craig, T.E. Essington, D. Fluharty, J. Rice, and J.N. Sanchirico. 2013. Marine spatial planning in practice. Estuarine, Coastal, and Shelf Science 117:1–11. | Corfield, R. 2003. The Silent Landscape: The Scientific Voyage of HMS Challenger. Joseph Henry Press, New York, 300 pp. | Doel, R E., T.J. Levin, and M.K. Marker. 2006. Extending modern cartography to the ocean depths: military patronage, Cold War priorities, and the Heezen-Tharp mapping project, 1952-1959. Journal of Historical Geography. 32:605¬–626. | Felt, H. 2012. Soundings: The Story of the Remarkable Woman Who Mapped the Ocean Floor. Henry Holt and Co., New York, 352 pp. | Finney, B. 1998. Nautical cartography and traditional navigation in Oceania. Pp. 443-492 in The History of Cartography: Cartography in the Traditional African, American, Arctic, Australian, and Pacific Societies, vol. 2, book 3. D. Woodward and L.G. Malcolm, eds, The University of Chicago Press, Chicago. | Gantz, J., and D. Reinsel. 2012. The Digital Universe in 2020: Big Data, Bigger Digital Shadows, and Biggest Growth in the Far East. International Data Corporation, Framingham, MA, 16 pp. | Garcia, H.E., R.A. Locarnini, T.P. Boyer, J.I. Antonov, O.K. Baranova, M.M. Zweng, and others. 2013. World Ocean Atlas 2013 version 2 (WOA13 V2), Volume 3: Dissolved Oxy-gen, Apparent Oxygen Utilization, and Oxygen Saturation. In: NOAA National Centers for Environmental Information, S. Levitus, ed., and A. Mishonov, technical ed., NOAA Atlas NESDIS 75, NOAA National Centers for Environmental Information, Silver Spring, Maryland, 27 pp, doi: 10.7289/V5XG9P2W via http://repository.library.noaa.gov. | Garcia, H.E., R.A. Locarnini, T.P. Boyer, J.I. Antonov, O.K. Baranova, M.M. Zweng, and others. 2013. World Ocean Atlas 2013 version 2 (WOA13 V2), Volume 4: Dissolved Inorganic Nutrients (phosphate, nitrate, silicate). In: NOAA National Centers for Environmental Information S. Levitus, ed., and A. Mishonov, technical ed., NOAA Atlas NESDIS 76, NOAA National Centers for Environmental Information, Silver Spring, Maryland, 25 pp., publication doi: 10.7289/V5J67DWD, dataset doi: 10.7289/V5F769GT via http://repository.library.noaa.gov. | Glover, D. M., P. H. Wiebe, C. L. Chandler, and S. Levitus. 2010. IOC contributions to international, interdisciplinary open data sharing. Oceanography 23 (3):140-151. | Grenley, D. 2016. The ArcGIS Imagery Book: A Geographic Rosetta Stone. https://blogs.esri.com/esri/esri-insider/2016/07/05/the-arcgis-imagery-book-a-geograph-ic-rosetta-stone. | Group on Earth Observations. 2005. Global Earth Observation System of Systems (GEOSS) 10 Year Implementation Plan Reference Document. European Space Agency Publication GEO 1000R/ESA SP 1284, The European Space Agency, Noordwijk, The Netherlands, 210 pp. | Group on Earth Observations. 2017. The Group on Earth Observations. http://www.earthobservations.org. | Hoegh-Guldberg, O., T. Aqorau, R. Arnason, T. Chansiri, N. Del Rio, H. Demone, S. Earle, M.H. Feeley, D. Gutierrez, R. Hilborn, N. Ishii, C. Lischewski, J. Lubchenco, K.A. Nguyen, D.O. Obura, R. Payet, T.N. Slade, J. Tanzer, J. H. Williams, D.J. Wright, and J. Xu. 2013. In-dispensable Ocean: Aligning Ocean Health and Human Well-Being – Guidance from the Blue Ribbon Panel to the Global Partnership for Oceans. The Global Partnership for Oceans and the World Bank, Washington, DC, 44 pp. | Landa, E.R. 2010. The ties that bind: Soil surveyor William Edgar Tharp and oceanographic cartographer Marie Tharp. Physics and Chemistry of the Earth 35 (15–18):868–880. | Lewis, D. 1994. We, the Navigators: The Ancient Art of Landfinding in the Pacific. second ed., University of Hawaii Press, Honolulu, 464 pp. | Li, Z., and C. Gold. 2004. Multidimensional geospatial technology for geosciences. Computers and Geosciences 30(4):321–323. | Locarnini, R.A., A.V. Mishonov, J.I. Antonov, T.P. Boyer, H.E. Garcia, O.K. Baranova, and others. 2013. World Ocean Atlas 2013 version 2 (WOA13 V2), Volume 1: Temperature. In: NOAA National Centers for Environmental Information S. Levitus, ed., and A. Mishonov, technical ed., NOAA Atlas NESDIS 73, NOAA National Centers for Environmental Information, Silver Spring, Maryland, pp 40, publication doi: 10.7289/V55X26VD, dataset doi: 10.7289/V5F769GT via http://repository.library.noaa.gov. | Malcolm, H.A., E. Foulsham, R.L. Pressey, A. Jordan, P.L. Davies, T. Ingleton, N. Johnstone, S. Hessey, and S. D. A. Smith. 2012. Selecting zones in a marine park: Early system-atic planning improves cost-efficiency; combining habitat and biotic data improves effectiveness. Ocean & Coastal Management 59:1–12. | Mascarelli, A.L. 2009. Data’s shameful neglect. Nature 461:145. | McHarg, I. 1995. Design with Nature, 25th Anniversary Edition. Wiley, New York, 208 pp. | McNutt, M., K. Lehnert, B. Hanson, B.A. Nosek, A.M. Ellison, and J.L. King. 2016. Liberating field science samples and data. Science 351(6277):1024–1026. | National Research Council. 2004. A Geospatial Framework for the Coastal Zone: National Needs for Coastal Mapping and Charting. The National Academies Press, Washington, DC, 149 pp. | National Research Coun-cil. 2011. An Ocean Infrastructure Strategy for U.S. Ocean Research in 2030. The National Academies Press, Washington, DC, 98 pp. | North, G.W. 2010. Marie Tharp: The lady who showed us the ocean floors. Physics and Chemistry of the Earth 35 (15–18):881–886. | Organisation for Economic Co-operation and Development. 2015. Making Open Science a Reality. OECD Science, Technology and Industry Policy Paper, OECD Publishing, Paris, 108 pp. | Paolo, D., A. Leadbetter, and H. Glaves, eds. 2017. Oceanographic and Marine Cross-Domain Data Management for Sustainable Development. IGI Global, Hershey, PA, 425 pp. | Paul, E., W. McClintock, and D. Wright. 2012. SeaSketch for oil spill response. Journal of Ocean Technology 7(4):130–131. | Picard, K., B. Brooke, and M.F. Coffin. 2017. Geo-logical insights from Malaysia Airlines flight MH370 search. Eos, Transactions American Geophysical Union 98, https://doi.org/10.1029/2017EO069015. | Sandwell, D., S. Gille, J.A. Orcutt, and W. Smith. 2003. Bathymetry from space is now possible. Eos Transactions American Geophysical Union 84(5):37, 44. | Sayre, R., D.J. Wright, S.P. Breyer, K.A. Butler, K. Van Graafeiland, M.J. Costel-lo, P.T. Harris, K.L. Goodin, J.M. Guinotte, Z. Basher, M.T. Kavanaugh, P.N. Halpin, M.E. Monaco, N.A. Cressie, P. Aniello, C.E. Frye, and D. Stephens. 2017. A three-dimensional mapping of the ocean based on environmental data. Oceanography 30(1):90—103. | Seife C. 2015. Big data: The revolution is digitized. Nature 518(7540):480–481. | Smith, W.H.F., and D.T. Sandwell. 1994. Bathymetric prediction from dense satellite altimetry and sparse shipboard bathymetry. Journal of Geophysical Research 99:21803¬–21824. | Smith, W.H.F., and D.T. Sandwell. 1997. Global seafloor topography from satellite altimetry and ship depth soundings. Science 277:1957–1962. | Smith, W.H.F., K.M. Marks, and T. Schmitt. 2017. Airline flight paths over the unmapped ocean. Eos, Transactions American Geophysical Union
2120

22
98, https://doi.org/10.1029/2017EO069127. | Steinitz, C. 2012. A Framework for Geodesign: Changing Geography by Design. Esri Press, Redlands, CA, 224 pp. | Stelzenmuller, V., J. Lee, A. South, J. Foden, and S.I. Rogers. 2013. Practical tools to support marine spatial planning: A review and some prototype tools. Marine Policy 38:214–227. | Strickland-Munro, J., H. Kobryn, G. Brown, and S.A. Moore. 2016. Marine spatial planning for the future: Using Public Participation GIS (PPGIS) to inform the human dimension for large marine parks. Marine Policy 73:15–26. | United Nations. 2015a. Sustainable Development Goals: 17 Goals to Transform our World. http://www.un.org/sustainabledevelopment. | United Nations. 2015b. Sustainable Development Goal 14: Conserve and Sustainably Use the Oceans, Seas, and Marine Resources. http://www.un.org/sustainabledevelopment/oceans. | Walters, M., and R.J. Scholes, eds. 2017. The GEO Handbook on Biodiversity Observation Networks. Springer International Publishing, Cham, Switzerland, 326 pp. | Wessel, P., and M.T. Chandler. 2011. The spatial and temporal distribution of marine geophysical surveys. Acta Geophysica 59 (11):55-71, https://doi.org/10.2478/s11600-010-0038-1. | White, C., B.S. Halpern, and C.V. Kappel. 2012. Ecosystem service tradeoff analysis reveals the value of marine spatial planning for multiple ocean uses. Proceedings of the National Academy of Sciences of the United States of America 109(12): 4696–4701. | Wright, D. 2014. Mapping the Course. Ensia. https://ensia.com/voices/mapping-the-course. | Wright, D.J., A. Verrill, M. Artz, and R. Deming. 2014. Story maps as an effective social medium for data synthesis, communication, and dissemina-tion, Transactions American Geophysical Union, 95, http://esriurl.com/agustories. | Wright, D.J. 2015a. Toward a digital resilience. El-ementa Science of the Anthropocene. 4(000082), http://dx.doi.org/10.12952/journal.elementa.000082. | Wright, D.J. 2015b. Toward a digital resilience (with a dash of location enlightenment). Eos Transactions American Geophysical Union, 96, http://dx.doi.org/10.13140/RG.2.1.2224.6489. | Wright, D.J., M.J. Blongewicz, P.N. Halpin, and J. Breman. 2007. Arc Marine: GIS for a Blue Planet. Esri Press, Redlands, California, 202 pp. | Zweng, M.M., J.R. Reagan, J.I. Antonov, R.A. Locarnini, A.V. Mishonov, T.P. Boyer, and others. 2013. World Ocean Atlas 2013 version 2 (WOA13 V2), Volume 2: Salinity. In: NOAA National Centers for Environmental Information, S. Levitus, ed., and A. Mishonov, technical ed., NOAA Atlas NESDIS 74, NOAA National Centers for Environmental Information, Silver Spring, Maryland, 39 pp. | LIST OF FIGURES | FIGURE 1. A navigational “stick chart” from the Marshall Islands, made of wood, coconut fibers and cowrie shells, with the fibers representing the crests of ocean swells. Chart is on display at the Berkeley Art Museum and Pacific Film Archive, University of California, Berkeley. Photo by Jim Heaphy and reproduced under Creative Commons License CC BY-SA 3.0 by Cullen328 via Wikimedia Commons. | FIGURE 2. 1968 map of the Atlantic Ocean Floor based on a large compilation of deep ocean soundings by Bruce Heezen and Marie Tharp, painted by Heinrich Berann, for the National Geographic Magazine. Image courtesy of Ken Field, International Cartographic Association. | FIGURE 3. An illustration of the broad variety of the ships, vehicles, platforms, and sensors used now and looking 20 years into the future for understanding how the oceans work, and how we need to manage, and protect it. From National Research Council (2011). | FIGURE 4. Visualization of the high volume of commercial shipping activity into and out of ports rimming the Pacific Ocean. The data were analyzed using an open-source collection of GIS tools for the spatial analysis of big data (https://esri.github.io/gis-tools-for-hadoop/). Visualization by Mansour Raad and Sajit Thomas, Esri. Interactive, online version available at http://coolmaps.esri.com/BigData/ShippingGlobe (best with the Chrome web browser running WebGL). | FIGURE 5. A map of typhoons in the Western Pacific during the record-breaking typhoon season of 2005, seeking to visualize the life cycle of the event and compare one storm to another in order to find unique details and overall patterns. 3D symbols depict the unique signature of every storm. This map shows wind speed as cylinder height and barometric pressure as cylinder color along with speed of travel, total distance traveled, and storm duration. Visualization by Nathan Sheph-ard, Esri. Interactive, online version available at http://www.esri.com/products/maps-we-love/pacific-typhoons. | FIGURE 6. Ex-ample of a visualization approach taken to represent a new classification for the ocean known as ecological marine units (EMUs) in three dimensions mapped over space. The region shown is largely off the east coast of Japan in the Pacific Ocean. Although the EMUs are mapped as a continuous surface, representing them in 3D is facilitated by the use of columnar stacks, allowing vi-sualization of EMUs beneath the ocean surface at evenly-spaced locations. In the coastal zone, EMUs are single or few, whereas offshore there are more and deeper EMUs. Visualization by Sean Breyer and Keith Van Graafeiland, both of Esri. | FIGURE 7. Ex-ample of a story map used in a US Coast Guard/NOAA workshop. Panning or zooming in one of the map panels synchronizes the same map scale and location for the other two, so that users can simultaneously examine vessel anchoring patterns (left), vessel traffic patterns (middle), and water depth (right) in order to propose the safest new anchorage areas. Link to story map available from http://esriurl.com/ocnstories. | FIGURE 8. Infographic of the 17 United Nations Sustainable Development Goals (from http://www.un.org/sustainabledevelopment/sustainable-development-goals). | FIGURE 9. A GIS dashboard commissioned by the UN to aid in the implementation and management of the SDGs, in this case for displaying progress on Goal 14, Target 1 about reducing marine pollution of all kinds, including marine debris. Interactive, online version available at http://github.com/Esri/sdg-dash.
23

The Ocean Studies Board would like to thank the founding and continuing sponsors for their generous support of the Revelle Lecture.
This lecture series would not be possible without their generous contributions.
Thank you
23

Revelle Alumni
ADM. JAMES D. WATKINS
DR. MICHAEL K. ORBACH
DR. MARCIA K. MCNUTT
DR. SHIRLEY A. POMPONI
DR. PETER BREWER
DR. RICHARD B. ALLEY
DR. ROGER PIELKE, JR.
DR. KEN CALDEIRA
DR. MICHAEL H. FREILICH
DR. PAUL G. FALKOWSKI
DR. JANE LUBCHENCO
DR. NANCYRABALAIS
DR. EDDIEBERNARD
DR. JOHN WALSH
DR. DAVEKARL
DR. SUSANLOZIER
DR. PHILLIP J. CLAPHAM