the national treasury medium term budget policy statementtreasury.go.ke/budget/2017-2018 fy draft...
TRANSCRIPT
REPUBLIC OF KENYA
THE NATIONAL TREASURY
MEDIUM TERM
BUDGET POLICY
STATEMENT
CONSOLIDATING ECONOMIC GAINS IN AN
ENVIRONMENT OF SUBDUED GLOBAL DEMAND
November 2016
2 2017 Budget Policy Statement
© Budget Policy Statement (BPS) 2017
To obtain copies of the document, please contact:
Public Relations Office
The National Treasury
Treasury Building
P. O. Box 30007-00100
NAIROBI, KENYA
Tel: +254-20-2252-299
Fax: +254-20-341-082
The document is also available on the website at: www.treasury.go.ke
3 2017 Budget Policy Statement
Foreword
The 2017 Budget Policy Statement (BPS) is prepared against a backdrop of slow
global economic growth owing to a more subdued outlook for advanced economies
following the UK vote in favour of leaving the European Union (Brexit) and
weaker than expected growth in the United States, and a sharp slowdown among
Sub-Saharan African economies especially commodity exporters. However, the
Kenyan economy remains resilient registering strong economic growth of 5.6
percent in 2015 compared to the average growth of 3.4 percent for Sub Saharan
Africa and 3.2 percent for global economy. Further, our macroeconomic
performance remains broadly stable with overall inflation within target, Kenya
Shilling exchange rate to the US dollar remaining stable and low short term interest
rates, a reflection of ample liquidity in the money market. The economy is
projected to grow at 6.0 percent in 2016 and over 6.5 percent in the medium term.
This BPS also comes at the brink of completion of the Second Medium Term Plan
(MTP II) (2013-2017). The preparation of the third Medium Term Plan (MTP III)
of the Kenya Vision 2030 for the period 2018-2022 has commenced with a mid-
term review of MTP II by taking stock of the milestones achieved so far and
transiting to MTP III. As such, the policy goals, priority programs and fiscal
framework in this BPS are revised to reflect emerging realities and priorities in the
MTP. The fiscal framework will ensure sustainable debt and improvement in
expenditure management. In particular, we plan to gradually lower our fiscal
deficit (by closing the gap between revenue and expenditure), over the medium
term, while at the same time providing sufficient room to finance productive
expenditure so as to sustain equitable growth. Further, expenditures will be
scrutinized carefully to ensure quality and alignment to the government economic
transformation agenda as outlined in the MTP and strategic interventions of
national interest. The MTP III will mainstream the Sustainable Development Goals
(SDGs) based on key thematic areas that include advocacy and awareness creation;
domestication and localizing SDGs; capacity building; stakeholder mapping and
engagement; monitoring and reporting, and resource mobilization.
This being the fourth BPS since the onset of the economic transformation agenda,
tremendous achievements have been realized from the past investments. These
include among others: improved infrastructure particularly construction of
Standard Gauge Railway which is 88 percent complete, construction of 1,194km
of new roads, rehabilitation of 523km of existing roads, completion of the first
phase of second container terminal at the Mombasa port, an addition of 615MW of
electricity to the national grid and an enhanced electricity connection. We have
also greatly improved the business environment for investment opportunities,
enhanced security through modernizing police equipment and improving police
mobility, and heightened the fight against corruption.
Going forward, spending on infrastructure, education, health and social safety net
and preparations for the elections remains a priority. Implementation of priority
programs will be monitored closely so as to realise benefits and maintain positive
growth momentum, create jobs, reduce poverty and inequality.

4 2017 Budget Policy Statement
The policy intentions outlined in this BPS have benefited from wide consultations.
I would like to thank the President and the Deputy President for the effective
leadership in putting together this document. To my cabinet colleagues, staff of the
National Treasury and other government officials, Asante Sana for your
contributions and understanding as we build a united and prosperous Kenya.
HENRY K. ROTICH, EGH
CABINET SECRETARY/THE NATIONAL TREASURY
5 2017 Budget Policy Statement
Acknowledgement
The 2017 Budget Policy Statement (BPS) is prepared in accordance with the Public
Finance Management (PFM) Act, 2012. It outlines the current state of the economy
and outlook over the medium term, broad macroeconomic issues and medium term
fiscal framework, the set strategic priorities and policy goals together with a
summary of Government spending plans, as a basis of the FY 2017/18 budget. The
document is expected to improve the public’s understanding of Kenya’s public
finances and guide public debate on economic and development matters.
Over the 2013/14-2015/16 Medium Term Expenditure Framework (MTEF), the
government has funded priority programs that are supportive of accelerated
inclusive growth and development. The programs are carefully assessed before
funding to ensure they are in line with the broad economic transformation agenda.
The key programs implemented are aimed at creating conducive business
environment, developing infrastructure to support manufacturing and
industrialization, transforming agriculture, provision of better social services and
rural development through devolution.
The key achievements realised under the prioritized programs include: improved
security infrastructure and police capacity in the country in order to secure citizens,
investors, investments and boost investor’s confidence; development of road
network, rail and ports to decongest major cities and open up Kenya for trade
within and with our neighbours, to this end, implementation of phase one of the
SGR project is progressing on well and H.E The President recently launched phase
two which will link the planned special industrial zones in Naivasha to Nairobi and
Mombasa.
In addition, the government is on course to provide quality and affordable energy
through exploiting the vast potential in geothermal, wind and solar energy and
transformation of the Agricultural sector towards mechanization is ongoing to
ensure food security. On social services, the government has made great progress
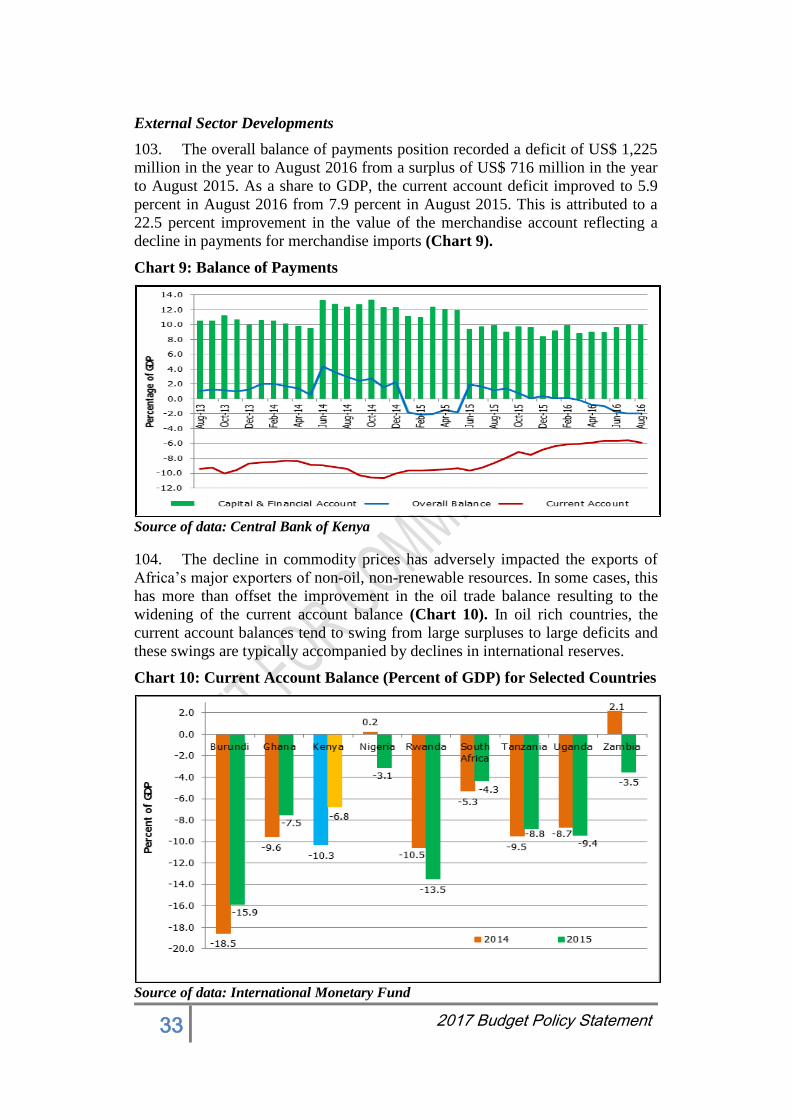
in improving welfare of all Kenyan through improved services in health care and
education and caring for the vulnerable group.
Our financial sector has attained notable achievements in increasing financial
access among Kenyans. We are ranked number 50 out of 138 countries for financial
market development and our capital market was voted the most innovative in
Africa in 2015. Devolution has led to distribution of resources and development to
all corners of the country. The national government is committed to build capacity
in the counties to enhance resource management and raise own source revenue and
entrench good governance in all institutions and fight against economic crimes.
The government will continue to implement priority programs to raise productivity
and economy-wide efficiency for sustainable and inclusive growth.
The preparation of the 2017 BPS was a collaborative effort among various
Government Agencies. We are grateful for their inputs. We thank all the spending
units, the Ministries, Government Departments and Agencies for timely provision
6 2017 Budget Policy Statement
of information. We are also grateful for the comments from the Macro Working
Group and Public Sector Hearings of October 2016 which provided inputs to this
2017 BPS, in addition to comments from several other stakeholders.
A core team in the National Treasury spent substantial amount of time putting
together this BPS. We are particularly grateful to them for their tireless efforts in
ensuring that this document was produced in time and is of high quality.
DR. KAMAU THUGGE, CBS
PRINCIPAL SECRETARY/THE NATIONAL TREASURY
7 2017 Budget Policy Statement
Table of Contents
Foreword………. ........................................................................................................................................... 3
Acknowledgement .......................................................................................................................................... 5
Table of Contents ........................................................................................................................................... 7
I. CONSOLIDATING ECONOMIC GAINS IN AN ENVIRONMENT OF SUBDUED GLOBAL
DEMAND……… ......................................................................................................................................... 10 1.1 Overview ...................................................................................................................... 10
1.2 Sustaining Conducive Business Environment for Investment Opportunities ............... 10
1.3 Continued spending in Infrastructure to Unlock Constraints to Growth ...................... 12
1.4 Sustaining Sectoral Spending for Employment Creation .............................................. 15
1.5 Sustained Investment in Social Services for the Welfare of Kenyans .......................... 18
1.6 Enhancing Service Delivery through Devolution ......................................................... 22
1.7 Structural Reforms ........................................................................................................ 23
II. RECENT ECONOMIC DEVELOPMENTS AND MEDIUM TERM OUTLOOK ....................... 26 2.1 Overview ...................................................................................................................... 26
2.2 Recent Economic Developments .................................................................................. 26
2.3 Fiscal Performance in FY 2016/17 ............................................................................... 34
2.4 FY 2016/17 Revised Fiscal Estimates .......................................................................... 35
2.5 Adherence to Fiscal Responsibility Principles.............................................................. 37
2.6 Economic Outlook ........................................................................................................ 40
2.6.1 External Environment ................................................................................................... 40
2.6.2 Kenya’s Macroeconomic Prospects .............................................................................. 41
2.6.3 Risks to the Economic Outlook .................................................................................... 42
2.7 Fiscal Policy and Outlook ............................................................................................. 43
2.8 Deficit Financing Policy ............................................................................................... 44
III. FY 2017/18 BUDGET AND THE MEDIUM TERM ........................................................................ 45 3.1 Budgetary Allocations for the FY 2017/18 - 2019/20 MTEF ....................................... 46
3.2 Details of Sector Priorities ............................................................................................ 49
3.3 Public Participation/ Sector Hearings and Involvement of Stakeholders...................... 55
IV. COUNTY FINANCIAL MANAGEMENT AND DIVISION OF REVENUE ................................ 60 4.1 Performance of County Governments in FY 2015/16 .................................................. 60
4.2 County Governments’ compliance with fiscal responsibility principles....................... 61
4.2.1 Compliance with the requirement for development spending allocations .................... 61
4.2.2 Compliance with requirements on recurrent spending and salary costs ....................... 62
4.2.3 Prudent management of fiscal risks .............................................................................. 62
4.2.4 Enhancement of counties’ own-source revenues and ensuring predictability in taxes . 63
4.2.5 Short term borrowing by County Governments for management of cash flows ........... 64
4.3 Finalizing the transfer of assets and liabilities to the counties ...................................... 64
4.4 Vertical division of revenue .......................................................................................... 65
4.5 Horizontal allocation of revenue ................................................................................... 66
4.6 Conclusion .................................................................................................................... 67
ANNEX 1: STATEMENT OF SPECIFIC FISCAL RISKS ..................................................................... 69
8 2017 Budget Policy Statement
ANNEX TABLES ........................................................................................................................................ 84 Annex Table 1: Macroeconomic Indicators, 2014/15-2019/20 ................................................. 84
Annex Table 2: Government Fiscal Operations, Ksh Billions .................................................. 85
Annex Table 3: Government Fiscal Operations, Percent of GDP ............................................. 86
Annex Table 4: Summary of Expenditure by Programmes, 2016/17 - 2019/20 (Ksh Million) . 87
9 2017 Budget Policy Statement
What is/ Why the Budget Policy Statement
The budget policy statement (BPS) is a government policy document that set out
the broad strategic priorities and policy goals that will guide the national
government and the county governments in preparing their budgets both for the
following financial year and over the medium term.
In the document, adherence to the fiscal responsibility principles is explained to
demonstrate prudent and transparent management of public resources in line with
the Constitution and the Public Finance Management (PFM) Act, 2012.
Section 25 of the Public Finance Management Act, 2012, provides that the National
Treasury shall prepare and submit to Cabinet the Budget Policy Statement for
approval. Subsequently, the approved BPS is submitted to Parliament, by the 15th
February in each year. Parliament shall, not later than 14 days after the BPS is
submitted, table and discuss a report containing its recommendations and pass a
resolution to adopt it with or without amendments. The Cabinet Secretary shall
take into account resolutions passed by Parliament in finalizing the budget for the
relevant financial year.
The Budget Policy Statement contains:
(a) an assessment of the current state of the economy and the financial outlook
over the medium term, including macroeconomic forecasts;
(b) the financial outlook with respect to Government revenue, expenditures and
borrowing for the next financial year and over the medium term;
(c) the proposed expenditure limits for the national government, including those
of Parliament and the Judiciary and indicative transfers to county
governments; and
(d) the fiscal responsibility principles and financial objectives over the medium
term including limits on total annual debt.
The preparation of the BPS is a consultative process that involves seeking and
taking into account the views of: the Commission on Revenue Allocation; County
governments; Controller of Budget; Parliamentary Service Commission; Judicial
Service Commission; the public and any other interested persons or groups.
10 2017 Budget Policy Statement
I. CONSOLIDATING ECONOMIC GAINS IN AN
ENVIRONMENT OF SUBDUED GLOBAL DEMAND
1.1 Overview
1. The global economy is experiencing a period of growth slowdown in the
volume of international trade driven majorly by subdued demand, particularly in
investment, which is necessary for generating international trade flows in the form
of capital goods and intermediate inputs.
2. Domestically, despite the improvements in growth over the last few years,
we are yet to reach our optimal levels and hence the need to tackle the challenges
that hinder us from operating optimally. Some of the constraints as identified in the
previous budget policy statements involves: business environment; infrastructure;
agriculture; devolution and social services. The government therefore, needs to
continue carrying out measures aimed at tackling the constraints and advancing
structural reforms to substantially reduce unemployment and poverty.
3. In this regard, implementation of the Vision 2030, and the five pillars of
the economic transformation agenda, namely: creating conducive business
environment; developing infrastructure for growth of industries; transforming
agriculture to sustain growth; supporting manufacturing to create employment;
investing in quality, accessible and relevant social services; and enhancing rural
economic development through consolidating gains made in devolution will ensure
that Kenya makes social progress and build a competitive economy.
4. This Budget Policy Statement therefore builds on the commitments made
by the government in the last BPS of implementing programs to raise productivity
and economy-wide efficiency, thereby sustaining high and inclusive growth in line
with aspirations of Vision 2030.
5. The preparation of the third Medium Term Plan (MTP III) of the Kenya
Vision 2030 for the period 2018-2022 has commenced with a concept note that
will be finalized after incorporating stakeholder comments both at the national and
county levels.
6. On the Post-2015 development agenda, the 17 Sustainable Development
Goals (SDGs) and respective 169 targets and 230 indicators will be mainstreamed
into the MTP III and County Integrated Development Plans (CIDPs). The SDGs
will be mainstreamed based on key thematic areas that include advocacy and
awareness creation; domestication and localizing SDGs; capacity building;
stakeholder mapping and engagement; monitoring and reporting and resource
mobilization.
1.2 Sustaining Conducive Business Environment for Investment
Opportunities
7. The reforms under this thematic area continues to focus on sustaining
conducive business environment by maintaining macroeconomic stability and
enhancing security, so as to promote sustainable growth and encourage investment
opportunities in the country.
11 2017 Budget Policy Statement
1.2.1 Macroeconomic Stability for Sustained Growth and
Development
8. The Government has established a strong track record of macroeconomic
stability for sustained and inclusive development. In order to sustain this effort
going forward, the Government will continue to implement prudent fiscal and
monetary policies that are supportive of accelerated inclusive growth and
development.
9. To anchor macroeconomic stability, the fiscal policy strategy recognizes
the need to efficiently apply the limited resources on priority programs with the
highest impact on the stated objectives, but within a medium term framework of
sustainable debt and strong financial position. As outlined in 2016 BPS, this will
be achieved by further rationalization and alignment of programs and resources to
the priorities undertaken by the spending Ministries, Departments/Agencies to
deliver desired outcomes economically and efficiently.
10. Monetary policy stance will aim to maintain overall month-on-month
inflation rate within the Government’s target range of 2.5 percent on either side of
5.0 percent target and ensure that movements in the short-term interest rates
support the objective of price stability. The level of foreign exchange reserves
together with the Precautionary Arrangements with the IMF will continue to
provide an adequate buffer against short-term shocks. The annual growth in credit
to the private sector is projected to pick up gradually in the year to June 2017.
11. Overall macroeconomic stability and sustainability of public debt will be
supported by continued coordination of fiscal and monetary policies. The National
Treasury will continue to work closely with the Central Bank of Kenya and Kenya
Revenue Authority to strengthen the coordination between fiscal and monetary
policies.
1.2.2 Enhancing Security for Sustained Growth and Employment
12. Kenya is part of the global community and is susceptible to various security
challenges including terrorism and the radicalization of young men and women.
Recognizing the importance of security in sustaining economic growth and
attracting investments, the Government remains committed to reducing incidences
of crime and insecurity.
13. Some of the achievements realised in this sector include: enhanced
surveillance system especially in urban areas, investment in street lighting in major
cities and towns, establishment of command and control centre, expansion of
police training facilities, acquisition of police patrol vehicles and motorbikes,
enhanced connection of the Integrated Population Registration System (IPRS) to
agencies and launch of e-passport. In addition, the government has improved police
welfare through provision of comprehensive life and medical insurance cover and
construction of housing units, recruitment of more police officers hence improving
on police to population ratio.
14. Despite the above achievements, there are some emerging issues that need
to be addressed. Going forward, the Government will continue focusing on the
following areas; scaling-up investments towards modernization of security systems
12 2017 Budget Policy Statement
aimed at strengthening security of our borders and throughout the country,
enhanced security operations, especially of areas prone to crimes; building capacity
for effective and faster investigation, and strengthening coordination among
security agencies with stronger partnership with communities. The Government
will further invest in ICT to facilitate timely access to crime scenes through
comprehensive mapping of crime and its incidences over time. This database
would then be applied to facilitate improved planning, deployment of assets and
performance management as it would be possible to understand why and how
crime occurs.
15. In addition to the above, the government will further implement the
following reforms over the medium term to enhance security: capacity
enhancement especially for the police, continued and sustained public sector
reforms, increase public awareness, partnerships and stakeholder’s engagements.
1.3 Continued spending in Infrastructure to Unlock Constraints to
Growth
16. In order to support a rapidly-growing economy as envisaged in the Kenya
Vision 2030, the Government will continue to sustain and expand the on-going
public investments in road, rail, energy and water supplies.
1.3.1 Further Expanding Road Network
17. Great strides have been made in the road construction and rehabilitation
which include construction of new roads, rehabilitation and maintenance of
existing roads. The major achievements include the construction of 1,194km of
new roads, rehabilitation of 523km of existing roads, and maintenance of
149,604km of roads.
18. Over the medium term, the strategy is to expand, modernize and maintain
the road transport in order to have an effective, efficient and secure road network.
Further, we aim to, strengthen the institutional framework for road development
and accelerate the speed of completion of road construction projects, and step up
road transport safety and regulations.
19. To this effect, in the FY 2017/18 the Government has earmarked to
construct 1,138km of low volume seal roads to enhance rural connectivity,
1,768km of new roads and 41 footbridges, rehabilitate 224km of roads, and
maintain an additional 36,225km of roads to facilitate efficient movement of goods
and people.
20. The Government is committed to decongest major urban centres through
the expansion of major roads in urban areas, such as the Outering road in Nairobi
City and Mombasa road section dual carriage way. To further decongest the City
of Nairobi and improve traffic flow, the Government will fast track the
construction of Ngong Road (All Saints-Adams Arcade), the improvement of road
junctions and construction of missing-link roads and non-motorised transport
facilities.
21. In order to boost regional trade, the Government will prioritize the
advancement of the LAPSSET project implementation on the first three berths at
the port of Lamu and the construction of major roads under the East African and
13 2017 Budget Policy Statement
Transport Facilitation Programs and the South Sudan – East African Regional
Transport, Trade and Development Facilitation Program.
1.3.2 Rail, Marine and Air Transport
Standard Gauge Railway
22. The Government’s commitment to develop and manage efficient and safe
railway transport is clearly demonstrated by the pace of the construction of the
Standard Gauge Railway (SGR) from Mombasa to Nairobi which is over 90
percent complete and is expected to be completed by mid-2017. Construction
works for the second phase (Nairobi – Naivasha section of 120kms) of the SGR
project was officially launched by the President on October 19, 2016. This
extension will link special industrial zones that would be established in Naivasha,
home to the Olkaria geothermal power plants, to Nairobi and Mombasa.
23. To facilitate a more cost effective and faster connectivity, the Government
will continue to implement a program to upgrade and modernize urban commuter
mass transit system through Public Private Partnership. As such, completion of
major railway lines, for instance, Makadara- Airport, Imara Daima, and JKIA
Commuter Railway lines will be expedited.
Sea Ports
24. The Government has made good progress on reforms and modernization of
the port of Mombasa, especially in expansion of the container terminals, purchase
of new ferries, and cargo handling and storage, which has reduced significantly
time to clear cargo. The first phase of the second container terminal has been
completed which is capable of handling fourth generation vessels of 60,000 twenty
foot equivalent units (TEUs) capacity. Moreover, the Kipevu Oil Terminal will be
relocated to a more suitable location to allow for expansion. The multi-billion
shilling project will involve the decommissioning of the existing Kipevu Oil
Terminal and the construction of an off-shore jetty near Dongo Kundu. In addition,
a framework has been developed to encourage private investments and
participation in port expansion and port operations.
25. These developments, together with the integration of the single window
system with other related systems to facilitate faster, efficient and competitive
clearance of cargo, will ultimately position the port of Mombasa as a preferred hub
in Eastern and Central Africa. The Government will continue to develop several
commercial ports within the next 5 years, including the Lamu Mega Port, Kisumu
Port as well as other smaller but highly developed ports along the coastline.
Airports
26. Kenya aims to entrench her position as undisputable regional aviation hub
by expanding, modernizing and managing the aviation sector. The screening yard
and security toll gate at Jomo Kenyatta International Airport (JKIA) has been
completed while rehabilitation work at the five airstrips (Nanyuki, Ikanga, Lodwar,
Embu and Malindi) and expansion and modernization of Isiolo and Kisumu
airports are ongoing. Going forward, the Government will further scale up the on-
14 2017 Budget Policy Statement
going airports expansion and modernization; commence work on the JKIA Second
runway for completion by end of the year 2018. The Government also plans to
commence the expansion of the Eldoret International Airport to enable large cargo
planes to land and position it as a transport hub.
1.3.3 Access to Adequate, Affordable and Reliable Energy Supply
27. The realisation of the development objectives set out in the Government’s
economic transformation agenda and Vision 2030 will be feasible if quality energy
services are availed in a sustainable, competitive, cost effective and affordable
manner to all sectors of the economy.
28. The Government’s commitment to provide affordable and competitive
electrical energy remains on course. Significant progress has been made towards
generation of 5000 MW of power. Already, a program to add adequate power
generation is on-going, and since March 2013, more than 615 MW of electricity
have been added to the national grid; of which, 371 MW are from geothermal. With
this additional power, total power available on the national grid is 2,282MW and
this added power has significantly reduced the cost of power.
29. The Government has also continued to raise its power production by
further exploiting the vast geothermal, wind and solar resources that Kenya is
endowed with. These resources are expected to increase the clean energy mix
cementing Kenya’s position as a World Leader in renewable energy.
30. Going forward, the Government will continue to invest in the construction
of more electricity substations, transmission lines, and distribution transformers to
boost the availability of electricity and to sustain demand. To date, the Government
has constructed and upgraded more than 81 power substations between 2013 and
June 2016. The additional power supplies, has significantly widened access to
power, reduced the cost of doing business, and spurred growth of enterprises, and
expanded the consumer base from 2.2 million households in March 2013 to 4.9
million households in June 2016. In addition, more than 22,245 primary schools
have been connected to the power grid to facilitate the digital literacy programme
and 810 public institutions have been connected to alternative (solar) power.
31. To conserve the environment and encourage value addition, the
Government will continue to improve access to clean alternative energy through
connection of more public institutions with solar energy, installation and
maintenance of wind masts and data loggers. The Government will also connect an
additional 52 towns under the street lighting program which aims at lighting towns
and cities into 24-hour economy.
15 2017 Budget Policy Statement
1.4 Sustaining Sectoral Spending for Employment Creation
1.4.1 Agricultural Transformation to Sustain Growth
32. The Agriculture is indeed a key sector in the economy of our nation, it
contributes 23 percent to the country’s GDP and 27 percent indirectly through
forward and backward linkages. It is worth noting that the sector is not only a key
player in our economy as a nation but that it also provides employment and is
means of livelihood for the majority of the Kenyan people.
33. Recognizing the importance of the sector, the Government has remained
committed to ensuring that the sector is cushioned through development of
policies, measures and interventions to enable it to adopt a forward look to
transforming agriculture from subsistence to commercial farming and agribusiness,
and to ensure sustainable food security in the country.
34. As a result, tremendous achievements have been realized, which include
among others; availed 521,047 MT of fertilizer subsidy and established fertilizer
blending facility; enhanced Strategic Grain Reserve (SGR); procurement and
distribution of 72 tractors, 16 rice combine harvesters, 72 rice reapers and 100
motorized rice threshers; production and distribution of 880,880 straws of semen;
production of 135 million doses of assorted vaccines; insurance of 66,085 tropical
livestock units (TLUs) under the Livestock Insurance Programme ; establishment
of mini fish processing facilities ; and development of National Residue
Monitoring Plan (RMP) for farmed fish that was approved by the European Union.
Government has commissioned two fertiliser plants in Eldoret and Nakuru with a
capacity of 500,000 tonnes in total. Once fully operational, the plants will enable
local blending of fertilisers and hence lower cost of fertilizers.
35. Land is a key resource in growing the agricultural sector. The government
has developed a draft National Spatial Plan and physical planning manual
(standards and guidelines); formulated National Land Use Policy and digitized 13
land registries; registered 2.4 million title deeds; enhanced administration and
management of public land; and procured and installation of Enterprise Resource
Plan (ERP) comprising of Land Information Management System (NLIMS).
36. During the FY 2017/18- 2019/20 Medium Term Expenditure Framework
(MTEF) period, the government has prioritized among others the following
programs: development of Agriculture Technology Centres; strengthening
agricultural mechanization; development of Soil and water conservation national
strategy; enhancement of Kenya Cereal Program and Climate Resilience
Agriculture; Aflatoxin management; National Accelerated Agricultural Inputs
Access Programme; improve access to market information and Eastern African
Agriculture Productivity Project for commercialization of technology.

16 2017 Budget Policy Statement
1.4.2 Supporting Growth of Manufacturing for Employment
Creation
37. Manufacturing sector is among priority sectors identified by the Vision
2030, earmarked to catalyze Kenya’s leap to a higher middle income economy.
Despite the difficult times due to weak exports, loss of flagship investors, and
unfair competition from subsidized imports from Asia and the rest of the World,
the sector’s notable contributions include 10.3 percent share of Gross Domestic
Product (GDP) in 2015, and increased employment creation to 2.8 million persons
in 2015 up from 2.4 million in 2013.
38. The Sector has also made great strides in the development of industrial
infrastructures such as Special Economic Zones, Free Trade Zones, and Industrial
Parks. The SEZs, and the subsequent boost in manufacturing, is intended to create
jobs and expand after it starts. In effect, the master plan, feasibility study and
strategic environmental assessment for Special Economic Zones (SEZ) at Dongo
Kundu Mombasa have been completed and SEZ Act 2015 enacted. The
construction of the textile and apparel industrial buildings and worksites at the
Export Processing Zones (EPZ) Athi River are at 65 percent.
39. As a result, the Sector has realized growth in both foreign direct investment
and exports; total foreign direct investment doubled from Ksh101 billion in FY
2013/14 to Ksh 224 billion in FY 2015/16. The country’s total exports to AGOA
markets rose from Ksh 47 billion to Ksh 67 billion during the same period, out of
which exports of apparels increased by 14.4 percent from Ksh 30.2 billion to Ksh
34.6 billion.
40. To promote the development of industries and extractive sectors of the
economy, the Government continues to promote the ease of doing business by re-
engineering processes and cost reduction. To this end, the country’s
competitiveness in Ease of Doing Business ranking index improved by 21 points
to position 92 from position 113 previously out of 190 countries according to the
2016 World Bank Doing Business report. The Government has also continued to
allocate national resources towards the leather industrial park development, textile
development, modernizing both Rivatex and the new KCC.
41. Going forward, the Government will prioritize with the promotion of
development of regional specific industrial clusters in Mombasa, Kisumu and
Garissa, operationalization of the SEZ Act 2015, development of the basic
infrastructure in Dongo Kundu/Mombasa, development of integrated industrial
database, development of basic infrastructure for leather industrial park in Kenanie,
development of a common manufacturing facility for leather in Kariokor, and
training SMEs on business management and value addition in counties,
development of industrial parks and establishment of small and medium industries
(SMI).
17 2017 Budget Policy Statement
1.4.3 Tourism Recovery, Sports, Culture, and Arts
42. The role of tourism, sports, culture and arts in the country’s transformation
and economic development is diverse. These sectors play this role by promotion
and exploitation of Kenya’s diverse culture and arts; enhancing Kenya’s reading
culture; regulation, development and promotion of sports, film industry and music;
and preservation of Kenya’s heritage. In cognizance of this, the Government has
continued to undertake several initiatives to spur recovery of the tourism sector and
create an enabling environment for tourism businesses, sports and culture,
including encouraging joint partnerships between individuals, citizen companies
and non-citizens.
43. Other achievements in the tourism sector include: increased bed-nights by
Kenyans, increased conference activity in the country, operationalization of the
Tourism Regulatory Authority, which has enabled the tourism sector to classify
and rate 122 hotels and restaurants, completion rate of 40.5 percent of the Ronald
Ngala Utalii College project works in Kilifi, and assessment of 54 pre-qualified
tourism establishments in Nyanza, Western and North Rift regions and
classification of 25 establishments (1-4 star rating).
44. In sports, culture and art, over the last medium term period, government
managed to trained and nurtured 73,700 talented youth in various sports disciplines
against the target of 55,490, sensitized 694 persons and tested 231 athletes on anti-
doping against a target of 200 set in both cases, enhanced film monitoring and
enforcement by issuing 1,043 film regulatory licenses and conducted 5,753 random
inspections against a set target of 5000 to ensure inappropriate content is not
distributed to the public, and heightened the construction of the National Library
in Nairobi.
45. Going forward, the Government working in partnership with key
stakeholders aims to increase tourism earnings, international and domestic tourist
arrivals, and conference tourism; develop and diversify niche tourism product;
facilitate concessional loan funds to tourism and tourism related facilities; and
complete the construction of Ronald Ngala Utalii College. Further, government
will continue to upgrade 5 regional stadia (Kamariny, Chuka, Karatu-Ndarugu,
Marsabit and Wote); completion of the Ultra-modern National library, full
operationalization of the Kenya Film School, improve compliance with sports
regulations, increase awareness on the fight against doping, and disseminate
heritage knowledge.
1.4.4 Promoting Mining Sector for Job Creation
46. The Mining sector has been identified by the Vision 2030 as one of the key
drivers for economic growth and transformation, it contributes 0.9 percent to GDP
but this is expected to rise to at least 10 percent by 2030 which will made possible
by discovery and exploitation of new minerals. In addition to contributing to GDP,
the sector employs more than 13, 800 and 6, 000 Kenyans in private and public
18 2017 Budget Policy Statement
sectors respectively. In order, to spur growth in the sector and attract investors, the
Government has over the years continued to initiate measures to transform the
sector.
47. These initiatives have paid off, as evidenced by the significant
achievements of the sector. Kenya is one of the world’s leading producers of
natural carbon dioxide, fluorspar, soda ash and titanium. Twenty other minerals
have been identified and confirmed, including a unique type of ruby. In the year
2015, 0.6M metric tonnes of titanium, 340kg gold, 64,000 metric tonnes of
Fluorspar, 0.5M metric tonnes of Soda Ash, and 3,700 M metric tonnes were
mined. Overall, mineral output rose by 14.7 percent from Ksh 21.1billion to Ksh
24.2billion in 2015, while in terms of current prices; the contribution of mining and
quarrying activities rose from Ksh 22.999billion in 2011 to Ksh 53.784billion in
2015.
48. The Government recognizes that the mining sector can only become a core
driver of Kenya’s economy, to the extent that the conditions are put in place to
support an attractive climate for investors. To this effect, the Government has
enacted a new Mining Act, 2016, in order to make the sector stable, predictable
and transparent. In addition, the Government has developed a set of 16 regulations
to fill in the gaps in the new law and help operationalize it. The Government has
also strengthened the licensing process through the Online Transactional Mining
Cadastre Portal (OTMCP), which has enhanced transparency and accountability.
Further, in a bid to attract investment in the sector, the Government is in the process
of finalizing a nationwide Airborne Geophysical Survey and establishing a
Geological Data Bank to provide data on mineralized areas in the country and
reduce exploration risk establishment. Going forward, the Government will
prioritize on the implementation of the new Mining Act, 2016 and the development
of an overarching National Extractive Policy and a 20- year Mining Strategy.
1.5 Sustained Investment in Social Services for the Welfare of Kenyans
49. To foster inclusive growth, reduce poverty and inequality, the Government
will continue investing in quality and accessible healthcare, relevant education and
strengthen the social safety net.
1.5.1 Health Care
50. The health sector aims to achieve the highest possible health standards in
line with the population needs through supporting provision of equitable,
affordable and quality health and related services to all Kenyans.
51. Spending in the health sector recorded improvements in communicable disease
control, maternal and child health as well as access to ARVs. The government will
continue to implement programs and projects aimed at promoting health promotion
and prevention; addressing the health needs of children, mothers and adolescents;
improving the health infrastructure; enhancing social health protection and
achievement of universal health coverage and the strengthening of adherence to
normal and standards as well as health regulation.
19 2017 Budget Policy Statement
52. To this effect, the financial year FY 2017/18-2019/20 Budget will prioritize
scaling up of policy interventions aimed at enhancing equitable access to high
impact healthcare services, addressing challenges associated with devolution of
health care and high turnover rate among health workers, controlling non-
communicable diseases, and improving health service delivery in the country. The
emphasis will therefore, be addressing these challenges in order to ease the burden
to the households and attainment of the highest standards care for sustained long-
term growth and development.
1.5.2 Quality and Relevant Education for all Kenyans
53. The Government’s overall goal in the education sector is to increase access
to education and training; improve quality and relevance of education; reduce
inequality as well as leverage on knowledge and skills in science, technology, and
innovation for global competitiveness. To achieve this goal the Government is
committed to further entrenching universal and compulsory basic education and
expanding tertiary education.
54. The education sector achievements have been significant in the FY
2015/16. They include; increase in the number of Early Childhood Development
and Education (ECDE) centres, Free Primary Education continued to be
implemented with enrolment stabilizing at 8.8M over and the number of Primary
schools increasing from 21,302 in FY 2013/14 to 21,877 in FY 2015/16. Despite
these achievements, a number of challenges still remain. . They include high
poverty incidence, high education costs to households and government,
unsatisfactory access levels especially at post primary education, low progression
and high school wastage, and regional and gender disparities in educational
attainment.
55. The medium term strategy will therefore, focus on:
Construction and improvement of infrastructure in all learning institutions
and county offices for teacher management services.
Enhance capitation and grants to institutions, support for education and
curriculum reforms and enhancement and support for examination,
competence assessment and certification.
Expansion of education and training opportunities in marginalized and
underserved areas. Promotion of education and TVET activities by
development of policies, licensing, accreditation and quality assurance of
all institutions.
Increasing provisions for loans, bursaries and scholarships to meet the
increased demands of education and training.
Enhancement of ICT integration in education at all levels and Promotion of
science, technology and innovation activities by development of policies,
research licensing, and accreditation of research and quality assurance of
research institutes.
20 2017 Budget Policy Statement
Mainstreaming, monitoring and evaluation of programmes and
empowering the Central Planning and Project Monitoring Unit (CPPMU)
to conduct effective monitoring of institutions.
1.5.3 Scaling up Social Safety Nets
56. The Government continues to build resilience and promote affirmative
action for addressing challenges facing vulnerable groups. Between the year 2013
and 2016, the sector realized a number of achievements, including: 40,520 Orphans
and Vulnerable Children (OVC) have been supported with scholarship; 792,815
children in distress assisted through the child help line 116; 13,679 persons with
disabilities provided with assistive and supportive devices and 3,026 supported
with sun screen lotion while 133,000 Self Help Groups/Community Based
Organizations have been registered.
57. On the National Safety Net Programs, the achievements included: increased
number of older persons receiving Cash Transfer from 164,000 to 310,000;
increased number of households with OVCs receiving cash transfers from 253,000
to 353,000; and increased number of Persons with Severe Disabilities receiving
cash transfers from 27,000 to 46,414.
58. The first phase of the Single Registry has already been set up; this phase
entailed its establishment where all the information on the five Cash Transfer
Programs is kept. These programs included; Cash Transfer to Orphans and
Vulnerable Children (CT- OVC), Older Persons Cash Transfer (OP-CT), Cash
Transfer to Persons with Severe Disability (CT- PWSD), Hunger Safety Net
Program (HSNP) and Cash for Asset programme of the World Food Programme.
The Government is now embarking on the second phase of the Single Registry
where it will ensure that the Single Registry is secure and expand it to
accommodate as many as possible Social Protection at both levels of the
Government.
59. Over the medium term, the Government is targeting to carry out the
following measures in order to ensure the success of the National Safety Net
Programme:
To build capacities of communities and register Self Help Groups and
Beneficiaries Welfare Committees (BWCs) providing them with formal
recognition and opportunities to link with Micro Finance Institution (MIF)
and non-state actors.
Infrastructure Development of 12 Vocational Rehabilitation
Centres(VRCs) in order to provide trainees who are Persons With
Disabilities with proper learning environment and equip them with skills
for self-reliance and also enable them to participate in socio economic
activities.
Establish National Development Fund for Persons with Disabilities
(PWDs) which is aimed at improving livelihoods of PWDs, improving
physical accessibility in learning institutions, increasing enrolment,
retention and completion of PWDs in schools, improving literacy and
21 2017 Budget Policy Statement
transition to higher levels of education and improving participation of
PWDs in development activities.
Single registry for the National Safety Net Programme will be decentralized
to the remaining 18 Counties by the end of FY 2016/17.
Integrate the existing Management Information Systems for the CT-OVC,
OPCT and PWSD-CT programs into a one-stop system. The integrated
system will enhance automation of key program components such as
targeting, enrolment, payroll preparation, bank reconciliation, change
management and complaints and grievances. It will be designed to be
compatible with the electronic targeting tool which is being piloted and
finalized in the current (2016/17) financial year.
1.5.4 Empowering Youth, Women and Persons with Disabilities
60. Kenya is among the few countries with large proportion of youthful
population. Demographic dividend is reaped when this youthful population is
utilized to accelerate economic development. To reap the benefits of the
demographic dividend, the government recognizes that it is important to empower
youth, women and persons with disabilities and remove all obstacles to ensure their
full participation in social economic development of the country.
61. During the FY 2013/14 – FY 2015/16 MTEF, 46,699 and 58,549 groups
were supported through Women Enterprise Fund and Uwezo Fund against a target
of 40,000 and 55,000 respectively. Further, Anti FGM campaigns forums aimed at
reducing FGM prevalence in the country were held in 20 counties against a target
of 17 counties.
62. The government will continue to promote gender and youth empowerment,
livelihoods for the vulnerable groups and marginalized areas through the National
Youth Service (NYS) program, the social transformation program, and SACCOs
in order to attain sustainable youth led enterprises and promote employment
creation services. Further, the Government will expand opportunities for the youth
in procurement through the Access to Government Procurement Opportunities
(AGPO) platform, and ensure that the youth suppliers under the platform are paid
in time. The Government will also designate resources for the establishment of
youth empowerment centers which will help facilitate mentoring of youth on
leadership, national values, entrepreneurship skills and further entrench digital
literacy.
1.5.5 Environmental Conservation and Making Water Accessible
63. The national policy blue print envisions the country to be a nation that
prides in a clean, secure and sustainable environment and targets universal access
to clean water and basic sanitation for all by the year 2030. To date, about 56

22 2017 Budget Policy Statement
percent of Kenyans have access to reliable clean water, while 70 percent have
access to clean sanitation.
64. Noting that Kenya is a water-scarce country with less than 1,000 cubic
metres per capita of renewable freshwater resources, the Government working with
devolved units of government will continue to invest in clean water supply and put
in place measures to control floods and harvest rain water as well as to protect and
conserve the environment thus connecting over one million additional Kenyans to
safe drinking water.
65. The Government remain committed on its bid to mitigate the impact of
climate change, having signed the Protocol on Climate Change following the
adoption of the Paris Agreement. Prior to the signing, the Government adopted a
Green Economy Strategy and Implementation Plan as a guideline for its
environmental sustainability efforts. Critical part of the Government’s
environmental conservation efforts is the stand against poaching and the illegal
trade in wildlife and wildlife products. In addition, the Government will continue
to mainstream climate change measures into all its projects and programmes.
66. Going forward, the Government will prioritize on sustainable water,
wildlife and natural resources management, the governance of land and water
utilities, the promotion of information technology, the reduction of non-revenue
water, together with reliable water distribution; prudent infrastructure development
and adoption of best practices in operation and maintenance. Moreover, the
Government will strengthen the uptake of Environmental Impact Assessment for
every project.
1.6 Enhancing Service Delivery through Devolution
67. The three years that devolution has been in existence, despite its many
challenges, shows that it’s one of the greatest successes of our new constitutional
architecture. The decentralization has led to distribution of resources to all corners
of our country and spread development to previously unbelievable villages.
Further, it has devolved leadership hence reducing political and social risks that
comes with system where leadership is centralised hence some
communities/people feel left out.
68. A challenge of low performance of own-source revenue against respective
target has been witnessed since the establishment of County Governments (CGs)
in 2013. A survey by the National Treasury of eight County Governments
revealed, among other findings, that: revenue forecasting in CGs is not
underpinned by macroeconomic assumptions or a credible methodology; revenue
forecasts once included in the budget are hardly updated since there is no in-year
monitoring that is done; and, there is an ambiguity of roles within County
Governments in the own-source revenue forecasting process, in a number of
instances, County Executives prepare revenue forecasts which are later raised by
County Assemblies.
69. The National Government has adhered to the principles of devolution by
providing resources to the county governments to run their affairs.
23 2017 Budget Policy Statement
70. To strengthen accountability and fiscal discipline, the National
Government will continue building capacity in the counties and assist them
develop a strategy to enhance revenue management by identifying strong revenue
raising measures and correct duplication and distortions in local taxes and fees that
hurt the business environment and reduce revenue streams when investors shy
away from such counties.
71. With regard to cash management, the National Government will continue
disbursing funds to county governments in accordance with the approved
disbursement Schedule. In disbursing the funds, however, the National
Government will prioritize disbursements to county governments with least fund
balances at the Central Bank of Kenya in order to ensure prudent cash management
as required under Article 201(d) of the Constitution.
1.7 Structural Reforms
Governance
72. The Government continues to fight against corruption and its adverse
effects to the economy which include inefficiency, low productivity and high costs
of doing business. The Government will continue with the implementation of the
measures articulated in National Call to Action against corruption which include
continuous and objective lifestyle audits for all Accounting Officers as well as
Authority to Incur Expenditure (AIE) holders. The Government is also committed
to strengthen expenditure control and improve the efficiency of public spending
through Public financial management reforms aimed at upgrading efficiency,
transparency and accountability in order to free fiscal space for priority social and
investment projects and to improve governance in the public sector.
73. Further during the State House Summit on Governance and Accountability,
held in October 2016 in Nairobi, the Government reiterated its commitment to fight
corruption and challenged the agencies charged with combating graft, especially
the courts to fast-track their mandate. The Government further warned against
politicization of corruption and integrity issues, promised swift action against
procurement offenders and highlighted the need for strengthening of investigations
and improvements to the anti-corruption cases in order to enhance their
effectiveness.
74. Some of the achievements in the fight against economic crimes in the
FY2015/16 include: 167 corruption and economic crime cases investigated while
358 case files were still at various stages of investigations; Ksh 2.6 billion loss
averted by disruption of 13 corruption networks; 17 corruptly acquired assets
traced, recovered and/or restituted worth Ksh 701 million; and 3 systems reviewed
and examinations to seal corruption loopholes conducted. In addition, 6.3 million
persons were sensitized/enlisted to combat corruption, 4 cases comprising of 147
case files on ethical breaches were investigated and 2350 Integrity Assurance
officers and corruption prevention committees trained.
75. The Government has allocated adequate resources to the Independent
Electoral and Boundary Commission towards the management of the voter
registration and electoral operations for the 2017 General Elections and its
24 2017 Budget Policy Statement
aftermath. This will ensure voice and accountability as well as stability and lack of
violence which are crucial for development of our country.
76. Further, the Government continues to strengthen various institutions that
are mandated to fight corruption in the country in order to instill good governance
and to enhance capacity to vigorously combat corruption and recover corruptly
acquired assets. Already progress has been made in the coordinated investigations
among the agencies. The Multi-Agency Team (MAT), which brings together the
Kenya Police Service (Directorate of Criminal Investigations), the Ethics and Anti-
corruption Commission, the Financial Reporting Centre, the Directorate of Public
Prosecutions, the Kenya Revenue Authority and the Asset Recovery Agency, have
taken to courts more than 360 corruption cases.
77. The parliament, in FY 2017/18, will continue to fast-track consideration of
reports on budget implementation, audited accounts of the National Government,
County Governments and State Corporations. In addition, they will introduce bills;
consider motions, statements and petitions; and carry out vetting of state officers
presented to them as required by law. These activities will go a long way in
entrenching good governance in our institutions and ensuring accountability of
public resources.
Financial Sector Developments and Reforms
78. Kenya’s banking sector has been expanding locally and across the Sub
Saharan region with innovations driving financial inclusion. With the Banking
(Amendment) Act 2016 that capped lending rate at four percentage points above
the Central Bank's benchmark rate and deposit rate at at-least 70 percent of the
benchmark rate, the sector is expected to continue with its growth based on the
ability to respond to the needs of Kenyans for convenience and efficiency riding
on Kenya’s position as a world leader in mobile money technology.
79. Kenya’s financial sector development continues to support economic
growth and transformation. The Kenya Deposit Insurance Corporation (KDIC) was
voted the deposit insurer of the year 2016 by the International Association of
Deposit Insurance (IADI). In FY 2016/17, the World Economic Forum Global
Competiveness Report ranked Kenya number 50 in the world out of 138 countries
for Financial Market Development. In the 2016 FinAccess survey, Kenyans access
to financial services improved to 75.3 percent, up from 66.7 percent in 2013.
80. Building on the progress made thus far, the Government will implement
additional measures to further deepen and strengthen the financial sector,
including:
The policy framework to establish the Nairobi International Financial
Centre (NIFC) and the NIFC Bill which are already before the Cabinet will
be forwarded to the National Assembly;
25 2017 Budget Policy Statement
The Financial Services Authority (FSA) Bill which consolidates existing
non bank financial sector regulators and creates a new market conduct
framework for the entire non-bank financial sector and is already before the
Cabinet will be forwarded to the National Assembly;
The Moveable Property Security Rights Bill which facilitates lenders to
provide credit using moveable properties as collateral and also creates an
online electronic collateral registry and is already before the Cabinet will
be forwarded to the National Assembly
The Kenya Credit Guarantee Scheme Bill to further support access to credit
by Small and Medium Enterprises will be finalised and forwarded to
Cabinet and thereafter the National Assembly;
Other reforms to address the high cost of credit including reforms to
facilitate leasing and factoring, further extending the credit reporting
framework to include credit providers from outside the financial sector,
digitization of land registries and other legal reforms to facilitate the
expansion of mortgage finance;
Enhancing Kenya’s position as an Islamic Finance Hub by putting in place
an Islamic Finance Regulatory Framework through the recently launched
Islamic Finance Steering Committee (IFSC) chaired by the Cabinet
Secretary/National Treasury and Islamic Finance Consultative Committee
(IFCC);
Strengthening, by the Central Bank of Kenya, of the bank supervision legal
and regulatory framework. This will include enhancing the macro- and
micro-prudential Stress Testing Framework and cross border supervision
framework,
Strengthening the independence and capacity of the Kenya Deposit
Insurance Corporation (KDIC) to ensure it is able to expeditiously
undertake bank resolution and protect the interests of depositors; and,
Launching the M-Akiba Government Bond which will be the world’s first
purely mobile phone based Government security.
26 2017 Budget Policy Statement
II. RECENT ECONOMIC
DEVELOPMENTS AND MEDIUM
TERM OUTLOOK
2.1 Overview
81. Kenya’s macroeconomic performance remains broadly stable despite the
global economic slowdown. The economy’s growth momentum has been strong
supported by significant investment in infrastructure, construction and mining
sectors, strong recovery in tourism lower energy prices and improved agricultural
production following improved weather conditions. Inflation is within the target
band due to prudent monetary policy management while interest rates are low and
stable despite global financial pressures following the enactment of the Banking
(Amendment) Act, 2015.
82. Improved export earnings from tea and horticulture, reduced import bill of
petroleum products due to lower oil prices, resilient diaspora remittances and
improved tourism performance led to a narrower current account deficit. The
narrowing of the current account deficit together with strong capital inflows led to
a stabilization of the shilling in the foreign exchange market, and also allowed the
accumulation of international reserves.
83. Going forward, the economy is projected to expand further by 6.0 percent in
2016 and above 6.5 percent in the medium term supported by strong output in
agriculture with a stable weather outlook, continued recovery of tourism and
completion of key public projects in roads, rail and energy generation. In addition,
strong consumer demand and private sector investment as well as stable
macroeconomic environment will help reinforce this growth.
2.2 Recent Economic Developments
Global Economic developments
84. The global economic growth outlook remains subdued in 2016, though
expected to recover gradually in 2017 and beyond. The new shocks to the outlook
include: Britain’s referendum result in favor of leaving the European Union;
ongoing realignments among emerging and developing economies, such as
adjustment of commodity exporters to a protracted decline in the terms of trade;
slow-moving trends, such as demographics and the evolution of productivity
growth; as well as noneconomic factors, such as geopolitical and political
uncertainty.
85. Global growth is estimated at 2.9 percent in the first half of 2016, slightly
weaker than in the second half of 2015 and lower than the projected growth in the
April 2016 WEO. The forecast for 2016 and 2017 is 3.1 percent and 3.4 percent,
respectively.
27 2017 Budget Policy Statement
Domestic Economic Developments
86. The Kenyan economy has sustained its robust growth in the past decade
supported by significant structural and economic reforms. The economy grew by
5.6 percent in 2015 compared to 5.3 percent growth in 2014. The economy further
improved and grew at 6.2 percent in quarter two of 2016 up from 5.9 percent
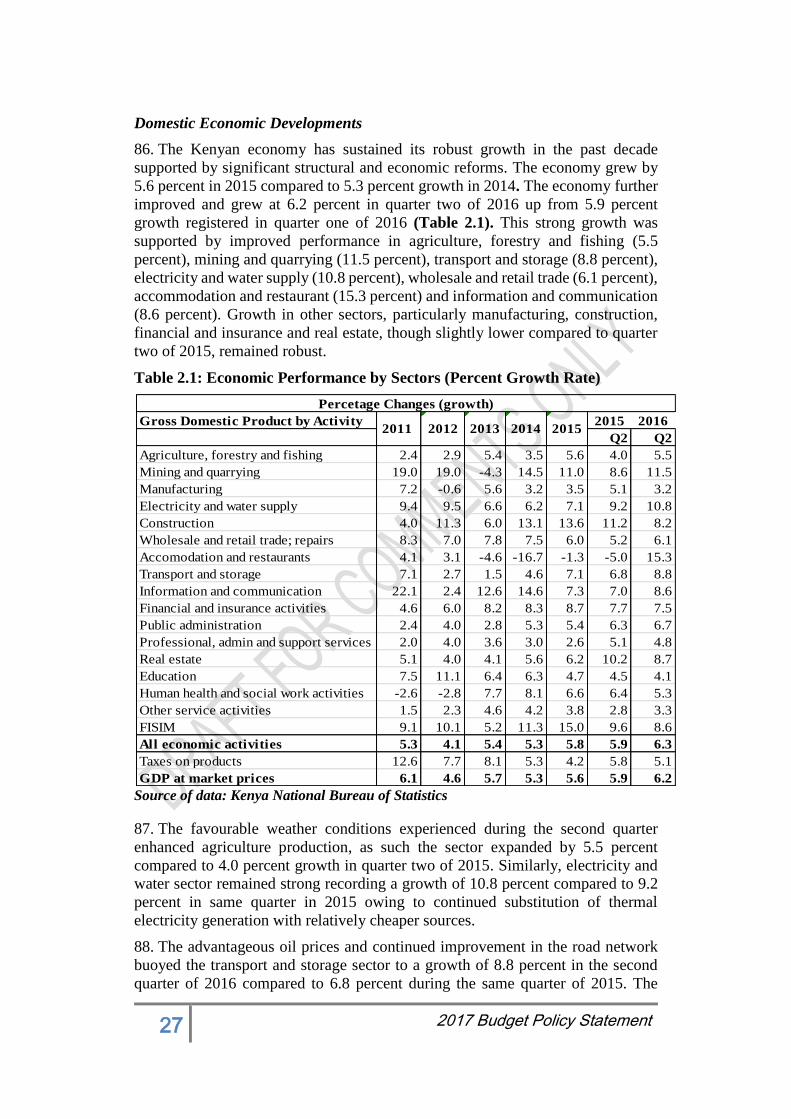
growth registered in quarter one of 2016 (Table 2.1). This strong growth was
supported by improved performance in agriculture, forestry and fishing (5.5
percent), mining and quarrying (11.5 percent), transport and storage (8.8 percent),
electricity and water supply (10.8 percent), wholesale and retail trade (6.1 percent),
accommodation and restaurant (15.3 percent) and information and communication
(8.6 percent). Growth in other sectors, particularly manufacturing, construction,
financial and insurance and real estate, though slightly lower compared to quarter
two of 2015, remained robust.
Table 2.1: Economic Performance by Sectors (Percent Growth Rate)
Source of data: Kenya National Bureau of Statistics
87. The favourable weather conditions experienced during the second quarter
enhanced agriculture production, as such the sector expanded by 5.5 percent
compared to 4.0 percent growth in quarter two of 2015. Similarly, electricity and
water sector remained strong recording a growth of 10.8 percent compared to 9.2
percent in same quarter in 2015 owing to continued substitution of thermal
electricity generation with relatively cheaper sources.
88. The advantageous oil prices and continued improvement in the road network
buoyed the transport and storage sector to a growth of 8.8 percent in the second
quarter of 2016 compared to 6.8 percent during the same quarter of 2015. The
Gross Domestic Product by Activity
Q2 Q2
Agriculture, forestry and fishing 2.4 2.9 5.4 3.5 5.6 4.0 5.5
Mining and quarrying 19.0 19.0 -4.3 14.5 11.0 8.6 11.5
Manufacturing 7.2 -0.6 5.6 3.2 3.5 5.1 3.2
Electricity and water supply 9.4 9.5 6.6 6.2 7.1 9.2 10.8
Construction 4.0 11.3 6.0 13.1 13.6 11.2 8.2
Wholesale and retail trade; repairs 8.3 7.0 7.8 7.5 6.0 5.2 6.1
Accomodation and restaurants 4.1 3.1 -4.6 -16.7 -1.3 -5.0 15.3
Transport and storage 7.1 2.7 1.5 4.6 7.1 6.8 8.8
Information and communication 22.1 2.4 12.6 14.6 7.3 7.0 8.6
Financial and insurance activities 4.6 6.0 8.2 8.3 8.7 7.7 7.5
Public administration 2.4 4.0 2.8 5.3 5.4 6.3 6.7
Professional, admin and support services 2.0 4.0 3.6 3.0 2.6 5.1 4.8
Real estate 5.1 4.0 4.1 5.6 6.2 10.2 8.7
Education 7.5 11.1 6.4 6.3 4.7 4.5 4.1
Human health and social work activities -2.6 -2.8 7.7 8.1 6.6 6.4 5.3
Other service activities 1.5 2.3 4.6 4.2 3.8 2.8 3.3
FISIM 9.1 10.1 5.2 11.3 15.0 9.6 8.6
All economic activities 5.3 4.1 5.4 5.3 5.8 5.9 6.3
Taxes on products 12.6 7.7 8.1 5.3 4.2 5.8 5.1
GDP at market prices 6.1 4.6 5.7 5.3 5.6 5.9 6.2
Percetage Changes (growth)
2011 2012 2013 20142015 2016
2015
28 2017 Budget Policy Statement
accommodation and restaurants sector recorded an impressive growth of 15.3
percent in quarter two of 2016 from a contraction of 5 percent in the same quarter
of 2015. The growth was on account of improved security and rigorous marketing
initiatives that boosted conference tourism as well as the general tourism.
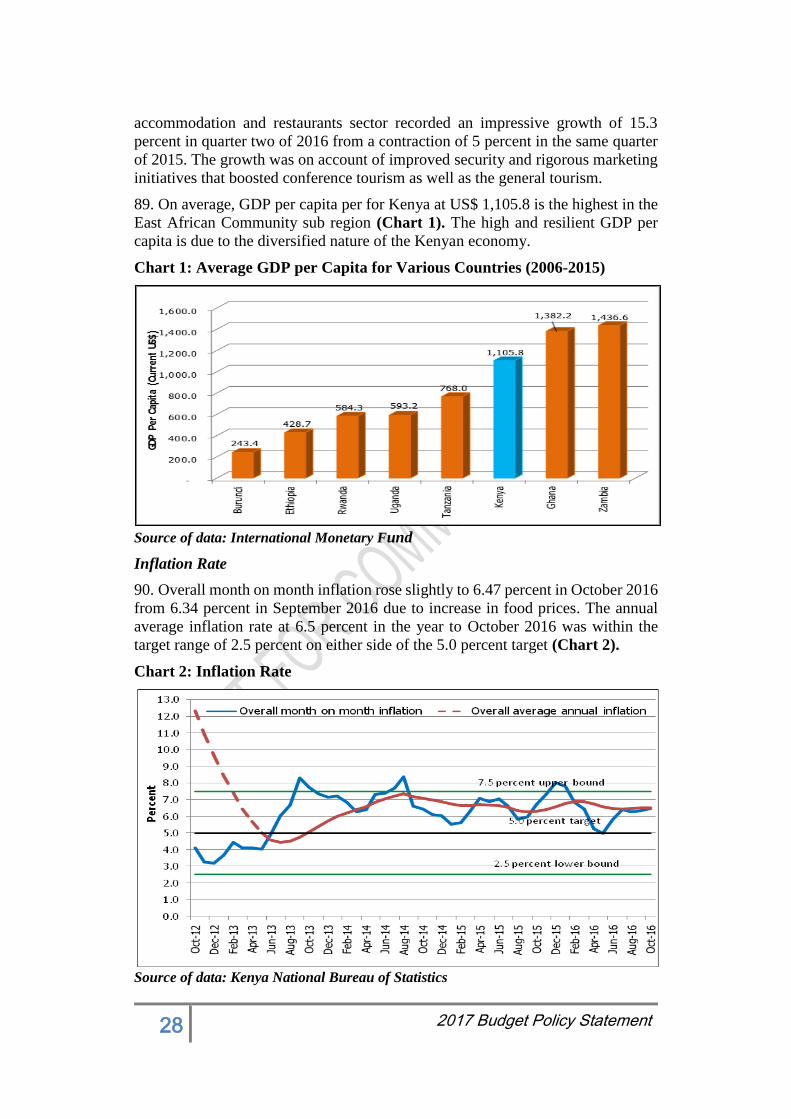
89. On average, GDP per capita per for Kenya at US$ 1,105.8 is the highest in the
East African Community sub region (Chart 1). The high and resilient GDP per
capita is due to the diversified nature of the Kenyan economy.
Chart 1: Average GDP per Capita for Various Countries (2006-2015)
Source of data: International Monetary Fund
Inflation Rate
90. Overall month on month inflation rose slightly to 6.47 percent in October 2016
from 6.34 percent in September 2016 due to increase in food prices. The annual
average inflation rate at 6.5 percent in the year to October 2016 was within the
target range of 2.5 percent on either side of the 5.0 percent target (Chart 2).
Chart 2: Inflation Rate
Source of data: Kenya National Bureau of Statistics

29 2017 Budget Policy Statement
91. Inflation rates within the EAC region have remained low due to prudent
monetary and fiscal policy management and lower oil and commodity prices
(Chart 3). High inflation rates in Ghana, Nigeria and Zambia reflects difficult
economic conditions as a result of foreign currency shortages resulting from lower
commodity revenues and slow policy adjustment.
Chart 3: Inflation Rates in selected African Countries (September 2016)
Source of data: National Central Banks
Kenya Shilling Exchange Rate
92. The Kenya Shilling exchange rate has continued to display relatively less
volatility compared with the major regional currencies and strengthened by 1.4
percent for the period October 2015 to October 2016 (Chart 4). The stability of
the Kenya shilling exchange rate reflects improved export earnings from tea and
horticulture, a reduction in the imports of petroleum products due to lower oil
prices, resilient Diaspora remittances and improved tourism performance.
93. In the Sub Saharan Africa region, large currency depreciations especially in
Nigeria reflects challenging macroeconomic conditions as the countries adjust to
lower commodity revenues.
Chart 4: Selected Currencies Performance against the US Dollar (Oct 2015 -
Oct 2016)
Source of data: National Central Banks
30 2017 Budget Policy Statement
94. The Kenya Shilling exchange rate strengthened in October 2016 against major
international currencies. The currency traded at Ksh 101.3 against the US dollar,
Ksh 111.9 against the Euro and Ksh 125.4 against the Sterling Pound in October
2016 compared to Ksh 102.8, Ksh 115.4 and Ksh 157.4 respectively, in October
2015.
Interest Rates
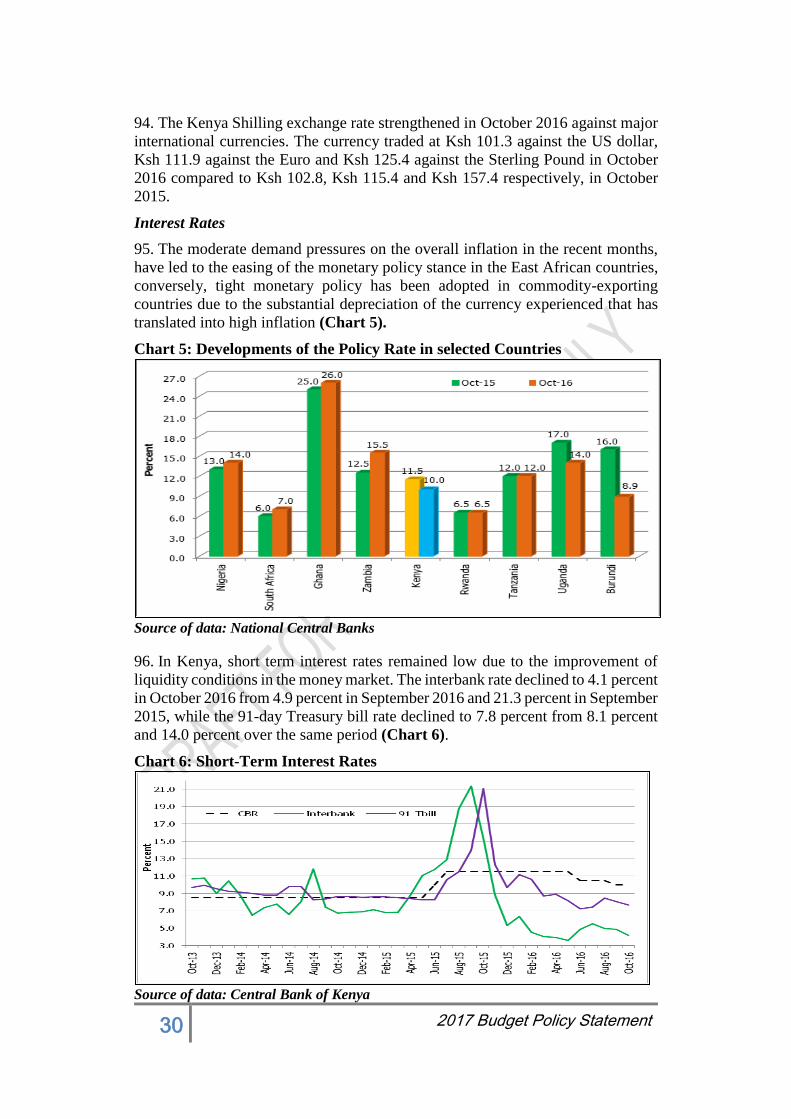
95. The moderate demand pressures on the overall inflation in the recent months,
have led to the easing of the monetary policy stance in the East African countries,
conversely, tight monetary policy has been adopted in commodity-exporting
countries due to the substantial depreciation of the currency experienced that has
translated into high inflation (Chart 5).
Chart 5: Developments of the Policy Rate in selected Countries
Source of data: National Central Banks
96. In Kenya, short term interest rates remained low due to the improvement of
liquidity conditions in the money market. The interbank rate declined to 4.1 percent
in October 2016 from 4.9 percent in September 2016 and 21.3 percent in September
2015, while the 91-day Treasury bill rate declined to 7.8 percent from 8.1 percent
and 14.0 percent over the same period (Chart 6).
Chart 6: Short-Term Interest Rates
Source of data: Central Bank of Kenya
31 2017 Budget Policy Statement
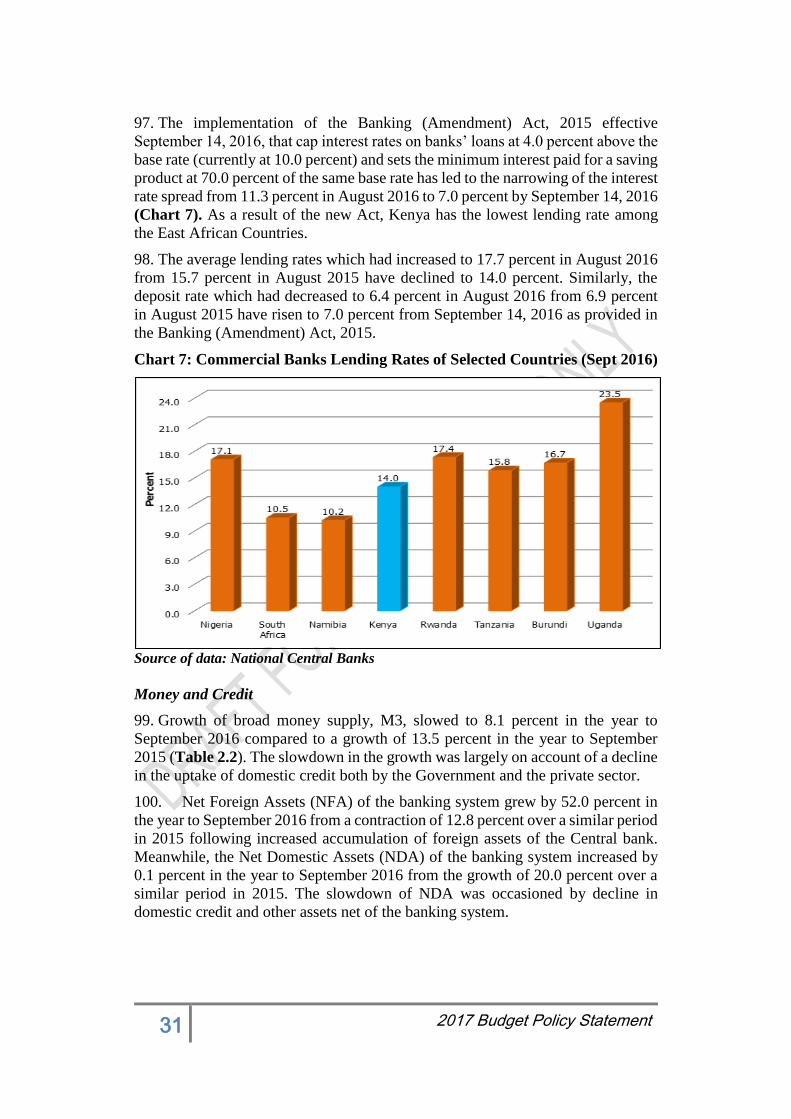
97. The implementation of the Banking (Amendment) Act, 2015 effective
September 14, 2016, that cap interest rates on banks’ loans at 4.0 percent above the
base rate (currently at 10.0 percent) and sets the minimum interest paid for a saving
product at 70.0 percent of the same base rate has led to the narrowing of the interest
rate spread from 11.3 percent in August 2016 to 7.0 percent by September 14, 2016
(Chart 7). As a result of the new Act, Kenya has the lowest lending rate among
the East African Countries.
98. The average lending rates which had increased to 17.7 percent in August 2016
from 15.7 percent in August 2015 have declined to 14.0 percent. Similarly, the
deposit rate which had decreased to 6.4 percent in August 2016 from 6.9 percent
in August 2015 have risen to 7.0 percent from September 14, 2016 as provided in
the Banking (Amendment) Act, 2015.
Chart 7: Commercial Banks Lending Rates of Selected Countries (Sept 2016)
Source of data: National Central Banks
Money and Credit
99. Growth of broad money supply, M3, slowed to 8.1 percent in the year to
September 2016 compared to a growth of 13.5 percent in the year to September
2015 (Table 2.2). The slowdown in the growth was largely on account of a decline
in the uptake of domestic credit both by the Government and the private sector.
100. Net Foreign Assets (NFA) of the banking system grew by 52.0 percent in
the year to September 2016 from a contraction of 12.8 percent over a similar period
in 2015 following increased accumulation of foreign assets of the Central bank.
Meanwhile, the Net Domestic Assets (NDA) of the banking system increased by
0.1 percent in the year to September 2016 from the growth of 20.0 percent over a
similar period in 2015. The slowdown of NDA was occasioned by decline in
domestic credit and other assets net of the banking system.
32 2017 Budget Policy Statement
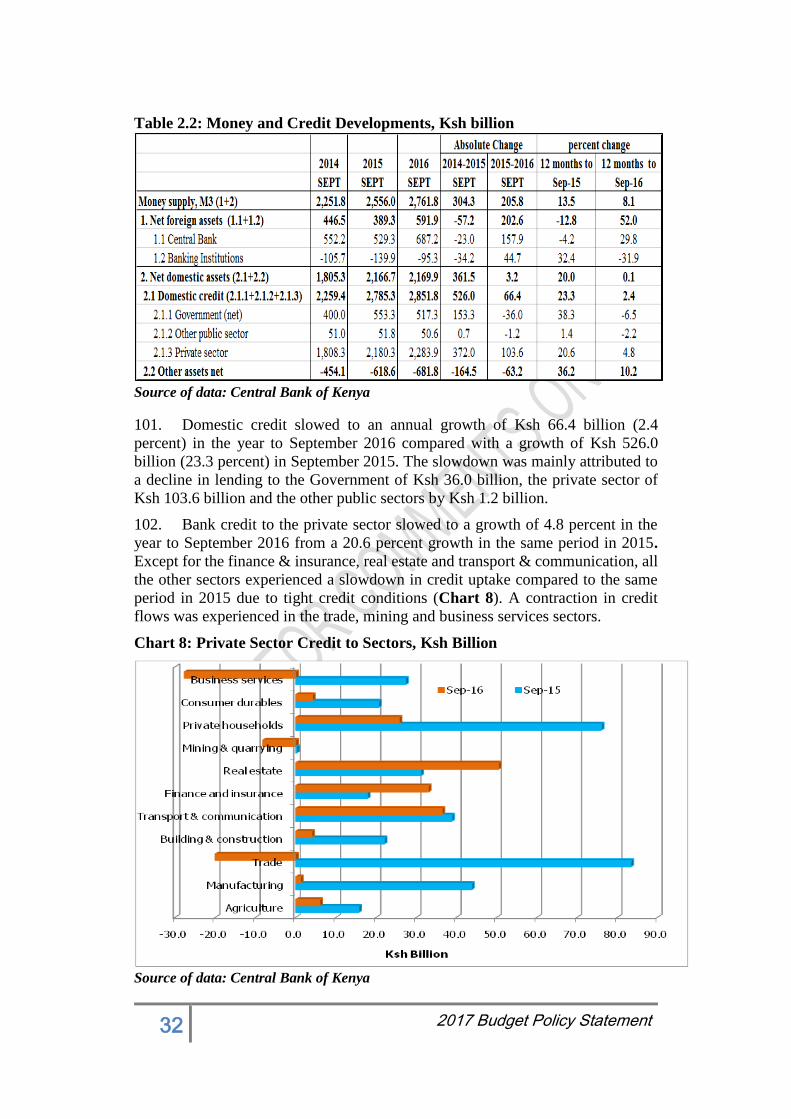
Table 2.2: Money and Credit Developments, Ksh billion
Source of data: Central Bank of Kenya
101. Domestic credit slowed to an annual growth of Ksh 66.4 billion (2.4
percent) in the year to September 2016 compared with a growth of Ksh 526.0
billion (23.3 percent) in September 2015. The slowdown was mainly attributed to
a decline in lending to the Government of Ksh 36.0 billion, the private sector of
Ksh 103.6 billion and the other public sectors by Ksh 1.2 billion.
102. Bank credit to the private sector slowed to a growth of 4.8 percent in the
year to September 2016 from a 20.6 percent growth in the same period in 2015.
Except for the finance & insurance, real estate and transport & communication, all
the other sectors experienced a slowdown in credit uptake compared to the same
period in 2015 due to tight credit conditions (Chart 8). A contraction in credit
flows was experienced in the trade, mining and business services sectors.
Chart 8: Private Sector Credit to Sectors, Ksh Billion
Source of data: Central Bank of Kenya
33 2017 Budget Policy Statement
External Sector Developments
103. The overall balance of payments position recorded a deficit of US$ 1,225
million in the year to August 2016 from a surplus of US$ 716 million in the year
to August 2015. As a share to GDP, the current account deficit improved to 5.9
percent in August 2016 from 7.9 percent in August 2015. This is attributed to a
22.5 percent improvement in the value of the merchandise account reflecting a
decline in payments for merchandise imports (Chart 9).
Chart 9: Balance of Payments
Source of data: Central Bank of Kenya
104. The decline in commodity prices has adversely impacted the exports of
Africa’s major exporters of non-oil, non-renewable resources. In some cases, this
has more than offset the improvement in the oil trade balance resulting to the
widening of the current account balance (Chart 10). In oil rich countries, the
current account balances tend to swing from large surpluses to large deficits and
these swings are typically accompanied by declines in international reserves.
Chart 10: Current Account Balance (Percent of GDP) for Selected Countries
Source of data: International Monetary Fund
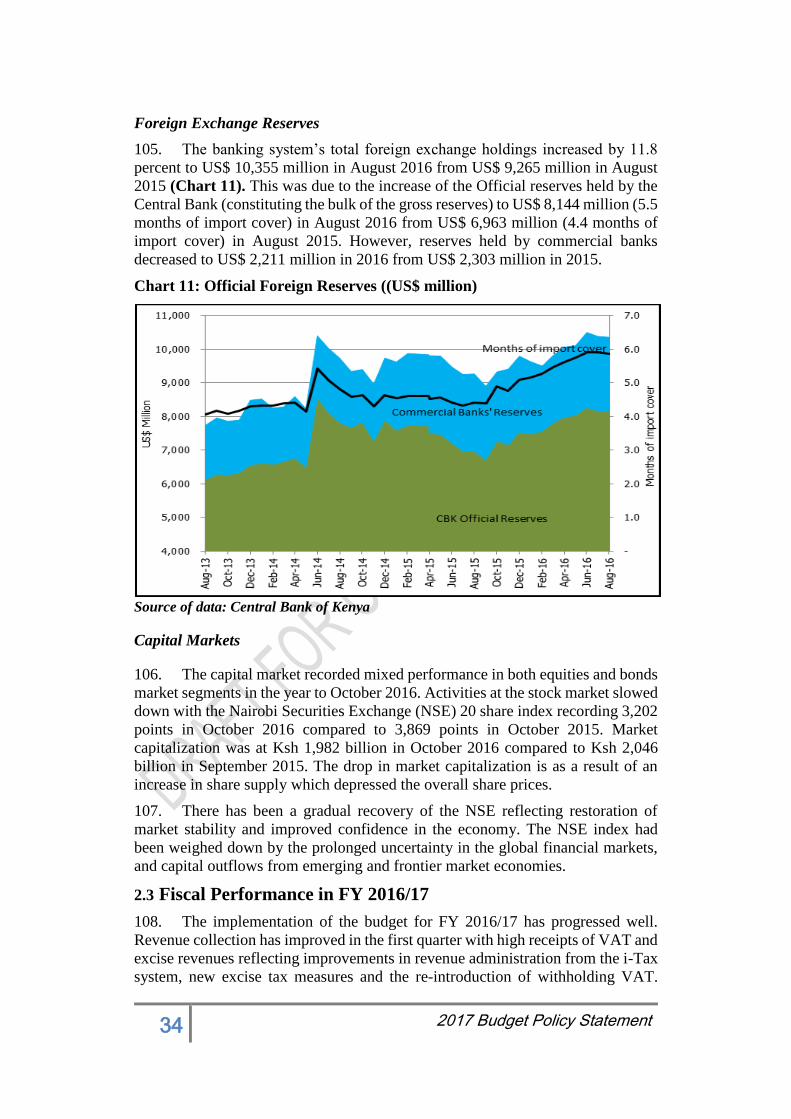
34 2017 Budget Policy Statement
Foreign Exchange Reserves
105. The banking system’s total foreign exchange holdings increased by 11.8
percent to US$ 10,355 million in August 2016 from US$ 9,265 million in August
2015 (Chart 11). This was due to the increase of the Official reserves held by the
Central Bank (constituting the bulk of the gross reserves) to US$ 8,144 million (5.5
months of import cover) in August 2016 from US$ 6,963 million (4.4 months of
import cover) in August 2015. However, reserves held by commercial banks
decreased to US$ 2,211 million in 2016 from US$ 2,303 million in 2015.
Chart 11: Official Foreign Reserves ((US$ million)
Source of data: Central Bank of Kenya
Capital Markets
106. The capital market recorded mixed performance in both equities and bonds
market segments in the year to October 2016. Activities at the stock market slowed
down with the Nairobi Securities Exchange (NSE) 20 share index recording 3,202
points in October 2016 compared to 3,869 points in October 2015. Market
capitalization was at Ksh 1,982 billion in October 2016 compared to Ksh 2,046
billion in September 2015. The drop in market capitalization is as a result of an
increase in share supply which depressed the overall share prices.
107. There has been a gradual recovery of the NSE reflecting restoration of
market stability and improved confidence in the economy. The NSE index had
been weighed down by the prolonged uncertainty in the global financial markets,
and capital outflows from emerging and frontier market economies.
2.3 Fiscal Performance in FY 2016/17
108. The implementation of the budget for FY 2016/17 has progressed well.
Revenue collection has improved in the first quarter with high receipts of VAT and
excise revenues reflecting improvements in revenue administration from the i-Tax
system, new excise tax measures and the re-introduction of withholding VAT.
35 2017 Budget Policy Statement
Expenditures lagged behind their respective targets during the first quarter but are
expected to pick up in the next quarter as implementation of development
programmes and the general activity of Government gain pace.
109. By the end of September 2016, total cumulative revenue including A-I-A
collected amounted to Ksh 313.6 billion against a target of Ksh 328.0, representing
a shortfall of Ksh 14.4 billion. The shortfall was as a result of the below target
collection of the ordinary revenue by Ksh 14.4 billion and the ministerial A-I-A by
Ksh 10.6 billion. The shortfall in ordinary revenue was mainly on account of
underperformance in import related revenues and VAT imports.
110. The total expenditure and net lending for the first quarter of FY 2016/17
amounted to Ksh 387.6 billion, against a target of Ksh 526.9 billion. The shortfall
of Ksh 139.2 billion was attributed to lower absorption recorded in both recurrent
and development expenditures by the National Government and County
Governments. Recurrent expenditure for National Government amounted to Ksh
230.2 billion (excl. Ksh 7,486 billion for Parliament and Judiciary), against a target
of Ksh 287.9 billion, with underperformance recorded in wages and salaries, and
Operation and Maintenance which accounted for Ksh 15.1 billion, and Ksh 38.8
billion, respectively.
111. The combined effect of the revenue and expenditure performance in the
first quarter of FY 2016/17 resulted to an overall fiscal deficit, on a commitment
basis (including grants) of Ksh 72.5 billion (equivalent to 1.1 percent of GDP)
against a targeted deficit of Ksh 182.3 billion. This deficit was financed through
foreign borrowing amounting to Ksh 39.2 billion and net domestic financing
amounting to Ksh 49.4 billion.
112. Net domestic financing amounted to Ksh 49.4 billion against a target of
Ksh 96.6 billion by end September 2016, an under performance of Ksh 47.2 billion.
The net domestic borrowing of Ksh 49.4 billion comprised borrowing through
government securities of Ksh 76.3 billion and net repayment of other domestic
borrowing of Ksh 40.7, less accumulation of government deposits of Ksh 13.8
billion.
2.4 FY 2016/17 Revised Fiscal Estimates
113. In view of the constrained fiscal developments to end September 2016, the
Government has slightly revised downwards its revenue projections for the
financial year on account of weaker than expected performance to September 2016.
114. Revenue inclusive of A-I-A are projected to fall short of the previous
estimates by Ksh 5.2 billion, reflecting projected reduction in ordinary revenues by
Ksh 18.8 billion and increase in A-I-A by Ksh 13.7 billion. The downward revision
in ordinary revenues is on account of projected shortfalls in Import duty (Ksh 8.7
billion), Income tax (Ksh 9.3 billion) largely on account of PAYE and VAT by
Ksh 5.9 billion. However, excise revenues have been revised upwards by Ksh 5.6
billion due to the positive outlook of the new excise tax measures.
115. In addition, the Government has instituted various measures aimed at
aligning the expenditures within the revised resource envelope. These include

36 2017 Budget Policy Statement
measures to curb non priority expenditures and to free resources for more
productive purposes as well as expenditures cuts on slow and delayed projects.
116. In summary, the revised fiscal framework reflects overall reduction in
revenues by Ksh 5.2 billion from Ksh 1,500.5 billion to Ksh 1,495.3 billion; and a
reduction in total expenditures and net lending by Ksh 202.0 billion, from Ksh
2,275.6 billion to Ksh 2,073.6 billion. The deficit, inclusive of grants, is, therefore,
projected to decline from Ksh 702.3 billion to Ksh 546.5 billion (equivalent to 7.5
percent of GDP). Borrowing from the domestic market has been revised upwards
to Ksh 254.9 billion from Ksh 236.1 billion in the budget. The overall impact of
these developments is reflected in Table 2.3.
Table 2.3 Revised Fiscal Framework (Ksh Million)
Source: National Treasury
37 2017 Budget Policy Statement
2.5 Adherence to Fiscal Responsibility Principles
117. The Government recognizes that the fiscal stance it takes today will have
implications into the future. Therefore, and in line with the Constitution and the
Public Finance Management (PFM) Act of 2012, the principle of sharing the
burdens and benefits of the use of resources and public borrowing between the
present and future generation implies that we have to make prudent policy
decisions today so that we do not impose an unwarranted debt burden on future
generations. Also to ensure that development portfolio is not crowded out by both
the National and County Governments, we shall ensure adherence to the ratio of
development to recurrent expenditures of at least 30:70 over the medium term, as
set out in the PFM Act.
118. The National Government will observe strictly regulation 26 (1) (a) of the
PFM Act, which requires that the national government’s expenditure on the
compensation of employees (including benefits and allowances) shall not exceed
35 percent of the national government’s equitable share of the revenue. It is
expected that county governments will also strictly adhere to this requirement as
stipulated in the PFM regulations 25 (1) (b) (County Regulations) and those that
are already in breach to take remedial measures as provided in the regulations.
119. In addition, the national and county governments will through
implementation of the e-procurement module of the IFMIS apply prudent
expenditure management on items such as office supplies and their pricing that
should, as much as possible, reflect actual market prices. Time for paying for goods
and services should be reduced to enable Government get competitive prices in the
market.
120. The respect and observance of these fiscal rules set out in the PFM law and
its regulations is important and necessary to entrench fiscal discipline. Observance
of the Fiscal responsibility principles, as stipulated by the Constitution and the
PFM Act, 2012, has been as follows:
a) The National Government’s development as a percent of total budget was
39.4 percent in FY 2015/16 as shown in Table 2.4. It is budgeted at 37.4
percent in FY 2016/17 and projected at 36.8 percent in the FY 2017/18 and
37.3 percent in FY 2018/19. These resources for development are above the
30 percent minimum threshold set out in the PFM law.

38 2017 Budget Policy Statement
Table 2.4: Revenues and Expenditures, (Ksh billion)
Source: National Treasury
b) On compensation of employees, the share to National Government revenues
was 31.7 percent in FY 2015/16, and is projected at 29.7 percent in FY
2016/17 and at 28.3 percent in the FY 2017/18. These ratios demonstrate the
commitment to the fiscal responsibility principle of ensuring that the national
government’s expenditure on wages and benefits for public officers shall not
exceed a percentage of the national government revenue as prescribed by the
regulations 26(1)(a).
c) Another fiscal responsibility principle requires that the national government’s
borrowings be used only for the purpose of financing development
expenditure and not for recurrent expenditure. This principle continues to be
adhered to by the government ensuring that its policy as set out in the Medium
Term Debt Strategy and other policy documents requires that external
financing is done only for development purposes.
d) The National government is required to maintain Public debt and obligations
at a sustainable level as approved by Parliament. The Government borrowing
level is set in the Medium Term Debt Strategy approved by the National
Assembly. The strategy aims at ensuring public debt sustainability and
minimizing the level of contingent liabilities. The Government is committed
to adherence to this principle at all times. Our debt ratios compared with
internationally recognized threshold continues to show that our debt level
remains sustainable (Tables 2.5a and 2.5b). The baseline public debt path
remains consistent with the EAC convergence criteria (deficit and debt) and
below the relevant public debt benchmark.
2013/14
Act. Prel. Budget Revised BROP'15 BPS'16 BROP'15 BPS'16 BROP'15 BPS'16
1.0 Total Expenditures & Net Lending 1,300.6 1,639.2 1,970.8 1,890.2 2,099.2 2,064.0 2,320.3 2,219.9 2,523.5 2,391.5
1.1 Total National Govt Expenses 1,107.2 1,409.9 1,712.8 1,630.4 1,824.1 1,783.7 2,003.6 1,922.3 2,173.9 2,073.1
Total Recurrent 787.9 895.2 1,021.6 989.7 1,112.0 1,094.2 1,199.9 1,193.8 1,264.8 1,278.4
CFS (Interest & Pensions) 165.0 209.4 228.8 240.5 242.4 275.4 246.0 292.1 250.5 307.1
Total ministerial Reccurrent 622.9 685.8 792.9 749.2 869.6 818.8 953.9 901.6 1,014.3 971.2
Wages & Salaries /1 281.2 298.0 315.4 333.5 360.8 360.8 396.9 396.9 436.6 436.5
Wages & Salaries as % of National Government Revenues/1 36.0% 33.9% 28.6% 31.7% 28.1% 29.7% 26.9% 28.3% 25.6% 27.0%
Development 319.3 509.7 711.6 642.9 699.6 667.7 791.3 706.5 893.2 772.2
Devt. as % of NG Expenditures 28.8% 36.2% 41.5% 39.4% 38.4% 37.4% 39.5% 36.8% 41.1% 37.3%
Domestic 200.7 268.1 362.2 328.9 419.2 351.4 550.9 410.6 636.8 462.8
External 118.6 241.2 349.5 308.0 280.4 310.4 240.4 290.4 256.4 300.8
Contingencies - 5.0 5.0 5.0 5.0 5.0 5.0 5.0 5.0 5.0
1.2 County Allocation 193.4 229.3 258.0 259.8 275.0 280.4 316.7 297.6 349.6 318.4
2.0 Total Revenues 974.4 1,108.5 1,360.1 1,313.2 1,560.4 1,496.3 1,791.5 1,702.2 2,051.8 1,933.7
3.0 Total National Govt - Revenues (Incl. A-I-A) 781.0 879.1 1,102.1 1,053.4 1,285.3 1,216.0 1,474.8 1,404.6 1,702.2 1,615.3
4.0 Net Domestic Financing 201.7 251.1 219.2 168.2 239.8 197.6 273.4 228.0 246.3 161.3
Of which: Sovereign Bond proceeds - 140.5 - - - - - - - -
Others 201.7 110.6 219.2 168.2 239.8 197.6 273.4 228.0 246.3 161.3
Source: National Treasury
/1 Salaries and Wages reflect the wages for civil service inclusive of the police and prison officers and teachers
2014/15 2015/16 2016/17 2017/18 2018/19
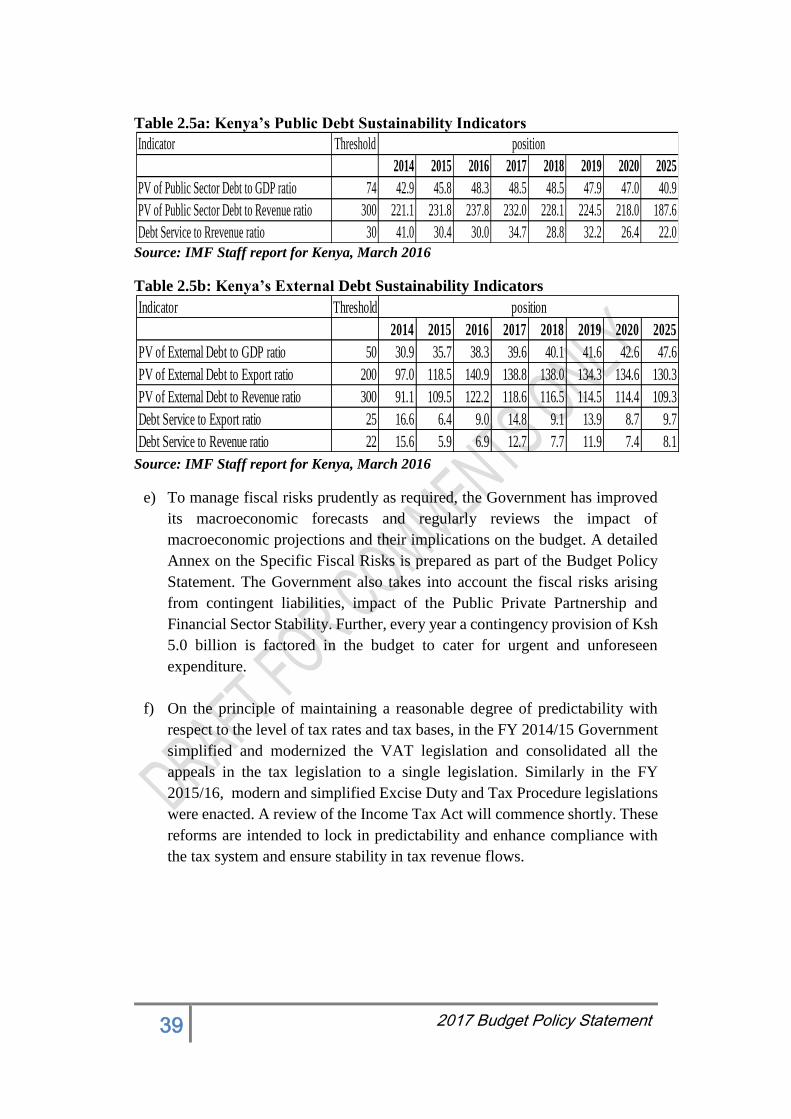
39 2017 Budget Policy Statement
Table 2.5a: Kenya’s Public Debt Sustainability Indicators
Source: IMF Staff report for Kenya, March 2016
Table 2.5b: Kenya’s External Debt Sustainability Indicators
Source: IMF Staff report for Kenya, March 2016
e) To manage fiscal risks prudently as required, the Government has improved
its macroeconomic forecasts and regularly reviews the impact of
macroeconomic projections and their implications on the budget. A detailed
Annex on the Specific Fiscal Risks is prepared as part of the Budget Policy
Statement. The Government also takes into account the fiscal risks arising
from contingent liabilities, impact of the Public Private Partnership and
Financial Sector Stability. Further, every year a contingency provision of Ksh
5.0 billion is factored in the budget to cater for urgent and unforeseen
expenditure.
f) On the principle of maintaining a reasonable degree of predictability with
respect to the level of tax rates and tax bases, in the FY 2014/15 Government
simplified and modernized the VAT legislation and consolidated all the
appeals in the tax legislation to a single legislation. Similarly in the FY
2015/16, modern and simplified Excise Duty and Tax Procedure legislations
were enacted. A review of the Income Tax Act will commence shortly. These
reforms are intended to lock in predictability and enhance compliance with
the tax system and ensure stability in tax revenue flows.
Indicator Threshold
2014 2015 2016 2017 2018 2019 2020 2025
PV of Public Sector Debt to GDP ratio 74 42.9 45.8 48.3 48.5 48.5 47.9 47.0 40.9
PV of Public Sector Debt to Revenue ratio 300 221.1 231.8 237.8 232.0 228.1 224.5 218.0 187.6
Debt Service to Rrevenue ratio 30 41.0 30.4 30.0 34.7 28.8 32.2 26.4 22.0
position
Indicator Threshold
2014 2015 2016 2017 2018 2019 2020 2025
PV of External Debt to GDP ratio 50 30.9 35.7 38.3 39.6 40.1 41.6 42.6 47.6
PV of External Debt to Export ratio 200 97.0 118.5 140.9 138.8 138.0 134.3 134.6 130.3
PV of External Debt to Revenue ratio 300 91.1 109.5 122.2 118.6 116.5 114.5 114.4 109.3
Debt Service to Export ratio 25 16.6 6.4 9.0 14.8 9.1 13.9 8.7 9.7
Debt Service to Revenue ratio 22 15.6 5.9 6.9 12.7 7.7 11.9 7.4 8.1
position
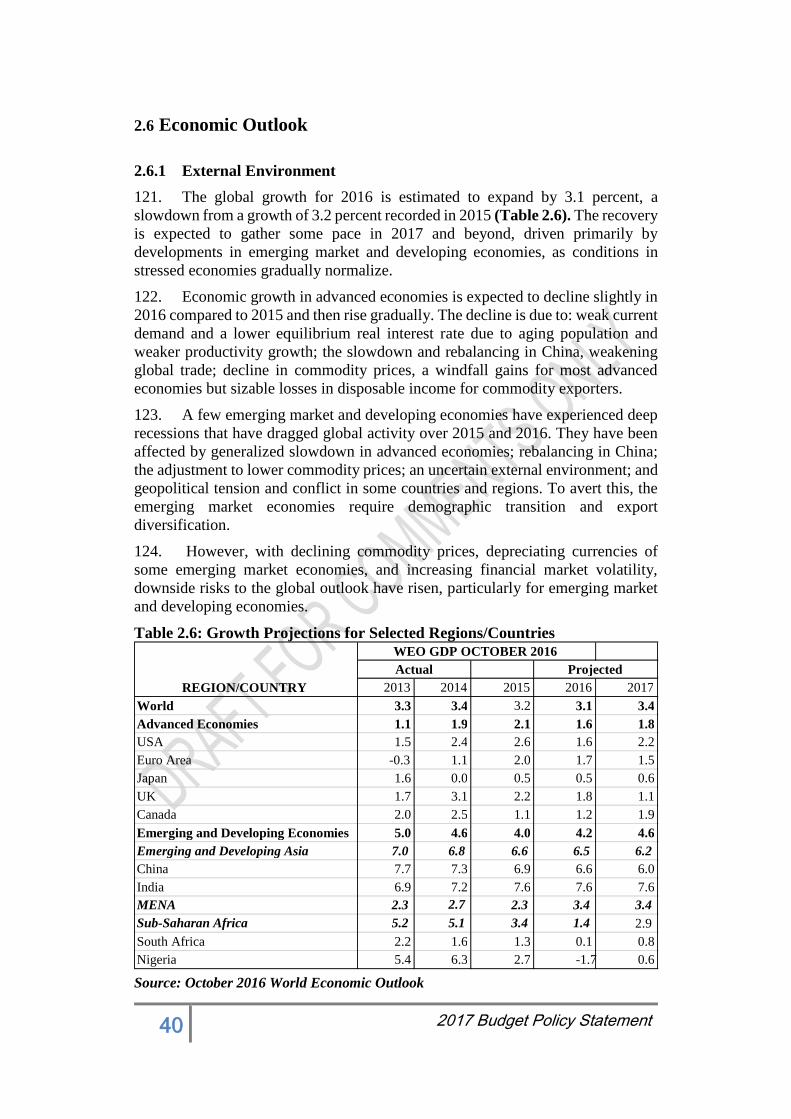
40 2017 Budget Policy Statement
2.6 Economic Outlook
2.6.1 External Environment
121. The global growth for 2016 is estimated to expand by 3.1 percent, a
slowdown from a growth of 3.2 percent recorded in 2015 (Table 2.6). The recovery
is expected to gather some pace in 2017 and beyond, driven primarily by
developments in emerging market and developing economies, as conditions in
stressed economies gradually normalize.
122. Economic growth in advanced economies is expected to decline slightly in
2016 compared to 2015 and then rise gradually. The decline is due to: weak current
demand and a lower equilibrium real interest rate due to aging population and
weaker productivity growth; the slowdown and rebalancing in China, weakening
global trade; decline in commodity prices, a windfall gains for most advanced
economies but sizable losses in disposable income for commodity exporters.
123. A few emerging market and developing economies have experienced deep
recessions that have dragged global activity over 2015 and 2016. They have been
affected by generalized slowdown in advanced economies; rebalancing in China;
the adjustment to lower commodity prices; an uncertain external environment; and
geopolitical tension and conflict in some countries and regions. To avert this, the
emerging market economies require demographic transition and export
diversification.
124. However, with declining commodity prices, depreciating currencies of
some emerging market economies, and increasing financial market volatility,
downside risks to the global outlook have risen, particularly for emerging market
and developing economies.
Table 2.6: Growth Projections for Selected Regions/Countries
Source: October 2016 World Economic Outlook
2013 2014 2015 2016 2017
World 3.3 3.4 3.2 3.1 3.4 Advanced Economies 1.1 1.9 2.1 1.6 1.8 USA 1.5 2.4 2.6 1.6 2.2 Euro Area -0.3 1.1 2.0 1.7 1.5 Japan 1.6 0.0 0.5 0.5 0.6 UK 1.7 3.1 2.2 1.8 1.1 Canada 2.0 2.5 1.1 1.2 1.9
Emerging and Developing Economies 5.0 4.6 4.0 4.2 4.6 Emerging and Developing Asia 7.0 6.8 6.6 6.5 6.2 China 7.7 7.3 6.9 6.6 6.0 India 6.9 7.2 7.6 7.6 7.6 MENA 2.3 2.7 2.3 3.4 3.4 Sub-Saharan Africa 5.2 5.1 3.4 1.4 2.9
South Africa 2.2 1.6 1.3 0.1 0.8 Nigeria 5.4 6.3 2.7 -1.7 0.6
REGION/COUNTRY Actual WEO GDP OCTOBER 2016
Projected
41 2017 Budget Policy Statement
125. Growth in Sub-Saharan Africa is expected to weaken from 3.4 percent in
2015 to 1.4 percent in 2016, occasioned by the repercussions of declining
commodity prices, particularly those for oil, as well as lower demand from China,
the largest single trading partner of sub-Saharan Africa, and the tightening of
global financial conditions for the region’s frontier market economies. Among the
region’s oil importers, a majority will continue to experience solid growth,
especially low-income countries, where investment in infrastructure continues and
private consumption remains strong. The growth will pick up in 2017 to 2.9
percent, driven by sustained infrastructure investment; buoyant services sectors,
and strong agricultural production, even as oil-related activities provide less
support.
2.6.2 Kenya’s Macroeconomic Prospects
126. Kenya’s economic growth prospects for the FY 2017/18 and the medium
term takes into account the global slower growth in demand, particularly
investment, which is especially pertinent to generate international trade flows in
the form of capital goods and intermediate inputs. Further, it takes cognizance of
the domestic environment including the general election to be held in August 2017.
The growth profile accommodates the strategic objectives of the Government as
outlined in the second Medium Term Plan (MTP) of Vision 2030, considering
progress made in implementation of key projects.
127. The outlook, therefore points to a continued robust growth, lower fiscal
deficits, contained inflation within the target range and a gradual improvement in
the external current account balance.
128. Real GDP is projected to expand by 6.0 percent in FY 2016/2017, 6.2
percent in FY 2017/2018, 6.5 percent in FY 2018/2019 and. 6.6 percent by FY
2019/20 (Table 2.7 and Annex Table 1). This high growth will be supported by
ongoing investments in infrastructural development, resilient domestic demand,
continued recovery in the tourism sector and growth of exports in the sub region.
In addition, the growth will be supported by structural reforms aimed at improving
competitiveness of the private sector and promoting overall productivity in the
economy.
129. Inflation is currently within set target and is expected to remain so in the
medium term underpinned by prudent monetary policy by the Central Bank of
Kenya. Interest rates have declined under the new interest rate regime following
assent to the Banking (Amendment) Act, 2015. The interest rates are expected to
remain low over the projection period. At the same time, the Kenya Shilling
exchange rate is expected to remain stable and competitive.
130. Kenya’s external position is projected to strengthen over the medium term
supported by a narrower current account deficit due to low international oil prices,
a slowdown in consumer imports, improved earnings from tea and horticulture
exports, and the resilient diaspora remittances
131. The fiscal policy aims at supporting rapid and inclusive economic growth,
ensuring sustainable debt position and at the same time supporting the devolved
system of Government for effective delivery of services. Consistent with this
objective, the policy is set to gradually reducing fiscal deficits, with a focus on
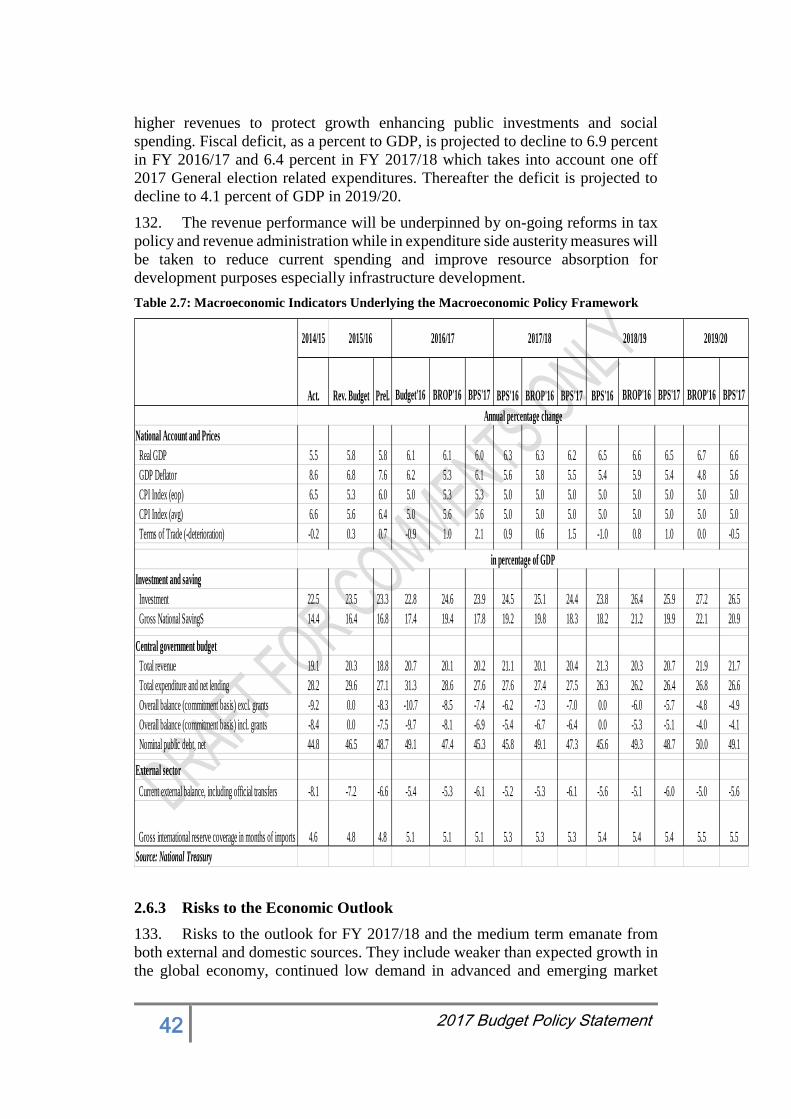
42 2017 Budget Policy Statement
higher revenues to protect growth enhancing public investments and social
spending. Fiscal deficit, as a percent to GDP, is projected to decline to 6.9 percent
in FY 2016/17 and 6.4 percent in FY 2017/18 which takes into account one off
2017 General election related expenditures. Thereafter the deficit is projected to
decline to 4.1 percent of GDP in 2019/20.
132. The revenue performance will be underpinned by on-going reforms in tax
policy and revenue administration while in expenditure side austerity measures will
be taken to reduce current spending and improve resource absorption for
development purposes especially infrastructure development.
Table 2.7: Macroeconomic Indicators Underlying the Macroeconomic Policy Framework
2.6.3 Risks to the Economic Outlook
133. Risks to the outlook for FY 2017/18 and the medium term emanate from
both external and domestic sources. They include weaker than expected growth in
the global economy, continued low demand in advanced and emerging market
Act. Rev. Budget Prel. Budget'16 BROP'16 BPS'17 BPS'16 BROP'16 BPS'17 BPS'16 BROP'16 BPS'17 BROP'16 BPS'17
National Account and Prices
Real GDP 5.5 5.8 5.8 6.1 6.1 6.0 6.3 6.3 6.2 6.5 6.6 6.5 6.7 6.6
GDP Deflator 8.6 6.8 7.6 6.2 5.3 6.1 5.6 5.8 5.5 5.4 5.9 5.4 4.8 5.6
CPI Index (eop) 6.5 5.3 6.0 5.0 5.3 5.3 5.0 5.0 5.0 5.0 5.0 5.0 5.0 5.0
CPI Index (avg) 6.6 5.6 6.4 5.0 5.6 5.6 5.0 5.0 5.0 5.0 5.0 5.0 5.0 5.0
Terms of Trade (-deterioration) -0.2 0.3 0.7 -0.9 1.0 2.1 0.9 0.6 1.5 -1.0 0.8 1.0 0.0 -0.5
Investment and saving
Investment 22.5 23.5 23.3 22.8 24.6 23.9 24.5 25.1 24.4 23.8 26.4 25.9 27.2 26.5
Gross National SavingS 14.4 16.4 16.8 17.4 19.4 17.8 19.2 19.8 18.3 18.2 21.2 19.9 22.1 20.9
Central government budget
Total revenue 19.1 20.3 18.8 20.7 20.1 20.2 21.1 20.1 20.4 21.3 20.3 20.7 21.9 21.7
Total expenditure and net lending 28.2 29.6 27.1 31.3 28.6 27.6 27.6 27.4 27.5 26.3 26.2 26.4 26.8 26.6
Overall balance (commitment basis) excl. grants -9.2 0.0 -8.3 -10.7 -8.5 -7.4 -6.2 -7.3 -7.0 0.0 -6.0 -5.7 -4.8 -4.9
Overall balance (commitment basis) incl. grants -8.4 0.0 -7.5 -9.7 -8.1 -6.9 -5.4 -6.7 -6.4 0.0 -5.3 -5.1 -4.0 -4.1
Nominal public debt, net 44.8 46.5 48.7 49.1 47.4 45.3 45.8 49.1 47.3 45.6 49.3 48.7 50.0 49.1
External sector
Current external balance, including official transfers -8.1 -7.2 -6.6 -5.4 -5.3 -6.1 -5.2 -5.3 -6.1 -5.6 -5.1 -6.0 -5.0 -5.6
Gross international reserve coverage in months of imports 4.6 4.8 4.8 5.1 5.1 5.1 5.3 5.3 5.3 5.4 5.4 5.4 5.5 5.5
Source: National Treasury
2014/15 2019/202015/16 2016/17 2017/18 2018/19
Annual percentage change
in percentage of GDP
43 2017 Budget Policy Statement
economies as well as the low commodity prices that may impact negatively on our
exports and tourism activities.
134. Further, the uncertainty in the global markets due to potential tightening of
US monetary policy and consequent increase in the US interest rates, Britain’s vote
to exit the European Union and persistent geopolitical uncertainty in the
international oil markets may have an impact on our economy.
135. Domestically, the economy is exposed to risks including any occurrence of
adverse weather conditions, public expenditure pressures especially recurrent
expenditures pose a fiscal risk and any inefficiency in spending government
resources that may lower impact of development expenditure, and potential
uncertainties associated with the run-up to 2017 elections that could lead to a wait-
and-see attitude by investors, thereby dampening short-term growth prospects.
136. The government will, however, continue to monitor the above risks and
will undertake appropriate measures to safeguard macroeconomic stability
wherever necessary.
2.7 Fiscal Policy and Outlook
137. The 2017 Medium-Term Fiscal Policy aims at supporting rapid and
inclusive economic growth, ensuring sustainable debt position and at the same time
supporting the devolved system of Government for effective delivery of services.
Our fiscal policy also indicates our deliberate convergence path towards the East
African Community Monetary Union protocol’s fiscal targets. Specifically, the
Fiscal policy underpinning the FY 2017/18 Budget and MTEF aims at raising
revenue from an estimated 20.2 percent of GDP in FY 2016/17 to 20.4 percent of
GDP in FY 2017/18 and 21.7 percent of GDP over the medium term while
containing growth of total expenditure. Total expenditures and net lending is
projected to decrease from 27.6 percent of GDP in FY 2016/17 to 27.5 percent of
GDP in FY 2017/18 and 26.6 percent of GDP over the medium term.
138. The overall fiscal deficit inclusive of grants is therefore projected to
decrease from 6.9 percent of GDP in FY 2016/17 to 6.4 percent in FY 2017/18 and
then decline to 4.1 percent of GDP over the medium term. The higher deficit
continues to reflect the implementation of the one off SGR project. Including
grants and excluding expenditures related to the SGR, the deficit declines from 5.5
percent of GDP in FY 2017/18 to 3.6 percent of GDP over the medium term.
139. This consolidation process will ensure smoother transition towards the
EAC convergence criterion on the deficit inclusive of grants of 3.0 percent of GDP
by FY 2020/21. Embedded in this policy is the aim to continue containing the
growth of recurrent expenditures in favour of capital investment so as to promote
sustainable and inclusive growth.
140. Despite the decline in the overall fiscal balance (after grants) over the
medium term, loan repayments will increase the public debt net of deposits from
47.2 percent of GDP in FY 2017/18 to about 49.0 percent of GDP by 2019/20. This
is however within the EAC convergence target of 50.0 percent of GDP.
44 2017 Budget Policy Statement
2.8 Deficit Financing Policy
141. The government will continue borrowing from domestic and external
sources mainly on concessional terms. Non-concessional external borrowing will
be limited to projects with viable expected returns and the ceiling stated in the
Medium-Term Debt Strategy paper. The Government will also continue
diversifying its sources of funds through accessing international capital markets.
Other alternative sources of financing the government may explore over the
medium term include; the Islamic financing instruments, the Samurai market,
Panda bonds and Diaspora bonds.
142. The Government’s borrowing plans remain anchored in the medium term
debt management strategy which aims at ensuring public debt sustainability. The
Government will ensure that the private sector is not crowded out through high
domestic borrowing levels. This is to ensure that their participation in the
development agenda is guaranteed in order to accelerate economic activities. This
will be achieved by ensuring transparency in the market through issuance of the
borrowing calendar and introduction of various products/initiatives aimed at
widening the investor base and increasing the retail participation in the government
securities market.
143. On the external financing front, the Government will minimize the degree
of foreign exchange rate risk exposure associated with the external debt portfolio
by adopting a deliberate approach in diversifying currency structure so as to hedge
against exchange rate risks especially to new loan commitments. A cautious
approach will be adopted in the issuance of external Government loan guarantees
and provision of government support to minimize the risk exposure to contingent
liabilities.
45 2017 Budget Policy Statement
III. FY 2017/18 BUDGET AND THE
MEDIUM TERM
144. The resource envelope available for allocation among the programmes is
based on the fiscal policy and medium term fiscal framework which is explained
as follows:
Revenue Projections
145. The fiscal framework for the FY 2017/18 Budget is set based on
macroeconomic policy framework set out in Chapter II.
146. The FY 2017/18 budget targets revenue collection including
Appropriation-in-Aid (AIA) of Ksh 1,694.1 billion (20.4 percent of GDP) from
Ksh 1,501.3 billion (20.2 percent of GDP) in FY 2016/17(Annex Tables 2 and 3).
This performance will be underpinned by on-going reforms in tax policy and
revenue administration. Ordinary revenues is projected at Ksh 1,549.4 billion (18.7
percent of GDP) in FY 2017/18 up from the projected Ksh 1,363.5 billion (18.3
percent of GDP) in FY 2016/17.
Expenditure Projections
147. In the FY 2017/18, total expenditure and net lending are projected at Ksh
2,275.9 billion (or 27.5 percent of GDP) from the estimated Ksh 2,048.8 billion
(27.6 percent of GDP) in the FY 2016/17 budget. Recurrent expenditures will
amount to Ksh 1,289.7 billion (15.6 percent of GDP) compared with Ksh 1,163.7
billion (15.7 percent of GDP) in FY 2016/17.
148. The wages and salaries for the National Government (excluding MDAs
whose budget is captured as current grants/transfer) in FY 2017/18 is projected at
4.8 percent of GDP.
149. Expenditure ceilings on goods and services for sectors/ministries are based
on funding allocation in the FY 2016/17 budget as the starting point. The ceilings
are then adjusted to take into account one-off expenditures in FY 2017/18.
150. The ceiling for development expenditures including foreign financed
projects (including net lending) in nominal terms amounts to Ksh 673.3 billion in
the FY 2017/18. Most of the outlays are expected to support critical infrastructure.
Part of the development budget will be funded by project loans and grants from
development partners, while the balance will be financed through domestic
resources.
151. A contingency of Ksh 5.0 billion is provided for in FY 2017/18. In addition,
Ksh 7.7 billion is provided for the Equalization Fund.

46 2017 Budget Policy Statement
Deficit Financing
152. Reflecting the projected expenditures and revenues, the fiscal deficit
(excluding grants), is projected at Ksh 581.8 billion (equivalent to 7.0 percent of
GDP) in FY 2017/18 against the estimated fiscal deficit of Ksh 547.5 billion (7.4
percent of GDP) in FY 2016/17. Including grants, the fiscal deficit is projected at
Ksh 529.8 billion (6.4 percent of GDP) in FY 2017/18 against the estimated fiscal
deficit of Ksh 515.8 billion (6.9 percent of GDP) in FY 2016/17.
153. Excluding expenditures related to the Standard Gauge Railway (SGR)
which is a one off expenditure, the deficit for the FY 2017/18 amounts to Ksh 457.8
billion or 5.5 percent of GDP.
154. The fiscal deficit in FY 2017/18, will be financed by net external financing
of Ksh 221.1 billion (2.7 percent of GDP) and Ksh 319.7 billion (3.9 percent of
GDP) from net domestic borrowing.
3.1 Budgetary Allocations for the FY 2017/18 - 2019/20 MTEF
155. The budgetary allocations to the three arms of Government as well as
sharable revenues to the Counties is summarised in Table 3.1 as follows:
Table 3.1: Summary Budget Allocations for the FY 2017/18 - 2019/20 MTEF
(Ksh Million)
Source: National Treasury
Key Priorities for the 2017/18 Medium Term Budget
156. The budget submissions by MDAs will critically be reviewed with a view
to remove any non-priority expenditures and shift the savings to the priority
programmes. The Second MTP (2013-2017) and the priorities of the Jubilee
Administration will guide resource allocation.
157. The Government is committed to improving the implementation and
absorption capacity of projects. In the FY 2016/17 and the medium term the
Development Budget is based on individual projects regardless of the source of
financing. This will help in monitoring and reporting on project implementation.
158. Taken as a whole, the budget for FY 2017/18 will focus on the following:
Capital investments in Energy, Infrastructure, ICT sector and other
development expenditure in general. This reflects the priority assigned to
capital investments in our growth objectives. The Energy, Infrastructure
Details 2016/2017 2017/2018 2018/2019 2019/2020
1 National Government 1,628,422.8 1,649,978.8 1,692,360.7 1,726,405.0
2 Parliament 31,480.0 30,915.1 31,693.5 32,646.1
3 The Judiciary 17,758.5 17,906.6 19,272.9 20,330.3
4 The County Government 284,784.6 307,878.0 332,410.5 359,475.2
Total 1,962,445.9 2,006,678.4 2,075,737.7 2,138,856.6
47 2017 Budget Policy Statement
and ICT Sector will receive 30.0 percent of total discretionary expenditures.
This is the largest share of the resource envelope. This reflects
Government’s commitment in improving infrastructure countrywide for
faster growth.
Enhancing support to social sectors (Social Protection, Health and
Education). These will continue to receive the bulk of budgetary resources
especially in education and health sectors. The Social Sectors will receive
28.2 percent of total discretionary expenditures.
159. Other priority areas including security, governance, justice, and agriculture
will be given priority in the allocation of resources.
Medium-Term Expenditure Estimates
160. Table 3.2 provides the projected baseline ceilings for the 2017 MTEF,
classified by sector.
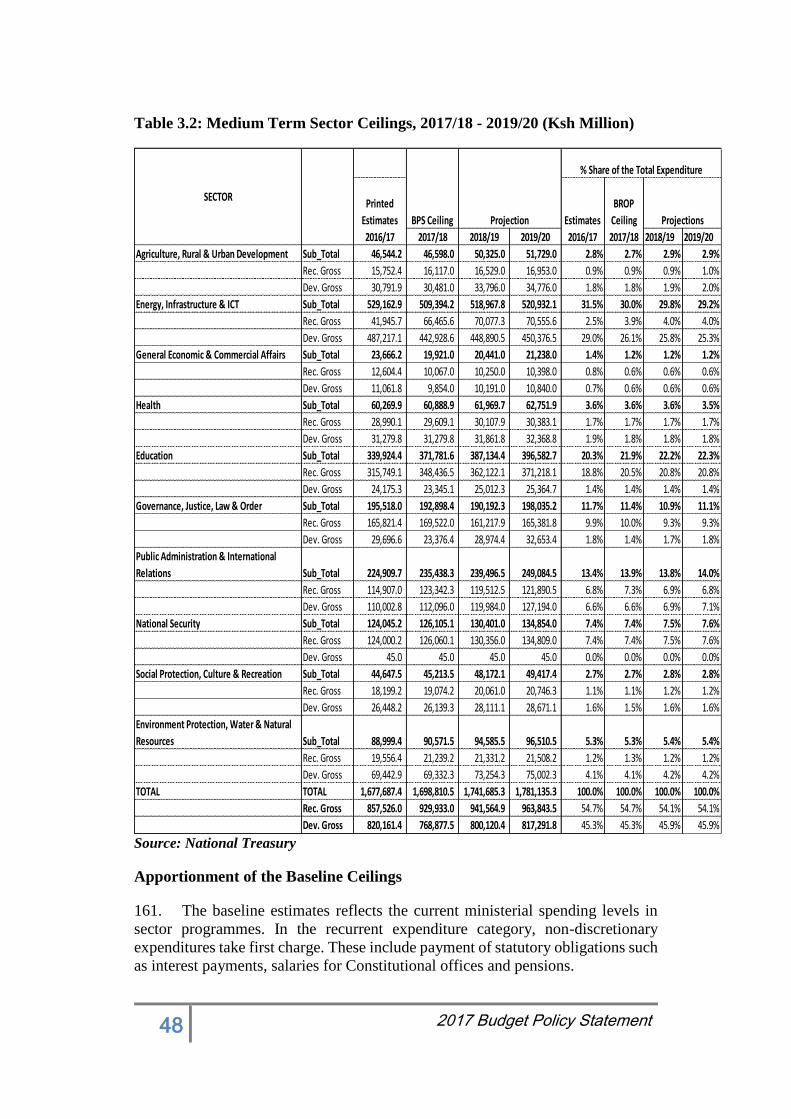
48 2017 Budget Policy Statement
Table 3.2: Medium Term Sector Ceilings, 2017/18 - 2019/20 (Ksh Million)
Source: National Treasury
Apportionment of the Baseline Ceilings
161. The baseline estimates reflects the current ministerial spending levels in
sector programmes. In the recurrent expenditure category, non-discretionary
expenditures take first charge. These include payment of statutory obligations such
as interest payments, salaries for Constitutional offices and pensions.
2017/18 2018/19 2019/20 2018/19 2019/20
Agriculture, Rural & Urban Development Sub_Total 46,544.2 46,598.0 50,325.0 51,729.0 2.8% 2.7% 2.9% 2.9%
Rec. Gross 15,752.4 16,117.0 16,529.0 16,953.0 0.9% 0.9% 0.9% 1.0%
Dev. Gross 30,791.9 30,481.0 33,796.0 34,776.0 1.8% 1.8% 1.9% 2.0%
Energy, Infrastructure & ICT Sub_Total 529,162.9 509,394.2 518,967.8 520,932.1 31.5% 30.0% 29.8% 29.2%
Rec. Gross 41,945.7 66,465.6 70,077.3 70,555.6 2.5% 3.9% 4.0% 4.0%
Dev. Gross 487,217.1 442,928.6 448,890.5 450,376.5 29.0% 26.1% 25.8% 25.3%
General Economic & Commercial Affairs Sub_Total 23,666.2 19,921.0 20,441.0 21,238.0 1.4% 1.2% 1.2% 1.2%
Rec. Gross 12,604.4 10,067.0 10,250.0 10,398.0 0.8% 0.6% 0.6% 0.6%
Dev. Gross 11,061.8 9,854.0 10,191.0 10,840.0 0.7% 0.6% 0.6% 0.6%
Health Sub_Total 60,269.9 60,888.9 61,969.7 62,751.9 3.6% 3.6% 3.6% 3.5%
Rec. Gross 28,990.1 29,609.1 30,107.9 30,383.1 1.7% 1.7% 1.7% 1.7%
Dev. Gross 31,279.8 31,279.8 31,861.8 32,368.8 1.9% 1.8% 1.8% 1.8%
Education Sub_Total 339,924.4 371,781.6 387,134.4 396,582.7 20.3% 21.9% 22.2% 22.3%
Rec. Gross 315,749.1 348,436.5 362,122.1 371,218.1 18.8% 20.5% 20.8% 20.8%
Dev. Gross 24,175.3 23,345.1 25,012.3 25,364.7 1.4% 1.4% 1.4% 1.4%
Governance, Justice, Law & Order Sub_Total 195,518.0 192,898.4 190,192.3 198,035.2 11.7% 11.4% 10.9% 11.1%
Rec. Gross 165,821.4 169,522.0 161,217.9 165,381.8 9.9% 10.0% 9.3% 9.3%
Dev. Gross 29,696.6 23,376.4 28,974.4 32,653.4 1.8% 1.4% 1.7% 1.8%
Public Administration & International
Relations Sub_Total 224,909.7 235,438.3 239,496.5 249,084.5 13.4% 13.9% 13.8% 14.0%
Rec. Gross 114,907.0 123,342.3 119,512.5 121,890.5 6.8% 7.3% 6.9% 6.8%
Dev. Gross 110,002.8 112,096.0 119,984.0 127,194.0 6.6% 6.6% 6.9% 7.1%
National Security Sub_Total 124,045.2 126,105.1 130,401.0 134,854.0 7.4% 7.4% 7.5% 7.6%
Rec. Gross 124,000.2 126,060.1 130,356.0 134,809.0 7.4% 7.4% 7.5% 7.6%
Dev. Gross 45.0 45.0 45.0 45.0 0.0% 0.0% 0.0% 0.0%
Social Protection, Culture & Recreation Sub_Total 44,647.5 45,213.5 48,172.1 49,417.4 2.7% 2.7% 2.8% 2.8%
Rec. Gross 18,199.2 19,074.2 20,061.0 20,746.3 1.1% 1.1% 1.2% 1.2%
Dev. Gross 26,448.2 26,139.3 28,111.1 28,671.1 1.6% 1.5% 1.6% 1.6%
Environment Protection, Water & Natural
Resources Sub_Total 88,999.4 90,571.5 94,585.5 96,510.5 5.3% 5.3% 5.4% 5.4%
Rec. Gross 19,556.4 21,239.2 21,331.2 21,508.2 1.2% 1.3% 1.2% 1.2%
Dev. Gross 69,442.9 69,332.3 73,254.3 75,002.3 4.1% 4.1% 4.2% 4.2%
TOTAL TOTAL 1,677,687.4 1,698,810.5 1,741,685.3 1,781,135.3 100.0% 100.0% 100.0% 100.0%
Rec. Gross 857,526.0 929,933.0 941,564.9 963,843.5 54.7% 54.7% 54.1% 54.1%
Dev. Gross 820,161.4 768,877.5 800,120.4 817,291.8 45.3% 45.3% 45.9% 45.9%
Estimates
2016/17
BROP
Ceiling
2017/18
Projections
% Share of the Total Expenditure
BPS Ceiling Projection
SECTORPrinted
Estimates
2016/17

49 2017 Budget Policy Statement
162. Compensation of employees covering staff in the line ministries providing
services for National Government functions accounts for about 4.8 percent of the
GDP. Other recurrent expenditures that include operations and maintenance
account for 4.7 percent of GDP.
163. Development expenditures have been shared out on the basis of the MTP
priorities and strategic interventions. The following criteria was used in
apportioning capital budget:
On-going projects: emphasis has been given to completion of on-going
capital projects and in particular infrastructure projects with high impact on
poverty reduction, equity and employment creation.
Counterpart funds: priority was also given to adequate allocations for
donor counterpart funds. Donor counterpart funds are the portion that the
Government must finance in support of the projects financed by
development partners.
Strategic policy interventions: priority was also given to policy
interventions covering the entire nation, regional integration, social equity
and environmental conservation.
Finalization of Spending Plans
164. As indicated earlier, the finalization of the preparation of the detailed
budgets will entail thorough scrutiny to curtail spending on non-productive areas
and ensure resources are directed to priority programmes. As detailed budgets are
scrutinized and the resource envelope firmed up, in the event that additional
resources become available, government will utilize them to accommodate key
national strategic priorities. Specifically, the following will receive priority:
Intervention identified during the stakeholders consultation for 2017/18
MTEF budget.
Strategic intervention in food security enhancing programmes, expansion
of energy connection to rural areas and public facilities and other policy
interventions to enhance regional integration and social equity.
Specific consideration to job creation for the youth based on sound
initiatives identified within and outside the normal budget preparation.
3.2 Details of Sector Priorities
165. The medium term expenditure framework for 2017/18 – 2019/20 ensures
continuity in resource allocation based on prioritized programmes aligned to the
Second MTP (2013-2017) of Vision 2030. It also focuses on strategic policy
initiatives of the Jubilee Administration to accelerate growth, employment creation
and poverty reduction. The recent achievements and key priority targets for each
sector are based on the sector reports that can be accessed on the National Treasury
website www.treasury.go.ke.
50 2017 Budget Policy Statement
Agriculture, Rural & Urban Development Sector
166. The goal of the sector is to attain food security, sustainable land
management, affordable housing and sustainable urban infrastructure
development.
167. During the FY 2017/18-2019/20 MTEF period, focus will be directed on
enhancement of Strategic Food Reserve, research and development, establishment
of the of the seed and fertilizer fund, establishment of crop and cattle insurance,
rehabilitate and equip regional veterinary laboratories, develop and transfer
livestock, aquaculture and Mari culture technologies.
168. In order to implement the prioritized programmes, the Sector has been
allocated Ksh 46.6 billion, Ksh 50.3 billion and Ksh 51.7 billion for the financial
years 2017/2018, 2018/2019 and 2019/2020 respectively. Recurrent expenditure
allocation is Ksh 16.1 billion, Ksh 16.5 billion and Ksh 17.0 billion for FY 2017/18,
FY 2018/19 and FY 2019/20 respectively, whereas Development expenditure for
the same period is Ksh 30.5 billion, Ksh 33.8 billion, and Ksh 34.8 billion.
Energy, Infrastructure and Information, Communication and Technology
Sector
169. The sector aims at promoting and sustaining cost-effective public utility
infrastructural facilities and services in the areas of energy, transport, and ICT and
telecommunications.
170. Some of the major projects prioritized in the MTEF period FY 2017/18 –
2019/20 include: 5,538MW of additional installed electricity generation capacity;
Northern Corridor Transport Improvement Project; Lamu Port Southern Sudan and
Ethiopia Transport corridor (LAPSSET); Standard Gauge Railway; Konza
Technopolis; Relocation Action Plan, National Optic Fiber Backborne
Infrastructure (NoFBI) Phase II, promotion and development of the maritime
sector, Digital Literacy Programme East African Trade and Transport Facilitation
Projects and County Connectivity; Construction of houses for Police and Prisons
services, exploration and appraisals in oil blocks and Early Oil Monetisation of
Crude Oil to enhance early commercialization of the crude oil discoveries; Kenya
Petroleum Technical Assistance Project (KEPTAP).
171. In order to implement the prioritized programs, the Sector has been
allocated Ksh 509.4 billion, Ksh 527.9 billion and Ksh 480.2 billion for the
financial years 2017/18, 2018/19 and 2019/20 respectively. Recurrent expenditure
for the medium-term is Ksh 66.5 billion, Ksh 70.1 billion and Ksh 70.5 billion
respectively. The development expenditure for the same period is Ksh 442.9
billion, Ksh 457.8 billion, and Ksh 409.7 billion respectively.
51 2017 Budget Policy Statement
General Economic and Commerce Affairs Sector
172. The strategic objectives of the sector, include; Improvement of the business
environment; Mobilizing savings and investment resources for national
development; Improving governance and accountability in the cooperative
movement; Promoting regional integration and cooperation; and, Supporting
growth and development of domestic and international trade.
173. During the FY 2017/18 – 2019/20 MTEF period the sector focus will be,
among others, to: Operationalize the Special Economic Zones (SEZ) Act 2015;
develop new standards by KEBS; Increase KIE credit disbursed; install new milk
processing machinery and equipment at New KCC; Develop Risk Based
Supervision system (RBS) for Sacco Societies Regulatory Authority
(SASRA);Develop an Integrated information management system for co-
operatives; Improve accessibility of agricultural products/commodities to markets;
equip Weights & Measures laboratories; Investigate and prosecute contraband and
counterfeit cases; Facilitate potential and existing enterprises including youth and
women in export business to increase exports; Comply with harmonized EAC
tariffs and Common External Tariff; Reduce Non-Tariff Barriers; Commission
One Stop Border Posts (OSBP) and establish a Monetary Institute for the East
African Community; tourist establishments; Hold cultural tourism festivals;
Construct Ronald Ngala Utalii College; and promote tourism to increase earnings
174. To implement the prioritized programmes, the Sector has been allocated
Ksh 19.9 billion, Ksh 20.4 billion and Ksh 21.2 billion for the financial years
2017/2018, 2018/2019 and 2019/2020 respectively. Recurrent expenditure
allocation for FY2017/18, FY2018/19 and FY2019/20 is Ksh 10.1 billion, Ksh 10.3
billion and Ksh 10.4 billion respectively. The Development expenditure for the
same is Ksh 9.9 billion, Ksh 10.2 billion, and Ksh 10.8 billion respectively.
Health
175. The general health sector goal is to attain the highest possible health
standards in a manner responsive to the population needs; it aims to achieve this
goal through supporting provision of equitable, affordable and quality health and
related services at the highest attainable standards to all Kenyans.
176. Key projects to be implemented in the FY2017/18 MTEF period include:
undertaking provision of water and sanitation activities in the counties in order to
improve health and hygiene to the citizens, construction of a radiation waste
management facility that is aimed at reducing radiation and radioactive substance
away from the environment and people, rehabilitation of hospitals across the
country, free maternity services for the deliveries in public hospitals and accredited
private hospitals and low cost private hospitals under new expanded free maternity
program and roll out of Universal Health Coverage in order to improve efficiency
in the provision of the essential health services for Kenyans while also ensuring
financial risk protection particularly for the poor and vulnerable groups.
177. In order to implement the prioritized programmes, the Sector has been
allocated Ksh 60.9 billion, Ksh 62.0 billion and Ksh 62.8 billion for the financial
52 2017 Budget Policy Statement
years 2017/2018, 2018/2019 and 2019/2020 respectively. The recurrent
expenditure allocation for FY2017/18, 2018/19 and 2019/20 is Ksh 29.6 billion,
Ksh 30.1 billion and Ksh 30.4 billion, while development expenditure allocation
for the same period is Ksh 31.3 billion, Ksh 31.9 billion, and Ksh 32.3 billion
respectively.
Education Sector
178. The sector’s overall goal is to increase access to education and training;
improve quality and relevance of education; reduce inequality as well as leverage
on knowledge and skills in science, technology, and innovation for global
competitiveness.
179. To meet its goal as well as contribute to economic growth, the sector has
prioritized the following programmes for the 2017/18 to 2019/20 MTEF Period:
Teacher resource management with recruitment of 5,000 additional teachers and
promotion of the existing establishment; Free primary Education; Free day
secondary Education; University Education; Technical and Vocational Education
and Training (TVET) infrastructure and Research Science, curriculum reform and
deepening technology (ICT). An additional allocation has been provided for the
establishment of seven additional universities i.e Koitalel samoei, Bomet, Alupe,
Gatundu, Tom Mboya; Kaimosi and Turkana.
180. In order to implement the prioritized programmes, the Sector has been
allocated Ksh 349.9 billion, Ksh 365.2 billion and Ksh 374.7 billion for the
financial years 2017/2018, 2018/2019 and 2019/2020 respectively. The recurrent
expenditure allocation for FY2017/18, 2018/19 and 2019/20 is Ksh 326.5 billion,
Ksh 340.2 billion and Ksh 349.3 billion, while development expenditure allocation
for the same period is Ksh 23.3 billion, Ksh 25.0 billion, and Ksh 25.4 billion
respectively.
Governance, Justice, Law and Order Sector
181. The sector plays a key role by creating an enabling environment for
economic, social and political development of the country. It is responsible for
providing security, correctional services, legal advice to Government agencies and
administration of justice. It is also responsible for promoting integrity and the fight
against corruption, providing prosecution services, regulating political parties,
protecting witnesses and protecting human rights. Further, the Sector is charged
with delimitation of electoral boundaries and management of electoral process,
promotion of gender equality and inclusion of marginalized groups and
communities. Additionally, the Sector plays a role in peace building and conflict
management, registration services, regulation of gaming industry, provision of
population management services, eradication of drugs and substance abuse, crime
research and government printing services.
182. Some of the Sector’s critical and priority areas in the 2017/18 to 2019/20
MTEF period include: modernization of policing services; preparation and
management of the 2017 general elections; scaling-up issuance of third generation
IDs; registration, regulation and funding of political parties; securitization of
53 2017 Budget Policy Statement
Somali border; national cohesion and integration initiatives; decentralization of
prosecution services; modernization, automation and decentralization of key sub-
sector’s programmes to all the Counties; entrenchment of democracy and
promotion and mainstreaming of human rights; gender equality and non-
discrimination across all sub-sectors.
183. In order to implement the prioritized programmes, the Sector has been
allocated Ksh 192.84 billion, Ksh 189.98 billion and Ksh 197.78 billion for the
financial years 2017/2018, 2018/2019 and 2019/2020 respectively. The recurrent
expenditure allocation for FY2017/18, FY2018/19 and FY2019/20 is Ksh 169.46
billion, Ksh 161.01 billion and Ksh 165.13 billion, while development expenditure
allocation for the same period is Ksh 23.38 billion, Ksh 28.97 billion, and Ksh
32.65 billion respectively.
Judiciary
184. The overriding goal for the Judiciary is to provide equitable access to and
expeditious delivery of justice.
185. During the MTEF period 2017/18 – 2019/20, the Judiciary will continue to
implement the Dispensation of Justice programme. The objective of this
programme is to implement Judiciary’s Constitutional mandate which includes
inter alia; dispensing justice expeditiously to all irrespective of status, promote
alternative dispute mechanisms, administer justice without undue regard to
procedural technicalities and promote the purpose and principles of the
Constitution.
186. In order to implement the prioritized programmes, the sub-sector has been
allocated Ksh 17.4 billion for FY 2017/18, Ksh 18.7 billion for FY 2018/19, and
Ksh 19.7 billion for the FY 2019/20.
Public Administration and International Relations Sector
187. The Sector provides overall policy, planning, coordination and leadership
for national prosperity; enhance Intergovernmental Relations; articulates Kenya’s
Foreign Policy, protect Kenya’s sovereignty and enhance territorial integrity;
promote prudent financial and fiscal management; oversees national legislation,
public service delivery. Further, the sector promotes harmony, equity and fairness
in public service remuneration and administrative justice in the public sector.
188. In the FY 2017-18 – 2019/20 MTEF period, the Sector intends to
implement thirty six programmes which are aimed at fulfilling constitutional
mandates; providing leadership for national unity, growth and prosperity;
supporting devolution; implementing affirmative initiatives towards empowerment
of youth, women and persons with disabilities; coordinating public benefits
organizations; ensuring prudent financial management in the public sector;
promoting economic and commercial diplomacy; and ensuring macro-economic
stability for sustainable development.
54 2017 Budget Policy Statement
189. To implement the prioritized programmes, the Sector has been allocated
Ksh 235.4 billion, Ksh 240.2 billion and Ksh 249.1 billion for the financial years
2017/18, 2018/19 and 2019/20 respectively. Recurrent expenditure for the
medium-term is Ksh 123.3 billion, Ksh 120.2 billion and Ksh 121.9 billion
respectively. The development expenditure for the same period is Ksh 112.1
billion, Ksh 119.98 billion, and Ksh 127.2 billion respectively.
Parliament
190. Parliament plays a crucial role in strengthening the democratic space and
good governance in the country. It approves overall policy and provides leadership
to National Legislation and oversight with respect to public expenditures. It also
vets and approves appointment of state officers as per the provisions of the
Constitution.
191. During the 2017/18-2019/20 MTEF period, the sub-sector will introduce
bills to parliament; consider motions, statements, and petitions; and provide
oversight over usage of public resources. It will also provide carry out other
activities including vetting of State Officers, conduct public hearings, produce
working policy documents on all Government sectors and conduct trainings and
induction for new members after the August 2017 general elections.
192. In order to implement the prioritized programmes, the sub-sector has been
allocated Ksh 30.9 billion for FY 2017/18, Ksh 31.7 billion for FY 2018/19, and
Ksh 32.6 billion for the FY 2019/20.
National Security
193. The Sector is mandated with the mission of deterring aggression, defending
the Republic of Kenya and providing support to civilians in maintaining peace and
order. The Sector will continue to defend and protect the territorial integrity and
sovereignty of Kenya and modernize its operations during the FY 2017/18 and the
medium term.
194. In order to implement the prioritized programmes, sector has been allocated
Ksh 126.1 billion for FY 2017/18, Ksh 130.4 billion for FY 2018/19, and Ksh 134.9
billion for the FY 2019/20.
Social Protection, Culture and Recreation Sector
195. The sector is mandated to address the issues on promotion and exploitation
of Kenya’s diverse culture for peaceful co-existence; enhancing Kenya’s reading
culture; development and promotion of sports; preservation of Kenya’s heritage;
promotion of cultural and sports tourism; regulation, development and promotion
of the film industry; and development, research and preservation of music in the
country. The sector is also mandated with the enhancement and promotion of
harmonious industrial relations; safety and health at workplaces; employment,
industrial training, regulation of sports organizations and trade unions,
55 2017 Budget Policy Statement
productivity management, national human resource planning and development,
social security, social assistance, children welfare and social development.
196. In order to implement the prioritized programmes, the Sector has been
allocated Ksh 45.1 billion, Ksh 94.5 billion and Ksh 96.5 billion for the financial
years 2017/2018, 2018/2019 and 2019/2020 respectively. The recurrent
expenditure allocation for FY2017/18, 2018/19 and 2019/20 is Ksh 18.9 billion,
Ksh 19.9 billion and Ksh 20.6 billion, while development expenditure allocation
for the same period is Ksh 26.1 billion, Ksh 28.1billion, and Ksh 28.7 billion
respectively.
Environment Protection, Water and Natural Resources
197. The sector’s mission is to promote sustainable utilization and management
of environment and natural resources for socio- economic development.
198. For the 2017/18 – 2019/20 MTEF period the sector has prioritized
programmes intended to promote sustainable utilization and management of the
environment and natural resources for socio-economic development. These
programmes include: environmental management and protection, metrological
services, natural resource management programme, water harvesting, irrigation,
integrated regional development, mineral resource management, general
administration, planning and support services.
199. The sector faces a number of challenges key among them being;
environmental degradation in the form of air and water pollution; deep quarries,
reduced land quality, reduced water resources capacity and siltation of water
reservoirs.
200. In order to implement the prioritized programmes, the Sector has been
allocated Ksh 90.5 billion, Ksh 94.5 billion and Ksh 96.5 billion for the financial
years 2017/2018, 2018/2019 and 2019/2020 respectively. The recurrent
expenditure allocation for FY2017/18, 2018/19 and 2019/20 is Ksh 21.2 billion,
Ksh 21.3 billion and Ksh 21.5 billion, while development expenditure allocation
for the same period is Ksh 69.3 billion, Ksh 73.3 billion, and Ksh 75.0 billion
respectively.
3.3 Public Participation/ Sector Hearings and Involvement of Stakeholders
201. The Sector Working Groups (SWG) provides an all-inclusive process for
identifying and prioritizing Government Projects and activities by stakeholders.
The involvement of stakeholders is a Constitutional requirement. The process is
commenced with the launch of SWGs.
202. The Constitution provides that the public should be involved in the budget
making process through public participation. Further, the Public Finance
Management (PFM) Act, 2012 section 25 (5) requires the National Treasury while
preparing the Budget Policy Statement to seek views of various institutions and the
public. In this regard, the sector priorities were subjected to public sector hearings
56 2017 Budget Policy Statement
in October 2016. All the sectors incorporated views arising from the Public during
the sector hearings.
203. Specific issues raised during the public sector hearings under the various
Sector Working Groups included:
Agriculture, Rural and Urban Development Sector
204. There was concern about the deficit budget and the public felt that the
budget of the sector needs to be reviewed upwards due to the importance and
contribution of the sector to the economy. Strategic partnerships with donors and
other stakeholders could be enhanced as a way of also addressing the deficit. The
sector noted this and agreed on the importance of strengthening the linkages.
205. The public stated that post-harvest equipment faces a number of taxes like
import duty and VAT, and wanted these taxes be removed as for the other
agricultural production implements to boost and curb post-harvest losses. The
sector stated that they are in talks with National Treasury to zero rate these
equipment.
Energy, Infrastructure and ICT Sector
206. The public was pleased with the progress in catering for people with
disability in terms of infrastructure through having universal design in construction
of roads and houses. The sector noted this and offered assurance that they would
keep enforcing these in the various infrastructure put up to ensure the various
groups of people are catered for.
207. There were also calls by the public to have affordable housing to the masses
in addition to providing affordable safe energy. The sector stated that they are
liaising with the private sector to provide housing to the public through using
affordable building technologies. They are also improving access to electricity
which is now at 57-58 percent and they target to increase to 70 percent in 2017.
General Economic and Commercial Affairs Sector
208. With regards to tourism, the public noted that arrivals in tourism in MTEF
figures in the presentation figures were a reduction even from the strategic
plan/Vision 2030. It was explained that the figures were revised downwards
especially owing to the security challenges that affected tourism and also the
budgetary provisions.
209. Emphasis was given on linkages with the social protection sector in giving
innovations to cash transfers. Especially in skills training and households
budgeting and investment to ensure the transfers sustain and improve livelihoods.
It was also recommended that priority areas should include robust interaction with
the civil society in addition to linking the report not only to the MTP II but also to
the Kenya industrial transformation programme. The sector welcomed the
recommendation.
57 2017 Budget Policy Statement
Health
210. The public commended the sector on the transformation KNH has had in
terms of service delivery, equipment, infrastructure and quality of service and
hoped this will be up scaled and maintained.
211. As regards disability, the sector was asked to take not of cerebral palsy
whose prevalence was on the rise. In addition they are to conduct training and
specialised services for staff to deal with the various kinds of disabilities.
212. The public sought to understand the relationship between ministry and
county governments in the provision of health services. The sector informed the
public that the ministry’s role is to set norms, standards and regulation and they do
work in collaboration and cooperation with county government through the inter-
governmental forum up to the higher levels of IBEC and the Summit.
Education
213. On teacher training institutions the public wanted to know what the sector
is doing to ensure quality. The sector said they achieve this by ensuring capitation
and they have set aside funds to improve infrastructure, also evaluating the
minimum entry level for their teachers in training institutions.
214. There was also concern that TVET allocation in HELB being too low to
cater for the fees charged by institutions. The HELB said that it is working with
the ministry to ensure that the amounts provided go to the needy students and they
are increasing their loan recovery in order to increase loan for funding. They are
also working with other bodies that fund education to administer the funds. The
sector was also urged to starting a campaign on TVET loans to ask student to apply
for the loan through TVET to create awareness and increase the uptake of this new
product.
215. Further the public wanted to know how the sector compensates counties
that fund school activities. It was clarified that primary education is a national
government function funded at the national level but if counties fund education
related activities then it is a complementary activity unless it is Early Childhood
Development (ECD) which is a clearly stipulated function.
216. The relocation of KTTC was also questioned and it was explained to be
government strategic decision due to its interaction with other stakeholders and it
is of national importance.
Governance, Justice, Law and Order Sector
217. The public wished to know IEBCs state of preparedness for 2017 election.
They were informed that this is informed by the IEBC election preparedness plan
and also the strategic plan and they will endeavour to carry out the elections within
the approved budget and timelines.
58 2017 Budget Policy Statement
218. The sector was also asked to capture commitments from donor funding to
indicate the counterpart funding to facilitate funding. The sector responded that
donor commitments are still being firmed up and once this is done the counterpart
will be given and indicated in the BPS.
219. The public also called for the need to open the space of engagement
between police, citizens and CSOs to dispense the fears, create a cordial
relationship and address pertinent issues rather than having reactive tendencies
after something displeasing has happened.
Public Administration and International Relations Sector
220. Regarding the initial tensions between national and county government the
public was pleased and commended efforts of working together for the
developmental agenda of the country. This relationship was as a result of a robust
intergovernmental relations body put in place that engages with the 2 levels of
government to bring out a more cordial relationship.
221. The public also reiterated the need to cascade intergovernmental relations
to the county levels and lower levels e.g. public participation and civic education.
This is together with strengthening capacities for counties to improve own revenue
generation and diversify the revenue sources. The sector stated that there is a public
participation guideline and they will put effort to cascade it to the counties and that
the structures are operationalized. Further the National Treasury is working with
governors on how counties can diversify their revenue base and there is progress
being done.
Social Protection Culture and Recreation Sector
222. The public raised concern over the many strikes especially in the counties
which are attributed to challenges in the Ministry of labour on staff shortage in
labour offices and wanted to know the mechanisms in place to fill the voids. The
sector responded that there are plans to hire 56 labour officers and approvals are in
place and together with the succession issues which will be addressed by the sector.
223. Regarding the cash transfers to older persons, there was concern that the
data on the number of people getting the transfer and their location isn’t publicly
available. The sector clarified that the data is available on the social protection
website and on the single window platform where information about the recipients
can be traced up to the ward level.
224. There was a call to have more investment in the arts in order to capture the
high population of youth and provide employment in areas such as fashion,
performing arts, film and music etc. Further there is need to lower the high taxation
on imports for software for film creation and reduce multiple taxation on royalties
for artistes, which make the country uncompetitive. The sector appreciated these
recommendations and on the issue of taxation they stated that they are in talks with
the National Treasury to harmonise the taxes.
59 2017 Budget Policy Statement
Programme Performance Information for 2017/18 - 2019/20 MTEF Period
225. Information on programmes outputs, key performance indicators, and the
set targets for the 2017/18 – 2019/20 MTEF period is contained in Annex Table
6, annexed separately to this 2017 BPS.
60 2017 Budget Policy Statement
IV. COUNTY FINANCIAL
MANAGEMENT AND DIVISION OF
REVENUE
4.1 Performance of County Governments in FY 2015/16
226. County Governments’ budget allocations for FY 2015/16 amounted to Ksh.
367.4 billion, a 12 percent growth from FY 2014/15 (Table 4.1). Development
budget allocations grew by 10 percent, while recurrent budget allocations grew by
15 percent. The counties’ aggregate expenditure in FY 2015/16 amounted to Ksh
295.3 billion, or 80 percent of allocations. Development spending was 35 percent
of the total actual expenditure, growing by 14.5 percent in the FY2015/16
compared to the actual spending in the FY2014/15.
Table 4.1: County Governments’ Aggregate Budgets and Expenditures (Ksh
billions)
Financial Year Budget Allocations Expenditure
Development Recurrent Total Development Recurrent Total
2013/14 100.4 160.6 261.0 36.6 132.8 169.4
2014/15 144.9 181.4 326.3 90.4 167.6 258.0
2015/16 158.6 208.8 367.4 103.5 191.8 295.3
Source of data: Controller of Budget
227. In FY 2015/16, County Governments collected an aggregate of Ksh 35
billion from local revenue sources, equivalent to 63.4 percent of the targeted Ksh
55.2 billion. Three key observations can be made from this performance. Firstly,
counties’ own-source revenue (OSR) is growing significantly slower. The
counties’ OSR grew by about Ksh 7.6 billion (28.9 percent growth) from Ksh 26.3
billion in the FY 2013/14 to Ksh 33.9 billion in the FY2014/15. In contrast,
between 2014/15 and 2015/16, the increase was 3.2 percent, equivalent to only Ksh
1.1 billion. (Figure 4.1a). This underscores the need for counties to apply more
fiscal effort, while also improving efficiency in revenue collection. Secondly,
actual OSR collection as a proportion of target has dropped from 67.3 percent in
FY 2014/15 to 63.4 percent in FY 2015/16. Collections in FY 2015/16 remained
below even the 2014/15 target, which was itself downgraded due to poor
performance in the previous year. In general, the escalating misalignment between
target and actual OSR collection highlights the difficulty counties continue to face
in preparing realistic forecasts. Thirdly, quarter three (i.e. January-March) is the
most productive for County Governments revenue-wise (Figure 4.1b). This is
when property rates and business licenses -- the two decentralized tax bases with
greatest potential -- become due for collection. Counties would do well therefore
to develop and maximize the scope for collecting these two charges.
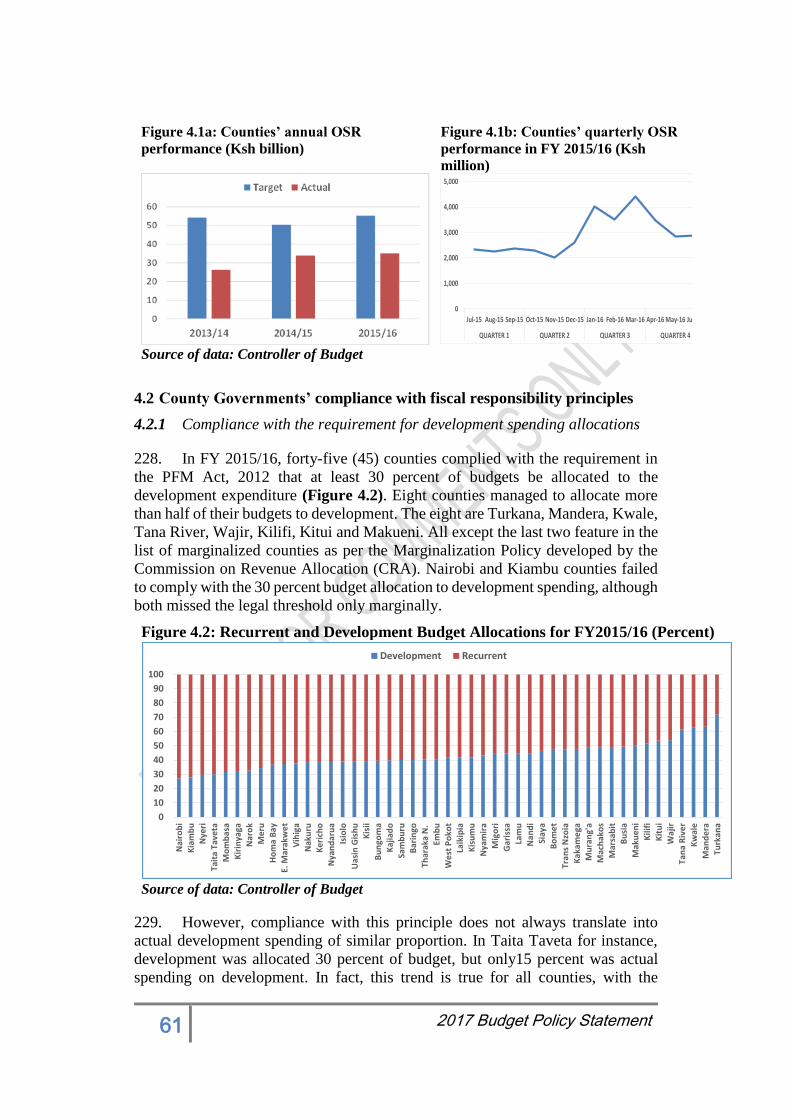
61 2017 Budget Policy Statement
4.2 County Governments’ compliance with fiscal responsibility principles
4.2.1 Compliance with the requirement for development spending allocations
228. In FY 2015/16, forty-five (45) counties complied with the requirement in
the PFM Act, 2012 that at least 30 percent of budgets be allocated to the
development expenditure (Figure 4.2). Eight counties managed to allocate more
than half of their budgets to development. The eight are Turkana, Mandera, Kwale,
Tana River, Wajir, Kilifi, Kitui and Makueni. All except the last two feature in the
list of marginalized counties as per the Marginalization Policy developed by the
Commission on Revenue Allocation (CRA). Nairobi and Kiambu counties failed
to comply with the 30 percent budget allocation to development spending, although
both missed the legal threshold only marginally.
Figure 4.2: Recurrent and Development Budget Allocations for FY2015/16 (Percent)
Source of data: Controller of Budget
229. However, compliance with this principle does not always translate into
actual development spending of similar proportion. In Taita Taveta for instance,
development was allocated 30 percent of budget, but only15 percent was actual
spending on development. In fact, this trend is true for all counties, with the
0
10
20
30
40
50
60
70
80
90
100
Nai
rob
iK
iam
bu
Nye
riTa
ita
Tave
taM
om
bas
aK
irin
yaga
Nar
ok
Me
ruH
om
a B
ayE.
Mar
akw
et
Vih
iga
Nak
uru
Ke
rich
oN
yan
dar
ua
Isio
loU
asin
Gis
hu
Kis
iiB
un
gom
aK
ajia
do
Sam
bu
ruB
arin
goTh
arak
a N
.Em
bu
We
st P
oko
tLa
ikip
iaK
isu
mu
Nya
mir
aM
igo
riG
aris
saLa
mu
Nan
di
Siay
aB
om
et
Tran
s N
zoia
Kak
ame
gaM
ura
ng'
aM
ach
ako
sM
arsa
bit
Bu
sia
Mak
ue
ni
Kil
ifi
Kit
ui
Waj
irTa
na
Riv
er
Kw
ale
Man
de
raTu
rkan
a
Development Recurrent
Figure 4.1a: Counties’ annual OSR
performance (Ksh billion)
Figure 4.1b: Counties’ quarterly OSR
performance in FY 2015/16 (Ksh
million)
Source of data: Controller of Budget
0
1,000
2,000
3,000
4,000
5,000
Jul-15 Aug-15 Sep-15 Oct-15 Nov-15 Dec-15 Jan-16 Feb-16 Mar-16 Apr-16 May-16 Jun-16
QUARTER 1 QUARTER 2 QUARTER 3 QUARTER 4
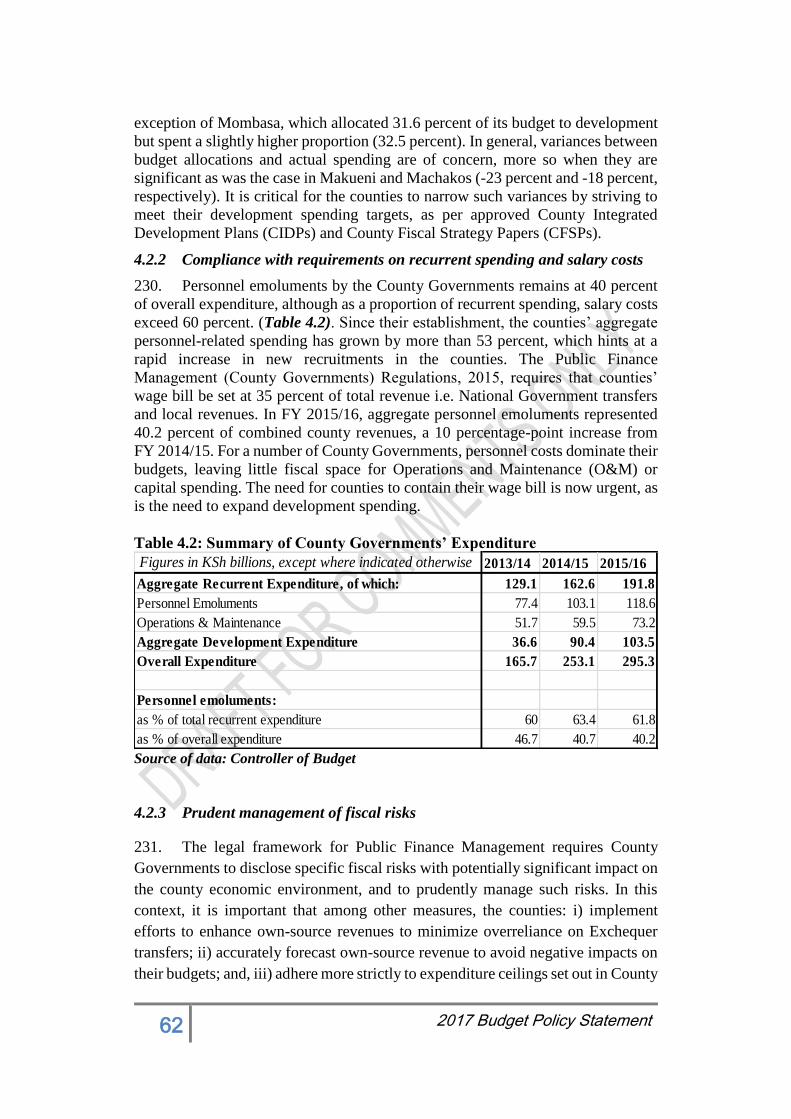
62 2017 Budget Policy Statement
exception of Mombasa, which allocated 31.6 percent of its budget to development
but spent a slightly higher proportion (32.5 percent). In general, variances between
budget allocations and actual spending are of concern, more so when they are
significant as was the case in Makueni and Machakos (-23 percent and -18 percent,
respectively). It is critical for the counties to narrow such variances by striving to
meet their development spending targets, as per approved County Integrated
Development Plans (CIDPs) and County Fiscal Strategy Papers (CFSPs).
4.2.2 Compliance with requirements on recurrent spending and salary costs
230. Personnel emoluments by the County Governments remains at 40 percent
of overall expenditure, although as a proportion of recurrent spending, salary costs
exceed 60 percent. (Table 4.2). Since their establishment, the counties’ aggregate
personnel-related spending has grown by more than 53 percent, which hints at a
rapid increase in new recruitments in the counties. The Public Finance
Management (County Governments) Regulations, 2015, requires that counties’
wage bill be set at 35 percent of total revenue i.e. National Government transfers
and local revenues. In FY 2015/16, aggregate personnel emoluments represented
40.2 percent of combined county revenues, a 10 percentage-point increase from
FY 2014/15. For a number of County Governments, personnel costs dominate their
budgets, leaving little fiscal space for Operations and Maintenance (O&M) or
capital spending. The need for counties to contain their wage bill is now urgent, as
is the need to expand development spending.
Table 4.2: Summary of County Governments’ Expenditure
Source of data: Controller of Budget
4.2.3 Prudent management of fiscal risks
231. The legal framework for Public Finance Management requires County
Governments to disclose specific fiscal risks with potentially significant impact on
the county economic environment, and to prudently manage such risks. In this
context, it is important that among other measures, the counties: i) implement
efforts to enhance own-source revenues to minimize overreliance on Exchequer
transfers; ii) accurately forecast own-source revenue to avoid negative impacts on
their budgets; and, iii) adhere more strictly to expenditure ceilings set out in County
Figures in KSh billions, except where indicated otherwise 2013/14 2014/15 2015/16
Aggregate Recurrent Expenditure, of which: 129.1 162.6 191.8
Personnel Emoluments 77.4 103.1 118.6
Operations & Maintenance 51.7 59.5 73.2
Aggregate Development Expenditure 36.6 90.4 103.5
Overall Expenditure 165.7 253.1 295.3
Personnel emoluments:
as % of total recurrent expenditure 60 63.4 61.8
as % of overall expenditure 46.7 40.7 40.2
63 2017 Budget Policy Statement
Fiscal Strategy Papers. In addition, efforts should be taken to avoid duplication of
functions between the two levels of Government, as this carries the risk of
generating intergovernmental conflicts, wasteful spending and financing gaps that
could adversely affect implementation of the fiscal framework.
4.2.4 Enhancement of counties’ own-source revenues and ensuring
predictability in taxes
232. As indicated in the BPS 2016, an Interagency Working Committee -- under
the Intergovernmental Budget and Economic Council (IBEC) -- has been preparing
a policy framework and a National Framework Legislation to support County
Governments’ own-source revenue (OSR) efforts. A draft National Policy on
County Government’s OSR is ready, and is being subjected to stakeholder
consultations. The draft Policy proposes measures to broaden County
Governments’ tax bases, while strengthening their revenue administrative
capacity. The draft Policy focuses on four distinct but interrelated themes as
follows:
(i) Legal and institutional framework for own source revenues: This aims to
provide direction towards a more unified and coherent legal framework
underpinning County Governments’ taxation efforts.
(ii) Revenue potential: This aims to guide assessment of the counties’ revenue
potential, by examining efficiency improvements. In this context, the
National Treasury will undertake a County revenue potential study. The
study will establish the current base for each county’s local revenue, and
articulate each county’s tax potential and tax effort. It is expected that the
Study’s findings will help the counties improve their revenue forecasting.
Preliminary outputs of the Study are expected in December 2016, with
subsequent deliverables being spread over FY 2016/17 and FY 2017/18.
(iii) Revenue assignments: This aims to clearly delineate revenue mandates
both between the two levels of Government and among the counties to
eliminate disputes.
(iv) Capacity for revenue administration: This aims to assess counties’ existing
capacity to manage revenue-related responsibilities, including collection
and administration of taxes, fees and service charges and make
recommendations on how to strengthen counties’ institutional capacity for
better tax administration.
233. Further, the Interagency Working Committee has drafted a Bill to regulate
the process to be followed by County Governments in imposing, varying or
waiving taxes, fees, levies and other charges. The draft County Governments’ (Tax
Regulation Process) Bill establishes the process whereby the counties may exercise
their taxation authority -- in accordance with Articles 209 and 210 of the
Constitution -- while the National Government, through the National Treasury
exercises its policy oversight role. Like the draft Policy, the draft Bill is being
64 2017 Budget Policy Statement
subjected to broad stakeholder consultations before introduction in Parliament
following Cabinet approval.
4.2.5 Short term borrowing by County Governments for management of cash
flows
234. Pursuant to an Intergovernmental Budget and Economic Council (IBEC)
agreement, the National Government will develop guidelines to regulate short-term
borrowing by County Governments from the Central Bank of Kenya (CBK).
Access to short-term borrowing will enable the counties to better manage their cash
flow, while eliminating need for high-interest commercial bank loans.
235. The above guidelines will mitigate fiscal risks, which could arise from
short-term lending or implicit guarantees to County Governments. One obvious
risk is the realization of contingent liabilities. According to the 2016 Medium Term
Debt Strategy (MTDS), contingent liabilities arising from the portfolio of lending
and guarantees to counties can increase the National Government’s debt stocks and
servicing costs. Another risk is that of County Governments lowering their fiscal
effort and focusing less on maximization of local revenue, due to the ability to
access short-term borrowing. Apart from dealing with the above risks, there is need
to enforce more strictly expenditure measures aimed at minimizing wastage and
enhancing productivity of public spending. In addition, the National Treasury will
sustain the efforts towards minimizing the delays in disbursement of equitable
share transfers and other factors which might lead to escalation of demand for
short-term finance by the counties.
236. The National Treasury, through the Public Debt Management Office
(PDMO) will pursue a number of strategic interventions aimed at supporting
County Governments to plan for and manage their debt in a more sustainable
manner. Among the interventions are: i) strengthening the institutional
arrangement for public debt management at the county level; ii) providing
technical assistance to County Treasuries in the preparation of Medium Term Debt
Strategies as required by the PFMA; iii) upgrading of the debt recording system
within IFMIS to correctly capture, analyze and report on any county borrowing;
and, iv) ensuring comprehensive, accurate and timely information on any
borrowing by the counties, including regular publication of public debt information
to enhance transparency on debt management.
4.3 Finalizing the transfer of assets and liabilities to the counties
237. To finalize the transfer of assets and liabilities from the defunct Local
Authorities (LAs) to the County Governments, a draft Legal Notice has been
prepared to facilitate this transfer process. The transfer is expected to be concluded
by March 31st, 2017. Among assets and liabilities of the defunct LAs to be covered
in this process are: i) pending bills; ii) tax arrears; and, iii) statutory deductions
relating to the National Hospital Insurance Fund (NHIF), National Social Security
Fund (NSSF), Pension Funds, VAT and PAYE. Preparation of the draft Legal
Notice to enable the transfer has been done by the Intergovernmental Relations

65 2017 Budget Policy Statement
Technical Committee (IGRTC), which succeeded the defunct Transition Authority
(TA). The IGRTC will also coordinate the actual auditing of assets and liabilities.
As part of the institutional arrangement to facilitate this transfer process, multi-
agency committees are to be set up in the counties, and the Auditor-General will
audit the final outcome.
4.4 Vertical division of revenue
238. County Governments’ equitable share of revenue for the FY 2017/18 is
arrived at by adjusting the baseline (i.e. the equitable share allocation in FY
2016/17) by a growth factor of 6.72 percent. Based on this adjustment, County
Governments’ equitable share in FY 2017/18 is estimated to be Ksh 299.1 billion.
(Table 4.3).
Table 4.3: County Governments’ Equitable Revenue Share Allocation (Ksh Million)
239. In addition to the above equitable share allocation, County Governments
will in FY 2017/18 receive Ksh 35.8 billion through various financing streams as
follows (Tables 4.4 and 4.5):
From the National Governments’ equitable revenue share, Ksh 14 billion
conditional allocations for: i) level-5 hospitals; ii) free maternal healthcare; iii)
leasing of medical equipment; and, iv) compensation for foregone user fees.
Ksh. 7.9 billion from the Road Maintenance Fuel Levy Fund (RMLF). As in
previous years, this is calculated at 15 percent of projected FY 2017/18
collections by the Kenya Roads Board (KRB).
KSh 14 billion from proceeds of external loans/grants to be transferred to
County Governments as conditional allocations, and which will finance
devolved functions in accordance with signed financing agreements for the
loans/grants. The loans/grants to be distributed to counties in FY 2017/18 are
as follows: i) a World Bank loan financing the Health Support Project (also
known as Result Based Financing) in 21 Arid- and Semi-Arid counties (KSh.
2.3 billion); ii) a World Bank loan supporting the Kenya Devolution Support
Programme (KDSP), which is facilitating capacity building and performance
grants to all counties (KSh. 5.5 billion); iii) a World Bank loan financing the
National Urban Transport Improvement Project (NUTRIP) in two counties
(KSh. 6.02 billion); and, iv) financing under the Kenya-Italy Debt for
Budget item 2015/16 2016/17 2017/18
Baseline (i.e. allocation in the previous FY) 226,660.0 259,774.5 280,300.0
Baseline adjustments:
1. Baseline adjustments (Due to additional county functions) 2,946.0
Adjusted baseline: 229,606.0 259,774.5 280,300.0
Additional revenue measures
1. Adjustment for revenue growth 23,902.0 20,525.2 18,836.2
2. Other adjustments 4,500.0
3. Adjustments negotiated in Parliament post-BPS 1,766.5
Computed equitable revenue share allocation 259,774.5 280,300.0 299,136.2
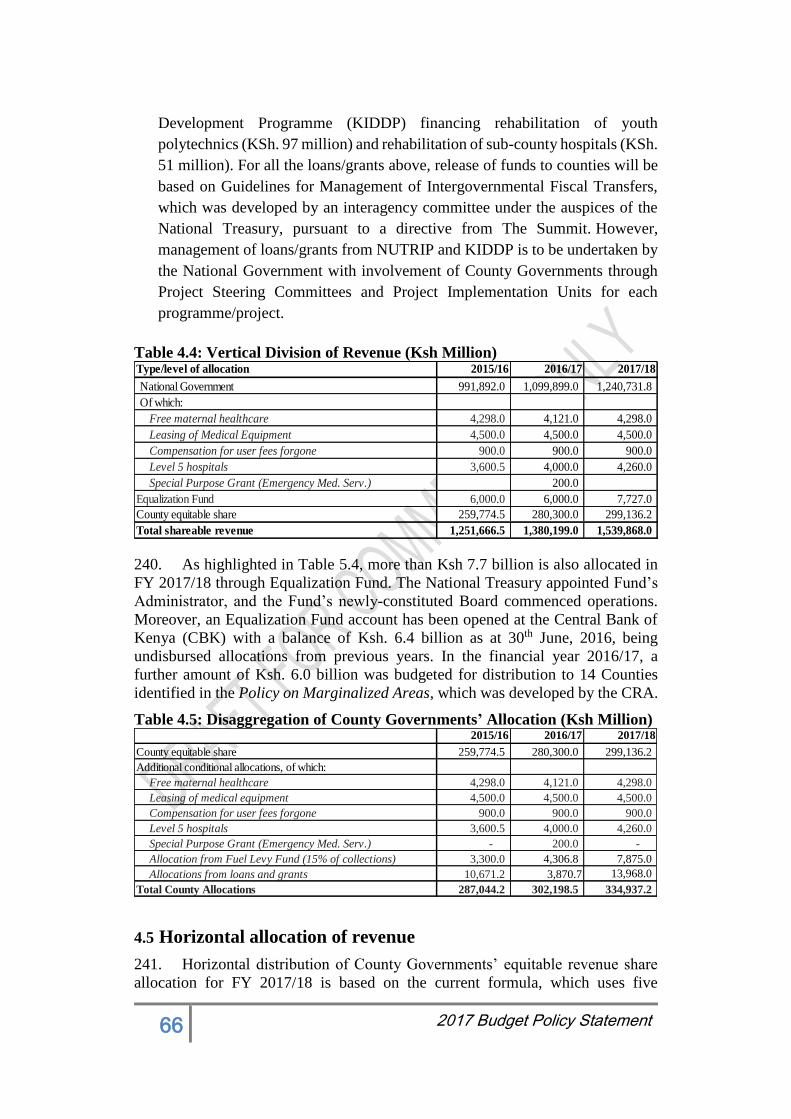
66 2017 Budget Policy Statement
Development Programme (KIDDP) financing rehabilitation of youth
polytechnics (KSh. 97 million) and rehabilitation of sub-county hospitals (KSh.
51 million). For all the loans/grants above, release of funds to counties will be
based on Guidelines for Management of Intergovernmental Fiscal Transfers,
which was developed by an interagency committee under the auspices of the
National Treasury, pursuant to a directive from The Summit. However,
management of loans/grants from NUTRIP and KIDDP is to be undertaken by
the National Government with involvement of County Governments through
Project Steering Committees and Project Implementation Units for each
programme/project.
Table 4.4: Vertical Division of Revenue (Ksh Million)
240. As highlighted in Table 5.4, more than Ksh 7.7 billion is also allocated in
FY 2017/18 through Equalization Fund. The National Treasury appointed Fund’s
Administrator, and the Fund’s newly-constituted Board commenced operations.
Moreover, an Equalization Fund account has been opened at the Central Bank of
Kenya (CBK) with a balance of Ksh. 6.4 billion as at 30th June, 2016, being
undisbursed allocations from previous years. In the financial year 2016/17, a
further amount of Ksh. 6.0 billion was budgeted for distribution to 14 Counties
identified in the Policy on Marginalized Areas, which was developed by the CRA.
Table 4.5: Disaggregation of County Governments’ Allocation (Ksh Million)
4.5 Horizontal allocation of revenue
241. Horizontal distribution of County Governments’ equitable revenue share
allocation for FY 2017/18 is based on the current formula, which uses five
Type/level of allocation 2015/16 2016/17 2017/18
National Government 991,892.0 1,099,899.0 1,240,731.8
Of which:
Free maternal healthcare 4,298.0 4,121.0 4,298.0
Leasing of Medical Equipment 4,500.0 4,500.0 4,500.0
Compensation for user fees forgone 900.0 900.0 900.0
Level 5 hospitals 3,600.5 4,000.0 4,260.0
Special Purpose Grant (Emergency Med. Serv.) 200.0
Equalization Fund 6,000.0 6,000.0 7,727.0
County equitable share 259,774.5 280,300.0 299,136.2
Total shareable revenue 1,251,666.5 1,380,199.0 1,539,868.0
2015/16 2016/17 2017/18
County equitable share 259,774.5 280,300.0 299,136.2
Additional conditional allocations, of which:
Free maternal healthcare 4,298.0 4,121.0 4,298.0
Leasing of medical equipment 4,500.0 4,500.0 4,500.0
Compensation for user fees forgone 900.0 900.0 900.0
Level 5 hospitals 3,600.5 4,000.0 4,260.0
Special Purpose Grant (Emergency Med. Serv.) - 200.0 -
Allocation from Fuel Levy Fund (15% of collections) 3,300.0 4,306.8 7,875.0
Allocations from loans and grants 10,671.2 3,870.7 13,968.0
Total County Allocations 287,044.2 302,198.5 334,937.2
67 2017 Budget Policy Statement
parameters with specific weights, namely: population (45 percent); equal share (25
percent); poverty (20 percent); land area (8 percent); and, fiscal responsibility (2
percent). Each additional conditional allocation is distributed based on its
objectives, criteria for selecting beneficiary counties and distribution formula.
Accordingly, in FY 2017/18, the counties will share an estimated Ksh 334.9 billion,
which represents an increase of nearly 11 percent over and above projected total
transfers for 2016/17 of Ksh 302.2 billion. Table 4.6 shows the projected transfer
to each county.
4.6 Conclusion
242. The National Treasury will implement reforms under the Revised Public
Finance Management Reform Strategy (2016-2018) to enhance performance of
County Governments. The reforms are expected to lead to:
a) Improved collection and efficiency of County Governments’ own-
source revenue (OSR) systems, including accounting and reporting.
b) Improved capacity of counties to formulate realistic and credible
budgets, and hence better harmony between County Executive and
County Assemblies in the budget process.
c) Strengthened capacity of County Assembly oversight committees --
specifically, County Assembly Budget and Appropriation Committees
-- to produce quality reports in a timely manner.
d) Proper documentation and management of County Governments’ assets
and liabilities.
e) A clearer and stronger system of intergovernmental fiscal relations,
particularly on management of intergovernmental conditional grants
between the two levels of Government.
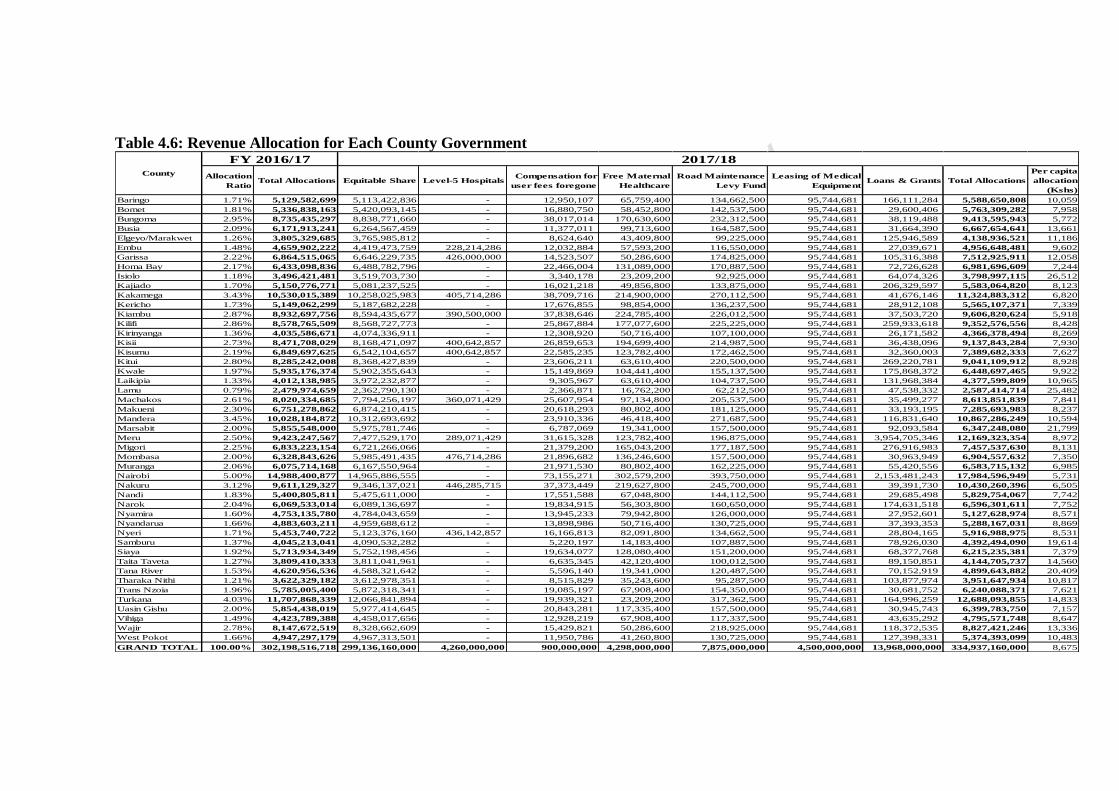
Table 4.6: Revenue Allocation for Each County Government
Allocation
RatioTotal Allocations Equitable Share Level-5 Hospitals
Compensation for
user fees foregone
Free Maternal
Healthcare
Road Maintenance
Levy Fund
Leasing of Medical
EquipmentLoans & Grants Total Allocations
Per capita
allocation
(Kshs)
Baringo 1.71% 5,129,582,699 5,113,422,836 - 12,950,107 65,759,400 134,662,500 95,744,681 166,111,284 5,588,650,808 10,059
Bomet 1.81% 5,336,838,163 5,420,093,145 - 16,880,750 58,452,800 142,537,500 95,744,681 29,600,406 5,763,309,282 7,958
Bungoma 2.95% 8,735,435,297 8,838,771,660 - 38,017,014 170,630,600 232,312,500 95,744,681 38,119,488 9,413,595,943 5,772
Busia 2.09% 6,171,913,241 6,264,567,459 - 11,377,011 99,713,600 164,587,500 95,744,681 31,664,390 6,667,654,641 13,661
Elgeyo/Marakwet 1.26% 3,805,329,685 3,765,985,812 - 8,624,640 43,409,800 99,225,000 95,744,681 125,946,589 4,138,936,521 11,186
Embu 1.48% 4,659,902,222 4,419,473,759 228,214,286 12,032,884 57,593,200 116,550,000 95,744,681 27,039,671 4,956,648,481 9,602
Garissa 2.22% 6,864,515,065 6,646,229,735 426,000,000 14,523,507 50,286,600 174,825,000 95,744,681 105,316,388 7,512,925,911 12,058
Homa Bay 2.17% 6,433,098,836 6,488,782,796 - 22,466,004 131,089,000 170,887,500 95,744,681 72,726,628 6,981,696,609 7,244
Isiolo 1.18% 3,496,421,481 3,519,703,730 - 3,340,178 23,209,200 92,925,000 95,744,681 64,074,326 3,798,997,115 26,512
Kajiado 1.70% 5,150,776,771 5,081,237,525 - 16,021,218 49,856,800 133,875,000 95,744,681 206,329,597 5,583,064,820 8,123
Kakamega 3.43% 10,530,015,389 10,258,025,983 405,714,286 38,709,716 214,900,000 270,112,500 95,744,681 41,676,146 11,324,883,312 6,820
Kericho 1.73% 5,149,062,299 5,187,682,228 - 17,676,855 98,854,000 136,237,500 95,744,681 28,912,108 5,565,107,371 7,339
Kiambu 2.87% 8,932,697,756 8,594,435,677 390,500,000 37,838,646 224,785,400 226,012,500 95,744,681 37,503,720 9,606,820,624 5,918
Kilifi 2.86% 8,578,765,509 8,568,727,773 - 25,867,884 177,077,600 225,225,000 95,744,681 259,933,618 9,352,576,556 8,428
Kirinyanga 1.36% 4,035,586,671 4,074,336,911 - 12,308,920 50,716,400 107,100,000 95,744,681 26,171,582 4,366,378,494 8,269
Kisii 2.73% 8,471,708,029 8,168,471,097 400,642,857 26,859,653 194,699,400 214,987,500 95,744,681 36,438,096 9,137,843,284 7,930
Kisumu 2.19% 6,849,697,625 6,542,104,657 400,642,857 22,585,235 123,782,400 172,462,500 95,744,681 32,360,003 7,389,682,333 7,627
Kitui 2.80% 8,285,242,008 8,368,427,839 - 23,606,211 63,610,400 220,500,000 95,744,681 269,220,781 9,041,109,912 8,928
Kwale 1.97% 5,935,176,374 5,902,355,643 - 15,149,869 104,441,400 155,137,500 95,744,681 175,868,372 6,448,697,465 9,922
Laikipia 1.33% 4,012,138,985 3,972,232,877 - 9,305,967 63,610,400 104,737,500 95,744,681 131,968,384 4,377,599,809 10,965
Lamu 0.79% 2,479,974,659 2,362,790,130 - 2,366,871 16,762,200 62,212,500 95,744,681 47,538,332 2,587,414,714 25,482
Machakos 2.61% 8,020,334,685 7,794,256,197 360,071,429 25,607,954 97,134,800 205,537,500 95,744,681 35,499,277 8,613,851,839 7,841
Makueni 2.30% 6,751,278,862 6,874,210,415 - 20,618,293 80,802,400 181,125,000 95,744,681 33,193,195 7,285,693,983 8,237
Mandera 3.45% 10,028,184,872 10,312,693,692 - 23,910,336 46,418,400 271,687,500 95,744,681 116,831,640 10,867,286,249 10,594
Marsabit 2.00% 5,855,548,000 5,975,781,746 - 6,787,069 19,341,000 157,500,000 95,744,681 92,093,584 6,347,248,080 21,799
Meru 2.50% 9,423,247,567 7,477,529,170 289,071,429 31,615,328 123,782,400 196,875,000 95,744,681 3,954,705,346 12,169,323,354 8,972
Migori 2.25% 6,833,223,154 6,721,266,066 - 21,379,200 165,043,200 177,187,500 95,744,681 276,916,983 7,457,537,630 8,131
Mombasa 2.00% 6,328,843,626 5,985,491,435 476,714,286 21,896,682 136,246,600 157,500,000 95,744,681 30,963,949 6,904,557,632 7,350
Muranga 2.06% 6,075,714,168 6,167,550,964 - 21,971,530 80,802,400 162,225,000 95,744,681 55,420,556 6,583,715,132 6,985
Nairobi 5.00% 14,988,400,877 14,965,886,555 - 73,155,271 302,579,200 393,750,000 95,744,681 2,153,481,243 17,984,596,949 5,731
Nakuru 3.12% 9,611,129,327 9,346,137,021 446,285,715 37,373,449 219,627,800 245,700,000 95,744,681 39,391,730 10,430,260,396 6,505
Nandi 1.83% 5,400,805,811 5,475,611,000 - 17,551,588 67,048,800 144,112,500 95,744,681 29,685,498 5,829,754,067 7,742
Narok 2.04% 6,069,533,014 6,089,136,697 - 19,834,915 56,303,800 160,650,000 95,744,681 174,631,518 6,596,301,611 7,752
Nyamira 1.60% 4,753,135,780 4,784,043,659 - 13,945,233 79,942,800 126,000,000 95,744,681 27,952,601 5,127,628,974 8,571
Nyandarua 1.66% 4,883,603,211 4,959,688,612 - 13,898,986 50,716,400 130,725,000 95,744,681 37,393,353 5,288,167,031 8,869
Nyeri 1.71% 5,453,740,722 5,123,376,160 436,142,857 16,166,813 82,091,800 134,662,500 95,744,681 28,804,165 5,916,988,975 8,531
Samburu 1.37% 4,045,213,041 4,090,532,282 - 5,220,197 14,183,400 107,887,500 95,744,681 78,926,030 4,392,494,090 19,614
Siaya 1.92% 5,713,934,349 5,752,198,456 - 19,634,077 128,080,400 151,200,000 95,744,681 68,377,768 6,215,235,381 7,379
Taita Taveta 1.27% 3,809,410,333 3,811,041,961 - 6,635,345 42,120,400 100,012,500 95,744,681 89,150,851 4,144,705,737 14,560
Tana River 1.53% 4,620,956,536 4,588,321,642 - 5,596,140 19,341,000 120,487,500 95,744,681 70,152,919 4,899,643,882 20,409
Tharaka Nithi 1.21% 3,622,329,182 3,612,978,351 - 8,515,829 35,243,600 95,287,500 95,744,681 103,877,974 3,951,647,934 10,817
Trans Nzoia 1.96% 5,785,005,400 5,872,318,341 - 19,085,197 67,908,400 154,350,000 95,744,681 30,681,752 6,240,088,371 7,621
Turkana 4.03% 11,707,868,339 12,066,841,894 - 19,939,321 23,209,200 317,362,500 95,744,681 164,996,259 12,688,093,855 14,833
Uasin Gishu 2.00% 5,854,438,019 5,977,414,645 - 20,843,281 117,335,400 157,500,000 95,744,681 30,945,743 6,399,783,750 7,157
Vihiga 1.49% 4,423,789,388 4,458,017,656 - 12,928,219 67,908,400 117,337,500 95,744,681 43,635,292 4,795,571,748 8,647
Wajir 2.78% 8,147,672,519 8,328,662,609 - 15,429,821 50,286,600 218,925,000 95,744,681 118,372,535 8,827,421,246 13,336
West Pokot 1.66% 4,947,297,179 4,967,313,501 - 11,950,786 41,260,800 130,725,000 95,744,681 127,398,331 5,374,393,099 10,483
GRAND TOTAL 100.00% 302,198,516,718 299,136,160,000 4,260,000,000 900,000,000 4,298,000,000 7,875,000,000 4,500,000,000 13,968,000,000 334,937,160,000 8,675
County
FY 2016/17 2017/18

ANNEX 1: STATEMENT OF SPECIFIC
FISCAL RISKS
Introduction
1. Kenya’s recent growth performance remains robust and the outlook is positive.
Despite positive economic policies and structural reforms undertaken under the
Economic Transformation Agenda program, the economy remains vulnerable to
shocks, reflecting less favourable global financial market conditions, as well as
continued security threats and potential extreme weather events. To this end,
maintaining fiscal stability is critical for safeguarding against these adverse shocks
and ensuring that growth is sustained despite challenging circumstances.
2. The “Statement of Specific Fiscal Risks” is part of the requirement under the
Public Finance Management Act, 2012 for prudent management of risks. It outlines
Kenya’s exposure to fiscal risks that are associated with assumptions used for fiscal
projections, public debt dynamics, operations of state corporations, contingent
liabilities, vulnerabilities of the financial sector, as well as risks posed by nature.
3. The Statement is intended to inform the parliament and the public about the
country’s exposure to these various sources of risk, and what more can be done to
ensure fiscal viability in the event of the occurrence of the stated risks.
4. Overall, the Statement highlights the following: spending at current levels and
low absorption of development funding, combined with low revenue collections, makes
it more difficult for the government to achieve its fiscal targets; Shocks to the exchange
rate could impact the size of debt servicing, the terms of trade, and inflation; The financial
sector remains sound and is adequately capitalized despite global financial crisis;
Contingent liabilities from key State Corporations present minimal fiscal risks; and Risks
from the devolved system of government remain a key concern.
Macroeconomic Assumptions Changes
5. Changes in macroeconomic assumptions create risks to both revenue and
expenditure projections as they play a key role in the formulation of the budget.
This section reviews past macroeconomic and fiscal performance in Kenya and
then assesses four important sources of fiscal risk to the budget namely:
Reduction in real GDP.
Inflation instability;
Exchange rate volatility, and
Volatility of commodity prices on imports;
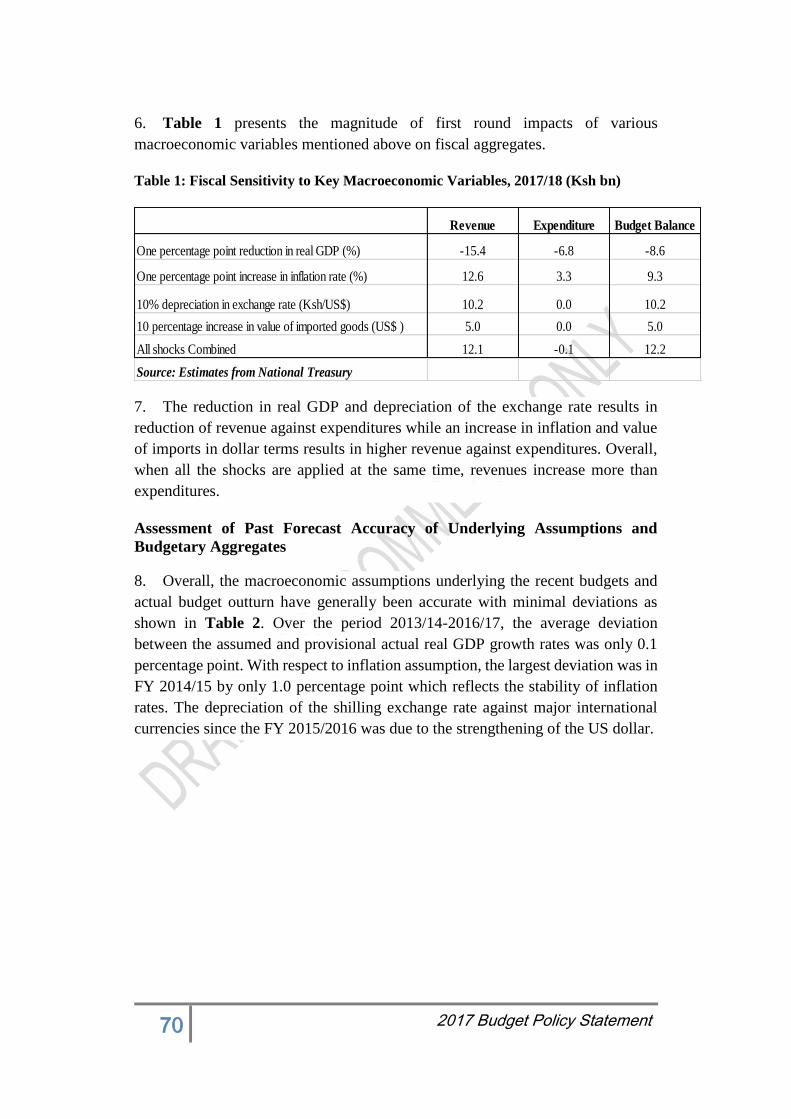
70 2017 Budget Policy Statement
6. Table 1 presents the magnitude of first round impacts of various
macroeconomic variables mentioned above on fiscal aggregates.
Table 1: Fiscal Sensitivity to Key Macroeconomic Variables, 2017/18 (Ksh bn)
7. The reduction in real GDP and depreciation of the exchange rate results in
reduction of revenue against expenditures while an increase in inflation and value
of imports in dollar terms results in higher revenue against expenditures. Overall,
when all the shocks are applied at the same time, revenues increase more than
expenditures.
Assessment of Past Forecast Accuracy of Underlying Assumptions and
Budgetary Aggregates
8. Overall, the macroeconomic assumptions underlying the recent budgets and
actual budget outturn have generally been accurate with minimal deviations as
shown in Table 2. Over the period 2013/14-2016/17, the average deviation
between the assumed and provisional actual real GDP growth rates was only 0.1
percentage point. With respect to inflation assumption, the largest deviation was in
FY 2014/15 by only 1.0 percentage point which reflects the stability of inflation
rates. The depreciation of the shilling exchange rate against major international
currencies since the FY 2015/2016 was due to the strengthening of the US dollar.
Revenue Expenditure Budget Balance
One percentage point reduction in real GDP (%) -15.4 -6.8 -8.6
One percentage point increase in inflation rate (%) 12.6 3.3 9.3
10% depreciation in exchange rate (Ksh/US$) 10.2 0.0 10.2
10 percentage increase in value of imported goods (US$ ) 5.0 0.0 5.0
All shocks Combined 12.1 -0.1 12.2
Source: Estimates from National Treasury
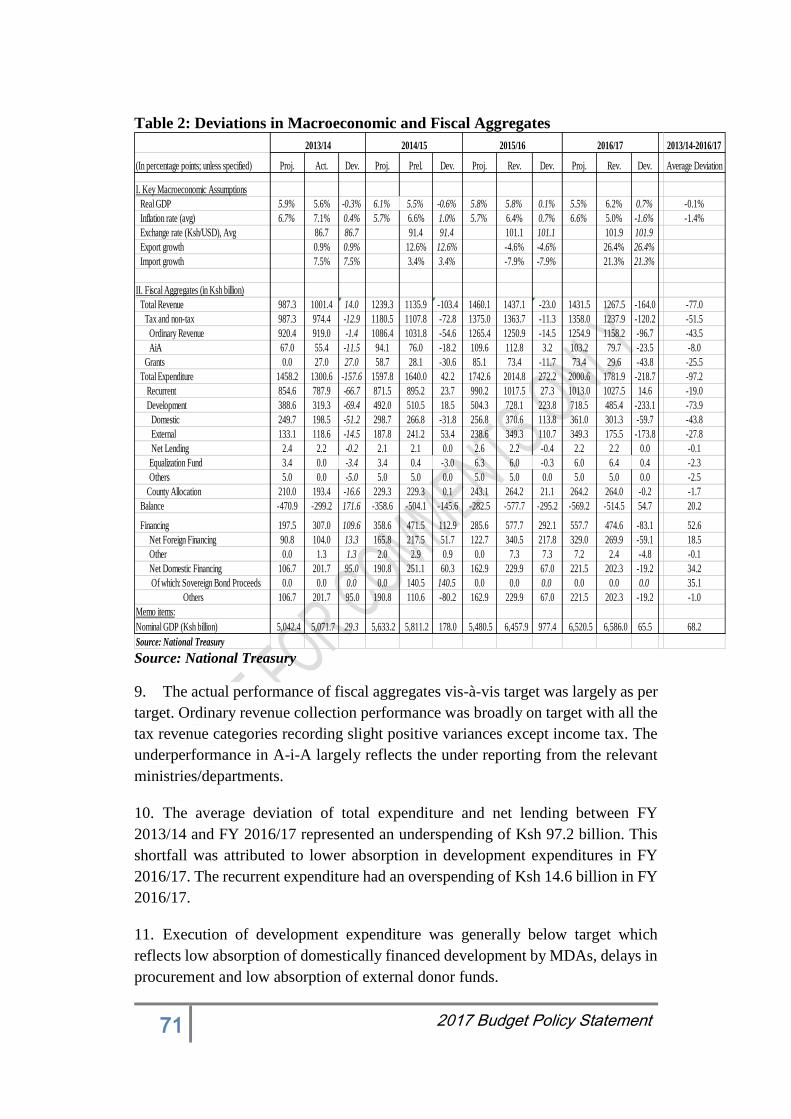
71 2017 Budget Policy Statement
Table 2: Deviations in Macroeconomic and Fiscal Aggregates
Source: National Treasury
9. The actual performance of fiscal aggregates vis-à-vis target was largely as per
target. Ordinary revenue collection performance was broadly on target with all the
tax revenue categories recording slight positive variances except income tax. The
underperformance in A-i-A largely reflects the under reporting from the relevant
ministries/departments.
10. The average deviation of total expenditure and net lending between FY
2013/14 and FY 2016/17 represented an underspending of Ksh 97.2 billion. This
shortfall was attributed to lower absorption in development expenditures in FY
2016/17. The recurrent expenditure had an overspending of Ksh 14.6 billion in FY
2016/17.
11. Execution of development expenditure was generally below target which
reflects low absorption of domestically financed development by MDAs, delays in
procurement and low absorption of external donor funds.
2013/14-2016/17
(In percentage points; unless specified) Proj. Act. Dev. Proj. Prel. Dev. Proj. Rev. Dev. Proj. Rev. Dev. Average Deviation
I. Key Macroeconomic Assumptions
Real GDP 5.9% 5.6% -0.3% 6.1% 5.5% -0.6% 5.8% 5.8% 0.1% 5.5% 6.2% 0.7% -0.1%
Inflation rate (avg) 6.7% 7.1% 0.4% 5.7% 6.6% 1.0% 5.7% 6.4% 0.7% 6.6% 5.0% -1.6% -1.4%
Exchange rate (Ksh/USD), Avg 86.7 86.7 91.4 91.4 101.1 101.1 101.9 101.9
Export growth 0.9% 0.9% 12.6% 12.6% -4.6% -4.6% 26.4% 26.4%
Import growth 7.5% 7.5% 3.4% 3.4% -7.9% -7.9% 21.3% 21.3%
II. Fiscal Aggregates (in Ksh billion)
Total Revenue 987.3 1001.4 14.0 1239.3 1135.9 -103.4 1460.1 1437.1 -23.0 1431.5 1267.5 -164.0 -77.0
Tax and non-tax 987.3 974.4 -12.9 1180.5 1107.8 -72.8 1375.0 1363.7 -11.3 1358.0 1237.9 -120.2 -51.5
Ordinary Revenue 920.4 919.0 -1.4 1086.4 1031.8 -54.6 1265.4 1250.9 -14.5 1254.9 1158.2 -96.7 -43.5
AiA 67.0 55.4 -11.5 94.1 76.0 -18.2 109.6 112.8 3.2 103.2 79.7 -23.5 -8.0
Grants 0.0 27.0 27.0 58.7 28.1 -30.6 85.1 73.4 -11.7 73.4 29.6 -43.8 -25.5
Total Expenditure 1458.2 1300.6 -157.6 1597.8 1640.0 42.2 1742.6 2014.8 272.2 2000.6 1781.9 -218.7 -97.2
Recurrent 854.6 787.9 -66.7 871.5 895.2 23.7 990.2 1017.5 27.3 1013.0 1027.5 14.6 -19.0
Development 388.6 319.3 -69.4 492.0 510.5 18.5 504.3 728.1 223.8 718.5 485.4 -233.1 -73.9
Domestic 249.7 198.5 -51.2 298.7 266.8 -31.8 256.8 370.6 113.8 361.0 301.3 -59.7 -43.8
External 133.1 118.6 -14.5 187.8 241.2 53.4 238.6 349.3 110.7 349.3 175.5 -173.8 -27.8
Net Lending 2.4 2.2 -0.2 2.1 2.1 0.0 2.6 2.2 -0.4 2.2 2.2 0.0 -0.1
Equalization Fund 3.4 0.0 -3.4 3.4 0.4 -3.0 6.3 6.0 -0.3 6.0 6.4 0.4 -2.3
Others 5.0 0.0 -5.0 5.0 5.0 0.0 5.0 5.0 0.0 5.0 5.0 0.0 -2.5
County Allocation 210.0 193.4 -16.6 229.3 229.3 0.1 243.1 264.2 21.1 264.2 264.0 -0.2 -1.7
Balance -470.9 -299.2 171.6 -358.6 -504.1 -145.6 -282.5 -577.7 -295.2 -569.2 -514.5 54.7 20.2
Financing 197.5 307.0 109.6 358.6 471.5 112.9 285.6 577.7 292.1 557.7 474.6 -83.1 52.6
Net Foreign Financing 90.8 104.0 13.3 165.8 217.5 51.7 122.7 340.5 217.8 329.0 269.9 -59.1 18.5
Other 0.0 1.3 1.3 2.0 2.9 0.9 0.0 7.3 7.3 7.2 2.4 -4.8 -0.1
Net Domestic Financing 106.7 201.7 95.0 190.8 251.1 60.3 162.9 229.9 67.0 221.5 202.3 -19.2 34.2
Of which: Sovereign Bond Proceeds 0.0 0.0 0.0 0.0 140.5 140.5 0.0 0.0 0.0 0.0 0.0 0.0 35.1
Others 106.7 201.7 95.0 190.8 110.6 -80.2 162.9 229.9 67.0 221.5 202.3 -19.2 -1.0
Memo items:
Nominal GDP (Ksh billion) 5,042.4 5,071.7 29.3 5,633.2 5,811.2 178.0 5,480.5 6,457.9 977.4 6,520.5 6,586.0 65.5 68.2
Source: National Treasury
2013/14 2014/15 2016/172015/16
72 2017 Budget Policy Statement
12. The slower-than-programmed spending on development budget poses a risk
to the fiscal program, going forward. In order to prevent this risk from
materializing, the National Treasury has issued guidelines on how capital projects
should be planned, appraised and evaluated before funds are finally committed in
the budget. The National Treasury will engage Development Partners and execute
financial agreements when the project has fulfilled all preliminary conditions for
execution.
13. Going forward, there are risks associated with expenditure proposals that
cannot be accommodated within the baseline ceilings.
SPECIFIC FISCAL RISKS
14. This section addresses areas of specific fiscal risk faced by Kenya. Each of
these risks has a linkage to the expansion of infrastructure in the country, a key
government priority, which makes effective risk management all the more
important:
The sustainability of public debt;
Explicit Contingent Liabilities
Implicit Contingent Liabilities
Devolved System of Government
Sustainability of Public Debt
15. The sustainability of Kenya’s debt depends on macroeconomic performance
and prudence in borrowing. Significant uptake of domestic debt could lead to
refinancing risk and expected increase in the US interest rates could also exert
pressure on the debt sustainability position due to expected rise in interest rates in
the global markets. In addition, increased external financing on both concessional
and non-concessional terms pose an inherent foreign exchange risk which may
worsen the PV of debt and therefore increases the risk of debt distress. Increased
use of longer-term domestic debt instruments would help mitigate exposure of the
government debt portfolio to foreign currency risk and contribute to reducing
domestic rollover risk.
16. The government recognizes the importance of managing debt in a prudent way
to ensure the debt burden is shared equally between the current and future
generation. The latest debt sustainability analysis (DSA) for Kenya (March 2016)
indicates that Kenya’s debt is sustainable. The DSA compares debt burden
indicators to indicative thresholds over a 20-year projection period. A debt-burden
indicator that exceeds its indicative threshold suggests a risk of experiencing some
form of debt distress.
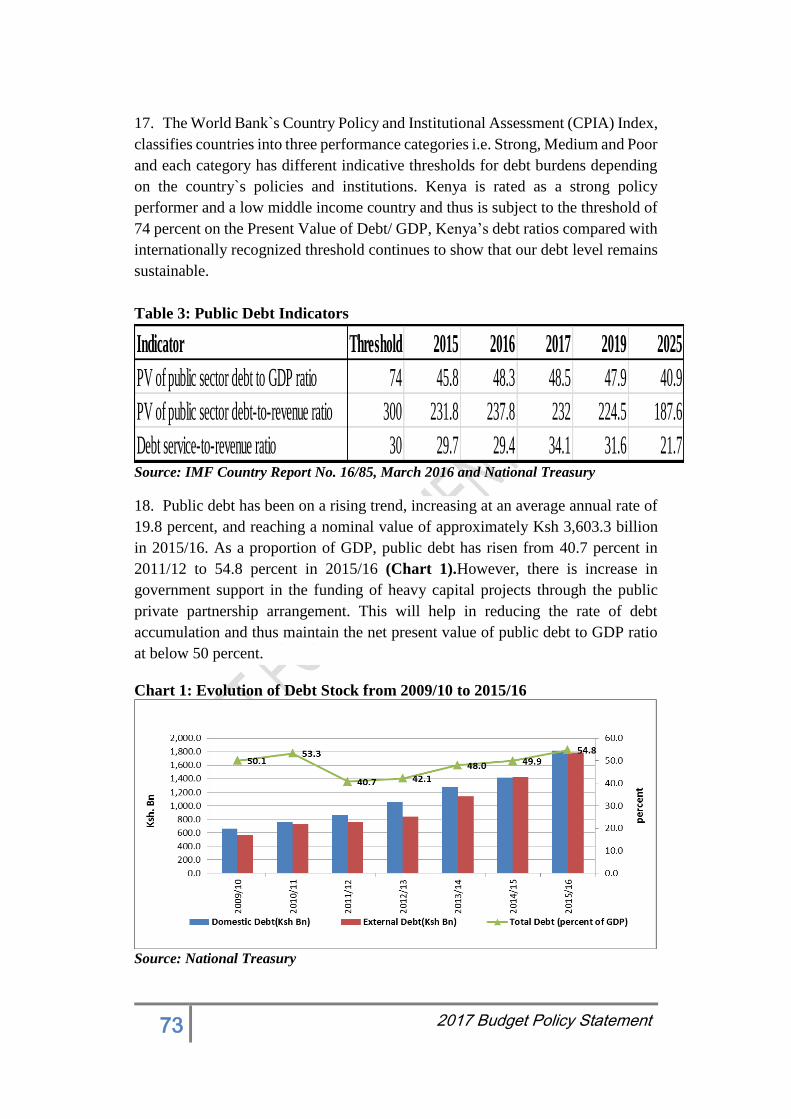
73 2017 Budget Policy Statement
17. The World Bank`s Country Policy and Institutional Assessment (CPIA) Index,
classifies countries into three performance categories i.e. Strong, Medium and Poor
and each category has different indicative thresholds for debt burdens depending
on the country`s policies and institutions. Kenya is rated as a strong policy
performer and a low middle income country and thus is subject to the threshold of
74 percent on the Present Value of Debt/ GDP, Kenya’s debt ratios compared with
internationally recognized threshold continues to show that our debt level remains
sustainable.
Table 3: Public Debt Indicators
Source: IMF Country Report No. 16/85, March 2016 and National Treasury
18. Public debt has been on a rising trend, increasing at an average annual rate of
19.8 percent, and reaching a nominal value of approximately Ksh 3,603.3 billion
in 2015/16. As a proportion of GDP, public debt has risen from 40.7 percent in
2011/12 to 54.8 percent in 2015/16 (Chart 1).However, there is increase in
government support in the funding of heavy capital projects through the public
private partnership arrangement. This will help in reducing the rate of debt
accumulation and thus maintain the net present value of public debt to GDP ratio
at below 50 percent.
Chart 1: Evolution of Debt Stock from 2009/10 to 2015/16
Source: National Treasury
Indicator Threshold 2015 2016 2017 2019 2025
PV of public sector debt to GDP ratio 74 45.8 48.3 48.5 47.9 40.9
PV of public sector debt-to-revenue ratio 300 231.8 237.8 232 224.5 187.6
Debt service-to-revenue ratio 30 29.7 29.4 34.1 31.6 21.7
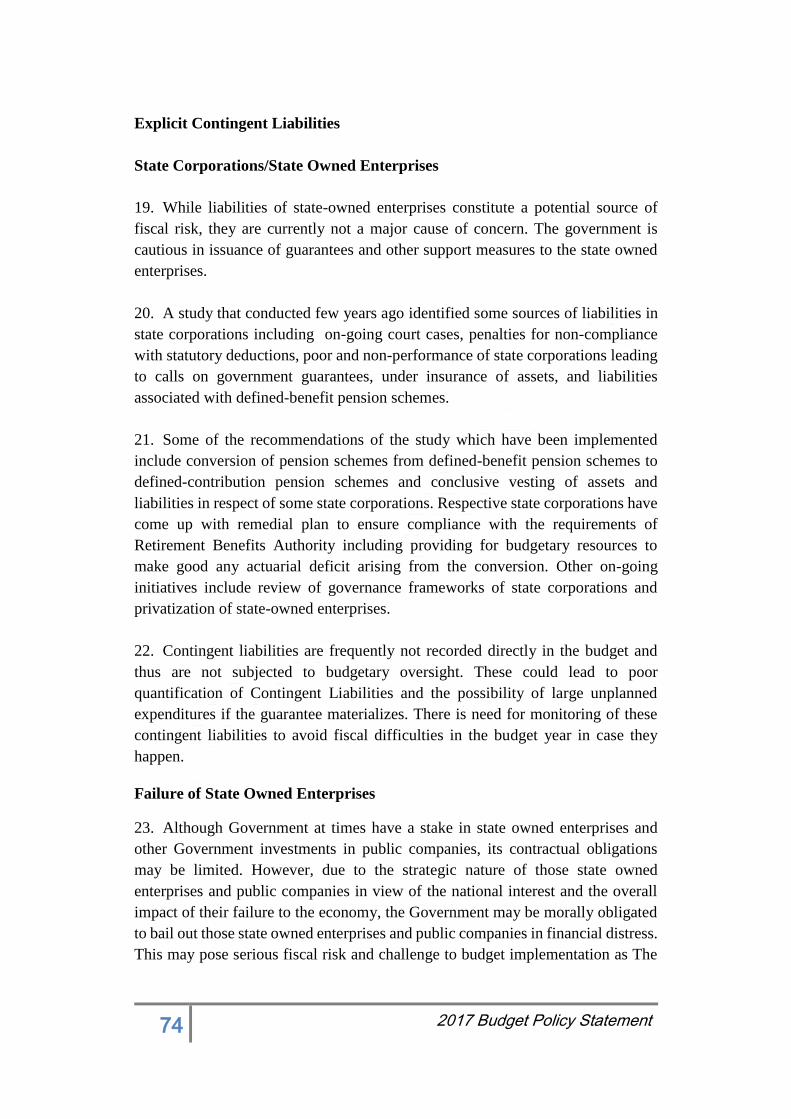
74 2017 Budget Policy Statement
Explicit Contingent Liabilities
State Corporations/State Owned Enterprises
19. While liabilities of state-owned enterprises constitute a potential source of
fiscal risk, they are currently not a major cause of concern. The government is
cautious in issuance of guarantees and other support measures to the state owned
enterprises.
20. A study that conducted few years ago identified some sources of liabilities in
state corporations including on-going court cases, penalties for non-compliance
with statutory deductions, poor and non-performance of state corporations leading
to calls on government guarantees, under insurance of assets, and liabilities
associated with defined-benefit pension schemes.
21. Some of the recommendations of the study which have been implemented
include conversion of pension schemes from defined-benefit pension schemes to
defined-contribution pension schemes and conclusive vesting of assets and
liabilities in respect of some state corporations. Respective state corporations have
come up with remedial plan to ensure compliance with the requirements of
Retirement Benefits Authority including providing for budgetary resources to
make good any actuarial deficit arising from the conversion. Other on-going
initiatives include review of governance frameworks of state corporations and
privatization of state-owned enterprises.
22. Contingent liabilities are frequently not recorded directly in the budget and
thus are not subjected to budgetary oversight. These could lead to poor
quantification of Contingent Liabilities and the possibility of large unplanned
expenditures if the guarantee materializes. There is need for monitoring of these
contingent liabilities to avoid fiscal difficulties in the budget year in case they
happen.
Failure of State Owned Enterprises
23. Although Government at times have a stake in state owned enterprises and
other Government investments in public companies, its contractual obligations
may be limited. However, due to the strategic nature of those state owned
enterprises and public companies in view of the national interest and the overall
impact of their failure to the economy, the Government may be morally obligated
to bail out those state owned enterprises and public companies in financial distress.
This may pose serious fiscal risk and challenge to budget implementation as The
75 2017 Budget Policy Statement
National Treasury has to provide budgetary resources to bail out those state owned
enterprises and public companies in the course of the budget year.
Unfunded Pension Liabilities
Under current pension arrangements, the government funds its pension liabilities
from the current budget based on projections of those entering retirement from the
public service. The legal retirement window ranges from 50 years to 60 years,
where 50 years is the voluntary retirement age while 60 years is mandatory.
Unfunded pension liabilities arise as a fiscal risk as the projected voluntary retirees
pension liabilities have yet to be quantified and the government has not set aside a
fund or scheme to cover for these, were the proportion of voluntary retirees to all
claim pension, the government would face a larger pension liability putting a
burden on the current budget.
Public Private Partnership (PPP) Projects
24. Since 1996 and as a result of progressive liberalization of the economy, Kenya
has attracted private investments into the country’s economic infrastructure sectors
including telecommunications, energy, transport, water and sewerage. The
frontrunner sector to lock in private participation in public infrastructure
development is the energy sector – which witnessed its first Independent Power
Producers (IPPs) in electricity generation starting from 1996. Currently, all of the
country’s generated electricity is private sector-led, with thirteen (13) active IPPs.
In most of the IPPs, Government has provided some forms of government support
measures, mainly a Letter of Support. (Annex Table 5).
25. There are twenty-one (21) new generation projects that are at an advanced
stage of planning –three (3) being large projects using coal and geothermal
technologies, and eighteen (18) renewable energy projects that will use wind, solar
and other renewable energy technologies. Other ongoing and planned PPPs in the
other sector are shown in the table below.
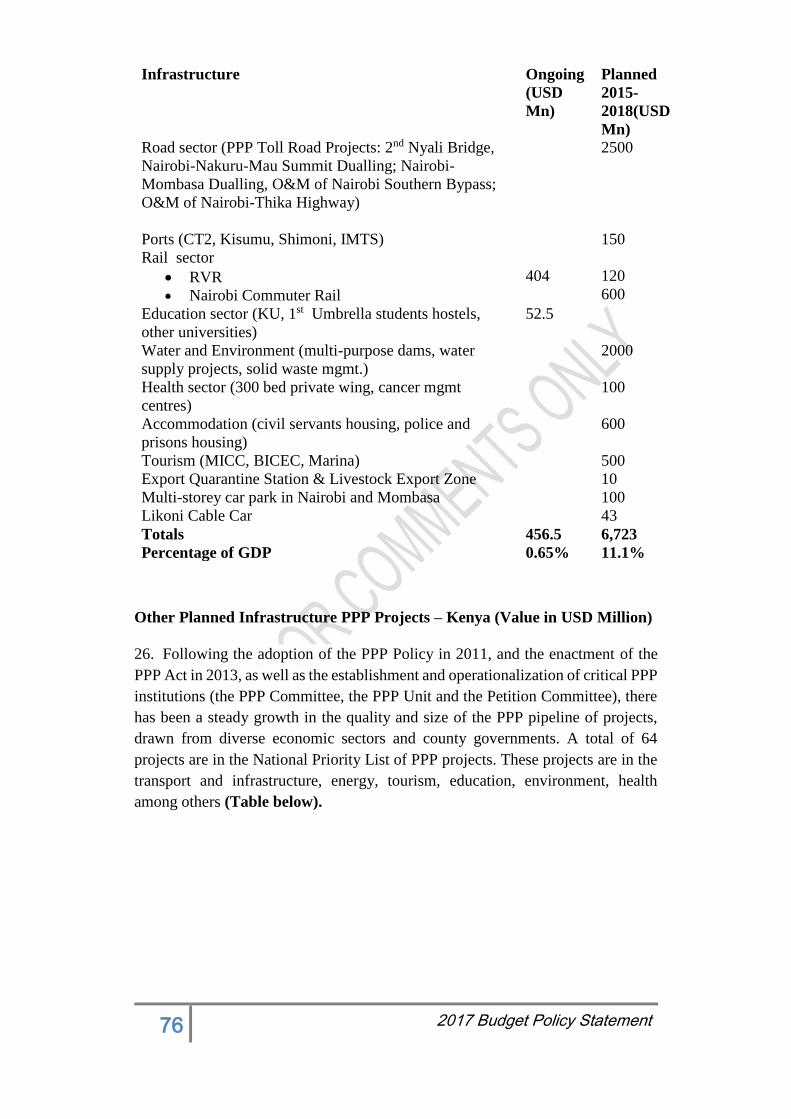
76 2017 Budget Policy Statement
Other Planned Infrastructure PPP Projects – Kenya (Value in USD Million)
26. Following the adoption of the PPP Policy in 2011, and the enactment of the
PPP Act in 2013, as well as the establishment and operationalization of critical PPP
institutions (the PPP Committee, the PPP Unit and the Petition Committee), there
has been a steady growth in the quality and size of the PPP pipeline of projects,
drawn from diverse economic sectors and county governments. A total of 64
projects are in the National Priority List of PPP projects. These projects are in the
transport and infrastructure, energy, tourism, education, environment, health
among others (Table below).
Infrastructure Ongoing
(USD
Mn)
Planned
2015-
2018(USD
Mn)
Road sector (PPP Toll Road Projects: 2nd Nyali Bridge,
Nairobi-Nakuru-Mau Summit Dualling; Nairobi-
Mombasa Dualling, O&M of Nairobi Southern Bypass;
O&M of Nairobi-Thika Highway)
Ports (CT2, Kisumu, Shimoni, IMTS)
Rail sector
RVR
Nairobi Commuter Rail
404
2500
150
120
600
Education sector (KU, 1st Umbrella students hostels,
other universities)
52.5
Water and Environment (multi-purpose dams, water
supply projects, solid waste mgmt.)
2000
Health sector (300 bed private wing, cancer mgmt
centres)
100
Accommodation (civil servants housing, police and
prisons housing)
600
Tourism (MICC, BICEC, Marina) 500
Export Quarantine Station & Livestock Export Zone 10
Multi-storey car park in Nairobi and Mombasa 100
Likoni Cable Car 43
Totals 456.5 6,723
Percentage of GDP 0.65% 11.1%

77 2017 Budget Policy Statement
Note: “FS” stands for feasibility study stage. “TA Proc” stands for transaction advisory
procurement. “Commercial Close” stands for signing of the PPP project agreement. “TA
TOR” stands for preparation of terms of reference for the recruitment of a transaction
advisor. “Prelm FS” stands for Preliminary Feasibility Study. These acronyms serve to
indicate the current stage of each project’s development.
78 2017 Budget Policy Statement
27. The GOK understands that any PPP project comprises roles and
responsibilities for both the public and private sector. In particular and based on
specific project needs, the public sector’s contributions to the “partnership” of
PPPs would typically include the use of multiple instruments of support and credit
enhancement measures such as project development funding, availability
payments, upfront capital grants, operational grants, revenue guarantees, Partial
Risk Guarantees (PRG), etc.
28. In accordance with section 7(1) of the PPP Act, the PPP Committee has
adopted a Fiscal Commitment and Contingent Liability (FCCL) Management
Framework to ensure approval of, and fiscal accountability in the management of,
financial and any other form of Government support granted in the
implementation of the country’s PPP program. To oversee the
institutionalisation and operationalization of this Management Framework, the
Government in collaboration with the World Bank (WB) and the PPP Unit, has
established an FCCL Unit within the Directorate of Public Debt Management
Office of the National Treasury.
29. The unit is responsible for: mandatory evaluation of all proposed PPP projects
for financial risks and contingent liabilities as a condition of project approval;
confirmation of this initial approval at feasibility stage based on preferred bidder
submission and final negotiated project structure; regular monitoring of all support
measures for any amendment(s) or variation(s) to a project agreement’s terms and
conditions, project outputs or any waivers in the project agreement; and, the
ongoing development of a policy framework to govern the issuance of any and all
types of letters of support requested across Government. The policy will provide a
clear structure and process as a primary means of managing financial risks
to government by ensuring robust and rigorous analysis and review before
the Government takes on such commitments.
30. All guarantees and other security instruments provided under the PPP agenda,
together with all other contingent liabilities will be integrated into The debt
management process. The FCCL Unit now routinely assesses and is establishing
systems for monitoring these projects with a view to ensuring continuous risk
management and the scheduled disclosure and reporting of all fiscal risks
associated with PPPs.
31. To mitigate the risks, operationalization of the PPP Project Facilitation Fund
(PFF) (a multi-purpose revolving fund) and establishment of a good Governance
Framework to manage Direct (or explicit) Liabilities and Contingent Liabilities is
critical. A useful component of the good governance framework is the below
qualitative risk assessment tool that is currently under implementation, while the
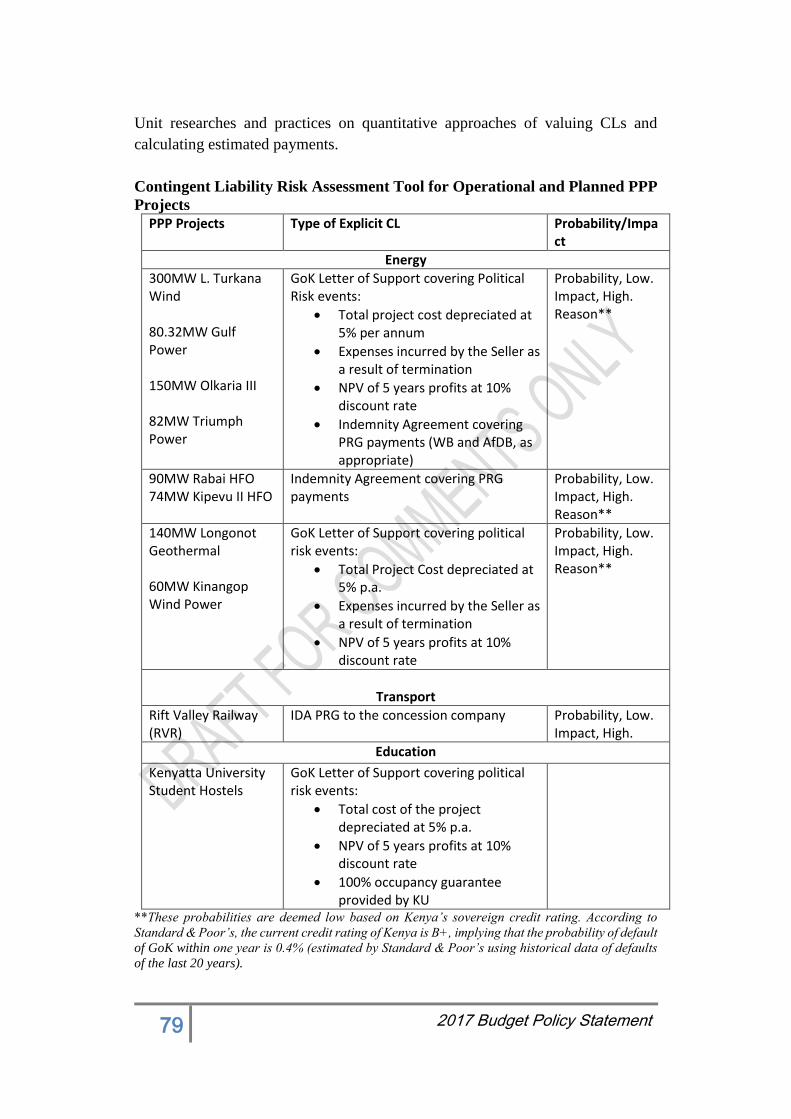
79 2017 Budget Policy Statement
Unit researches and practices on quantitative approaches of valuing CLs and
calculating estimated payments.
Contingent Liability Risk Assessment Tool for Operational and Planned PPP
Projects
PPP Projects Type of Explicit CL Probability/Impact
Energy
300MW L. Turkana Wind 80.32MW Gulf Power 150MW Olkaria III 82MW Triumph Power
GoK Letter of Support covering Political Risk events:
Total project cost depreciated at 5% per annum
Expenses incurred by the Seller as a result of termination
NPV of 5 years profits at 10% discount rate
Indemnity Agreement covering PRG payments (WB and AfDB, as appropriate)
Probability, Low. Impact, High. Reason**
90MW Rabai HFO 74MW Kipevu II HFO
Indemnity Agreement covering PRG payments
Probability, Low. Impact, High. Reason**
140MW Longonot Geothermal 60MW Kinangop Wind Power
GoK Letter of Support covering political risk events:
Total Project Cost depreciated at 5% p.a.
Expenses incurred by the Seller as a result of termination
NPV of 5 years profits at 10% discount rate
Probability, Low. Impact, High. Reason**
Transport
Rift Valley Railway (RVR)
IDA PRG to the concession company Probability, Low. Impact, High.
Education
Kenyatta University Student Hostels
GoK Letter of Support covering political risk events:
Total cost of the project depreciated at 5% p.a.
NPV of 5 years profits at 10% discount rate
100% occupancy guarantee provided by KU
**These probabilities are deemed low based on Kenya’s sovereign credit rating. According to
Standard & Poor’s, the current credit rating of Kenya is B+, implying that the probability of default
of GoK within one year is 0.4% (estimated by Standard & Poor’s using historical data of defaults
of the last 20 years).
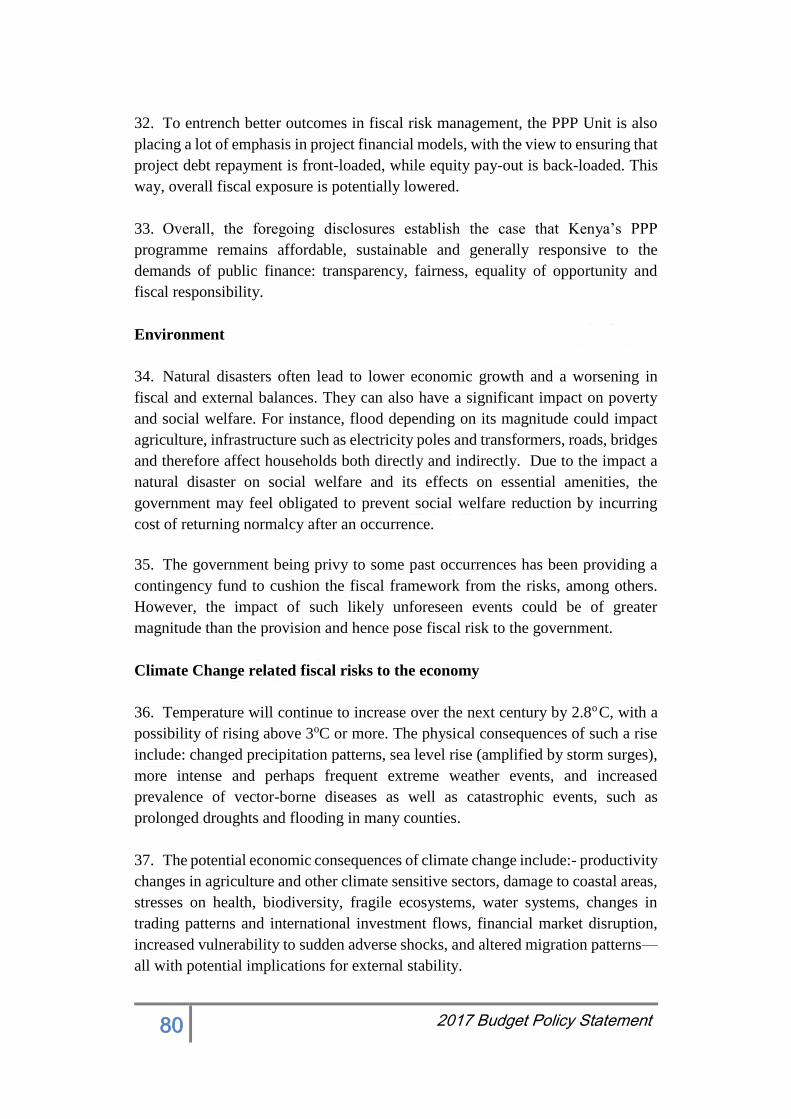
80 2017 Budget Policy Statement
32. To entrench better outcomes in fiscal risk management, the PPP Unit is also
placing a lot of emphasis in project financial models, with the view to ensuring that
project debt repayment is front-loaded, while equity pay-out is back-loaded. This
way, overall fiscal exposure is potentially lowered.
33. Overall, the foregoing disclosures establish the case that Kenya’s PPP
programme remains affordable, sustainable and generally responsive to the
demands of public finance: transparency, fairness, equality of opportunity and
fiscal responsibility.
Environment
34. Natural disasters often lead to lower economic growth and a worsening in
fiscal and external balances. They can also have a significant impact on poverty
and social welfare. For instance, flood depending on its magnitude could impact
agriculture, infrastructure such as electricity poles and transformers, roads, bridges
and therefore affect households both directly and indirectly. Due to the impact a
natural disaster on social welfare and its effects on essential amenities, the
government may feel obligated to prevent social welfare reduction by incurring
cost of returning normalcy after an occurrence.
35. The government being privy to some past occurrences has been providing a
contingency fund to cushion the fiscal framework from the risks, among others.
However, the impact of such likely unforeseen events could be of greater
magnitude than the provision and hence pose fiscal risk to the government.
Climate Change related fiscal risks to the economy
36. Temperature will continue to increase over the next century by 2.8o C, with a
possibility of rising above 3oC or more. The physical consequences of such a rise
include: changed precipitation patterns, sea level rise (amplified by storm surges),
more intense and perhaps frequent extreme weather events, and increased
prevalence of vector-borne diseases as well as catastrophic events, such as
prolonged droughts and flooding in many counties.
37. The potential economic consequences of climate change include:- productivity
changes in agriculture and other climate sensitive sectors, damage to coastal areas,
stresses on health, biodiversity, fragile ecosystems, water systems, changes in
trading patterns and international investment flows, financial market disruption,
increased vulnerability to sudden adverse shocks, and altered migration patterns—
all with potential implications for external stability.

81 2017 Budget Policy Statement
38. The fiscal implications of climate change could be among its most powerful
and immediate, affecting many countries including Kenya. Climate developments
will directly affect fiscal positions, through their impact on tax bases and spending
programs and use of fiscal instruments in mitigating the extent of CC and adapting
so as to limit the damage that remains.
39. Over the last three years, the National Treasury has been leading the process
of developing fiscal instruments for climate proofing vulnerable sectors of the
economy through enhancing mitigation and adaption. These include: Climate
Finance Policy, Climate Public Expenditure review and climate change budget
coding for tracking climate change related expenditure. However, climate change
will continue to pose significant fiscal risk especially through potential flooding
and drought incidences.
Terrorist Attack
40. Potential terrorist attacks would affect the tourism sector and may also impact
market confidence. Tourism contributes 0.5% of GDP and brings in a substantial
amount of foreign earnings. In the recent past, Kenya faced terror attacks including
in: Westgate Shopping Mall in Nairobi (September 2013), Eastleigh in Nairobi
(April 2014), Thika Highway attack (May 2014), Gikomba Market attack (May
2014), Mpeketoni attack in Lamu (June 2014), Mandera bus attack (November
2014), Mandera quarry workers attack (December 2014) and Garissa University
College attack (April 2015). These attacks have resulted in loss of lives, destruction
of property, loss of businesses, disruption of families, restriction of movement of
people, religious animosity and profiling of certain communities.
41. These direct and other indirect costs including loss of jobs have a negative
impact on government revenue from tax, increased government spending on
security and peace restoration as well as redeeming country’s image hence risk to
the government’s fiscal framework.
Technological Disaster
42. Information technology accounts for about 0.9 percent of GDP (2015) driven
by financial innovation in mobile money transfer services. 1.1 billion transactions
amounting to Ksh.2.8 trillion were transacted through this system in 2015. The
main telecommunication company driving this channel constitutes a significant
share of the market as well as a significant proportion of corporate tax paid to the
government. Various financial products have been leveraged on this payment
channel increasing the inter linkages between this technology and the banking
sector. If this system was to be compromised, the impact would be substantial
considering the linkages and the corporate tax revenue for government. The
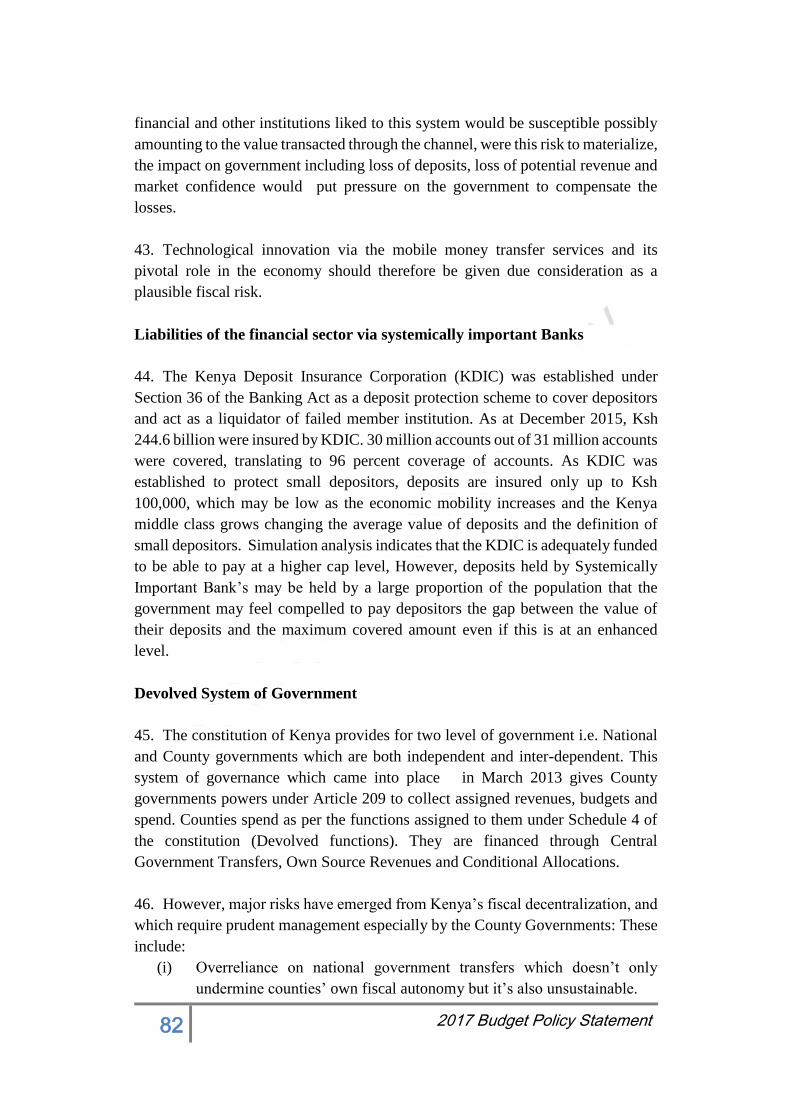
82 2017 Budget Policy Statement
financial and other institutions liked to this system would be susceptible possibly
amounting to the value transacted through the channel, were this risk to materialize,
the impact on government including loss of deposits, loss of potential revenue and
market confidence would put pressure on the government to compensate the
losses.
43. Technological innovation via the mobile money transfer services and its
pivotal role in the economy should therefore be given due consideration as a
plausible fiscal risk.
Liabilities of the financial sector via systemically important Banks
44. The Kenya Deposit Insurance Corporation (KDIC) was established under
Section 36 of the Banking Act as a deposit protection scheme to cover depositors
and act as a liquidator of failed member institution. As at December 2015, Ksh
244.6 billion were insured by KDIC. 30 million accounts out of 31 million accounts
were covered, translating to 96 percent coverage of accounts. As KDIC was
established to protect small depositors, deposits are insured only up to Ksh
100,000, which may be low as the economic mobility increases and the Kenya
middle class grows changing the average value of deposits and the definition of
small depositors. Simulation analysis indicates that the KDIC is adequately funded
to be able to pay at a higher cap level, However, deposits held by Systemically
Important Bank’s may be held by a large proportion of the population that the
government may feel compelled to pay depositors the gap between the value of
their deposits and the maximum covered amount even if this is at an enhanced
level.
Devolved System of Government
45. The constitution of Kenya provides for two level of government i.e. National
and County governments which are both independent and inter-dependent. This
system of governance which came into place in March 2013 gives County
governments powers under Article 209 to collect assigned revenues, budgets and
spend. Counties spend as per the functions assigned to them under Schedule 4 of
the constitution (Devolved functions). They are financed through Central
Government Transfers, Own Source Revenues and Conditional Allocations.
46. However, major risks have emerged from Kenya’s fiscal decentralization, and
which require prudent management especially by the County Governments: These
include:
(i) Overreliance on national government transfers which doesn’t only
undermine counties’ own fiscal autonomy but it’s also unsustainable.
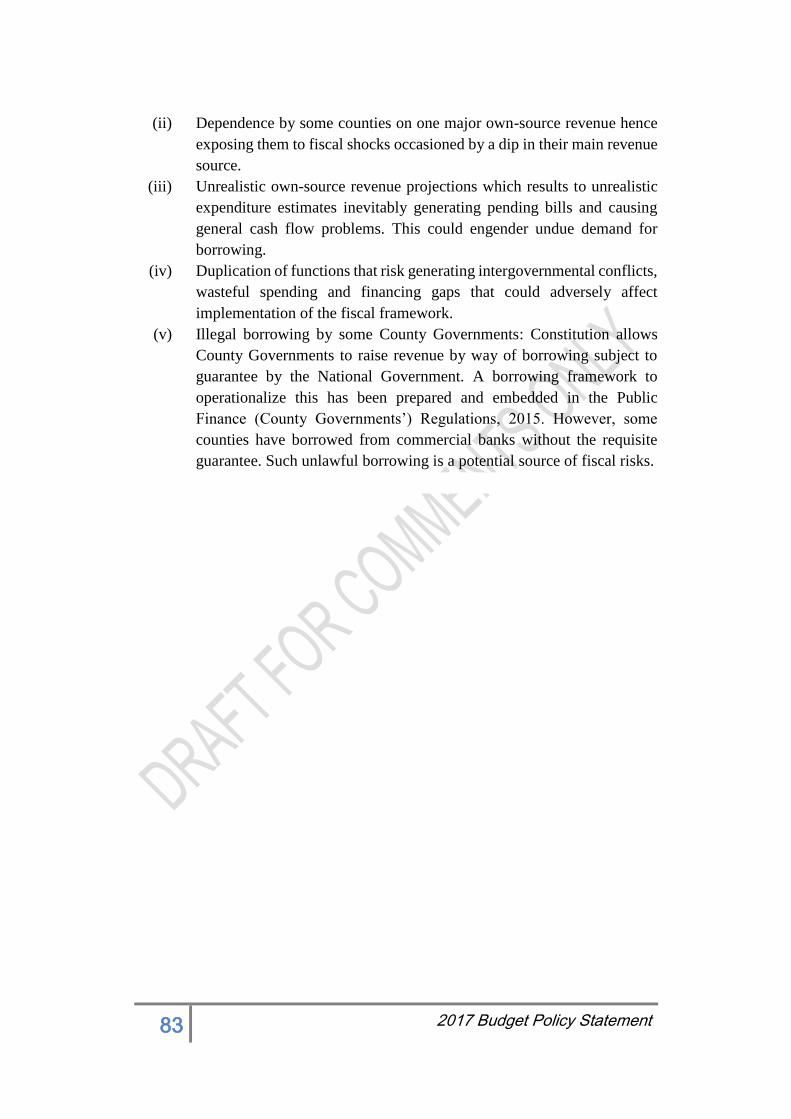
83 2017 Budget Policy Statement
(ii) Dependence by some counties on one major own-source revenue hence
exposing them to fiscal shocks occasioned by a dip in their main revenue
source.
(iii) Unrealistic own-source revenue projections which results to unrealistic
expenditure estimates inevitably generating pending bills and causing
general cash flow problems. This could engender undue demand for
borrowing.
(iv) Duplication of functions that risk generating intergovernmental conflicts,
wasteful spending and financing gaps that could adversely affect
implementation of the fiscal framework.
(v) Illegal borrowing by some County Governments: Constitution allows
County Governments to raise revenue by way of borrowing subject to
guarantee by the National Government. A borrowing framework to
operationalize this has been prepared and embedded in the Public
Finance (County Governments’) Regulations, 2015. However, some
counties have borrowed from commercial banks without the requisite
guarantee. Such unlawful borrowing is a potential source of fiscal risks.

84 2017 Budget Policy Statement
ANNEX TABLES
Annex Table 1: Macroeconomic Indicators, 2014/15-2019/20
Act.
Rev.
Budget'16 Prel. Budget'16 BROP'16 BPS'17 BPS'16 BROP'16 BPS'17 BPS'16 BROP'16 BPS'17 BROP'16 BPS'17
National Account and Prices
Real GDP 5.5 5.8 5.8 6.1 6.1 6.0 6.3 6.3 6.2 6.5 6.6 6.5 6.7 6.6
GDP deflator 8.6 6.8 7.6 6.2 5.3 6.1 5.6 5.8 5.5 5.4 5.9 5.4 4.8 5.6
CPI Index (eop) 6.5 5.3 6.0 5.0 5.3 5.3 5.0 5.0 5.0 5.0 5.0 5.0 5.0 5.0
CPI Index (avg) 6.6 5.6 6.4 5.0 5.6 5.6 5.0 5.0 5.0 5.0 5.0 5.0 5.0 5.0
Terms of trade (-deterioration) -0.2 0.3 0.7 -0.9 1.0 2.1 0.9 0.6 1.5 -1.0 0.8 1.0 0.0 -0.5
Money and Credit (end of period)
Net domestic assets 19.6 12.3 10.1 7.3 -4.0 -6.0 6.0 5.1 2.5 6.9 7.0 8.4 10.9 13.7
Net domestic credit to the Government 72.9 22.3 14.4 18.2 25.0 19.1 15.4 22.0 22.8 9.9 15.3 20.0 10.0 10.4
Credit to the rest of the economy 20.3 16.8 8.4 14.8 17.1 8.5 13.5 14.6 8.7 12.7 15.1 14.9 21.6 18.6
Broad Money, M3 (percent change) 18.6 13.0 7.9 12.6 11.5 12.9 12.3 12.3 11.4 12.4 12.4 11.8 14.2 15.0
Reserve money (percent change) 14.9 4.9 10.4 14.8 15.8 11.2 11.2 10.8 11.3 11.3 11.1 13.1 14.3
Investment and Saving
Investment 22.5 23.5 23.3 22.8 24.6 23.9 24.5 25.1 24.4 23.8 26.4 25.9 27.2 26.5
Central Government 8.7 10.4 7.2 11.1 8.2 7.9 9.0 8.1 8.0 8.5 7.8 7.7 8.1 7.8
Other 13.8 13.1 16.1 11.7 16.5 16.0 15.5 17.0 16.4 15.3 18.5 18.2 19.0 18.7
Gross National Saving 14.4 16.4 16.8 17.4 19.4 17.8 19.2 19.8 18.3 18.2 21.2 19.9 22.1 20.9
Central Government 3.6 3.3 3.2 4.7 3.8 4.6 6.7 5.0 5.1 7.4 5.7 5.8 7.2 6.7
Other 10.8 13.0 13.6 12.7 15.6 13.3 12.6 14.8 13.2 10.7 15.6 14.2 15.0 14.2
Central Government Budget
Total revenue 19.1 20.2 18.8 20.7 20.1 20.2 21.1 20.1 20.4 21.3 20.3 20.7 21.9 21.7
Total expenditure and net lending 28.2 31.5 27.1 31.3 28.6 27.6 27.6 27.4 27.5 26.3 26.2 26.4 26.8 26.6
Overall balance (commitment basis) excl. grants -9.2 -11.4 -8.3 -10.7 -8.5 -7.4 -6.2 -7.3 -7.0 -4.9 -6.0 -5.7 -4.8 -4.9
Overall balance (commitment basis) incl. grants -8.4 -10.3 -7.5 -9.7 -8.1 -6.9 -5.4 -6.7 -6.4 -4.1 -5.3 -5.1 -4.0 -4.1
Overall balance (commitment basis) incl. grants exl SGR -6.3 -10.3 -6.7 -8.0 -7.1 -5.9 -5.7 -5.8 -5.5 -4.2 -4.7 -4.5 -3.5 -3.6
Primary budget balance -5.4 -7.0 -4.2 -6.2 -4.6 -3.8 -2.9 -3.3 -3.0 -1.6 -2.2 -1.9 -2.6 -2.6
Net domestic borrowing 4.3 0.0 3.1 3.3 4.1 3.0 -0.2 4.0 3.9 -0.2 3.0 3.7 2.8 2.8
Total external support (grant & loans) 4.3 5.6 2.7 5.8 2.8 2.7 3.9 3.2 3.2 3.4 3.2 3.2 3.4 3.4
External Sector
Exports value, goods and services 19.6 21.7 18.9 22.8 22.5 19.2 23.7 23.6 21.7 24.1 24.4 21.5 25.6 21.8
Imports value, goods and services 32.2 33.2 29.7 32.1 31.7 29.1 32.6 32.6 31.5 33.1 32.9 30.8 33.9 30.6
Current external balance, including official transfers -8.1 -7.2 -6.6 -5.4 -5.3 -6.1 -5.2 -5.3 -6.1 -5.6 -5.1 -6.0 -5.0 -5.6
Gross international reserve coverage in months of next
year imports (end of period) 4.9 4.5 4.3 4.5 4.5 4.3 4.7 4.7 4.9 5.1 4.9 5.1 5.0 4.8
Gross international reserve coverage in months of this
year's imports (end of period) 4.6 4.8 4.8 5.1 5.1 5.1 5.3 5.3 5.3 5.4 5.4 5.4 5.5 5.5
Public debt
Nominal central government debt (eop), net of deposits 44.8 48.8 48.7 49.1 47.4 45.3 45.8 49.1 47.3 45.6 49.3 48.7 50.0 49.1
Domestic (gross) 24.4 25.1 27.6 24.9 28.3 26.7 23.4 29.2 27.8 22.6 28.9 28.6 29.1 28.5
Domestic (net) 20.3 21.4 21.4 21.5 22.7 21.2 20.4 24.2 22.9 20.0 24.5 24.2 24.9 24.5
External 24.5 27.4 27.4 27.6 24.7 24.1 25.4 24.9 24.5 25.6 24.9 24.5 25.1 24.7
Memorandum Items:
Nominal GDP (in Ksh Billion) 5,811 6,444 6,586 7,259 7,259 7,435 8,151 8,151 8,284 9,159 9,159 9,259 9,838 10,022
Nominal GDP (in US$ Million) 63,600 64,843 65,143 72,348 71,909 73,655 80,462 79,973 81,284 89,551 89,007 89,981 94,699 96,468
Source: National Treasury
Notes: BPS = Budget Policy Statement; BROP = Budget Review & Outlook Paper; SGR = Standard Gauge Railway
in percentage of GDP, unless otherwise indicated
annual percentage change, unless otherwise indicated
2019/202018/192017/182016/172014/15 2015/16
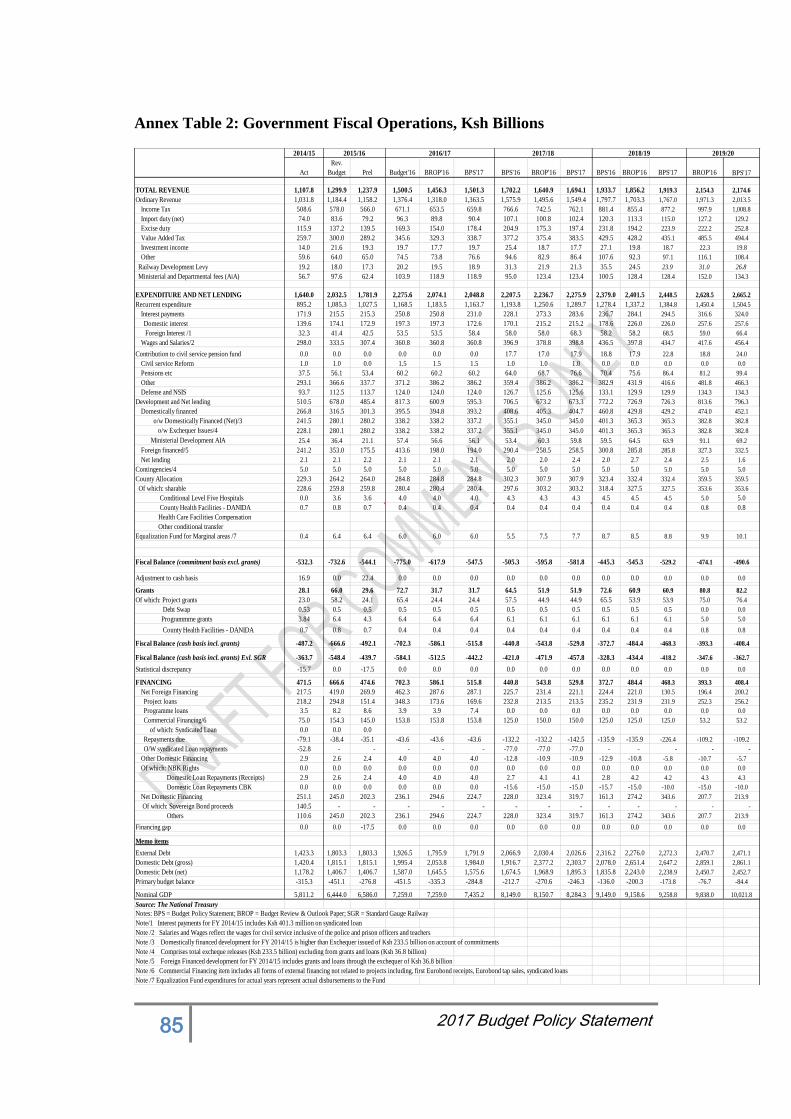
85 2017 Budget Policy Statement
Annex Table 2: Government Fiscal Operations, Ksh Billions
Act
Rev.
Budget Prel Budget'16 BROP'16 BPS'17 BPS'16 BROP'16 BPS'17 BPS'16 BROP'16 BPS'17 BROP'16 BPS'17
TOTAL REVENUE 1,107.8 1,299.9 1,237.9 1,500.5 1,456.3 1,501.3 1,702.2 1,640.9 1,694.1 1,933.7 1,856.2 1,919.3 2,154.3 2,174.6
Ordinary Revenue 1,031.8 1,184.4 1,158.2 1,376.4 1,318.0 1,363.5 1,575.9 1,495.6 1,549.4 1,797.7 1,703.3 1,767.0 1,971.3 2,013.5
Income Tax 508.6 578.0 566.0 671.1 653.5 659.8 766.6 742.5 762.1 881.4 855.4 877.2 997.9 1,008.8
Import duty (net) 74.0 83.6 79.2 96.3 89.8 90.4 107.1 100.8 102.4 120.3 113.3 115.0 127.2 129.2
Excise duty 115.9 137.2 139.5 169.3 154.0 178.4 204.9 175.3 197.4 231.8 194.2 223.9 222.2 252.8
Value Added Tax 259.7 300.0 289.2 345.6 329.3 338.7 377.2 375.4 383.5 429.5 428.2 435.1 485.5 494.4
Investment income 14.0 21.6 19.3 19.7 17.7 19.7 25.4 18.7 17.7 27.1 19.8 18.7 22.3 19.8
Other 59.6 64.0 65.0 74.5 73.8 76.6 94.6 82.9 86.4 107.6 92.3 97.1 116.1 108.4
Railway Development Levy 19.2 18.0 17.3 20.2 19.5 18.9 31.3 21.9 21.3 35.5 24.5 23.9 31.0 26.8
Ministerial and Departmental fees (AiA) 56.7 97.6 62.4 103.9 118.9 118.9 95.0 123.4 123.4 100.5 128.4 128.4 152.0 134.3
EXPENDITURE AND NET LENDING 1,640.0 2,032.5 1,781.9 2,275.6 2,074.1 2,048.8 2,207.5 2,236.7 2,275.9 2,379.0 2,401.5 2,448.5 2,628.5 2,665.2
Recurrent expenditure 895.2 1,085.3 1,027.5 1,168.5 1,183.5 1,163.7 1,193.8 1,250.6 1,289.7 1,278.4 1,337.2 1,384.8 1,450.4 1,504.5
Interest payments 171.9 215.5 215.3 250.8 250.8 231.0 228.1 273.3 283.6 236.7 284.1 294.5 316.6 324.0
Domestic interest 139.6 174.1 172.9 197.3 197.3 172.6 170.1 215.2 215.2 178.6 226.0 226.0 257.6 257.6
Foreign Interest /1 32.3 41.4 42.5 53.5 53.5 58.4 58.0 58.0 68.3 58.2 58.2 68.5 59.0 66.4
Wages and Salaries/2 298.0 333.5 307.4 360.8 360.8 360.8 396.9 378.8 398.8 436.5 397.8 434.7 417.6 456.4
Contribution to civil service pension fund 0.0 0.0 0.0 0.0 0.0 0.0 17.7 17.0 17.9 18.8 17.9 22.8 18.8 24.0
Civil service Reform 1.0 1.0 0.0 1.5 1.5 1.5 1.0 1.0 1.0 0.0 0.0 0.0 0.0 0.0
Pensions etc 37.5 56.1 53.4 60.2 60.2 60.2 64.0 68.7 76.6 70.4 75.6 86.4 81.2 99.4
Other 293.1 366.6 337.7 371.2 386.2 386.2 359.4 386.2 386.2 382.9 431.9 416.6 481.8 466.3
Defense and NSIS 93.7 112.5 113.7 124.0 124.0 124.0 126.7 125.6 125.6 133.1 129.9 129.9 134.3 134.3
Development and Net lending 510.5 678.0 485.4 817.3 600.9 595.3 706.5 673.2 673.3 772.2 726.9 726.3 813.6 796.3
Domestically financed 266.8 316.5 301.3 395.5 394.8 393.2 408.6 405.3 404.7 460.8 429.8 429.2 474.0 452.1
o/w Domestically Financed (Net)/3 241.5 280.1 280.2 338.2 338.2 337.2 355.1 345.0 345.0 401.3 365.3 365.3 382.8 382.8
o/w Exchequer Issues/4 228.1 280.1 280.2 338.2 338.2 337.2 355.1 345.0 345.0 401.3 365.3 365.3 382.8 382.8
Ministerial Development AIA 25.4 36.4 21.1 57.4 56.6 56.1 53.4 60.3 59.8 59.5 64.5 63.9 91.1 69.2
Foreign financed/5 241.2 353.0 175.5 413.6 198.0 194.0 290.4 258.5 258.5 300.8 285.8 285.8 327.3 332.5
Net lending 2.1 2.1 2.2 2.1 2.1 2.1 2.0 2.0 2.4 2.0 2.7 2.4 2.5 1.6
Contingencies/4 5.0 5.0 5.0 5.0 5.0 5.0 5.0 5.0 5.0 5.0 5.0 5.0 5.0 5.0
County Allocation 229.3 264.2 264.0 284.8 284.8 284.8 302.3 307.9 307.9 323.4 332.4 332.4 359.5 359.5
Of which: sharable 228.6 259.8 259.8 280.4 280.4 280.4 297.6 303.2 303.2 318.4 327.5 327.5 353.6 353.6
Conditional Level Five Hospitals 0.0 3.6 3.6 4.0 4.0 4.0 4.3 4.3 4.3 4.5 4.5 4.5 5.0 5.0
County Health Facilities - DANIDA 0.7 0.8 0.7 0.4 0.4 0.4 0.4 0.4 0.4 0.4 0.4 0.4 0.8 0.8
Health Care Facilities Compensation
Other conditional transfer
Equalization Fund for Marginal areas /7 0.4 6.4 6.4 6.0 6.0 6.0 5.5 7.5 7.7 8.7 8.5 8.8 9.9 10.1
Fiscal Balance (commitment basis excl. grants) -532.3 -732.6 -544.1 -775.0 -617.9 -547.5 -505.3 -595.8 -581.8 -445.3 -545.3 -529.2 -474.1 -490.6
Adjustment to cash basis 16.9 0.0 22.4 0.0 0.0 0.0 0.0 0.0 0.0 0.0 0.0 0.0 0.0 0.0
Grants 28.1 66.0 29.6 72.7 31.7 31.7 64.5 51.9 51.9 72.6 60.9 60.9 80.8 82.2
Of which: Project grants 23.0 58.2 24.1 65.4 24.4 24.4 57.5 44.9 44.9 65.5 53.9 53.9 75.0 76.4
Debt Swap 0.53 0.5 0.5 0.5 0.5 0.5 0.5 0.5 0.5 0.5 0.5 0.5 0.0 0.0
Programmme grants 3.84 6.4 4.3 6.4 6.4 6.4 6.1 6.1 6.1 6.1 6.1 6.1 5.0 5.0
County Health Facilities - DANIDA 0.7 0.8 0.7 0.4 0.4 0.4 0.4 0.4 0.4 0.4 0.4 0.4 0.8 0.8
Fiscal Balance (cash basis incl. grants) -487.2 -666.6 -492.1 -702.3 -586.1 -515.8 -440.8 -543.8 -529.8 -372.7 -484.4 -468.3 -393.3 -408.4
Fiscal Balance (cash basis incl. grants) Exl. SGR -363.7 -548.4 -439.7 -584.1 -512.5 -442.2 -421.0 -471.9 -457.8 -328.3 -434.4 -418.2 -347.6 -362.7
Statistical discrepancy -15.7 0.0 -17.5 0.0 0.0 0.0 0.0 0.0 0.0 0.0 0.0 0.0 0.0 0.0
FINANCING 471.5 666.6 474.6 702.3 586.1 515.8 440.8 543.8 529.8 372.7 484.4 468.3 393.3 408.4
Net Foreign Financing 217.5 419.0 269.9 462.3 287.6 287.1 225.7 231.4 221.1 224.4 221.0 130.5 196.4 200.2
Project loans 218.2 294.8 151.4 348.3 173.6 169.6 232.8 213.5 213.5 235.2 231.9 231.9 252.3 256.2
Programme loans 3.5 8.2 8.6 3.9 3.9 7.4 0.0 0.0 0.0 0.0 0.0 0.0 0.0 0.0
Commercial Financing/6 75.0 154.3 145.0 153.8 153.8 153.8 125.0 150.0 150.0 125.0 125.0 125.0 53.2 53.2
of which: Syndicated Loan 0.0 0.0 0.0
Repayments due -79.1 -38.4 -35.1 -43.6 -43.6 -43.6 -132.2 -132.2 -142.5 -135.9 -135.9 -226.4 -109.2 -109.2
O/W syndicated Loan repayments -52.8 - - - - - -77.0 -77.0 -77.0 - - - - -
Other Domestic Financing 2.9 2.6 2.4 4.0 4.0 4.0 -12.8 -10.9 -10.9 -12.9 -10.8 -5.8 -10.7 -5.7
Of which: NBK Rights 0.0 0.0 0.0 0.0 0.0 0.0 0.0 0.0 0.0 0.0 0.0 0.0 0.0 0.0
Domestic Loan Repayments (Receipts) 2.9 2.6 2.4 4.0 4.0 4.0 2.7 4.1 4.1 2.8 4.2 4.2 4.3 4.3
Domestic Loan Repayments CBK 0.0 0.0 0.0 0.0 0.0 0.0 -15.6 -15.0 -15.0 -15.7 -15.0 -10.0 -15.0 -10.0
Net Domestic Financing 251.1 245.0 202.3 236.1 294.6 224.7 228.0 323.4 319.7 161.3 274.2 343.6 207.7 213.9
Of which: Sovereign Bond proceeds 140.5 - - - - - - - - - - - - -
Others 110.6 245.0 202.3 236.1 294.6 224.7 228.0 323.4 319.7 161.3 274.2 343.6 207.7 213.9
Financing gap 0.0 0.0 -17.5 0.0 0.0 0.0 0.0 0.0 0.0 0.0 0.0 0.0 0.0 0.0
Memo items
External Debt 1,423.3 1,803.3 1,803.3 1,926.5 1,795.9 1,791.9 2,066.9 2,030.4 2,026.6 2,316.2 2,276.0 2,272.3 2,470.7 2,471.1
Domestic Debt (gross) 1,420.4 1,815.1 1,815.1 1,995.4 2,053.8 1,984.0 1,916.7 2,377.2 2,303.7 2,078.0 2,651.4 2,647.2 2,859.1 2,861.1
Domestic Debt (net) 1,178.2 1,406.7 1,406.7 1,587.0 1,645.5 1,575.6 1,674.5 1,968.9 1,895.3 1,835.8 2,243.0 2,238.9 2,450.7 2,452.7
Primary budget balance -315.3 -451.1 -276.8 -451.5 -335.3 -284.8 -212.7 -270.6 -246.3 -136.0 -200.3 -173.8 -76.7 -84.4
Nominal GDP 5,811.2 6,444.0 6,586.0 7,259.0 7,259.0 7,435.2 8,149.0 8,150.7 8,284.3 9,149.0 9,158.6 9,258.8 9,838.0 10,021.8
Source: The National Treasury
Notes: BPS = Budget Policy Statement; BROP = Budget Review & Outlook Paper; SGR = Standard Gauge Railway
Note/1 Interest payments for FY 2014/15 includes Ksh 401.3 million on syndicated loan
Note /2 Salaries and Wages reflect the wages for civil service inclusive of the police and prison officers and teachers
Note /3 Domestically financed development for FY 2014/15 is higher than Exchequer issued of Ksh 233.5 billion on account of commitments
Note /4 Comprises total excheque releases (Ksh 233.5 billion) excluding from grants and loans (Ksh 36.8 billion)
Note /5 Foreign Financed development for FY 2014/15 includes grants and loans through the exchequer of Ksh 36.8 billion
Note /6 Commercial Financing item includes all forms of external financing not related to projects including, first Eurobond receipts, Eurobond tap sales, syndicated loans
Note /7 Equalization Fund expenditures for actual years represent actual disbursements to the Fund
2019/202017/182015/16 2016/17 2018/192014/15
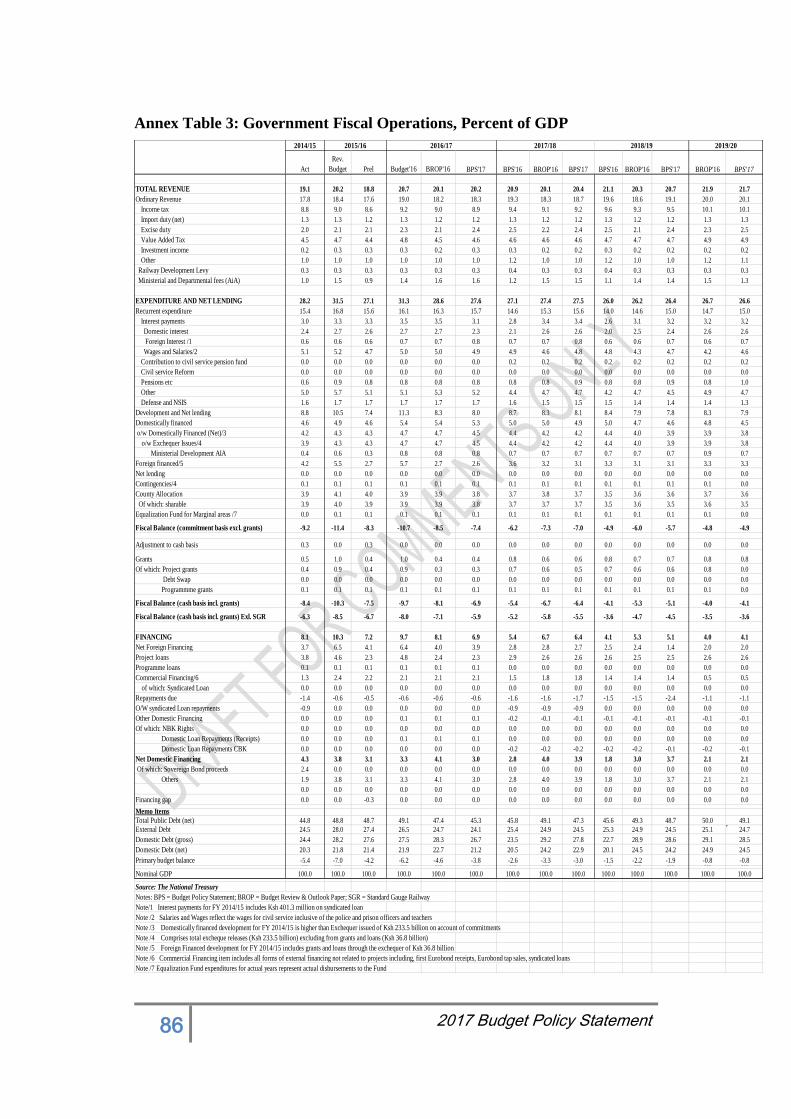
86 2017 Budget Policy Statement
Annex Table 3: Government Fiscal Operations, Percent of GDP
Act
Rev.
Budget Prel Budget'16 BROP'16 BPS'17 BPS'16 BROP'16 BPS'17 BPS'16 BROP'16 BPS'17 BROP'16 BPS'17
TOTAL REVENUE 19.1 20.2 18.8 20.7 20.1 20.2 20.9 20.1 20.4 21.1 20.3 20.7 21.9 21.7
Ordinary Revenue 17.8 18.4 17.6 19.0 18.2 18.3 19.3 18.3 18.7 19.6 18.6 19.1 20.0 20.1
Income tax 8.8 9.0 8.6 9.2 9.0 8.9 9.4 9.1 9.2 9.6 9.3 9.5 10.1 10.1
Import duty (net) 1.3 1.3 1.2 1.3 1.2 1.2 1.3 1.2 1.2 1.3 1.2 1.2 1.3 1.3
Excise duty 2.0 2.1 2.1 2.3 2.1 2.4 2.5 2.2 2.4 2.5 2.1 2.4 2.3 2.5
Value Added Tax 4.5 4.7 4.4 4.8 4.5 4.6 4.6 4.6 4.6 4.7 4.7 4.7 4.9 4.9
Investment income 0.2 0.3 0.3 0.3 0.2 0.3 0.3 0.2 0.2 0.3 0.2 0.2 0.2 0.2
Other 1.0 1.0 1.0 1.0 1.0 1.0 1.2 1.0 1.0 1.2 1.0 1.0 1.2 1.1
Railway Development Levy 0.3 0.3 0.3 0.3 0.3 0.3 0.4 0.3 0.3 0.4 0.3 0.3 0.3 0.3
Ministerial and Departmental fees (AiA) 1.0 1.5 0.9 1.4 1.6 1.6 1.2 1.5 1.5 1.1 1.4 1.4 1.5 1.3
EXPENDITURE AND NET LENDING 28.2 31.5 27.1 31.3 28.6 27.6 27.1 27.4 27.5 26.0 26.2 26.4 26.7 26.6
Recurrent expenditure 15.4 16.8 15.6 16.1 16.3 15.7 14.6 15.3 15.6 14.0 14.6 15.0 14.7 15.0
Interest payments 3.0 3.3 3.3 3.5 3.5 3.1 2.8 3.4 3.4 2.6 3.1 3.2 3.2 3.2
Domestic interest 2.4 2.7 2.6 2.7 2.7 2.3 2.1 2.6 2.6 2.0 2.5 2.4 2.6 2.6
Foreign Interest /1 0.6 0.6 0.6 0.7 0.7 0.8 0.7 0.7 0.8 0.6 0.6 0.7 0.6 0.7
Wages and Salaries/2 5.1 5.2 4.7 5.0 5.0 4.9 4.9 4.6 4.8 4.8 4.3 4.7 4.2 4.6
Contribution to civil service pension fund 0.0 0.0 0.0 0.0 0.0 0.0 0.2 0.2 0.2 0.2 0.2 0.2 0.2 0.2
Civil service Reform 0.0 0.0 0.0 0.0 0.0 0.0 0.0 0.0 0.0 0.0 0.0 0.0 0.0 0.0
Pensions etc 0.6 0.9 0.8 0.8 0.8 0.8 0.8 0.8 0.9 0.8 0.8 0.9 0.8 1.0
Other 5.0 5.7 5.1 5.1 5.3 5.2 4.4 4.7 4.7 4.2 4.7 4.5 4.9 4.7
Defense and NSIS 1.6 1.7 1.7 1.7 1.7 1.7 1.6 1.5 1.5 1.5 1.4 1.4 1.4 1.3
Development and Net lending 8.8 10.5 7.4 11.3 8.3 8.0 8.7 8.3 8.1 8.4 7.9 7.8 8.3 7.9
Domestically financed 4.6 4.9 4.6 5.4 5.4 5.3 5.0 5.0 4.9 5.0 4.7 4.6 4.8 4.5
o/w Domestically Financed (Net)/3 4.2 4.3 4.3 4.7 4.7 4.5 4.4 4.2 4.2 4.4 4.0 3.9 3.9 3.8
o/w Exchequer Issues/4 3.9 4.3 4.3 4.7 4.7 4.5 4.4 4.2 4.2 4.4 4.0 3.9 3.9 3.8
Ministerial Development AIA 0.4 0.6 0.3 0.8 0.8 0.8 0.7 0.7 0.7 0.7 0.7 0.7 0.9 0.7
Foreign financed/5 4.2 5.5 2.7 5.7 2.7 2.6 3.6 3.2 3.1 3.3 3.1 3.1 3.3 3.3
Net lending 0.0 0.0 0.0 0.0 0.0 0.0 0.0 0.0 0.0 0.0 0.0 0.0 0.0 0.0
Contingencies/4 0.1 0.1 0.1 0.1 0.1 0.1 0.1 0.1 0.1 0.1 0.1 0.1 0.1 0.0
County Allocation 3.9 4.1 4.0 3.9 3.9 3.8 3.7 3.8 3.7 3.5 3.6 3.6 3.7 3.6
Of which: sharable 3.9 4.0 3.9 3.9 3.9 3.8 3.7 3.7 3.7 3.5 3.6 3.5 3.6 3.5
Equalization Fund for Marginal areas /7 0.0 0.1 0.1 0.1 0.1 0.1 0.1 0.1 0.1 0.1 0.1 0.1 0.1 0.0
Fiscal Balance (commitment basis excl. grants) -9.2 -11.4 -8.3 -10.7 -8.5 -7.4 -6.2 -7.3 -7.0 -4.9 -6.0 -5.7 -4.8 -4.9
Adjustment to cash basis 0.3 0.0 0.3 0.0 0.0 0.0 0.0 0.0 0.0 0.0 0.0 0.0 0.0 0.0
Grants 0.5 1.0 0.4 1.0 0.4 0.4 0.8 0.6 0.6 0.8 0.7 0.7 0.8 0.8
Of which: Project grants 0.4 0.9 0.4 0.9 0.3 0.3 0.7 0.6 0.5 0.7 0.6 0.6 0.8 0.0
Debt Swap 0.0 0.0 0.0 0.0 0.0 0.0 0.0 0.0 0.0 0.0 0.0 0.0 0.0 0.0
Programmme grants 0.1 0.1 0.1 0.1 0.1 0.1 0.1 0.1 0.1 0.1 0.1 0.1 0.1 0.0
Fiscal Balance (cash basis incl. grants) -8.4 -10.3 -7.5 -9.7 -8.1 -6.9 -5.4 -6.7 -6.4 -4.1 -5.3 -5.1 -4.0 -4.1
Fiscal Balance (cash basis incl. grants) Exl. SGR -6.3 -8.5 -6.7 -8.0 -7.1 -5.9 -5.2 -5.8 -5.5 -3.6 -4.7 -4.5 -3.5 -3.6
FINANCING 8.1 10.3 7.2 9.7 8.1 6.9 5.4 6.7 6.4 4.1 5.3 5.1 4.0 4.1
Net Foreign Financing 3.7 6.5 4.1 6.4 4.0 3.9 2.8 2.8 2.7 2.5 2.4 1.4 2.0 2.0
Project loans 3.8 4.6 2.3 4.8 2.4 2.3 2.9 2.6 2.6 2.6 2.5 2.5 2.6 2.6
Programme loans 0.1 0.1 0.1 0.1 0.1 0.1 0.0 0.0 0.0 0.0 0.0 0.0 0.0 0.0
Commercial Financing/6 1.3 2.4 2.2 2.1 2.1 2.1 1.5 1.8 1.8 1.4 1.4 1.4 0.5 0.5
of which: Syndicated Loan 0.0 0.0 0.0 0.0 0.0 0.0 0.0 0.0 0.0 0.0 0.0 0.0 0.0 0.0
Repayments due -1.4 -0.6 -0.5 -0.6 -0.6 -0.6 -1.6 -1.6 -1.7 -1.5 -1.5 -2.4 -1.1 -1.1
O/W syndicated Loan repayments -0.9 0.0 0.0 0.0 0.0 0.0 -0.9 -0.9 -0.9 0.0 0.0 0.0 0.0 0.0
Other Domestic Financing 0.0 0.0 0.0 0.1 0.1 0.1 -0.2 -0.1 -0.1 -0.1 -0.1 -0.1 -0.1 -0.1
Of which: NBK Rights 0.0 0.0 0.0 0.0 0.0 0.0 0.0 0.0 0.0 0.0 0.0 0.0 0.0 0.0
Domestic Loan Repayments (Receipts) 0.0 0.0 0.0 0.1 0.1 0.1 0.0 0.0 0.0 0.0 0.0 0.0 0.0 0.0
Domestic Loan Repayments CBK 0.0 0.0 0.0 0.0 0.0 0.0 -0.2 -0.2 -0.2 -0.2 -0.2 -0.1 -0.2 -0.1
Net Domestic Financing 4.3 3.8 3.1 3.3 4.1 3.0 2.8 4.0 3.9 1.8 3.0 3.7 2.1 2.1
Of which: Sovereign Bond proceeds 2.4 0.0 0.0 0.0 0.0 0.0 0.0 0.0 0.0 0.0 0.0 0.0 0.0 0.0
Others 1.9 3.8 3.1 3.3 4.1 3.0 2.8 4.0 3.9 1.8 3.0 3.7 2.1 2.1
0.0 0.0 0.0 0.0 0.0 0.0 0.0 0.0 0.0 0.0 0.0 0.0 0.0 0.0
Financing gap 0.0 0.0 -0.3 0.0 0.0 0.0 0.0 0.0 0.0 0.0 0.0 0.0 0.0 0.0
Memo Items
Total Public Debt (net) 44.8 48.8 48.7 49.1 47.4 45.3 45.8 49.1 47.3 45.6 49.3 48.7 50.0 49.1
External Debt 24.5 28.0 27.4 26.5 24.7 24.1 25.4 24.9 24.5 25.3 24.9 24.5 25.1 24.7
Domestic Debt (gross) 24.4 28.2 27.6 27.5 28.3 26.7 23.5 29.2 27.8 22.7 28.9 28.6 29.1 28.5
Domestic Debt (net) 20.3 21.8 21.4 21.9 22.7 21.2 20.5 24.2 22.9 20.1 24.5 24.2 24.9 24.5
Primary budget balance -5.4 -7.0 -4.2 -6.2 -4.6 -3.8 -2.6 -3.3 -3.0 -1.5 -2.2 -1.9 -0.8 -0.80.0 0.0 0.0 0.0 0.0 0.0 0.0 0.0 0.0 0.0 0.0 0.0 0.0 0.0
Nominal GDP 100.0 100.0 100.0 100.0 100.0 100.0 100.0 100.0 100.0 100.0 100.0 100.0 100.0 100.0
Source: The National Treasury
Notes: BPS = Budget Policy Statement; BROP = Budget Review & Outlook Paper; SGR = Standard Gauge Railway
Note/1 Interest payments for FY 2014/15 includes Ksh 401.3 million on syndicated loan
Note /2 Salaries and Wages reflect the wages for civil service inclusive of the police and prison officers and teachers
Note /3 Domestically financed development for FY 2014/15 is higher than Exchequer issued of Ksh 233.5 billion on account of commitments
Note /4 Comprises total excheque releases (Ksh 233.5 billion) excluding from grants and loans (Ksh 36.8 billion)
Note /5 Foreign Financed development for FY 2014/15 includes grants and loans through the exchequer of Ksh 36.8 billion
Note /6 Commercial Financing item includes all forms of external financing not related to projects including, first Eurobond receipts, Eurobond tap sales, syndicated loans
Note /7 Equalization Fund expenditures for actual years represent actual disbursements to the Fund
2019/202016/17 2018/192017/182015/162014/15
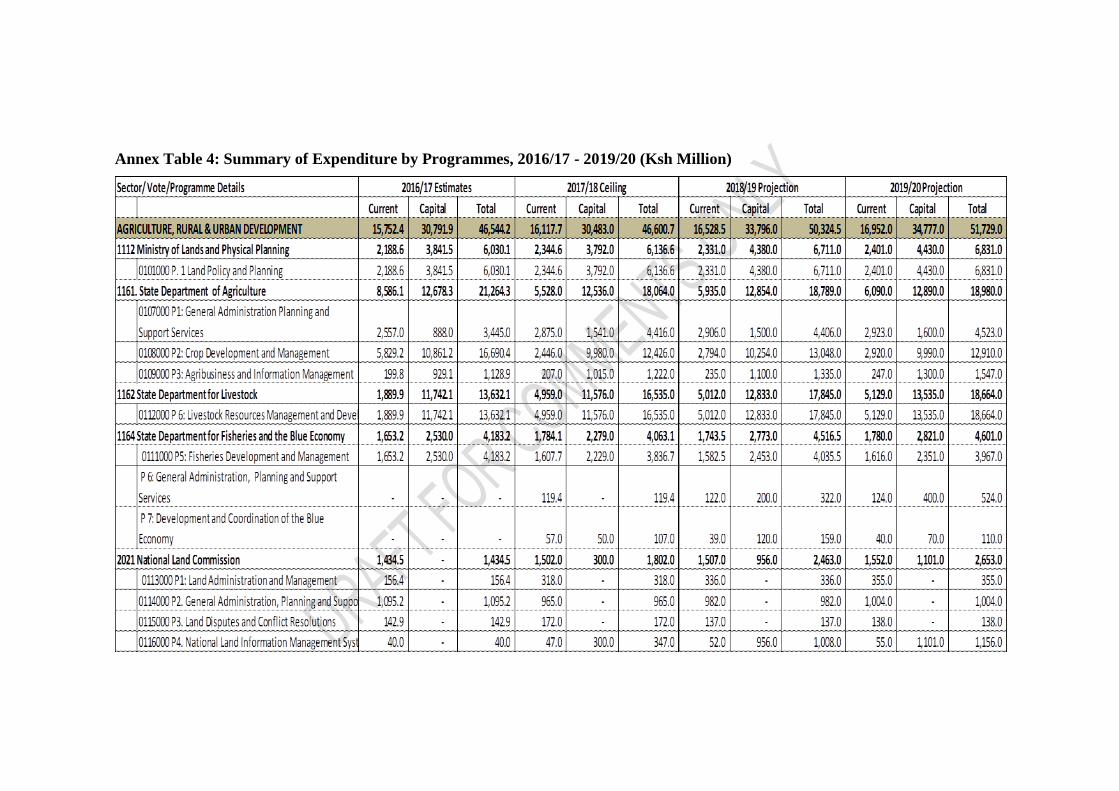
Annex Table 4: Summary of Expenditure by Programmes, 2016/17 - 2019/20 (Ksh Million)
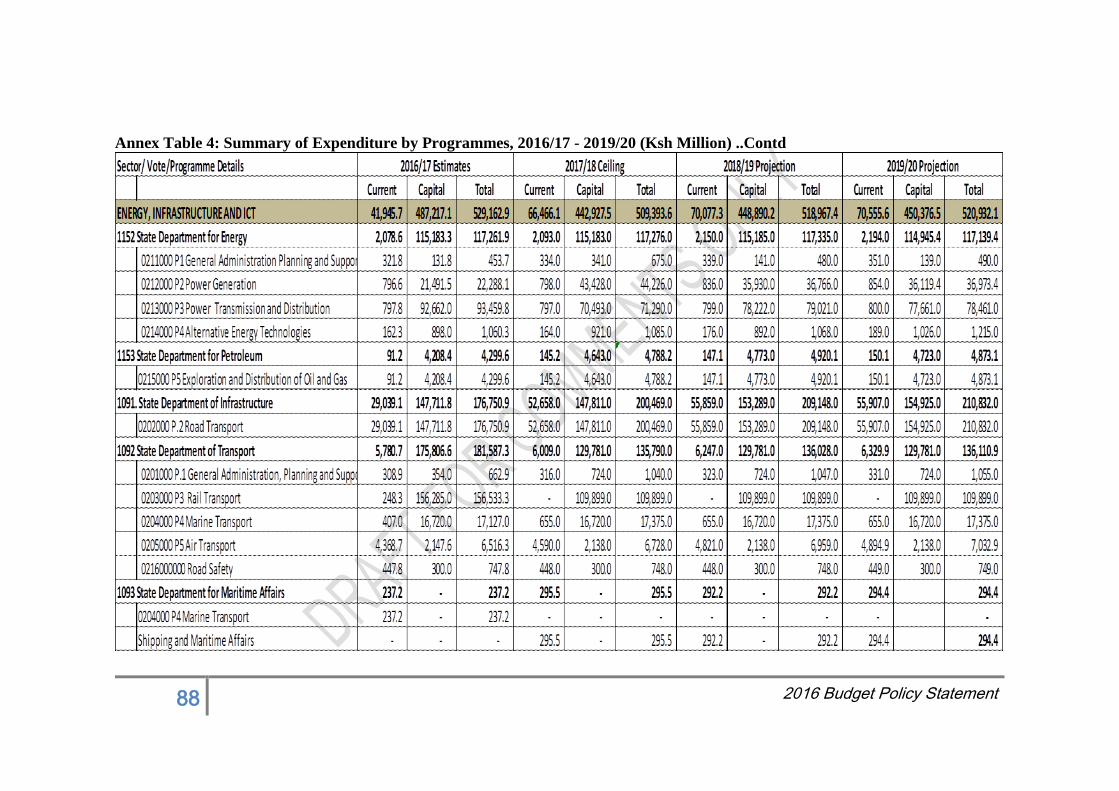
88 2016 Budget Policy Statement
Annex Table 4: Summary of Expenditure by Programmes, 2016/17 - 2019/20 (Ksh Million) ..Contd
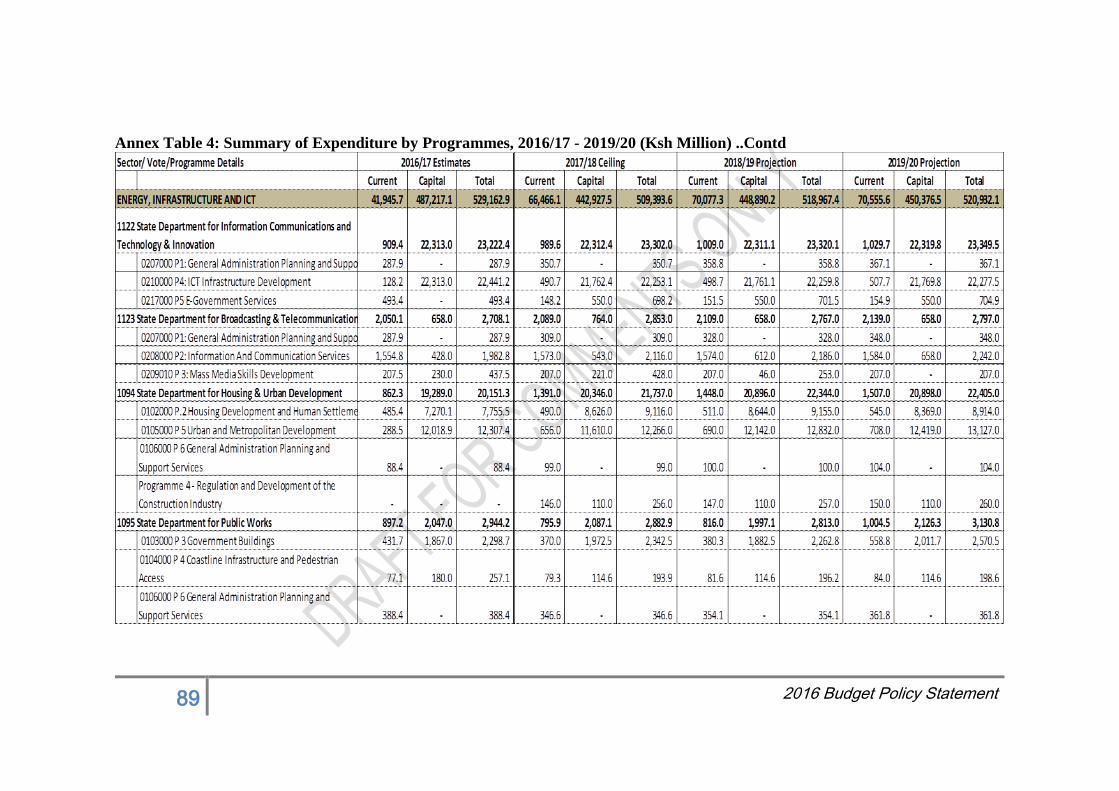
89 2016 Budget Policy Statement
Annex Table 4: Summary of Expenditure by Programmes, 2016/17 - 2019/20 (Ksh Million) ..Contd
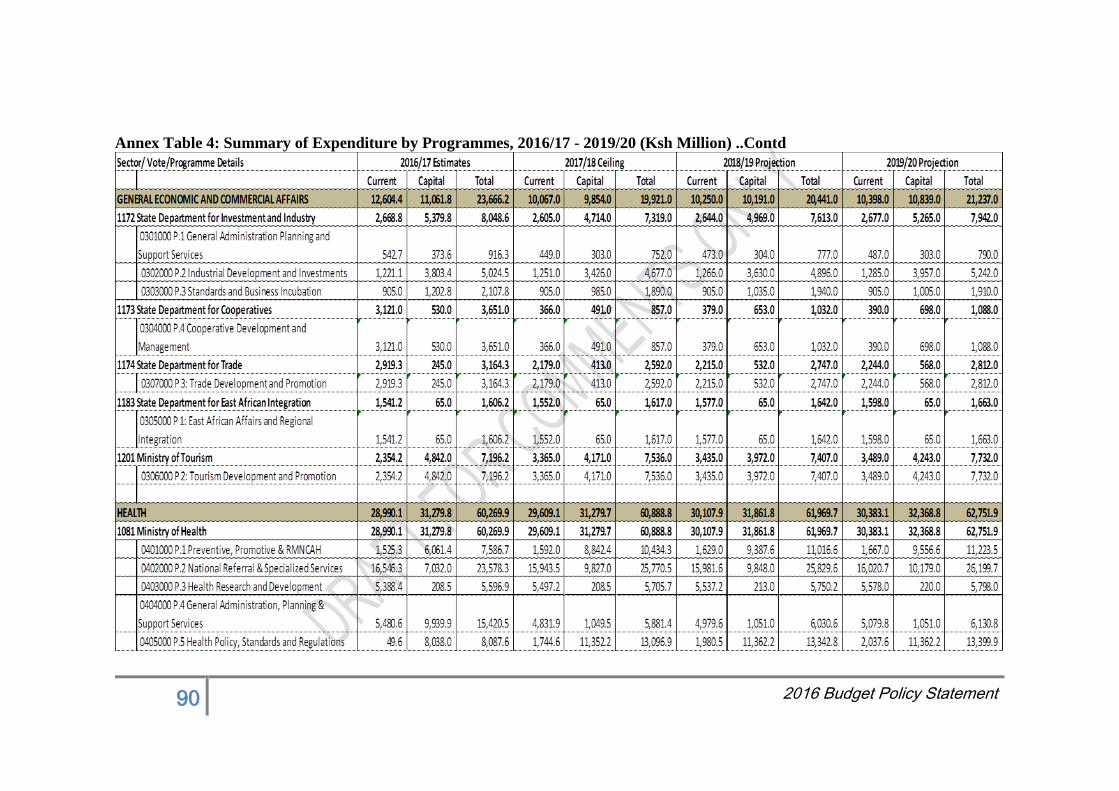
90 2016 Budget Policy Statement
Annex Table 4: Summary of Expenditure by Programmes, 2016/17 - 2019/20 (Ksh Million) ..Contd
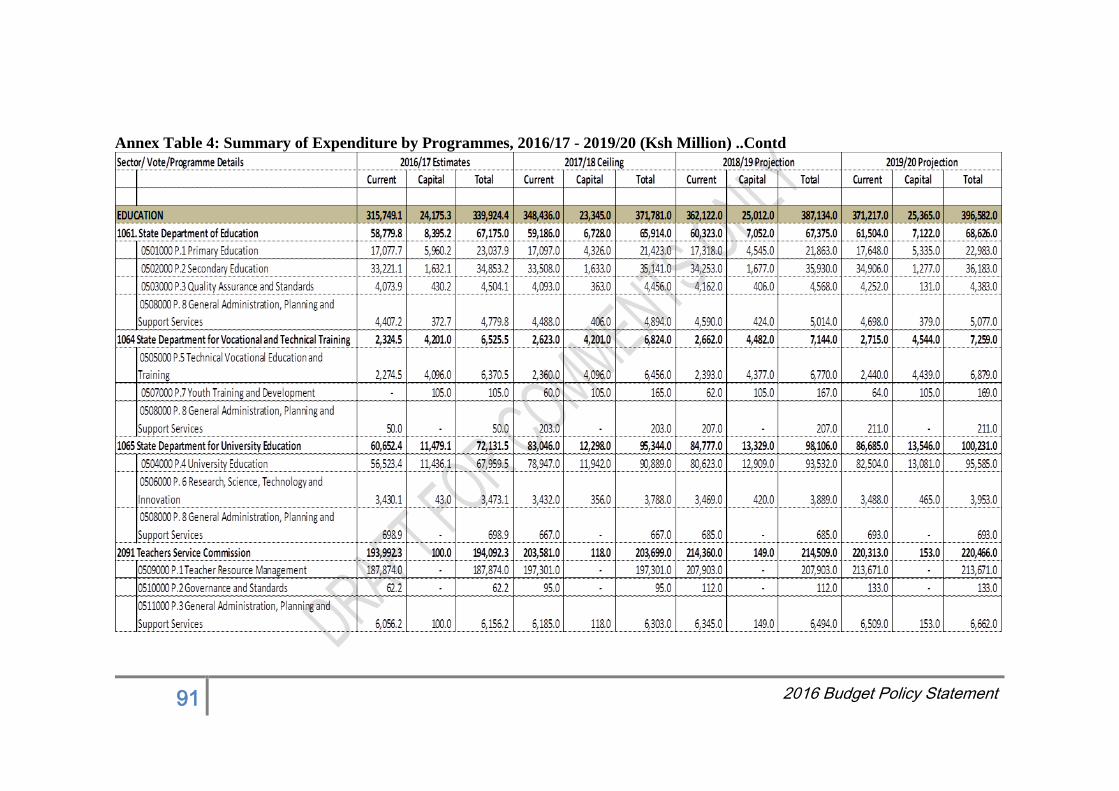
91 2016 Budget Policy Statement
Annex Table 4: Summary of Expenditure by Programmes, 2016/17 - 2019/20 (Ksh Million) ..Contd
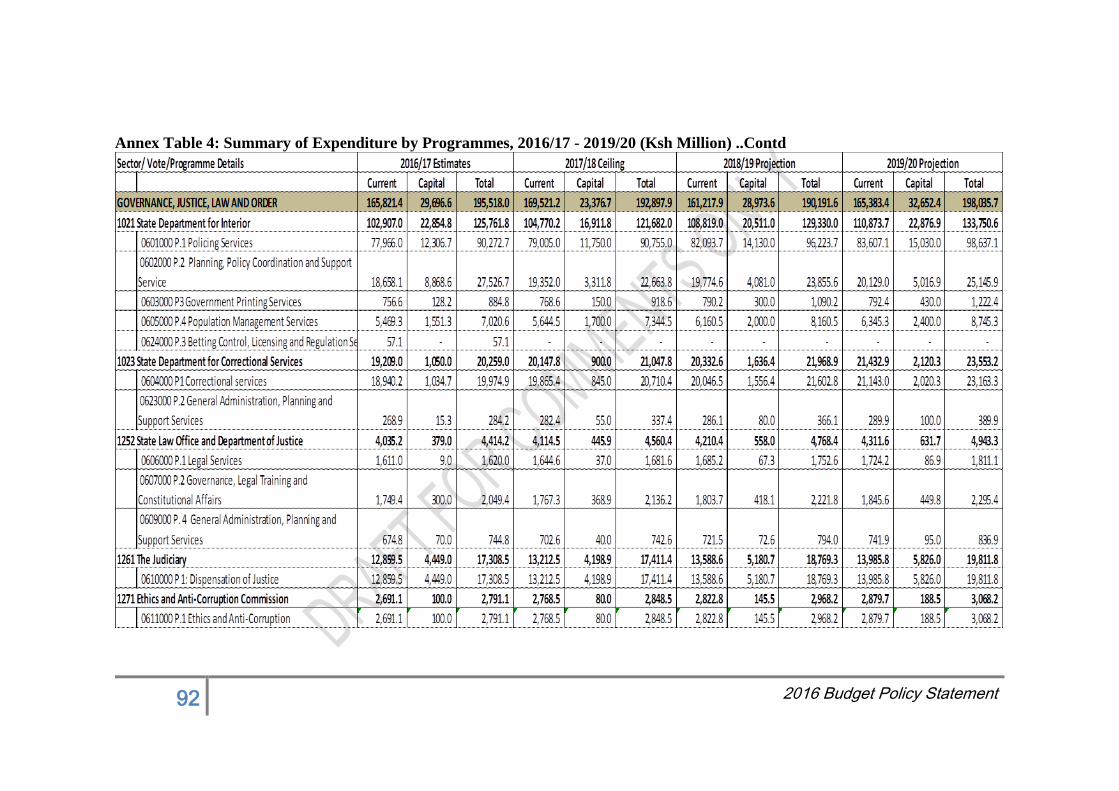
92 2016 Budget Policy Statement
Annex Table 4: Summary of Expenditure by Programmes, 2016/17 - 2019/20 (Ksh Million) ..Contd

93 2016 Budget Policy Statement
Annex Table 4: Summary of Expenditure by Programmes, 2016/17 - 2019/20 (Ksh Million) ..Contd
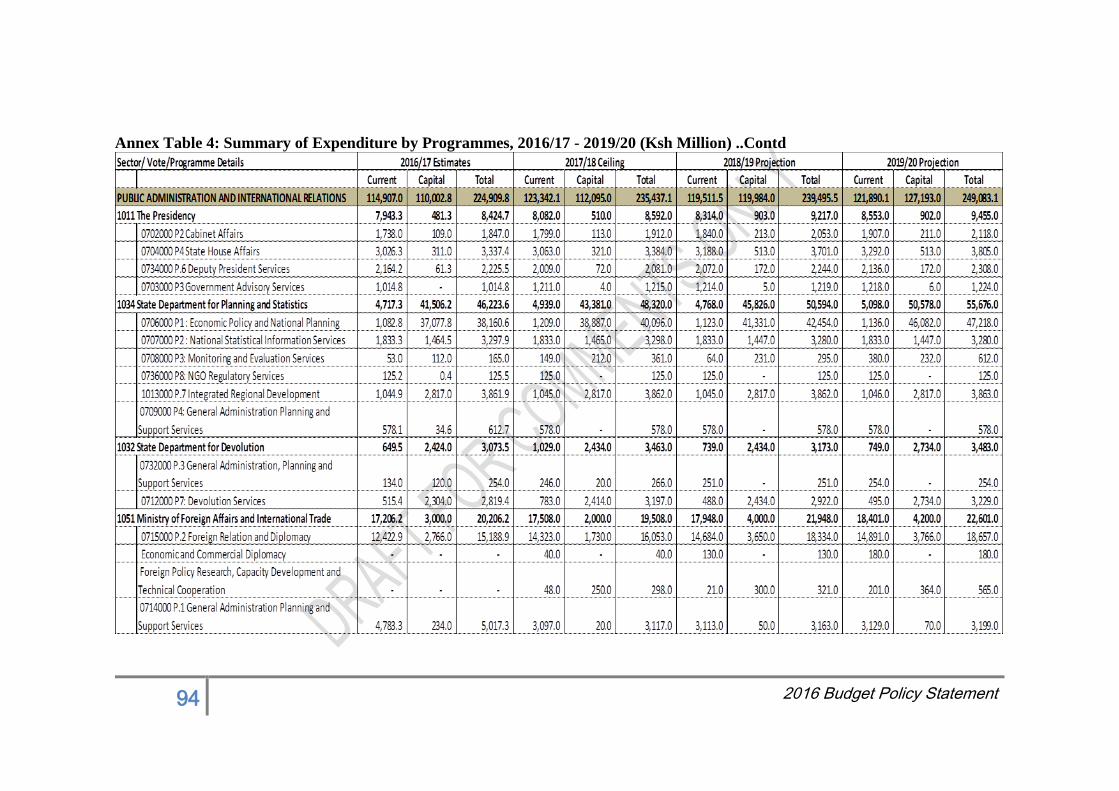
94 2016 Budget Policy Statement
Annex Table 4: Summary of Expenditure by Programmes, 2016/17 - 2019/20 (Ksh Million) ..Contd
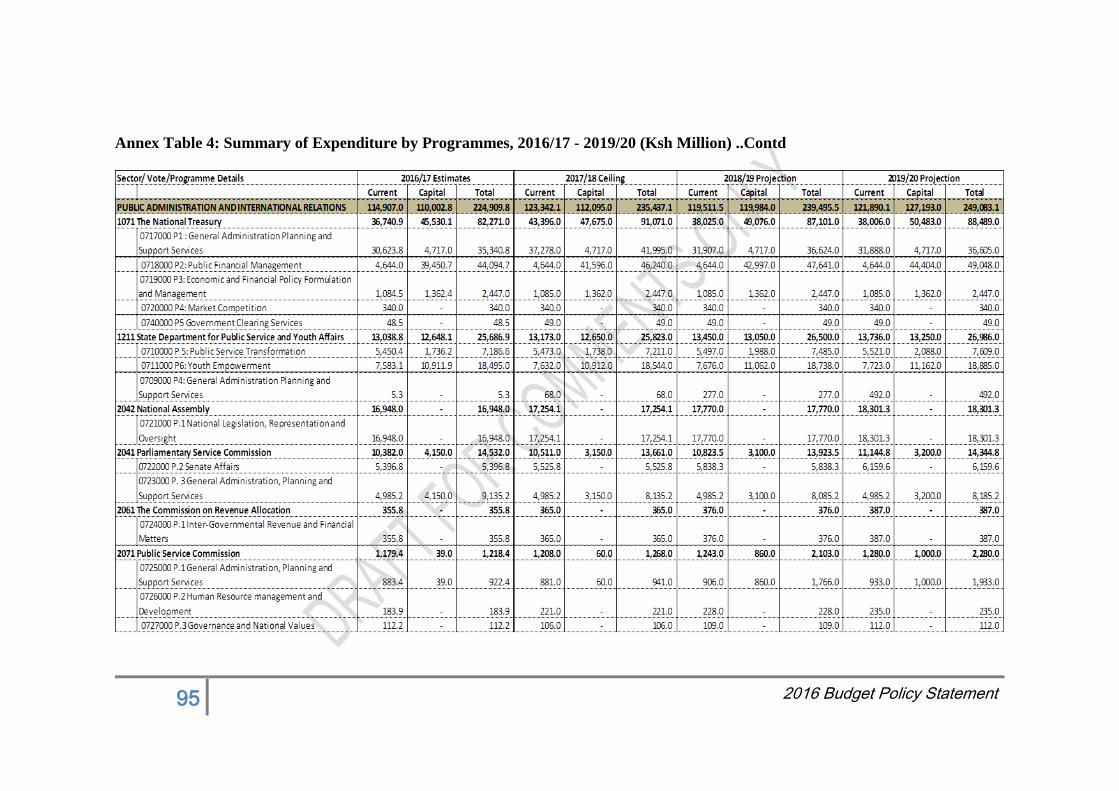
95 2016 Budget Policy Statement
Annex Table 4: Summary of Expenditure by Programmes, 2016/17 - 2019/20 (Ksh Million) ..Contd
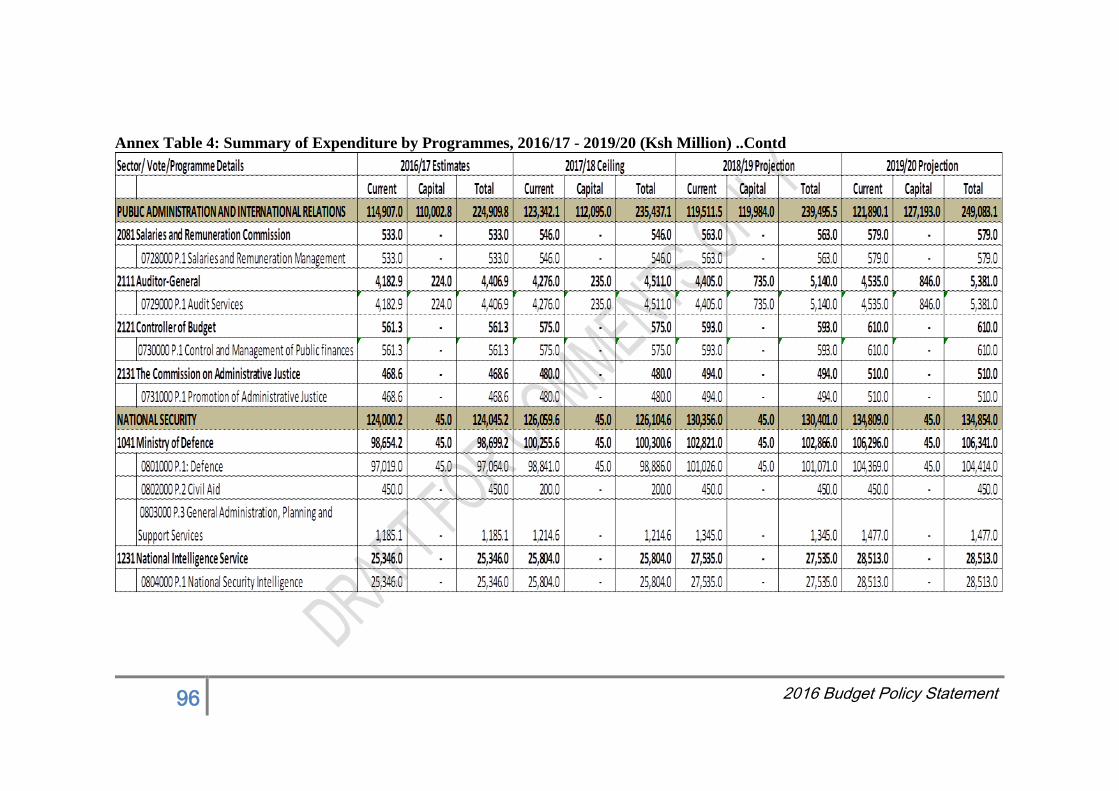
96 2016 Budget Policy Statement
Annex Table 4: Summary of Expenditure by Programmes, 2016/17 - 2019/20 (Ksh Million) ..Contd
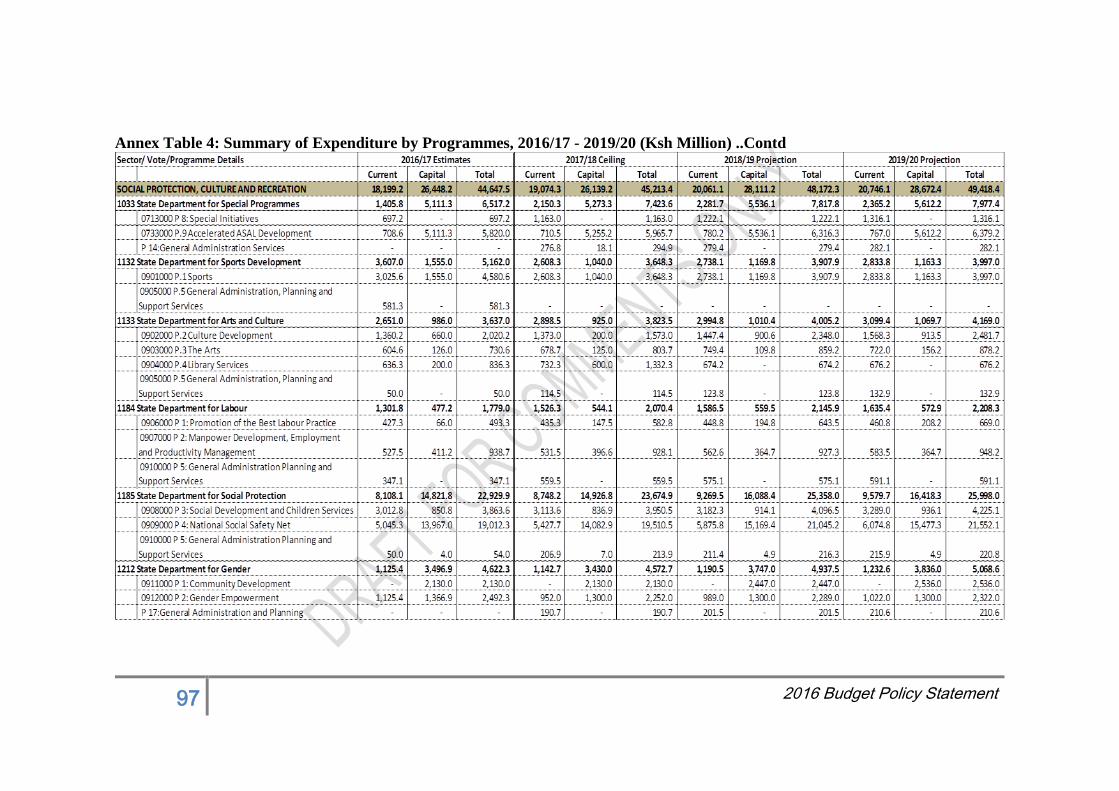
97 2016 Budget Policy Statement
Annex Table 4: Summary of Expenditure by Programmes, 2016/17 - 2019/20 (Ksh Million) ..Contd
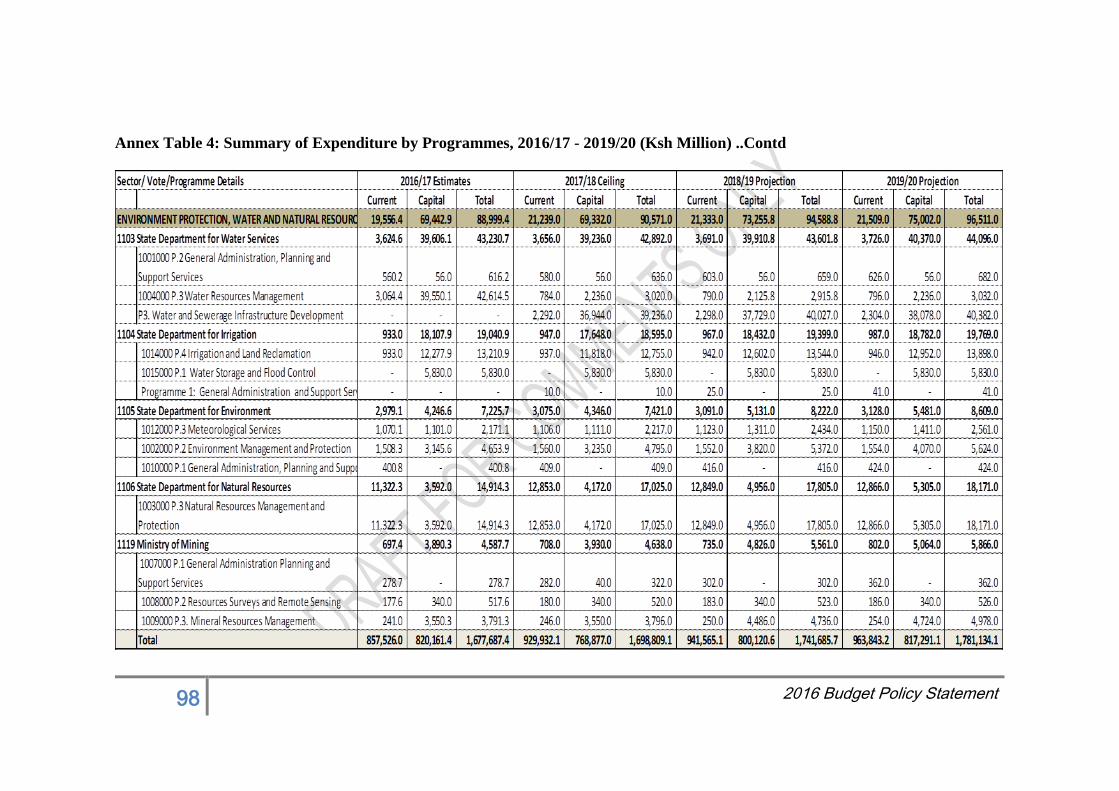
98 2016 Budget Policy Statement
Annex Table 4: Summary of Expenditure by Programmes, 2016/17 - 2019/20 (Ksh Million) ..Contd

99 2016 Budget Policy Statement
Annex Table 5: Public Private Partnership (PPP) Projects – Kenya, government’s guarantee and termination terms No. Project Name Project
Description
Project
Value
($ Mn)
Status Type/Value/ State
Guarantee
Amount for Termination
Payment (default by GoK)
Obligation for
fixed Capacity
Payments(Ann
ual)
Call on
Guarant
ee (Y/N)
1. Africa
Geothermal
International 140
MW
25-year Power
Purchase
Agreement on a
Build, Own, and
Operate (BOO)
basis at Longonot
geothermal power
project adjacent to
Olkaria, Kenya.
760 Financial
Close: 3rd
April 2014
Status:
Under
construction
Letter of Support is
being finalized
1. Total Project Cost
depreciated at 5% per
annum.
2. Expenses incurred by the
Seller as a result of
termination.
3. Net Present Value of 5
Years profits at 10%
discount rate.
US$ 77.3Mn NO
2. Lake Turkana
Wind Power -
300MW
The wind turbine
farm is being
developed on BOO
basis in
Loyangalani,
Marsabit West
County, on a 20-
year PPA with
Kenya Power.
847 Financial
Close: 24th
March 2014
Status:
Under
construction
Letter of Support
covering Political
Risks issued on 28th
February 2013
Indemnity
Agreement
LC to be replaced
with Escrow Account
1. Total Project Cost
depreciated at 5% per
annum.
2. Expenses incurred by the
Seller as a result of
termination.
3. Net Present Value of 5
Years profits at 10%
discount rate.
Deemed
Generated
Energy
Payments
Euros 110.4Mn
NO

100 2016 Budget Policy Statement
No. Project Name Project
Description
Project
Value
($ Mn)
Status Type/Value/ State
Guarantee
Amount for Termination
Payment (default by GoK)
Obligation for
fixed Capacity
Payments(Ann
ual)
Call on
Guarant
ee (Y/N)
3. Gulf Power -
80.32 MW
The Heavy Fuel
Oil (HFO) power
plant is being
developed on a
BOO basis, in the
Athi River region,
on a 20-year PPA
with KPLC.
108 Financial
Close: 18th
Nov. 2013
Status:
Under
construction
Letter of Support
covering Political
Risks issued on 2nd
July 2012
Indemnity Agreement
covering PRG
payments was signed
on 14th March 2013.
PRG Amount US$
35Mn and Euros 7Mn
1. Total Project Cost
depreciated at 5% per
annum.
2. Expenses incurred by the
Seller as a result of
termination.
3. Net Present Value of 5
Years profits at 10%
discount rate.
Euros 16.3 Mn NO
4. Triumph Power
- 82MW
The Heavy Fuel
Oil (HFO) power
plant is being
developed on a
BOO basis, at
Kitengela near the
Athi River area of
Mavoko, on a 20-
year PPA with
KPLC.
156.5 Financial
Close: 7th
August 2013
date
Status:
Under
construction
Letter of Support
covering Political
Risks issued on 2nd
July 2012
Indemnity Agreement
covering PRG
payments was signed
on 5th December
2012. PRG Amount
US$ 45Mn
1. Total Project Cost
depreciated at 5% per
annum.
2. Expenses incurred by the
Seller as a result of
termination.
3. Net Present Value of 5
Years profits at 10%
discount rate.
US$ 24.5Mn NO

101 2016 Budget Policy Statement
No. Project Name Project
Description
Project
Value
($ Mn)
Status Type/Value/ State
Guarantee
Amount for Termination
Payment (default by GoK)
Obligation for
fixed Capacity
Payments(Ann
ual)
Call on
Guarant
ee (Y/N)
5. Thika Power -
87MW
The Heavy Fuel
Oil (HFO) power
plant is being
developed on a
BOO basis, in
Thika, on a 20-year
PPA with KPLC.
146 Financial
Close: 11th
October
2012
Status:
Operational
from Aug
2013
Letter of Support
covering Political
Risks issued on 2nd
July 2012
Indemnity Agreement
covering PRG
payments was signed
on 28th August 2014.
PRG Amount US$
35Mn and Euros
7.7Mn
1. Total Project Cost
depreciated at 5% per
annum.
2. Expenses incurred by the
Seller as a result of
termination.
3. Net Present Value of 5
Years profits at 10%
discount rate.
Euros 17.1Mn NO
6. Kinangop Power
– 60.8MW
The wind power
plant is being
developed on a
BOO basis in
South Kinangop,
Nyandarua County
on a 20-year PPA
with KPLC.
150 Financial
Close: 31st
December
2012
Status:
Under
construction
Letter of Support
covering Political
Risks issued on 26th
July, 2013
1. Total Project Cost
depreciated at 5% per
annum.
2. Expenses incurred by the
Seller as a result of
termination.
3. Net Present Value of 5
Years profits at 10%
discount rate.
Deemed Energy
Payment
US$ 26.8Mn
NO*
7. Orpower
150MW**
Olkaria III
Geothermal
power plant(1st
plant 48MW,2nd
Plant 36MW,3rd
plant 16MW and
4th Plant 29MW)
Description:
20 year - BOO
558*** Financial
Close: Jan,
1999
Status:
Operational
Letter of Support
covering Political
Risks issued on 16th
April 2015
Indemnity Agreement
LC covering PRG
payments of Amount
US$ 31Mn
1. Total Project Cost
depreciated at 5% per
annum.
2. Expenses incurred by the
Seller as a result of
termination.
3. Losses incurred by the seller
US$70.98 Mn NO
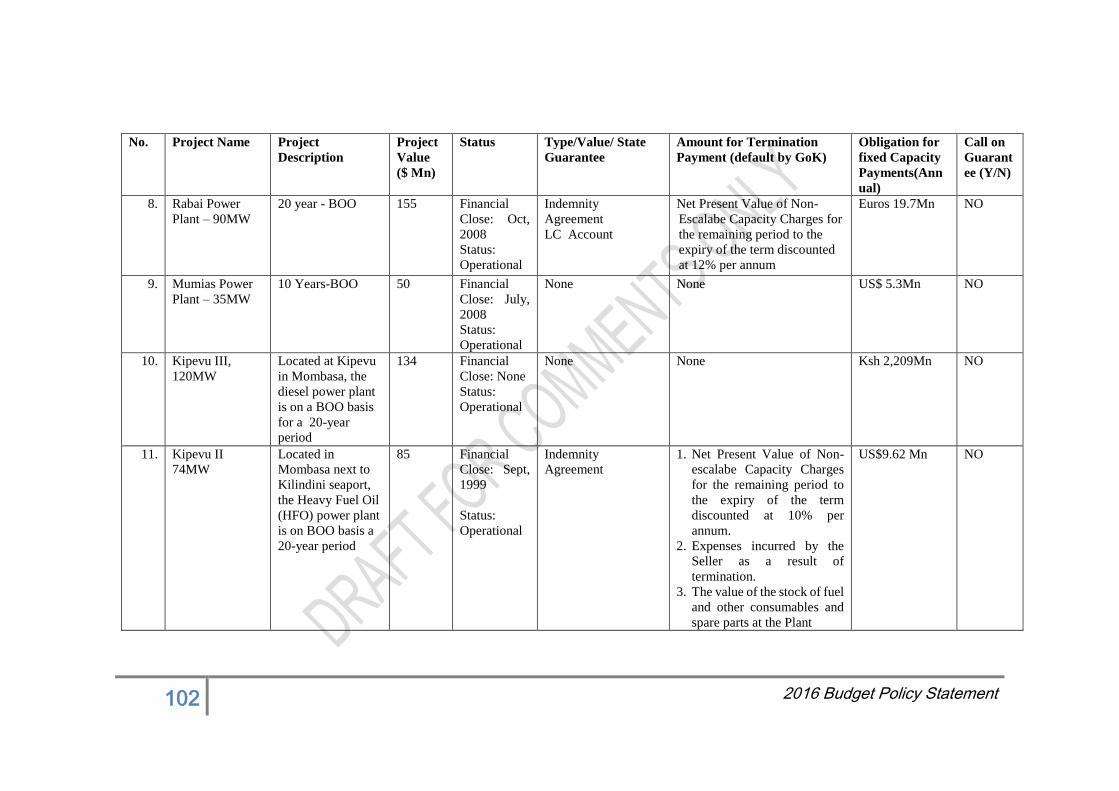
102 2016 Budget Policy Statement
No. Project Name Project
Description
Project
Value
($ Mn)
Status Type/Value/ State
Guarantee
Amount for Termination
Payment (default by GoK)
Obligation for
fixed Capacity
Payments(Ann
ual)
Call on
Guarant
ee (Y/N)
8. Rabai Power
Plant – 90MW
20 year - BOO 155 Financial
Close: Oct,
2008
Status:
Operational
Indemnity
Agreement
LC Account
Net Present Value of Non-
Escalabe Capacity Charges for
the remaining period to the
expiry of the term discounted
at 12% per annum
Euros 19.7Mn NO
9. Mumias Power
Plant – 35MW
10 Years-BOO 50 Financial
Close: July,
2008
Status:
Operational
None None US$ 5.3Mn NO
10. Kipevu III,
120MW
Located at Kipevu
in Mombasa, the
diesel power plant
is on a BOO basis
for a 20-year
period
134 Financial
Close: None
Status:
Operational
None None Ksh 2,209Mn NO
11. Kipevu II
74MW
Located in
Mombasa next to
Kilindini seaport,
the Heavy Fuel Oil
(HFO) power plant
is on BOO basis a
20-year period
85 Financial
Close: Sept,
1999
Status:
Operational
Indemnity
Agreement
1. Net Present Value of Non-
escalabe Capacity Charges
for the remaining period to
the expiry of the term
discounted at 10% per
annum.
2. Expenses incurred by the
Seller as a result of
termination.
3. The value of the stock of fuel
and other consumables and
spare parts at the Plant
US$9.62 Mn NO
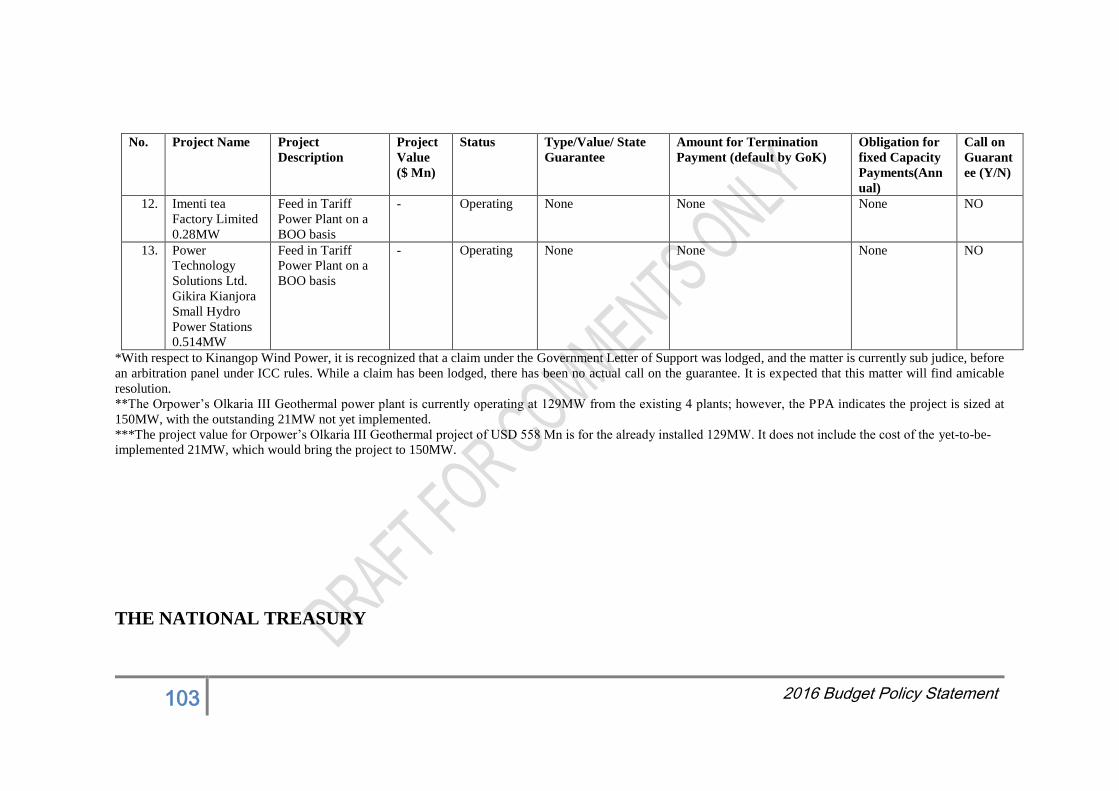
103 2016 Budget Policy Statement
No. Project Name Project
Description
Project
Value
($ Mn)
Status Type/Value/ State
Guarantee
Amount for Termination
Payment (default by GoK)
Obligation for
fixed Capacity
Payments(Ann
ual)
Call on
Guarant
ee (Y/N)
12. Imenti tea
Factory Limited
0.28MW
Feed in Tariff
Power Plant on a
BOO basis
- Operating None None None NO
13. Power
Technology
Solutions Ltd.
Gikira Kianjora
Small Hydro
Power Stations
0.514MW
Feed in Tariff
Power Plant on a
BOO basis
- Operating None None None NO
*With respect to Kinangop Wind Power, it is recognized that a claim under the Government Letter of Support was lodged, and the matter is currently sub judice, before
an arbitration panel under ICC rules. While a claim has been lodged, there has been no actual call on the guarantee. It is expected that this matter will find amicable
resolution.
**The Orpower’s Olkaria III Geothermal power plant is currently operating at 129MW from the existing 4 plants; however, the PPA indicates the project is sized at
150MW, with the outstanding 21MW not yet implemented.
***The project value for Orpower’s Olkaria III Geothermal project of USD 558 Mn is for the already installed 129MW. It does not include the cost of the yet-to-be-
implemented 21MW, which would bring the project to 150MW.
THE NATIONAL TREASURY