the natural gas heat pump and air conditioner 2014 peer... · the natural gas heat pump and air...
TRANSCRIPT

Paul Schwartz, [email protected] DE-FOA-0000823 Grantee
The Natural Gas Heat Pump and Air Conditioner 2014 Building Technologies Office Peer Review
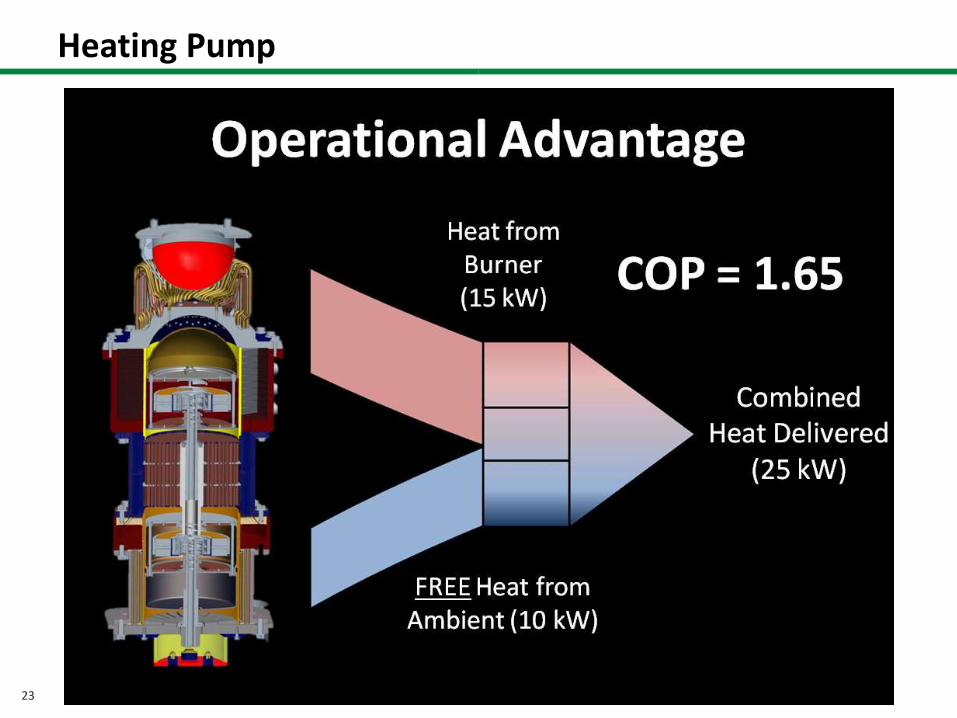
FREE Heat from
Ambient (10 kW)
Heat from Burner
(15 kW)
Combined
Heat
Delivered
(25 kW)
New Project

2
Project Summary
Timeline:
Start date: 10/1/2013 (8/1/2013)
Planned end date: 9/30/2014
Key Milestones
1. Concept & CAD model; Q1 FY2014
2. Thermal Simulation; Q2 FY2014
3. 20kW Demonstrator; Q3-Q4 FY2014
4. Testing at Oak Ridge; Q4 FY2014?
Budget: $750,000
Total spent to date: $397,000
Total future: $353,000
Key Partners:
Project Goal: To develop a Vuilleumier heat pump (VHP)
which includes novel improvements that
will yield higher performance than the
already high COP results of previously
developed VHP. The heat pump will use
natural gas to provide heating, cooling, and
hot water with a single device.
Target Market / Audience:
Residential and Small Commercial Buildings & Specialized Industrial Applications
DOE NYSERDA
Stony Brook Univ. Oak Ridge Natl. Lab.
National Grid Par Group
ATA STAR Energy
Fala Technologies LoDolce

3
Purpose and Objectives
Impact of Project: 1. The project goal is a 20kW device, capable of delivering complete heating and cooling
demand with scalable 2,000 sqft. units. 2. Growth and Impact Plan:
a. Near-term (<1 yr after project) – Incorporate manufacturing design refinements and conduct durability studies, Begin demonstration through DOD ESTCP program and pilots through gas utility partnerships.
b. Intermediate-term (1-3 yrs) – Product launch, 5k units installed during the first year, 15,000 in year two.
c. Long-term (3+ yrs) – Expansion / global adoption, Target: 150k-250k unit production.
Problem Statement: • In cold weather climates, typical heat pumps are prohibitively costly to operate. • In warm climates, peak electricity is very expensive. • Common HVAC devices (compressors, furnaces, boilers, etc.) are outdated / inefficient.
Target Market and Audience:
18.68 Quads Used for heating, cooling, & hot water
≈ 20% of total energy used
Total U.S. Energy Use = 98.0 Quads

4
Comparison to State-of-the-Art

5
Team

6
Approach
Approach: ThermoLift is modernizing a proven Vuilleumier cycle device for heating,
cooling, and hot water. The end product will be a single 20kW natural gas-driven device for residential and commercial applications. Engineering development is focused on incorporating innovative improvements, optimizing device performance, and reducing the complexity and manufacturing costs.
Key Issues: • Design of novel electromechanical drive • Design of optimized heat exchangers • Concerns due to high temperatures and pressures
Distinctive Characteristics: • Single Natural gas-driven device for heating, cooling, and hot water • No electricity meaning grid independence • No refrigerants - Helium working gas • Cold climate performance
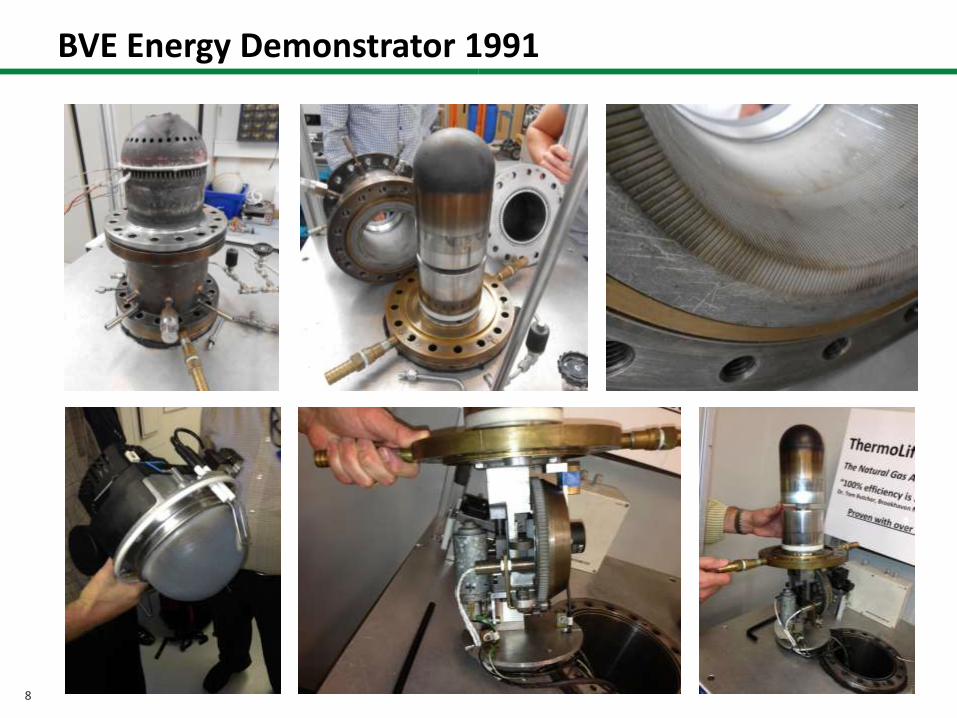
Temp °F DOE Target BVE Demonstrator
-13 1 1.3
17 1.15 1.45
47 1.3 1.65

7
Mechanical Compressor
Thermal Compressor
Stirling Process
Vuilleumier
Process
Thermally Driven Cycles (Vuilleumier & Stirling)
8
BVE Energy Demonstrator 1991

9
ThermoLift First Generation Benefits:
• Single device for complete HVAC • 30-50% reduction in energy used • No electricity / Grid Independent • No refrigerants • Cold climate performance • Fuel agnostic • Simple retrofit & installation • Smaller footprint / Fully scalable units • Smart grid enabled controls • Full efficiency at partial loads

10
3D Printed Prototype
355 mm ~ 14 in
806 mm ~ 32 in

11
Thermodynamic Cycle Analysis & Simulation
Two different 1D simulation tools
Tested effects of: • Non-traditional displacer motion • Geometry changes • Different temperatures
Results: • Found potential issues with flow resistance leading to improved design
Next steps: • Integrate and validate simulation with CFD and prototype test data • Define critical loss mechanisms
Case Bore8 Bore4 Bore9 Bore0Nominal
Stroke8
Nominal
Stroke4
Nominal
Stroke9
Nominal
Stroke0
Wall
Temperat
ure
Wall
Temperat
ure
Wall
Temperat
ure
Wall
Temperat
ure
Engine
Speed
(cycle
average);
Part
EngineCra
nk
Indicated
Power;
Part
EngineCra
nk
Combine
d Energy
Rate Out
of Fluid;
Part
HE_Hot_
7
Combine
d Energy
Rate Out
of Fluid;
Part
HE_Hot-
Warm_5
Combine
d Energy
Rate Out
of Fluid;
Part
HE_Cold-
Warm_3
Combine
d Energy
Rate Out
of Fluid;
Part
HE_Cold_
1
Output;
Part
COP_Hot
Output;
Part
COP_COL
D
Output;
Part
COP_Hot
Output;
Part
COP_COL
D
Energy
Balancing
No Unit mm mm mm mm mm mm mm mm degC degC degC degC RPM kW kW kW kW kW - - - - kW
4 180 180 120 120 50 50 50 50 700 67 67 30 450 -0.977 -13.102 11.140 12.378 -9.492 1.80 0.72 1.67 0.67 0.00
5 180 180 140 140 50 50 50 50 700 67 67 30 450 -1.426 -14.136 11.646 15.933 -12.120 1.95 0.86 1.77 0.78 0.00
6 180 180 160 160 50 50 50 50 700 67 67 30 450 -2.311 -15.131 12.132 19.697 -14.518 2.10 0.96 1.82 0.83 0.00
7 180 180 180 180 50 50 50 50 700 67 67 30 450 -3.919 -16.028 12.819 23.409 -16.332 2.26 1.02 1.82 0.82 0.00
COP 2.26

12
Heat Exchanger CFD
Using 2D CFD: • Simulated fluid flow and heat transfer between helium working gas and hydronic distribution system
Results: • Required design changes (length, # tubes, baffles) to ensure sufficient heat transfer with acceptable pressure drops
Next steps: • Validate simulation data including losses (e.g. entrance / exit effects)
• Further analyze flow resistance versus dead volume performance tradeoff
• Develop more effective HX designs for future generations including alternative fuels

13
Mechanical FEA
Simulation: • Found unacceptable stress and strain on the heater head
Results: • Designed thicker plate and changed flange locations for proper sealing
• Developed method for better creep evaluation
Next steps: • Evaluate materials with superior mechanical properties at high temperatures
• Investigate alternative design structures for thermal stress mitigation
14
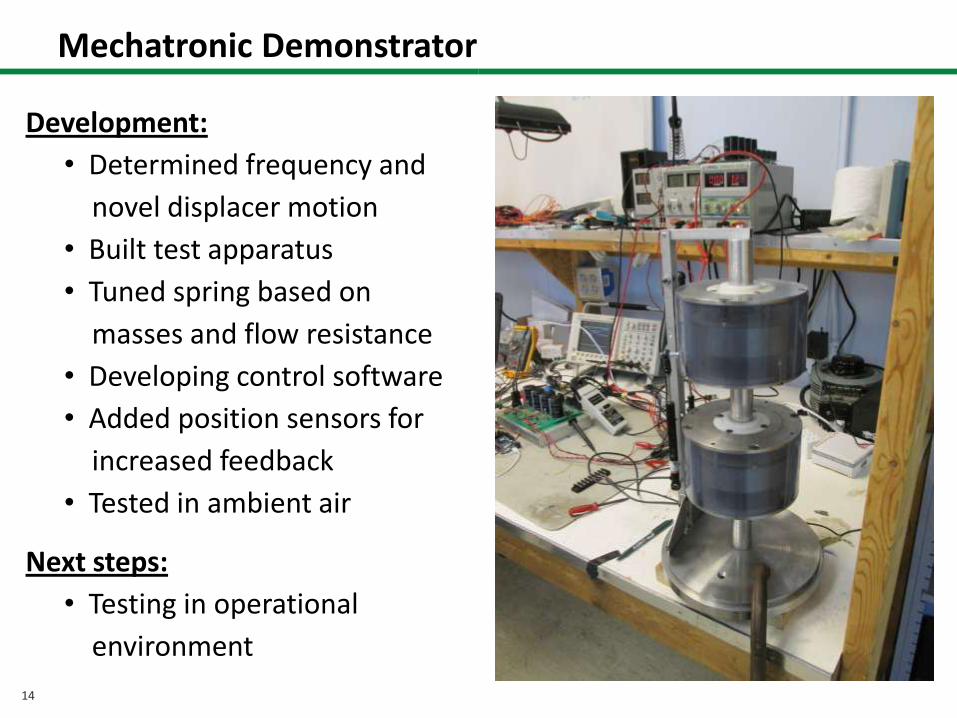
Mechatronic Demonstrator
Development:
• Determined frequency and
novel displacer motion
• Built test apparatus
• Tuned spring based on
masses and flow resistance
• Developing control software
• Added position sensors for
increased feedback
• Tested in ambient air
Next steps:
• Testing in operational
environment

15
Progress and Accomplishments
Lessons Learned: • There is a high sensitivity to flow resistance and regenerator performance • The complexity of regenerators provides opportunity for study and innovation particularly manufacturing • Address high temperature and pressure concerns • Simulation will be further tuned with initial test data
Accomplishments: • Built and begun testing on mechatronic controls • Sourcing and receiving components for first prototype • Developed a baseline simulation for tuning and validation
Market Impact: • Assembled an experienced organization • Built extensive network of advocates, partners & suppliers
Awards/Recognition: • 2013 Defense Energy Summit – Winner • 2013 New England Venture Summit – Best Presenter • 2014 ARPA-E UltraLight Startups Future Energy Pitch Competition – Winner

16
Project Integration: • Stony Brook University - AERTC • Engineering expertise in Detroit • Gas utilities domestically and abroad • Established advocates in numerous organization (DOD, European Heat Pump Assoc.)
Partners, Subcontractors, and Collaborators: • Applied Thermodynamic Apparatus (ATA) • Oak Ridge National Labs • Brookhaven National Labs • Fala Technologies, LoDolce, MicroTube, HandyTube, Bruce Diamond
Communications: Exhibits:
2014 ARPA-E, 2013 New England Venture Summit, 2013 Defense Energy Summit, 2013 Advanced Energy Conference NYC, 2012 National Academy of Sciences
Publications: 2014 American Gas Magazine, China Lake High Technology Association Journal, Newsday, LI Business News, CBS News Affiliate
Project Integration and Collaboration

17
• Large scale demonstration
• Further optimized design: • Analysis of flow resistance and dead volume of critical components
• Simplified manufacturing design
• Analysis of innovative technologies & materials
• Development of novel heat exchanger components
• Optimization for alternative technologies and industrial applications
• Development of fuel agnostic capabilities using alternative fuel sources including heating oil, biofuels and solar thermal
Next Steps and Future Plans
Oak Ridge Natl. Lab

18
REFERENCE SLIDES

19
Project Budget: $1,103,810 (DOE $750,000 / ThermoLift $ 353,810) Cost to Date: • Total spent = $651,862 ≈ 59.1% of total project budget
Additional Funding: • NYSERDA – $482,722 • Private Capital – $1.63M (TopSpin, LI Angel Network).
Budget History
Q1 FY2014 (past)
Q2 FY2014 (current)
Q3-Q4 FY2014 (planned)
DOE Cost-share DOE Cost-share DOE Cost-share $ 299,681 $ 192,782 $ 97,000 $ 62,399 $ 353,319 $ 98,629
Project Budget
20
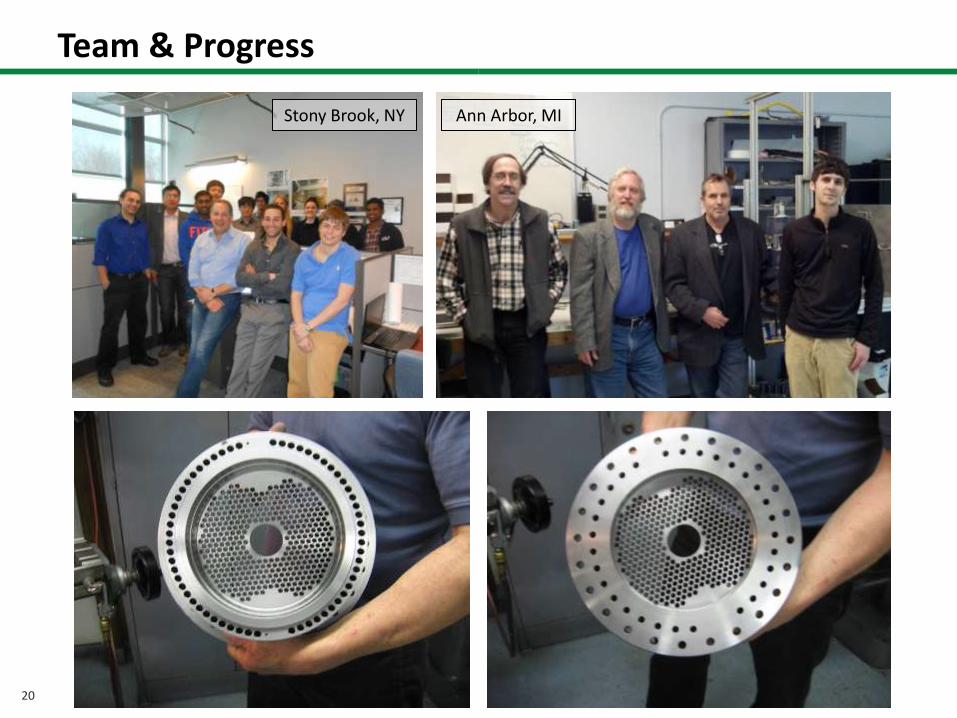
Team & Progress
Stony Brook, NY Ann Arbor, MI

21
Additional Progress Pictures

22
Vuilleumier Development
23
Heating Pump
24
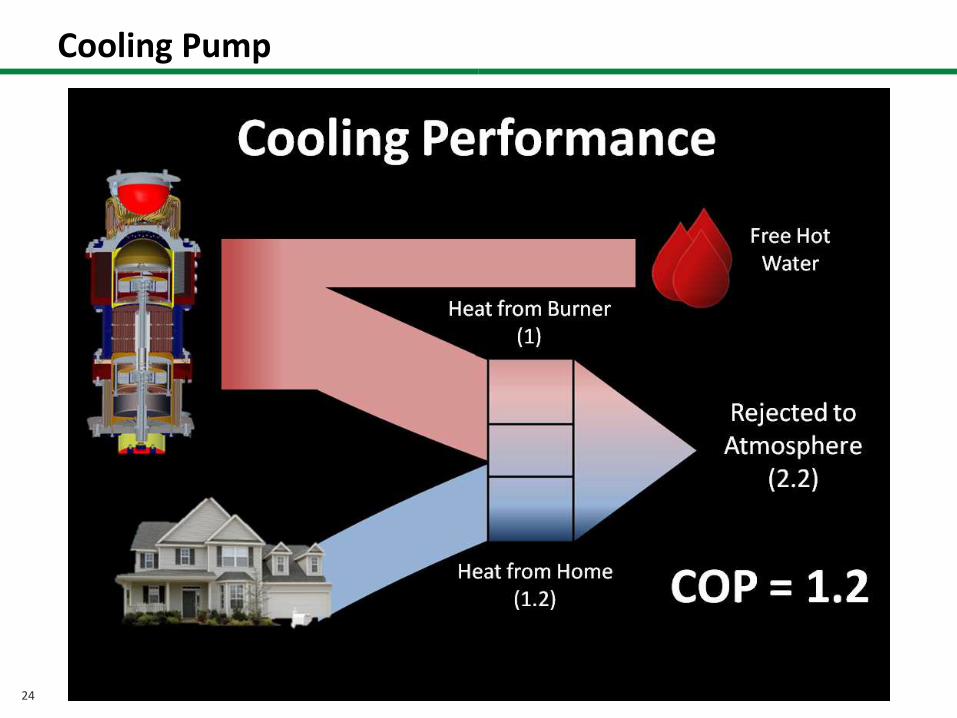
Cooling Pump

25
Energy Savings

26
Emissions Reduction

27
Customer Value