the natural landscape metaphor in information ...montello/pubs/nattyland.pdf · the natural...
TRANSCRIPT

The Natural Landscape Metaphor in InformationVisualization:The Role of Commonsense Geomorphology
Sara Irina FabrikantDepartment of Geography, University of Zurich, Winterthurerstrasse 190, CH-8057 Zurich, Switzerland.E-mail: [email protected]
Daniel R. MontelloDepartment of Geography, University of California at Santa Barbara, Santa Barbara, CA 93106.E-mail: [email protected]
David M. MarkDepartment of Geography, University at Buffalo (SUNY), Buffalo, NY 14261. E-mail: [email protected]
The landscape metaphor was one of the first methodsused by the information visualization community to reor-ganize and depict document archives that are not inher-ently spatial. The motivation for the use of the landscapemetaphor is that everyone intuitively understands land-scapes. We critically examine the information visualiza-tion designer’s ontologies for implementing spatializedlandscapes with ontologies of the geographic domainheld by lay people. In the second half of the article,we report on a qualitative study where we empiricallyassessed whether the landscape metaphor has explana-tory power for users trying to make sense of spatializedviews, and if so, in what ways. Specifically, we are inter-ested in uncovering how lay people interpret hills andvalleys in an information landscape, and whether theirinterpretation is congruent with the current scientificunderstanding of geomorphologic processes. Our empir-ical results suggest that neither developers’nor lay users’understanding of terrain visualizations is based on uni-versal understanding of the true process that has shapeda natural landscape into hills and valleys, mountains, andcanyons. Our findings also suggest that the informationlandscape metaphor for sense making of a documentcollection is not self-evident to lay users, as claimed byinformation landscape designers. While a deep under-standing of geomorphology will probably not be requiredto successfully use an information landscape, we do sug-gest that a coherent theory on how people use space willbe necessary to produce cognitively useful informationvisualizations.
Introduction
With the advance of the World Wide Web and its diverseapplications for the exchange of information, many have tried
Received March 9, 2009; revisedAugust 13, 2009; acceptedAugust 14, 2009
© 2009 ASIS&T • Published online 12 November 2009 in Wiley Inter-Science (www.interscience.wiley.com). DOI: 10.1002/asi.21227
to conceptualize and depict digital information collectionssuch as online libraries, Web-based multimedia collections ordigital discussion forums (Dodge & Kitchin, 2000). Informa-tion providers and users have considered properties of digitalinformation collections represented as “spaces,” includingtheir size, shape, and form. What is the nature of an infor-mation space, and what do they look like when depicted?How is information located in these spaces, and how do theirspatial properties represent nonspatial properties of the infor-mation? Do depictions of information spaces (i.e., externalvisualizations) correspond with the mental maps (i.e., internalvisualizations) of the information spaces held by their users?
Depicting information collections as concrete spatial lay-outs, even when the collections are not themselves explicitlyspatial, is an information visualization technique known asspatialization (Kuhn & Blumenthal, 1996). Spatialization isbased on utilizing spatial metaphors such as location, dis-tance, size, and connectivity to devise graphic displays thatdepict the structure or content of nonspatial informationstored in very large databases. Instead of presenting userswith large tables or long lists of queried items in text format,information spatializations allow users to explore graphic dis-plays of information, often allowing users to see the “layout”of the information in a single view (Skupin & Fabrikant,2003). Spatialization attempts to exploit the power of graphicdisplays as cognitive aids, allowing people to sift more effi-ciently through and gain knowledge from vast amounts ofaccumulated data such as medical records, banking transac-tions, or information-bearing items stored in online archives(Fabrikant & Buttenfield, 2001). However, empirical find-ings have suggested that information landscapes should bebased on sound geographical principles (Fabrikant, 2000,2001a, 2001b) and adhere to cartographic design guidelinesto be cognitively inspired and usable (Fabrikant & Skupin,
JOURNAL OF THE AMERICAN SOCIETY FOR INFORMATION SCIENCE AND TECHNOLOGY, 61(2):253–270, 2010

FIG. 1. An information landscape by Kartoo (www.kartoo.com).
FIG. 2. An information landscape by Chalmer’s (1983) bead system, depicting articles from an HCI conference (CHI ’91).
2005). Very often, however, spatializations are presented tousers without “metadata,” such as a legend explaining thesymbolization, labels, source information, or mathematicalconstruction details so that lay users can evaluate the basis ofthe spatial layout.
Several Web search engines have embraced the idea of alandscape metaphor to depict data holdings. The landscapemetaphor was one of the first methods used by the informa-tion visualization community to depict document archivesand is still an extremely popular method (Card, Robertson, &Mackinlay, 1991; Chalmers, 1993; Wise et al., 1995). Theinformation landscape also has been applied to scientometricanalyses (Scharnhorst, 2000). Of the myriad of existing spa-tialization examples,1 we were interested in evaluating classic
1See, for example, Martin Dodge’s online collection in the “Atlasof Cyberspace on the Web at: http://personalpages.manchester.ac.uk/staff/m.dodge/cybergeography/atlas/atlas.html
representatives of information landscape visualizations in ourstudy. One such prototypical example of an information land-scape accessible on the Web is depicted in Figure 1. Anothervery early example is shown in Figure 2, a sample screenfrom Chalmer’s (1993) Bead information landscape system.
As Kuhn (1993) suggested, powerful interface metaphorsare those that create explanatory theories for users interact-ing with a system. That is, users can map the processes andrelations of the source domain (e.g., the natural landscape)onto the processes and relations of the target domain (i.e., theinformation space), allowing them to use their knowledge ofsource domain operation to predict the target domain opera-tion. The power of the landscape metaphor as an interfacelies partially in the rich ontology provided by the land-scape concept in the real world. Landscapes are ubiquitousin the evolution of the human species, the development ofhuman cultures, and the personal experience of individuals.Landscapes thus provide not only a deep source domain for
254 JOURNAL OF THE AMERICAN SOCIETY FOR INFORMATION SCIENCE AND TECHNOLOGY—February 2010DOI: 10.1002/asi

the creation of various spatial metaphors (Couclelis, 1998)but also provide a theoretical basis for spatialization previ-ously missing in the field of information visualization (Wise,1999). Of course, if the landscape metaphor suggests certainproperties of an information system target domain that do notactually apply to that target domain, users run the risk of beingconfused or misled by the landscape metaphor. This is botha blessing and a curse when using a metaphor. A metaphoris only like a source domain, not the domain itself (Lakoff,1987). This means that a metaphor may include only some,but not all, characteristics, and may in fact have additional(i.e., “magical”) properties.
In the present article, we critically examine the explana-tory theories that the landscape metaphor suggests to layusers. A common claim in information visualization is thatthe landscape metaphor is intuitively understood by the pub-lic because it is based on the familiarity of the organizationof the natural environment (Dourish & Chalmers, 1994), andthe interpretation of natural forms is part of humans’ biolog-ical heritage (Wise, 1999). Specifically, we are interested inuncovering how lay people interpret hills and valleys in aninformation landscape, and if their interpretation is congruentwith the current scientific understanding of geomorphologicprocesses. In the first section, we consider possible ontologiesembodied by the landscape metaphor. We contrast the infor-mation visualization designer’s ontologies for implementingspatialized landscapes with ontologies of the geographicdomain held by lay people (i.e., commonsense or naïve geo-morphology). In the second half of the article, we reporta qualitative study in which we empirically assessed if thelandscape metaphor has explanatory power for users tryingto make sense of spatialized views, and if so, in what ways.
The Landscape Metaphor in Information Visualization
Although the landscape metaphor has become almostubiquitous in the literature of human–computer interac-tion (HCI), information science, and information visual-ization, this literature almost completely avoids any refer-ence to geographic theory and research. The few referencesmade to geography, cartography, or GIS/GIScience are gen-erally somewhat misleading. For example, the followingquote comes from a state-of-the-art information visualizationarticle by Börner, Chen, and Boyack (2003): “GeographicInformation Systems (GIS) represent a gray area betweeninformation visualization and traditional cartography. . . .Thematic maps provide a rich metaphor for a class of informa-tion visualization known as information landscape” (p. 185).There is a fundamental difference to use geographical spaceas a reference system to depict additional attribute infor-mation of geographic phenomena (i.e., inherently spatial),compared to an abstract three-dimensional space for multi-variate, nongeographical data (i.e., metaphorically spatial).GISs are not “just” visualizations or maps but are quitecomplex hardware and software tools employed to store,manage, analyze, and display geographically referenced datato help everyone from scientist to citizen to solve geographic
problems (Longley, Goodchild, Maguire, & Rhind, 2005).The core of a GIS is the georeferenced database. Geographicdata stored in a GIS are represented in various visual (andnonvisual) forms. Visual GIS outputs can include tables,graphs, images, and various types of “traditional” cartograph-ical products (i.e., maps). In other words, maps are just oneof many forms that the GIS offers as spatial database repre-sentations. Thematic maps show the spatial distribution of aparticular geographic phenomenon or process (Dent, 1999).Specifically, thematic maps, known since the 19th century(thus well before computers), are one class of visuospatialforms that can be produced with GIS, but they also can beproduced with a simple graphic-design package or even byhand. They illustrate physical and cultural phenomena (andprocesses) or abstract ideas about them (e.g., statistical rela-tionships) within a geographical reference frame (e.g., shownon a cartographic base map). While featuring abstract statis-tical data and respective statistical graphics (e.g., statisticalsurfaces, pie and bar charts, etc.), thematic maps are basedon inherently spatially referenced data (e.g., by latitude andlongitude), and thus show data that are not spatialized.
While cartographic maps or GIS maps refer to the geo-graphic environment, we now turn to the mapping of abstractspaces. The basis for using a landscape metaphor is to “exploitour familiarity with the naturally spatial organization of thereal world” (Dourish & Chalmers, 1994, p. 1) and to “poten-tially gain a great benefit by employing many of our innateperceptual skills” (Chalmers, 1995, p. 106). But details ofexactly how or why a landscape metaphor might “work”are seldom presented, nor is a connection made to any evi-dence of how people understand landscapes or their meaning.The landscape metaphor expresses the idea of depictingtypically high-dimensional and abstract data spaces withlower dimensional intuitive spaces, but details of the allegedmetaphorical mapping between the target domain and thesource domain are sketchy or absent. One example of such aninformation landscape is the landscape provided in VxInsight(Boyak et al., 2002a, 2002b) depicting
. . . a 3-D virtual landscape that looks like a mountain range.This three-dimensional environment is readily understoodbecause there is only a small cognitive step between see-ing the virtual terrain and then exercising our innate humanexpertise in navigating through real terrains. (Boyack et al.,2002a, p. 766)
A second landscape example, according to Wise et al.(1995), is said to “reveal thematic patterns and relationshipsbetween documents in a manner similar if not identical to theway the natural world is perceived” (p. 52). Although neitherWise nor other information visualizers provided detail as tohow the natural world is in fact perceived, they suggestedthat the landscape metaphor carries a natural interpreta-tion that does not require instruction or prolonged trainingto be appreciated and used (Wise, 1999).
Geographers have traditionally used the term “landscape”to refer to a perspective view of a portion of the mate-rial earth surface that can be perceived by humans via thesenses, especially vision; this term also has been used to
JOURNAL OF THE AMERICAN SOCIETY FOR INFORMATION SCIENCE AND TECHNOLOGY—February 2010 255DOI: 10.1002/asi

FIG. 3. Example of a Populated Information Terrain (PIT; available at: http://www.crg.cs.nott.ac.uk/research/applications/pits/#examples).
refer to a homogenous area of earth surface, similar to“region” (Granö, 1929/1997; Johnston, Gregory, & Smith,1993; Martin & James, 1993). Landscape is thus closer totwo-dimensional than to three-dimensional—the landscapeis part of the curved (i.e., undulating) two-dimensional sur-face grounding a three-dimensional volume in which lifeexists on Planet Earth. Geographers distinguish addition-ally between natural (i.e., biophysical) and cultural (i.e.,artificial, anthropogenic, etc.) landscapes to recognize theimportance of human agency on Earth’s features and pro-cesses. Terrain implies the curved two-dimensional surfaceof the Earth, and its use suggests why Gibson’s (1979) eco-logical perception theory has become popular in the fewtheoretical discussions to be found in the information visu-alization literature. In contrast, the term “terrain” is oftenused interchangeably with information landscape in the infor-mation visualization community. Following the Gibsoniantradition, Wise (1999) attributed to the information landscape“the advantage of the visual appearances of natural forms thathumans have learned to interpret visually as part of the biolog-ical heritage from their species history on Earth” (p. 1225).This quote also suggests that the term landscape for someinformation visualization researchers is synonymous with thenatural landscape, emphasizing physical Earth features andprocesses.
Unfortunately, there seems to be confusion about theontology (i.e., geographic primitives and their relationships)of landscapes in the real world (i.e., the source domain)that information visualization designers draw upon when
developing information landscapes to represent the contentof databases (i.e., the target domain). As mentioned earlier,when there is a mismatch between source domain and targetdomain, developers run the risk of confusing or mislead-ing the audience with a metaphor. For example, consider thePopulated Information Terrain (PIT) (Benford, Snowdon, &Mariani, 1995; Mariani et al., 1994), a screenshot from whichis shown in Figure 3. As terrain, according to the evolution-ary argument mentioned earlier, a user would expect dataobjects in PITs to be subjected to gravity and thus groundedon a horizontal surface; however, as the screenshot reveals,data items are depicted as abstract-looking geometric shapesfloating in three-dimensional space, and information seekersfly through the space to browse the data archive. The issue ofdimensionality is another problem area in information visu-alization. Wise et al. (1995), creators of probably the mostwell-known information landscape, ThemeScapes, stated that“ThemeScapes are abstract, three-dimensional landscapes ofinformation that are constructed from document corpora”(p. 55); however, ThemeScapes and similar spatializationssuch as VxInsight (Figure 4) are not three-dimensional, nor2.5-dimensional as noted by Boyack et al. (2002b), but rathercurved two-dimensional surfaces. They are undulating, sur-facelike entities which a viewer does not penetrate or travelbeneath to explore. Typically, the distance measures assignedto the x–y surface (the ordination output distance based oninput similarities) are not in the same units as in the z dimen-sion (e.g., frequencies, or densities). The exploration volumesurrounding the landscape or terrain is three-dimensional
256 JOURNAL OF THE AMERICAN SOCIETY FOR INFORMATION SCIENCE AND TECHNOLOGY—February 2010DOI: 10.1002/asi

FIG. 4. Screenshots of (a) ThemeScapes and (b) VxInsight Information landscapes. Themescape image created with a demo version of ThemeScape(available at http://inspire.pnl.gov/). VxInsight image from Boyack, Wylie, & Davidson (2002a).
because a viewer can fly over and around them and is typi-cally able to rotate them as if they were toy blocks in one’shand. When depicted on a two-dimensional computer mon-itor, the image projected to a viewer makes them look like2.5-dimensional perspective views.
Some of the confusion about dimensionality may stemfrom restricting the term landscape to natural landscapes,as found in some of the information visualization literature(e.g., Wise, 1999), but unlike traditional use in geogra-phy. As mentioned earlier, natural landscapes are typically
JOURNAL OF THE AMERICAN SOCIETY FOR INFORMATION SCIENCE AND TECHNOLOGY—February 2010 257DOI: 10.1002/asi
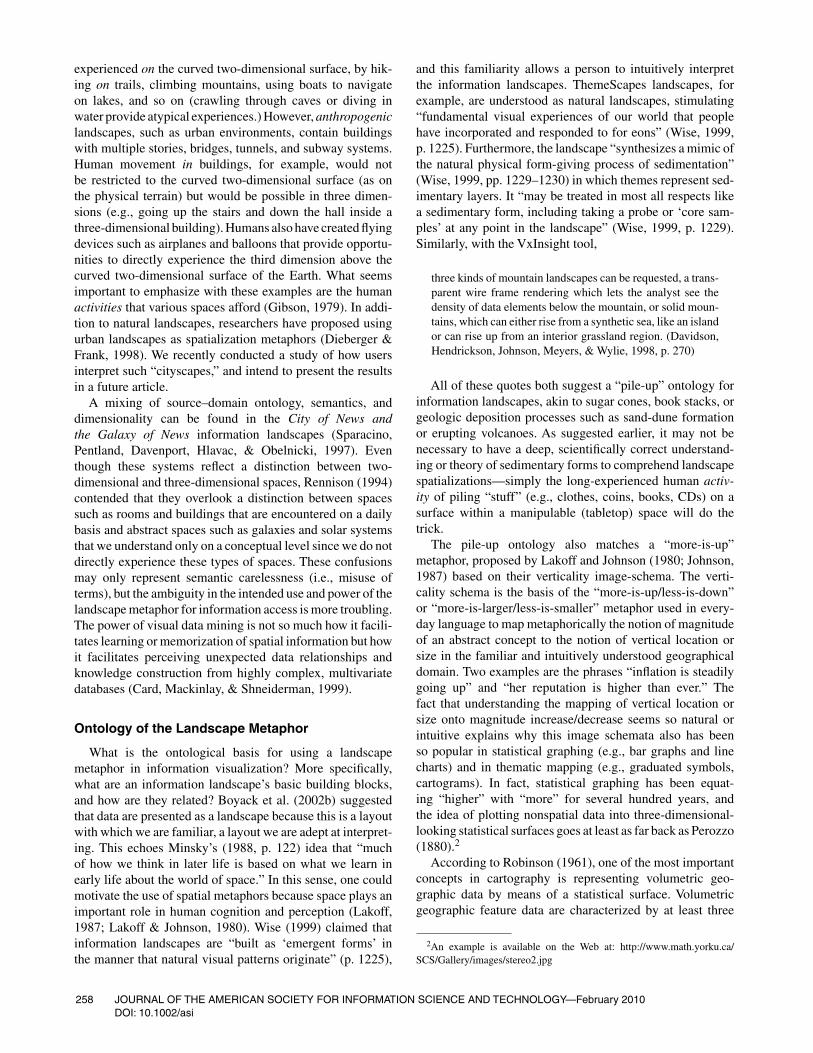
experienced on the curved two-dimensional surface, by hik-ing on trails, climbing mountains, using boats to navigateon lakes, and so on (crawling through caves or diving inwater provide atypical experiences.) However, anthropogeniclandscapes, such as urban environments, contain buildingswith multiple stories, bridges, tunnels, and subway systems.Human movement in buildings, for example, would notbe restricted to the curved two-dimensional surface (as onthe physical terrain) but would be possible in three dimen-sions (e.g., going up the stairs and down the hall inside athree-dimensional building). Humans also have created flyingdevices such as airplanes and balloons that provide opportu-nities to directly experience the third dimension above thecurved two-dimensional surface of the Earth. What seemsimportant to emphasize with these examples are the humanactivities that various spaces afford (Gibson, 1979). In addi-tion to natural landscapes, researchers have proposed usingurban landscapes as spatialization metaphors (Dieberger &Frank, 1998). We recently conducted a study of how usersinterpret such “cityscapes,” and intend to present the resultsin a future article.
A mixing of source–domain ontology, semantics, anddimensionality can be found in the City of News andthe Galaxy of News information landscapes (Sparacino,Pentland, Davenport, Hlavac, & Obelnicki, 1997). Eventhough these systems reflect a distinction between two-dimensional and three-dimensional spaces, Rennison (1994)contended that they overlook a distinction between spacessuch as rooms and buildings that are encountered on a dailybasis and abstract spaces such as galaxies and solar systemsthat we understand only on a conceptual level since we do notdirectly experience these types of spaces. These confusionsmay only represent semantic carelessness (i.e., misuse ofterms), but the ambiguity in the intended use and power of thelandscape metaphor for information access is more troubling.The power of visual data mining is not so much how it facili-tates learning or memorization of spatial information but howit facilitates perceiving unexpected data relationships andknowledge construction from highly complex, multivariatedatabases (Card, Mackinlay, & Shneiderman, 1999).
Ontology of the Landscape Metaphor
What is the ontological basis for using a landscapemetaphor in information visualization? More specifically,what are an information landscape’s basic building blocks,and how are they related? Boyack et al. (2002b) suggestedthat data are presented as a landscape because this is a layoutwith which we are familiar, a layout we are adept at interpret-ing. This echoes Minsky’s (1988, p. 122) idea that “muchof how we think in later life is based on what we learn inearly life about the world of space.” In this sense, one couldmotivate the use of spatial metaphors because space plays animportant role in human cognition and perception (Lakoff,1987; Lakoff & Johnson, 1980). Wise (1999) claimed thatinformation landscapes are “built as ‘emergent forms’ inthe manner that natural visual patterns originate” (p. 1225),
and this familiarity allows a person to intuitively interpretthe information landscapes. ThemeScapes landscapes, forexample, are understood as natural landscapes, stimulating“fundamental visual experiences of our world that peoplehave incorporated and responded to for eons” (Wise, 1999,p. 1225). Furthermore, the landscape “synthesizes a mimic ofthe natural physical form-giving process of sedimentation”(Wise, 1999, pp. 1229–1230) in which themes represent sed-imentary layers. It “may be treated in most all respects likea sedimentary form, including taking a probe or ‘core sam-ples’ at any point in the landscape” (Wise, 1999, p. 1229).Similarly, with the VxInsight tool,
three kinds of mountain landscapes can be requested, a trans-parent wire frame rendering which lets the analyst see thedensity of data elements below the mountain, or solid moun-tains, which can either rise from a synthetic sea, like an islandor can rise up from an interior grassland region. (Davidson,Hendrickson, Johnson, Meyers, & Wylie, 1998, p. 270)
All of these quotes both suggest a “pile-up” ontology forinformation landscapes, akin to sugar cones, book stacks, orgeologic deposition processes such as sand-dune formationor erupting volcanoes. As suggested earlier, it may not benecessary to have a deep, scientifically correct understand-ing or theory of sedimentary forms to comprehend landscapespatializations—simply the long-experienced human activ-ity of piling “stuff” (e.g., clothes, coins, books, CDs) on asurface within a manipulable (tabletop) space will do thetrick.
The pile-up ontology also matches a “more-is-up”metaphor, proposed by Lakoff and Johnson (1980; Johnson,1987) based on their verticality image-schema. The verti-cality schema is the basis of the “more-is-up/less-is-down”or “more-is-larger/less-is-smaller” metaphor used in every-day language to map metaphorically the notion of magnitudeof an abstract concept to the notion of vertical location orsize in the familiar and intuitively understood geographicaldomain. Two examples are the phrases “inflation is steadilygoing up” and “her reputation is higher than ever.” Thefact that understanding the mapping of vertical location orsize onto magnitude increase/decrease seems so natural orintuitive explains why this image schemata also has beenso popular in statistical graphing (e.g., bar graphs and linecharts) and in thematic mapping (e.g., graduated symbols,cartograms). In fact, statistical graphing has been equat-ing “higher” with “more” for several hundred years, andthe idea of plotting nonspatial data into three-dimensional-looking statistical surfaces goes at least as far back as Perozzo(1880).2
According to Robinson (1961), one of the most importantconcepts in cartography is representing volumetric geo-graphic data by means of a statistical surface. Volumetricgeographic feature data are characterized by at least three
2An example is available on the Web at: http://www.math.yorku.ca/SCS/Gallery/images/stereo2.jpg
258 JOURNAL OF THE AMERICAN SOCIETY FOR INFORMATION SCIENCE AND TECHNOLOGY—February 2010DOI: 10.1002/asi

dimensions, such as two-dimensional location (x- and y-coordinates on the plane), and a feature’s characteristicmapped into the third dimension (i.e., attribute). For topo-graphic surfaces (i.e., relief or landform maps), the thirddimension is typically elevation above sea level; for abstractstatistical surfaces, it can by any attribute that smoothlyvaries over space (e.g., population density, access distanceto grocery stores, noise levels, etc.). Over many years, car-tographers have developed an array of graphical symbols,including points (dot-density maps), lines (isolines or fish-net surfaces), and areas (isopleth and shaded relief maps), todepict volumetric data in the form of statistical terrains.
Geomorphology 101
Given the claim by information visualization researchersthat people rely on their understanding of terrain-formationprocesses to interpret terrain metaphors, it is instructive toreview those processes from a geographical and geologi-cal perspective. Geomorphology is the science that studieslandforms and the processes that shape them (Summerfield,1991). Over the last several centuries, a creationist view ofthe landscape as immutable was replaced first by theories thatthe landscape was shaped by the Biblical flood, and laterby scientific models that the landscape was formed by theprocesses we can observe today, acting over very long timeperiods. Geomorphologists now believe that the Earth’s ter-restrial surface has been shaped primarily by tectonic forcesthat cause uplift, folding, and faulting, and the erosionand deposition (“denudation”) of sediments by wind, water,glaciers, and the action of chemical and gravitational pro-cesses. These processes often gouge out valleys or canyons(“local minima”), or fill in basins to form plains and otherflat features. A large proportion of the Earth’s protrudinglandforms—“local maxima” that lay people often identifyas hills or mountains—are created by the differential ero-sion of materials varying in hardness. For example, much ofthe “mountainous” areas of the Western Appalachians of theEastern United States and the intermontane plateaus of theWestern United States were formed in this way. Althoughthese erosional features often operate on plateaus that havebeen uplifted by tectonic forces, they do not result directlyfrom true orogenic (mountain-building) processes. Such oro-genic processes primarily include the folding and faulting, notjust uplift, due to plate tectonics. Volcanism is important, too,but accounts for a relatively small proportion of the Earth’sprotruding landforms.
Where sediments were deposited by water, they either fillbasins in the bottoms of water bodies or produce flat-toppedfills in the forms of deltas, flood plains, and alluvial fans. Inother words, fluvial deposition tends to make land surfacesmore level. In a fluvially eroded landscape, geomorphic activ-ity generally produces concave topographic features such asvalleys and canyons, and not convex forms such as hills ormountains. Fluvial erosion may increase local variation inheight by carving the low parts even lower or may itself pro-duce a leveling by eroding the high areas. When tectonic
forces cause land to rise, areas often rise as masses, retain-ing (more or less) the forms they had at lower elevation.The increased elevation exposes surfaces to higher potentialenergy and potential erosion, with hill and valley forms beingcreated through erosion of the valleys. In typical geomor-phic systems, maximum geomorphic process activity leads tolarger and lower valleys whereas true hills and mountains arethe places in the landscape where the least activity has hap-pened. Thus, the topography of natural landscapes, includingwhat most lay people would call hilly or mountainous terrain,is mostly not formed via piling-up processes.
Commonsense Understanding ofLandscape Forms
Given that the interpretation of terrain spatializationssupposedly requires understanding of geomorphological pro-cesses primarily by lay people, not geomorphologists, it isimportant to take the next step and ask how lay peopleunderstand the basic facts of geomorphology we have justreviewed. Very little is known about commonsense knowl-edge of topography by the general public, nor about how thismight vary across cultures (but see Mark & Turk, 2003; Mark,Turk, & Stea, 2007). In various places across the Earth, promi-nent convex forms such as mountains and hills often providegood landmarks for navigation in natural landscapes. Indi-vidual mountains are given proper names in many cultures,and sacred significance is often attributed to them (Tuan,1974). People generally know that water runs downhill, andare likely aware that valleys collect and concentrate thewater that may form a river on the valley floor. They proba-bly know that floods can carry sediment and deposit it as flowslackens, and that erosion can create gullies and landslides.If they live in affected areas, they may know that volcaniceruptions can produce lava flows or cinder cones, and thatwind can pile up dunes that can move across the landscape.Processes such as these may be available to users of informa-tion displays as a grounding for metaphors that allow displayinterpretation.
Commonsense geomorphology (or naïve, intuitive, etc.)is the understanding that lay people—nonspecialists—haveof geomorphological structures and processes. This notionis inspired by early work on commonsense physics (Hayes,1978; McCloskey & Kohl, 1983) and by more recent workon commonsense understanding of the Earth and geography(Egenhofer & Mark, 1995; Vosniadou & Brewer, 1992). Infact, the systematic analysis of how lay people perceive andconceive earth-surface topography can be traced at least asfar back as Granö’s (1929/1997) early writing on “pure geog-raphy,” with its focus on perceived landforms as the basis fora human-centric physical geography. This also is reflected inwork on landform “ontologies”—how do lay people percep-tually and conceptually organize the solid earth surface intofeatures, subsequently labeling them verbally (Hoffman &Pike, 1995; Montello, Sullivan, & Pick, 1994; Smith & Mark,2003). In related work, educational researchers have beenconcerned with the conceptions of geology that students bring
JOURNAL OF THE AMERICAN SOCIETY FOR INFORMATION SCIENCE AND TECHNOLOGY—February 2010 259DOI: 10.1002/asi

to their earth-science classes (Ishikawa & Kastens, 2005).One of the main goals of the research we report here is toinvestigate further the commonsense understanding (ontol-ogy) people have of processes that create landforms. This isof interest in itself, but it also will help us understand howlandscape metaphors may work well or poorly when used tospatialize data for lay people.
Research in environmental perception might provideinsights on how information landscapes are “read” andunderstood. Behavioral geographers, environmental psychol-ogists, and others have long studied human–environmentrelationships, including the way people perceive, cognize,experience, and behave in natural environments (Amedeo &Golledge, 2003; Golledge & Stimson, 1997; Hoffman & Pike,1995). Montello, Sullivan, and Pick (1994), for example,compared experienced topographic map users to novice userson a recall memory task involving photographed scenes ofnatural landscapes; in addition, half the experienced partici-pants had to match from memory the landscape scenes withviewing directions marked on a topographic map. The rela-tive proportion of terrain features recalled on drawings andverbal descriptions of the scenes, as opposed to nonterrainfeatures such as vegetation or atmosphere, did not differ as afunction of prior map experience, nor did the types of terrainfeatures recalled. Generally, participants tended to parse thecontinuous landscape shown on the photographs into discretefeatures. All participant groups recalled hills, as opposed tovalleys, flat areas, and slopes, most commonly. But perform-ing the map-matching task did influence recall for the naturallandscape scenes. Experienced map-reading participants whohad to match the scenes with viewing directions on a map ofthe area recalled relatively more terrain than nonterrain fea-tures (e.g., vegetation or atmosphere), and among the terrainfeatures they recalled, relatively more were hills, valleys, orslopes, and fewer were flat features.
How Do Landscape Metaphors “Work?”
To our knowledge, displays based on people’s actual com-monsense knowledge of landscape processes have not yetbeen created. Among information visualization specialists,Wise (1999) should be commended for attempting to providean explicit connection between information displays and thesource domains for display “metaphors” such as stars or ter-rains. Most others who present information landscapes do noteven bother to outline why they think that the displays theycreate might be effective. However, Wise’s (and other infor-mation visualizers’) understanding of the geomorphologicalsource domain was not always accurate. For example, Wisebegan with a general thesis inspired by evolutionary psy-chology: Humans are adapted as a species to interpret certainaspects of natural environments. By designing informationvisualizations in forms that imitate these natural environ-ments, users will find it easier and more intuitive to interpretthe visualizations. Wise referred to this as the “ecologicalapproach” to visualization, evocative of Gibson’s (1979) eco-logical theory of perception (Note that Gibson himself was
not particularly specific about this being innate rather thanlearned.)
Wise (1999) got more specific about the metaphoricalmappings between displays and source domains in landscapespatializations:
It was not accidental that the “Galaxies” visualization invokedthe metaphor of documents as stars in the night sky, or thatThemeScapes™ represented themes as sedimentary layersthat together create the appearance of a natural landscape.These are fundamental visual experiences of our world thatpeople have incorporated and responded to for eons. Theyboth carry a natural interpretation that does not requireinstruction or prolonged training to appreciate and use.(p. 1225)
But how do people really interpret the night sky? Wise(1999) did not cite any research on this question, nor doeshe state specifically how human interpretation of astronom-ical forms and processes in the night sky might transferto users’ interpretations of the “Galaxies” visualization. Inthe case of terrain, Wise was more specific, suggesting thatusers interpret the meaning of sedimentary deposits quicklyand “naturally” because the human species has viewed suchdeposits for millennia. Do people really see and correctlyinterpret sedimentary layers in hills and canyon walls as aregular and repeated component of their experience?
Wise (1999) described the process of creatingThemeScaperepresentations to imitate sedimentary deposition:
The terms are used like layers of sedimentary strata, whereineach term’s layer will vary in thickness as the real proba-bility of finding that term within a document at each pointin the 2-D plane. . .. In a ThemeScape™, a term layer isthickest at the highest density of documents that carry thatterm because the probability of finding that term there iscorrespondingly greater. . .. As term layers accumulate, thehighest elevations occur where the thickest layers overlayeach other. Lower regions reflect places where there are fewerdocuments or where the documents are less thematicallyfocused. . .. Such a thematic terrain synthesizes a mimic ofthe natural physical form-giving process of sedimentation.(pp. 1229–1230)
However, the physical forms of landscapes are generallynot produced in the way Wise described. The sedimentarystrata evident on the sides of many landforms, particu-larly in arid landscapes, are revealed by erosion of surround-ing material, not build-up of material (Summerfield, 1991).If “local maxima” such as hills and mountains are not formedin the way Wise described, how do terrainlike informationvisualizations “work” to communicate information? Eitherthey work for reasons different than those Wise hypothe-sized or they work because the users of spatialized displaysapply the same commonsense geomorphology as did Wise,which is actually inaccurate. Another possibility is that theydo not, in fact, work well. Our primary goal in the researchwe present here is to investigate which of these options istrue.
260 JOURNAL OF THE AMERICAN SOCIETY FOR INFORMATION SCIENCE AND TECHNOLOGY—February 2010DOI: 10.1002/asi

FIG. 5. A sample display used in the experiment. The display was created with LandEx software (see http://www.3dgeo.de/landx.aspx).
If we believe that users of information visualizations arefamiliar with the true nature of geomorphic processes, andthe true origins of hills and valleys, we might predict thatusers would naturally interpret valleys and canyons as placesof maximum information activity, and mountains as places ofminimal information activity, unless the rendering looks likedunes or volcanoes. If, on the other hand, users interpret largerhills and mountains as representing more information, thiswould be evidence that users’ commonsense or naïve ideasabout topography do not reflect a valid comprehension ofgeomorphological processes, at least as expressed in currentscientific understanding.
Experiment
We conducted an experiment with nonspecialists on theirunderstanding of geomorphology and their interpretation ofnatural landscapes in information spatializations. Our con-cern was to characterize the nature of lay understandingof geomorphological processes—what we are calling com-monsense geomorphology. We also were interested in howlay people understand spatialized displays based on naturallandscapes, and in what ways commonsense geomorphologyexplains how people interpret spatialized displays based onnatural landscapes. Are spatialized displays based on land-scapes interpreted on the basis of one’s understanding ofactual landscapes? If so, how does that understanding resem-ble an expert’s understanding of geomorphology? If not, howdo people interpret spatialized displays? Do they interpretthem easily and consistently, particularly when they are givenonly very minimal instructions?
To address these questions, we showed participants curvedtwo-dimensional surface displays that they could explore in athree-dimensional space depicted on a two-dimensional com-puter monitor.As can be seen in Figure 5, the test stimuli wereinspired by the kinds of information landscapes produced andcommonly used in the information visualization community(e.g., Boyack et al., 2002a). About half the participants weretold that they were looking at an actual earth-landscape sur-face; the rest were told they were looking at an “informationspace.” Using a mouse as an interaction device, participantswere able to zoom in and out of the display, rotate the land-scape, and fly over it if they wished before answering a testquestion. Participants were asked to explore the depicted sur-face and answer a series of open-ended questions about theconvexities and concavities visible in the display.
Method
Participants
Twenty-three students (13 females, 10 males) from anintroductory undergraduate human geography course tookpart in the experiment. Their mean age was 20.0 years.The participants had many different majors, mostly notgeography; most of them had not taken other geographycourses. Students received a small amount of course creditfor participating in the experiment.
Materials
Participants viewed an interactive computer display com-posed of a curved two-dimensional surface depicted in
JOURNAL OF THE AMERICAN SOCIETY FOR INFORMATION SCIENCE AND TECHNOLOGY—February 2010 261DOI: 10.1002/asi

FIG. 6. Sample screenshot from an experiment trial showing two convexities of different heights, labeled “A” and “B.”
three-dimensional space; the surface was colored green, andthe surrounding flat area was blue (see Figure 6). The sur-face displays were depicted on a 20-in. computer monitor,using a Windows 2000 Pentium III personal computer. Thesurfaces were derived from a Reuters news stories database,applying spatialization procedures described in further detailin Fabrikant (2001b) and Skupin and Fabrikant (2003).The surfaces were displayed using the LandEx software(Döllner, 2005), a state-of-the-art, three-dimensional visu-alization software developed for display of natural and urbanlandscape models. On various trials, either two or three pointlocations on the surface were labeled A, B, or C. To avoid a“preferred” or default viewing perspective, the point labelsrotated along with the viewer position, but remained fixed(i.e., “billboarding”), when participants chose to change theviewing perspective of the surface.
Participants were randomly assigned to one of two experi-mental conditions. In the landscape condition, 12 participantswere told that the displays represented “a portion of theEarth’s surface. Your task is to explore the depicted land-scape and answer a series of questions about the convexitiesand concavities visible in the landscape.” In the informationspace condition, 11 participants were told that the displaysrepresented “a portion of a document collection of newsstories. . . . The display shows a portion of an informationspace. Your task is to explore the depicted information spaceand answer a series of questions about the convexities andconcavities visible in the information space.” That is, land-scape participants were told to interpret the displays as actualtopographic ground surfaces while information space partic-ipants were told to interpret them as abstract spatializations
of nonspatial semantic content. We attempted to keep thelength of the display descriptions in the two conditions asnearly equal as possible, although the information spacedid require a little additional description. These descriptionsaside, participants in both conditions saw exactly the samedisplays.
Participants in both conditions answered a series of 10questions about the display, often specifically about thelabeled points (see Appendix A). The questions werethe same for the two conditions, with the exception that“natural” or “landscape” for the landscape group was sub-stituted with “information” or “information space” for theinformation space group. The questions asked participantsabout the general appearance of the landscape or informa-tion space; how they interpreted the depth, height, shape,width, and volume of the convexities, concavities, and thespace between the convexities (i.e., saddles); and how theyinterpreted the two-dimensional locations of the compari-son points. The final question asked participants to comparethree points, imagining that the points were the locations ofthree soil or information samples. Participants had to decidewhich of two samples would be more similar to the third. Thisquestion was particularly interesting insofar as it dealt withhow viewers relate distance in information spatializationsto similarity—the “distance-similarity metaphor” (Montello,Fabrikant, Ruocco, & Middleton, 2003).
Procedure
Participants were tested individually in a small labora-tory room. They first answered questions about their age and
262 JOURNAL OF THE AMERICAN SOCIETY FOR INFORMATION SCIENCE AND TECHNOLOGY—February 2010DOI: 10.1002/asi
gender, and the number of geography/cartography classesthey had taken. They then read a description of their taskprinted on paper, tailored to whether they were in thelandscape or information space condition, as described ear-lier. This description explained that they would see three-dimensional computer displays containing “convexities andconcavities;” a sample image of each was shown to them.Participants were told they would have to answer 10 ques-tions about the displays, and were assured that there were noright or wrong answers. They were told to use the mouse tonavigate the landscape or information space, using the leftbutton to rotate the display and the wheel to zoom in or out.Thus, participants were able to manipulate their viewing per-spective at will during the test, with 2 df of motion. Finally,participants were told that they could take as much time toanswer the questions as they needed. The test administratormanually switched the displays, and participants wrote theiranswers directly into a paper questionnaire booklet.
Coding of responses. A coding system was developed tocategorize open-ended responses into classes of similarresponses, to interpret the responses in ways relevant toour research goals. In particular, we wanted to characterizegenerally our participants’ commonsense notions of geomor-phology (in the landscape condition), and we wanted to seehow these notions would or would not be applied to inter-pret the displays when they were described as informationspaces depicting the content of nonspatial documents (in theinformation space condition). However, because we wantedto compare the two conditions directly, as much as was fea-sible, we attempted to code responses in the two conditionswithin the framework of a common coding system. Havingsaid that, we coded more features for the landscape condition(see Appendix B) because our respondents produced morefeatures in that case (see Table 2) compared to the respondentsin the information space condition (see Table 4).
First, each response was segmented into one or more state-ments that expressed a single idea; these segments were thefundamental coding unit; they consisted of as few as one wordand as much as an entire phrase. For all 10 questions in bothconditions, we then coded segments in terms of three cate-gories: Feature, Process, and Appearance (Appendix B). Forresponses in the landscape condition, Feature codes classi-fied mentions of geographic entities, generally nouns, suchas mountains (hills, peaks, etc.) or water bodies. Processcodes classified mentions of geomorphological processes,generally actions that describe how places get formed, suchas erosion, uplift, or deposition. Appearance codes classifiedmentions of what the display image itself looked like, gen-erally adjectives such as high, large, or smooth. With respectto segment categories, coding was mutually exclusive; a seg-ment coded as a Feature could not be coded as a Process or anAppearance; however, code types within categories were notexclusive; an erosion Process could be coded as a depositionProcess as well, although this would be rare.
Responses in the information space condition were codedin a very similar way, with just a few of modifications. Process
and Feature categories were not coded into the articulatedset of natural processes and features described earlier forthe landscape condition; they were coded only as naturalor human processes and features. In addition, Process andFeature categories in the information space condition werecoded in terms of information processes and features, suchas writing or stories, instead of natural processes, such aserosion.
Coding responses into specific types within the three cat-egories of Process, Feature, and Appearance constituted thebulk of the coding we did to interpret participants’ records.In addition, for Question 1, we coded whether the displayreminded participants of a particular place, and if so, whetherit was a general type of place (e.g., “a mountainous area”) ora specific place token (e.g., “Boulder, Colorado”). For Ques-tion 10, we coded whether participants thought Location B orC was more similar to Location A, and whether they used theFirst Law of Geography (“Closer locations will be more simi-lar.”) (Tobler, 1970) to reason about the similarity of the sam-ples (If they did, they would presumably have answered “C.”)
We developed our coding system through a standarditerative process in which we started with some ideas forcategories and types based on our own expectations aboutwhat participants would write in response to each questionand what we would find relevant in these responses. Wemodified these ideas repeatedly to accommodate the contentof particular responses, and to increase the clarity and ease ofcoding. We established the reliability of our coding systemby having a subset of 12 randomly selected records codedindependently by two research assistants. We achieved aninterrater reliability of 71% on this subset of records beforewe completed coding of all of the records.
Results and Discussion
Landscape Condition
Looking first at the landscape condition, participants wrotea mean of 3.6 codable statements per question.This was ratherconsistent across questions, except for Question 1, in whichparticipants were asked if the landscape reminded them ofa particular place. This specific and concrete question led toonly 1.5 statements, on average. In fact, 8 of the 12 partici-pants said the landscape image did remind them of a particularplace. Half of these were specific places, including Hawaii,Switzerland, or the Santa Barbara Mountains; the other halfwere general types of places, including islands, volcanoes, ormountains.
Response statements were classified exclusively into cat-egories (i.e., each statement was classified into one and onlyone category). Participants made a mean of 1.3 Feature state-ments (36% of statements), 0.6 Process statements (18% ofstatements), and 1.6 Appearance statements (46% of state-ments) per question. As Table 1 indicates, this pattern ofcategories generally holds across questions, with three con-siderable exceptions. Question 1 is again unique; given thatit asks for a place or an object, 82% of replies were Features.
JOURNAL OF THE AMERICAN SOCIETY FOR INFORMATION SCIENCE AND TECHNOLOGY—February 2010 263DOI: 10.1002/asi

TABLE 1. Proportion of Statement Categories for each Question in Landscape Condition.
Questiona
1 2 3 4 5 6 7 8 9 10 Overall
Feature 0.82 0.44 0.31 0.36 0.45 0.35 0.35 0.30 0.37 0.14 0.36Process 0.03 0.18 0.36 0.11 0.15 0.19 0.19 0.14 0.08 0.24 0.18Appearance 0.15 0.38 0.33 0.53 0.40 0.47 0.46 0.56 0.55 0.63 0.46
Total Statements 1.5 3.1 3.0 4.4 4.8 3.7 4.8 4.2 3.7 2.8
Note. Because statement categories were coded exclusively, proportions within each question sum to 1.00, within the limits of rounding error.aQuestions are listed in Appendix A.
TABLE 2. Mean Proportions of Feature, Process, and Appearance Types for each Question in Landscape Condition.
Feature Process Appearance
a. human, urban 0.00 a. age related 0.08 a. color 0.01b. island, peninsula 0.07 b. altitude related 0.11 b. image height 0.27c. land, landscape (generic) 0.22 c. deposition 0.03 c. image location, distance 0.26d. lava 0.02 d. erosion, all types 0.35 d. shape 0.15e. local max (mountain, hill) 0.40 e. human 0.03 e. size, volume 0.15f. flat (plain, mesa) 0.00 f. other; generic natural process 0.18 f. texture 0.04g. saddle 0.02 g. plant, animal 0.03 g. width 0.11h. local min (valley, canyon) 0.11 h. tectonic, up-lift 0.11i. water body 0.16 i. volcanism, lava 0.08
Note. Proportions of statement type within each category, so proportions within each category sum to 1.00, within the limits of rounding error.
Question 3 asked about the meaning of the volume of theconcavities. Participants replied the highest proportion ofProcess statements, 36%, to this question. Finally, Question10 asked participants to compare the similarity of soil samplestaken at three point locations and explain their answer. Par-ticipants replied the lowest proportion of Feature statements,14%, and the highest proportion of Appearance statements,63%, to this question. We address these variations further inour examination of types of statements within each category.
We next considered the coded types within each cate-gory of statement in the landscape condition (Table 2). Themajority of Feature statements referred to local maxima(e.g., hills). Generic statements about land or landscape werenext, followed by statements about water. Statements aboutlocal minima were a distinct fourth. The preponderance ofstatements about local maxima over other types of featuresreplicates the findings of Montello et al. (1994), in a taskthat required participants to recall the content of topographicmaps or landscape photographs. The largest proportion ofProcess statements referred to erosional processes (overalland on 7 of 10 questions). Generic natural processes werenext, followed by tectonic statements and altitude-relatedstatements. The majority of Appearance statements referredeither to height on the image or to other aspects of locationon the image (e.g., distance or connectivity). Shape and sizewere the next most frequent statements.
We gain some further insights by separately examining thetypes of statements for each question. In general, participantsmentioned types that were asked about in the question. Forexample, 42% of participants mentioned an island featureon Question 1. This question asks about the identity of
the overall image; an island is a straightforward interpreta-tion of what the entire landmass is. Question 5 is the onlyimage to contain what looks like a lake, and 83% of partic-ipants referred to water on this question. Questions 4 and 7elicited large numbers of height responses, a property of theimages specifically asked about in those questions. Similarly,Questions 5 and 8 elicited many width statements, which iswhat those questions asked about. Notably, even when partic-ipants were asked about concavities (i.e., local minima), as inQuestions 3 to 5, most still mentioned the surrounding con-vexities (i.e., local maxima) even more so than they referredto the concavities (i.e., local minima). We noted earlier thatin response to Question 3 about the meaning of the volumeof the concavities, participants gave the highest proportion ofProcess statements. Apparently, this is because the volumeof the concavities asked about in this question, more thanany other question, suggested processes of erosion to respon-dents; 45% of them made an erosion statement in reply to thisquestion.
Question 10 is of special interest because it speaks directlyto the distance-similarity metaphor in landscape spatializa-tions. It asked participants to compare the similarity of soilsamples taken at three point locations and explain theiranswer. Specifically, participants were asked which soil sam-ple, “B” or “C,” is more similar to Sample “A” (see Figure 7).Participants gave the lowest proportion of Feature statements,14%, and the highest proportion of Appearance statements,63%, in response to this question. Looking at the typesof Appearance statements offered by participants, we find67% of participants gave statements about height, and 58%gave statements about location or distance. Height and/or
264 JOURNAL OF THE AMERICAN SOCIETY FOR INFORMATION SCIENCE AND TECHNOLOGY—February 2010DOI: 10.1002/asi

TABLE 3. Proportion of Statement Categories for each Question in Information Space Condition.
Questiona
1 2 3 4 5 6 7 8 9 10 Overall
Feature 0.83 0.27 0.22 0.21 0.32 0.25 0.17 0.15 0.15 0.08 0.26Process 0.00 0.30 0.38 0.23 0.15 0.16 0.25 0.18 0.15 0.16 0.20Appearance 0.17 0.43 0.40 0.56 0.53 0.59 0.58 0.67 0.70 0.76 0.54
Total Statements 1.6 2.7 2.7 3.6 3.7 4.2 3.0 3.9 2.4 3.0
Note. Because statement categories were coded exclusively, proportions within each question sum to 1.00, within the limits of rounding error.aQuestions are listed in Appendix A.
TABLE 4. Mean Proportions of Feature, Process, and Appearance Types for each Question in Information Space Condition.
Feature Process Appearance
a. human 0.15 a. human 0.24 a. color 0.01b. info about 0.06 b. information 0.68 b. image height 0.29
geographic places c. all natural 0.08 c. image location, distance 0.34c. info not about 0.12
geographic places d. shape 0.19d. natural features 0.35 e. size, volume 0.17
f. texture 0.01g. width 0.14h. centrality/periphery 0.17
Note. Proportions of statement type within each category, so proportions within each category sum to 1.00, within the limits of rounding error.
distance provided the major rationales for a particular answerto Question 10. Although caution must be taken in drawinga conclusion from 11 participants (One did not answer.), it isinteresting that 6 of the 11 said “C” was more similar to “A,”and 5 said “B” was more similar to “A.” This is not partic-ularly consistent with the distance-similarity metaphor, forwhich other research has found strong evidence (e.g., Mon-tello et al., 2003). For one, “C” is much closer to “A” than“B” is; yet, only about half the participants said it was moresimilar. Furthermore, while we expect distance statements asrationales for choosing the more similar pair, at least as manyparticipants actually provided height statements as rationales.Based on height, “B” and “C” should be considered aboutequally similar to “A,” which is what we found.
Information Space Condition
Turning next to the information space condition, partici-pants uttered a mean of 3.9 codable statements per question,about the same as that in the landscape condition. Again,this was fairly consistent across questions, except for Ques-tion 1, which led to only 1.6 statements on average. Alsolike the landscape condition, 8 of the 11 participants saidthe information space image did remind them of a particu-lar place. Again, about half said a specific place, includingthe Foothills of Northern/Central California, the Rockies,or the Los Angeles area, and the other half said a generaltype of place, including mountain ranges, islands, andcity/urban zones.
Response statements were again classified exclusively intocategories. Participants made a mean of 0.8 Feature state-ments (25% of statements), 0.6 Process statements (20% ofstatements), and 1.7 Appearance statements (55% of state-ments) per question. This is quite similar to the breakdownin the landscape condition. As Table 3 indicates, this pat-tern of categories again generally holds across questions,with three considerable exceptions. Question 1 again elicitsa very high proportion of Feature statements, 83%. Question3 about the volume of the concavities again elicited the high-est proportion of Process statements, 38%. Finally, also likethe landscape condition, Question 10 about the similarity ofinformation samples taken at three point locations elicitedthe fewest Feature statements, 8%, and the most Appearancestatements, 76%.
We next considered the coded types within each categoryof statement in the information space condition (Table 4).these types were substantially different than those in thelandscape condition and are not completely comparable.However, we can see that 15% of participants referred tohuman features, which none did in the landscape condition.Fully 35% of participants referred to natural information fea-tures in the information space condition, which suggests alikely confusion between abstract information spaces and theconcrete physical landscapes being used to depict them. Thegreat majority of Process statements referred to “informa-tional” processes (e.g., “more news stories in the center thanin the periphery” or “more people are informed about newsstories” in one area compared to another, or one area “gath-ered more news” than another). Human processes were fairly
JOURNAL OF THE AMERICAN SOCIETY FOR INFORMATION SCIENCE AND TECHNOLOGY—February 2010 265DOI: 10.1002/asi

FIG. 7. Screenshot from Question 10, showing hypothetical soil (information) Samples “B” and “C” to be compared to Sample “A” for similarity.
common as well, being offered by 24% of participants. Natu-ral processes of any kind were rarely mentioned. Height andlocation statements were again the most common Appear-ance statements, and shape and size were again quite frequent.Interestingly, a spatial concept that had not been mentioned inthe landscape condition—centrality/periphery—surfacedin participants’ answers in the information spacecondition.
We next separately examined the types of statements foreach question in the information space condition. As in thelandscape condition, participants clearly tended to mentiontypes asked about in the question. Questions 4 and 7 againelicited large numbers of height responses, a property of theimages specifically asked about in those questions. Simi-larly, Questions 5 and 8 again elicited many width statements,which is what those questions asked about. But in this condi-tion, natural features were intended to be metaphorical ratherthan literal, suggesting that a focus on natural landscapefeatures and processes constitutes confusion in interpret-ing the spatialization. For example, 55% of participants inthe information space condition mentioned a natural fea-ture (usually an island, as in the landscape condition) onQuestion 1, but only 36% mentioned an information feature(e.g., news stories), and these were all said to be informationabout geographic features or places. In fact, to all but twoof the questions, participants mostly provided natural fea-tures as descriptions of their interpretations of the spatializedimages. On no question did a majority of participants provideother types of features, including information features. This istrue even though the questions asked participants to interpret
“information spaces” and said nothing about landscape, ter-rain, and so on. Questions also asked participants to interpret“information processes,” and this did elicit more statementsabout information processes, such as writing news stories,than statements about natural processes, such as erosion.On all but two questions, information processes were themost commonly listed. On no question did more than 10%of participants mention natural processes. In other words,participants are neither familiar with the true nature of geo-morphic processes (e.g., more information is accumulated inthe valley) nor do they share commonsense/naïve ideas abouttopography as suggested by designers (e.g., higher mountainmeans more information).
Question 10 again asked participants to compare the rela-tive similarity of two pairs of points located in the informationspace. Participants were asked which information sample,“B” or “C,” is more similar to Sample “A” (Figure 7).As com-pared to the landscape condition, participants gave an evenlower proportion of Feature statements, 8%, and a higherproportion of Appearance statements, 76%, in response tothis question. Looking at the types of Appearance statementsoffered, we found that all participants mentioned relativelocation, but a full 73% mentioned height.As in the landscapecondition, height and distance provided the major rationalesfor answers to Question 10. In this condition, we find that 8 of11 participants said “C” was more similar to “A,” while only3 participants said “B” was more similar to “A.” Althoughthis is a small sample, it appears to more consistently reflectthe distance-similarity metaphor; the two information pointscloser in planimetric distance are seen as more similar. Still,
266 JOURNAL OF THE AMERICAN SOCIETY FOR INFORMATION SCIENCE AND TECHNOLOGY—February 2010DOI: 10.1002/asi

we found that a clear majority of participants did mentionheight as a rationale for deciding on similarity, as in thelandscape condition.
Conclusions and Outlook
In this article, we examined the explanatory theories thatthe landscape metaphor suggests to lay users for accessinginformation in a document archive. Information visualiza-tion designers seem to have commonsense or naïve ideasabout topography that do not reflect a valid comprehen-sion of geomorphological processes, at least as expressed incurrent scientific understanding. Our empirical results sug-gest that the landscape metaphor is not as self-evident asinformation designers seem to believe, and like visualizationdesigners, lay users reveal a similar naïve understanding ofgeomorphological structures and processes. Moreover, thiscommonsense or experiential understanding of geomorphol-ogy and landscapes (Egenhofer & Mark, 1995) does nottransfer well to spatialized views for lay people. Our resultssuggest that naïve users have difficulty interpreting and fullygrasping the spatial metaphor for information visualization.In one sense, the metaphor is taken literally, as most par-ticipants mention islands, mountains, and so on, even afterthey have been specifically told that the display is an abstractinformation space of new stories. On the other hand, oncethe abstract news concept is applied, it is mixed with naïveconceptions about landscape forms.
Geographic space is not only characterized by phys-ical or geometric principles but also carries experientialmeaning, reflected in people’s knowledge structures (Lakoff,1987; Lakoff & Johnson, 1980) and manifested in perceptual(Gibson, 1979) and cognitive (Kuhn & Blumenthal, 1996;Norman, 1988) affordances. Perhaps the natural landscape,as one type of space, does not provide enough familiarityfor human experience, as is suggested by the commonsense(naïve) geomorphology understanding of lay people, whichis not congruent with the current scientific understanding. Alack of familiarity with the source domain seems to resultin metaphorical mappings that do not structure the targetdomain well enough, and thus the resulting mapping hierar-chy seems too shallow for generating the intended meaning.An emphasis on the physical landscape conceptualized as acontinuous field might be one problem. If humans have greatdifficulty dealing with continuous phenomena, then repre-senting continuous properties of space in a discrete mannerwould be cognitively more adequate because this is howhumans make sense of the environment (Rosch, 1973). Forthis reason, and because we believe that an urban environmentmight be more familiar to naïve users, we have transformedthe source data employed for this natural landscape studyinto a discrete-looking representation, simulating an urbanlandscape. We plan to report on the collected empiricaldata from the urban landscape experiment in a follow-uppublication.
How then do terrain metaphors work, if indeed they do,given that neither the designers nor the users appear to
know how terrain really is shaped? We contend that accu-rate and complete process knowledge is not required for ametaphor to work. Instead, we believe the explanation ismuch simpler than the mechanism suggested by Wise andother information visualizers (e.g., Boyack et al., 2002a,2002b). Clearly, users’understanding of terrain visualizationsis not based on universal understanding of the true processesthat have shaped the landscape into hills and valleys, moun-tains, and canyons. It also appears that interpretations ofdisplays are not consistently based on commonsense under-standings of the present-day functions of topographic forms,where again we might predict that users would think thatlarger valleys would collect more water and feed larger rivers.
Instead, we believe that terrain metaphors work because ofa very basic understanding of the world, in no sense specificto geomorphological landscapes. Everyday experience withmanipulable tabletop spaces is extended metaphorically to awide variety of domains of other spatial scales. From this vari-ety of experiences, typically related to everyday activities andinteractions with the world, people naturally assume, oftencorrectly, that higher is more and that bigger is more (Lakoff,1987). A higher mountain requires more effort to climb it. Ahigher book pile needs more effort to construct or will takelonger to produce. Bigger things are not only made of morestuff but also require more effort, more strength, and moreactivity to deal with. If we removed two rocky hills by quarry-ing the rock, we would get more crushed rock from the largerhill than we could from the smaller one, and it also would takelonger for the bigger one. This is so obvious that it is hardly ametaphor in itself, and it is metaphorically extended to a vari-ety of abstract domains. For example, greater value is readilymapped onto higher position in graphs of nonspatial data,and size has long been recognized as a fundamental graphicvariable to represent quantity by cartographers and graphicdesigners (Bertin, 1967; Dent, 1999; Flannery, 1956). Theproperty of more is readily mapped onto higher in linguis-tic expressions (e.g., Gattis, 2001), and social dominance issometimes associated with a location that is literally higher(Keating, 1995).
To follow the Gibsonian argument, it is perhaps not“innate” interpretations humans have about landscape formsand processes that make spatial metaphors useful for informa-tion visualization but the potential affordances that (physicalor cultural) landscapes generate for human activities in andinteractions with space. In fact, some may argue that it isthe grounding of virtual activities in and interactions withvirtual information spaces, or more generally computer inter-faces (target domain), on real activities and interactions in thereal world (source domain) that is the basis of a successfulmetaphorical mapping (Kuhn & Blumenthal, 1996; Norman,1988). Such activities include moving along a path, climbingup a hill, recognizing landforms, manipulating objects, flyingover a landscape, and so on.
In empirical experiments on spatialized views where par-ticipants were told at the beginning of the test sessions thatthe landscapes were not a representation of geographic ter-rain but of a library archive, Fabrikant (2001a) recorded user
JOURNAL OF THE AMERICAN SOCIETY FOR INFORMATION SCIENCE AND TECHNOLOGY—February 2010 267DOI: 10.1002/asi

comments such as, “it is shorter to hike from the valley tothis mountain than to that one over there,” or “oh, the sun hasjust gone down” (reacting to the addition of relief shading inthe view). These statements clearly suggest that participantswere responding to test questions as if they were exploring areal-world environment.
One aspect of landscape perception that is potentially rel-evant, but that the information visualization community hasnot investigated much, concerns aesthetic responses to land-scapes. One could argue that when people are attracted toa pleasing-looking display, they might perform better with itbecause they would attend to it more. Kaplan (1992) reviewedliterature suggesting that humans prefer landscapes that arewell-balanced between order and uncertainty, involving fac-tors such as coherence, complexity, and mystery. Complexityof the environment is of particular relevance when humansengage directly with the environment (e.g., while explor-ing it). Aesthetic satisfaction is produced when the complexenvironment becomes legible for an observer, and when itgenerates mystery for the human explorer.
Finally, many information-display designers reason thatsince we live in a three-dimensional visual world, we shouldbe able to convey more information in displays that take fulladvantage of all three spatial dimensions of vision rather thanrestricting ourselves to just two (Wise, 1999); however, tothis day, there has been little empirical evidence whether apotential information increase afforded by adding an addi-tional (i.e., third) display dimension outweighs the potentialincreased costs (cognitive, perceptual, and technological)caused by more resource-demanding three-dimensional dis-plays (Ware, 2008; Westerman, Collins, & Cribbin, 2005).Based on our ongoing experiments, we believe that addingthe third dimension will actually detract somewhat frompeople’s ability to see similarity relationships in spatializeddisplays. This is because people map document similarityonto interposing distance, as we have shown in prior work(Montello et al., 2003), and because the third dimension ofdepth is perceived so differently than the “fronto-parallel”dimensions of width and height. Our ongoing results leadus to conclude that a potential information increase affordedby adding an additional (i.e., third) display dimension doesnot outweigh the increased perceptual costs caused by moreresource-demanding three-dimensional displays (Fabrikant,Montello, & Neun, 2008).
Acknowledgments
We thank Jeff Onsted for help with data collection, andJim Rumbley and Natalie Campos for help with data coding.We also thank the National Geospatial-Intelligence Agency(NMA-201–00–1–2005) for financial support.
References
Amedeo, D.M., & Golledge, R.G. (2003). Environmental perception andbehavioral geography. In G.L. Gaile & C.J. Willmott (Eds.), Geographyin America at the dawn of the 21st century (pp. 133–148). Oxford, NewYork: Oxford University Press.
Benford, S., Snowdon, D., & Mariani, J. (1995). Populated information ter-rains: First steps. In R.A. Earnshaw, J.A. Vince, & H. Jones (Eds.), Virtualreality application (pp. 27–39). London: Academic Press.
Bertin, J. (1983). Semiology of Graphics. Madison, WI: University ofWisconsin Press.
Bertin, J. (1967). Sémiologie Graphique: Les Diagrammes–les Réseaux–lesCartes. Paris: Mouton.
Börner, K., Chen, C., & Boyack, K.W. (2003). Visualizing knowledgedomains. Annual Review of Information Science and Technology, 37,179–255.
Boyack, K.W., Wylie, B.N., & Davidson, G.S. (2002a). Domain visualiza-tion using VxInsight for science and technology management. Journalof the American Society for Information Science and Technology, 53(9),764–774.
Boyack, K.W., Wylie, B.N., & Davidson, G.S. (2002b). Information visual-ization, human–computer interaction, and cognitive psychology: Domainvisualizations. In C. Chen (Ed.),Visual interfaces to digital libraries [JCDLWorkshop]. Lecture Notes in Computer Science, 2539, 145–160. Berlin:Springer Verlag.
Card, S.K., Mackinlay, J.D., & Shneiderman, B. (1999). Readings in infor-mation visualization. Using vision to think. San Francisco: Kaufmann.
Card, S.K., Robertson, G.G., & Mackinlay, J.D. (1991). The informationvisualizer, and information workspace. Proceedings of CHI ’91 (pp. 181–188). New Orleans, LA.
Chalmers, M. (1993). Using a landscape metaphor to represent a corpusof documents. In A.U. Frank & I. Campari (Eds.), Spatial informationtheory. A theoretical basis for GIS. Lecture Notes in Computer Science,716, 377–390. Berlin: Springer.
Chalmers, M. (1995, March 27–29). Design perspectives in visualizingcomplex information. Proceedings of the IFIP 3rd Visual DatabasesConference (pp. 103–111). Lausanne, Switzerland.
Chalmers, M., & Chitson, P. (1992, June 21–24). Bead: Explorations ininformation visualization. Proceedings of the Conference on Researchand Development in Information Retrieval (pp. 330–337). Copenhagen,Denmark.
Couclelis, H. (1998). Worlds of information: The geographic metaphor inthe visualization of complex information. Cartography and GeographicInformation Systems, 25(4), 209–220.
Davidson, G.S., Hendrickson, B., Johnson, D.K., Meyers, C.E., & Wylie,B.N. (1998). Knowledge mining with VxInsight: Discovery throughinteraction. Journal of Intelligent Information Systems, 11(3), 259–285.
Dent, B.D. (1999). Cartography: Thematic map design. Dubuque, IA:Brown.
Dieberger, A., & Frank, A.U. (1998). A city metaphor for supporting navi-gation in complex information spaces. Journal of Visual Languages andComputing, 9, 597–622.
Dodge, M., & Kitchin, R. (2000). Mapping cyberspace. London: Routledge.Döllner, J. (2005). Geovisualization and real-time 3D computer graph-
ics. In J. Dykes, A.M. MacEachren, & M.-J. Kraak (Eds.), Exploringgeovisualization (pp. 325–343). Amsterdam: Elsevier.
Dourish, P., & Chalmers, M. (1994, August). Running out of space: Mod-els of information navigation (Short paper). Paper presented at Peopleand Computers IX, Human–Computer Interaction Conference, Glasgow,United Kingdom. Retrieved October 5, 2009, from http://www.dcs.gla.ac.uk/∼matthew/papers/hci94.pdf
Egenhofer, M.J., & Mark, D.M. (1995). Naive geography. In A.U. Frank &W. Kuhn (Eds.), Spatial information theory: A theoretical basis for GIS(pp. 1–15). Berlin: Springer.
Fabrikant, S.I. (2000). Spatialized browsing in large data archives. Transac-tions in GIS, 4(1), 65–78.
Fabrikant, S.I. (2001a). Evaluating the usability of the scale metaphor forquerying semantic information spaces. In D.R. Montello (Ed.), Spatialinformation theory: Foundations of geographic information science. Pro-ceedings of the Conference on Spatial Information Theory, Lecture Notesin Computer Science, 2205, 156–171. Berlin: Springer Verlag.
Fabrikant, S.I. (2001b). Visualizing region and scale in semantic spaces.Proceedings of the 20th International Cartographic Conference (pp. 2522–2529). Beijing, China.
268 JOURNAL OF THE AMERICAN SOCIETY FOR INFORMATION SCIENCE AND TECHNOLOGY—February 2010DOI: 10.1002/asi

Fabrikant, S.I., & Buttenfield, B.P. (2001). Formalizing semantic spaces forinformation access. Annals of the Association of American Geographers,91(2), 263–280.
Fabrikant, S.I., Montello, D.R., & Neun, M. (2008, September). Evaluating3D point-display spatializations (Extended Abstract). Paper presented atGIScience, Park City, UT (CD-ROM).
Fabrikant, S.I., & Skupin,A. (2005). Cognitively plausible information visu-alization. In J. Dykes,A.M. MacEachren, & M.J. Kraak, (Eds.), Exploringgeovisualization (pp. 667–690). Amsterdam: Elsevier.
Flannery, J.J. (1956). The graduated circle: A description, analysis, and eval-uation of a quantitative map symbol. Unpublished dissertation, Universityof Wisconsin, Madison.
Gattis, M. (Ed.). (2001). Spatial schemas and abstract thought. Cambridge,MA: MIT Press.
Gibson, J.J. (1979). The ecological approach to visual perception. Boston:Houghton Mifflin.
Golledge, R.G., & Stimson, R.J. (1997). Spatial behavior: A geographicperspective. New York: Guilford Press.
Granö, J.G. (1929/1997). Pure geography (M. Hicks, Trans.). Baltimore:Johns Hopkins University Press.
Hayes, P.J. (1978). The naive physics manifesto. In D. Michie (Ed.), Expertsystems in the microelectronic age (pp. 242–270). Edinburgh, Scotland:Edinburgh University Press.
Hoffman, R.R., & Pike, R.J. (1995). On the specification of the informationavailable for the perception and description of the natural terrain. In P.A.Hancock, J. Flach, J.K. Caird, & K. Vicente (Eds.), Local applications ofthe ecological approach to human–machine systems (Vol. 2, pp. 285–323).Hillsdale, NJ: Erlbaum.
Ishikawa, T., & Kastens, K. (2005). Why some students have trouble withmaps and other spatial representations. Journal of Geoscience Education,53, 184–197.
Johnson, M. (1987). The body in the mind: The bodily basis of meaning,imagination, and reason. Chicago: University of Chicago Press.
Johnston, R.J., Gregory, D., & Smith, D.M. (Eds.). (1993). The dictionaryof human geography (2nd ed.). Oxford, England: Blackwell.
Kaplan, S. (1992). Environmental preference in a knowledge-seeking,knowledge-using organism. In J.H. Barkow, L. Cosmides, & J. Tooby(Eds.), The adapted mind: Evolutionary psychology and the generation ofculture (pp. 581–598). New York: Oxford University Press.
Keating, E. (1995). Spatial conceptualizations of social hierarchy in Pohnpei,Micronesia. In A.U. Frank & W. Kuhn (Eds.), Spatial information theory:A theoretical basis for GIS (pp. 463–474). Berlin: Springer.
Kuhn, W. (1993). Metaphors create theories for users. In I. Campari (Ed.),Spatial information theory. A theoretical basis for GIS. Proceedings of theConference on Spatial Information Theory. Lecture Notes in ComputerScience, 716, 366–376. Berlin: Springer.
Kuhn, W., & Blumenthal, B. (1996). Spatialization: Spatial metaphors foruser interfaces. Department of Geoinformation, Technical University ofVienna, Vienna.
Lakoff, G. (1987).Women, fire, and dangerous things:What categories revealabout the mind. Chicago: University of Chicago Press.
Lakoff, G., & Johnson, M. (1980). Metaphors we live by. Chicago: Universityof Chicago Press.
Longley, P.A., Goodchild, M.F., Maguire, D.J., & Rhind, D.W. (2005).Geographical information systems and science. New York: Wiley.
Mariani, J., Rodden, T., Coleboume, A., Palfreyman K., & Smith, G. (1994).Q-PIT: A populated information terrain. Proceedings of the Symposiumon Electronic Imaging: Science & Technology (pp. 12–22). San Jose, CA.
Mark, D.M., & Turk, A.G. (2003). Landscape categories in Yindjibarndi:Ontology, environment, and language. In W. Kuhn, M. Worboys, &S. Timpf (Eds.), Spatial information theory: Foundations of geographicinformation science. Berlin: Springer-Verlag, Lecture Notes in ComputerScience, 2825, 31–49.
Mark, D.M., Turk, A.G., & Stea, D. (2007). Progress onYindjibarndi Ethno-physiography. In S. Winter, M. Duckham, L. Kulik, & A. Kuipers (Eds.),
Spatial information theory. Lecture Notes in Computer Science, 4736,1–19. Berlin: Springer-Verlag.
Martin, G.J., & James, P.E. (1993). All possible worlds: A history ofgeographical ideas (3rd ed.). New York: Wiley.
McCloskey, M., & Kohl, D. (1983). Naive physics: The curvilinear impe-tus principle and its role in interactions with moving objects. Journal ofExperimental Psychology: Learning, Memory, and Cognition, 9, 146–156.
Minsky, M. (1988). The society of mind. New York: Simon and Schuster.Montello, D.R., Fabrikant, S.I., Ruocco, M., & Middleton, R.S. (2003). Test-
ing the first law of cognitive geography on point-display spatializations.In W. Kuhn, M.F. Worboys, & S. Timpf (Eds.), Spatial information the-ory: Foundations of geographic information science. Proceedings of theConference on Spatial Information Theory. Lecture Notes in ComputerScience, 2825, 316–331. Berlin: Springer.
Montello, D.R., Sullivan, C.N., & Pick, H.L. (1994). Recall memory fortopographic maps and natural terrain: Effects of experience and taskperformance. Cartographica, 31, 18–36.
Norman, D. (1988). The psychology of everyday things. New York: BasicBooks.
Perozzo, L. (1880). Della reppresentazione graphica di una collettività diindividui nella successione del tempo [Of the graphic representation of acollection of individuals over time]. Annali di Statistica, 12, 1–16.
Rennison, E. (1994). Galaxy of news: An approach to visualizing andunderstanding expansive news landscapes. Proceedings of the ACM Sym-posium on User Interfaces Software and Technology (pp. 3–12). MarinaDel Ray, CA.
Robinson, A.H. (1961). The cartographic representation of the statisticalsurface. International Yearbook of Cartography, 1, 53–61.
Rosch, E.H. (1973). Natural categories. Cognitive Psychology, 4, 328–350.Scharnhorst, A. (2000). Evolution in adaptive landscapes—Examples of
science and technology development. Discussion Paper FS II 00–302.In F. Havemann & H. Kretschmer (Eds.), Collaboration in science(pp.118–142). Berlin, Germany: Gesellschaft fürWissenschaftsforschung.
Skupin, A., & Fabrikant, S.I. (2003). Spatialization methods: A carto-graphic research agenda for non-geographic information visualization.Cartography and Geographic Information Science, 30, 95–119.
Smith, B., & Mark, D.M. (2003). Do mountains exist? Towards an ontologyof landforms. Environment and Planning B: Planning and Design, 30,411–427.
Sparacino, F., Pentland, A., Davenport, G., Hlavac, M., & Obelnicki, M.(1997). City of news. Paper presented at Ars Electronica, Linz, Austria.Retrieved October 5, 2009, from http://ic.media.mit.edu/Publications/Conferences/CityOfNewsArs/HTML/
Summerfield, M. (1991). Global geomorphology. Harlow, United Kingdom:Pearson.
Tobler, W.R. (1970). A computer movie simulating urban growth in theDetroit region. Economic Geography, 46(2), 234–240.
Tuan, Y.-F. (1974). Topophilia: A study of environmental perception,attitudes, and values. Englewood Cliffs, NJ: Prentice-Hall.
Vosniadou, S., & Brewer, W.F. (1992). Mental models of the earth: Astudy of conceptual change in childhood. Cognitive Psychology, 24,535–585.
Ware, C. (2008). Visual thinking for design. San Francisco: Kaufmann.Westerman, S.J., Collins, J., & Cribbin, T. (2005). Browsing a document
collection represented in two- and three-dimensional virtual informa-tion space. International Journal of Human–Computer Studies, 62(6),713–736.
Wise, J.A. (1999). The ecological approach to text visualization.Journal of the American Society for Information Science, 50,1224–1233.
Wise, J.A., Thomas, J.J., Pennock, K., Lantrip, D., Pottier, M., Schur, A., &Crow, V. (1995). Visualizing the non-visual: Spatial analysis and inter-action with information from text documents. In N. Gershon & S. Eick(Eds.), Proceedings of IEEE Information Visualization (pp. 51–58). LosAlamitos, CA: IEEE Computer Society Press.
JOURNAL OF THE AMERICAN SOCIETY FOR INFORMATION SCIENCE AND TECHNOLOGY—February 2010 269DOI: 10.1002/asi

Appendix A
Questions Answered by Participants in Both Conditions
1. Does this landscape (information space) remind you of aparticular place?
2. What does the volume of the convexities mean to you, ifanything, considering the natural (information) processesshaping this landscape (information space)?
3. What does the volume of the concavities mean to you, ifanything, considering the natural (information) processesshaping this landscape (information space)?
4. Compare the depths of concavity A to B. What can yousay about their depths, if anything, with respect to theland (information) represented in the display at locationsA and B? What type of natural (information) feature dothe shapes of A and B remind you of, if any? What doesthis depth difference mean to you, if anything, consideringthe natural (information) processes shaping this landscape(information space)?
5. Compare the width of concavity A to B. What does thiswidth difference mean to you, if anything, consideringthe natural (information) processes shaping this landscape(information space)? What do the shapes of A and Bremind you of, if anything?
6. Consider the two convexities labeled A and B. How couldyou describe the surface between A and B? What type ofnatural (information) feature does the shape between Aand B remind you of, if anything? What does this shapemean to you, if anything, considering the natural (infor-mation) processes shaping this landscape (informationspace)?
7. Compare the heights of convexity A to B. What can yousay about their heights, if anything, with respect to theland (information) represented in the display at locationsA and B? What type of natural (information) feature dothe shapes of A and B remind you of, if any? What doesthis height difference mean to you, if anything, consideringthe natural (information) processes shaping this landscape(information space)?
8. Compare the width of convexity A to B. What does thiswidth difference mean to you, if anything, consideringthe natural (information) processes shaping this landscape(information space)? What do the shapes of A and Bremind you of, if anything?
9. Consider the places labeled A and B. What can you say, ifanything, about their relative locations with respect to thelandscape (information space)?
10. Imagine taking a soil (information) sample at locations A,B and C. Your task is to compare the soil (information)composition of B and C with respect to A. Which soil(information) sample, B or C, would be more similar toA? Why?
Note. Text inside parentheses presents the wording usedin the information space condition, as an alternative to thewording in the landscape condition.
Appendix B:Types Coded Within Each StatementCategory
Landscape Condition
Feature Types1-human, urban2-island, peninsula3-land, landscape (generic)4-lava5-local max (mountain, hill, etc.)6-flat (plain, mesa)7-saddle, natural dam8-local min (valley, canyon, etc.)9-water body
Process Types1-age related2-altitude related3-deposition, accumulation4-erosion (all types)5-human6-natural processes not in other categories7-plant, animal8-tectonic movement, up-lift9-volcanism (flowing lava)
Appearance Types1-color2-higher on image3-relative location (distance, etc.)4-shape5-size6-texture7-width
Information Space Condition
Feature Types1-human, urban2-information (documents, stories, files) about geographicfeatures/places3-information (documents, stories, files) not about geo-graphic features/places4-natural features
Process Types1-human process2-information processes (writing, etc.)3-natural process
Appearance Types1-centrality/periphery2-color3-higher, lower elevation, depth4-relative location (distance, etc.)5-shape6-size7-texture8-width
270 JOURNAL OF THE AMERICAN SOCIETY FOR INFORMATION SCIENCE AND TECHNOLOGY—February 2010DOI: 10.1002/asi