the nature of minimum wages and their effectiveness as a wage floor in costa rica, 1976–1991
TRANSCRIPT

Pergamon
World Development, Vol. 23, No. 8, pp. 1439-1458, 1995 Elsevier Science Ltd
Printed in Great Britain
0305-750)3(95)00047-x
The Nature of Minimum Wages and Their Effectiveness as a Wage Floor in Costa Rica, 1976-91
T. H. GINDLING University of Maryland Baltimore County, U.S.A.
and KATHERINE TERRELL*
University of Pittsburgh, U.S.A.
Summary. - This study describes Costa Rica’s complex minimum wage system and its evolution over 1976-91, examines the trend in minimum wage to average wage in eight industries, and compares the num- ber and characteristics of workers who earn below the minimum wage over these 16 years in the covered and uncovered sectors. We conclude that noncompliance is a major problem. On average one-third of the workers in the legally covered sector earn below the minimum wage over this period. Moreover, the same proportion earns below the minimum wage in the uncovered sectors. This evidence indicates that the law may fail its intent of assuring an adequate salary to workers without bargaining power.
1. INTRODUCTION
Minimum wages are set with the intent of protect- ing vulnerable workers from the viscitudes of the mar- ket. The degree of the intended protection afforded by a government and the actual level of protection vary from country to country. In many developing coun- tries minimum wages are set relatively high, giving the impression of high protection. Yet, if employers reduce employment as wages rise, strict enforcement of minimum wages would result in high unemploy- ment. In fact, most governments in developing coun- tries appear not to enforce strict compliance with minimum wages.
In this paper we present a detailed analysis of the effectiveness of the minimum wage as a wage floor in a developing country that has earned particularly high marks for its demonstrated concern for labor - Costa Rica. Our methodology is to compare the number and characteristics of workers earning below the minimum wage in the legally covered and uncovered sectors of eight industries over 1976-91. If minimum wages are an effective floor, there should be only a small per- centage of workers earning below the minimum in the covered sector, and at the very least, this percentage should be smaller than the percentage in the uncov- ered sectors.’
Costa Rica is also particularly interesting as a case study because it has had an extremely complicated minimum wage system which has been simplified substantially over the years. An important question
that we also address is whether the simplification has improved employer compliance with the minimum wage.
2. DESCRIPTION OF THE MINIMUM WAGE SYSTEM IN COSTA RICA
Legal minimum wages are generally considered to be an important labor market institution in the private sector in Costa Rica.z Minimum wage legislation has three stated purposes: (a) to promote “the material, moral and cultural” necessities of the workers (Cd&go de Trabajo, 1990, p. 56); (b) “to assure a minimum salary to worker groups that do not have an organiza- tion strong enough to negotiate their salaries through collective bargaining” (Naranjo, 1985, p. 23) and (c) to improve income distribution by reducing interindustry and occupational differences in wages (Gregory, 198 1).
* The authors would like to thank FatmaEl-Hamidi for carc- ful research assistance, Orlando Garcia of the Salary Division of the Costa Rican Ministry of Labor and Social Security for the minimum wage data, and the participants of the International Conference on “Economic Analysis of Low Salaries and the Effects of the Minimum Wage” (Aries, France) for their comments. The data analyzed in this paper are used with the permission of the Costa Rican General Directorate of Statistics. Ministry of Labor and Social Security. Final revision accepted: March 15, 1995.
1439

1440 WORLD DEVELOPMENT
Minimum wages are set by the National Salary Council, composed of three representatives from each of three groups: the central government (including the president of the council), worker groups, and employer organizations (Cardoso-Rojas, 1991). The nine mem- bers are appointed to four-year terms by the central government. While mandated to consider a variety of factors in its decisions (inflation, national consump- tion, balance of payments, productivity and exports), the National Salary Council need not do so in any spe- cific or systematic way (Lom and Lizano, 1976).
The process of setting minimum wages is generally a public one, with each of the three groups publicizing their demands to the press. During the economic crisis and subsequent structural adjustment program in the 198Os, the worker and employer groups lost influence, with a consequent increase in the power of the central government to set wages (Cardoso-Rojas, 1991). At pre- sent, the government continues to have a greater influ- ence in setting minimum wages than the other groups.
The structure of minimum wages in Costa Rica is complex. As recently as 1980 there were approxi- mately 350 minimum wages, set by industrial classifi- cations (about 130) and occupational categories (up to nine within each industrial classification). This struc- ture was created in part to achieve the goal of improv- ing income distribution by reducing wage disparities between the industry/occupation categories. In addi- tion, over the years the National Salary Council has systematically increased the lowest minimum wages by a larger percentage than the highest minimum
wages. In 1988 the number of minimum wage cate- gories was reduced to about 200 and in 1990 there was further simplification to about 80 categories.
The timing of adjustments to the minimum wage is partially determined by the rate of inflation. During 1949-74 minimum wages were set every two years as inflation was low and constant. In 1974, in response to the accelerating inflation (a new phenomenon in Costa Rica), the Council began to adjust minimum wages yearly and to implicitly use the Consumer Price Index (CPI) of the lower middle-income families in the Metropolitan Area of San JosC as a guide.
During 1979-82 Costa Rica experienced its worst recession since the 193Os, accompanied by rapid infla- tion. (See Table 1 for selected macroeconomic indica- tors.) As a result, in 1980, minimum wages began to be revised at least twice a year. During 1980-82 the minimum wage was, implicitly at least, indexed to the change in the price level since the last adjustment. Under such a lagged adjustment mechanism, acceler- ating inflation (such as Costa Rica experienced from 1980 to mid-1982) led to falling real minimum wages3 Real minimum wages fell each adjustment period from 1980 to April, 1982 (Figure 1).
In mid- 1982, the new government of Luis Albert0 Monge (1982-86), as part of the “loo-day plan” of economic recovery, explicitly increased the minimum wage at a faster rate than the rate of inflation (Rovira and Trejos, 1985). As seen in Figure 1, from April 1983 to January 1986 the real minimum wage increased on average each adjustment period.
Table 1. Selected macroeconomic and labor market indicators (for July of each year)
Year GDP* Inflation rate (%):
Employed workers+ (000’S)
Average Unemployment
Rate+
Average earnings of
salaried employees$
1976 1977 1978 1979 1980 1981 1982 1983 1984 1985 1986 1987 1988 1989 1990 1991
7885.1 3.5 8586.9 4.2 9125.1 6.0 9575.8 9.2 9647.8 18.1 9429.6 37.7 8742.6 90. I 8992.9 32.6 9714.5 12.0 9784.6 15.1
10326.3 II.8 10817.8 16.9 I 1189.6 20.8 11823.6 16.5 12244.5 19.0 12521.1 28.7
617 6.2 653 4.6 687 4.5 707 4.9 725 5.9 726 8.8 760 9.3 768 9.0
8;; 61; 892 5.9 941 5.6 970 5.5 987 3.9
1017 4.6 1006 5.5
1080 1287 1307 1409 I346 II39 843
1037
12;: 1276 1491 1427 1436 1506 1402
* Source: Central Bank of Costa Rica. In millions of 1966 colons. t Source: Central Bank of Costa Rica. f Source: Household Surveys of Employment and Unemployment, July. Salaried employees are those workers paid by employers (workers who are neither self-employed, nor owners nor unpaid family workers). The earnings are in 1976 colons; they were deflated with the annual average value of the CPl for low and middle-income households in San Jost.

MINIMUM WAGE IN COSTA RICA 1441
Source: Minimum wage legislation, the Ministry of Labor (Division of Salaries) and Central Bank of Costa Rica (for the consumer price index for low and medium-income households in San JosC)
Figure 1. Wages in Costa Rica. 1976-91
In August 1986 the real minimum wage fell sharply. Accelerating inflation may have contributed to this fall. Some have suggested that it was a policy of the Arias administration (1986-90) to lower real minimum wages (see Cardozo, 1990). On average, the minimum wage continued at this lower level until 1991, falling slightly between August 1986 and August 1988, rising slightly between August 1986 and August 1990.
The opposition candidate for president in 1989, Rafael Calderon, campaigned on a platform of recov- ering real wage levels lost during the last years of the Areas administration (CEPAS, 1989). When in power, the new Calderon administration (1990-94) indeed increased minimum wages more rapidly than the infla- tion rate in January 1990. The next adjustments were not as large, however, and by June 1991 the real min- imum wage was approximately the same level as in August 1989 (see Figure 1).
All full-time private sector employees (paid work- ers) are legally covered by minimum wages.4 A sig- nificant portion of the private-sector labor force however, is not legally covered by minimum wages. For example, because of the way minimum wages are specified, part-time workers are not covered and self- employed workers are exempt. There are low penal- ties for violating minimum wage laws and relatively few minimum-wage inspectors in the Ministry of Labor (Lopez, 1981). Nevertheless, we expect the workers and their unions enforce minimum wages to some extent.
3. DATA AND METHODOLOGY
In this paper we estimate the number of workers earning below the minimum wage in Costa Rica, both legally and illegally. We use the Household Surveys of
Employment and Unemployment, conducted by the Costa Rican General Directorate of Statistics and the Ministry of Labor to calculate workers’ wages and we compare these to the legislated minimum wages.’ Because the detailed industry and occupation cate- gories reported in the Household Surveys do not corre- spond exactly to the industry and occupation categories in the minimum wage legislation, we are unable to carry out comparisons with all the minimum wage categories. We have instead confined our analysis to estimating the number of workers earning below the lowest minimum wage (LMW) in each industry, at the one digit level of classification.6 These eight categories are: agriculture, manufacturing, electricity and other utilities, construc- tion, commerce, transportation and communications, personal services, and other services.’ We expect our estimates of the number of workers earning less than the minimum wage will underestimate the actual num- ber since we are using far fewer categories than those in the minimum wage legislation.
We estimate the number of legally covered workers earning below the minimum wage by comparing the lowest monthly minimum wage to the monthly salary of only full-time private sector employees (salaried workers).x We then compare these estimates to ones from sectors that are not legally covered which are a large proportion of the Costa Rican labor force: part- time workers (41% of the work force in 1980) and self-employed workers (16% of the work force in 1980). In order to estimate the number of part-time workers earning below the minimum wage we convert the minimum wage into an hourly wage and compare that legal minimum hourly wage to the hourly wage of part-time workers.Y We separately examine the num- ber of full-time self-employed workers earning below the monthly minimum wage, and the number of part-

1442 WORLD DEVELOPMENT
time self-employed workers earning below the hourly minimum wage.
Our methodology is to compare the proportion of workers earning below the minimum wage in each of these four categories of workers, across the eight industries. If minimum wages are being enforced, there should be only a small percentage of workers earning below the minimum in the covered sector, and at the very least, this percentage should be smaller than the percentage in the uncovered sectors. We, of course, compare these sectors within an industry because we expect there to be variation across industries.
Note that since full-time workers tend to have higher wages even in the absence of minimum wages, one might actually observe a smaller proportion of full-time (as compared to part-time and self- employed) workers earning below the minimum wage level. Hence, if one found that a similar proportion of full-time, part-time and self-employed workers fell below the minimum-wage level, it would be relatively strong evidence that the minimum wage legislation failed to provide a floor.
We also observe however, that the Costa Rican leg- islation specifically states that minimum wages are designed to assure a minimum salary to worker groups that do not have an organization strong enough to negotiate their salaries through collective bargaining. If minimum wages provide a wage floor for only full- time employees, then they do not accomplish this goal; the workers with the most bargaining power (full-time employees) are provided with a wage floor while those with the least bargaining power (part-time workers) are not.
4. MINIMUM WAGES AND AVERAGE WAGES
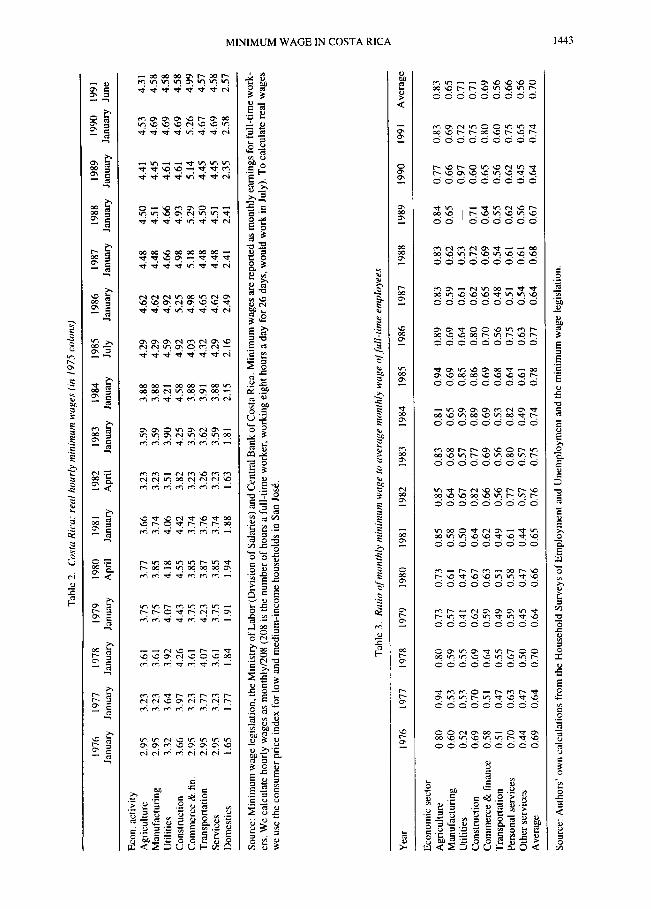
Table 2 presents the structure of the lowest real hourly minimum wages (LMW) effective in July for the eight industrial categories we study here. Not surprisingly, the smallest LMW is the one for domes- tic servants; it is approximately one-half of the next lowest LMW, that for agriculture. The highest LMWs over the period are in utilities and constructioni Over time the eight real minimum wages follow the same general pattern described in section 1- increasing dur- ing 1976-80, falling during 1980-82, rising during 1982-86, and then remaining relatively stable through 1991.
Table 3 presents the minimum wages as a propor- tion of average wages for full-time employees (the covered sector) in each industry. These ratios are high when compared to less interventionist countries, such as the United States and Canada. In Costa Rica the LMWs in manufacturing for 197691 are between 64% and 78% of average wages for full-time employ-
ees in manufacturing. In the US minimum wages have been between 30% and 50% of the average wage in manufacturing since the 1950s (Ehrenberg and Smith, 1991). The ratios for Canada (over the 1960s and 1970s) were between 40% to 45% (Watanabe, 1976). Compared to other OECD and less developed coun- tries, however, the proportion of the LMW to the aver- age wage in Costa Rica is not so high. In 1990, the ratios for seven OECD countries were between 60% and 73% (Freeman, 1993). Watanabe (1976) reports the minimum wage as a proportion of the average wage for several developing countries in the 1960s and 1970s. Many of them fell in the 90% to 120% range (e.g., 120% in Mexico; 103% in the Philippines; 98% in Peru; 97% for Algeria; 92% for Argentina).
We expect that compliance is made more difficult the higher the minimum wage. Hence if there is lack of enforcement and compliance is weak, the higher the ratio of the LMW to the average wage, the larger the proportion of workers earning less than the minimum wage. Given the relative ratios in the industrial cate- gories in Table 3, we might expect that among full- time employees, the highest proportion of those earning less than the minimum would be in agriculture (where minimum wages were on average 83% of aver- age wages) and lowest proportion in transportation and other services (where minimum wages were on average only 56% of average wages).”
The evolution of the ratio of the minimum to aver- age wages of full-time employees over 1976-91 (Table 4, col. 1) indicates that on average, the ratio was higher (74-78%) during 1982-86 compared to the years before and after (64-70%), excepting 1991. This same trend is also found among the part-time employees and the full-time self-employed, but not for part-time self-employed workers. The 1982-86 years are marked by declining inflation (after a peak of 90% in 1982). With declining inflation, a lagged-adjust- ment mechanism will keep minimum wages high. The fact that the ratio of the minimum wage to average wages rose in 1982-86 implies that average wages were not growing as rapidly as minimum wages. This may indicate that at least in periods of inflation, actual average wages (market wages) are set independently of the minimum wage. If actual wages were set to fol- low the minimum wage, one would expect minimum wages to adjust to inflation first. Hence the ratio would have been lower.
The final row of Table 4 also indicates that com- pared to full-time employees, the ratio of minimum wages to average wages is lower for part-time employees (on average 62%), full-time self-employed (on average 57%) and part-time self-employed (on average 44%). This is an unexpected finding given that average wages for full-time employees are not characteristically lower than the wages of part-time employees or the self-employed. Perhaps the reported “wage” for self-employed workers includes returns to
Tabl
e 2.
C
osm
R
icu:
re
d ho
urly
m
inim
um
wug
es
(in
1975
col
ons)
I976
I9
77
I978
19
79
1980
19
81
1982
19
83
1984
19
85
1986
I9
87
1988
19
89
1990
19
91
Janu
ary
Janu
ary
Janu
ary
Janu
ary
Apr
il Ja
nuar
y A
pril
Janu
ary
Janu
ary
July
Ja
nuar
y Ja
nuar
y Ja
nuar
y Ja
nuar
y Ja
nuar
y Ju
ne
Econ
. ac
tivity
A
gric
ultu
re
2.95
3.
23
3.61
3.
75
3.77
3.
66
3.23
3.
59
3.88
4.
29
4.62
4.
48
4.50
4.
41
4.53
4.
3 I
Man
ufac
turin
g 2.
95
3.23
3.
61
3.75
3.
85
3.74
3.
23
3.59
3.
88
4.29
4.
62
4.48
4.
5 1
4.45
4.
69
4.58
U
tiliti
es
3.32
3.
64
3.92
4.
07
4.18
4.
06
3.51
3.
90
4.21
4.
59
4.92
4.
66
4.66
4.
6 I
4.69
4.
58
Con
stru
ctio
n 3.
66
3.97
4.
26
4.43
4.
55
4.42
3.
82
4.25
4.
58
4.92
5.
25
4.98
4.
93
4.61
4.
69
4.58
C
omm
erce
&
fin
. 2.
9.5
3.23
3.
61
3.75
3.
85
3.74
3.
23
3.59
3.
88
4.03
4.
98
5.18
5.
29
5.14
5.
26
4.99
Tr
ansp
orta
tion
2.95
3.
77
4.07
4.
23
3.87
3.
76
3.26
3.
62
3.91
4.
32
4.65
4.
48
4.50
4.
45
4.67
4.
57
Serv
ices
2.
9.5
3.23
3.
61
3.7s
3.
85
3.74
3.
23
3.59
3.
88
4.29
4.
62
4.48
4.
5 I
4.45
4.
69
4.58
D
omes
tics
1.65
1.
77
1.84
1.
91
1.94
1.
88
1.63
I.8
1 2.
15
2.16
2.
49
2.41
2.
4 I
2.35
2.
58
2.57
Sour
ce:
Min
imum
w
age
legi
slat
ion,
th
e M
inis
try
of L
abor
(D
ivis
ion
of S
alar
ies)
an
d C
entra
l B
ank
of C
osta
R
ica.
M
inim
um
wag
es
are
repo
rted
as m
onth
ly
earn
ings
fo
r fu
ll-tim
e w
ork-
er
s W
e ca
lcul
ate
hour
ly
wag
es
as m
onth
ly/2
08
(208
is
the
num
ber
of h
ours
a
full-
time
wor
ker,
wor
king
ei
ght
hour
s a
day
for
26 d
ays,
wou
ld
wor
k in
Jul
y).
To c
alcu
late
re
al
wag
es
we
use
the
cons
umer
pr
ice
inde
x fo
r lo
w a
nd m
ediu
m-in
com
e ho
useh
olds
in
San
Jos
e.
Yea
r
Econ
omic
se
ctor
A
gric
ultu
re
Man
ufac
turin
g U
tiliti
es
Con
stru
ctio
n C
omm
erce
&
fin
ance
Tr
ansp
orta
tion
Pers
onal
se
rvic
es
Oth
er
serv
ices
A
vera
ge
Tabl
e 3.
R
do
ofm
onth
ly
min
imum
w
qe
to u
verc
cge
mon
thly
w
qe
offil
l-tim
e em
ploy
ees
I976
19
77
1978
19
79
1980
19
81
I982
19
83
1984
19
85
1986
19
87
1988
19
89
0.80
0.
94
0.80
0.
73
0.73
0.
8.5
0.85
0.
83
0.81
0.
94
0.60
0.
53
059
0.57
0.
6 I
0.58
0.
64
0.68
0.
65
0.69
0.
52
0.53
0.
55
0.4
I 0.
47
0.50
0.
67
0.57
0.
59
0.85
0.
69
0.70
0.
69
0.62
0.
67
0.64
0.
82
0.77
0.
89
0.86
0.
58
0.51
0.
64
0.59
0.
63
0.62
0.
66
0.69
0.
69
0.69
0.
5 I
0.47
0.
55
0.49
0.
5 1
0.49
0.
56
0.56
0.
53
0.68
0.
70
0.63
0.
67
0.59
0.
58
0.6
I 0.
77
0.80
0.
82
0.64
0.
44
0.47
0.
50
0.45
0.
47
0.44
0.
57
0.57
0.
49
0.6
I 0.
69
0.64
0.
70
0.64
0.
66
0.65
0.
76
0.75
0.
74
0.78
0.89
0.
83
0.83
0.
84
0.77
0.
83
0.83
0.
69
0.59
0.
62
0.65
0.
66
0.69
0.
65
0.64
0.
6 I
0.53
-
0.97
0.
72
0.7
I 0.
80
0.62
0.
72
0.7
I 0.
60
0.75
0.
7 I
0.70
0.
65
0.69
0.
64
0.65
0.
80
0.69
0.
56
0.48
0.
54
0.55
0.
56
0.60
0.
56
0.75
0.
5 I
0.61
0.
62
0.62
0.
75
0.66
0.
63
0.54
0.
6 I
0.56
0.
45
0.65
0.
56
0.71
0.
64
0.68
0.
67
0.64
0.
74
0.70
1990
19
91
Ave
rage
Sou
rce:
Aut
hors
’ ow
n ca
lcul
atio
ns
from
the
Hou
seho
ld
Sur
veys
of
Em
ploy
men
t an
d U
nem
ploy
men
t an
d th
e m
inim
um
w
age
legi
slat
ion

1444 WORLD DEVELOPMENT
Table 4. Ratio of least minimum wage to average wage of all workers
Year Employees Self-employed
Full-time Part-time Full-time Part-time
1976 .69 .60 na na 1977 .64 .63 na na 1978 .70 .60 na na 1979 .64 57 1980 .66 .60 .; .“4”9 1981 .65 .62 .47 .40 1982 .76 .63 56 .36 1983 .75 .66 57 .49 1984 .74 .68 56 .45 1985 .78 .67 .54 .44 1986 .77 .70 .57 .46 1987 64 57 .54 .36 1988 .68 .56 .53 .44 1989 .67 .65 .56 .41 1990 64 .58 .54 .45 1991 .74 .63 .66 .49 Avg. .70 .62 .57 .44
Source: Authors’ own calculations from the Household Surveys of Employment and Unemployment and the mini- mum wage legislation.
the capital invested by the self-employed worker mak- ing this an artificially higher wage.
5. HAS THE MINIMUM WAGE BEEN AN EFFECTIVE FLOOR?
If the minimum wage is an effective floor, we expect to find fewer people earning less than the min- imum in the legally covered sector as compared to the uncovered sector. Is that the case?
From Table 5 it is seen that on average 33% of full-
time employees earned less than the LMW during 1976-91. This is a relatively high number and it should be recalled that this underestimates the true number of workers earning below the minimum wage in Costa Rica because we are only comparing actual wages with the lowest minimum wage in eight indus- try groups. Even under the broadest assumptions, however, the proportion of workers in the submini- mum-wage population in the United States is less than 10% (Linneman, 1982). Using US data from the 1973 population survey, Ashenfelter and Smith (1979) esti- mated that 0.8% of the fully covered workers earned less than the minimum wage whereas 13.7% of the noncovered workers earned less than the minimum wage. In Israel an average of 11.5% of the workers earned less than the minimum wage in 1980-82 and this fell to an average of 5.6% in 1988-91 (Flug and Kasir, 1993). Clearly, minimum wages are not well enforced in Costa Rica and therefore do not act as a wage floor for many of those workers covered by min- imum wage legislation.
One way in which employers could avoid paying minimum wages is to hire workers part-time. The pro- portion of part-time employees earning below the minimum wage is larger than the proportion of full- time employees (37.4% on average). This indicates that employers may be avoiding minimum wage leg- islation by hiring workers part-time. The proportion of part-time employees earning less than the minimum wage is larger than the proportion of full-time employ- ees earning less than the minimum wage in agriculture and construction. This may indicate that employers in these industries may be using part-time workers to avoid minimum wages. But other explanations due to the seasonal or technological nature of the work may also be driving this result.
If workers are not hired into minimum wage jobs they have the option of working in the uncovered sec-
Table 5. The average proportion af workers earning less than rhe lowest minimum wage by indusrq and qpe qf worker
Indust& Employees* Self-employed+
Full-time Part-time Full-time Part-time Total
Agriculture 47.0 Manufacturing 22.6 Construction 27.4 Commerce & finance 30.5 Transportation 14.8 Personal service 44.4 Other services’ 20.8 Total 33.0
53.8 18.6 31.5 26.2 13.2 31.3 14.1 37.4
53.7 46.9 50.2 29. I 37.4 23.3 19.7 27.0 26.8 28.3 22.1 29.4 15.5 9.1 15.2 9.1s 13.28 36.0
29.4 12.7 17.4 32.8 32.8 34.0
* These figures are averaged over 1976-9 1. t These figures are averaged over 1980-9 I. $ The utilities industry is excluded from the analysis due to the lack of a significant number of observations in the Household Survey. 5 Small number of observations. Source: Tables Al-A5 in the appendix.

MINIMUM WAGE IN COSTA RICA 1445
tor. One such uncovered sector in Costa Rica is among the self-employed. The proportions of full- and part- time self-employed workers earning less than the minimum wage is, on average, the same as the pro- portion of full-time employees earning below the minimum wage - 33%. This appears inconsistent with the fact that the ratios of minimum wages to average wages are lower for the self-employed than for full-time employees (see Table 4). Clearly then, the distribution of wages must be more unequal for the self-employed, with a greater number of both high- wage and low-wage workers than for the full-time employees.
The relative size of the below minimum wage pop- ulation does not vary greatly across the four worker types within an industry (see Table 5). There are per- haps two exceptions. Part-time construction workers may on average earn less than full-time. In manufac- turing, a larger proportion of self-employed workers earn below the LMW compared with the employees, signalling that the self-employed in manufacturing are most likely artisans. The fact that the proportions in each industry are so similar for the self-employed and employees, full and part-time, adds further evidence to support the hypothesis that the minimum wage is not being enforced and that perhaps the wage level is not necessarily affected by the minimum wage. We must check the distribution of earnings among these different worker types however, before we can make this assertion.
6. WHO EARNS BELOW THE MINIMUM WAGE?
We examine the sectoral pattern and personal char- acteristics of the proportions earning less than the minimum wage in each of the four types of workers (full- and part-time employees and the full- and part- time self-employed) in Tables 5 and 6.
Note in Table 5 that a disproportionate number of workers earn less than the minimum wage in agricul- ture (on average about 50%) and in personal service (on average 39.9%). It is surprising that so many workers in personal services earn below the minimum wage given that the minimum wage for domestic ser- vants is so low (one-half the smallest minimum wage in any other category).r2
The demographic characteristics of the below min- imum wage population are presented in Table 6. From the far right column, it can be seen that, on average over time, workers earning below the minimum wage are disproportionately female, nonheads of house- holds, very young (less than 19 years old) or older (60+ years), have less education, and live in rural areas not in the Central Valley.‘) These results are typical of findings from other countries with respect to sex, edu- cation and age distribution.
A disproportionate number of workers in small firms are earning less than the minimum wage (45% on average). Many studies have shown that small firms pay less than large firms, but why this is the case is not clear. One explanation is that small firms have lower capital/labor ratios and hence pay less. It is also likely that compliance with the minimum wage is higher in the large firms and that this is having spillover effects on the small firms. Gindling (1991) argues that minimum wages are segmenting markets by preventing mobility of workers from the low-wage sector to the high-wage sector.
7. HOW HAS THE PROPORTION OF THOSE EARNING BELOW THE MINIMUM WAGE
CHANGED OVER TIME?
Table 7 presents a summary of the changes in the proportion of workers earning below the LMW over 1976-91. The pattern that emerges is that in all four sectors this proportion fell in 1979-81, when the min- imum wage was falling relative to the average wage (see Table 4) and that the proportion rose to its high- est level in 1982-86 when the ratio of the minimum wage to the average wage was the highest.
For the covered sector, the finding that the propor- tion rises as the minimum wage goes up, and falls as the LMW falls, can be interpreted as a lack of compli- ance. If there were strong compliance, the proportion should not have varied over time as the ratio of the minimum wage to average wage changed. The fact that this pattern is also found in the uncovered sectors is an indication that a large number of workers’ wages are unaffected by changes in the minimum wage. Hence as the minimum wage is increased, a larger pro- portion of workers have wages below the minimum.
It should be noted however, that the proportions for full-time employees earning below the minimum fell more in 1979-81 than the proportion of part-time employees. This may indicate some compliance on the part of the employers if the falling proportion is the result of relatively larger job losses among these lower wage full-time workers.rJ
With the simplification in the minimum wage leg- islation in 1988 there was no change in the aggregate proportion of workers earning below the minimum wage. Nor was there a big change in any characteris- tics of workers who earn below the LMW (see Tables A6-A10 in the appendix). Another simplification in 1990 was accompanied by a fall in the proportion of workers earning below the minimum wage. This fall however, probably had more to do with the decline in the real minimum wage relative to the average wage (Table 4) than with the simplification. Hence, we con- clude from this analysis that the reduction in the num- ber of minimum wage categories had no visible impact on the proportion of workers earning less than

1446 WORLD DEVELOPMENT
Table 6. Characteristics of workers earning less than the lowest minimum wage - average percentage of workers in each ,group over 197691*
Employees Self-employedf Full-time Part-time Full-time Part-time Total
Total Sex
Male Female
Region Urban Rttral Central valley Rest of country
Family status Heads Non-heads
Age Less than 19 20-29 30-39 40-49 SO-59 60-69 lO+
Education Primary Secondary University
Firm size l-9 IO+
33.0 37.4 32.8 32.8 34.0
29.0 39.1 31.2 31.7 32.1 44.1 32.9 45.9 36.1 39.7
24.5 19.9 21.6 22.4 40.3 48.1 42.6 40.9 29.8 28.3 25.7 26.9 41.1 53.8 43.7 41.5
22.9 42.8 29.0 45.2
22.4 35.2 30.0 31.4 28.0 42.3 43.7 42.2 35.3 41.2
57.3 55.9 53.1 28.6 30.3 33.1 22.8 27.9 28.2 24.9 32.5 29.7 29.8 34.9 33.2 38.1 44.7 44.3 43.1 47.2 57.3
44.0 56.3 28.8 29.4 29.1 25.5 29.3 28.1 32.8 32.1 36.9 40.3 49.0 48.4
37.4 48.5 36.7 36.3 49.4 22.2 20.4 21.0 20.7 24.7
5.7 4.2 8.1 5.7 6.4
46.4 45.9 23.5 22.6
na na
na na
na na
*See Tables A6-A10 in the appendix for annual data. t For self-employed workers the averages are for 198G9 1.
the minimum wage. We must note, however, that this analysis is not an adequate test. Because our calcula- tions are based on a simplification of the minimum wage legislation (only nine minimum wages), we are less likely to see the impact.
Regarding changes over time in the characteristics of workers earning below the LMW, it appears from Tables A6-Al0 in the appendix that there is no sig- nificant change in terms of the sex, age or education. The proportion of workers however, earning below the minimum wage who work in larger firms increased during 1979-9 1. We question whether enforcement of minimum wages was declining over time among larger firms.
8. CONCLUSIONS
In this study we: (a) described the Costa Rican min- imum wage system and its evolution over 1976-91, (b) examined the trend in the minimum wage to aver- age wage in eight industries, (c) measured the number of workers who earn below the minimum wage and(d) described their characteristics.
We conclude that enforcement of minimum wages was lax in that on average, at least one-third of the workers who were legally covered by minimum wage legislation earned below the minimum wage over the 16-year period. Employers may have avoided mini- mum wage legislation by hiring workers part-time, where slightly higher proportions were earning below the minimum. The fact that 33% of the other uncov- ered sector-full- and part-time self-employed work- ers - earned below the minimum wage strongly supports the view that there is little compliance with minimum wages. The finding that the number of workers earning below the minimum wage declined (rose) as minimum wages declined (rose) relative to average wages also lead us to conclude that the mini- mum wage is not an effective floor.
Our limited findings suggest that the simplification of the minimum wage system over time has not increased compliance as there is no noticeable change in the proportion earning below the minimum wage when the two simplifications were put into place. Our test is not rigorous, however, and hence not conclusive.
These findings also lead us to question whether minimum wages are affecting wages in the Costa

MINIMUM WAGE IN COSTA RICA 1447
Table 7. The proportion of workers earning less than the lowest minimum wage
Employees Self-employed Year Full-time Part-time Full-time Part-time Total
1976 35.4 31.4 na na na 1977 31.0 43.7 na na na 1978 30.7 32.8 na na na 1979 25.0 27.5 1980 21.5 31.5 3:5 3:7 2:6 1981 24.1 31.7 18.2 24. I 25.9 1982 42.1 45.2 41.3 30.9 42.3 1983 36.5 39.9 31.2 31.8 36.4 1984 37.3 41.9 33.5 31.3 37.4 1985 38.4 41.0 31.7 32.0 37.7 1986 39.4 43.5 31.1 35.0 39.2 1987 32.1 37.7 36.6 35.3 34.4 1988 34.1 35.9 32.5 36.4 34.6 1989 30.5 38.7 34.3 33.7 33.5 1990 26.2 32.5 31.9 35.9 29.6 1991 36.4 37.0 37.9 36.3 36.7 Avg. 33.0 37.4 32.8 32.8 34.0
Source: Authors’ own calculations from the Household Surveys of Employment and Unemployment and the minimum wage legislation.
Rican labor market. The evidence is consistent with compliance with and enforcement of the law. But even the idea that the wages of low wage workers (those if there were strict compliance, the law as it is written earning near or below the minimum wage) are not is incapable of meeting this goal because it excludes affected by changes in the minimum wage. We do not low wage part-time workers. If the Costa Rican gov- know, however, if changes in the minimum wage are emment is seeking ways to better reach the target of shifting the distribution of wages over time, a topic this policy, one response could be to change the law to which will be addressed in our future research. extend coverage to part-time workers, and require
In sum, the minimum wage laws in Costa Rica are only one or two minimum wages. The latter change not having the intended effect of protecting workers would make it easier and less costly to enforce the with little bargaining power to negotiate their salary. minimum wage and the former would give equal treat- This is so for two reasons. For one, there is lack of ment under the law to all employees.
NOTES
I. There are, of course, many other ways that minimum wages can affect the labor market which we are not treating in this paper. For example, we do not measure its impact on employment or unemployment nor do we assess its affect on the wage structure, income distribution and inflation. For classic surveys of these theoretical and empirical issues see, for example Brown, Gilroy and Kohen (1982). Brown (1988) Mincer (1976) and the Minimum Wage Study Commission (1981).
2. For example, see Pollack and Uthoff (1986) and Gindling and Berry, (1992). Legal minimum wages were mandated with the Gdigo de Trabajo in 1943, but they could only begin to influence national wages after the creation of the National Salary Council in November 1948.
3. Gindling and Berry (1992) make this argument.
4. The public sector was not, until 1984, covered by mini- mum wage legislation, although in practical terms rarely did public sector salaries fall below legislated minimum wages. An exception was in 1982 and 1983 when the wages for some professional and technical personnel in the public sector were below the legal minimum wages for professional work-
ers (IICE, 1989). Legislation was passed in 1984 which made it mandatory that public sector wages not fall below legal minimum wages.
5. The Household Surveys contain information on the monthly earnings, weekly hours worked, labor force status, and other labor market characteristics of each worker. Each July survey covers approximately 1% of the Costa Rican population.
6. The minimum wages are taken from an unpublished table from the Ministry of Labor and Social Security, given to us by Orlando Garcia (Director, Salary Division) and from the minimum wage laws published in the Gazeta (the official record of the legislature). The specific categories used from the minimum wage laws for each broad category are: for agriculture “peones” (in Chapter 1 of the legislation), for manufacturing “trabajadores de1 proceso” (in Chapter II), for electricity and other utilities “trabajadores del proceso” (in Chapter V), for construction “peones” (in Chapter IV), for commerce “trabajadores en otras actividades comerciales” or “peones” (in Chapter VI). for transportation and commu- nication “transporte por aqua y otros trabajadores” (in Chapter VII), domestic servants “semicio domt!stico” or

1448 WORLD DEVELOPMENT
“se&dotes dombticus” (in Chapter VIII), other services “otros servicios” (in Chapter VIII).
We attempted to use the “professional” occupational cate- gory, which has a separate minimum wage, irrespective of industrial category. Upon examination, however, we con- cluded that the category of “professionals” in the household surveys was not consistent with the category of “profession- als” in the minimum wage legislation.
11. “Other services” exclude personal services and include private sector industries that are likely to pay high wages such as international organizations (96) and entertainment and cultural services (94).
12. We know, however, that domestic servants comprise between 58% and 77% of the workers in personal services during 1987-91, the years when the Household Surveys reported data on domestic servants.
7. The mining industry was deleted from our analysis since the sample size in the Household Surveys was too small to be of any use.
8. Full-time private sector workers work eight hours a day for six days a week (26 days in the month of July).
13. In the appendix we present complete tables of the char- acteristics of workers earning below the LMW for full-time employees (Table A6), part-time employees (Table A7), full- time self-employed (Table A8), and part-time self-employed (Table A9).
9. We calculated the hourly minimum wage by dividing the monthly minimum wage by 208 hours (26 working days per month times eight hours per day). The hourly wage from the household surveys are calculated as the monthly wage divided by (hours worked per week times 4.6 weeks in July).
10. In 1990, manufacturing, utilities and construction were combined to form one category in the minimum wage legis- lation. Note, moreover, that for 12 of the 16 years manufac- turing, transportation and other services have the same LMW as agriculture.
14. Changes in the proportion of workers earning below the minimum wage in July of each year may also be affected by the time elapsed between July and the last setting of the min- imum wages. For example, in 1980 the minimum wage that was effective in July had been set in April when the minimum wages in effect as of July 1976-79, 1981, and 1983-84 had been set in January (three months earlier). The labor market had more time to adjust to the changing minimum wage in these years compared with 1982. This may contribute to the high number of people earning below the minimum wage in 1982. This timing however, would not explain why it was also higher in 1983-84.
REFERENCES
Ashenfelter, 0. and R. S. Smith, “Compliance with the min- imum wage law,” Journal ofPoliticu1 Economy, Vol. 87 (1979) pp. 335-350.
Brown, C., “Minimum wage laws: Are they overrated?,” Journal of Economic Perspectives, Vol. 2, No. 3 (1988).
Brown, C., C. Gilroy and A. Kohen, “The effect of the min- imum wage on employment and unemployment,” Jourmd ofEconomic Lirerufnre, Vol. 20 (1982), pp. 487-525.
CEPAS, “Costa Rica: Balance de la Situation,” No. 31 (1989).
Cardozo, Victorino, Politica Suluriul de1 Esrado Cosruricense (Heredia, Costa Rica: Editorial UNA, 1990).
Ehrenberg, R.. and R. Smith, Modern Labor Economics: Theory und Public Policy (New York: Harper Collins Publishers, 1991).
Flug, K. and N. Kasir, ‘Compliance with the minimum wage law: The case of Israel,” International Conference on the Economic Analysis of Low Pay and the Effects of Minimum Wages (Aries. France: September 30-October I, 1993).
Freeman, R., “Minimum wages again!,” International Conference on the Economic Analysis of Low Pay and the Effects of Minimum Wages (Arles. France: September 3&0ctober I, 1993).
Gindling, T. H., “An investigation into labor market seg- mentation: The case of San Jose, Costa Rica,” Economic Development and Cultural Change, Vol. 39, No. 3 (199 I), pp. 585605.
Gindling, T. H. and A. Berry, “The performance of the labor market during recession and adjustment in Costa Rica,” World Development, Vol. 20, No. 11 (1992). pp. 1599-1616.
Gregory, P., “Legal minimum wages as an instrument of social policy in Costa Rica,” Research Paper Series No. 5
(Santa Fe, NM: University of New Mexico, July 1991). Institute de Investigaci6nes en Ciencias Economicas
(IICE), “Estudio Sobre Sueldos e Incentives en el Sector Public0 Costarricense a Nivel Profesional” (San Jose, CA: University of Costa Rica, informe final, 1989).
Linneman, P., “The Economic Impact of Minimum Wage Laws: A New Outlook at an Old Question,” Journrd of Polificul Economy, Vol. 90, No. 3 (1982). pp. 443-469.
Lom, H. and E. Lizano Fait, “The National Wages Board and minimum wage policy in Costa Rica,” Internationul Lubour Review, Vol. 114, No. I (1976). pp. 95-106.
Lopez, L. C., “Politica Salarial en Costa Rica: 1978-198 1,” Mimeo (San Jose. CA: 1981).
Minimum Wage Study Commission, Report of the Minimum Wage Srudy Commission, Volumes I-10 (Washington, DC: U.S. Government Printing Office, 1981).
Mincer, J., “Unemployment effects of minimum wages,” Journal cfPolitica1 Economy, Vol. 84, No. 4 (1976), pp. S87-S 104.
Naranjo, F. E., “Recent employment policies in Costa Rica,” Mimeo (San Jose, CA: 1985).
Pollack, M. and A. Uthoff, “Inflation, salario minim0 y salaries nominales 19761983,” Revisra de Ciencius Econrimicus (University of Costa Rica), Vol. 6, No. I (1986), pp. 57-78.
Rovira, J. and J. D. Trejos, “El curso de la crisis en Costa Rica y las opciones de la polftica economica en el Segundo lustro de 10s aiios ochenta,” Rerisru de Ciencias Econrimicus (University of Costa Rica), Vol. 5, No. 2 (1985) pp. 3-22.
Watanabe, S., “Minimum wages in developing countries: Myth and reality,” fnternarionul Lubour Review, Vol. 1 13, No. 3 (1976) pp. 345-358.

Tabl
e Al
Th
e nu
mbe
r cf
f:fill
-tim
e em
ploy
ees
eurn
ing
less
rh
un
the
mon
thly
m
inim
um
wuge
I976
I9
77
I978
I9
79
1980
19
81
I982
I9
83
I984
19
85
1986
19
87
1988
19
89
1990
I9
9 I
Aver
age
Econ
omic
se
ctor
Ag
ricul
ture
31
342
2281
4 27
231
1835
4 22
100
II.51
0 30
707
2459
7 33
527
3377
2 35
885
3123
5 39
279
3183
8 30
367
3042
3 28
436
% t
o to
tal
cate
gory
49
.4
S7.6
42
. I
33.6
40
.8
40.
I 52
.9
48.3
SO
.5
61.3
56
.7
44.4
48
.2
43.3
37
.5
46.0
41
.0
Man
ufac
turin
g I2
053
Y604
85
84
8240
12
039
6513
13
438
IS55
2 16
663
1345
6 11
774
1789
5 18
167
1769
8 17
671
2078
6 I3
758
510 t
o to
tal
cate
gory
22
.6
20.7
20
.0
18.9
19
. I
12.9
32
.4
25.8
2.
5.2
28.3
23
.3
22.8
22
.3
21.2
19
.2
26.7
22
.6
Utili
ties
82
82
208
85
77
- 67
13
5 96
-
- -
- 37
97
%
to
tota
l ca
tego
ry
9.3
- -
IS.1
14
.9
8.4
6.3
- 6.
3 48
.0
22.1
-
- -
- 10
.6
15.7
Co
nstru
ctio
n 54
12
4129
61
14
4892
60
08
4689
62
62
4950
78
15
6638
59
25
590s
71
0s
5954
36
41
6949
57
74
% t
o to
tal
cate
gory
26
.8
18.2
21
.6
16.3
22
. I
2.5.
3 42
.3
28.8
44
.3
43.3
35
.7
22.
I 26
.3
22.2
14
.3
28.0
27
.4
Com
mer
ce
& fin
ance
13
766
104.
53
1295
3 10
834
1319
8 78
87
1177
5 16
049
1303
7 10
897
1164
8 21
168
2302
1 18
605
1780
8 25
639
1492
1 8,
to
tot
al
cate
gory
30
.8
23.7
28
.1
23.S
27
.5
20.8
39
.3
34.3
28
.0
24.9
32
.8
35.5
37
.8
31.6
27
.6
41.3
30
.5
Tran
spor
tatio
n I7
93
147s
I8
70
1199
10
23
992
1029
I6
94
2139
17
28
669
1129
I4
78
1539
15
86
1787
14
43
% t
o to
tal
cate
gory
21
.3
17.9
16
.8
12.8
8.
8 11
.2
14.8
17
.5
21.0
18
.8
10.2
9.
3 14
.0
14.7
12
.4
15.8
14
.8
Pers
onal
se
rvic
es
1465
8 97
74
1211
9 10
743
9538
88
88
1351
9 16
896
1497
8 11
184
1186
6 13
735
1229
3 97
13
9306
10
982
1188
7 %
J to
tota
l ca
tego
ry
48.9
39
.5
45.2
36
.8
35.2
41
.6
53.5
56
.7
54.
I 41
.5
52.0
42
.2
37
41.2
34
.6
51.1
44
.4
Othe
r se
rvic
es
904
I176
67
7 49
0 13
.54
903
1444
17
99
2066
21
39
1644
20
29
2130
12
0s
1634
22
56
1491
%
IO
tota
l cn
tego
ry
17.6
21
.2
I I.0
7.
4 23
.9
IS.7
26
.8
22.6
27
.0
22.6
28
.4
21.6
26
.8
16.1
IS
.8
28.9
20
.8
Tota
l W
I. 80
174
5945
9 69
647
5524
5 66
010
4200
4 78
424
8176
2 90
912
8015
5 79
701
9336
9 10
353
8681
2 82
193
9925
2 78
047
‘% to
lot
al
sLun
ple
35.4
31
.0
30.7
2,
s 27
.5
24.1
42
.7
36.5
37
.3
38.4
39
.4
32.1
34
.1
30.5
26
.2
36.4
33
.0
Sour
ce:
Auth
ors’
ow
n ca
lcul
atio
ns
from
th
e Ho
useh
old
Surv
eys
of E
mpl
oym
ent
and
Unem
ploy
men
t an
d th
e m
inim
um
wage
le
gisl
atio
n.

Tabl
e A
2.
The
num
ber
of p
ut-t-
time
empl
oyee
s aw
ning
le
ss t
hun
the
hour
ly
min
imum
nq
e
Yea
r I9
16
1971
19
78
1979
19
80
1981
19
82
1983
19
84
1985
19
86
1987
19
88
1989
19
90
1991
A
vera
ge
Econ
omic
se
ctor
A
gric
ultu
re
8 to
tot
al c
ateg
oty
Man
ufac
turin
g %
to
tota
l ca
tego
ry
Con
stru
ctio
n %
to t
otal
cat
egor
y C
omm
erce
&
fin
ance
%
to
tota
l ca
tego
ry
Tran
spor
tatio
n %
to t
otal
cat
egor
y Pe
rson
al
serv
ices
%
to
tota
l ca
tego
ry
Oth
er
serv
ices
%
to t
otal
cat
egor
y To
tal
col.
% to
tot
al s
ampl
e To
t. ea
rnin
g LT
MM
%
to
tota
l sa
mpl
e
2579
0 25
445
2498
1
2247
3 29
555
2455
8 43
269
3318
1 33
440
3348
8 38
121
3274
8 33
235
3461
9 25
627
3630
8 50
.3
55.6
47
.0
39.9
49
.8
49.6
62
.0
54.0
59
. I
62.7
59
.2
56.0
55
.9
58.8
47
.8
53.7
24
66
1618
17
63
1778
36
13
1916
34
99
3950
44
21
3030
34
19
3988
43
50
4396
35
79
6737
17
.8
20.2
14
.4
12.9
15
.9
10.3
20
.9
20. I
26
.5
18.0
22
.6
16.6
21
.8
20.5
16
.9
21.7
11
52
1326
16
74
1774
I5
92
1434
I8
25
1546
20
00
1431
12
43
1737
62
1 10
96
2074
15
09
31.3
38
.1
36.2
25
.3
22.6
25
. I
48.7
47
.1
38. I
40
.6
28.5
35
.9
15.0
19
.0
29.9
22
.3
2382
31
74
3619
36
74
3040
26
58
3888
44
91
5929
28
87
3124
62
32
479
I 74
92
7236
90
95
21.4
32
.1
22.2
20
.7
17.2
19
.3
25.8
25
.7
31.7
19
.6
25.8
30
.6
24.0
34
.4
32. I
36.0
21
7 67
1 49
0 57
3 58
1 45
5 41
6 10
04
695
846
41 I
362
284
603
354
11%
5.
6 28
.0
11.5
Il.
8 10
.0
16.9
9.
7 24
.4
13.0
19
.3
11.2
8.
0 6.
1 12
.5
5.9
17.3
37
16
3002
29
17
2795
36
11
3217
52
21
627
I 52
58
3941
45
%
7588
55
34
838
1 78
48
921
I 41
.9
36.5
24
.3
20.3
21
.4
24.0
35
.0
41.3
34
.0
30.9
35
.3
34.8
24
.5
29.1
29
.2
32.3
55
4 50
6 54
8 60
0 73
5 12
53
690
1072
I5
63
1088
14
90
1103
14
50
1764
19
11
2012
13
.6
12.5
8.
2 6.
6 8.
3 16
.6
12.5
14
.2
18.8
13
.8
19.7
13
.0
16.3
18
.5
15.5
17
.3
3633
7 35
844
3599
2 33
798
4284
0 35
567
5890
6 51
558
5330
6 46
831
5246
8 53
982
5031
7 58
666
4862
9 66
192
31.4
43
.7
32.8
27
.5
31.5
31
.7
45.2
39
.9
41.9
41
.0
43.5
37
.1
35.9
38
.7
32.5
37
.0
3785
9 37
983
3944
8 39
656
4720
2 40
140
6375
I
5558
8 58
186
4660
7 56
904
5842
0 57
758
6736
7 53
589
7070
3 38
.8
44.6
34
.4
30.6
34
.5
35.5
48
.5
42.1
45
.4
40.6
46
.7
40.5
40
.8
43.9
35
.4
39.2
3105
6 53
.8
3408
IS
.6
1502
31
.5
4607
E;
26.2
g
572
d 13
.2
5202
5
31.3
FS
11
46
14.1
3
4758
I
37.4
51
948
40. I

Tabl
e A
3.
The
num
ber
offu
ll-tim
e se
lf-em
ploy
ed
eclm
ing
less
thu
n the
mon
thly
m
inim
um
wqe
Yea
r 19
80
1981
19
82
1983
19
84
1985
19
86
1987
19
88
1989
19
90
1991
A
vera
ge
Econ
omic
se
ctor
A
gric
ultu
re
% t
o to
tal
cate
gory
-
Man
ufac
turin
g %
to t
otal
cat
egor
y C
onst
ruct
ion
8 to
tot
al c
ateg
ory
Com
mer
ce
& f
inan
ce
8 to
tot
al c
ateg
ory
Tran
spor
tatio
n %
to
tota
l ca
tego
ry
Pers
onal
se
rvic
es
% to
tot
al c
ateg
ory
Oth
er
serv
ices
%
to t
otal
cat
egor
y To
tal
col.
% t
o to
tal
sam
ple
Tot.
earn
ing
LT M
M
% to
tot
al s
ampl
e
939s
s4
.1
1170
25
.1
85.5
23
.2
3495
24
.0
144
5.1
266
9.5 96
39.3
I.5
421
33.5
15
38.5
33
.4
2589
74
.59
32.9
59
.2
978
2090
20
.3
459
322
363
15.0
20
.4
1817
44
7 I
13.4
34
.3
417
554
20.8
28
.3
130
740
3.7
20.3
-
- -
- 62
53
1567
7 18
.2
41.3
63
12
1649
3 18
.2
43.1
4892
10
389
8362
80
12
1198
3 12
288
1422
1 11
688
9780
92
55
45.9
53
.7
55.7
48
.9
57.9
55
.3
57.7
62
.7
59.9
53
.7
1856
27
35
2262
16
08
1905
31
96
22.5
7 27
79
358
I 22
0 1
28.3
36
.6
24.4
23
.7
24.5
32
.6
20.2
24
.5
43.2
29
.1
628
1006
12
10
472
284
1406
12
85
1413
18
72
926
25.3
22
.0
33.9
22
.8
4.0
16.1
16
.5
14.5
23
.2
19.7
55
49
5074
36
55
3881
97
51
5042
61
07
5264
61
10
5018
34
.0
23.6
23
.5
24.2
43
.6
25.3
30
.0
28.7
34
.9
28.3
36
8 14
39
213
406
421
440
130
620
474
469
14.1
40
.0
9.2
15.9
9.
2 12
.2
4.2
13.8
13
.5
15.5
23
0 24
9 11
9 21
6 35
7 44
5 91
3 87
6 98
0 46
0 4.
9 4.
5 2.
8 6.
8 7.
5 8.
1 15
.7
10.7
14
.8
9.1
170
140
47
76
287
172
254
91
269
160
32.9
14
.7
13.9
30
.6
25.6
20
42
.2
27.5
46
.9
29.4
13
693
2103
2 16
058
1467
1 25
078
2304
6 25
167
2273
1
2306
6 18
491
31.2
33
.5
31.7
31
.1
36.6
32
.5
34.3
31
.9
37.9
32
.8
1496
1 21
167
1624
2 13
888
2261
3 23
975
2525
7 23
230
2192
8 18
454
34.0
33
.6
31.8
29
.3
33.0
33
.7
34.2
32
.5
35.9
32
.7

Tabl
e A
4.
The
num
ber
of p
urr-
time
self-
empl
oyed
eu
rnin
g le
ss t
han
the
hour
ly m
inim
um
wcl
ge
Yea
r 19
80
1981
19
82
1983
I9
84
1985
19
86
1987
19
88
1989
19
90
1991
A
vera
ge
Econ
omic
se
ctor
A
gric
ultu
re
% t
o to
tal
cate
gory
M
anuf
actu
ring
% to
tot
al c
ateg
ory
Con
stru
ctio
n %
to t
otal
cat
egor
y C
omm
erce
&
fin
ance
%
to t
otal
cat
egor
y Tr
ansp
orta
tion
% t
o to
tal
cate
gory
Pe
rson
al
serv
ices
%
to
tota
l ca
tego
ry
Oth
er
serv
ices
%
to t
otal
cat
egor
y To
tal
col.
% t
o to
tal
sam
ple
Tot.
earn
ing
LT M
M
8 10
tota
l sa
mpl
e
1015
6 41
.8
2997
31
.9
575
23.5
24
13
22.7
12
0 4.
4 75
5 12
.7
97
21.8
17
209
30.7
18
632
33.1
5011
34
.5
2688
31
.5
494
17.6
63
5 9.
8 16
8 IO
.4
519
10.5
- - 9583
24
.1
1064
4 26
.2
5872
39
.9
2649
34
.3
782
35.4
18
34
27.4
95
6.
2 44
3 10
.5
42
5.5
1171
7 30
.9
I186
5 31
8361
39
.7
41.5
44
5 26
.4
2839
27
.0
87
3.9
835
12.3
15
0 15
.7
1714
7 31
.8
1790
9 33
.2
7467
47
.4
3275
35
.8
634
32.8
20
95
18.7
44
3 16
.7
757
15.0
- -
1480
9 31
.3
1574
3 33
.2
6175
46
.5
3163
36
.2
684
39.3
16
99
18.5
30
2 12
.2
757
18.7
11
4 14
.5
I289
4 32
.0
1317
4 32
.6
7144
47
.6
4003
45
.5
572
25.7
15
54
22.7
14
2 6.
3 26
6 8.
8 - -
1368
1 35
.0
1483
2 37
.8
1211
7 54
. I
6183
38
.7
865
31.6
23
41
19.2
40
2.
9 79
8 11
.1
36
2.5
2238
0 35
.3
2379
0 37
.4
1467
6 51
.8
6581
38
.2
756
28.1
32
27
24.7
- - 64
4 9 466
24.2
26
407
36.4
27
390
37.5
1284
7 13
172
51.9
55
.6
6792
65
56
34.8
36
.9
217
1134
9.
6 32
.9
4526
41
27
25.8
26
.2
343
158
18.3
11
.2
777
1768
9.
2 15
.8
184
159
10.1
7.
5 25
686
2707
4 33
.7
35.9
26
700
2821
9 34
.7
37.2
1532
4 52
.2
1103
5 43
.1
1185
21
.6
4213
22
.7
189
7.2
3683
24
.3
_
3572
3 36
.3
3675
0 37
.2
9860
46
.9
5023
37
.4
695
27.0
s
2625
g
22. I
190
g 9.
1 10
00
13.2
15
6 12
.7
1952
6 32
.8
2047
1
34.3

Tabl
e AS
. Th
e rru
rnhe
r oj
’trll
work
ers
ecrrn
ing
less
th
trn
the
mon
thly
/hou
rly
min
imum
wq
e
Year
I Y
76
1977
19
78
1979
19
80
1981
19
82
1983
19
84
198.
5 19
86
1987
19
88
1989
19
90
1991
Av
erag
e
fiono
rnic
se
ctor
Ag
ricul
ture
57
132
4825
9 52
212
4082
7 71
206
4366
8 87
307
7103
1 84
823
8179
7 89
162
8808
3 99
478
93.5
85
8085
4 91
835
7382
9 %
to
tota
l ca
tego
ry
49.8
56
.6
44.3
36
.8
4s.9
43
.4
S6.3
49
.3
53.7
59
.8
56.0
51
.2
51.9
51
.5
4s.7
51
.2
50.2
3
Man
ufac
turin
g 14
SlY
II222
10
347
I001
8 19
819
1209
5 21
676
2571
3 27
094
2191
1 20
804
2997
1 32
294
3114
3 30
585
4213
9 22
584
z Q
to
tot
al
cate
gory
21
.6
20.6
18
.7
l7.S
19
.8
14.7
30
.7
26.S
27
.3
26.6
25
.6
23.7
25
.1
22.9
21
.5
29.5
23
.3
z Ut
ililir
s X2
-
- 82
20
8 8.
5 77
-
67
I35
96
- -
- 37
97
%
to
tota
l ca
tego
ry
_
7.9
14.2
8.
9 4.
6 5.
9 -
3.8
20.3
5
_ _
IS.0
-
4.6
9.5
Cons
truct
ion
_ _
6564
54
5s
7788
66
66
9030
69
39
9232
75
69
1145
.5
9963
82
12
8791
98
88
8552
82
62
I IS
IS
8493
Q
% t
o to
tal
cate
gory
27
.5
20.9
23
.7
18.0
22
.4
23.8
41
.0
30.7
39
.0
41.2
32
.5
21.3
23
.2
20.0
18
.1
25.S
26
.8
$ Co
mm
erce
&
tinlm
cc
16 I4
8 I3
627
I657
2 14
508
2214
6 12
997
2196
8 28
928
2613
5 19
138
2020
7 39
492
3608
1 36
730
3443
5 45
057
2526
1 ‘1
. to
tot
al
cate
gory
2x
.9
44.2
26
.6
22.7
24
.4
18.1
34
.0
31.7
26
.7
23.0
28
.7
34.5
31
.7
3 I .
o 28
.5
36.5
29
.4
9
Trx~
spor
tatio
n I Y
70
2146
23
60
I772
18
6X
2032
20
94
3153
47
16
3089
16
28
1952
22
02
261.
5 27
18
3646
24
98
8 B
to t
otal
ca
tego
ry
16.2
40
. I
IS.4
12
.4
8. I
13
.4
14.2
17
.0
21.6
16
.8
IO.8
8.
6 10
.5
12.9
I I
.0
14.7
15
.2
s Pw
sona
l se
rvic
es
1843
4 12
776
I SO3
6 13
5.78
14
170
I275
4 19
923
2423
2 21
242
1600
1 16
944
2247
8 18
916
1978
4 19
798
2491
6 18
184
‘1
to t
otal
ca
tego
ry
47.3
46
.0
38.7
31
5
28.‘)
29
.5
41.5
46
.4
39.6
33
.3
40.3
33
.9
27.6
29
.7
27.1
34
.6
36.0
ia
Othe
r se
rvic
es
145x
I6
82
122.
5 IO
90
2282
21
.56
2176
31
91
3769
33
88
3210
34
5s
4218
34
07
379s
45
37
2815
$
% t
o to
tal
cate
gory
IS
8 26
.3
9.5
6.9
IS.0
14
.x
18.2
19
.0
20.6
18
.4
22.
I 16
.9
21.5
17
.6
IS.1
21
.0
17.4
To
tal
cd.
IlhSl
l 95
303
1056
3Y
X904
3 14
1480
93
407
1648
24
1641
60
1800
59
IS.5
938
1605
21
1948
09
2033
60
1963
31
1806
27
2242
33
1541
40
%
to I
ota1
s;
m1p
lc
36.0
3-
1.X
31.1
25
.9
29.6
29
.9
42.3
36
.4
37.4
37
.7
39.2
34
.4
34.6
33
.5
29.6
36
.7
34.1
TO
I. c;
uwnf
LT
M
M
IS76
82
I23
I6 I
I-l
hl-1
2 13
9114
IS
4325
11
4941
17
6338
lX
Y413
20
3629
17
6412
18
9808
20
9120
20
2640
I.5
0145
13
.507
8 IS
6889
16
4052
‘i
to t
ot;d
ha
nlpl
c JX
2
-12.
0 -1
0.7
37.5
32
.2
31.6
44
.9
41.8
42
.0
42.4
46
.1
36.8
34
.2
25.4
22
.0
25.S
37
.1

Tabl
e A
6.
Chur
crct
eris
tics
offu
ll-tim
e em
ploy
ees
earn
ing
less
tlu
m t
he m
onth
ly
min
imum
nw
ge
YKU
1976
19
77
1978
19
79
1980
19
81
1982
19
83
1984
19
85
1986
19
87
1988
19
89
1990
19
91
Ave
rage
# of
tot
al s
ampl
e #o
f LT
MW
%
to
tota
l sa
mpl
e
Sex M
ales
Fe
mal
es
Reg
ion
UllX
lll
Rur
al
Cen
tral
Val
ley
Res
t of
cou
ntry
Hea
ds
of f
amili
es
Non
hea
ds
of f
amili
es
Age
Less
tha
n I9
2G
29
30-3
9 40
-49
SO-5
9 60
-69
70+
Educ
atio
n Pr
imar
y Se
cond
ary
Uni
vers
ity
Firm
siz
e l-9
IO
+
2267
6 I
8017
4 35
.4
30.7
48
.9
28.3
41
.5
34. I
38
.6
25.3
44.1
56.6
28
.0
28.7
28
.0
29.8
34
.3
30.2
39.3
20
.2
8.0
1917
73
2267
37
5945
9 69
647
31.0
30
.7
27.3
27
.0
41.0
41
.6
22.2
23
.6
39.9
36
.0
27.7
28
.5
48.6
36
.2
20.4
20
.4
39.5
39
.7
52.8
54
.2
23.6
23
.1
22.6
21
.4
21.2
21
.7
26.8
26
.6
39.2
29
.8
34.3
46
.3
35.7
33
.7
19.3
23
.6
1.6
5.8
- -
- -
2208
60
2397
12
1742
18
1837
30
2238
39
2440
13
2084
97
2021
15
2908
00
3039
94
2849
75
3139
96
2727
48
5524
5 25
.0
19.9
39
. I
18.3
30
.5
22.1
31
.9
14.9
34.3
47.9
19
.3
14.0
19
.4
18.3
23
.1
47.9
28.7
15
.7
- 37.4
16
.8
6601
0 42
004
7852
4 27
.5
24. I
42
.7
23.3
19
.8
36.6
40
.9
36.2
60
.2
21.2
16
.5
27.3
33
.3
31.2
52
.2
22.8
20
.6
40.7
39
.2
38.3
46
.6
17.7
14
.8
27.7
36.4
32
.8
57.6
47.3
47
.6
72.6
22
.2
19.6
41
.1
19.3
15
.1
26.3
20
.5
15.4
31
.2
24.8
23
.9
41.9
37
.2
28.6
40
.2
38.6
54
.9
36.9
30.6
28
.2
49.0
20
. I
16.6
30
.8
1.6
- 11
.9
40.8
36
.4
57.6
20
.5
16.9
32
.9
8176
2 90
912
8015
5 79
701
36.5
37
.3
38.4
39
.4
31.3
33
.7
36.9
36
.0
50.4
48
. I
42.8
48
.9
29.0
28
.2
25.9
43
.9
45.7
49
.9
33.7
34
.0
33.2
44
.4
44.5
49
.7
24.2
27
.1
30.4
48.3
47
.3
46.4
28.2
45
.7
37.5
42
.7
26.4
49.9
66.2
60
.9
69.2
66
.5
32.3
34
.0
33.2
36
.5
25.3
26
.8
28.0
26
.0
28.4
32
.5
28.6
30
.8
27.1
36
.2
38.7
37
.8
37.0
50
.8
45.7
37
.3
42.9
47
.0
30.0
45
.8
43.1
-
48.2
27
.4
- 23
.8
6.4
- 5.
5
52.6
-
48.4
25
.9
- 31
.6
- - - - -
9336
9 10
3530
86
812
32.1
34
. I
30.5
28.
I 30
.8
27.4
42
.4
42.8
38
.9
24.9
25
.9
22.6
39
.8
41.8
38
. I
28.8
30
.9
26.8
39
.9
41.0
38
.2
21.5
22
.6
20.4
40.7
43
.3
39.
I
57.0
60
.8
49.9
29
.3
29.5
29
.2
20.0
22
.2
24.2
23
.2
25.8
22
.0
29.7
35
.3
24.0
49
.4
47.5
24
.4
49.7
45
. I
28.3
37.9
39
.4
36.0
22
.9
24.6
21
.7
7.4
7.7
9.7
47.5
47
.7
47.7
21
.1
25.7
21
.5
8219
3 99
252
26.2
36
.4
2380
48
7804
7 33
.0
23.1
32
.0
29.0
34
.6
48.3
44
.1
19.5
30
.3
24.5
32
.5
42.5
40
.3
22.7
32
.1
29.8
33
.5
44.5
41
.1
18.5
26
.6
22.4
32.6
45
.4
42.3
46.7
61
.3
57.3
22
.0
35.2
28
.6
20.0
25
.2
22.8
19
.3
30.6
24
.9
27.2
28
.6
29.8
34
.8
49.7
38
.1
53.4
57
.9
43.1
31.2
43
. I
31.4
18
.6
26.
I 22
.2
3.9
10.6
5.
7
42.0
52
.2
46.4
18
.6
26.9
23
.5
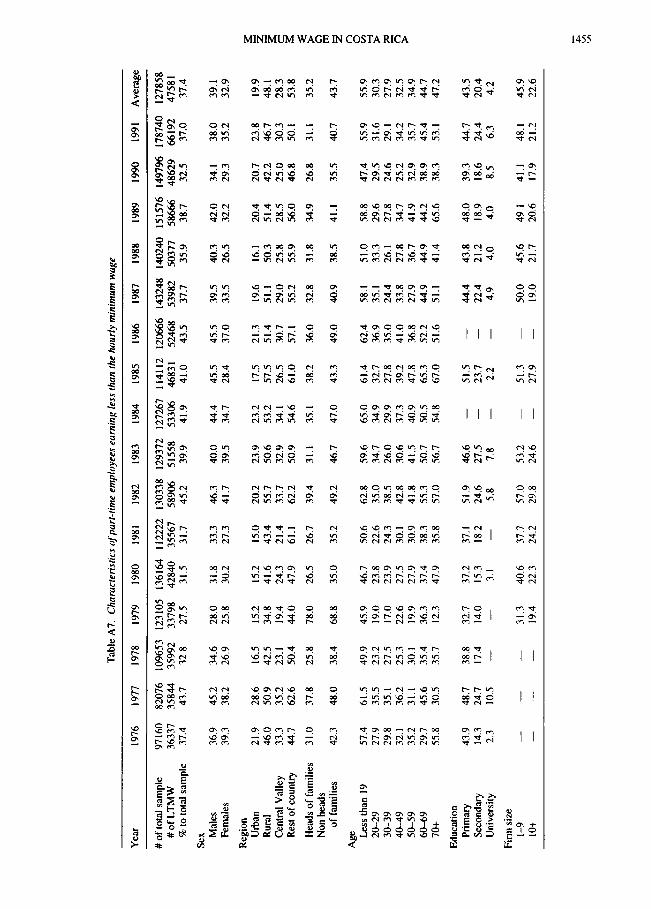
Tabl
e A
l. C
haru
cter
islic
s of
pcrr
&rim
e em
ploye
es
eurn
ing
less
Hum
th
e ho
urly
min
imum
w
qe
Yea
r I9
76
1971
19
78
1979
19
80
1981
19
82
1983
19
84
1985
19
86
1987
19
88
1989
19
90
1991
A
vera
ge
# of
tot
al s
ampl
e 97
160
8207
6 #o
f LT
MW
36
337
3584
4 W
to t
otal
sam
ple
37.4
43
.7
Sex M
ales
Fe
mal
es
36.9
45
.2
34.6
28
.0
31.8
39
.3
38.2
26
.9
25.8
30
.2
Reg
ion
Urb
an
Rur
al
Cen
tral
Val
ley
Res
t of
cou
ntry
Hea
ds
of f
amili
es
Non
bea
ds
of f
amili
es
21.9
28
.6
46.0
50
.9
33.3
35
.2
44.1
62
.6
31.0
37
.8
42.3
48
.0
Age
Less
tha
n I9
20
-29
30-3
9 40
-49
S&59
60
-69
70+
57.4
61
.5
49.9
45
.9
46.7
27
.9
35.5
23
.2
19.0
23
.8
29.8
35
. I
27.5
17
.0
23.9
32
. I
36.2
25
.3
22.6
27
.5
35.2
31
.1
30.
I 19
.9
21.9
29
.1
45.6
35
.4
36.3
37
.4
55.8
30
.5
35.7
12
.3
47.9
Educ
atio
n Pr
imar
y Se
cond
ary
Uni
vers
ity
43.9
48
.7
14.3
24
.7
2.3
IO.5
Firm
siz
e l-9
IO
+
1096
53
1231
05
1361
64
1122
22
1303
38
1293
72
3599
2 33
798
4284
0 32
.8
27.5
31
.5
16.5
15
.2
15.2
42
.5
34.8
41
.6
23.
I 19
.4
24.3
50
.4
44.0
47
.9
25.8
78
.0
26.5
38.4
68
.8
35.0
38.8
32
.7
17.4
14
.0
- -
31.2
15
.3
3.1
- 31
.3
40.6
-
19.4
22
.3
3556
7 58
906
31.7
45
.2
33.3
46
.3
27.3
41
.7
15.0
20
.2
43.4
55
.7
21.4
33
.7
61.1
62
.2
26.1
39
.4
35.2
49
.2
50.6
62
.8
22.6
35
.0
24.3
38
.5
30. I
42
.8
30.9
41
.8
38.3
55
.3
35.8
57
.0
37. I
51
.9
18.2
24
.6
- 5.
8
37.7
57
.0
24.2
29
.8
5155
8 39
.9
I272
67
5330
6 41
.9
4683
1 52
468
5398
2 41
.0
43.5
37
.1
1402
40
5037
7 35
.9
40.0
44
.4
45.5
45
.5
39.5
40
.3
39.5
34
.7
28.4
37
.0
33.5
26
.5
23.9
23
.2
50.6
53
.2
32.9
34
. I
50.9
54
.6
31.1
35
. I
17.5
21
.3
57.5
51
.4
26.5
30
.7
61.0
57
. I
38.2
36
.0
43.3
49
.0
19.6
16
.1
51.1
50
.3
29.0
25
.8
55.2
55
.9
32.8
31
.8
46.7
47
.0
40.9
38
.5
59.6
65
.0
61.4
62
.4
58.1
51
.0
34.1
34
.9
32.7
36
.9
35. I
33
.3
26.0
29
.9
27.8
35
.0
24.4
26
. I
30.6
37
.3
39.2
41
.0
33.8
27
.8
41.5
40
.9
47.8
36
.8
27.9
36
.7
50.7
50
.5
65.3
52
.2
44.9
44
.9
56.7
54
.8
67.0
51
.6
51.1
41
.4
46.6
-
51.5
-
44.4
43
.8
27.5
-
23.7
-
22.4
21
.2
7.8
- 2.
2 -
4.9
4.0
53.2
51
.3
- 50
.0
45.6
24
.6
27.9
-
19.0
21
.7
1141
12
1206
66
1432
48
1515
76
1497
96
1787
40
5866
6 48
629
6619
2 38
.7
32.5
37
.0
42.0
34
. I
38.0
32
.2
29.3
35
.2
20.4
20
.7
23.8
51
.4
42.2
46
.7
28.5
25
.0
30.3
56
.0
46.8
50
. I
34.9
26
.8
31.1
41.1
35
.5
40.7
58.8
47
.4
55.9
29
.6
29.5
31
.6
27.8
24
.6
29.1
34
.7
25.2
34
.2
41.9
32
.9
35.7
44
.2
38.9
45
.4
65.6
38
.3
53. I
48.0
39
.3
44.7
18
.9
18.6
24
.4
4.0
8.5
6.3
49.1
41
.1
48.1
20
.6
17.9
21
.2
1278
58
4758
I
37.4
39.1
32
.9
19.9
48
.1
28.3
53
.8
35.2
43.7
55.9
30
.3
27.9
32
.5
34.9
44
.7
47.2
43.5
20
.4
4.2
45.9
22
.6

Tabl
e A
8.
Clu
wuc
teris
tics
%fil
l-tim
e se
&em
ploy
ed
earn
ing
less
fhu
n th
e m
onth
ly
min
imum
w
uge
Yea
r 19
80
1981
19
82
1983
19
84
1985
19
86
1987
19
88
1989
19
90
1991
A
vera
ge
#of
tota
l sa
mpl
e #o
f LT
MW
%
of
tota
l sa
mpl
e
Sex M
ales
Fe
mal
es
Reg
ion
Urb
an
Rur
al
Cen
tml
Val
ley
Res
t of
cou
ntry
Hea
ds
of f
amili
es
Non
hea
ds
of f
amili
es
Age
Less
tha
n I9
2&
29
30-3
9 40
-49
So-5
9 6(
M9
70+
4610
1 34
448
3799
5 43
865
6287
5 50
625
4723
0 68
564
7080
8 73
420
7119
8 60
932
5567
2 IS
421
6253
IS
677
1369
3 21
032
I605
8 14
671
2507
8 23
046
2516
7 22
73 I
23
066
1849
1 33
.5
18.2
41
.3
31.2
33
.5
31.7
31
.1
36.6
32
.5
34.3
31
.9
37.9
32
.8
32.3
16
.6
38.7
29
. I
31.3
30
.4
29.9
34
.6
30.3
33
.7
29.2
37
.7
31.2
43
.5
31.3
62
.5
47.6
53
.7
42.5
41
.9
49.6
51
.3
38.7
49
.5
38.6
45
.9
19.0
10
.5
26.7
25
.0
23.
I 16
.6
16.7
28
.3
21.6
22
.3
19.9
28
.9
21.6
d
41.8
27
.8
SO.8
37
.6
43.7
46
.5
40.0
45
.4
42.0
44
.8
44.2
46
.4
42.6
?
23.0
12
.8
34.6
26
. I
26.4
23
.8
20.4
30
.9
24.2
29
.5
24.4
32
.8
2.5.
7 46
.6
32.0
47
.8
40.7
44
.4
47.3
42
.2
46.2
45
.6
41.5
44
.9
45.6
43
.7
E 32
.2
16.5
39
.4
29.0
30
.2
26.8
28
.9
34.4
29
.9
31.2
28
.2
33.6
30
.0
s
37.6
23
.7
47.7
39
.0
44.2
49
.3
40.
I 42
.9
41.9
46
.4
42.4
51
.3
42.2
5
62.0
6.
2 49
.6
38.0
81
.5
62.3
47
.3
42.9
57
.7
70.9
44
.0
74.7
53
.1
34.2
15
.6
41.3
28
.6
31.9
41
.8
32.6
35
.3
30.3
35
.2
3 I .
o 38
.9
33.1
4
33.3
16
.8
39.4
28
.3
26.0
26
.2
25.0
31
.8
27.6
24
.8
26.6
32
.9
28.2
31
.5
14.1
37
.3
21.6
33
.7
25.8
31
.5
35.8
30
.6
28.3
31
.0
34.9
29
.7
25.8
24
.6
34.4
36
.6
35.0
29
.0
31.7
39
.7
32.3
42
.0
33.4
33
.3
33.2
35
.4
27.0
47
.7
55.6
38
.8
36.
I 37
.6
52.7
48
.4
51.8
43
.5
57.0
44
.3
64.4
37
.0
87.1
59
.1
50.3
42
.4
~52.
8 47
.3
64.
I 55
.5
72.0
55
.4
s7.3
Educ
atio
n Pr
imar
y 33
.9
22.5
45
.0
35.7
-
36.8
38
.4
36.5
38
.4
36.4
43
.4
36.7
Se
cond
ary
23.6
S.
I 24
.9
16.6
-
20.4
-
30.9
20
.7
20.4
20
. I
26.9
21
.0
Uni
vers
ity
IO.5
2.
6 12
.8
- 8.
1 -
9.7
9.0
16.8
6.
6 4.
9 8.
1

Tabl
e A9
. Ct
ltrm
rteris
tic..~
of
‘pcr
rt-tim
e se
lf-em
plov
ed
ecrm
inp
less
th
trn
the
hour
lv
min
imum
w
we
Yea
r I9
80
1981
19
82
1983
19
84
1985
19
86
1987
19
88
1989
19
90
1991
Av
erag
e
# of
tot
al
sam
ple
#of
LTM
W
% o
f to
tal
sum
ple
Sex M
ales
Fe
mal
es
Regi
on
Urba
n Ru
ral
Cent
ml
Vulle
y Re
st
of c
ount
ry
Head
s of
fa
mili
es
Non
he&
of
fam
ilies
Age Le
ss
than
19
2&
29
3G3Y
40
49
S&-.5
9 6&
6Y
70+
Educ
atio
n Pr
imar
y Se
cond
ary
Univ
ersi
ty
S603
9 39
782
3787
0 S3
839
4724
I
4026
8 39
050
6332
6 72
642
7625
6 75
327
9848
2 58
344
I720
9 95
83
1171
7 17
147
1480
9 12
894
1368
1 22
380
2640
7 2.
5686
27
074
3572
3 19
526
30.7
24
. I
30.9
31
.8
31.3
32
.0
35.0
35
.3
36.4
33
.7
35.9
36
.3
32.8
29.
I 21
.5
32.0
28
.9
30.2
36
.7
32,s
27
.S
42.4
34
.8
18.S
16
.4
19.6
23
.5
21.8
37
.6
30.4
38
.1
37.6
40
.0
19.7
19
.8
24.
I 26
.8
28.7
45
.2
36.6
39
.5
38.0
35
.8
29.8
24
.3
28.6
28
.7
28.6
32
.7
23.6
35
.4
37.8
36
.4
42.8
18
.5
SO.5
40
.2
51.9
26
. I
18.1
33
.9
31.7
30
.9
29.3
21
.7
28.8
24
.6
26.0
36
.2
18.3
25
.0
33.0
29
.7
23.3
31
.7
28.0
26
.4
24.9
29
.4
26.8
32
.2
42.3
36
. I
45.8
S3
.6
34.8
SO
.3
S8.8
32. I
25
.2
3s.4
33
.2
- 14
.3
7.6
16.5
29
.3
- 13
,s
2.5
31.4
32
.9
34.6
35
.1
32.1
37
.0
35.6
3
I .7
33.8
41
.3
37.0
39
. I
36.3
33
.9
37.3
36
. I
21.7
23
.8
23.2
23
.2
24.2
26
. I
27.0
22
.4
41.9
40
.4
46.2
46
.2
42.4
44
.7
45.1
40
.9
25.6
29
.8
30.7
31
.1
25.2
30
.4
30.4
26
.9
40.6
41
.1
42.1
44
.6
44.5
44
.3
45.6
41
.5
30.5
32
.9
34.2
34
.7
33.6
37
. I
33.8
31
.4
35.0
39
.3
37.0
38
.8
33.9
34
.2
39.6
35
.3
49.7
36
.7
52.1
60
.2
32.4
48
.6
44.0
44
.0
30.3
36
.7
33.5
34
.2
32.3
3.
0 34
.8
28.8
31
.2
34.9
31
.5
28.5
28
.8
28.0
34
.7
29.1
21.6
30
. I
29.0
34
.2
30.5
31
.7
32.7
29
.3
42.2
37
. I
27.
I 38
.4
38.9
41
.3
33.8
32
.8
23.9
30
.5
56.0
39
.3
37.4
46
.3
42.6
36
.9
50.0
46
.2
46.0
47
.6
52.2
51
.6
51.1
49
.0
37.3
39
.4
39.9
38
.8
41.6
40
.4
36.3
21.2
25
.2
28.6
17
.8
19.5
26
.6
20.7
I.7
3.
6 4.
4 14
.0
6.0
10.8
5.
7

Year
Tabl
e A
10.
Chu-
ucte
ristic
s of
wor
kers
ea
rnin
g le
ss t
hun
the
mon
thly
/hou
rly
min
imum
wu
ge
1976
19
77
1978
19
79
1980
19
81
1982
19
83
1984
19
85
1986
19
87
1988
19
89
1990
19
91
Ave
rage
# of
tot
al s
ampl
e 42
6061
34
8079
41
2255
44
1669
48
5992
37
7333
40
0348
48
5101
51
4730
47
2285
46
9306
59
3462
55
8249
43
6551
#
of L
TMti
% t
o to
tal
sam
ple
1491
41
35.0
11
1139
13
3033
31
.9
32.3
11
9883
14
4691
27
.1
29.8
24.3
27
.5
36.1
37
.7
19.0
20
.1
33.3
37
.8
22.2
24
.2
37.2
42
.0
20.8
23
.5
33.8
36
.4
46.7
48
.0
21.0
24
.0
18.5
22
.6
1065
23
1657
82
1807
78
1936
71
28.2
Sex M
ales
Fe
mal
es
32.2
29
.7
30.7
45
.1
39.0
37
.3
26.6
33
.4
Reg
ion
UltX
M
Rum
I C
entra
l V
alle
y R
est
of c
ount
ry
Hea
ds
of f
amili
es
Non
hea
ds
of f
amili
es
25.1
42
.1
31.3
42
.3
32.6
21.2
21
.8
41.1
39
.4
27.0
27
. I
49.6
42
. I
23.9
25
.3
16.7
38
.2
21.7
47
.1
36.9
50.1
39
.9
39.4
38
.0
Age
Less
tha
n 19
20
-29
30-3
9 4&
49
50-5
9 6C
69
70+
56.4
54
.5
52.6
28
.3
25.3
24
.8
29.7
23
.9
26.1
30
.8
22.2
25
.1
28.5
28
.5
29.2
31
.9
35.4
34
.3
46.1
41
.3
48.4
22.7
26
.4
23.3
27
.7
Educ
atio
n Pr
imar
y Se
cond
ruy
Uni
vers
ity
38.7
36
.7
36.2
18
.7
17.6
21
.6
5.5
3.6
4.0
Firm
si
ze
l-9
IO+
- - - -
36.9
37
.3
42.8
48
.3
31.0
33
.1
16.7
18
.6
2.1
2.3
34.8
40
.7
17.5
21
.1
49.4
22
.8
21.7
22
.2
30.4
31
.5
45.2
33.0
18
.0
1.9
37.1
19
.2
41.4
37
.3
37.6
38.5
34
.6
35.9
51
.2
45.3
43
.1
23.6
27
.0
25.6
50
.9
46.4
47
.4
35.5
32
.8
32.4
50
.5
46.4
47
.4
31.6
29
.3
30.4
52.2
44
.2
45.8
66.8
62
.4
62.2
38
.1
33.4
34
.0
30.2
27
.6
27.8
34
.2
30.9
33
.3
39.1
33
.3
36.8
41
.3
49.7
46
.0
49.3
48
.0
51.6
50.2
42
.8
38.2
28
.6
27.6
24
.3
9.3
6.4
6.9
57.3
52
.8
- 31
.9
25.5
-
1778
39
1819
74
2061
40
1919
24
1454
78
37.7
38
.8
34.7
34
.4
33.3
37.7
37
.4
33.1
33
.3
32.1
26
.4
34.2
32
. I
37.4
42
.8
38.8
37
.4
36.2
32
.6
42.2
39
.7
23.2
24
.8
24.5
49
.9
47.1
44
.4
30.0
38
.3
29.5
50
.4
47.7
45
.4
32.6
30
.9
28.0
43.6
46
.9
41.1
23.1
22
.0
19.9
28
.0
44.2
43
.2
35.8
44
.3
29.1
27
.4
23.5
31
.4
45.3
44
.9
38.0
46
.7
27.9
24
.9
20.7
28
.2
41.3
39
.8
33.7
43
.3
64.5
63
.3
57.1
56
.9
53.7
47
.0
59.0
33
.2
35.8
31
.8
30.8
29
.3
24.2
33
.8
27.5
28
.4
25.5
24
.8
25.3
21
.3
26.7
31
.0
33.3
29
.8
27.6
26
.6
21.3
32
. I
41.1
37
.5
31.2
35
.0
31.5
28
.9
31.5
45
.6
45.4
46
.8
43.6
35
.2
37.1
47
.4
51.9
53
.9
51.5
47
.8
51.4
42
.7
53.9
45.8
39
.0
40.5
38
.6
40.4
33
.9
43.7
44
.4
22.6
19
.8
23.7
22
.8
20.9
18
.6
25.5
24
.7
7.1
6.2
7.1
6.1
7.1
5.6
8.4
6.4
49.6
-
48.5
46
.8
48.4
41
.6
50.1
46
.2
30.5
-
20.6
24
.8
21.3
18
.5
25.2
23
.3
4637
92
4514
88
1308
22
1654
44
28.2
36
.6
4585
44
1565
16
34.0
22.9
42
.8
29.0
3
45.2
g
28.0
g
41.8
E
56.3
29
.4
25.5
28
. I
32. I
40
.3
48.4