the navigators group, inc. - iis windows...
TRANSCRIPT
The Navigators Group, Inc.“Insuring a World in Motion”
Credit Suisse First BostonAnnual Insurance ConferenceNovember 16, 2005
Stanley A. Galanski, President & CEOPaul J. Malvasio, EVP & CFO
2
Forward Looking Statements
This presentation contains forward-looking statements that are subject to risks and uncertainties. All statements other than statements of historical fact included in this presentation are forward-looking statements. Forward-looking statements give our current expectations and projections relating to our financial condition, results of operations, plans, objectives, future performance and business. You can identify forward-looking statements by the fact that they do not relate strictly to historical or current facts. These statements may include words such as "anticipate," "estimate," "expect," "project," "plan,“ "intend," "believe" and other words and terms of similar meaning in connection with any discussion of the timing or nature of future operating or financial performance or other events. These forward-looking statements are based on assumptions that we have made in light of our industry experience and on our perceptions of historical trends, current conditions, expected future developments and other factors we believe are appropriate under the circumstances. As you consider this presentation, you should understand that these statements are not guarantees of performance or results. They involve risks, uncertainties (some of which are beyond our control) and assumptions. Although we believe that these forward-looking statements are based on reasonable assumptions, you should be aware that many factors could affect our actual financial results and cause them to differ materially from those anticipated in the forward-looking statements.
Because of these factors, we caution that you should not place undue reliance on any of our forward-looking statements. Further, any forward-looking statement speaks only as of the date on which it is made. New risks and uncertainties arise from time to time, and it is impossible for us to predict those events or how they may affect us. Except as required by law, we have no duty to, and do not intend to, update or revise the forward-looking statements in this presentation after the date of this presentation.

3
Navigators – Investment Highlights
I. A global leader in marine insuranceMarine Insurance Pool formed in 1974 (Navigators Insurance Company)Lloyd’s Syndicate 1221 acquired in 1998. Well positioned to capitalize on post-Katrina/Rita opportunity in ocean marine
II. A track record of “hard market” growth and profitability3 year 25% compound annual Gross Written Premium growth rate (2002-2004)One of Fortune’s 100 fastest growing companies (2003 and 2004)Imbedded growth by retaining more profitable business net in 2006
III. Successful implementation of diversification strategySpecialty Property & Casualty product and geographic expansionProfessional Liability growing and profitablePortfolio diversification for stronger earnings stream
IV. A strong and leveragable platformRated “A” by A.M. Best and Standard and Poor’sLloyd’s licenses provide access to major world marketsDeep, experienced management teamNo debt
4
“KatRita” Impact to Marine Market
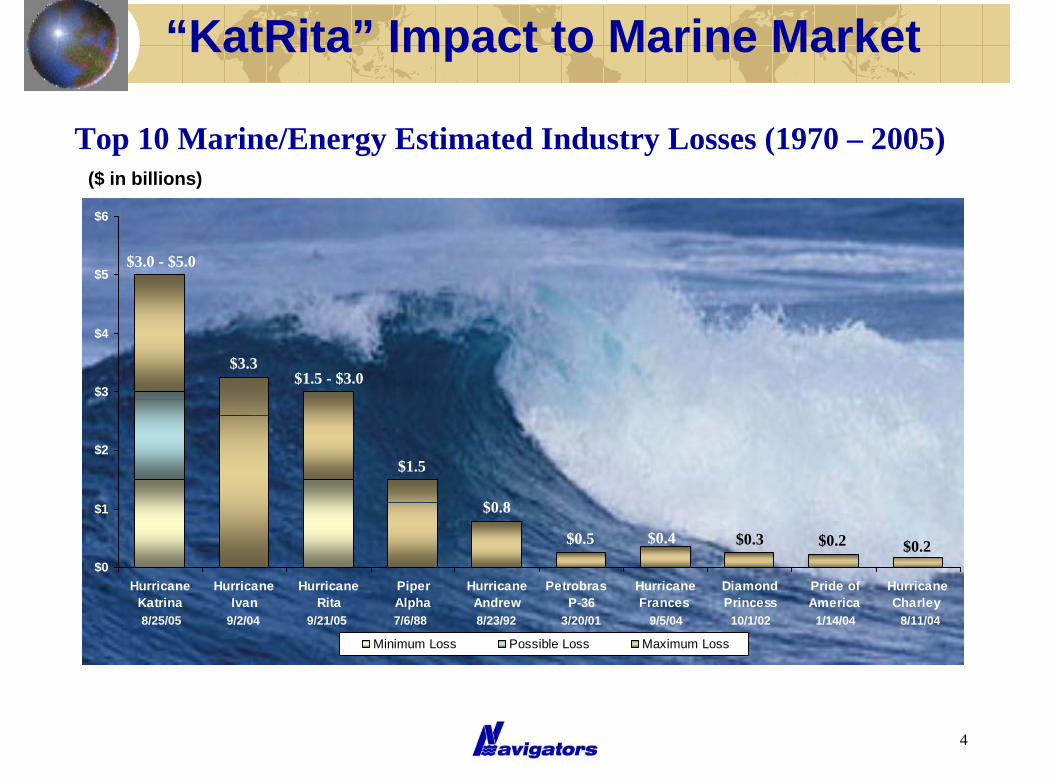
Top 10 Marine/Energy Estimated Industry Losses (1970 – 2005)
$0
$1
$2
$3
$4
$5
$6
HurricaneKatrina
HurricaneIvan
HurricaneRita
Piper Alpha
HurricaneAndrew
Petrobras P-36
HurricaneFrances
DiamondPrincess
Pride ofAmerica
HurricaneCharley
Minimum Loss Possible Loss Maximum Loss
$0.2$0.2$0.3$0.4$0.5
$0.8
$1.5
$1.5 - $3.0
$3.0 - $5.0
$3.3
($ in billions)
8/25/05 9/2/04 9/21/05 7/6/88 8/23/92 3/20/01 9/5/04 10/1/02 1/14/04 8/11/04
5
Hurricane Rita – The Knock-out Punch
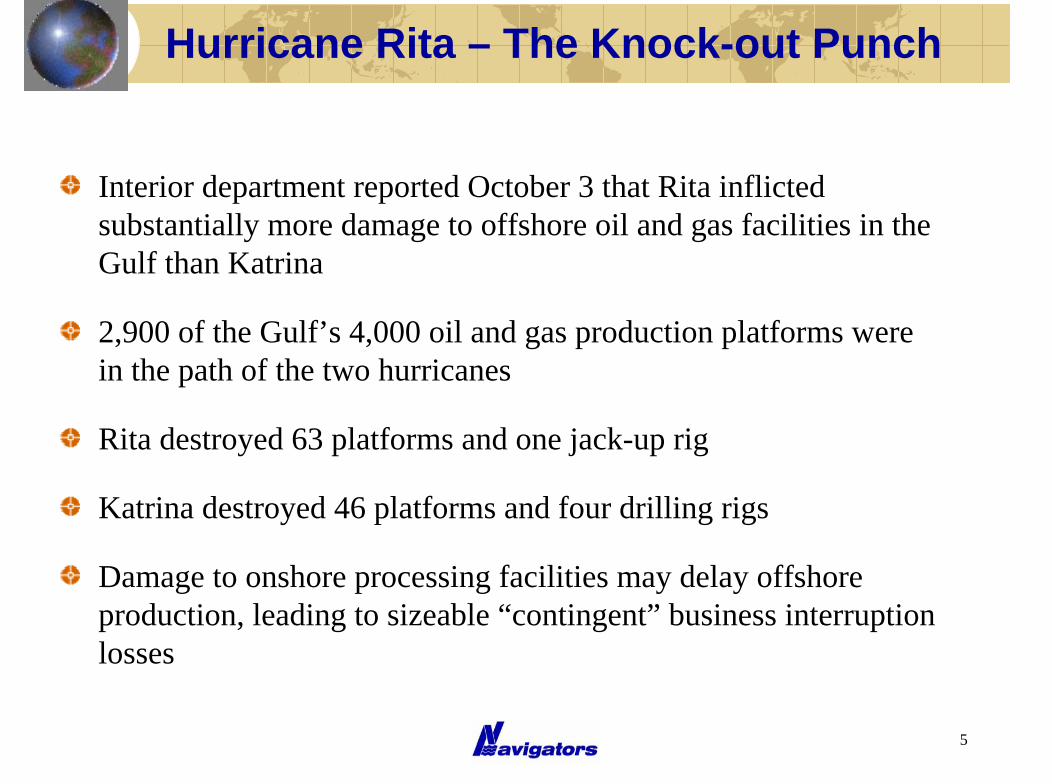
Interior department reported October 3 that Rita inflicted substantially more damage to offshore oil and gas facilities in the Gulf than Katrina
2,900 of the Gulf’s 4,000 oil and gas production platforms were in the path of the two hurricanes
Rita destroyed 63 platforms and one jack-up rig
Katrina destroyed 46 platforms and four drilling rigs
Damage to onshore processing facilities may delay offshore production, leading to sizeable “contingent” business interruption losses
6
“KatRita” Impact to Navigators
Navigators has a substantial excess of loss reinsurance program that limits the Company’s exposure to catastrophic claims
Net after-tax loss estimated at $15 million for Katrina and $9 million for Rita
Navigators underwriters declined to insure several of the “high-profile”accounts with major losses, thereby beating the industry result
While absorbing two of the largest marine market catastrophe losses ever in the third quarter, we expect to make a profit for the full year
A.M. Best to re-affirmed “A” rating and upgrade outlook
7
The Navigators Opportunity
Hurricanes Katrina and Rita have devastated offshore energy underwriters, wiping out three to four years worth of industry premiumWe anticipate Gulf of Mexico exposures will receive rate increases of 100% or more for all accounts; those with losses will pay substantially moreWe anticipate overall marine rate levels to increase at least 10% in 2006We suspect a number of underwriters will exit the offshore energy sector altogetherWe expect the level of losses experienced by the industry in Rita and Katrina to stabilize pricing across all lines of business
Lloyd’s Marine & EnergyI. A global leader in marine insurance:
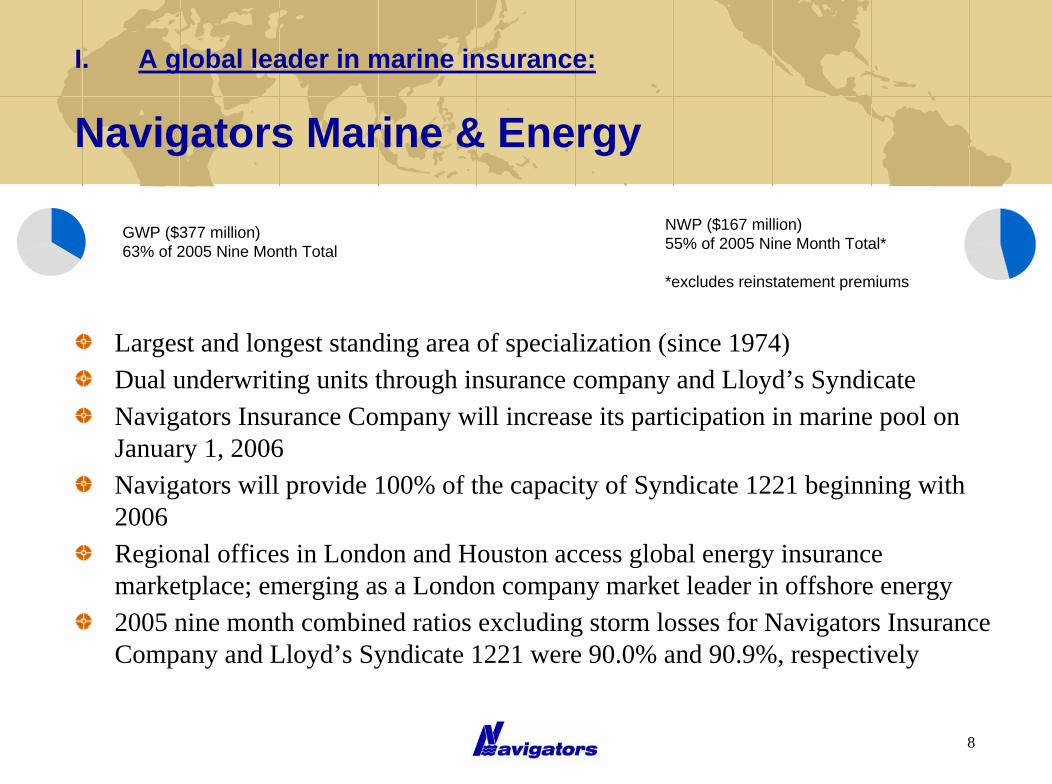
Navigators Marine & Energy
Largest and longest standing area of specialization (since 1974)Dual underwriting units through insurance company and Lloyd’s SyndicateNavigators Insurance Company will increase its participation in marine pool on January 1, 2006Navigators will provide 100% of the capacity of Syndicate 1221 beginning with 2006Regional offices in London and Houston access global energy insurance marketplace; emerging as a London company market leader in offshore energy2005 nine month combined ratios excluding storm losses for Navigators Insurance Company and Lloyd’s Syndicate 1221 were 90.0% and 90.9%, respectively
GWP ($377 million)63% of 2005 Nine Month Total
Marine & Energy (Lloyd's)
Navigators Pro
Navigators Specialty
8
NWP ($167 million)55% of 2005 Nine Month Total*
*excludes reinstatement premiumsMarine & Energy (Lloyd's)
Navigators Pro
Navigators Specialty
9
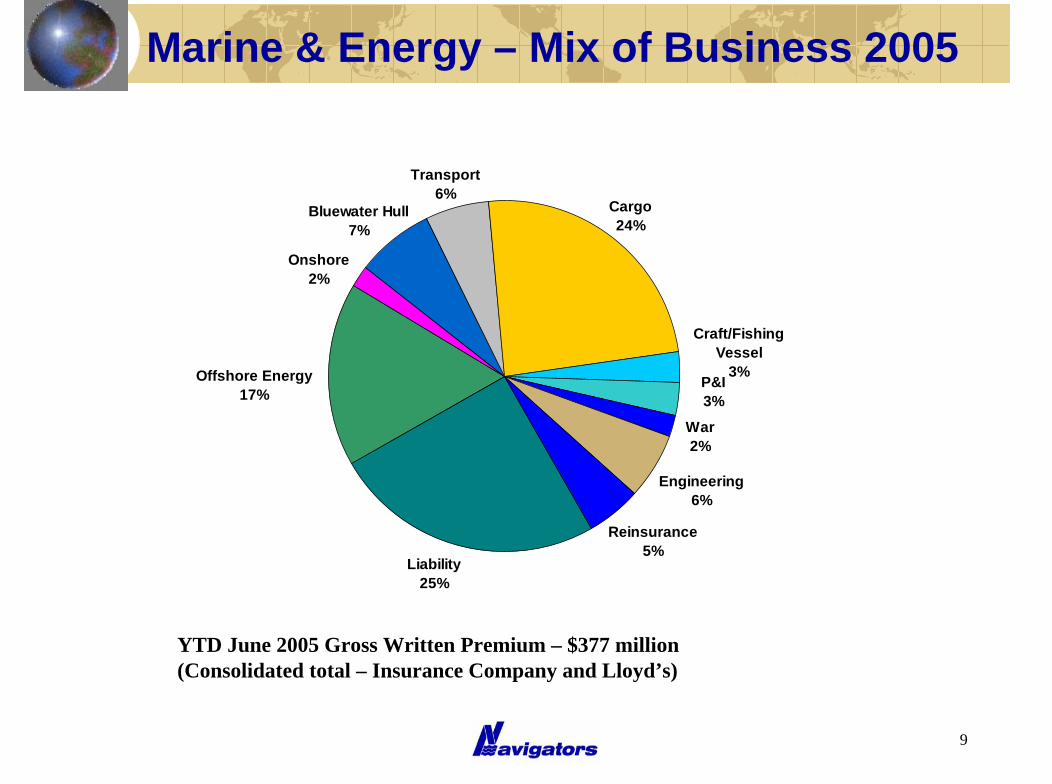
Marine & Energy – Mix of Business 2005
Transport6%
Cargo24%
Liability25%
Offshore Energy17%
Onshore2%
Craft/Fishing Vessel
3%P&I3%
War2%
Bluewater Hull7%
Reinsurance5%
Engineering6%
YTD June 2005 Gross Written Premium – $377 million(Consolidated total – Insurance Company and Lloyd’s)
10
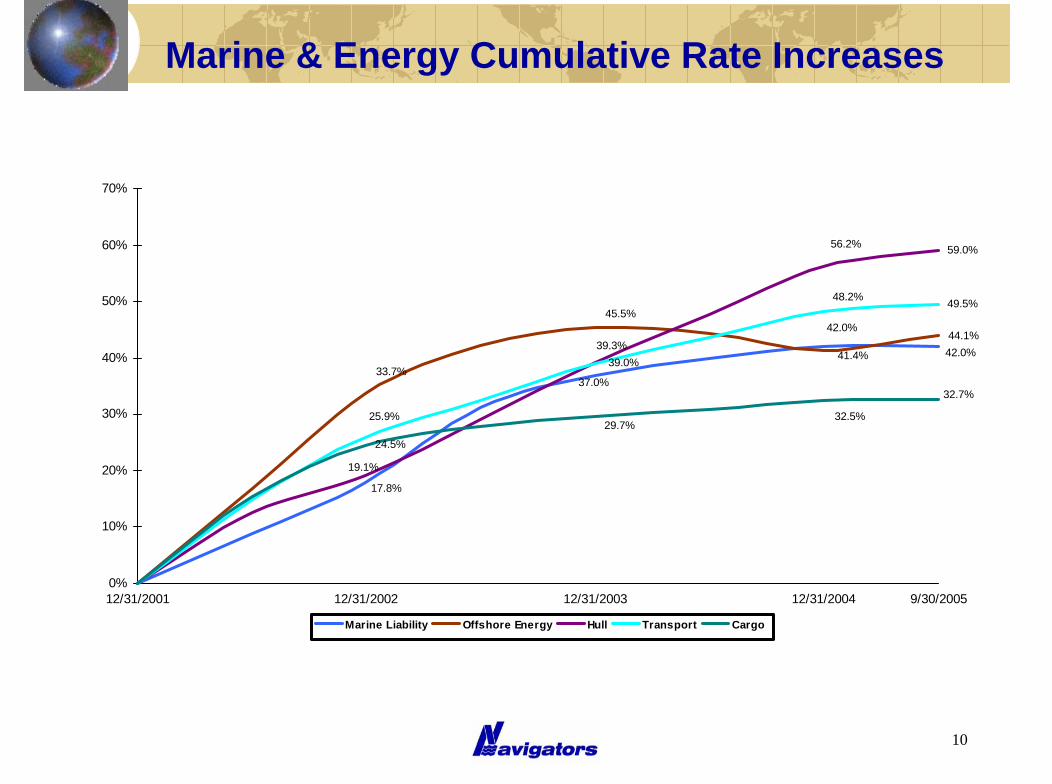
Marine & Energy Cumulative Rate Increases
59.0%
49.5%
24.5%
17.8%
37.0%
42.0%
42.0%
33.7%
45.5%
44.1%
41.4%
56.2%
39.3%
19.1%
39.0%
25.9%
48.2%
32.5%
32.7%
29.7%
0%
10%
20%
30%
40%
50%
60%
70%
12/31/2001 12/31/2002 12/31/2003 12/31/2004 9/30/2005
Marine Liability Offshore Energy Hull Transport Cargo
11
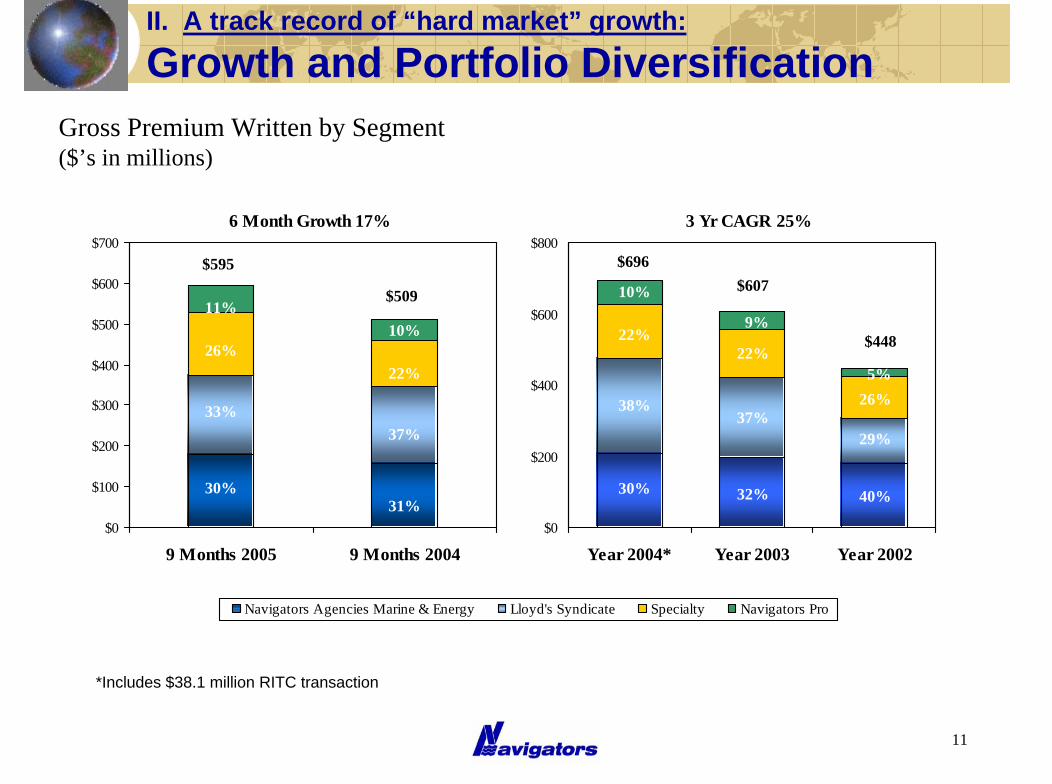
II. A track record of “hard market” growth:
Growth and Portfolio Diversification
6 Month Growth 17%
$0
$100
$200
$300
$400
$500
$600
$700
9 Months 2005 9 Months 2004
Gross Premium Written by Segment($’s in millions)
3 Yr CAGR 25%
$0
$200
$400
$600
$800
Year 2004* Year 2003 Year 2002
11%
26%
33%
30%
$509
$595
9%
22%
37%
32%
5%26%
29%
40%
$607
$448
10%
22%
38%
30%
$696
10%
22%
37%
31%
*Includes $38.1 million RITC transaction
Navigators Agencies Marine & Energy Lloyd's Syndicate Specialty Navigators Pro
Lloyd’s Marine & Energy
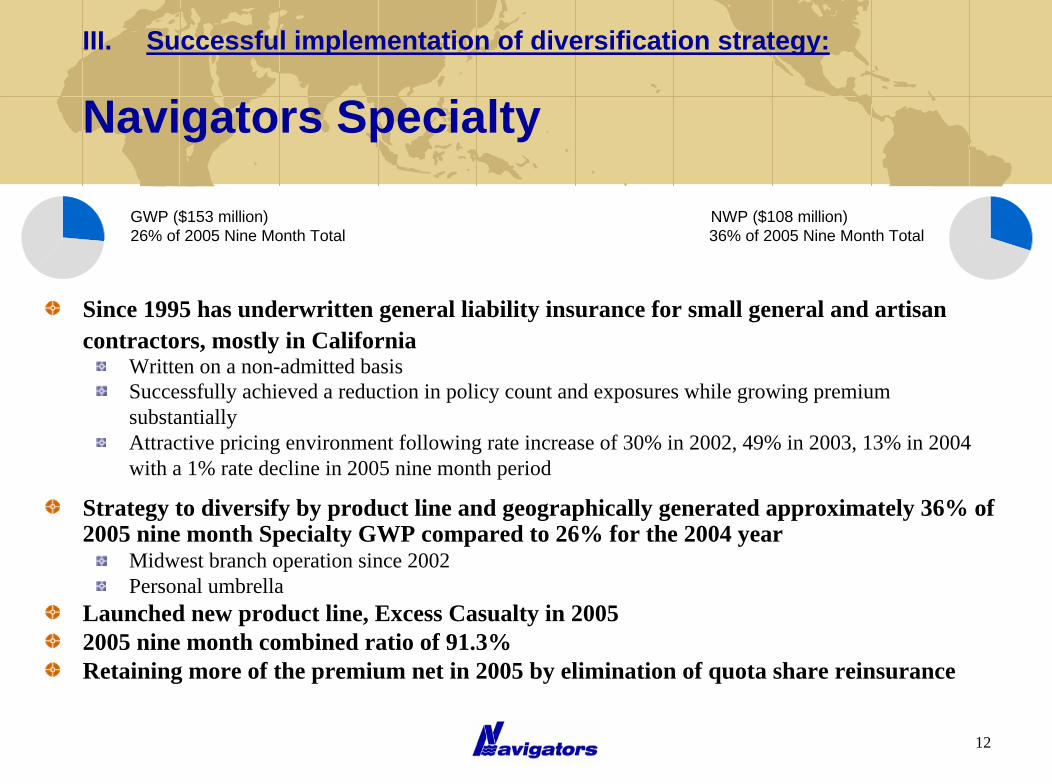
III. Successful implementation of diversification strategy:
Navigators Specialty
Marine & Energy (Lloyd's)
Navigators Pro
Navigators Specialty
Marine & Energy (Lloyd's)
Navigators Pro
Navigators Specialty
GWP ($153 million) NWP ($108 million)26% of 2005 Nine Month Total 36% of 2005 Nine Month Total
Since 1995 has underwritten general liability insurance for small general and artisan contractors, mostly in California
Written on a non-admitted basisSuccessfully achieved a reduction in policy count and exposures while growing premium substantiallyAttractive pricing environment following rate increase of 30% in 2002, 49% in 2003, 13% in 2004 with a 1% rate decline in 2005 nine month period
Strategy to diversify by product line and geographically generated approximately 36% of 2005 nine month Specialty GWP compared to 26% for the 2004 year
Midwest branch operation since 2002Personal umbrella
Launched new product line, Excess Casualty in 20052005 nine month combined ratio of 91.3%Retaining more of the premium net in 2005 by elimination of quota share reinsurance
12

13
Navigators Specialty
4,489 4,755
8,995
512 6331,009 1,022 1,231
2,035
-
1,000
2,000
3,000
4,000
5,000
6,000
7,000
8,000
9,000
10,000
Small Artisan Commercial GC Residential GC
Year 2004 Year 2003 Year 2002
In Force Policy CountsExposure Management Strategy – Dramatic Reduction in IFC
14
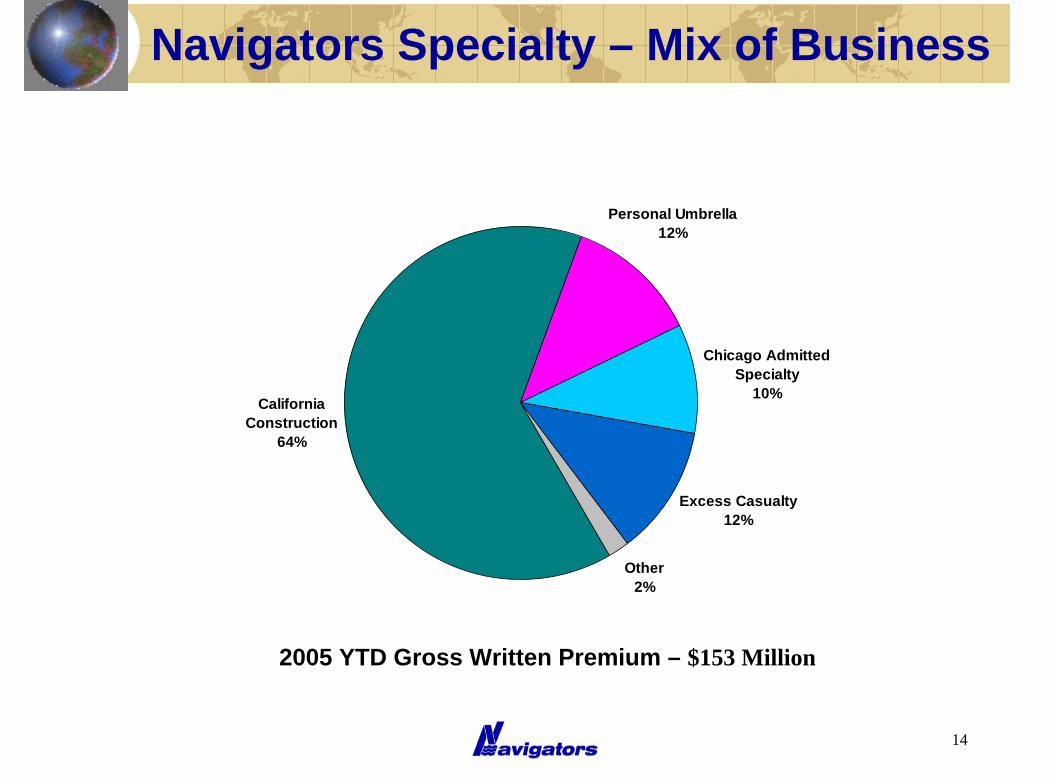
Navigators Specialty – Mix of Business
Excess Casualty12%
Other2%
California Construction
64%
Personal Umbrella12%
Chicago Admitted Specialty
10%
2005 YTD Gross Written Premium – $153 Million
Lloyd’s Marine & Energy
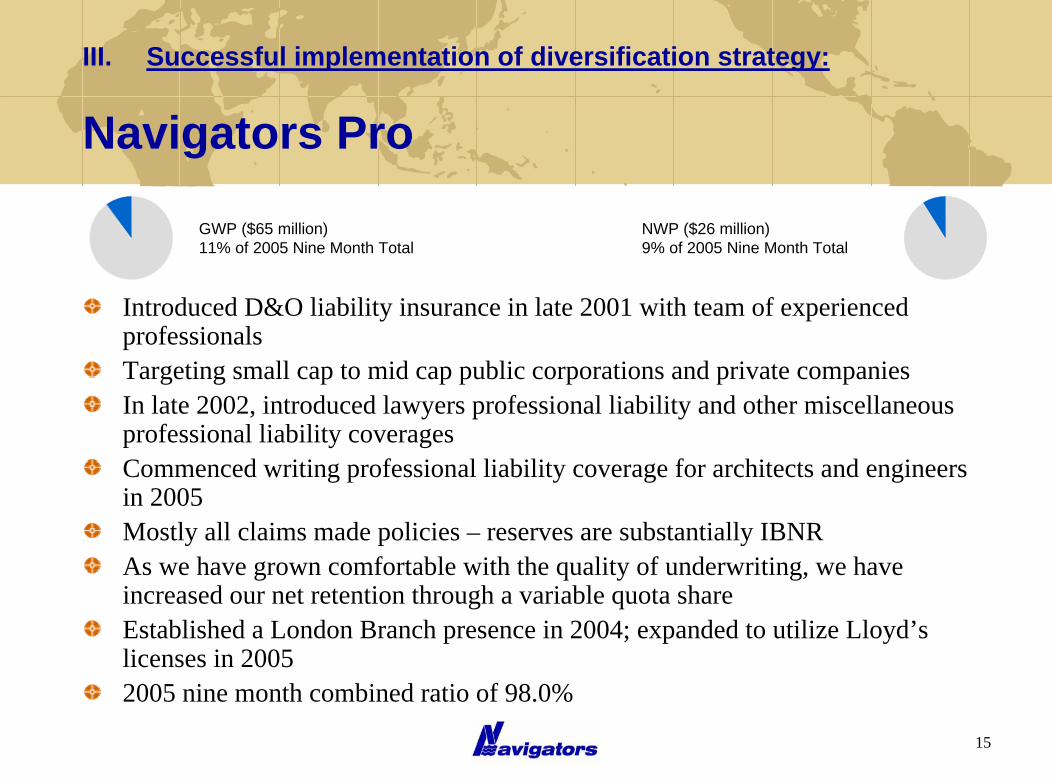
Introduced D&O liability insurance in late 2001 with team of experienced professionalsTargeting small cap to mid cap public corporations and private companiesIn late 2002, introduced lawyers professional liability and other miscellaneous professional liability coveragesCommenced writing professional liability coverage for architects and engineers in 2005Mostly all claims made policies – reserves are substantially IBNRAs we have grown comfortable with the quality of underwriting, we have increased our net retention through a variable quota shareEstablished a London Branch presence in 2004; expanded to utilize Lloyd’s licenses in 20052005 nine month combined ratio of 98.0%
GWP ($65 million)11% of 2005 Nine Month Total
III. Successful implementation of diversification strategy:
Navigators Pro
15
NWP ($26 million)9% of 2005 Nine Month Total
16
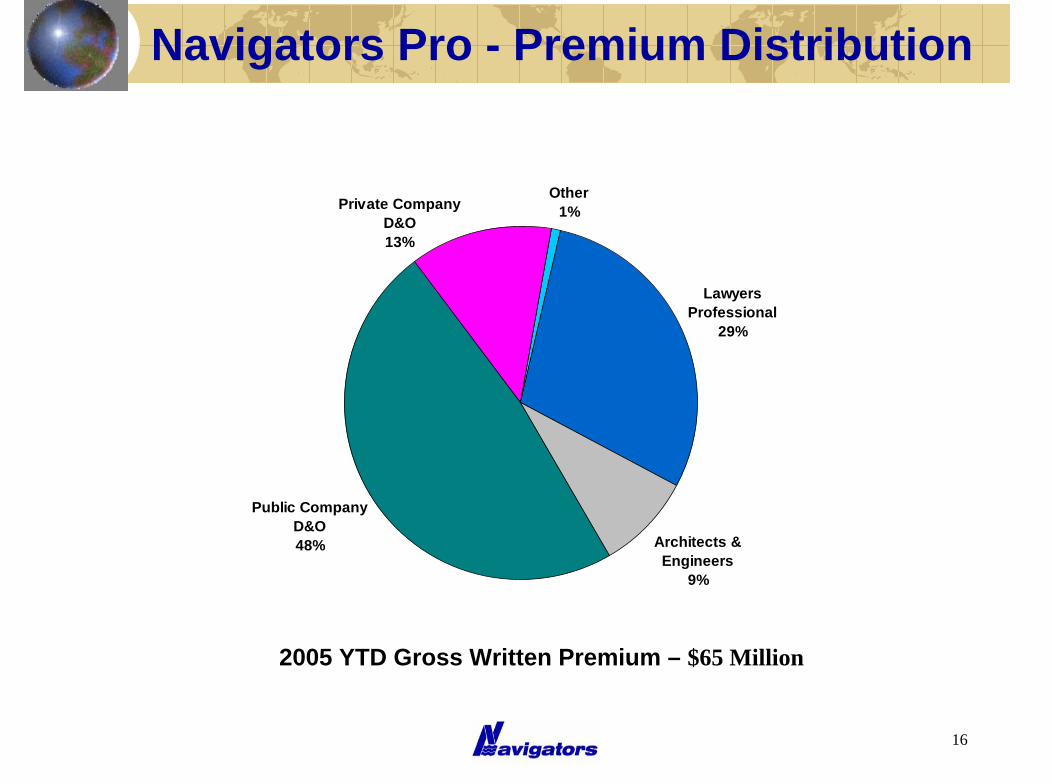
Navigators Pro - Premium Distribution
Lawyers Professional
29%
Architects & Engineers
9%
Public Company D&O48%
Private CompanyD&O13%
Other1%
2005 YTD Gross Written Premium – $65 Million
17
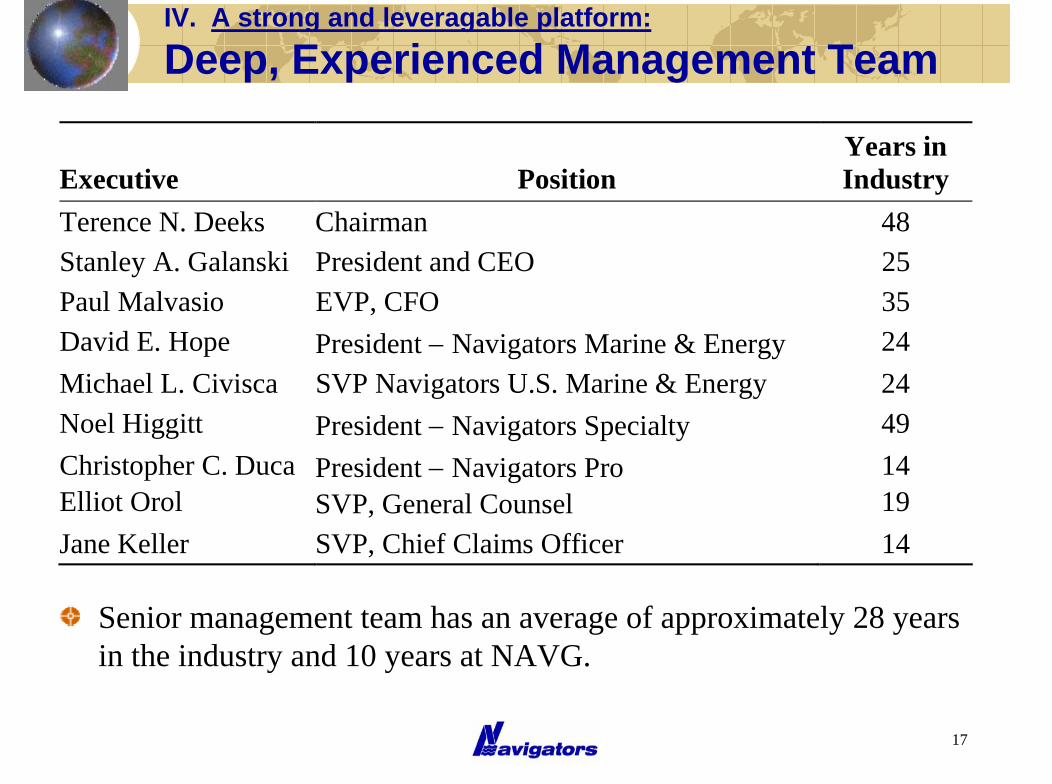
Senior management team has an average of approximately 28 years in the industry and 10 years at NAVG.
Executive
Position
Years in Industry
Terence N. Deeks Chairman 48 Stanley A. Galanski President and CEO 25 Paul Malvasio EVP, CFO 35 David E. Hope President − Navigators Marine & Energy 24 Michael L. Civisca SVP Navigators U.S. Marine & Energy 24 Noel Higgitt President − Navigators Specialty 49 Christopher C. Duca Elliot Orol
President − Navigators Pro SVP, General Counsel
14 19
Jane Keller SVP, Chief Claims Officer 14
IV. A strong and leveragable platform:
Deep, Experienced Management Team
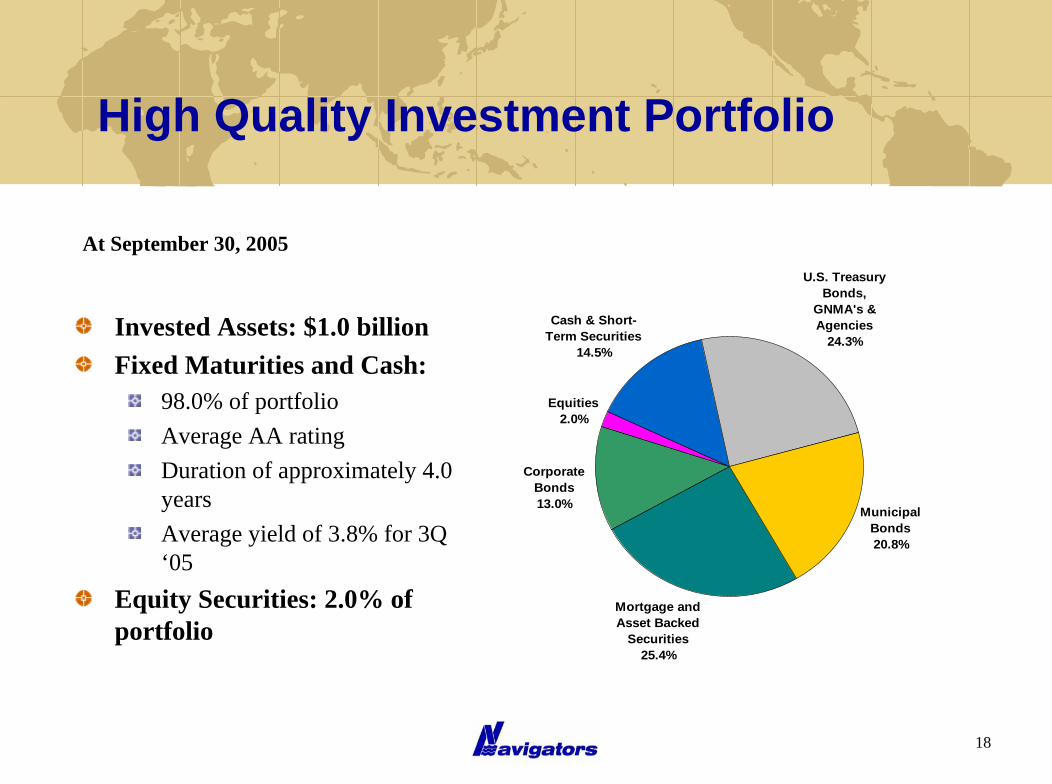
Lloyd’s Marine & EnergyHigh Quality Investment Portfolio
U.S. Treasury Bonds,
GNMA's & Agencies
24.3%
Municipal Bonds20.8%
Mortgage and Asset Backed
Securities25.4%
Corporate Bonds13.0%
Equities2.0%
Cash & Short-Term Securities
14.5%Invested Assets: $1.0 billionFixed Maturities and Cash:
98.0% of portfolioAverage AA ratingDuration of approximately 4.0 yearsAverage yield of 3.8% for 3Q ‘05
Equity Securities: 2.0% of portfolio
At September 30, 2005
18
19
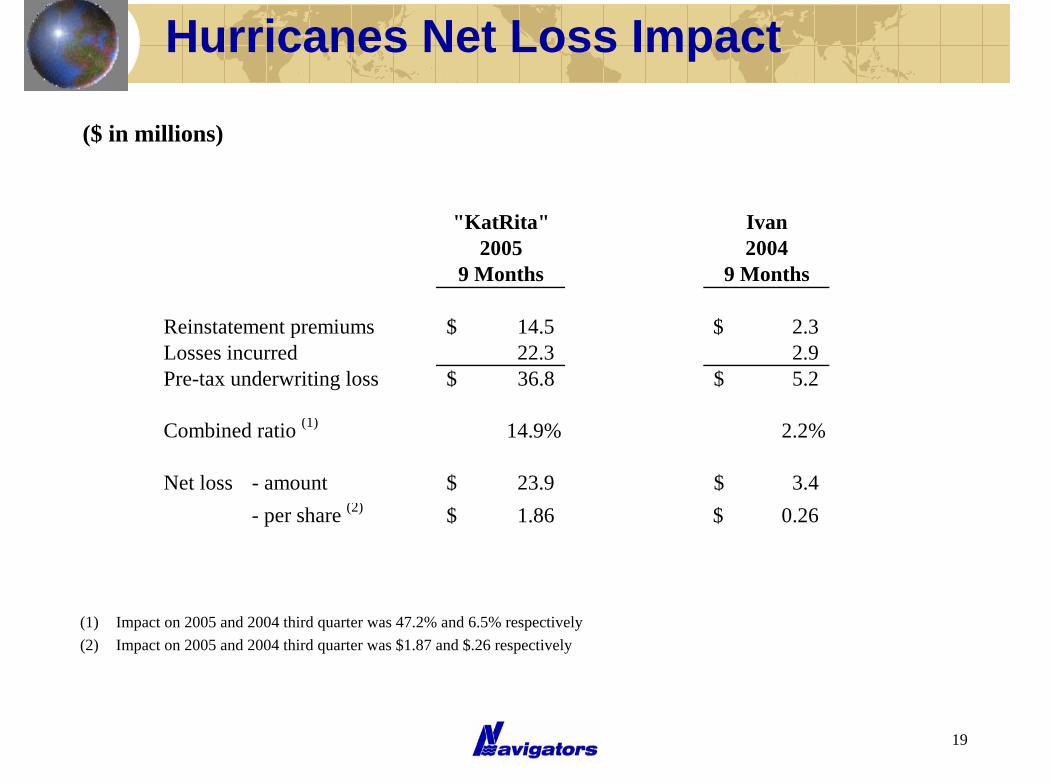
Hurricanes Net Loss Impact
($ in millions)
(1) Impact on 2005 and 2004 third quarter was 47.2% and 6.5% respectively(2) Impact on 2005 and 2004 third quarter was $1.87 and $.26 respectively
"KatRita" Ivan2005 2004
9 Months 9 Months
Reinstatement premiums 14.5$ 2.3$ Losses incurred 22.3 2.9Pre-tax underwriting loss 36.8$ 5.2$
Combined ratio (1) 14.9% 2.2%
Net loss - amount 23.9$ 3.4$ - per share (2) 1.86$ 0.26$

20
Key Summary Financial Data
($ in millions)
(1) Excludes Hurricanes effects for both periods
20059 Months
20049 Months Change
Gross written premium $595 $509 17%
Net written premium $286 $236 22%
Net investment income $26 $19 33%
Combined ratio (1) 90.7% 88.2%
Cash flow $168 $142 18%
Adjusted net income (1) $2.50 $2.18 15%
ROE (beginning book value) (1) 13.0% 12.8%
21
The Navigators’ Story
Proven track record and commitment to underwriting profit
Recent new capital will be deployed immediately toward profitable growth, rather than to fill a hole in the balance sheet
“Once in a career” opportunity in the offshore energy sector
Global leader in marine insurance with the know-how and market presence to capitalize on the immediate market opportunity in ocean marine
Expected continued satisfactory market conditions in Specialty and Professional Liability lines
Opportunity to retain more existing business net
22
Navigators“Insuring a World in Motion”
Navigators“Insuring a World in Motion”