the nbfc liquidity situation: analysis and insights nbfc liquidity situation.pdf · vehicle loans...
TRANSCRIPT
The NBFC Liquidity Situation:Analysis and Insights
J u l y 2 0 1 9
Table of Contents
• Quantum of debt raised
• Sources of debt
• Products providing liquidity
• Cost of funds
• Potential factors impacting liquidity
• Vivriti Capital clients’ view
• Outlook

Quantum of debt
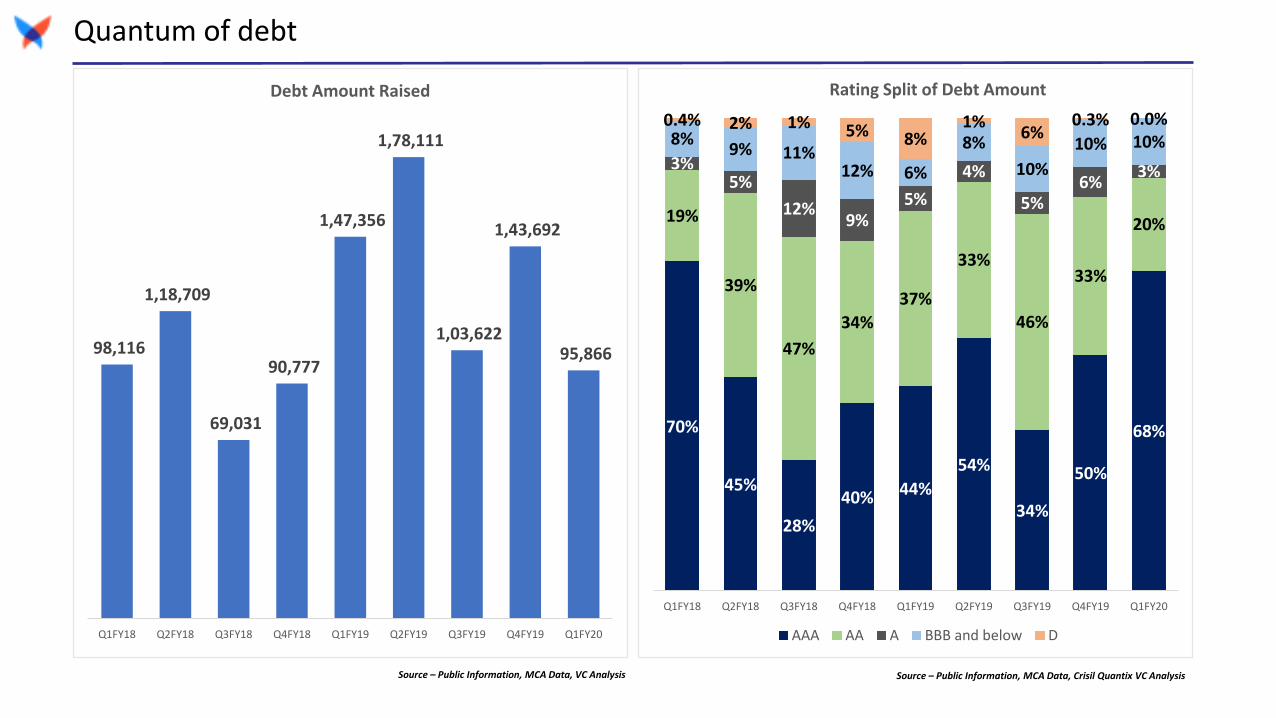
Quantum of debt
98,116
1,18,709
69,031
90,777
1,47,356
1,78,111
1,03,622
1,43,692
95,866
Q1FY18 Q2FY18 Q3FY18 Q4FY18 Q1FY19 Q2FY19 Q3FY19 Q4FY19 Q1FY20
Debt Amount Raised
70%
45%
28%
40% 44%
54%
34%
50%
68%
19%
39%
47%
34%
37%
33%
46%
33%
20%
3%5%
12%9%
5%
4%
5%6%
3%
8%9% 11%
12% 6%
8%
10%
10% 10%0.4% 2% 1% 5% 8%
1%6%
0.3% 0.0%
Q1FY18 Q2FY18 Q3FY18 Q4FY18 Q1FY19 Q2FY19 Q3FY19 Q4FY19 Q1FY20
Rating Split of Debt Amount
AAA AA A BBB and below D
Source – Public Information, MCA Data, VC Analysis Source – Public Information, MCA Data, Crisil Quantix VC Analysis
Sector and Rating trends (1/3)
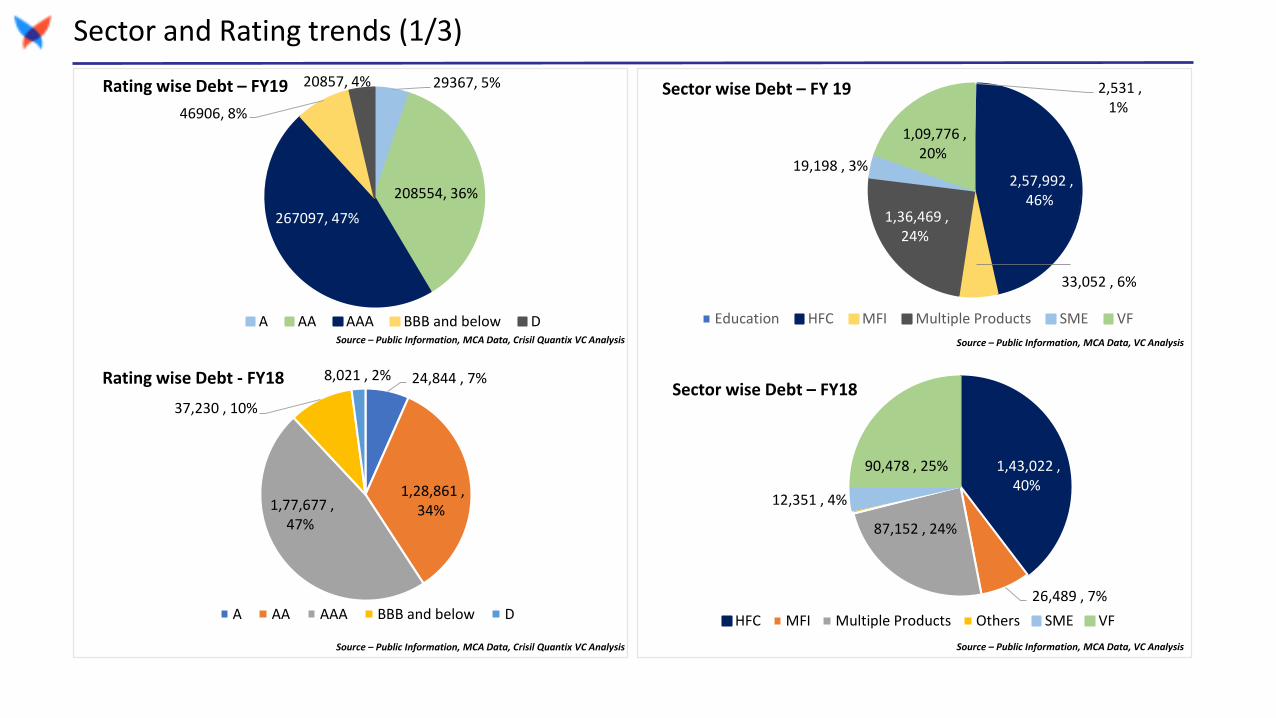
29367, 5%
208554, 36%
267097, 47%
46906, 8%
20857, 4%Rating wise Debt – FY19
A AA AAA BBB and below D
24,844 , 7%
1,28,861 , 34%1,77,677 ,
47%
37,230 , 10%
8,021 , 2%Rating wise Debt - FY18
A AA AAA BBB and below D
2,531 , 1%
2,57,992 , 46%
33,052 , 6%
1,36,469 , 24%
19,198 , 3%
1,09,776 , 20%
Sector wise Debt – FY 19
Education HFC MFI Multiple Products SME VF
1,43,022 , 40%
26,489 , 7%
87,152 , 24%
12,351 , 4%
90,478 , 25%
Sector wise Debt – FY18
HFC MFI Multiple Products Others SME VF
Source – Public Information, MCA Data, Crisil Quantix VC Analysis
Source – Public Information, MCA Data, Crisil Quantix VC Analysis Source – Public Information, MCA Data, VC Analysis
Source – Public Information, MCA Data, VC Analysis
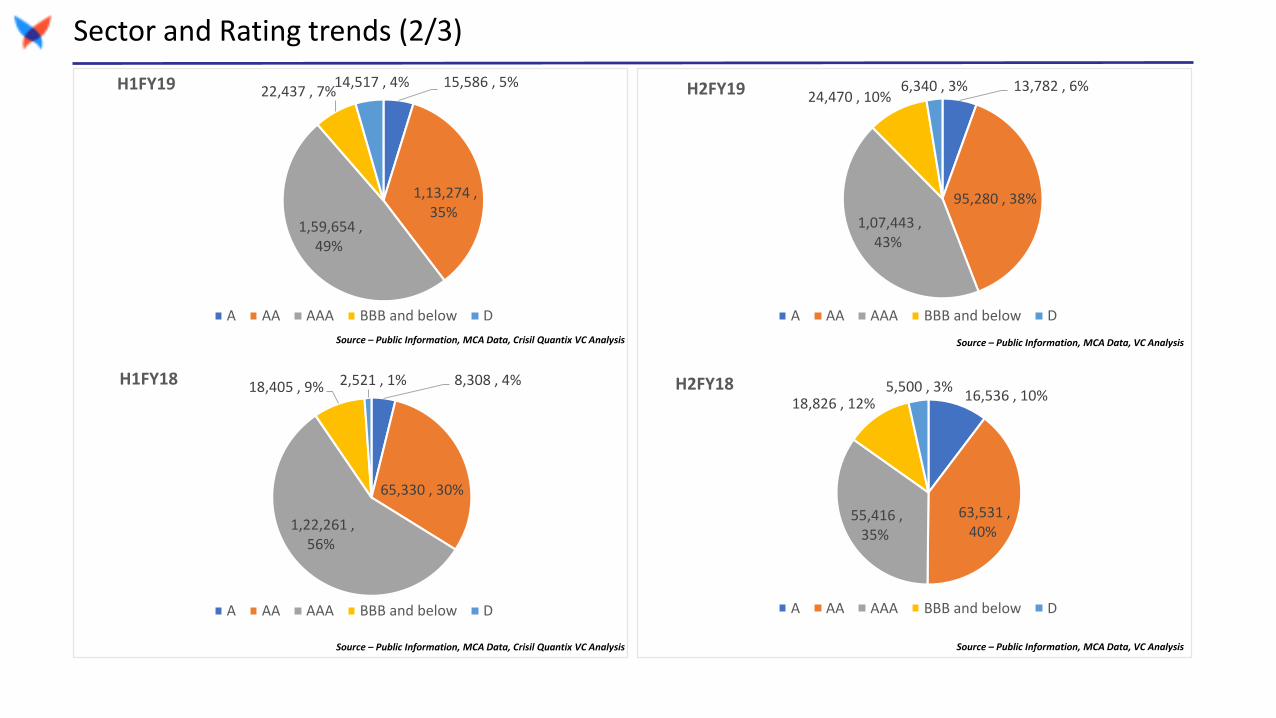
Sector and Rating trends (2/3)
15,586 , 5%
1,13,274 , 35%
1,59,654 , 49%
22,437 , 7%14,517 , 4%H1FY19
A AA AAA BBB and below D
8,308 , 4%
65,330 , 30%
1,22,261 , 56%
18,405 , 9% 2,521 , 1%H1FY18
A AA AAA BBB and below D
13,782 , 6%
95,280 , 38%
1,07,443 , 43%
24,470 , 10%6,340 , 3%H2FY19
A AA AAA BBB and below D
16,536 , 10%
63,531 , 40%
55,416 , 35%
18,826 , 12%5,500 , 3%H2FY18
A AA AAA BBB and below D
Source – Public Information, MCA Data, Crisil Quantix VC Analysis
Source – Public Information, MCA Data, Crisil Quantix VC Analysis Source – Public Information, MCA Data, VC Analysis
Source – Public Information, MCA Data, VC Analysis
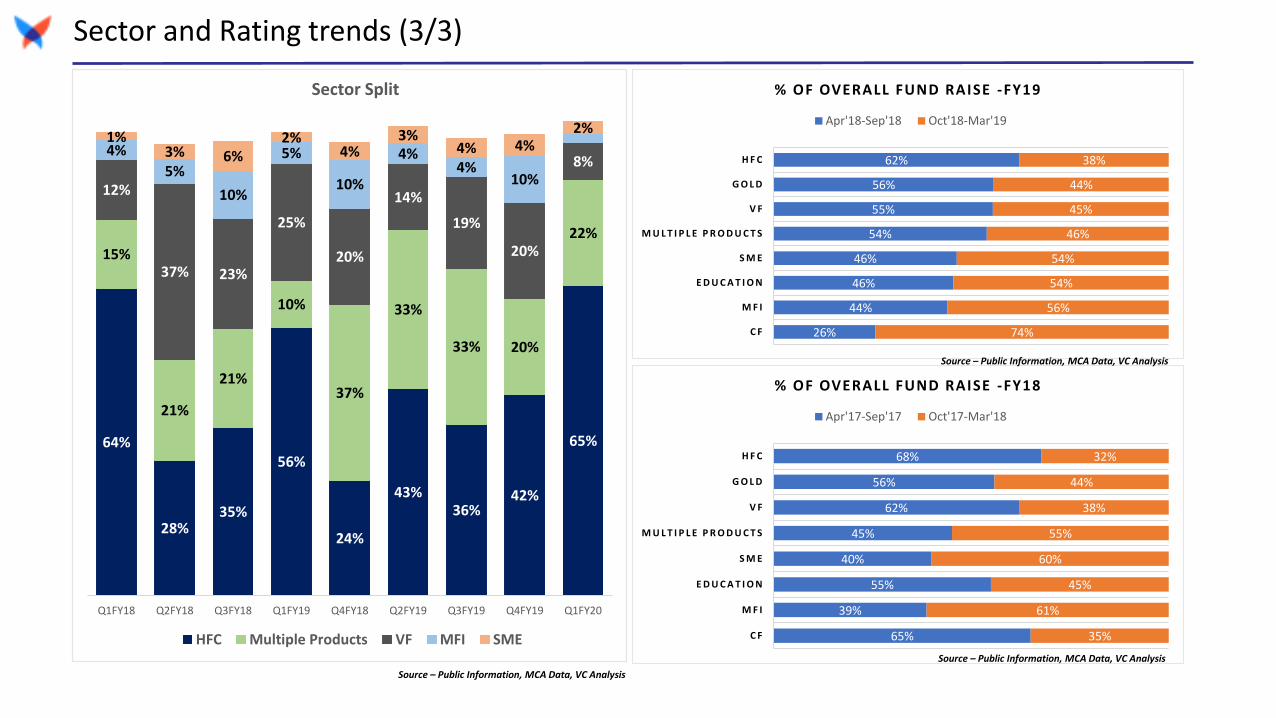
Sector and Rating trends (3/3)
64%
28%35%
56%
24%
43%36%
42%
65%
15%
21%
21%
10%
37%
33%
33% 20%
22%
12%
37% 23%
25%
20%
14%
19%
20%
8%4%
5%
10%
5%
10%
4%4%
10%
1%3% 6%
2%4%
3%4% 4%
2%
Q1FY18 Q2FY18 Q3FY18 Q1FY19 Q4FY18 Q2FY19 Q3FY19 Q4FY19 Q1FY20
Sector Split
HFC Multiple Products VF MFI SME
Source – Public Information, MCA Data, VC Analysis
26%
44%
46%
46%
54%
55%
56%
62%
74%
56%
54%
54%
46%
45%
44%
38%
C F
M F I
E D U C A T I O N
S M E
M U L T I P L E P R O D U C T S
V F
G O L D
H F C
% OF OVERALL FUND RAISE -FY19
Apr'18-Sep'18 Oct'18-Mar'19
65%
39%
55%
40%
45%
62%
56%
68%
35%
61%
45%
60%
55%
38%
44%
32%
C F
M F I
E D U C A T I O N
S M E
M U L T I P L E P R O D U C T S
V F
G O L D
H F C
% OF OVERALL FUND RAISE -FY18
Apr'17-Sep'17 Oct'17-Mar'18
Source – Public Information, MCA Data, VC Analysis
Source – Public Information, MCA Data, VC Analysis

Sources of funds
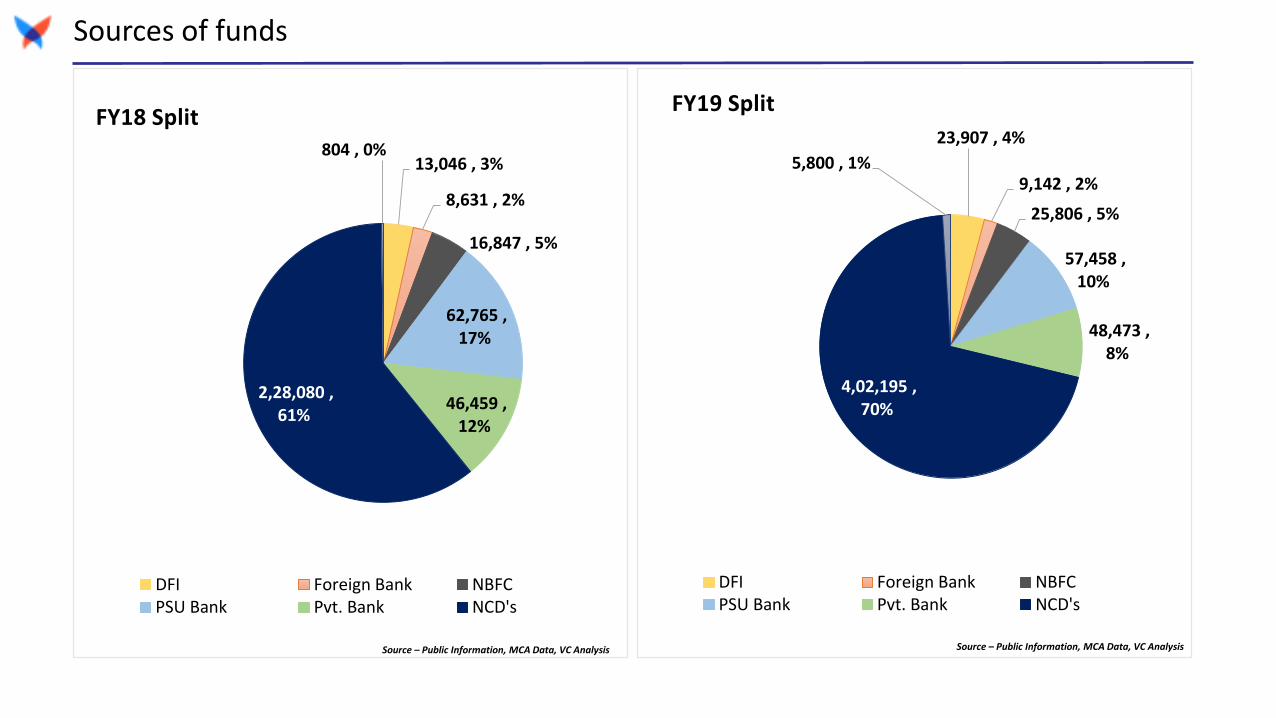
Sources of funds
13,046 , 3%
8,631 , 2%
16,847 , 5%
62,765 , 17%
46,459 , 12%
2,28,080 , 61%
804 , 0%
FY18 Split
DFI Foreign Bank NBFCPSU Bank Pvt. Bank NCD's
23,907 , 4%
9,142 , 2%
25,806 , 5%
57,458 , 10%
48,473 , 8%
4,02,195 , 70%
5,800 , 1%
FY19 Split
DFI Foreign Bank NBFCPSU Bank Pvt. Bank NCD's
Source – Public Information, MCA Data, VC Analysis Source – Public Information, MCA Data, VC Analysis
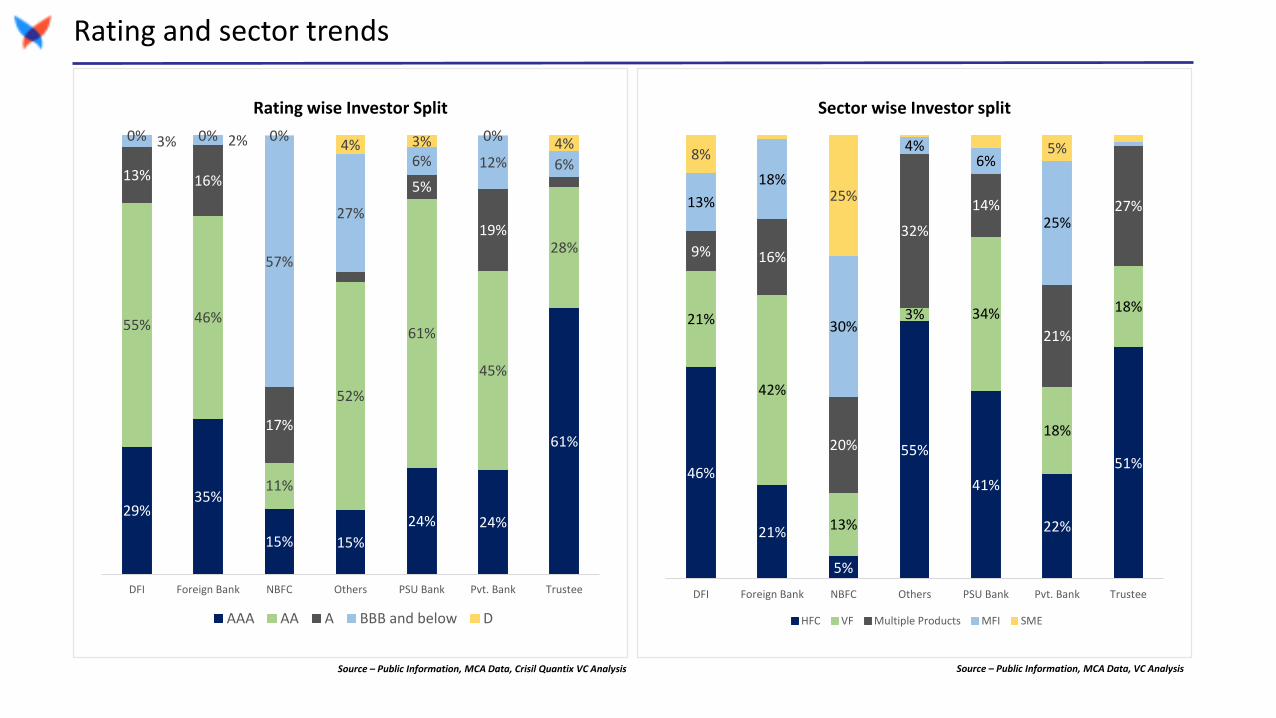
Rating and sector trends
29%35%
15% 15%
24% 24%
61%
55% 46%
11%
52%
61%
45%
28%
13% 16%
17%
2%
5%
19%
2%
3% 2%
57%
27%
6% 12% 6%
0% 0% 0%4% 3% 0% 4%
DFI Foreign Bank NBFC Others PSU Bank Pvt. Bank Trustee
Rating wise Investor Split
AAA AA A BBB and below D
46%
21%
5%
55%
41%
22%
51%
21%
42%
13%
3% 34%
18%
18%
9% 16%
20%
32%
14%
21%
27%13%
18%
30%
4%6%
25%
8%
25%
5%
DFI Foreign Bank NBFC Others PSU Bank Pvt. Bank Trustee
Sector wise Investor split
HFC VF Multiple Products MFI SME
Source – Public Information, MCA Data, VC AnalysisSource – Public Information, MCA Data, Crisil Quantix VC Analysis
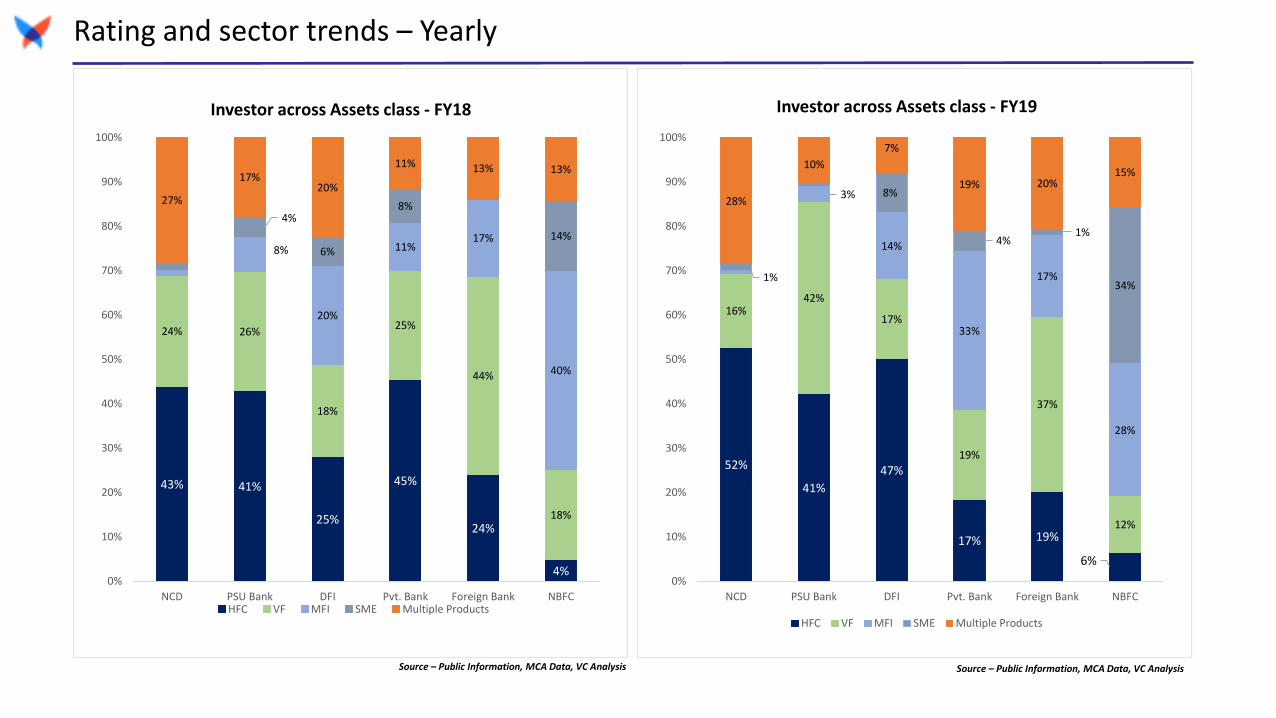
Rating and sector trends – Yearly
43% 41%
25%
45%
24%
4%
24% 26%
18%
25%
44%
18%
8%
20%
11%17%
40%
4%
6%
8%
14%
27%
17%20%
11% 13% 13%
0%
10%
20%
30%
40%
50%
60%
70%
80%
90%
100%
NCD PSU Bank DFI Pvt. Bank Foreign Bank NBFC
Investor across Assets class - FY18
HFC VF MFI SME Multiple Products
52%
41%
47%
17% 19%
6%
16%42%
17%
19%
37%
12%
1%
3%
14%
33%
17%
28%
8%
4%1%
34%
28%
10%
7%
19% 20%15%
0%
10%
20%
30%
40%
50%
60%
70%
80%
90%
100%
NCD PSU Bank DFI Pvt. Bank Foreign Bank NBFC
Investor across Assets class - FY19
HFC VF MFI SME Multiple Products
Source – Public Information, MCA Data, VC AnalysisSource – Public Information, MCA Data, VC Analysis

Products providing liquidity

70%2%
17%
5%
1%2%
3%
FY 2018- ABS Issuances- Sector Split
Vehicle loans
Housing loans
Micro loans
Loan against property(LAP)
Small business loans
Tractor loans
Others*
Source – Rating Agencies Market Estimate
Structured Finance : Sector Wise Split: Aggregate Market TrendsABS Issuances: Sector Split
Direct Assignment Issuances: Sector Split
14%
54%
10%
18%
2% 2%
FY 2018- DA Issuances- Sector Split
Vehicle loans
Housing loans
Micro loans
LAP
Small business loans
Tractor loans
Others*
Source – Rating Agencies Market Estimate
• Vehicle loans receivables-backed securitizationtransactions are dominating ABS issuances bothin FY 18 and FY 19.
• Microfinance loans were second highestcontributor to the overall ABS issuances; owingto improved asset quality on postdemonetization originated portfolio
• The direct assignment issuances continues to bedominated by housing finance companies-constituting more than 50% of total issuancevolumes.
• Housing finance issuances continue to dominateDA issuances on account of following reasonsdue to low risk perception of asset class
• Microfinance issuances on account of improvedasset quality has shown considerableimprovement in issuance volumes for this FY
• Vehicle finance issuances due to favorable tenorare quite popular in ABS market; however thevolatility of PAR of the underlying makes itunattractive under direct assignment route
13
49%
6%
16%
5%
4%
2%
17%
1%
FY 2019- ABS Issuances- Sector Split
Vehicle Loans
Housing Loans
Micro Loans
Loan Against Property(LAP)Small Business Loans
Tractor Loans
Lease Rentals
Others*
Source – Rating Agencies Market Estimate
11%
52%
14%
16%
1%
6%
FY 2019- DA Issuances- Sector Split
Vehicle Loans
Housing Loans
Micro Loans
LAP
Small Business Loans
Tractor Loans
Others
Source – Rating Agencies Market Estimate
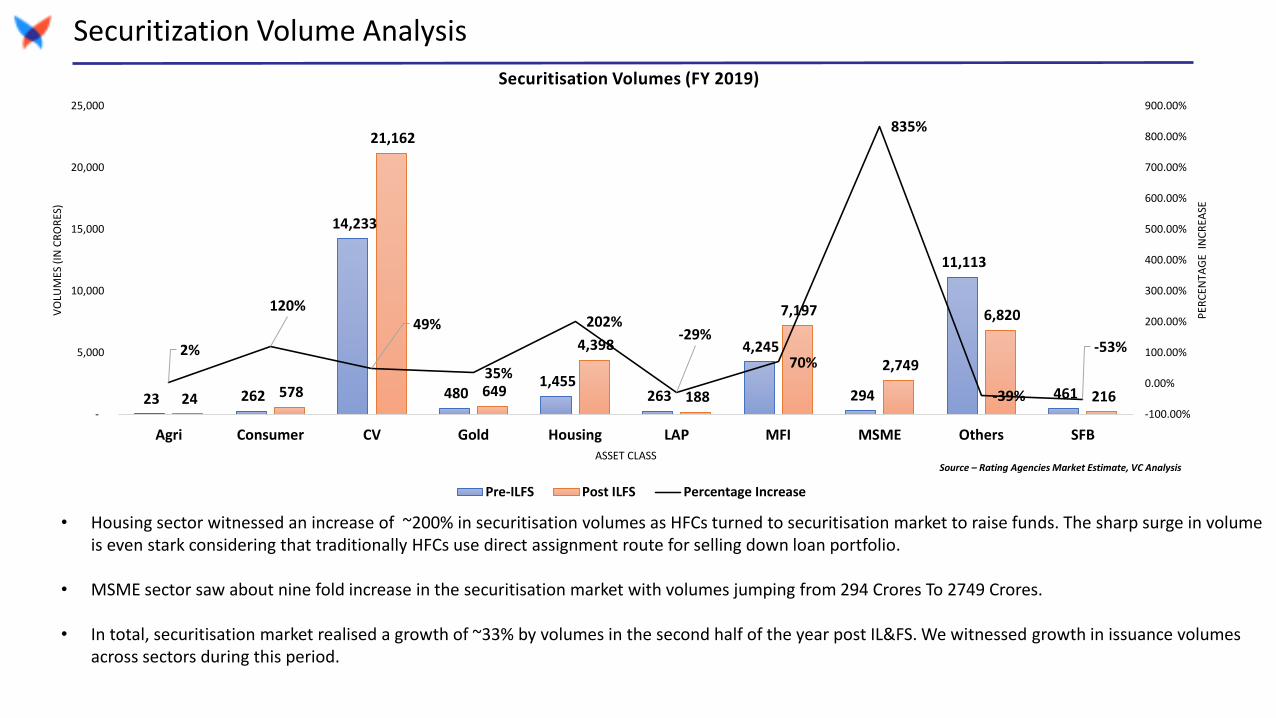
Securitization Volume Analysis
• Housing sector witnessed an increase of ~200% in securitisation volumes as HFCs turned to securitisation market to raise funds. The sharp surge in volume is even stark considering that traditionally HFCs use direct assignment route for selling down loan portfolio.
• MSME sector saw about nine fold increase in the securitisation market with volumes jumping from 294 Crores To 2749 Crores.
• In total, securitisation market realised a growth of ~33% by volumes in the second half of the year post IL&FS. We witnessed growth in issuance volumes across sectors during this period.
23 262
14,233
480 1,455
263
4,245
294
11,113
461 24 578
21,162
649
4,398
188
7,197
2,749
6,820
216
2%
120%49%
35%
202%-29%
70%
835%
-39%
-53%
-100.00%
0.00%
100.00%
200.00%
300.00%
400.00%
500.00%
600.00%
700.00%
800.00%
900.00%
-
5,000
10,000
15,000
20,000
25,000
Agri Consumer CV Gold Housing LAP MFI MSME Others SFB
PER
CEN
TAG
E IN
CR
EASE
VO
LUM
ES (
IN C
RO
RES
)
ASSET CLASS
Securitisation Volumes (FY 2019)
Pre-ILFS Post ILFS Percentage Increase
Source – Rating Agencies Market Estimate, VC Analysis
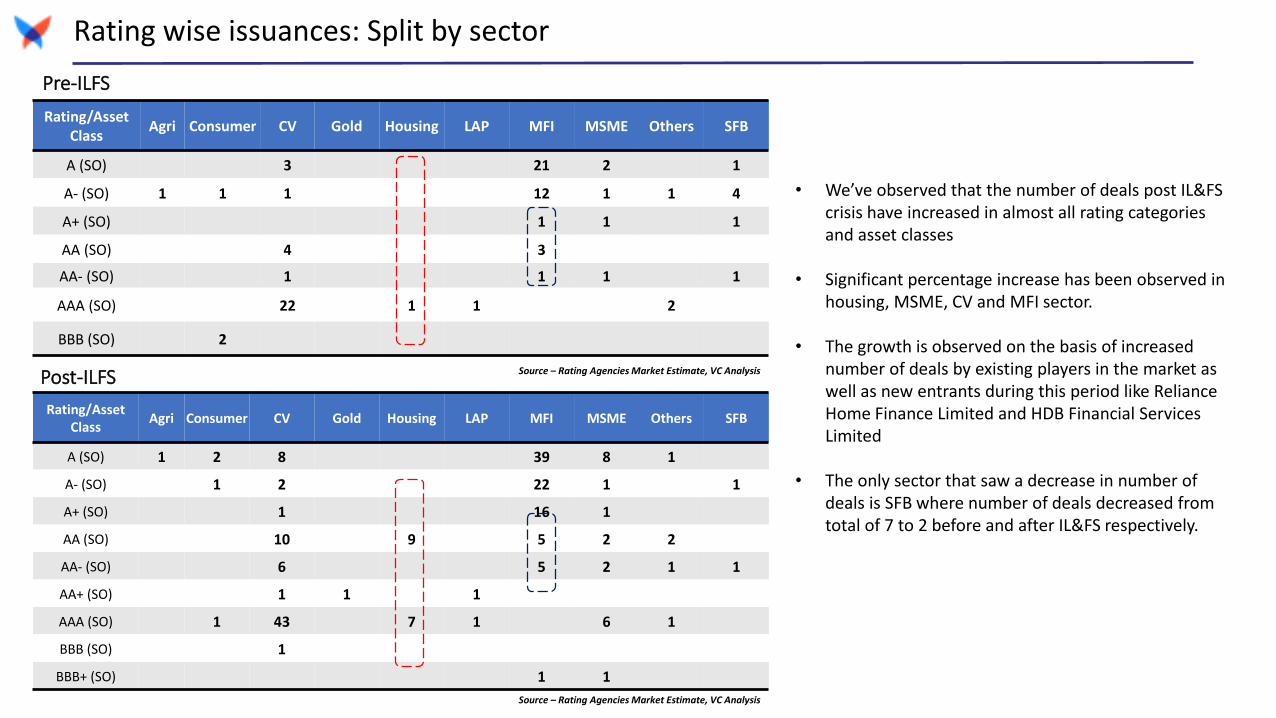
Rating wise issuances: Split by sector
Rating/Asset Class
Agri Consumer CV Gold Housing LAP MFI MSME Others SFB
A (SO) 3 21 2 1
A- (SO) 1 1 1 12 1 1 4
A+ (SO) 1 1 1
AA (SO) 4 3
AA- (SO) 1 1 1 1
AAA (SO) 22 1 1 2
BBB (SO) 2
Rating/Asset Class
Agri Consumer CV Gold Housing LAP MFI MSME Others SFB
A (SO) 1 2 8 39 8 1
A- (SO) 1 2 22 1 1
A+ (SO) 1 16 1
AA (SO) 10 9 5 2 2
AA- (SO) 6 5 2 1 1
AA+ (SO) 1 1 1
AAA (SO) 1 43 7 1 6 1
BBB (SO) 1
BBB+ (SO) 1 1
Pre-ILFS
Post-ILFS
• We’ve observed that the number of deals post IL&FS crisis have increased in almost all rating categories and asset classes
• Significant percentage increase has been observed in housing, MSME, CV and MFI sector.
• The growth is observed on the basis of increased number of deals by existing players in the market as well as new entrants during this period like Reliance Home Finance Limited and HDB Financial Services Limited
• The only sector that saw a decrease in number of deals is SFB where number of deals decreased from total of 7 to 2 before and after IL&FS respectively.
Source – Rating Agencies Market Estimate, VC Analysis
Source – Rating Agencies Market Estimate, VC Analysis
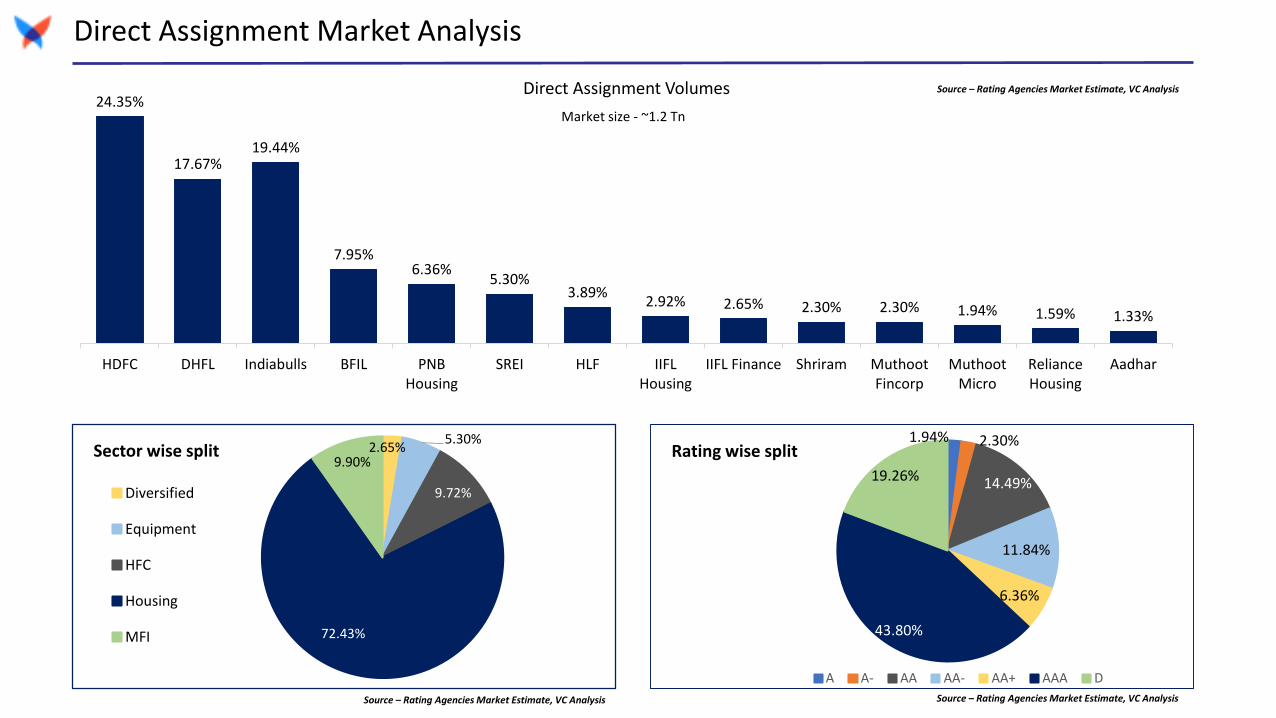
Direct Assignment Market Analysis
1.94% 2.30%
14.49%
11.84%
6.36%
43.80%
19.26%
Rating wise split
A A- AA AA- AA+ AAA D
2.65%5.30%
9.72%
72.43%
9.90%Sector wise split
Diversified
Equipment
HFC
Housing
MFI
Source – Rating Agencies Market Estimate, VC Analysis Source – Rating Agencies Market Estimate, VC Analysis
Source – Rating Agencies Market Estimate, VC Analysis
24.35%
17.67%19.44%
7.95%6.36%
5.30%3.89%
2.92% 2.65% 2.30% 2.30% 1.94% 1.59% 1.33%
HDFC DHFL Indiabulls BFIL PNBHousing
SREI HLF IIFLHousing
IIFL Finance Shriram MuthootFincorp
MuthootMicro
RelianceHousing
Aadhar
Direct Assignment Volumes
Market size - ~1.2 Tn
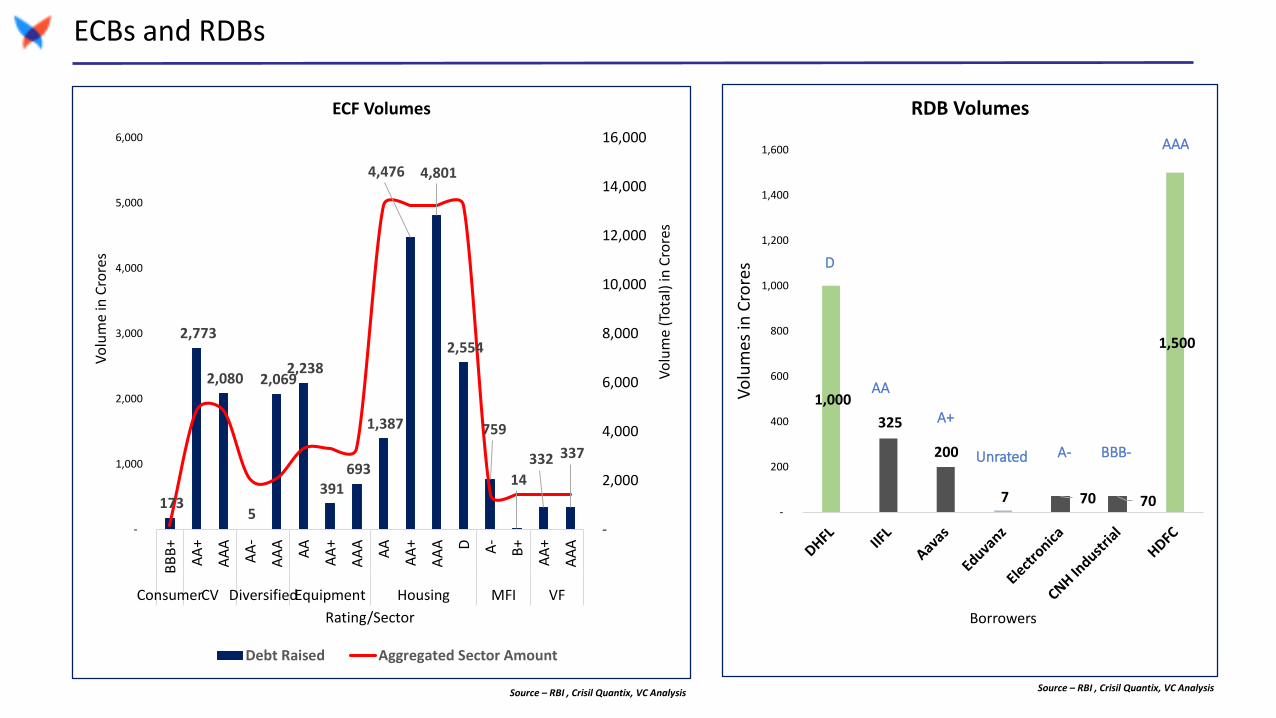
ECBs and RDBs
173
2,773
2,080
5
2,069 2,238
391 693
1,387
4,476 4,801
2,554
759
14
332 337
-
2,000
4,000
6,000
8,000
10,000
12,000
14,000
16,000
-
1,000
2,000
3,000
4,000
5,000
6,000
BB
B+
AA
+
AA
A
AA
-
AA
A
AA
AA
+
AA
A
AA
AA
+
AA
A D A-
B+
AA
+
AA
A
ConsumerCV DiversifiedEquipment Housing MFI VF
Vo
lum
e (T
ota
l) in
Cro
res
Vo
lum
e in
Cro
res
Rating/Sector
ECF Volumes
Debt Raised Aggregated Sector Amount
1,000
325
200
7 70 70
1,500
-
200
400
600
800
1,000
1,200
1,400
1,600
Vo
lum
es in
Cro
res
Borrowers
RDB Volumes
D
AA
A+
A-Unrated BBB-
AAA
Source – RBI , Crisil Quantix, VC AnalysisSource – RBI , Crisil Quantix, VC Analysis

Cost of funds
Rating vs Pricing Movement Analysis
0.77%
1.60%
0.64%
2.40%
0.69%
0.81%
1.70%1.65%
1.42%
0.77%
0.77%
0.87%1.06%
0.00%
0.50%
1.00%
1.50%
2.00%
2.50%
3.00%
MFI MSME CV MSME SFB MSME CV MFI CV MSME SFB CV LAP
A (SO) A- (SO) A+ (SO) AA (SO) AA- (SO) AAA (SO)
CH
AN
GE
IN P
RIC
ING
RATING/ASSET CLASS
Rating Pricing Movement
6.4
6.6
6.8
7
7.2
7.4
7.6
7.8
8
8.2
8.4
Ma
r 2
9,
20
19
Ma
r 1
9,
20
19
Ma
r 0
8,
20
19
Feb
26
, 2
01
9
Feb
14
, 2
01
9
Feb
05
, 2
01
9
Jan
25
, 2
01
9
Jan
16
, 2
01
9
Jan
07
, 2
01
9
De
c 2
7,
20
18
De
c 1
7,
20
18
De
c 0
6,
20
18
No
v 2
7,
20
18
No
v 1
4,
20
18
No
v 0
1,
20
18
Oct
23
, 2
01
8
Oct
11
, 2
01
8
Oct
01
, 2
01
8
Sep
19
, 2
01
8
Sep
10
, 2
01
8
Au
g 3
0,
20
18
Au
g 2
0,
20
18
Au
g 0
7,
20
18
Jul 2
7,
20
18
Jul 1
8,
20
18
Jul 0
9,
20
18
Jun
28
, 2
01
8
Jun
19
, 2
01
8
Jun
08
, 2
01
8
Ma
y 3
0,
20
18
Ma
y 2
1,
20
18
Ma
y 1
1,
20
18
Ma
y 0
2,
20
18
Ap
r 1
9,
20
18
Ap
r 1
0,
20
18
10 Year G-Sec Yield Movement
IL&FS Crisis
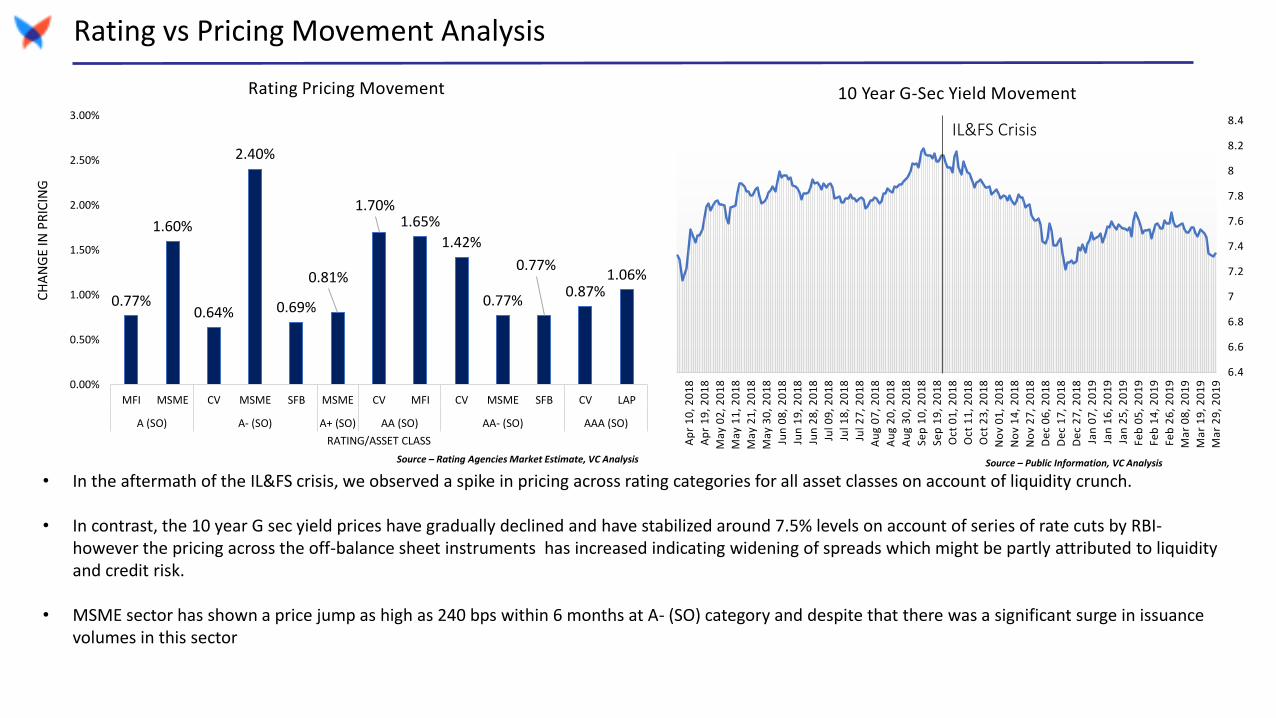
• In the aftermath of the IL&FS crisis, we observed a spike in pricing across rating categories for all asset classes on account of liquidity crunch.
• In contrast, the 10 year G sec yield prices have gradually declined and have stabilized around 7.5% levels on account of series of rate cuts by RBI-however the pricing across the off-balance sheet instruments has increased indicating widening of spreads which might be partly attributed to liquidity and credit risk.
• MSME sector has shown a price jump as high as 240 bps within 6 months at A- (SO) category and despite that there was a significant surge in issuance volumes in this sector
Source – Rating Agencies Market Estimate, VC Analysis Source – Public Information, VC Analysis

Factors impacting liquidity
Growth and Rating Transition
3152
17
100
70
154
74
298
0
10
20
30
40
50
60
0
50
100
150
200
250
300
350
Apr'18-Sep'18 Oct'18-Mar'19 Apr'19-Jun'19 Total
Nu
mb
er o
f C
om
pan
ies
(Do
wn
grad
e/U
pgr
ade)
Nu
mb
er o
f En
titi
esRating action - Apr'18-Jun'19
Assigned Reaffirmed Downgraded Upgraded
19
95
0
52
1
37
6
9
6
0
5
0 1
17
4
0
5
10
15
20
25
30
MFI HFC VF CF SME Gold Education MultipleProducts
Others
Upgrades/Downgrades - Apr'18-Jun'19
Upgrades Downgrades
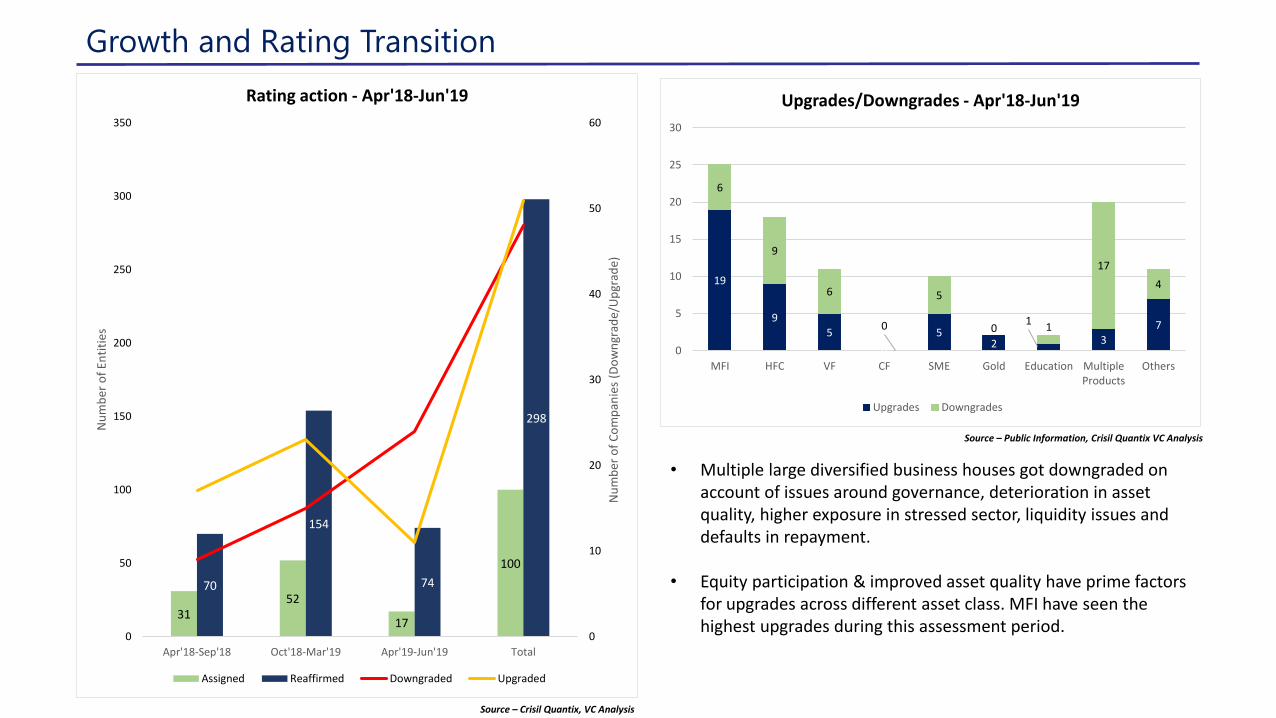
• Multiple large diversified business houses got downgraded on account of issues around governance, deterioration in asset quality, higher exposure in stressed sector, liquidity issues and defaults in repayment.
• Equity participation & improved asset quality have prime factors for upgrades across different asset class. MFI have seen the highest upgrades during this assessment period.
Source – Crisil Quantix, VC Analysis
Source – Public Information, Crisil Quantix VC Analysis
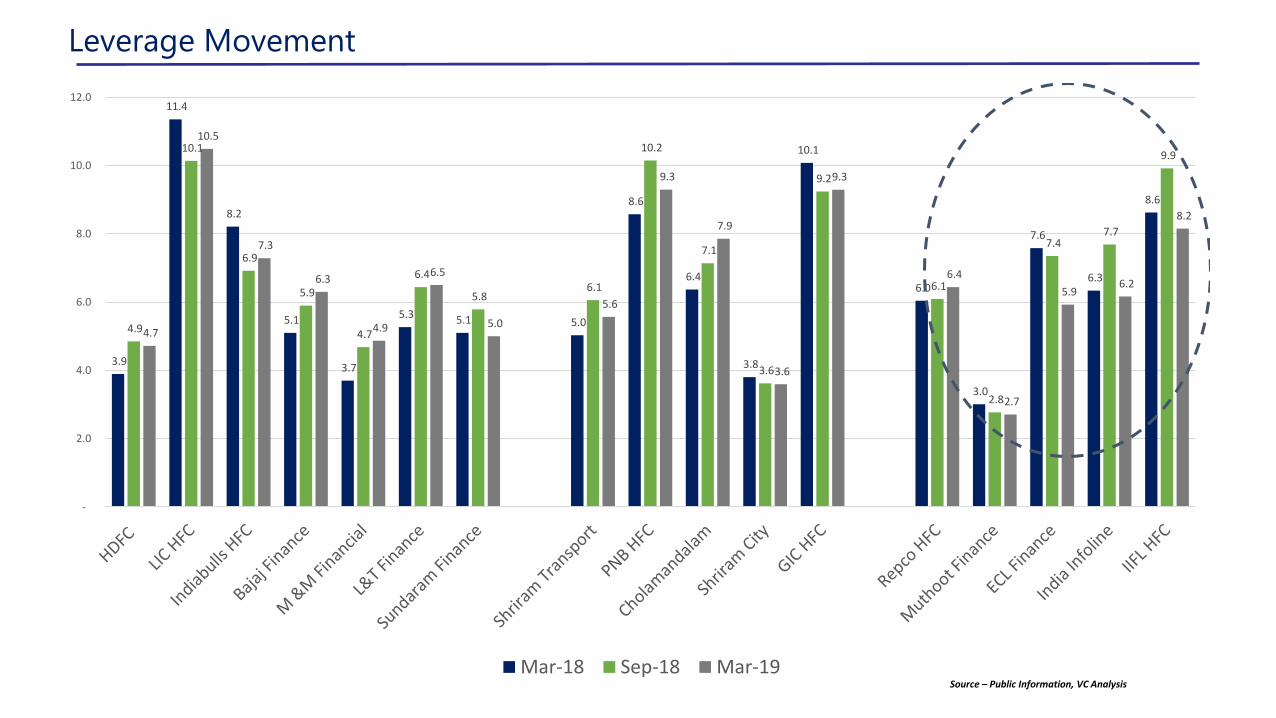
Leverage Movement
3.9
11.4
8.2
5.1
3.7
5.3 5.1 5.0
8.6
6.4
3.8
10.1
6.0
3.0
7.6
6.3
8.6
4.9
10.1
6.9
5.9
4.7
6.4
5.8 6.1
10.2
7.1
3.6
9.2
6.1
2.8
7.4 7.7
9.9
4.7
10.5
7.3
6.3
4.9
6.5
5.0
5.6
9.3
7.9
3.6
9.3
6.4
2.7
5.9 6.2
8.2
-
2.0
4.0
6.0
8.0
10.0
12.0
Mar-18 Sep-18 Mar-19Source – Public Information, VC Analysis
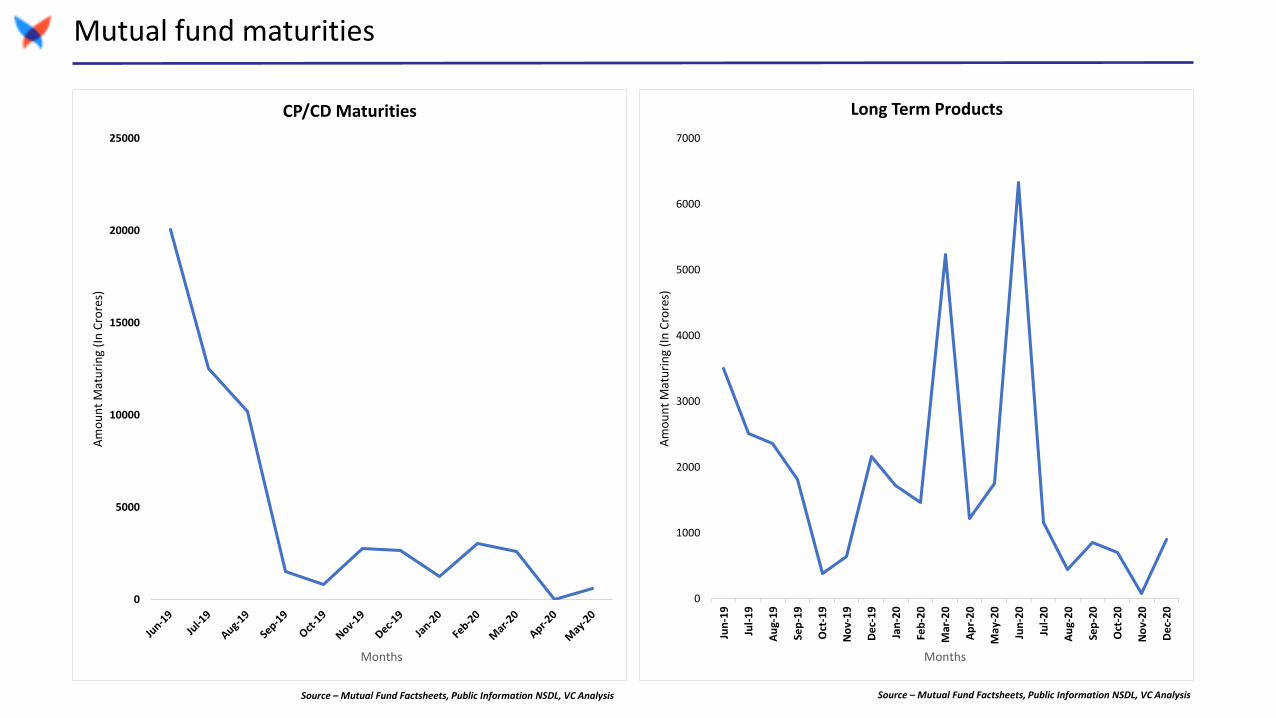
Mutual fund maturities
0
5000
10000
15000
20000
25000
Am
ou
nt
Mat
uri
ng
(In
Cro
res)
Months
CP/CD Maturities
0
1000
2000
3000
4000
5000
6000
7000
Jun
-19
Jul-
19
Au
g-1
9
Sep
-19
Oct
-19
No
v-1
9
De
c-1
9
Jan
-20
Feb
-20
Mar
-20
Ap
r-2
0
May
-20
Jun
-20
Jul-
20
Au
g-2
0
Sep
-20
Oct
-20
No
v-2
0
De
c-2
0
Am
ou
nt
Mat
uri
ng
(In
Cro
res)
Months
Long Term Products
Source – Mutual Fund Factsheets, Public Information NSDL, VC Analysis Source – Mutual Fund Factsheets, Public Information NSDL, VC Analysis
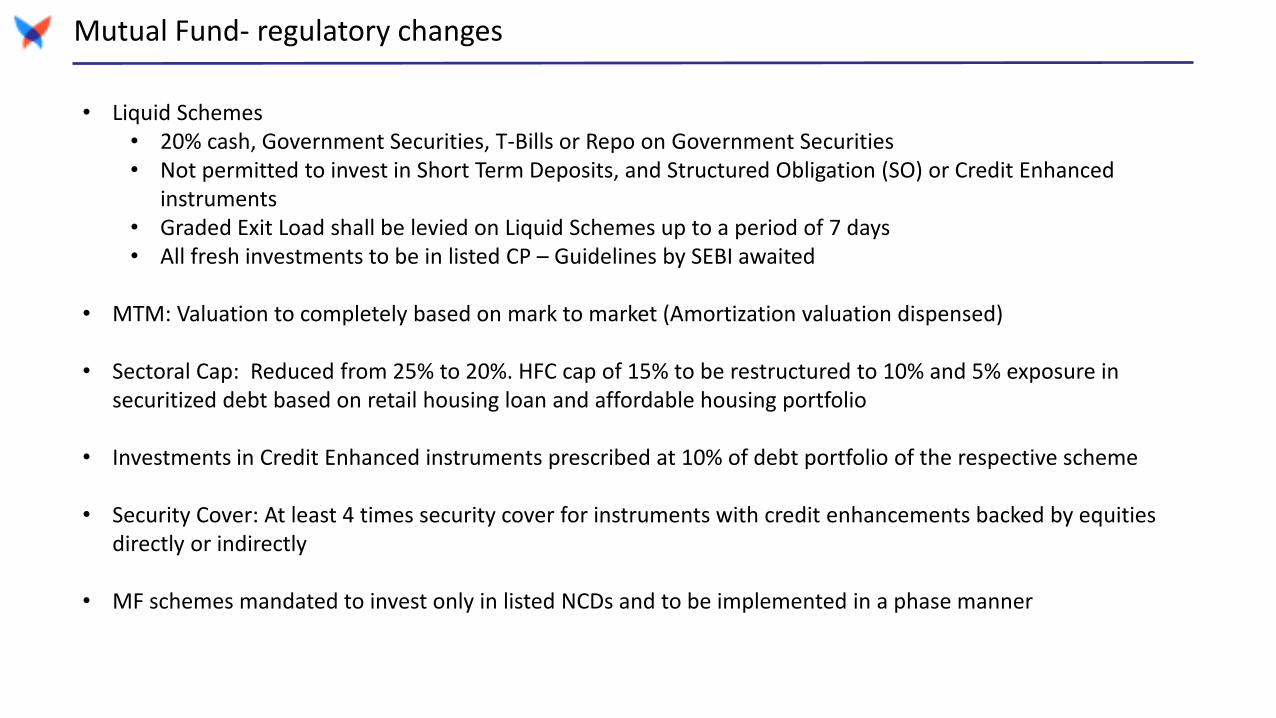
Mutual Fund- regulatory changes
• Liquid Schemes• 20% cash, Government Securities, T-Bills or Repo on Government Securities• Not permitted to invest in Short Term Deposits, and Structured Obligation (SO) or Credit Enhanced
instruments• Graded Exit Load shall be levied on Liquid Schemes up to a period of 7 days• All fresh investments to be in listed CP – Guidelines by SEBI awaited
• MTM: Valuation to completely based on mark to market (Amortization valuation dispensed)
• Sectoral Cap: Reduced from 25% to 20%. HFC cap of 15% to be restructured to 10% and 5% exposure in securitized debt based on retail housing loan and affordable housing portfolio
• Investments in Credit Enhanced instruments prescribed at 10% of debt portfolio of the respective scheme
• Security Cover: At least 4 times security cover for instruments with credit enhancements backed by equities directly or indirectly
• MF schemes mandated to invest only in listed NCDs and to be implemented in a phase manner

Vivriti Capital client base
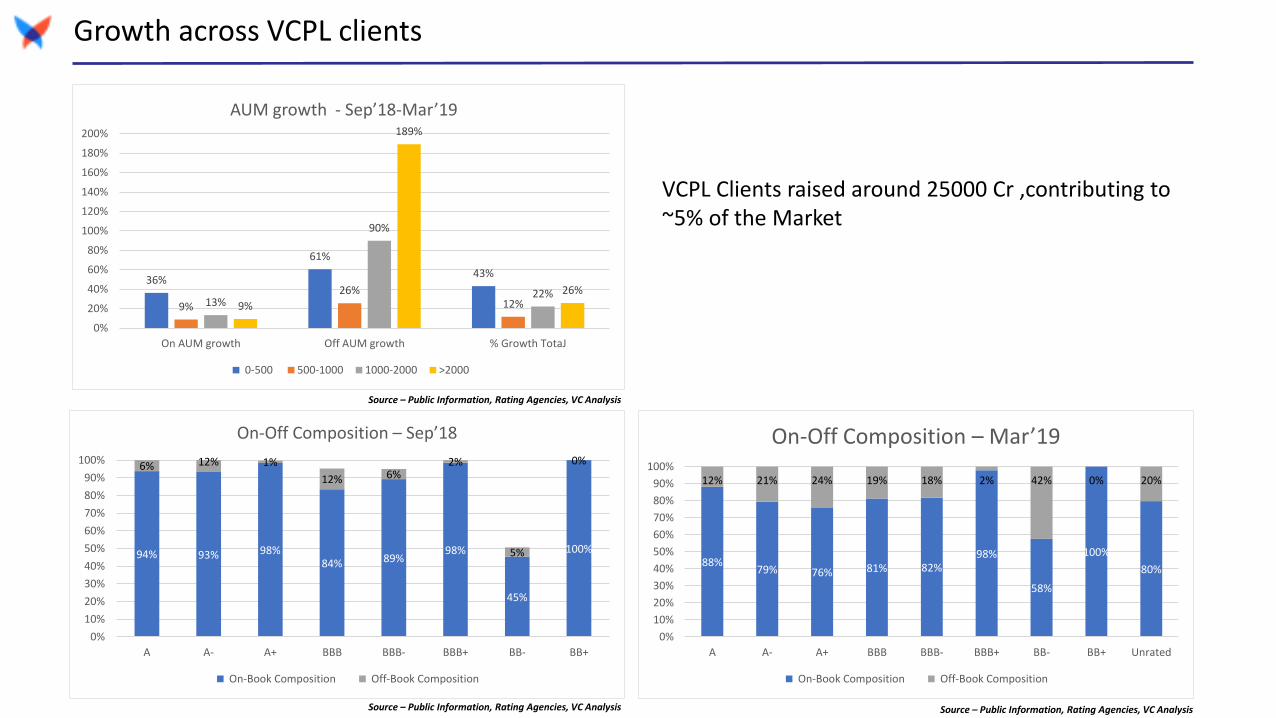
Growth across VCPL clients
36%
61%
43%
9%
26%12%13%
90%
22%9%
189%
26%
0%
20%
40%
60%
80%
100%
120%
140%
160%
180%
200%
On AUM growth Off AUM growth % Growth TotaJ
AUM growth - Sep’18-Mar’19
0-500 500-1000 1000-2000 >2000
94% 93% 98%84% 89%
98%
45%
100%
6% 12% 1%
12% 6%2%
5%
0%
0%
10%
20%
30%
40%
50%
60%
70%
80%
90%
100%
A A- A+ BBB BBB- BBB+ BB- BB+
On-Off Composition – Sep’18
On-Book Composition Off-Book Composition
88%79% 76% 81% 82%
98%
58%
100%
80%
12% 21% 24% 19% 18% 2% 42% 0% 20%
0%
10%
20%
30%
40%
50%
60%
70%
80%
90%
100%
A A- A+ BBB BBB- BBB+ BB- BB+ Unrated
On-Off Composition – Mar’19
On-Book Composition Off-Book Composition
VCPL Clients raised around 25000 Cr ,contributing to ~5% of the Market
Source – Public Information, Rating Agencies, VC Analysis
Source – Public Information, Rating Agencies, VC Analysis Source – Public Information, Rating Agencies, VC Analysis
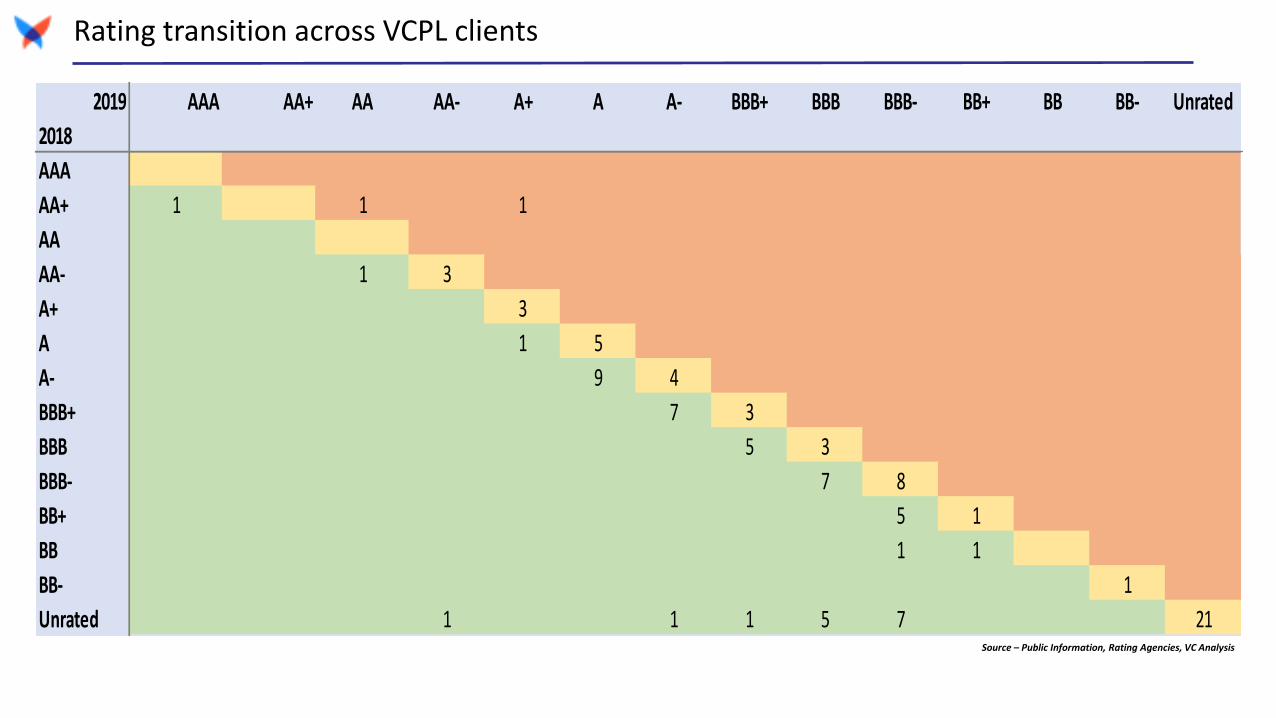
Rating transition across VCPL clients
2019 AAA AA+ AA AA- A+ A A- BBB+ BBB BBB- BB+ BB BB- Unrated
2018
AAA
AA+ 1 1 1
AA
AA- 1 3
A+ 3
A 1 5
A- 9 4
BBB+ 7 3
BBB 5 3
BBB- 7 8
BB+ 5 1
BB 1 1
BB- 1
Unrated 1 1 1 5 7 21Source – Public Information, Rating Agencies, VC Analysis
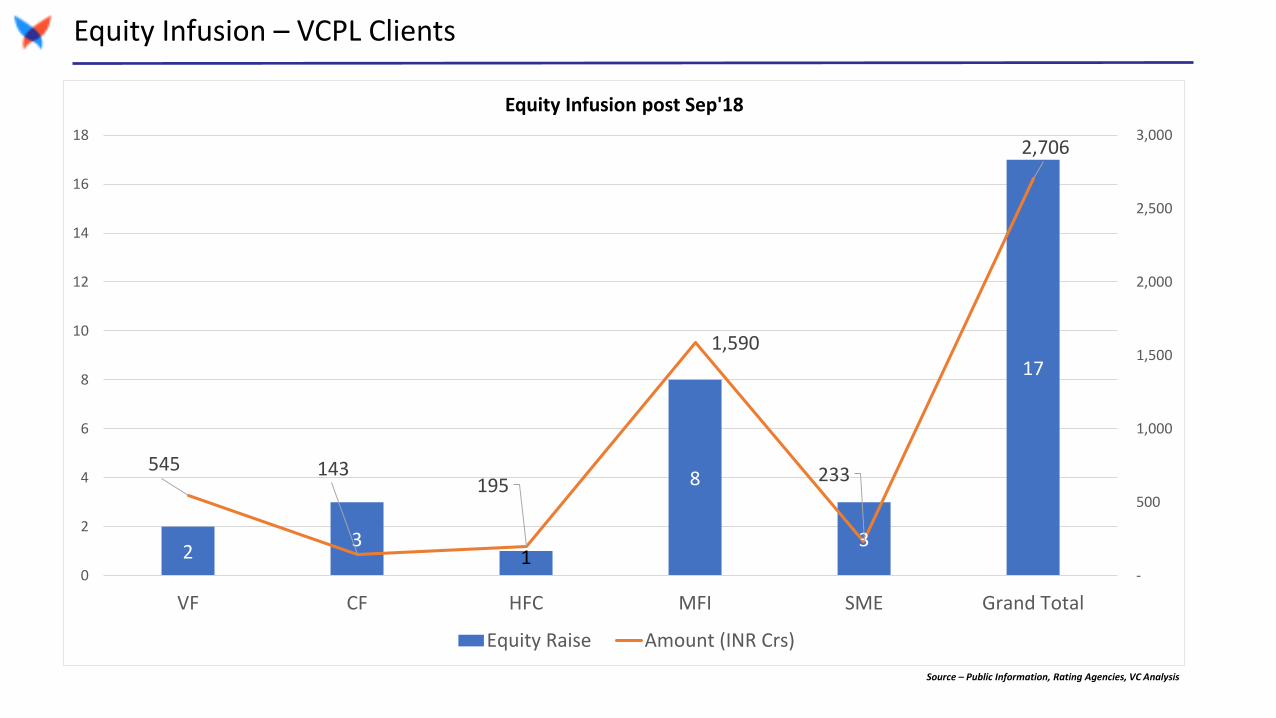
Equity Infusion – VCPL Clients
23
1
8
3
17
545 143 195
1,590
233
2,706
-
500
1,000
1,500
2,000
2,500
3,000
0
2
4
6
8
10
12
14
16
18
VF CF HFC MFI SME Grand Total
Equity Infusion post Sep'18
Equity Raise Amount (INR Crs)
Source – Public Information, Rating Agencies, VC Analysis

Outlook
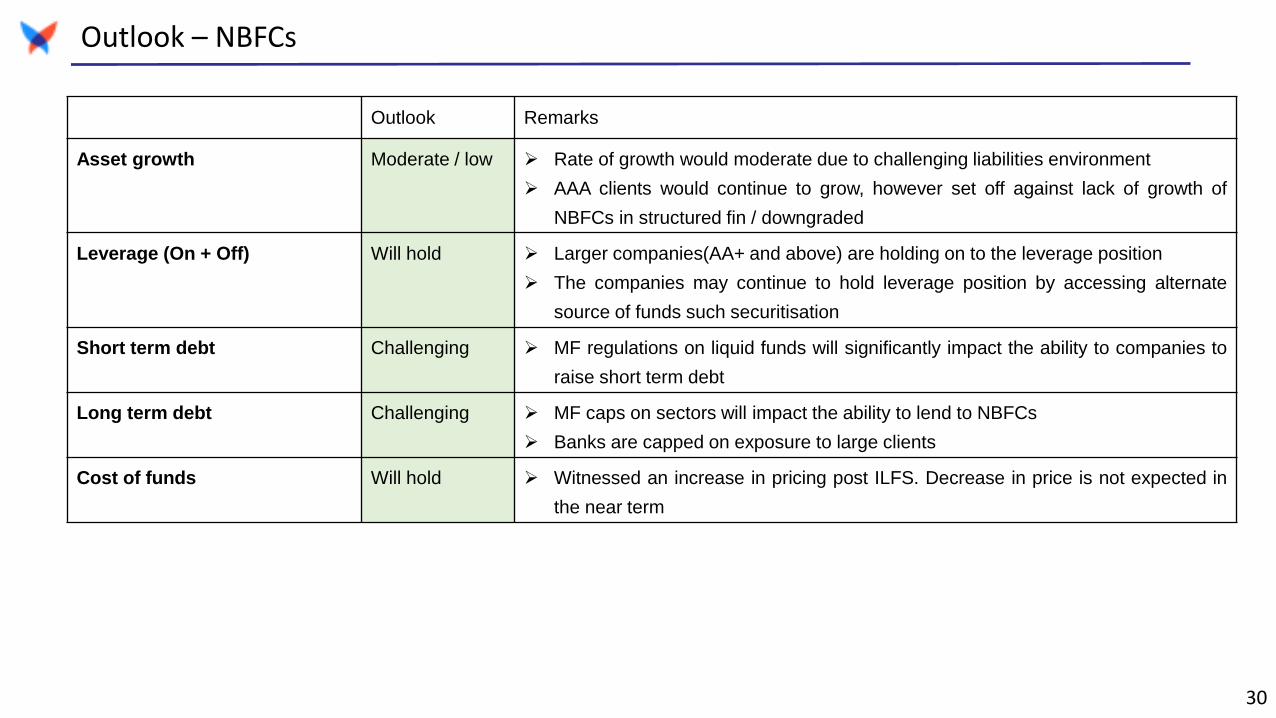
Outlook – NBFCs
30
Outlook Remarks
Asset growth Moderate / low ➢ Rate of growth would moderate due to challenging liabilities environment
➢ AAA clients would continue to grow, however set off against lack of growth of
NBFCs in structured fin / downgraded
Leverage (On + Off) Will hold ➢ Larger companies(AA+ and above) are holding on to the leverage position
➢ The companies may continue to hold leverage position by accessing alternate
source of funds such securitisation
Short term debt Challenging ➢ MF regulations on liquid funds will significantly impact the ability to companies to
raise short term debt
Long term debt Challenging ➢ MF caps on sectors will impact the ability to lend to NBFCs
➢ Banks are capped on exposure to large clients
Cost of funds Will hold ➢ Witnessed an increase in pricing post ILFS. Decrease in price is not expected in
the near term

Outlook – VCPL clients
31
Outlook Remarks
Asset growth Increase ➢ Asset growth fuelled by to equity infusion
Leverage Decrease ➢ Decrease due to equity infusion witnessed across sectors and increase in off
balance sheet transactions
➢ However, increasing % off balance sheet transactions may cap the ability to
securitize for few clients
Short term debt No access ➢ Never had access to short term debt
Long term debt Moderate ➢ Increase in rating due to equity infusion
➢ PSL tag increasing saleability of assets
Cost of funds Will hold ➢ Witnessed an increase in pricing post ILFS. Decrease in price is not expected in
the near term

Thank you