the nbta foundation, the education and research arm of the...
TRANSCRIPT


2 The NBTA Foundation, the education and research arm of the National Business Travel Association (NBTA), has commissioned Vantage Strategy, LLC to build the first‐ever quarterly business travel outlook for the United States. Sponsored by Visa, Inc., the purpose is to provide corporate travel professionals and the broader business community insight into both short‐ and long‐term trends in business travel volumes, spending, and inflation. The newly developed Business Travel Quarterly Outlook – United States projects aggregate business travel trends over the next eight quarters. The report includes key buy‐side metrics such as total business travel volume and spending, plus supply‐side projections of changes in costs, across both transient (individual) and meetings travel. Following the report’s initial release, it will be published on the last Wednesday of each quarter (Dec 29th, March 23rd, 2011, June 29th, 2011, etc.). Vantage Strategy developed an econometric model to better inform the forecast process. The model explicitly relates measures of business trip volume and spending, sourced from D.K. Shifflet & Associates (www.dksa.com), to key economic and market drivers of business travel including:
U.S. Gross Domestic Product (GDP) and its components
U.S. Corporate Profits and Cash Flow
U.S. Employment & Unemployment
ISM Business Sentiment Index
Key Travel Components of CPI (airfare, lodging, food away from home, rental cars, fuel, transportation)
Hitwise® data (www.hitwise.com) analyzing Internet traffic to business‐oriented travel Websites and to potential travel alternative sites such as GoToMeeting and WebEx
Productivity rates for business travel spending as a key business input to U.S. corporations
Supply variables such as the number of rooms, occupancy, available Seat Miles (ASM), and rental car fleet size from various travel information vendors and government/NGOs.
Another unique measure created for the Outlook is the NBTA/Visa Business Travel Index (BTI). This index provides a way to distil both recent market performance and the outlook for business travel into a single metric that can be tracked over time. The BTI compares business travel spending activity today and over the next eight quarters to levels achieved in 2005, a mid‐expansion period also used as a base year for many U.S. government statistics.
CONTACT: Nicole Hayes Communications & Public Relations NBTA 703‐684‐0836 ext. 133 [email protected]
Matt Flegal Public Relations Visa, Inc. 650‐432‐1139 [email protected]

3
Forecast Highlights U.S‐originated business travel1 is enjoying a solid recovery after two long years of retrenchment. Through 2010 Q2, business travel trips and spending have both advanced dramatically from their 2009 Q4 recessionary trough. Expectations are for the economy to take a breather in the second half of the year, however. This growth slowdown will impact all sectors of the economy, including business travel. Still, we expect 2010 to register 3.8% growth over 2009 for all U.S.‐originated business travel spending. For 2011 and 2012, business travel will begin to take a slightly more aggressive upward trajectory in lockstep with relatively modest advances in U.S. economic activity. Travel spending will advance by 6.7% and 6.9% for 2011 and 2012, respectively.
U.S. Economic Performance The U.S. economy is finally in recovery mode after the worst recession in post‐WWII history. The official end to the Great Recession took place in June 2009, according to the National Bureau of Economic Research (NBER), although most of us probably did not notice until well into the fourth quarter of last year. At October 2010, the economy continues to gather steam –yet this recovery has been anything but typical. The most glaring differences after 15‐months of recovery are a reluctant consumer sector and very little job creation ‐both closely related. As a result, the economy clearly lost some momentum over the summer and appears to be struggling to maintain its upward trajectory. This has brought on fears of a double dip. There is a relatively low probability of economic retrenchment, however. Consider:
July, August, and early Sept economic reports confirm that a double dip is unlikely. Unemployment insurance claims have improved, consumer incomes and spending are up slightly, capital spending is holding up well, and corporate earnings reports continue to encourage.
U.S. businesses are performing relatively well. Corporate profits and cash flow are in excellent shape. After two years of cost containment, much‐needed inventory replenishment, robust export demand, and modest gains in capital spending, the business sector is leading the recovery charge.
So much so, that many industries have all but exhausted their ability to grow without hiring new workers. Temporary payrolls have been running high for most of this year and productivity is up sharply –both typical of early recovery. This is usually not sustained and eventually leads to new full‐time hiring.
Credit is once again flowing through the economy ‐not enough to small businesses just yet, but the banking sector has clearly righted its ship. Borrowing rates remain favorable.
Monetary and fiscal policies both continue to be aggressively accommodative. Without imminent inflationary fears, the Fed will continue to keep credit flowing. We can also expect the fiscal stimulus pump to carry on, even after the deficit rhetoric leading up to November elections.
1 Includes all U.S. domestic business travel plus outbound international trips

4 Finally, robust global growth, particularly in the developing economies of Asia and Latin America, will sustain many exportoriented U.S. businesses and generate corresponding growth in outbound international travel for the forecast horizon and beyond.
Having said all of this, the recovery has lost some momentum of late and the growth prospects for 2011 and 2012 remain muted:
Consumers continue to be cautious. Household income growth is very weak, debt reduction and savings replenishment continue, and sentiment is, at best, cautiously optimistic. These factors have conspired to keep consumer spending sluggish.
The housing sector is still underwater. Existing home sales are weak in most U.S. markets, home prices have yet to stabilize across the country, new construction is struggling, and delinquencies remain problematic. .
Unemployment continuous to be pervasive. Private sector job growth has been very slow for this stage of economic recovery. With housing and commercial real estate struggling, construction jobs are not yet there. Government job growth, after the initial stimulus and a brief 2010 Census‐related spurt, has again dropped back. We have also seen more previously discouraged job seekers coming back into the labor market, putting even more pressure on an elevated unemployment rate. In fact, the unemployment rate is expected to rise into the 4th quarter, peaking at 9.9% before gradually improving next year.
Despite monetary ease and fiscal stimulus, inflation remains moderate. Demand side growth is simply not high enough to build pricing pressure in the near term. Even energy prices appear to be in check. Abundant supply of refined product is not being absorbed quickly enough by demand to build systemic pricing pressure.
Global growth is also slowing in the second half of 2010, but remains a positive for US export trade. Asia & Latin America are leading the way unfettered by the excessive de‐leveraging and asset bubbles that built up in Europe, Japan, and the U.S.
Many have likened the shape of this economic recovery to a square root symbol, where stronger, V‐shaped early
performance gives way to a slower growth trajectory after 2010. Real GDP will struggle to sustain growth rates above 2.5% in 2011 and 2012.

5
NBTA U.S. Business Travel OutlookUS Domestic plus International Outbound
-15.0%
-10.0%
-5.0%
0.0%
5.0%
10.0%
2007 2008 2009 2010 2011 2012
Yr-t
o-Yr
% C
hang
e
Total U.S. Business Travel Trips Total U.S. Business Travel Spending
Forecast
Source: D.K. Shifflet & Associates, US DOC-OTTI, Vantage Strategy
Business Travel Performance
Business travel spending will recover at a slightly faster rate than overall trip volume: during the forecast period of 2010 Q3 to 2012 Q3, the total number of Business Person‐Trips is projected to grow 6% to 112 million, while total spending on business travel is projected to grow 14.7% to $67 Billion.
The outlook suggests that firms are taking their time shifting from costcontainment to driving sales growth, as projected annual growth in total business travel spending reaches only 3.8% in 2010, then ramps up to 6.7% and 6.9% for 2011 and 2012, respectively.
The recovery in domestic business travel will ramp up slowly, with spending advancing more quickly than trip volume through 2012. Slightly more liberal travel budgets and the return of business travel inflation account for this difference. After advancing 2.2% in 2010, domestic business travel spending will increase 7.2%
and 6.4% in 2011 and 2012, respectively.
International outbound business trips dropped off heavily in 2009. The decline in spending was even greater, as firms managed travel spend by reducing or shortening trips and moving employees out of premium class airfare and hotels. Better corporate earnings and booming export markets brought the return of premium business travel in 2010 and will sustain growth through 2012. International outbound trips and outbound spending will both show healthy growth, with spending expected to advance by 16.3%, 3.1%, and 10.6% for 2010, 2011, and 2012, respectively.
After falling 9.8% (trip volume) and 14.7% (spending) in 2009, domestic transient business travel PersonTrips and spending surged ahead in the first two quarters of 2010. Transient volume reached an estimated 67.6 million Person‐Trips in the second quarter, a gain of 8.8 million over Q1. Transient spending advanced even faster as this new trip volume was coupled with higher per‐trip spending. Transient spend advanced 7.4% in Q2 after a decline of nearly 3% in Q1. Transient growth will take a slight breather in the second half of the year, but spending will still register a welcome 3.9% growth over 2009.
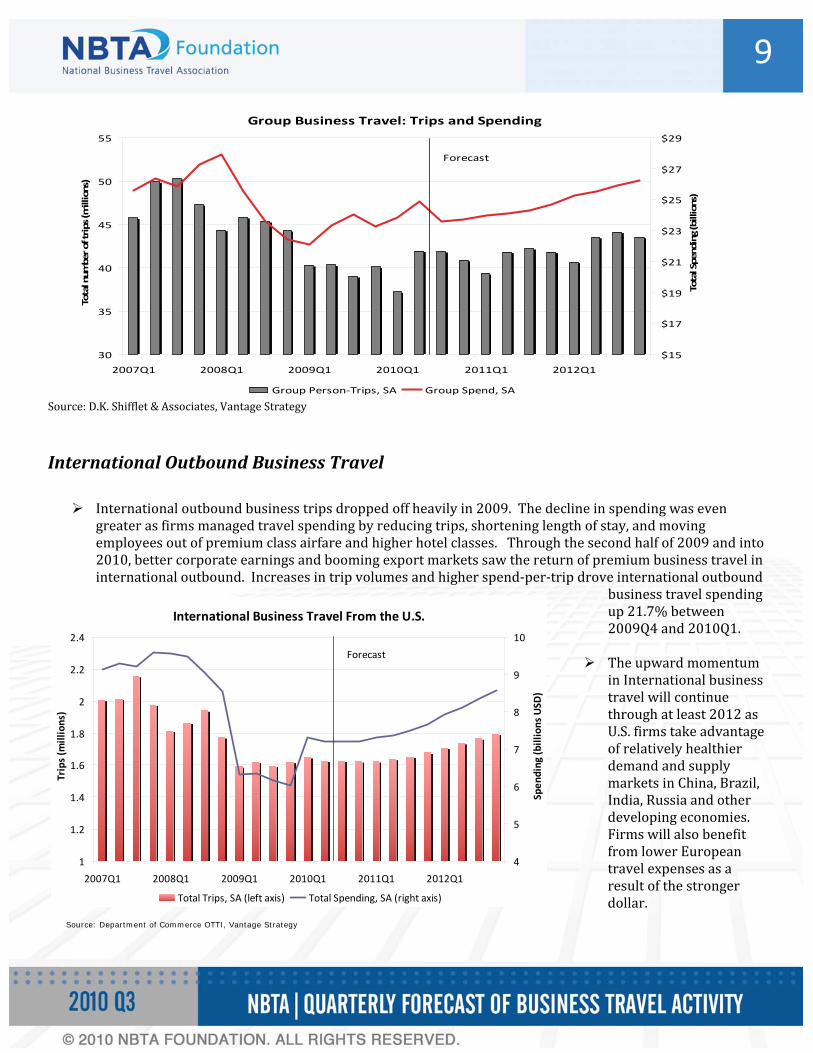
Group Meeting & Convention travel had been under siege for nearly three years. Between 2007 and 2009, group meeting trip volume fell by 33.7million Person‐Trips or 17% to total 92.8 million Person‐Trips. Spending dropped by $12billion or 12% for same period. The first two quarters of 2010 have shown a remarkable turnaround with group spending advancing at a seasonally adjusted annualized rate of 5%. After a slightly slower second half, group meeting spending is expected to grow by 3.5% in 2010, followed by slower growth in 2011 at 1.1% before more robust performance kicks in for 2012 at 6%.
Travel prices fell sharply during the recession, but have already begun to recover. Bolstered by both rising travel demand and pressure from constrained capacity in airlines and, to a lesser extent, hotels, total business travel inflation is expected to advance by 2.7% in 2010, followed by 2.3% and 2.6% in 2011 and 2012, respectively.

6
NBTA Business Travel Index (BTI) One of the objectives of the Business Travel Quarterly Outlook –United States was to construct a headline measure of the current and projected level of business travel –a Business Travel Index. The BTI has been derived from total Business Travel Spending, the most holistic of measures in our database since it reflects the volume of travel, spending‐per‐trip, and travel prices. An index base year of 2005 was chosen for the BTI for three reasons. First, it is relatively recent and reflects similar market conditions. Secondly, 2005 represents neither the top of an expansion or the trough of a recession. Finally, the US government has chosen 2005 as the base year for many of its high profile economic releases. Specifically, the NBTA BTI is set equal to 100 in 2005 Q2.
The NBTA BTI reached 120 at the last expansionary peak (2007 Q4). Two years of decline left the BTI at 96 at the trough of the Great Recession (2009 Q4), a decline of almost 20%.
The BTI has recovered to 106 for 2010 Q2, the latest historical estimate, up about a half a point from the first quarter. The index is expected to hold steady for Q3. With the slight slowdown in growth for the second half of 2010, we see the BTI rising to only107 in the 4th quarter.
In 2011, we will begin to make more rapid progress in lock‐step with the U.S. economy. By the end of the year, the BTI is expected to reach 111, about two‐thirds of the way back to the previous peak.
Looking forward to the end of the forecast horizon (2012 Q4), the Business Travel Outlook Index will reach just short of 120, finally reaching the level of the previous cyclical peak.
NBTA Business Travel Index (BTI)
70
80
90
100
110
120
130
2005Q2 2006Q2 2007Q2 2008Q2 2009Q2 2010Q2 2011Q2 2012Q2
Inde
x value (2005 = 100)
2010Q3 = 106
2005Q2 (Base) = 100
Source: Vantage Strategy, D.K. Shifflet & Associates

7
Business Travel Quarterly Outlook Details
Total U.S.Originated Business Travel Spending & Trip Volumes2
The compounding effects of deflation, declining trip volume, and a smaller amount spent per business trip led to a decline in spending of 17.2% between 2007 and 2009. Conversely, the effects of economic recovery will lead to a faster recovery for travel spending, projected to grow at a rate of 16.6% between 2010 Q2 and 2012 Q4.
Firms have spent much of the post‐recessionary period in cost cutting mode, playing defense to weather the storm. Moving forward, firms will have to start spending on sales generation and business development. The outlook suggests that firms are taking their time coming out of their shells, as projected annual growth in total business spending hangs around 5% in 2010 and 2011 before jumping to nearly 8% in 2012.
In addition to demand side pressure, business travel spend will benefit over the next few years from tightened supply, as air carriers have slashed capacity 11% for domestic flights and 7% for international flights, and new hotel and lodging construction has been running at historically low levels over the last couple of years.
The total number of U.S. Business Person‐Trips saw a sharp decline of 15.6% during the Great Recession
2 Includes all U.S. domestic business travel plus outbound international trips

8from 511 million Person‐Trips in 2007 to 431 million trips in 2010. The decline was driven in large part by the drop in transient business travel, which comprises roughly 60% of the total. The recovery period for total trip volume will take longer than business travel spending, given that spending has the benefit of upward pressure on prices from both the supply and demand sides of lodging, air travel, transportation, and key input commodities to travel goods and services (e.g., fuel).
Group Meeting & Convention vs. Transient Business Travel
During the Great Recession, Transient Person‐Trip volume fell more slowly than Group Person‐Trips –a typical recessionary pattern. However, spending cuts were greater among Transient business travelers, a result of tighter travel management, shortening trips, and at least some use of technological alternatives to travel. Conversely, spending on Transient business travel is expected to advance more quickly —a projected 31% between 2010 Q2 and 2012 Q4—as the economy recovers. This will be driven by more trips, cost increases, and the conservative relaxation of premium travel restrictions.
Source: D.K. Shifflet & Associates, Vantage Strategy
Transient Business Travel: Trips and Spending
40
45
50
55
60
65
70
75
80
85
2007Q1 2008Q1 2009Q1 2010Q1 2011Q1 2012Q1
Total num
ber of trips (m
illions)
$20
$22
$24
$26
$28
$30
$32
$34
Total Spe
nding (billions)
Transient Person‐Trips, SA Transient Spend, SA
9
International Business Travel From the U.S.
1
1.2
1.4
1.6
1.8
2
2.2
2.4
2007Q1 2008Q1 2009Q1 2010Q1 2011Q1 2012Q1
Trips (m
illions)
4
5
6
7
8
9
10
Spen
ding
(billions USD
)
Total Trips, SA (left axis) Total Spending, SA (right axis)
Forecast
Source: Department of Commerce OTTI, Vantage Strategy
Source: D.K. Shifflet & Associates, Vantage Strategy
International Outbound Business Travel
International outbound business trips dropped off heavily in 2009. The decline in spending was even greater as firms managed travel spending by reducing trips, shortening length of stay, and moving employees out of premium class airfare and higher hotel classes. Through the second half of 2009 and into 2010, better corporate earnings and booming export markets saw the return of premium business travel in international outbound. Increases in trip volumes and higher spend‐per‐trip drove international outbound
business travel spending up 21.7% between 2009Q4 and 2010Q1.
The upward momentum in International business travel will continue through at least 2012 as U.S. firms take advantage of relatively healthier demand and supply markets in China, Brazil, India, Russia and other developing economies. Firms will also benefit from lower European travel expenses as a result of the stronger dollar.
Group Business Travel: Trips and Spending
30
35
40
45
50
55
2007Q1 2008Q1 2009Q1 2010Q1 2011Q1 2012Q1
Total number of trips (millions)
$15
$17
$19
$21
$23
$25
$27
$29
Total Spending (billions)
Group Person‐Trips, SA Group Spend, SA
Forecast

10U.S. Business Travel Inflation In order to better frame overall business travel price inflation and provide a barometer for future budgeting, Vantage Strategy created a weighted index of key travel components of the Consumer Price Index: airfare, lodging, food away from home, ground transportation, and auto rentals. The CPI was chosen because it reflects prices paid by travelers for a broad set of categories. The index weights are reflective of business travel trip budgets as reported by travelers in the D.K. Shifflet & Associates travel panel. Last year, this included data from over 32,000 business trips.
Business travel inflation saw a sharp decline between 2008 Q1 and 2009 Q2 due to acute deflation in both airfare and lodging. Prices have already recovered in air and are starting to firm up in most hotel markets. The food away from home, rental car, and ground transportation categories have yet to apply upward pressure to the overall index.
Business travel prices will continue to rise over the forecast horizon (2012 Q4) remaining in the 2‐3% per year range. Record airline load factors and slowly rising hotel ADRs will keep upward capacity and supply‐side pressure on travel prices. Still, tepid demand‐side growth will moderate overall business travel inflation through 2012.
Business Travel Price Inflation (index value & % change)
1.7
1.8
1.9
2
2.1
2.2
2.3
2.4
2.5
2.6
2.7
1999Q1
2000Q1
2001Q1
2002Q1
2003Q1
2004Q1
2005Q1
2006Q1
2007Q1
2008Q1
2009Q1
2010Q1
2011Q1
2012Q1
inde
x value 19
82‐198
4= 1.0
‐6%
‐4%
‐2%
0%
2%
4%
6%
8%
Yr‐to‐Yr % change
Index Value % change
Source: US Bureau of Labor Statistics, D.K. Shifflet & Associates, Vantage Strategy
Forecast

11
Forecast Tables 2010Q3: Annual & Quarterly
Spending data is in billions of current dollars Person‐Trips data is in millions of trips Business Travel Price Index = 1.0 in 1982‐1984
12
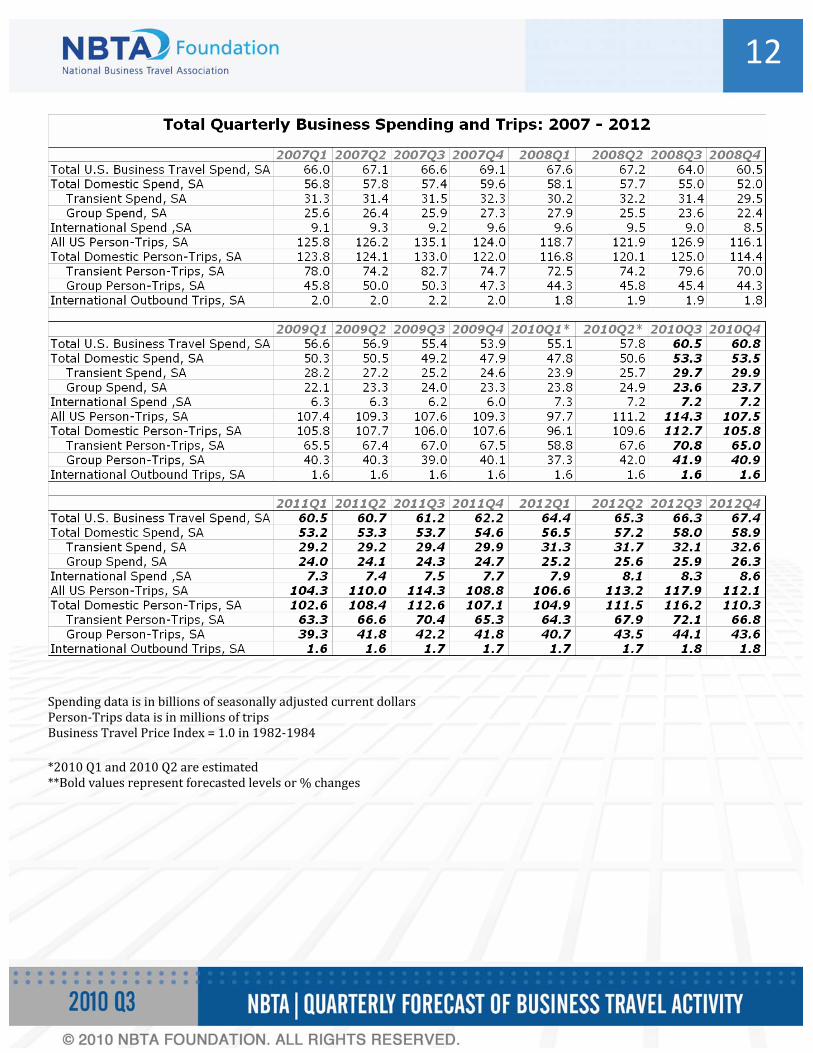
Spending data is in billions of seasonally adjusted current dollars Person‐Trips data is in millions of trips Business Travel Price Index = 1.0 in 1982‐1984 *2010 Q1 and 2010 Q2 are estimated **Bold values represent forecasted levels or % changes

13
Last reported historic value for Person‐Trips is 2010Q2 Last reported historic value for Spending is 2009Q4 * Spending data for 2010Q1,Q2 is estimated by Vantage Strategy Source: D.K. Shifflet & Associates, US Department of Commerce OTTI, Vantage Strategy