the neighborhood atlas - university of washington
TRANSCRIPT
The Neighborhood Atlas: Local Health and Social Disadvantage
October 19, 2018
Amy Kind, MD, PhDDirector, Department of Medicine Health Services and Care Research Program
Associate Professor, Department of Medicine, Division of Geriatrics University of Wisconsin School of Medicine and Public Health;
Current Funding and Recent Past Funding:NIH/National Institute on AgingNIH/National Institute on Minority Health
and Health DisparitiesUS Centers for Medicare and Medicaid ServicesUS Department of Veterans AffairsCommonwealth FoundationUK Alzheimer’s Society
Disclosures

© cnbc.com
We Can Improve Health Here….
Source: www.Pixabay.com-- All images are released free of copyrights under Creative Commons CC0
© cnbc.com
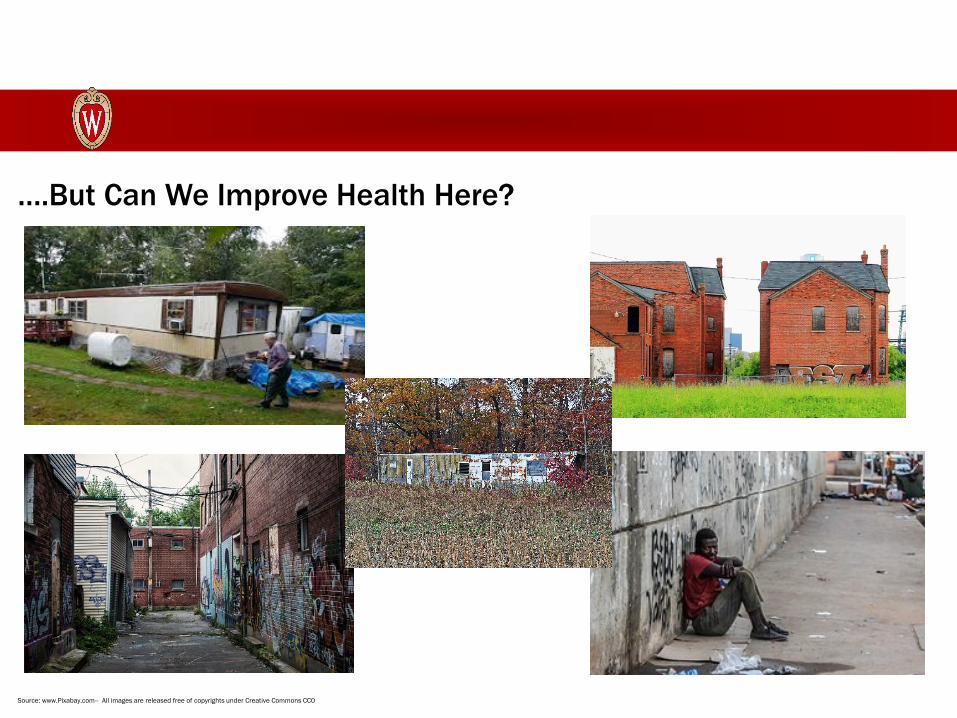
….But Can We Improve Health Here?
Source: www.Pixabay.com-- All images are released free of copyrights under Creative Commons CC0

• Alzheimer’s disease and many other conditions disproportionately impact racial/ethnic minorities and the socioeconomically disadvantaged—populations often exposed to neighborhood disadvantage
[Link & Phelan, J Health Soc Behav, 1995; ]
• Neighborhood disadvantage influences many factors including health behaviors, access to food, toxic exposures and personal safety
[Link & Phelan, J Health Soc Behav, 1995; House et al, Milban Q, 1990; Franco et al, Am J Prev Med, 2008; and others]
• Neighborhood disadvantage is a social determinant of health
• Living in a disadvantaged US neighborhood is strongly linked to increased mortality and disease
[Kind et al, Annals of Int Med, 2014; Link & Phelan, J Health Soc Behav, 1995; House et al, Milban Q, 1990; and others]
Background
Source: www.Pixabay.com-- All images are released free of copyrights under Creative Commons CC0

Source: https://www.nimhd.nih.gov/images/research-framework-slide.pdf
• Context is fundamental to almost all theoretical mechanisms of health disparities

• High-quality studies [Ludwig, Science 2012 and others] suggest that neighborhood-level factors impact health independently of individual-level factors
• Health interventions and policies that do not account for neighborhood disadvantage may be ineffective
• Much research in this area relies on application of geospatial analytics to quantify neighborhood disadvantage. This is a specialized field, not widely available
• Key Gap: Neighborhood-level factors are not typically incorporated into existing NIH research data and population resources
Background
Source: www.Pixabay.com-- All images are released free of copyrights under Creative Commons CC0

• Metrics of Neighborhood Disadvantage are Robust:• Generalizable to full US and Puerto Rico• Incorporate into predictive analytics • Facilitate mechanistic science across health conditions• Privacy-compliant• Strong track record of application – mostly abroad
• Translatable: Actionable at person, community, research and policy levels
• Guide outreach, targeting- particularly through mapping• Influence intervention design, implementation• Policy-applicable: eligibility, adjustment, resources, etc
• Underutilized: Yet, despite all this potential, greatly underutilized in the US-- not easily accessible nor always in a format that allows wide applicability
Potential of Geospatial Metrics of
Neighborhood Disadvantage
Source: www.Pixabay.com-- All images are released free of copyrights under Creative Commons CC0

• Originally created by Health Resources and Services Administration nearly three decades ago and employed at the county level
• 17 education, employment, housing-quality and povertymeasures originally drawn from long-form Census
• Limitations mirror those of parent data
• Required updates for modern use
• UW team:• Updated to more recent and relevant data sources
(American Community Survey, 2009-13)• Refined down to census block-group level (i.e.
“neighborhood” ~ 1,500 persons) which is critical tomore precisely measure exposure
• NIH R01 to validated these changes with users across US
Area Deprivation
Index(ADI)
Source: www.Pixabay.com-- All images are released free of copyrights under Creative Commons CC0
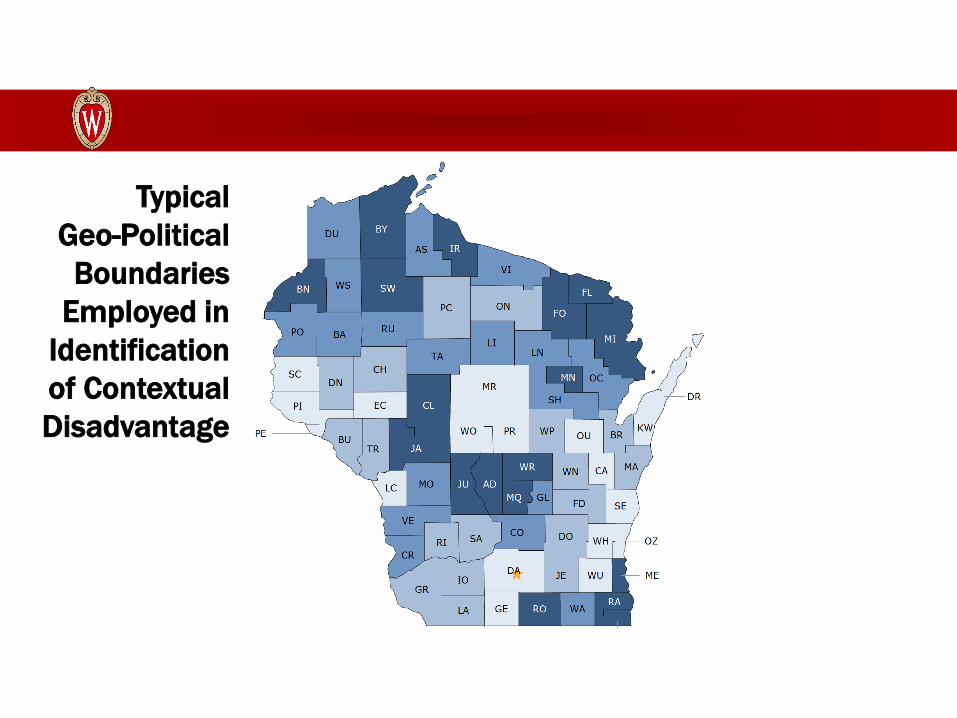
TypicalGeo-Political Boundaries
Employed in Identification of Contextual Disadvantage

Neighborhood Disadvantage
by ADI

Milwaukee County


• Research---Living in a highly disadvantaged neighborhood:
• Rehospitalization and cost [Kind et al, Annals, 2014; Hu et al, AJMQ, 2018]
• AD-specific CSF biomarkers, cognitive loss; hippocampal volumes[Kind et al, Alz Assoc Annual Meeting, 2017; Hunt et al, Alz Assoc Annual Meeting, 2018]
• CMV seroprevalence in pregnancy[Lantos et al, J Racial and Ethnic Health Disparities, 2018]
• Skin infection and deafness in childhood[Lantos et al, manuscripts in submission, 2018]
• Medicare Advantage plan performance on cholesterol and BP quality measures[Durfey et al, Health Affairs, 2018]
• Functional loss, many others…[Jung et al, JAGS, 2018]
• Delivery -- CMS Everyone with Diabetes Counts Program• Outreach, targeting to disadvantaged neighborhoods
• Policy– Multiple state-based health organizations • Catalyze new partnerships among communities, health systems
and governments to advocate for policies addressing social factors that influence health
Examples:Neighborhood Disadvantage
by ADIand Health
Source: www.Pixabay.com-- All images are released free of copyrights under Creative Commons CC0

• Making complex data easily available to wide-reaching expert and non-expert audiences to massively broaden uptake and use of critical concepts and tools
• Extremely challenging to practically achieve due to technical challenges of big data
Data Democratization
Source: www.Pixabay.com-- All images are released free of copyrights under Creative Commons CC0
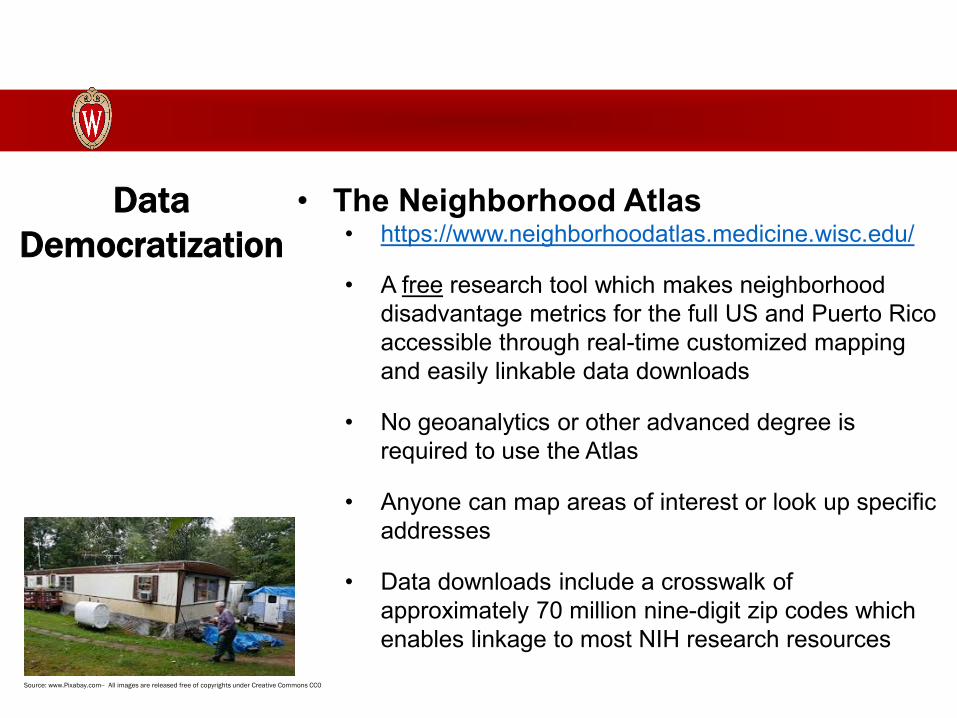
• The Neighborhood Atlas• https://www.neighborhoodatlas.medicine.wisc.edu/
• A free research tool which makes neighborhood disadvantage metrics for the full US and Puerto Rico accessible through real-time customized mapping and easily linkable data downloads
• No geoanalytics or other advanced degree is required to use the Atlas
• Anyone can map areas of interest or look up specific addresses
• Data downloads include a crosswalk of approximately 70 million nine-digit zip codes which enables linkage to most NIH research resources
Data Democratization
Source: www.Pixabay.com-- All images are released free of copyrights under Creative Commons CC0

Neighborhood Atlas
https://www.neighborhoodatlas.medicine.wisc.edu/

Neighborhood Atlas: Download Data
https://www.neighborhoodatlas.medicine.wisc.edu/

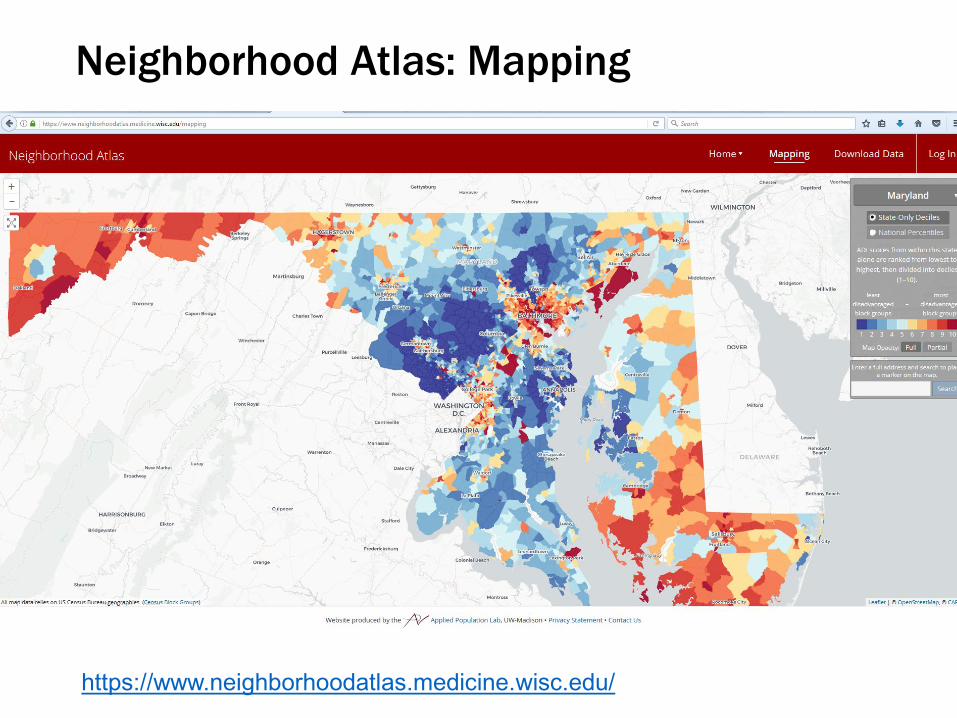
Neighborhood Atlas: Mapping
https://www.neighborhoodatlas.medicine.wisc.edu/

Neighborhood Atlas: Mapping
https://www.neighborhoodatlas.medicine.wisc.edu/
Neighborhood Atlas: Mapping
https://www.neighborhoodatlas.medicine.wisc.edu/

Neighborhood Atlas: Mapping
https://www.neighborhoodatlas.medicine.wisc.edu/


• ~60,000 views, vast majority focused on mapping
• Over 4,000 data downloads• US House of Representatives• Social Security Administration• NIH, CDC, VA, DOD, HHS• AARP• Directors of global pharmaceutical companies,
health systems and other industry leaders, as well as many others
• More than 600 registered academic users, representing 300 unique universities in 47 of the 50 US states, France, Netherlands, England and Nigeria
• Feedback = Positive and overwhelmingly thankful
Neighborhood Atlas Use
( 3 months after NEJM
publication)
Kind AJH, Buckingham W. Making Neighborhood Disadvantage Metrics Accessible: The Neighborhood Atlas. New England Journal of Medicine, 378: 2456-2458; (2018)

• Update ADI at least every 5 years; Update annually if resources allow
• Explore offering additional measures on Atlas
• Catalyze, inform translational research:• Multi-stakeholder community intervention research to
improve health• Clinical trial and cohort recruitment, retention, analysis• Epigenomics• Social-biological mechanisms of disease
• Goal: Bring together new partnerships to catalyze the kinds of policy initiatives, research studies, resource alignment and clinical interventions that are needed to improve health equity in the US
Potential Next Steps
Source: www.Pixabay.com-- All images are released free of copyrights under Creative Commons CC0

NIH FundingNIMHD R01MD010243-01 (Kind PI)NIA RF1AG057784 (Kind PI; Bendlin MPI)
Co-authorWilliam Buckingham, PhD
AcknowledgementsCarol HermannCaitlin McKownAlice KimSarah Keller