the net benefit to employer investment in … net benefit to employer investment in apprenticeship...
TRANSCRIPT
The Net Benefit to Employer Investment in Apprenticeship
Training
A Report for the Apprenticeship Ambassadors Network
by Chris Hasluck, Terence Hogarth, Beate Baldauf and Geoff Briscoe
November 2008
University of Warwick Institute for Employment Research
Coventry CV4 7AL Tel: 02476-524420 Fax: 02476-524241
E-mail: T. [email protected] [email protected]


i
CONTENTS LIST OF TABLES.................................................................................................................. iv
LIST OF FIGURES ................................................................................................................ iv
DISCLAIMER.......................................................................................................................... v
ACKNOWLEDGEMENTS ...................................................................................................... v
SUMMARY ........................................................................................................................... vii
The study ............................................................................................................................. vii
The case studies ................................................................................................................. vii
The structure of the report................................................................................................ viii
Key findings ....................................................................................................................... viii
1. INTRODUCTION ............................................................................................................. 1
1.1 The “Net Costs of Training to Employers” series................................................... 1
1.2. Aims of the study ....................................................................................................... 3
1.3 Research design and data collection....................................................................... 3
1.3.1 Case studies ............................................................................................................... 3
1.3.2 A telephone survey .................................................................................................... 4
1.4. Measuring the net benefit of Apprenticeship training............................................ 5
1.4.1 General approach....................................................................................................... 5
1.4.2 Estimating costs and benefits .................................................................................. 7
1.5 Structure of the report ............................................................................................. 10
2. THE ENGINEERING SECTOR ..................................................................................... 11
2.1 Introduction .............................................................................................................. 11
2.2 The engineering case studies................................................................................. 11
2.3 Recruitment of engineering Apprentices............................................................... 12
2.4 The structure of training.......................................................................................... 13
2.5 The costs of training................................................................................................ 14
2.6 Cost changes over time........................................................................................... 16
2.7 Conclusions.............................................................................................................. 20

ii
3. THE HOSPITALITY SECTOR....................................................................................... 21
3.1 Introduction .............................................................................................................. 21
3.2 The case studies ...................................................................................................... 21
3.3 Recruitment of Apprentices .................................................................................... 22
3.4 The structure of training.......................................................................................... 23
3.5 The costs of training................................................................................................ 24
3.6 Conclusion................................................................................................................ 25
4. THE RETAIL SECTOR.................................................................................................. 27
4.1 Introduction .............................................................................................................. 27
4.2 The case studies ...................................................................................................... 27
4.3 Recruitment of Apprentices .................................................................................... 28
4.4 The structure of training.......................................................................................... 28
4.5 Apprentice pay and productivity ............................................................................ 30
4.6 The costs of training................................................................................................ 30
4.7 Conclusions.............................................................................................................. 32
5. BUSINESS ADMINISTRATION .................................................................................... 33
5.1 Introduction .............................................................................................................. 33
5.2 The case studies ...................................................................................................... 33
5.3 Recruitment of Apprentices .................................................................................... 34
5.4 The structure of Apprenticeship training .............................................................. 35
5.5 The net cost of training ........................................................................................... 36
5.6 Completion, drop out and career progression...................................................... 40
5.7 Conclusions.............................................................................................................. 40
6. SOCIAL CARE .............................................................................................................. 43
6.1 Introduction .............................................................................................................. 43
6.2 The case studies ...................................................................................................... 43
6.3 Structure of training................................................................................................. 44
6.4 Net costs of training ................................................................................................ 47

iii
6.5 Conclusion................................................................................................................ 50
7. THE CONSTRUCTION SECTOR.................................................................................. 51
7.1 Introduction .............................................................................................................. 51
7.2 The case studies ...................................................................................................... 52
7.3 Recruitment of Apprentices .................................................................................... 53
7.4 The structure of training.......................................................................................... 54
7.5 The costs of training................................................................................................ 54
7.6 Conclusion................................................................................................................ 56
8. THE BENEFITS OF APPRENTICESHIP ...................................................................... 57
8.1 Investing in Apprenticeship training...................................................................... 57
8.2 An approach to measuring benefits....................................................................... 57
8.3 Payback periods for Apprenticeship in selected sectors .................................... 60
8.4 Other benefits from Apprenticeships..................................................................... 65
8.5 Public funding and the investment in Apprenticeship ......................................... 68
9. CONCLUSIONS ............................................................................................................ 71
9.1 Introduction .............................................................................................................. 71
9.2 Key messages .......................................................................................................... 72
10. REFERENCES........................................................................................................... 75
ANNEX A Topic guide for case study interviews ........................................................ 77
ANNEX B Report on the net cost telephone survey.................................................... 83

iv
LIST OF TABLES Table 1.1 Employer case studies by sector .................................................................. 4 Figure 1.1 A stylised model of Apprenticeship training ............................................... 6 Table 1.2................................................................................................................................. 8 Accounting framework of the costs and benefits of training (per Apprentice) .............. 8 Table 2.1 The engineering case studies ...................................................................... 11 Table 2.2 Structure of training in engineering ............................................................ 13 Table 2.3 An example of the content of Apprenticeship training in engineering .... 14 Table 2.4 Net costs of training to engineering employers......................................... 15 Table 2.5 Example of relatively high cost engineering Apprenticeship ................... 17 Table 2.6 Example of relatively low cost engineering Apprenticeship..................... 18 Table 2.7 Changes in the cost of training, 2002/3 – 2008 (2008 constant prices).... 19 Table 3.1 The hospitality case studies ........................................................................ 22 Table 3.2 Employers’ training costs in hospitality ..................................................... 24 Table 4.1 The retail case study employers.................................................................. 28 Table 4.2 Net costs of training to retail employers..................................................... 30 Table 4.3 Variations in the cost of retail Apprenticeships......................................... 31 Table 5.1 The business administration case study employers ................................. 34 Table 5.2 Net cost of Level 2 business administration Apprenticeships ................. 36 Table 5.3 Net cost of Level 3 business administration Apprenticeships ................. 37 Table 5.4 A low cost Level 3 business administration Apprenticeship.................... 38 Table 5.5 A high cost Level 3 business administration Apprenticeship .................. 39 Table 6.1 The social care case studies........................................................................ 43 Table 6.2 Core and optional (selection) units for health & social care Level 2........ 45 Table 6.3 Example of a relatively low cost NVQ (Case Study S7) ............................. 48 Table 6.4 Example of a relatively high cost NVQ (Case Study S8)............................ 49 Table 7.1 The case studies: employers in construction ............................................ 52 Table 7.2 Employers’ training costs in construction.................................................. 55 Table 8.1 Scale of marginal productivity gain for employers by sector ................... 59 Table 8.2 Payback period for an Apprenticeship in engineering .............................. 62 Table 8.3 Payback period for an Apprenticeship in hospitality................................. 62 Table 8.5 Payback period for an Apprenticeship in business administration ......... 63 Table 8.6 Payback periods for an Apprenticeship in social care .............................. 64 Table 8.7 Payback periods for an Apprenticeship in construction........................... 64
LIST OF FIGURES Figure 1.1 A stylised model of Apprenticeship training ………………………………… 6
v
DISCLAIMER
The views in this report are those of the authors and do not necessarily reflect those of the Apprenticeship Ambassadors Network.
ACKNOWLEDGEMENTS
A number of people have provided help and support for this research. First, and foremost, gratitude is expressed to all of the employers who agreed to be interviewed as part of the case studies for their time and their hospitality.
The authors would also like to thank members of the project steering group, in particular John Allbutt, representing the Secretariat of the Apprenticeship Ambassadors Network, and Chris Littler of the Department for Innovation, Universities and Skills. Thanks must also be expressed to Rod Kenyon and members of the Apprenticeship Ambassadors Network for comments on early findings and drafts of this report.
The research team was supported in their work by Duncan Adam, Martyn Kerry and Chris Jacobs who assisted with case study fieldwork, Amanda Kerry who organised case study visits and Faye Padfield who assisted with the production of the final report.

vi
vii
SUMMARY
The study The overall aim of the study was to contribute to the work of the Apprenticeship Ambassadors Network by providing a detailed assessment of the contribution made by employers to the provision of Apprenticeship training to Level 2 and Level 3, and to indicate some of the longer-term benefits to the employer from engaging in such Apprenticeship training. The study was undertaken by the Warwick Institute for Employment Research (IER) and updated earlier IER studies of Apprenticeship in the context of the targets established for Apprenticeship training following the Leitch Review and the introduction of Leitch Implementation Plan.
The study provides:
• estimates of the net and gross costs to the employer of training to (a) completion of the NVQ and (b) the full framework;
• an assessment of the scale of the public funding of Apprenticeships; • estimates of the costs in each year of the Apprenticeship; • the structure of training being offered; • an assessment of the impact of Apprenticeship on labour retention and recruitment; • an assessment of the relative productivity of the fully experienced worker trained via
employers’ Apprenticeship schemes compared to fully experienced workers recruited externally;
• employers’ views on the importance of completing the full Framework; • employers’ perceptions of the impact on innovation.
The case studies The evidence for the study was drawn from case studies conducted in six industrial sectors providing Apprenticeships under the following frameworks:
• Engineering • Hospitality • Retail
• Business Administration • Social care • Construction
These sectors provided a contrast between traditional and non traditional areas of Apprenticeship training.
The data collection method used was the same as that used in earlier IER studies of the net costs of Apprenticeship. It must be recognised that the case study method does not provide a statistically representative sample of employers and the findings relate only to the selected establishments and cannot provide robust estimates of net costs for each sector as a whole. A telephone survey was piloted covering 102 employers in engineering and retailing to test the feasibility of conducting the study using a telephone interview approach (facilitating larger, statistically representative samples). The experiment was only partially successful.
viii
While useful information about Apprenticeships was obtained from the telephone survey, the costing of Apprenticeships is complex and proved difficult to achieve by that means. Telephone interviews often provided only crude estimates of costs. It was possible to compare some case study and telephone interviews with the same employer and such comparison highlighted discrepancies between the two sets of responses and also suggested that telephone responses were likely to overstate the cost of Apprenticeship training (because of the crude estimates of cost which the case study interviews were able to probe and refine). The evidence presented in this report is, therefore, based on the case studies.
The structure of the report The report is, essentially, in two parts. In the first part – Chapter 2 to Chapter 7 – the net cost of providing Apprenticeships is examined. Chapter 2 looks at net cost in engineering, Chapters 3 and 4 look at Apprenticeships in hospitality and retailing, Chapter 5 considers business administration Apprenticeships while Chapter 6 examines training in social care. Finally, Chapter 7 examines the cost of Apprenticeship in the construction sector. These chapters provide essential detail relating to the cost – or investment – that employers are making in Apprenticeships. It is, however, important not to lose sight of the benefits accruing to business from such investments and these are examined in Chapter 8. Chapter 9 draws together the findings of the study and presents its main conclusions.
Key findings The evidence from the case studies highlights the following key findings:
• Training an Apprentice in engineering was relatively expensive compared to other sectors (estimated as £28,762, on average, across the case studies) but such costs must be set against the potential benefits of training. The engineering case studies indicate that the employer’s investment was, on average, paid back in less than three years. More importantly, the evidence points to significant benefits to establishments from investing in Apprenticeships through lower labour turnover, a better fit between the skills possessed by employees and the skills required by the company, and some control skill-shortages potentially pushing up wage rates. There is also evidence of Apprentices bringing innovation into workplaces.
• The cost of investing in Apprenticeship training in the hospitality sector was modest in comparison to other case study sectors and was likely to be quickly recouped in a little over one year. The average cost of a completed Apprenticeship in a hospitality case study was in the order of £4,236. The main problems for employers related to the recruitment of young people to begin Apprenticeships and the retention of Apprentices once they had completed their training.
ix
• Retailing Apprenticeships tend to be of short duration and mostly involve on-the-job training. A combination of low supervision costs and high productivity (relative to an experienced worker) during the training period resulted in a net cost that was low compared to more traditional Apprenticeships. While the average net cost across retail case studies was estimated to be around £2,305, some retail establishments had virtually recouped their whole investment by the end of the Apprenticeship.
• Apprenticeships in business administration varied in the way that such Apprenticeships were delivered and the time taken to complete. Achieving an NVQ Level 3 Apprenticeship could take between two and four years depending upon the employer concerned. NVQs at Level 2 could be achieved in 12-15 months or sometimes less. Business administration Apprenticeships represent a comparatively low cost investment for many employers, especially where the Apprenticeship was completed at Level 3 in just two years. The comparatively high value of Apprentices to the business during training offsets the cost of supervision and assessment to a considerable degree. The average net cost of achieving a Level 3 Apprenticeship was estimated to be £3,464 where the Apprenticeship was completed in two years and not much more (£3,898) if completed within three years.
• Establishing the net cost of training in social care was difficult because of the complexity and variability of the training provided. If an employer provides training to NVQ Level 2 then the cost to them could be as high as £4,359 while if training were to NVQ Level 2 followed by NVQ Level 3 the total net cost was estimated to be as high as £7,743. In both instances, these costs reflect the formal structure of training and the time taken to achieve the qualifications. It can take up to four years to recoup the net cost of training to NVQ Level 2 and over five years where training is to NVQ Level 3.
• Employers in the construction sector train people in order to ensure a supply of skilled and qualified workers (both to themselves and, subsequently, to their sub-contractors and the industry as a whole) as well as to recoup levy payments. Although employers incurred a considerable expenditure training Apprentices (an estimated average of £22,043 across the case studies), they were able to recoup this within a short-space of time – usually less than two years. Training was seen as critical for the individual companies and their sub-contractors to improve skill retention.
• A wide range of benefits were mentioned (although the relative importance of benefits varied across sectors). These benefits included the following:
o Apprenticeships allowed the business to secure a supply of people with the skills and qualities that the business required and which were often not available on the external job market;
o Apprenticeships were especially important in establishments where they were seen as potential replacements for an ageing workforce;
x
o even if external recruitment was possible it was often more expensive to recruit experienced workers from the external labour market because of recruitment costs plus the costs of induction and any necessary training;
o by training Apprentices the business contributed to the pool of skilled and certificated employees from which it might recruit in the future;
o Apprentices ensured that the supply-chain (i.e. sub-contractors) had a sufficiently skilled workforce;
o lower labour turnover – Apprentices tend to stay with the organisation;
o Apprentices provided a cadre of employees from which to select future managers;
o Apprenticeship training could increase interest in training amongst other employees;
o shows company commitment to the employee;
o Apprenticeships were more practical and job-related than other forms of learning;
o Apprentices can bring new ideas and innovation to the business;
o a good Apprenticeship scheme could be reflected in an enhanced reputation for the business both within the industry and in the local community...
• Case study employers often appeared unaware of the source or the extent of public financial support for Apprenticeships, as such funding was often delivered through training providers and not directly to employers. For that reason it was not possible to measure directly the public funding received by those employers. An alternative, indirect, approach using LSC funding rates to estimate the public funding received by case study employers was also difficult because the case studies did not collect the full range of information about delivery models used, or the characteristics of individual Apprentices that would enable such an estimation to be made. Nonetheless, setting the net costs of case study employers alongside LSC funding rates, while not strictly comparable, does highlight the substantial public investment that takes place in support of employers’ investment in Apprenticeships.
Overall, the evidence points to employers obtaining a range of qualitative benefits, as highlighted above, from the Apprenticeship training in which they invest, but importantly that investment is recouped in monetary terms within two to three years in most instances. If the employer can retain the Apprentice for a few years they will obtain a positive return on their investment and, moreover, if they view Apprenticeship as an investment then they will want to protect it by putting in place, as many employers do, those practices that will help retain Apprentices over the period of training and beyond. For the employer that appropriately husbands their investment in Apprenticeships there are significant returns to be had. This report provides the most concrete evidence to date to demonstrate this key point.
1
1. INTRODUCTION
1.1 The “Net Costs of Training to Employers” series
Since 1995, the University of Warwick Institute for Employment Research (IER) has undertaken a series of Net Cost of Training to Employers studies that periodically estimated the costs to employers from investing in Apprenticeship training (see Hogarth et al., 1996; Hogarth and Hasluck, 2003; Hogarth et al., 2005 for details). In doing so, these studies examined the employer’s rationale for engaging in this form of training against a background of changing policy with respect to both funding and the content of training. The current Net Cost study updates these earlier studies in the context of the targets established for Apprenticeship training following the Leitch Review and the introduction of Leitch Implementation Plan. The study seeks to go further than the earlier studies in that it also attempts to estimate the investment ‘payback’ period, that is, the time over which an employer recoups their investment in Apprenticeship.
In general, the previous Net Cost studies revealed that employer supply of Apprenticeship places was driven by:
• a history of engaging in Apprenticeship training;
• a demand for an inflow of – typically young – skilled people into the business;
• the appropriateness of Frameworks to the needs of the business;
• a public service commitment in relation to the largest employers and the public sector; and
• the level of funding available.
A wider body of evidence on the benefits of Apprenticeship training suggest that Apprenticeships benefit both employers and young people, but that supply of such training places made available by employers has been sub-optimal because of:
• the wide variation in the level of employer investment (funding) by sector and Framework (Hogarth et al., 1996; Hogarth and Hasluck, 2003);
• the relatively low levels of participation in Apprenticeship training in some sectors of the economy, although this has improved of late (IFF 2000; Ryan et al., 2006);
• demand outstripped the supply of Apprenticeship in some sectors and amongst the exemplary employers (Fuller and Unwin, 2007; House of Lords, 2007);
• declining levels of participation at Level 3 which, historically, has been the level at which Apprenticeships have been delivered and where, arguably, the country has been most deficient compared to competitor nations;
• relatively low levels of completion, although these have increased of late;
• relatively little evidence of progression to Foundation Degrees and beyond once the Apprenticeship has been completed.

2
Since Modern Apprenticeships were established in the mid 1990s, there have been a number of reviews that have assessed their performance and recommended various changes: from the Cassel’s Report – Modern Apprenticeships: the Way to Work at the beginning of this century to the more recent DIUS/DCSF White Paper World Class Apprenticeships: Unlocking Talent, Building Skills for All. Recently, the London Apprenticeship Task Force has been established, comprising representatives from DIUS, employers, local government, college principals and training providers, with the aim of encouraging employers to increase their take up of Apprenticeships. The Taskforce targets public sector employers and small and medium-sized private enterprises. In January 2008, civil service employers committed to expanding the number of Apprenticeships in the public sector to 500 new Apprentices and in October 2008 Ministers announced a further increase in Apprenticeship numbers during the global downturn. Over 1,000 Apprentices will be recruited to central government departments and agencies in 2008-2009, spanning sixteen government departments, including: the Department for Innovation Universities and Skills; the Department for Children, Schools and Families; the Department for Work and Pensions and the Ministry of Justice. Finally, an Apprenticeship Bill is currently progressing through Parliament which will give Apprenticeships the statutory base some commentators have long called for.
Of central importance to persuading employers to invest in Apprenticeship training – to a level where completion rates are assured - is the extent to which they obtain a return on their investment. Previous research has indicated that there is positive return to employers (McIntosh, 2007), but the costs of Apprenticeship are front-loaded with the employer only obtaining a return if they can retain the Apprentice they have trained. The latest Net Costs of Training study reported here looks at the period over which returns are obtained. It also assesses the extent to which an Apprenticeship provides a route to progression within organisations by opening the door to further training opportunities and thereby career progression.
As with previous Net Costs of Training studies, the evidence indicates that the employer experience is variable across sectors and levels: Level 3 Apprenticeships in engineering and construction tend to be highly structured and relatively expensive but can generate significant returns to the employer over the long-run; in contrast, Level 2 Apprenticeships in sectors such as retail tend to be much shorter in duration and rely much more upon on-the-job training and are consequently less expensive. Where the evidence is consistent across sectors and levels is with respect to the level of employer engagement with Apprenticeship. Where employers are willing to make a high level of commitment to the training programme and the Apprentice such that completion rates are high, and recognise that the Apprentice can be a valuable resource to the company over the medium- to long-term, then the returns
3
to the employer – even if reported in qualitative terms – are comparatively greater than where the commitment is not so manifest.
1.2. Aims of the study
The overall aim of the study was to contribute to the work of the Apprenticeship Ambassadors Network by providing a detailed assessment of the contribution made by employers to the provision of Apprenticeship training to Level 2 and Level 3, and indicate some of the longer-term benefits to the employer from engaging in such Apprenticeship training.
The study provides:
• estimates of the total net and gross costs to the employer of training Apprentices to completion of the NVQ;
• estimates of the costs in each year of the Apprenticeship • an assessment of the scale of public funding of Apprenticeships; • the structure of training being offered; • an assessment of the impact of Apprenticeship on labour retention and recruitment; • an assessment of the relative productivity of the fully experienced worker trained via
employers’ Apprenticeship scheme compared to fully experienced workers recruited externally;
• employers’ views on the importance of completing the full Framework; • employers’ perceptions of the impact on innovation.
The study was concerned with Apprenticeships provided under the following frameworks:
• Engineering • Hospitality • Retail
• Business Administration • Social care • Construction
These sectors provide a contrast between traditional and non-traditional areas of Apprenticeship training.
1.3 Research design and data collection
1.3.1 Case studies
The evidence for the study is drawn from a large number of case studies across six industrial sectors. The method used was the same as that used in earlier IER studies of the net cost of Apprenticeship. An average of eight case studies were conducted in each sector, in total 50 case studies were completed (see Table 1.1). In each sector the Framework to which the net costs data refer is one directly related to the sector (e.g. the Frameworks in Construction relate to Level 3 Frameworks in bricklaying and joinery).
4
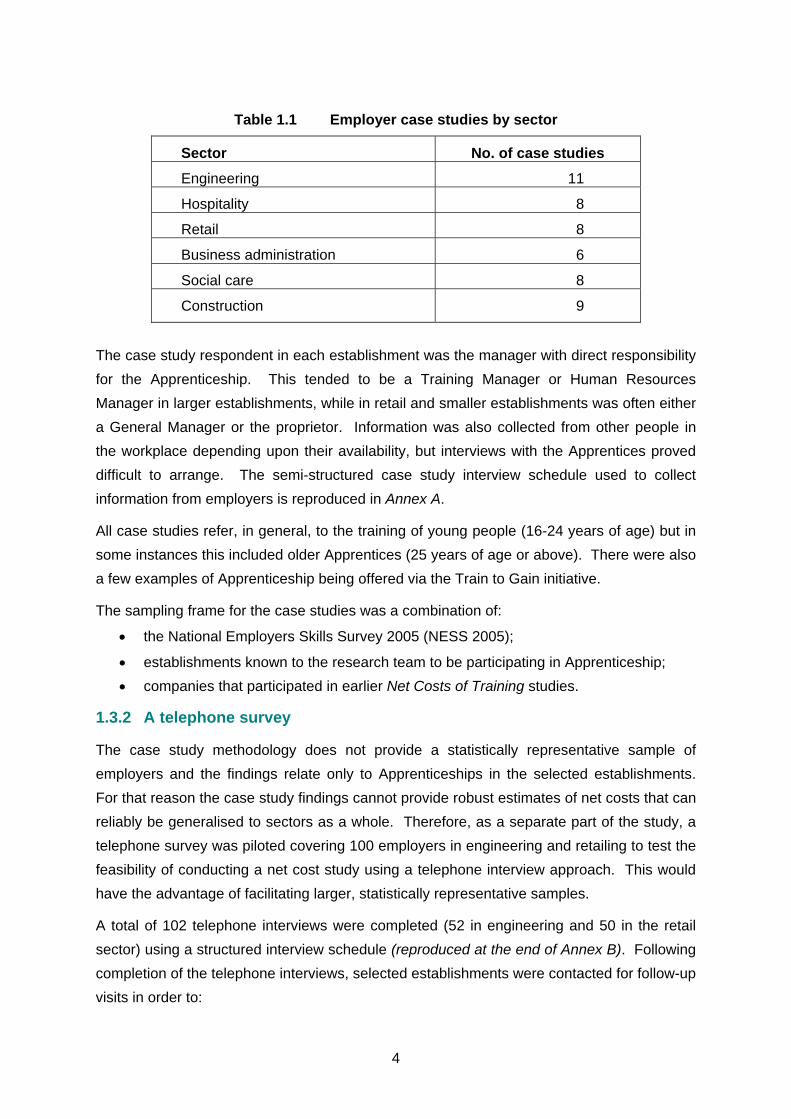
Table 1.1 Employer case studies by sector
Sector No. of case studies
Engineering 11
Hospitality 8
Retail 8
Business administration 6
Social care 8
Construction 9
The case study respondent in each establishment was the manager with direct responsibility for the Apprenticeship. This tended to be a Training Manager or Human Resources Manager in larger establishments, while in retail and smaller establishments was often either a General Manager or the proprietor. Information was also collected from other people in the workplace depending upon their availability, but interviews with the Apprentices proved difficult to arrange. The semi-structured case study interview schedule used to collect information from employers is reproduced in Annex A.
All case studies refer, in general, to the training of young people (16-24 years of age) but in some instances this included older Apprentices (25 years of age or above). There were also a few examples of Apprenticeship being offered via the Train to Gain initiative.
The sampling frame for the case studies was a combination of:
• the National Employers Skills Survey 2005 (NESS 2005);
• establishments known to the research team to be participating in Apprenticeship; • companies that participated in earlier Net Costs of Training studies.
1.3.2 A telephone survey
The case study methodology does not provide a statistically representative sample of employers and the findings relate only to Apprenticeships in the selected establishments. For that reason the case study findings cannot provide robust estimates of net costs that can reliably be generalised to sectors as a whole. Therefore, as a separate part of the study, a telephone survey was piloted covering 100 employers in engineering and retailing to test the feasibility of conducting a net cost study using a telephone interview approach. This would have the advantage of facilitating larger, statistically representative samples.
A total of 102 telephone interviews were completed (52 in engineering and 50 in the retail sector) using a structured interview schedule (reproduced at the end of Annex B). Following completion of the telephone interviews, selected establishments were contacted for follow-up visits in order to:

5
• validate the cost-benefit data provided in the telephone survey;
• collect the additional, often more qualitative data, that could not be collected through the telephone survey due to lack of time or difficulty collecting such data through a telephone interview.
The experiment was only partially successful. While useful information about Apprenticeships was obtained from the telephone survey, the complexity of costing Apprenticeships appeared to be more difficult to achieve by that means. In many instances the employers interviewed via telephone could not provide the necessary information or provided information that sometimes appeared implausible. The impact of missing information in the survey was that it was often impossible to estimate the net cost of training since a single piece of missing information could prevent the calculation from being made (whereas such data gaps would be explored and filled during a case study interview). Where employers appeared as both case study and survey respondent it was possible to compare responses from the two methods. The comparison highlighted a significant number of discrepancies between the two sets of responses and, overall, indicated that telephone responses tended to overstate the level of investment made by employers in Apprenticeship training. This overstatement arose from the fact that respondents tended to give crude estimates of costs whereas the case study interview was able to probe and refine responses. While the telephone survey method might be made more robust in the future, the flaws in that approach were such that the evidence presented in this report is based on the findings of the case studies alone. An account of the telephone survey is provided in Annex B.
1.4. Measuring the net benefit of Apprenticeship training
1.4.1 General approach
It has long been recognised that training by employers is a form of investment in ‘human capital’. The decision facing employers is whether or not to invest, through training in their workforce in the expectation that enhanced skills will lead to higher productivity and greater profit in the future. As with all investments, the decision whether or not to engage with Apprenticeships will reflect the employer’s perceptions of the costs of training and the longer-term benefits that will accrue to their business. The situation facing employers can be represented in a stylised manner by Figure 1.1.
6
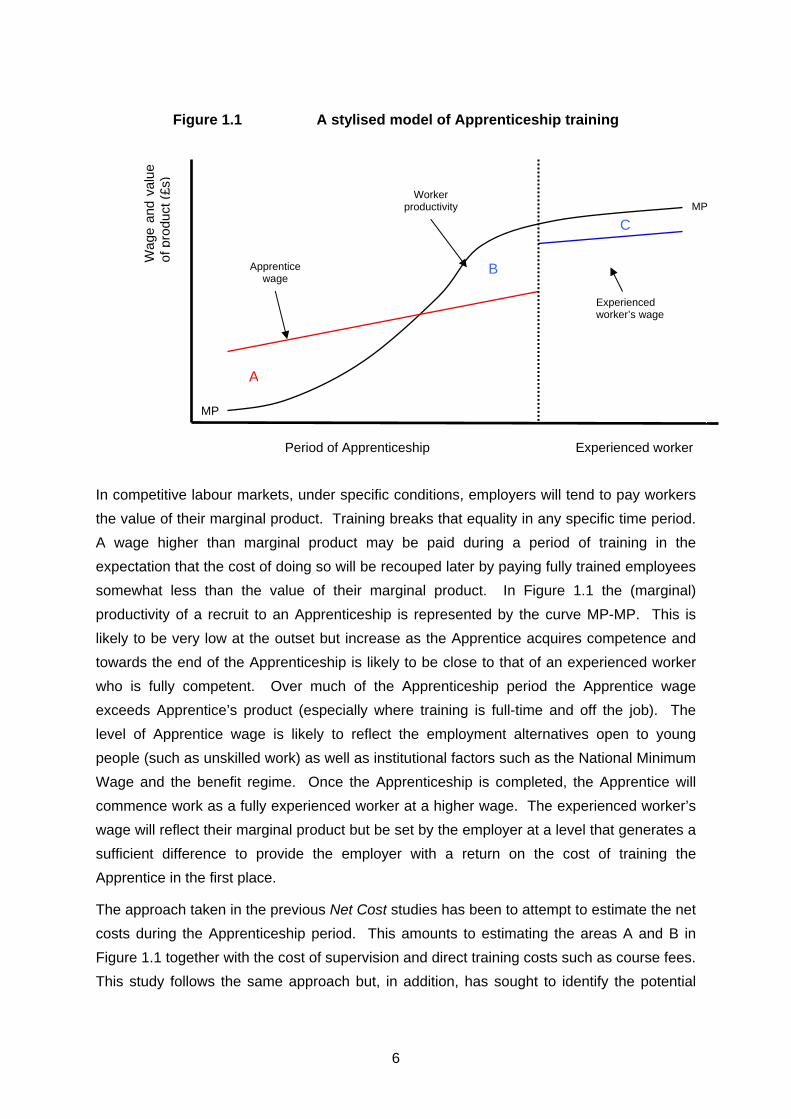
Figure 1.1 A stylised model of Apprenticeship training
In competitive labour markets, under specific conditions, employers will tend to pay workers the value of their marginal product. Training breaks that equality in any specific time period. A wage higher than marginal product may be paid during a period of training in the expectation that the cost of doing so will be recouped later by paying fully trained employees somewhat less than the value of their marginal product. In Figure 1.1 the (marginal) productivity of a recruit to an Apprenticeship is represented by the curve MP-MP. This is likely to be very low at the outset but increase as the Apprentice acquires competence and towards the end of the Apprenticeship is likely to be close to that of an experienced worker who is fully competent. Over much of the Apprenticeship period the Apprentice wage exceeds Apprentice’s product (especially where training is full-time and off the job). The level of Apprentice wage is likely to reflect the employment alternatives open to young people (such as unskilled work) as well as institutional factors such as the National Minimum Wage and the benefit regime. Once the Apprenticeship is completed, the Apprentice will commence work as a fully experienced worker at a higher wage. The experienced worker’s wage will reflect their marginal product but be set by the employer at a level that generates a sufficient difference to provide the employer with a return on the cost of training the Apprentice in the first place.
The approach taken in the previous Net Cost studies has been to attempt to estimate the net costs during the Apprenticeship period. This amounts to estimating the areas A and B in Figure 1.1 together with the cost of supervision and direct training costs such as course fees. This study follows the same approach but, in addition, has sought to identify the potential
Period of Apprenticeship Experienced worker
Wag
e an
d va
lue
of p
rodu
ct (£
s)
Worker productivity
Apprentice wage
A
B
C
Experienced worker’s wage
MP
MP
7
returns to employers following the completion of the Apprenticeship. In principle this amounts to identifying the area C in Figure 1.1 (the return to investment in Apprenticeships).
1.4.2 Estimating costs and benefits
The cost of Apprenticeships
Early analyses of training costs typically relied upon direct costs which were easily identifiable in the workplace (Deloittes, Haskins and Sells/IFF, 1988). Where studies were extended to look at the benefits of Apprenticeship they were often restricted to the manufacturing sector where measures of output were more readily available (Thomas et al., 1969). The present study seeks to cover a range of sectors including both traditional and non-traditional areas of Apprenticeship training.
The direct costs of training, such as the costs of the training department (salaries and materials), the costs of formal training courses and such like, are usually available in larger organisations and easily incorporated into a cost-benefit analysis. It must be acknowledged, however, that it is sometimes difficult to ascribe these costs to particular training activities and even large organisations maintain relatively poor financial records about their training activities. It is important therefore to devise an approach which couples rigorous analysis with a practicable approach.
In this study the components included in the analysis of the cost of employers' training were:
• wages/allowances paid to the trainee; • supervision costs of providing on-the-job training; • fees for off-the-job training; • any tool and travel allowances; • funding received by the employer from the LSC or other public funding; • administration costs.
The aim, as in previous Net Cost studies, was to provide a set of core data. The elements of that core data collected during case study interviews are set out in Table 1.2 which reproduces the accounting framework used to calculate the cost-benefit of Apprentices and which is filled out from data collected during each case study interview.

8
Table 1.2 Accounting framework of the costs and benefits of training (per Apprentice)
Year 1 Year 2 Year 3 Year 4 Total
Basic information Total number of Apprentices Apprentice’s salary1 (£ p.a.) Apprentice’s productivity (% of skilled workers) Supervision (per Apprentice) (% of Training Manager's time) Supervision (per Apprentice) (% of Line Manager's time) Supervision (per Apprentice) (% of Supervisor's time) Training Manager's Salary (£ p.a.) Line Manager's Salary (£ p.a.) Supervisor's Salary (£ p.a.)
Total training costs per Apprentice (£) Costs of recruiting the Apprentice Course fees Supervision 1 (Training Manager, Line Manager, and Supervisor) Trainee salaries Employer's NI contributions Administrative costs Total cost per Apprentice
Total training benefits per Apprentice (£) Value of Apprentice’s output 2 Income associated with Apprentice Total benefit per Apprentice Cost-benefit per Apprentice3
1 Proportion of time multiplied by salaries. 2 Percentage of tasks of the fully trained worker undertaken by the Apprentice multiplied by salary of full
experienced worker, adjusted for time in the workplace. 3 Sum of costs minus sum of benefits. Source: IER Net Benefits of Training Study 2008
9
The benefits of Apprenticeship
For many employers, the rationale for engaging in Apprenticeship training is based on the longer-term benefits that accrue to the business. Nonetheless, Apprenticeships can bring benefits to the business as well as costs even in the short-term. The main short-term benefit to the employer is the trainee's productive contribution during the Apprenticeship training period. As indicated in Figure 1.1 above, such a contribution may be small at the start of an Apprenticeship but can be significant towards the end of training. The value of the productive contribution will depend very much on the nature of the business and occupation being trained for, and the structure of the Apprenticeship (especially the extent to which training takes place on-the-job).
The productive contribution of Apprentices was estimated in the following manner. First, the ‘potential’ contribution that an Apprentice could make to the business had they been fully competent was assumed to be equal to that of a fully experienced worker. Case study respondents were then asked to assess the proportion of the tasks undertaken by an experienced worker that a typical Apprentice might be expected to achieve in each year of their Apprenticeship. That proportion was then used to moderate the potential productive contribution of the Apprentice (for instance, if an Apprentice was deemed capable of 75 per cent of the tasks of an experienced worker in their final year of training then the potential value of the productive contribution was 75 per cent of the experienced / qualified workers wage). A productive contribution from an Apprentice can, however, only be realised when they are in the workplace. Thus a further adjustment was made to the value of the productive contribution to take account of time in the workplace. In engineering, for instance, the first year of an Apprenticeship was normally full-time in college with the consequence that the productive contribution was zero or restricted to that obtained in breaks between college-based training. Where training took the form of day-release that was also factored into the estimates of productive contribution (for instance, if training required day release to a training provider (or company training centre) for one day per week, the productive contribution was taken to be 80 per cent, or 4/5ths, of potential productive contribution).
Apart from the direct contribution to production, there are other benefits that can accrue to the business during the Apprenticeship period. One example is innovation and the transfer of ideas into the workplace (for example through project work undertaken by Apprentices). The case studies identified several examples of such innovation or new ideas. While some employers could place a value on such innovation most were not able to do so. For that reason, and because it is not clear how typical such examples might be, no attempt has been made to build the value of such benefits into the cost-benefit estimates. Where examples of innovation were found they are discussed in the relevant chapter for that sector.
10
Whatever the productive contribution of Apprentices in the short-term, the main rationale for such training are the longer-term benefits to the business once the Apprenticeship training is completed. These benefits include:
• the relative productivity of fully experienced workers trained within the organisation versus those recruited externally;
• a better organisational fit between those trained in-house and the working practices of the organisation;
• improved labour retention of Apprentices trained within the organisation; and • removal of difficulties recruiting suitable fully-experienced workers from the external
labour market
Previous Net Costs studies have alluded to the perceived benefits of Apprenticeship to businesses providing the training, and such benefits were very much to the fore in the Apprenticeship Task Force study Employing Apprentices: the Business Case. In an attempt to extend the coverage of benefits in the Net Costs of Training series, several additional issues have been covered in this study:
• the extent to which Apprentices are retained by the company and how retention rates affect decision making with respect to the number of Apprentices taken on;
• an assessment of the extent of cost saving from not having to recruit a fully experienced worker (or not so many of them) because Apprentices have stayed with the company as fully experienced workers;
Where fully experienced workers are recruited from the external market a comparison has been made, where possible, of their productivity relative to the in-house trained Apprentice.
1.5 Structure of the report
The report is, essentially, in two parts. In the first part – Chapter 2 to Chapter 7 – the net cost of providing Apprenticeships is examined. Chapter 2 looks at net cost in engineering, Chapters 3 and 4 look at Apprenticeships in hospitality and retailing, Chapter 5 considers business administration Apprenticeships while Chapter 6 examines training in social care. Finally, Chapter 7 examines the cost of Apprenticeship in the construction sector. These chapters provide essential detail relating to the cost – or investment – that employers are making in Apprenticeships. It is, however, important not to lose sight of the benefits accruing to business from such investments and the benefits of Apprenticeships for employers are examined in Chapter 8. Chapter 8 also provides an appraisal of employer investment in Apprenticeships using a simple payback approach. Chapter 9 draws together the findings of the study and presents its conclusions.
11
2. THE ENGINEERING SECTOR
2.1 Introduction
The engineering case studies were all concerned with the provision of Level 3 training in either electrical or mechanical engineering. As in previous Net Costs of Training studies, establishments in the engineering sector tended to have had in place for sometime Apprenticeship training leading to accreditation as a fully experienced worker with many of their Apprenticeship programmes predating the Modern Apprenticeship initiative launched in 1994. Because of their long tradition of Apprenticeship training case study employers had often adapted their longstanding systems to meet the current requirements of the Apprenticeship programme but sometimes considered completion to require more than achievement of the full Framework. This was because they were training, in many instances, to a historical standard that had, and continued to meet, the specific needs of the business. As will be seen this has implications for the costs of training borne by employers in the sector and is one of the reasons why training in the sector is relatively expensive compared to training at a similar level in other sectors. The cost, however, were seen by employers as an investment necessary to meet the needs of the business and, as such, was considered money well spent.
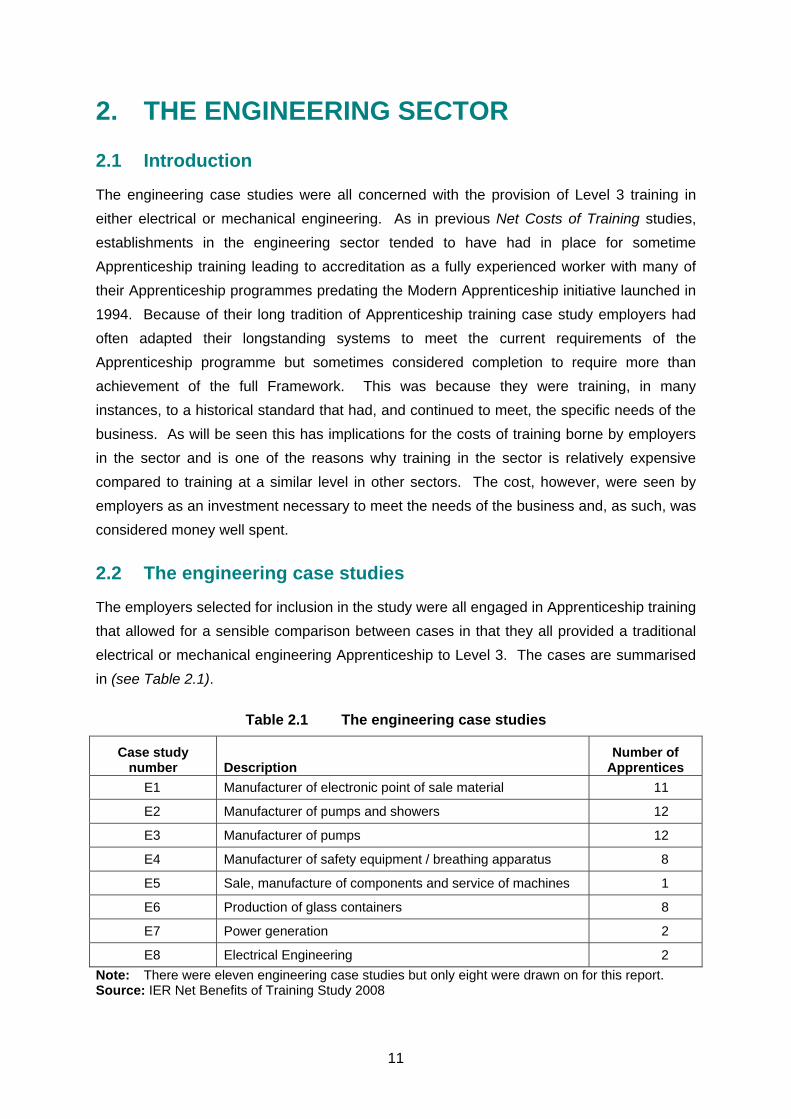
2.2 The engineering case studies
The employers selected for inclusion in the study were all engaged in Apprenticeship training that allowed for a sensible comparison between cases in that they all provided a traditional electrical or mechanical engineering Apprenticeship to Level 3. The cases are summarised in (see Table 2.1).
Table 2.1 The engineering case studies
Case study number
Description
Number of Apprentices
E1 Manufacturer of electronic point of sale material 11
E2 Manufacturer of pumps and showers 12
E3 Manufacturer of pumps 12
E4 Manufacturer of safety equipment / breathing apparatus 8
E5 Sale, manufacture of components and service of machines 1
E6 Production of glass containers 8
E7 Power generation 2
E8 Electrical Engineering 2 Note: There were eleven engineering case studies but only eight were drawn on for this report. Source: IER Net Benefits of Training Study 2008
12
2.3 Recruitment of engineering Apprentices
Recruitment of engineering Apprentices was not straightforward. Some employers reported that it was relatively easy to recruit suitable candidates whilst others reported much more difficulty. To some extent the difficulties related to local labour market conditions. Case Study E1, for instance, was in a relatively tight labour market in the South West with strong competition from other engineering firms and other sectors for suitably qualified candidates. In contrast, Case Study E4 was located in a much weaker labour market and had much less difficulty in recruiting the Apprentices it needed but made it relatively difficult to find fully experienced workers.
At a minimum, applicants required three GCSEs at Grade C or above including mathematics and a science, but some employers expected applicants to have a minimum of five GCSEs at Grade C or above. In the weaker local labour markets, qualifications required for entry could be used as a means of sifting applicants, but for the most part the entry requirement was specified because Apprentices required that level of educational attainment to study towards their ONC and HNC qualifications. Employers also looked for other qualities to help differentiate between candidates including a proven interest in engineering and evidence of extra-curricula activities.
Employers were often looking to make themselves the “employer of choice” in their locality by demonstrating: (i) the value of engineering to the economy; (ii) the salaries on offer to fully experienced workers; and (iii) the opportunities for career development within the company. The emphasis upon setting a relatively high qualification for entry to an Apprenticeship, and establishing themselves as one of the better employers in the area so as to attract good applicants, reflected the relatively high level of investment employers made in Apprentices once they were hired. The level of investment also reflected the importance of Apprentices to the future of the organisation.
In general, employers were looking to recruit people aged 16-18 years, though they were willing to take on older Apprenticeships. The increase in the number of people entering higher education has implications for Apprenticeships in the engineering sector beyond reducing the potential supply of young people with five GCSEs looking to enter employment immediately upon completion of their compulsory schooling. At least one employer reported that the recruitment of engineers to graduate traineeships had increased over recent years. It was too early to tell what impact this would have on the Apprenticeship programme within the organisation and to some extent the organisation’s growth tended to maintain a stable level of demand for Apprentices, but it was recognised that there was the potential to reduce the number of Apprentices and increase the number of graduate trainees.
13
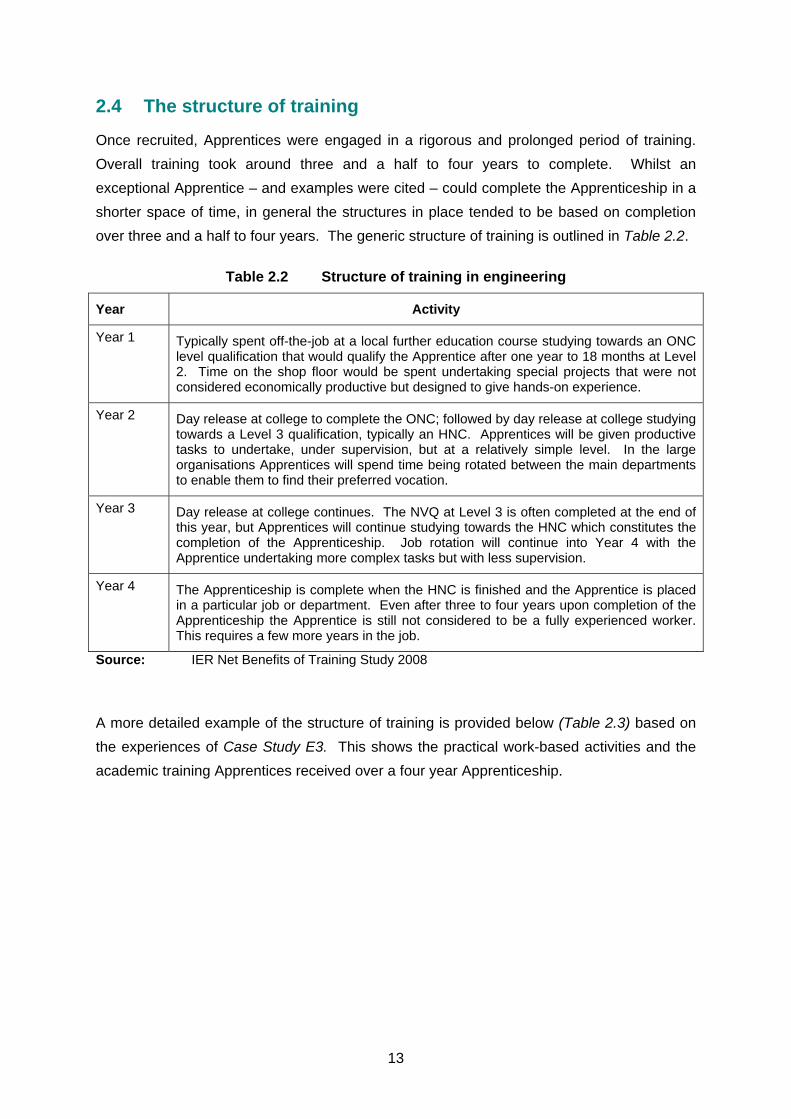
2.4 The structure of training
Once recruited, Apprentices were engaged in a rigorous and prolonged period of training. Overall training took around three and a half to four years to complete. Whilst an exceptional Apprentice – and examples were cited – could complete the Apprenticeship in a shorter space of time, in general the structures in place tended to be based on completion over three and a half to four years. The generic structure of training is outlined in Table 2.2.
Table 2.2 Structure of training in engineering
Year Activity
Year 1 Typically spent off-the-job at a local further education course studying towards an ONC level qualification that would qualify the Apprentice after one year to 18 months at Level 2. Time on the shop floor would be spent undertaking special projects that were not considered economically productive but designed to give hands-on experience.
Year 2 Day release at college to complete the ONC; followed by day release at college studying towards a Level 3 qualification, typically an HNC. Apprentices will be given productive tasks to undertake, under supervision, but at a relatively simple level. In the large organisations Apprentices will spend time being rotated between the main departments to enable them to find their preferred vocation.
Year 3 Day release at college continues. The NVQ at Level 3 is often completed at the end of this year, but Apprentices will continue studying towards the HNC which constitutes the completion of the Apprenticeship. Job rotation will continue into Year 4 with the Apprentice undertaking more complex tasks but with less supervision.
Year 4 The Apprenticeship is complete when the HNC is finished and the Apprentice is placed in a particular job or department. Even after three to four years upon completion of the Apprenticeship the Apprentice is still not considered to be a fully experienced worker. This requires a few more years in the job.
Source: IER Net Benefits of Training Study 2008
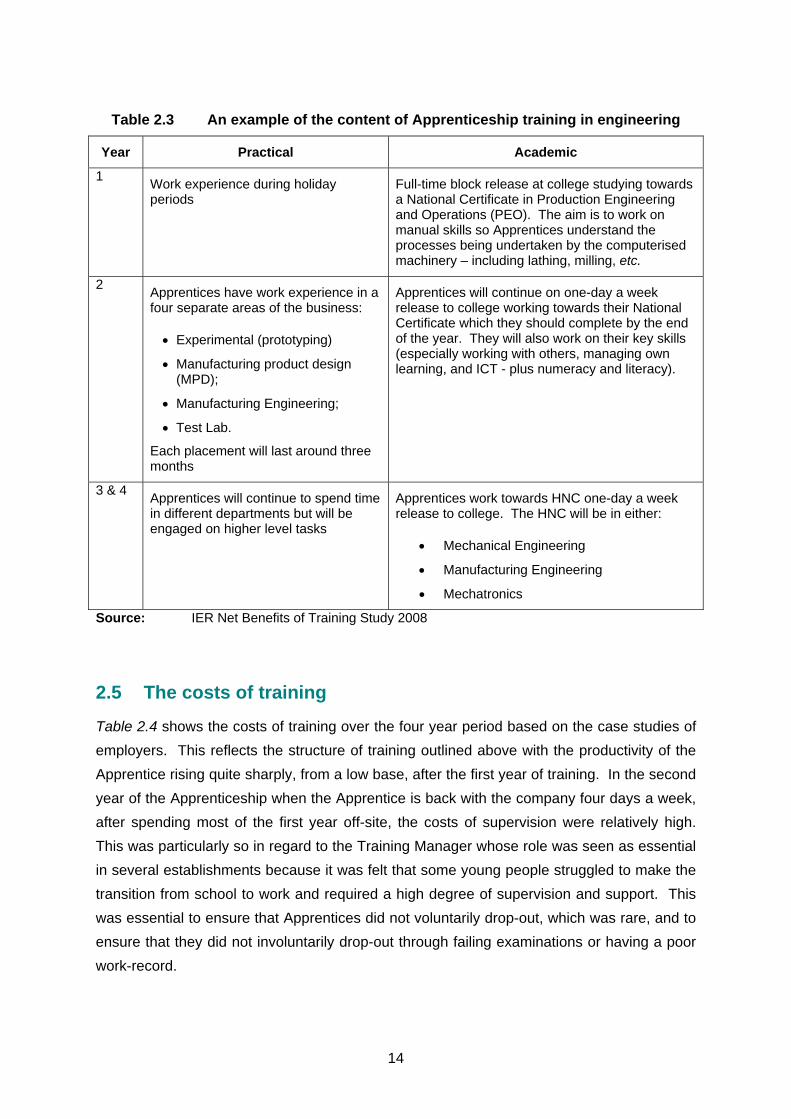
A more detailed example of the structure of training is provided below (Table 2.3) based on the experiences of Case Study E3. This shows the practical work-based activities and the academic training Apprentices received over a four year Apprenticeship.
14
Table 2.3 An example of the content of Apprenticeship training in engineering
Year Practical Academic
1 Work experience during holiday periods
Full-time block release at college studying towards a National Certificate in Production Engineering and Operations (PEO). The aim is to work on manual skills so Apprentices understand the processes being undertaken by the computerised machinery – including lathing, milling, etc.
2 Apprentices have work experience in a four separate areas of the business:
• Experimental (prototyping)
• Manufacturing product design (MPD);
• Manufacturing Engineering;
• Test Lab.
Each placement will last around three months
Apprentices will continue on one-day a week release to college working towards their National Certificate which they should complete by the end of the year. They will also work on their key skills (especially working with others, managing own learning, and ICT - plus numeracy and literacy).
3 & 4 Apprentices will continue to spend time in different departments but will be engaged on higher level tasks
Apprentices work towards HNC one-day a week release to college. The HNC will be in either:
• Mechanical Engineering
• Manufacturing Engineering
• Mechatronics
Source: IER Net Benefits of Training Study 2008
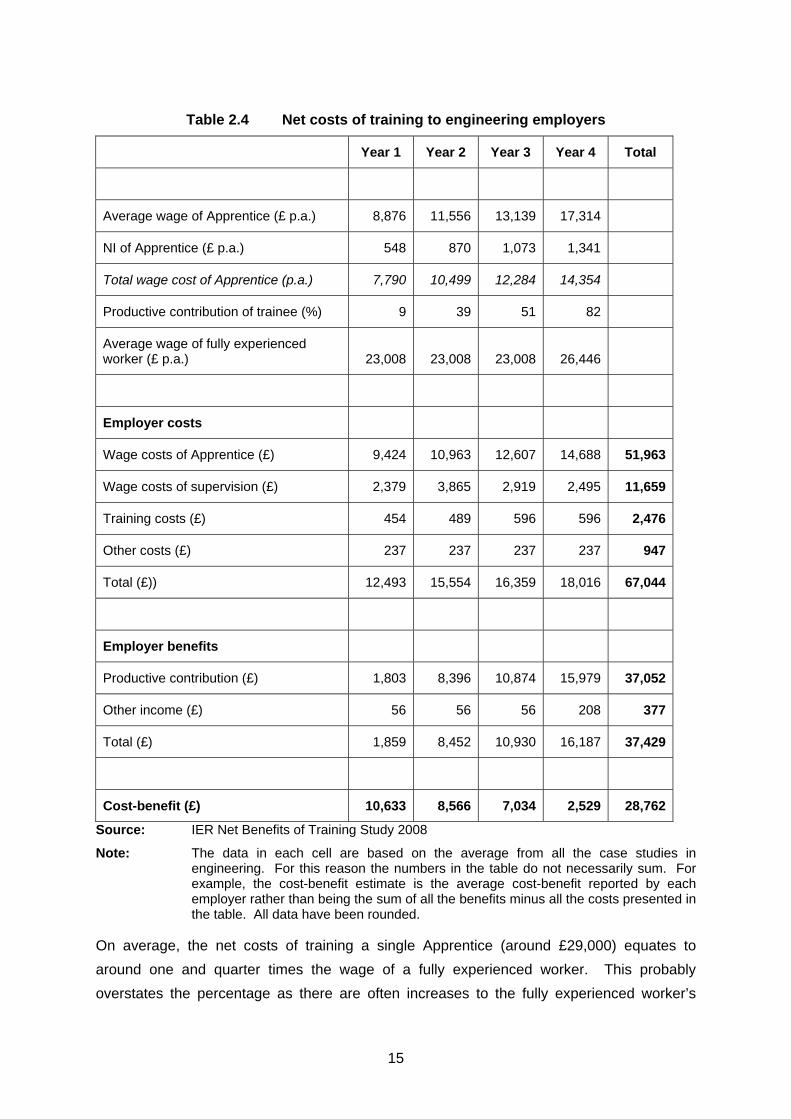
2.5 The costs of training
Table 2.4 shows the costs of training over the four year period based on the case studies of employers. This reflects the structure of training outlined above with the productivity of the Apprentice rising quite sharply, from a low base, after the first year of training. In the second year of the Apprenticeship when the Apprentice is back with the company four days a week, after spending most of the first year off-site, the costs of supervision were relatively high. This was particularly so in regard to the Training Manager whose role was seen as essential in several establishments because it was felt that some young people struggled to make the transition from school to work and required a high degree of supervision and support. This was essential to ensure that Apprentices did not voluntarily drop-out, which was rare, and to ensure that they did not involuntarily drop-out through failing examinations or having a poor work-record.
15
Table 2.4 Net costs of training to engineering employers
Year 1 Year 2 Year 3 Year 4 Total
Average wage of Apprentice (£ p.a.) 8,876 11,556 13,139 17,314
NI of Apprentice (£ p.a.) 548 870 1,073 1,341
Total wage cost of Apprentice (p.a.) 7,790 10,499 12,284 14,354
Productive contribution of trainee (%) 9 39 51 82
Average wage of fully experienced worker (£ p.a.) 23,008 23,008 23,008 26,446
Employer costs
Wage costs of Apprentice (£) 9,424 10,963 12,607 14,688 51,963
Wage costs of supervision (£) 2,379 3,865 2,919 2,495 11,659
Training costs (£) 454 489 596 596 2,476
Other costs (£) 237 237 237 237 947
Total (£)) 12,493 15,554 16,359 18,016 67,044
Employer benefits
Productive contribution (£) 1,803 8,396 10,874 15,979 37,052
Other income (£) 56 56 56 208 377
Total (£) 1,859 8,452 10,930 16,187 37,429
Cost-benefit (£) 10,633 8,566 7,034 2,529 28,762
Source: IER Net Benefits of Training Study 2008
Note: The data in each cell are based on the average from all the case studies in engineering. For this reason the numbers in the table do not necessarily sum. For example, the cost-benefit estimate is the average cost-benefit reported by each employer rather than being the sum of all the benefits minus all the costs presented in the table. All data have been rounded.
On average, the net costs of training a single Apprentice (around £29,000) equates to around one and quarter times the wage of a fully experienced worker. This probably overstates the percentage as there are often increases to the fully experienced worker’s

16
wage based on seniority, but nevertheless gives an indication of the scale of investment made by employers.
The evidence on drop-out suggests that for this group of employers it tends to occur relatively early-on during the Apprenticeship such that it is difficult to estimate the costs of this for the employer. In many establishments considerable effort was made to ensure that Apprentices successfully made the transition from school to work and were then subsequently able to meet the required standard of competence.
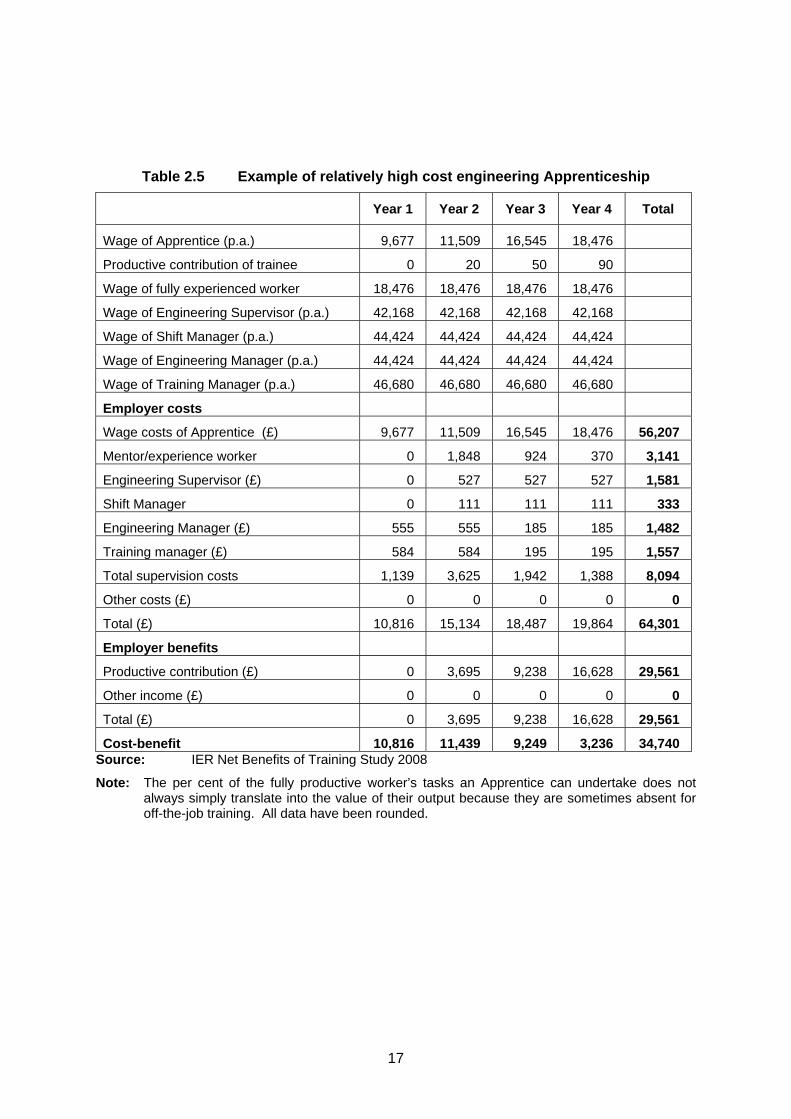
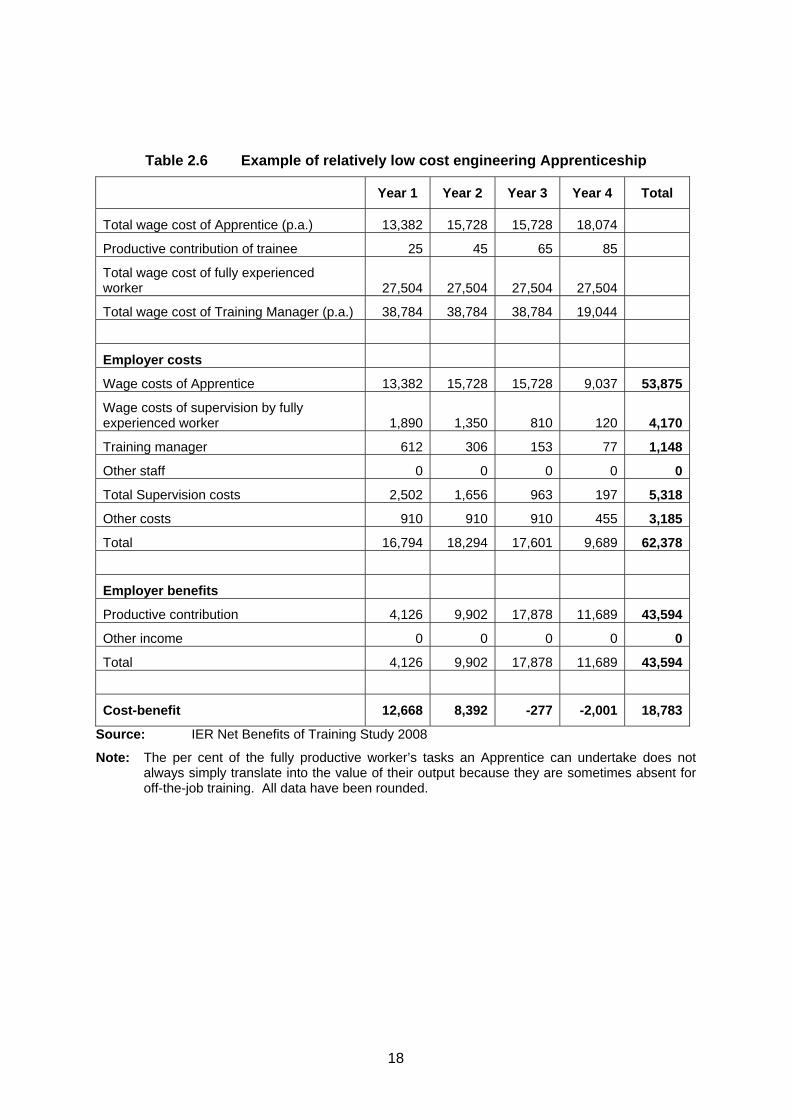
There is variation in the employer’s costs. Tables 2.5 and 2.6 show relatively high cost and low cost Apprenticeships. One factor influencing cost is the level of off-the-job training and the level of supervision that is provided to Apprentices. Employers often recognised that it was possible to reduce the costs of training – and there were often significant business pressures to do so – but the Apprenticeships had been designed over a long-period of time to ensure that they fitted the needs of business and the establishment. So, to some extent, the pressure to reduce costs could be resisted. A further factor reducing cost in the low cost example was the shorter duration of training (3.5 years versus four in the high cost example) and the fact that Apprentices can make a positive net contribution in the final years of their Apprenticeship.
2.6 Cost changes over time
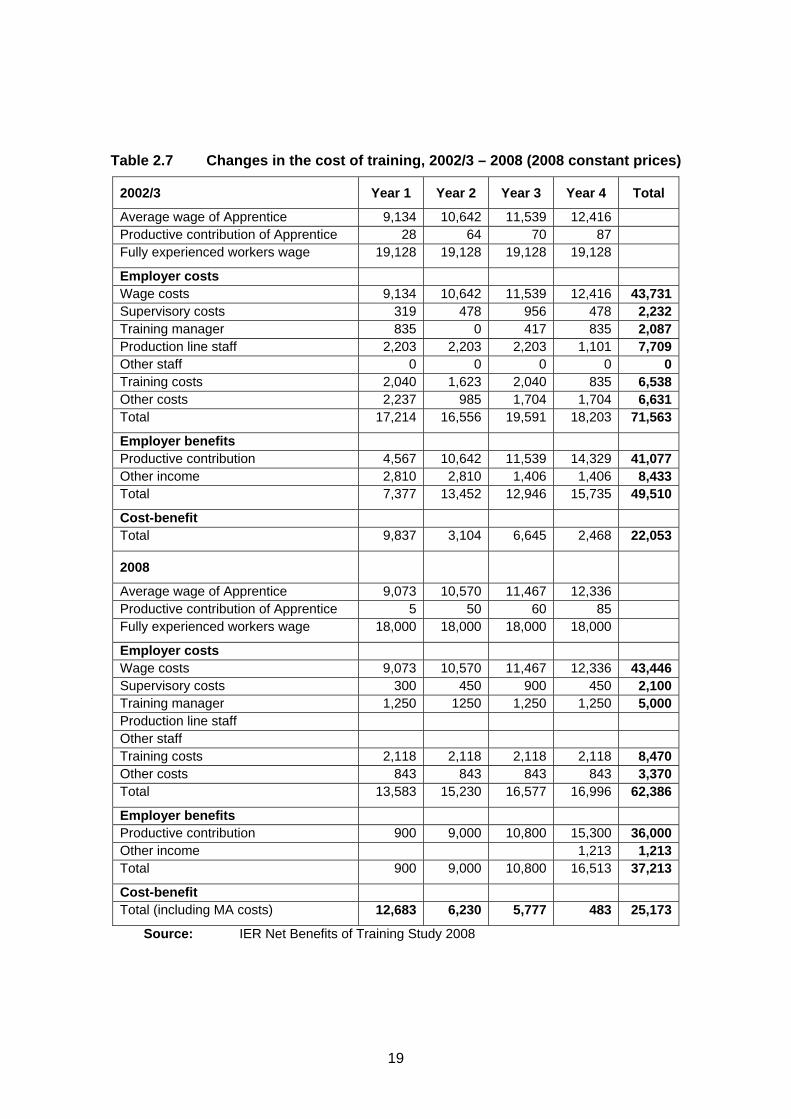
It is possible to look at changes in the real costs of training over time from a business that participated in both the 2002/3 study and the current one. All data have been converted to 2007/8 constant prices so that an appropriate comparison can be made (see Table 2.7). The employer’s National Insurance Contribution has been removed so that any changes in taxation do not affect the comparison. Overall, the data suggest that the costs of training have increased by around £3,000 per Apprentice, which represents around a 14 per cent increase. This is accounted for, in large part, by Apprentices now having a slightly lower productive capacity over the earlier part of the Apprenticeship.
17
Table 2.5 Example of relatively high cost engineering Apprenticeship
Year 1 Year 2 Year 3 Year 4 Total
Wage of Apprentice (p.a.) 9,677 11,509 16,545 18,476
Productive contribution of trainee 0 20 50 90
Wage of fully experienced worker 18,476 18,476 18,476 18,476
Wage of Engineering Supervisor (p.a.) 42,168 42,168 42,168 42,168
Wage of Shift Manager (p.a.) 44,424 44,424 44,424 44,424
Wage of Engineering Manager (p.a.) 44,424 44,424 44,424 44,424
Wage of Training Manager (p.a.) 46,680 46,680 46,680 46,680
Employer costs
Wage costs of Apprentice (£) 9,677 11,509 16,545 18,476 56,207
Mentor/experience worker 0 1,848 924 370 3,141
Engineering Supervisor (£) 0 527 527 527 1,581
Shift Manager 0 111 111 111 333
Engineering Manager (£) 555 555 185 185 1,482
Training manager (£) 584 584 195 195 1,557
Total supervision costs 1,139 3,625 1,942 1,388 8,094
Other costs (£) 0 0 0 0 0
Total (£) 10,816 15,134 18,487 19,864 64,301
Employer benefits
Productive contribution (£) 0 3,695 9,238 16,628 29,561
Other income (£) 0 0 0 0 0
Total (£) 0 3,695 9,238 16,628 29,561
Cost-benefit 10,816 11,439 9,249 3,236 34,740 Source: IER Net Benefits of Training Study 2008
Note: The per cent of the fully productive worker’s tasks an Apprentice can undertake does not always simply translate into the value of their output because they are sometimes absent for off-the-job training. All data have been rounded.
18
Table 2.6 Example of relatively low cost engineering Apprenticeship
Year 1 Year 2 Year 3 Year 4 Total
Total wage cost of Apprentice (p.a.) 13,382 15,728 15,728 18,074
Productive contribution of trainee 25 45 65 85
Total wage cost of fully experienced worker 27,504 27,504 27,504 27,504
Total wage cost of Training Manager (p.a.) 38,784 38,784 38,784 19,044
Employer costs
Wage costs of Apprentice 13,382 15,728 15,728 9,037 53,875
Wage costs of supervision by fully experienced worker 1,890 1,350 810 120 4,170
Training manager 612 306 153 77 1,148
Other staff 0 0 0 0 0
Total Supervision costs 2,502 1,656 963 197 5,318
Other costs 910 910 910 455 3,185
Total 16,794 18,294 17,601 9,689 62,378
Employer benefits
Productive contribution 4,126 9,902 17,878 11,689 43,594
Other income 0 0 0 0 0
Total 4,126 9,902 17,878 11,689 43,594
Cost-benefit 12,668 8,392 -277 -2,001 18,783
Source: IER Net Benefits of Training Study 2008
Note: The per cent of the fully productive worker’s tasks an Apprentice can undertake does not always simply translate into the value of their output because they are sometimes absent for off-the-job training. All data have been rounded.
19
Table 2.7 Changes in the cost of training, 2002/3 – 2008 (2008 constant prices)
2002/3 Year 1 Year 2 Year 3 Year 4 Total
Average wage of Apprentice 9,134 10,642 11,539 12,416 Productive contribution of Apprentice 28 64 70 87 Fully experienced workers wage 19,128 19,128 19,128 19,128
Employer costs Wage costs 9,134 10,642 11,539 12,416 43,731Supervisory costs 319 478 956 478 2,232Training manager 835 0 417 835 2,087Production line staff 2,203 2,203 2,203 1,101 7,709Other staff 0 0 0 0 0Training costs 2,040 1,623 2,040 835 6,538Other costs 2,237 985 1,704 1,704 6,631Total 17,214 16,556 19,591 18,203 71,563
Employer benefits Productive contribution 4,567 10,642 11,539 14,329 41,077Other income 2,810 2,810 1,406 1,406 8,433Total 7,377 13,452 12,946 15,735 49,510
Cost-benefit Total 9,837 3,104 6,645 2,468 22,053
2008
Average wage of Apprentice 9,073 10,570 11,467 12,336 Productive contribution of Apprentice 5 50 60 85 Fully experienced workers wage 18,000 18,000 18,000 18,000
Employer costs Wage costs 9,073 10,570 11,467 12,336 43,446Supervisory costs 300 450 900 450 2,100Training manager 1,250 1250 1,250 1,250 5,000Production line staff Other staff Training costs 2,118 2,118 2,118 2,118 8,470Other costs 843 843 843 843 3,370Total 13,583 15,230 16,577 16,996 62,386
Employer benefits Productive contribution 900 9,000 10,800 15,300 36,000Other income 1,213 1,213Total 900 9,000 10,800 16,513 37,213
Cost-benefit Total (including MA costs) 12,683 6,230 5,777 483 25,173
Source: IER Net Benefits of Training Study 2008
20
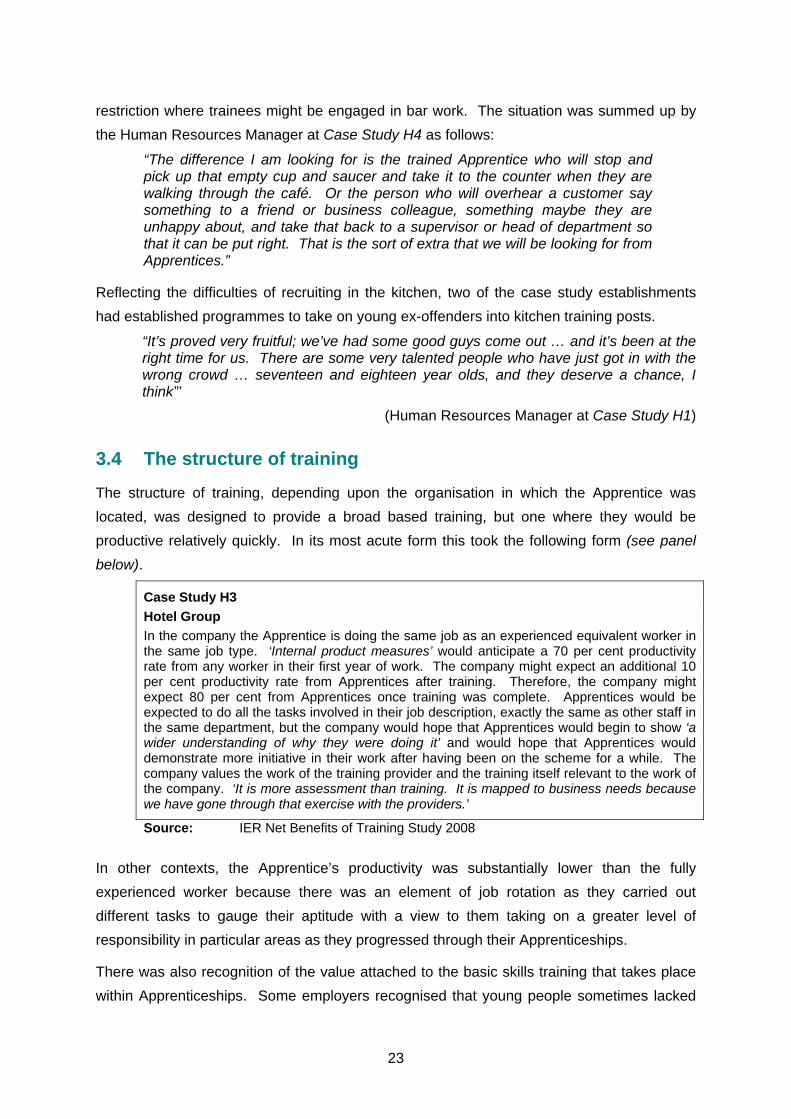
2.7 Conclusions
The evidence reveals that training an Apprentice in engineering was relatively expensive compared to other sectors. Such costs must be set against the potential benefits of training. These are considered in greater detail in Chapter 8 below but the evidence from the engineering case studies indicates that the employer’s investment is, on average, paid back within three years. More importantly, the evidence points to significant benefits to the establishments from investing in Apprenticeships through lower labour turnover, a better fit between the skills possessed by employees and the skills required by the company, and some control skill-shortages potentially pushing up wage rates. There was also evidence of Apprentices bring innovation into workplaces.
Given the level of investment engineering establishments made in recruiting and training Apprentices, employers also placed emphasis upon providing the Apprentices with opportunities to stay with the organisation and progress their careers. Labour retention tends to be writ large into establishment human resource practices, even if the employee does not wish to progress beyond a skilled craft level. Employers also tended to emphasise that there was an open door for progression to higher level qualifications if the individual was sufficiently capable and motivated. This provided a means by which Apprentices could move into more senior positions within the organisation.

21
3. THE HOSPITALITY SECTOR
3.1 Introduction
The information provided in this chapter outlines the costs and benefits of Apprenticeship training in the hospitality sector. It was not always clear to what extent “Apprenticeship” as a brand was recognised in the industry with employers referring to their young recruits who were training towards an NVQ Level 2 qualification as “trainees” as much as they called them “Apprentices”. In many respects the term “Apprentice” is a new one for the sector, or at least in the sample of companies that participated as case studies.1
The focus of attention in the chapter is upon gaining a Level 2 qualification in a hotel or kitchen environment. Sometimes the framework studied appeared to be narrowly focused on one particular occupation, such as working in the kitchen where there was a clearly defined occupational structure, but at other times hotels were training people more generally to fill, eventually, a number of roles in the hotel. The Apprenticeship in these cases sometimes allowed the hotels to gauge the strengths of the Apprentice and identify where they might be suitably deployed.
The overall evidence from the employer’s perspective is that Apprenticeships provided a “win-win” situation. For a relatively small investment, employers are able to equip themselves not only with employees having the skills they required, but also obtain a source of new ideas and the means to address some of the long-standing human resource challenges the industry has to face (such as high labour turnover).
3.2 The case studies
The employers selected for inclusion in the study were all hospitality establishments providing Level 2 qualifications in housekeeping, kitchen, and reception. Several were part of large chains of hotels and restaurants that required a standard quality of service to be maintained across their organisations. Training was seen as central to achieving this goal. The cases are summarised in Table 3.1.
1 Employers were able to differentiate between structured initial training delivered to young
people aged 16-18 who had recently left college, and the general entitlement to a first Level 2 qualification for which all their staff were eligible, via Train to Gain.
22
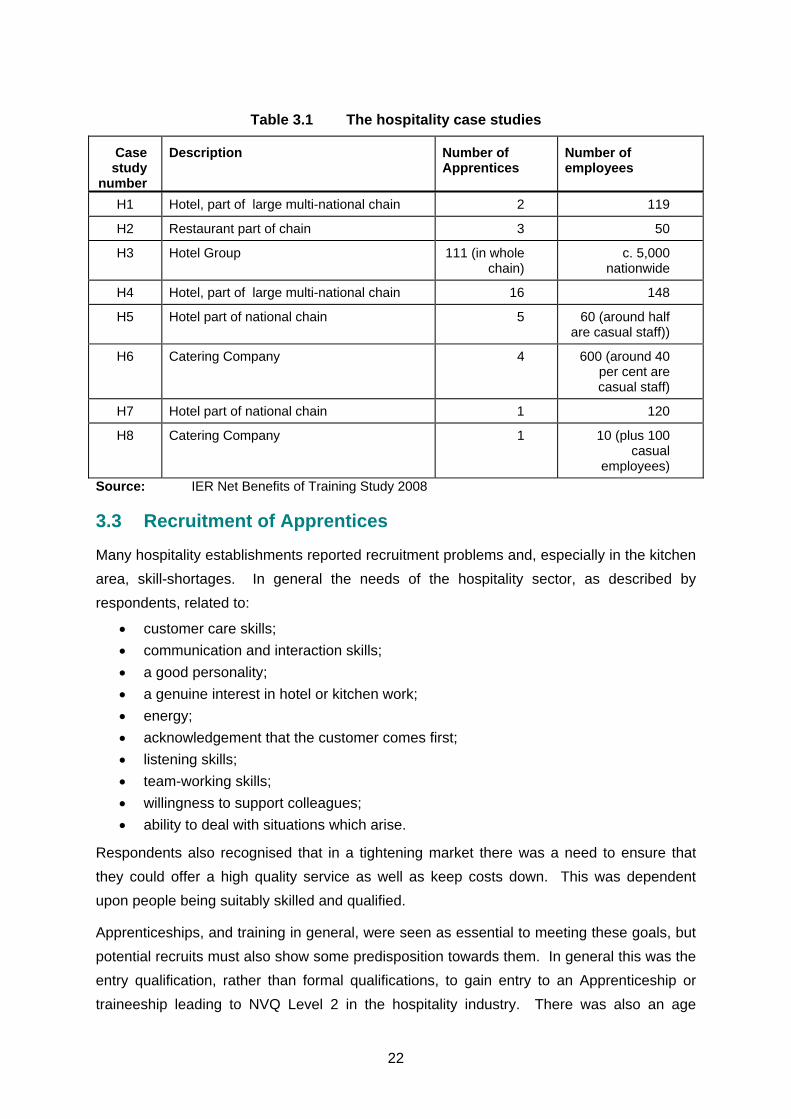
Table 3.1 The hospitality case studies
Case study
number
Description Number of Apprentices
Number of employees
H1 Hotel, part of large multi-national chain 2 119
H2 Restaurant part of chain 3 50
H3 Hotel Group 111 (in whole chain)
c. 5,000 nationwide
H4 Hotel, part of large multi-national chain 16 148
H5 Hotel part of national chain 5 60 (around half are casual staff))
H6 Catering Company 4 600 (around 40 per cent are casual staff)
H7 Hotel part of national chain 1 120
H8 Catering Company 1 10 (plus 100 casual
employees) Source: IER Net Benefits of Training Study 2008
3.3 Recruitment of Apprentices
Many hospitality establishments reported recruitment problems and, especially in the kitchen area, skill-shortages. In general the needs of the hospitality sector, as described by respondents, related to:
• customer care skills; • communication and interaction skills; • a good personality; • a genuine interest in hotel or kitchen work; • energy; • acknowledgement that the customer comes first; • listening skills; • team-working skills; • willingness to support colleagues; • ability to deal with situations which arise.
Respondents also recognised that in a tightening market there was a need to ensure that they could offer a high quality service as well as keep costs down. This was dependent upon people being suitably skilled and qualified.
Apprenticeships, and training in general, were seen as essential to meeting these goals, but potential recruits must also show some predisposition towards them. In general this was the entry qualification, rather than formal qualifications, to gain entry to an Apprenticeship or traineeship leading to NVQ Level 2 in the hospitality industry. There was also an age
23
restriction where trainees might be engaged in bar work. The situation was summed up by the Human Resources Manager at Case Study H4 as follows:
“The difference I am looking for is the trained Apprentice who will stop and pick up that empty cup and saucer and take it to the counter when they are walking through the café. Or the person who will overhear a customer say something to a friend or business colleague, something maybe they are unhappy about, and take that back to a supervisor or head of department so that it can be put right. That is the sort of extra that we will be looking for from Apprentices.”
Reflecting the difficulties of recruiting in the kitchen, two of the case study establishments had established programmes to take on young ex-offenders into kitchen training posts.
“It’s proved very fruitful; we’ve had some good guys come out … and it’s been at the right time for us. There are some very talented people who have just got in with the wrong crowd … seventeen and eighteen year olds, and they deserve a chance, I think”’
(Human Resources Manager at Case Study H1)
3.4 The structure of training
The structure of training, depending upon the organisation in which the Apprentice was located, was designed to provide a broad based training, but one where they would be productive relatively quickly. In its most acute form this took the following form (see panel below).
Case Study H3 Hotel Group In the company the Apprentice is doing the same job as an experienced equivalent worker in the same job type. ‘Internal product measures’ would anticipate a 70 per cent productivity rate from any worker in their first year of work. The company might expect an additional 10 per cent productivity rate from Apprentices after training. Therefore, the company might expect 80 per cent from Apprentices once training was complete. Apprentices would be expected to do all the tasks involved in their job description, exactly the same as other staff in the same department, but the company would hope that Apprentices would begin to show ‘a wider understanding of why they were doing it’ and would hope that Apprentices would demonstrate more initiative in their work after having been on the scheme for a while. The company values the work of the training provider and the training itself relevant to the work of the company. ‘It is more assessment than training. It is mapped to business needs because we have gone through that exercise with the providers.’
Source: IER Net Benefits of Training Study 2008 In other contexts, the Apprentice’s productivity was substantially lower than the fully experienced worker because there was an element of job rotation as they carried out different tasks to gauge their aptitude with a view to them taking on a greater level of responsibility in particular areas as they progressed through their Apprenticeships.
There was also recognition of the value attached to the basic skills training that takes place within Apprenticeships. Some employers recognised that young people sometimes lacked
24
numeracy and literacy skills upon entry to the Apprenticeship and these were necessary skills to acquire in order to succeed in the industry.
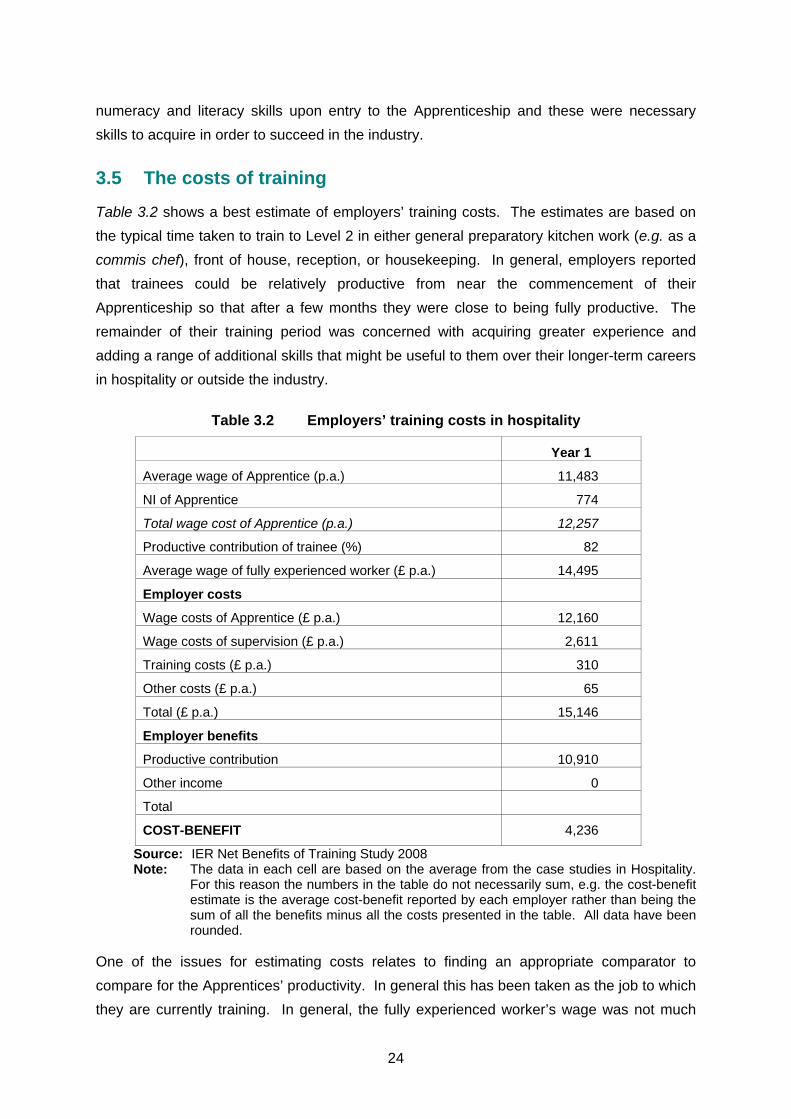
3.5 The costs of training
Table 3.2 shows a best estimate of employers’ training costs. The estimates are based on the typical time taken to train to Level 2 in either general preparatory kitchen work (e.g. as a commis chef), front of house, reception, or housekeeping. In general, employers reported that trainees could be relatively productive from near the commencement of their Apprenticeship so that after a few months they were close to being fully productive. The remainder of their training period was concerned with acquiring greater experience and adding a range of additional skills that might be useful to them over their longer-term careers in hospitality or outside the industry.
Table 3.2 Employers’ training costs in hospitality
Year 1
Average wage of Apprentice (p.a.) 11,483
NI of Apprentice 774
Total wage cost of Apprentice (p.a.) 12,257
Productive contribution of trainee (%) 82
Average wage of fully experienced worker (£ p.a.) 14,495
Employer costs
Wage costs of Apprentice (£ p.a.) 12,160
Wage costs of supervision (£ p.a.) 2,611
Training costs (£ p.a.) 310
Other costs (£ p.a.) 65
Total (£ p.a.) 15,146
Employer benefits
Productive contribution 10,910
Other income 0
Total
COST-BENEFIT 4,236
Source: IER Net Benefits of Training Study 2008 Note: The data in each cell are based on the average from the case studies in Hospitality.
For this reason the numbers in the table do not necessarily sum, e.g. the cost-benefit estimate is the average cost-benefit reported by each employer rather than being the sum of all the benefits minus all the costs presented in the table. All data have been rounded.
One of the issues for estimating costs relates to finding an appropriate comparator to compare for the Apprentices’ productivity. In general this has been taken as the job to which they are currently training. In general, the fully experienced worker’s wage was not much
25
greater than that of the Apprentice trainee but in fact, the expectation, but not guarantee, was that Apprentice trainee might progress beyond that level to at least a supervisory level. Respondents were also unclear about the amount of time spent supervising trainees who acquired skills for the job via on-the-job training.
Thinking about the costs, relative to the costs of not training, the respondent at Case Study H2 commented:
“The benefits outweigh the costs, because there are no significant costs to the organisation”
Respondents were not able to give reliable estimates of drop-out from training. At Case Study H3, 31 out of the 111 Apprentices had left. In this case study the average cost of training someone over the first year was £7,925 (the most costly of all the hospitality case studies but also the one providing the most highly structured training). If drop-out is factored into the calculation then the marginal costs of training increase to £10,189.
3.6 Conclusion
The evidence suggests that the costs of investing in Apprenticeship training were modest in comparison to some other sectors and likely to be quickly recouped by employers. The main problems for employers related to recruitment and retention. In certain parts of the hospitality industry, such as work in kitchens, employers reported that it was difficult to recruit people with the attitudes and attributes required for a successful career in hospitality. Retention was also a problem. Employers seemed willing to accept that if they kept an Apprentice for a couple of years after they had completed their training then the business would have benefited in a number of ways and if the former Apprentice left the business for another hospitality company, then at least there would have been a contribution to the pool of trained employees in the industry. Many companies had introduced schemes to help retain employees, not just Apprentices, by providing concessionary accommodation, free meals on duty, training opportunities, etc. It was notable, however, that in one establishment it had lost nearly a third of its Apprentices even before they had completed the Apprenticeship.

26
27
4. THE RETAIL SECTOR
4.1 Introduction
UK retail sales were £265 billion in 2007, and accounted for almost 8 per cent of UK Gross Domestic Product. More than a third of consumer spending goes through retail shops and while retail sales over the internet have grown strongly in recent years, such sales still account for less than 4 per cent of total retail activity. There are around 321,000 retail outlets in the UK employing over 3.0 million people (March 2008). This amounted to 11 per cent of the total UK workforce. Over the last five years, employment in retailing has grown by only a modest amount (85,087).
The UK retail market has experienced weak demand growth over the past decade but faced fierce price competition and a squeeze on margins as the result of increased operating costs. The sector is also exposed to change, in terms of a demand from consumers for longer opening hours and increased competition from on-line retailing. The prospects for the sector are even more challenging as the so-called ‘credit crunch’ is likely to impact upon the retail sector in a significant way (in the short- to medium-term). The high cost of credit can be expected to slow down consumer expenditure as households limit non-essential expenditure, particularly on deferrable ‘big ticket’ purchases. The effects of any downturn in consumer spending are likely to vary across the sector with some retailers benefiting while others may face closure.
The prospects for the retailing sector are likely to impact upon training and Apprenticeships by retailing employers. A large portion of workforce in the industry consists of women working in part-time jobs (over half the work force). Around 25 per cent of employment in the industry is in micro-enterprises and just under 75 per cent of employment is in establishments with less than 200 employees. Training in the sector in the past has typically been informal, ‘on the job’ and not accredited. Apprenticeships have changed that, providing a formal structure for training leading to a qualification. Nonetheless, training is always vulnerable to changes in business fortunes, especially in small and micro-businesses. At the time of the case study interviews, it was probably too early for the ‘credit crunch’ to have impacted on respondents thinking or their plans for training in the future, but their assessment of the costs and benefits may well change quite rapidly should a major downturn in retail sales materialise.
4.2 The case studies
The employers covered by the case studies were a mix of small retailers and retail establishments that were part of larger (often national) organisations. They all provided Apprenticeship training at NVQ Level 2 although in some instances the employer was not
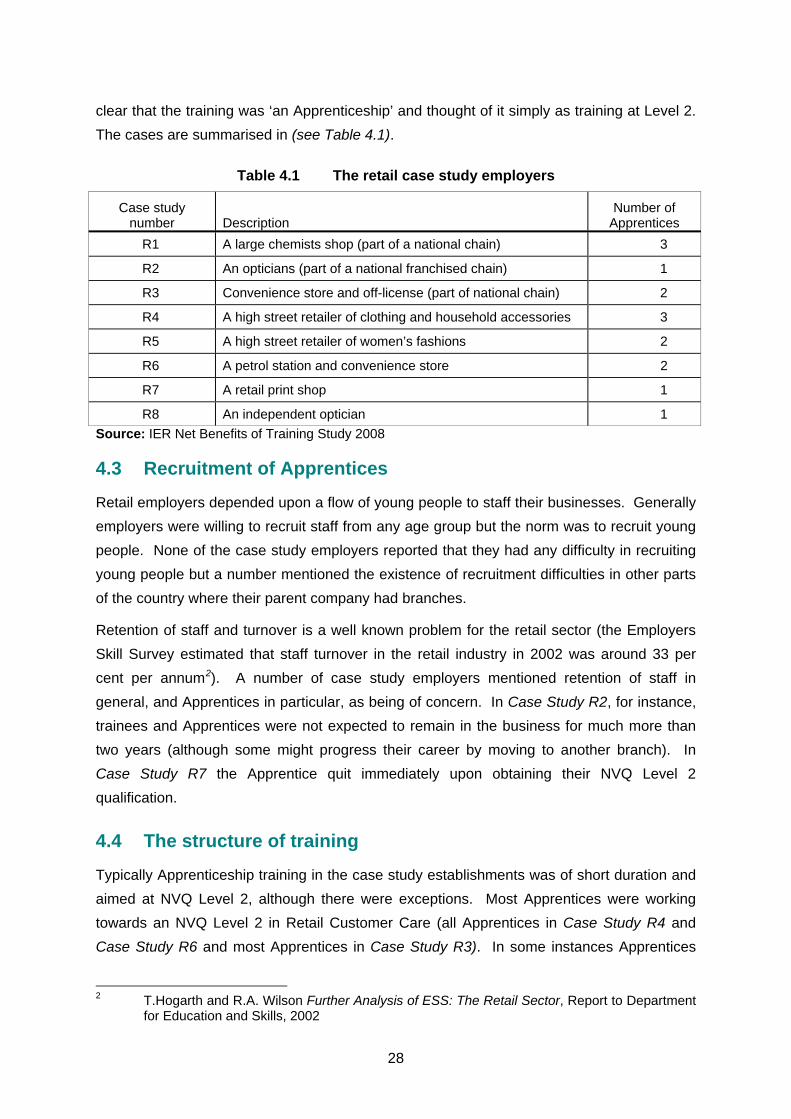
28
clear that the training was ‘an Apprenticeship’ and thought of it simply as training at Level 2. The cases are summarised in (see Table 4.1).
Table 4.1 The retail case study employers
Case study number
Description
Number of Apprentices
R1 A large chemists shop (part of a national chain) 3
R2 An opticians (part of a national franchised chain) 1
R3 Convenience store and off-license (part of national chain) 2
R4 A high street retailer of clothing and household accessories 3
R5 A high street retailer of women’s fashions 2
R6 A petrol station and convenience store 2
R7 A retail print shop 1
R8 An independent optician 1 Source: IER Net Benefits of Training Study 2008
4.3 Recruitment of Apprentices
Retail employers depended upon a flow of young people to staff their businesses. Generally employers were willing to recruit staff from any age group but the norm was to recruit young people. None of the case study employers reported that they had any difficulty in recruiting young people but a number mentioned the existence of recruitment difficulties in other parts of the country where their parent company had branches.
Retention of staff and turnover is a well known problem for the retail sector (the Employers Skill Survey estimated that staff turnover in the retail industry in 2002 was around 33 per cent per annum2). A number of case study employers mentioned retention of staff in general, and Apprentices in particular, as being of concern. In Case Study R2, for instance, trainees and Apprentices were not expected to remain in the business for much more than two years (although some might progress their career by moving to another branch). In Case Study R7 the Apprentice quit immediately upon obtaining their NVQ Level 2 qualification.
4.4 The structure of training
Typically Apprenticeship training in the case study establishments was of short duration and aimed at NVQ Level 2, although there were exceptions. Most Apprentices were working towards an NVQ Level 2 in Retail Customer Care (all Apprentices in Case Study R4 and Case Study R6 and most Apprentices in Case Study R3). In some instances Apprentices
2 T.Hogarth and R.A. Wilson Further Analysis of ESS: The Retail Sector, Report to Department
for Education and Skills, 2002
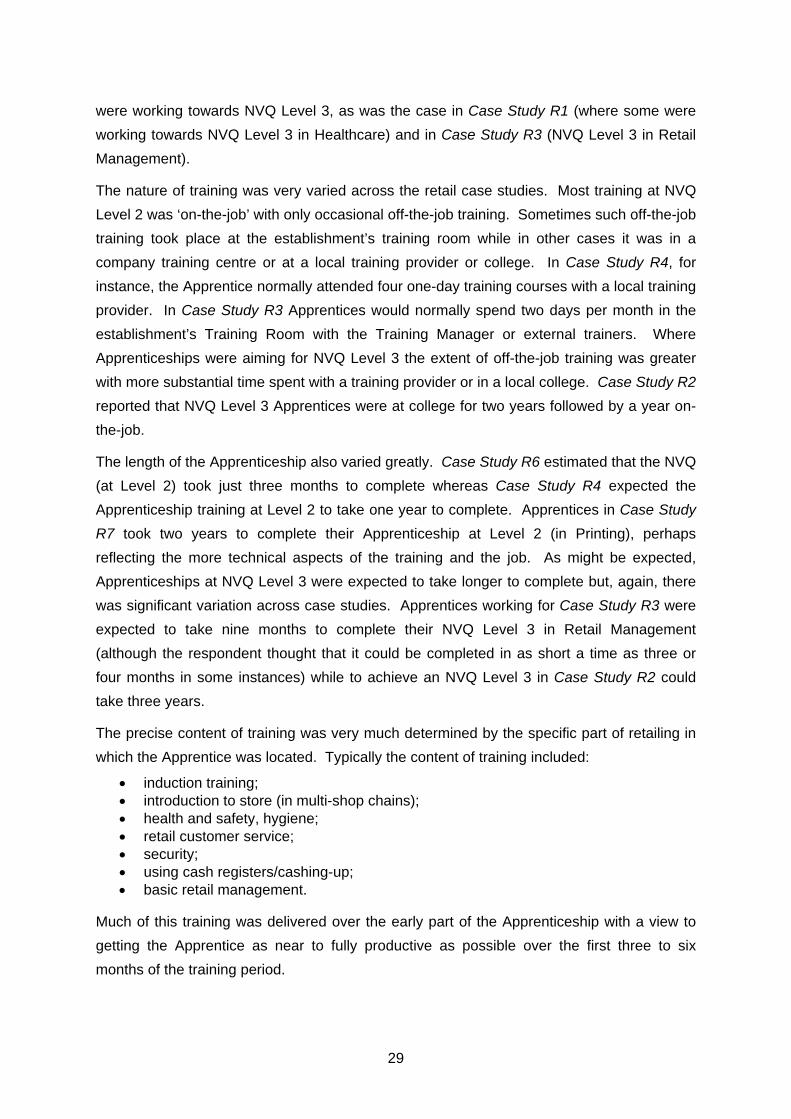
29
were working towards NVQ Level 3, as was the case in Case Study R1 (where some were working towards NVQ Level 3 in Healthcare) and in Case Study R3 (NVQ Level 3 in Retail Management).
The nature of training was very varied across the retail case studies. Most training at NVQ Level 2 was ‘on-the-job’ with only occasional off-the-job training. Sometimes such off-the-job training took place at the establishment’s training room while in other cases it was in a company training centre or at a local training provider or college. In Case Study R4, for instance, the Apprentice normally attended four one-day training courses with a local training provider. In Case Study R3 Apprentices would normally spend two days per month in the establishment’s Training Room with the Training Manager or external trainers. Where Apprenticeships were aiming for NVQ Level 3 the extent of off-the-job training was greater with more substantial time spent with a training provider or in a local college. Case Study R2 reported that NVQ Level 3 Apprentices were at college for two years followed by a year on-the-job.
The length of the Apprenticeship also varied greatly. Case Study R6 estimated that the NVQ (at Level 2) took just three months to complete whereas Case Study R4 expected the Apprenticeship training at Level 2 to take one year to complete. Apprentices in Case Study R7 took two years to complete their Apprenticeship at Level 2 (in Printing), perhaps reflecting the more technical aspects of the training and the job. As might be expected, Apprenticeships at NVQ Level 3 were expected to take longer to complete but, again, there was significant variation across case studies. Apprentices working for Case Study R3 were expected to take nine months to complete their NVQ Level 3 in Retail Management (although the respondent thought that it could be completed in as short a time as three or four months in some instances) while to achieve an NVQ Level 3 in Case Study R2 could take three years.
The precise content of training was very much determined by the specific part of retailing in which the Apprentice was located. Typically the content of training included:
• induction training; • introduction to store (in multi-shop chains); • health and safety, hygiene; • retail customer service; • security; • using cash registers/cashing-up; • basic retail management.
Much of this training was delivered over the early part of the Apprenticeship with a view to getting the Apprentice as near to fully productive as possible over the first three to six months of the training period.

30
4.5 Apprentice pay and productivity
Apprentices in retailing were regarded by employers as being, potentially, just as productive as other shop floor staff. Most case study employers rated the productive potential of Apprentices as, 100 per cent or close to that figure. Moreover, since retail Apprenticeships were largely spent on-the-job the actual productive contribution of Apprentices was also close to 100 per cent and was only less than 100 per cent where any significant time was spent off the shop floor in some form of off-the-job training activity. Consequently, Apprentices tended to be paid at a wage that was not markedly less than experienced employees (although neither was paid a high wage). Wages for Apprentices in the case study businesses were in the range of £9,000-£11,000, although some Apprentices worked part-time hours and were paid accordingly.
4.6 The costs of training
Table 4.2 shows the average cost of Apprenticeship training in the case study establishments. The figures are included for the purpose of comparison with those of other sectors. It is, however, important to note that the considerable variation in the length, level and delivery of Apprenticeships across the case study employers means that these costs are not true reflections of the cost in any of the individual case study businesses. Nonetheless, some general tendencies are clear.
Table 4.2 Net costs of training to retail employers
Year 1
Average wage of Apprentice (£ p.a.) 10,244* Average NI of Apprentice (£ p.a.) 715 Average productive contribution of trainee (%) 89 Average wage of fully experienced worker (£ p.a.) 15,842
Employer costs Wage costs of Apprentice (£ p.a.) 8,177 Wage costs of supervision (£ p.a.) 1,818 Training costs (£ p.a.) 40 Other costs (£ p.a.) 260 Total (£ p.a.) 10,751
Employer benefits Productive contribution (£ p.a.) 8,446 Other income (£ p.a.) 0 Total (£ p.a.) 8,446
COST – BENEFIT (£ p.a.) 2,305 * In two cases where Apprentices worked part-time their wage was adjusted to a full-time
equivalent for comparison. Source: IER Net Benefits of Training Study 2008
31
First, all the costs of Apprentices in retailing occur within the first year of the Apprenticeship and in some instances much less than one year. The level of supervision of Apprentices also appears ‘light’ in comparison with other sectors, reducing the costs of supervision. In addition, while costs were comparatively low, the productive contribution of the Apprentice was relatively high (in comparison with an experienced employee) as they spent little time training off-the-job and many of their activities were normal shop floor activities under the supervision of an experienced colleague or supervisor. The net result was that the overall cost of training an Apprentice in retailing was comparatively low. On average, the total cost of training a retail Apprentice was estimated to be just £2,305 for the case study employers.
Given the diversity of patterns of training and the implied costs for employers it is illuminating to consider the extreme ends of the net cost range. Table 4.3 presents the evidence from a low cost and a high cost case study respectively (although both can be considered as low cost employers in comparison with the cost of Apprenticeships in other sectors). At the upper end of the net cost range is Case Study R1 where the net cost of an Apprentice was estimated at £4917 while the cost of training an Apprentice in Case Study R3 was estimated at just £275.
Table 4.3 Variations in the cost of retail Apprenticeships
High cost
(Case Study R1) Low cost
(Case Study R3) Number of Apprentices 3 2 Average wage of trainee 10,046 4,593 Productive contribution of trainee 100 100 Experienced Worker 12,168 Line Manager 18,000 13,182 Training Manager 35,000
Employer costs Wage costs 10,046 3,444 National insurance contributions 690 0 Line manager 0 1,011 Supervisory costs 450 0 Training manager 1,458 0 Other staff 0 0 Training costs 0 200 Other costs 0 0 Total 12,645 4,655
Employer benefits Productive contribution 7,728 4,380 Other income 0 0 Total 7,728 4,380 Cost-benefit 4,917 275 Cost benefit (adjusted for drop out) 4,917 550
Source: IER Net Benefits of Training Study 2008 The low wage in Case Study R3 is because Apprentices worked part-time.
32
Two main factors explain the difference in costs. First, although both employers paid Apprentices at a similar rate of pay, Apprentices in Case Study R1 worked full-time hours while Apprentices in Case Study R3 only worked for 16 hours per week. Part-time hours reduced the total wage and National Insurance costs of the Apprentice in Case Study R3. Second, Apprentices in Case Study R3 were exclusively supervised by their line manager at a lower cost than in Case Study R1 where supervision of the Apprentice involves more of the (more expensive) time of the Training Manager. The greater amount of time spent training with the Training Manager in Case Study R1 also reduced the time available for a productive contribution by the Apprentice on the shop-floor. Thus, the employer did not fully benefit from the 100 per cent productive capability of the Apprentice. In Case Study R3, the business reaped the benefit of the whole of the Apprentice’s productive contribution (albeit on a part-time basis) with the consequence that, in conjunction with the lower supervisory costs, training an Apprentice in Case Study R3 was very low, almost costless.
It should, however, be noted that all Apprentices in Case Study R1 completed their Apprenticeship whereas half of all Apprentices in Case Study R3 ‘dropped out’ of their Apprenticeship. This had the effect of doubling the real cost of an Apprentice to £550 for Case Study R3, although this remains a comparatively low figure even within the retail case studies.
4.7 Conclusions
Retailing is very much a non-traditional area of Apprenticeship training. Apprenticeships in the sector tend to be of short duration and mostly undertaken on-the-job. A consequence of this is that the net cost of training an Apprentice was low compared to more traditional Apprenticeships. There was a wide range of cost associated with Apprenticeship in retailing. At the lower end such training was very low cost. Given the widely reported benefits of Apprenticeship (see Chapter 8) Apprenticeship clearly represents a low risk investment for most retail employers.

33
5. BUSINESS ADMINISTRATION
5.1 Introduction
Business administration provides training in a range of activities associated with the functioning of an office. Traditionally such tasks have involved filing and record-keeping, book-keeping, organisation and conduct of meetings, minute taking and reporting and so forth. Those traditional functions, while still important, are increasing being supplemented by functions relating to new information and communications technology. This involves the use of standard office tools (such as word processing, spreadsheets and e-mail), as well as bespoke office systems. These developments mean that business administration Apprentices require a new skill set that is focussed on working with business systems rather than simply acquiring traditional administrative skills.
Unlike most of the other Apprenticeship frameworks examined in this report, business administration Apprenticeships are spread across a range of industries rather than being sector specific. Having said that, business administration Apprenticeships are amongst the most common of form of Apprenticeships in the public sector, especially in local government where large numbers of such Apprenticeships are offered. Assessing the net benefit of Apprenticeships is more difficult in a public sector body than a private sector organisation. The public sector body is driven by a broader community service objective and less by calculations of profit. Often the motivation of public sector bodies for providing Apprenticeships is founded on a sense of responsibility for training young people in the local community rather than a calculation of the economic benefits to the organisation. Nonetheless, public sector bodies are not immune to financial pressures and public sector managers generally have to make a business case for any Apprentices they recruit. Indeed, the evidence from the case studies was that public sector managers had very similar concerns about skill needs, skill supply and workforce succession to their private sector colleagues, not only in comparison to other employers of business administration Apprentices but in comparison to employers of Apprentices in other sectors.
5.2 The case studies
The assessment of the net benefit of business Administration Apprenticeships was based on six case studies. Three of the case studies were local authorities while a further case study was a community housing and regeneration organisation with close links to a local authority. The remaining two were private sector businesses. The local authorities were drawn from across England including one in London. The case studies are summarised below.
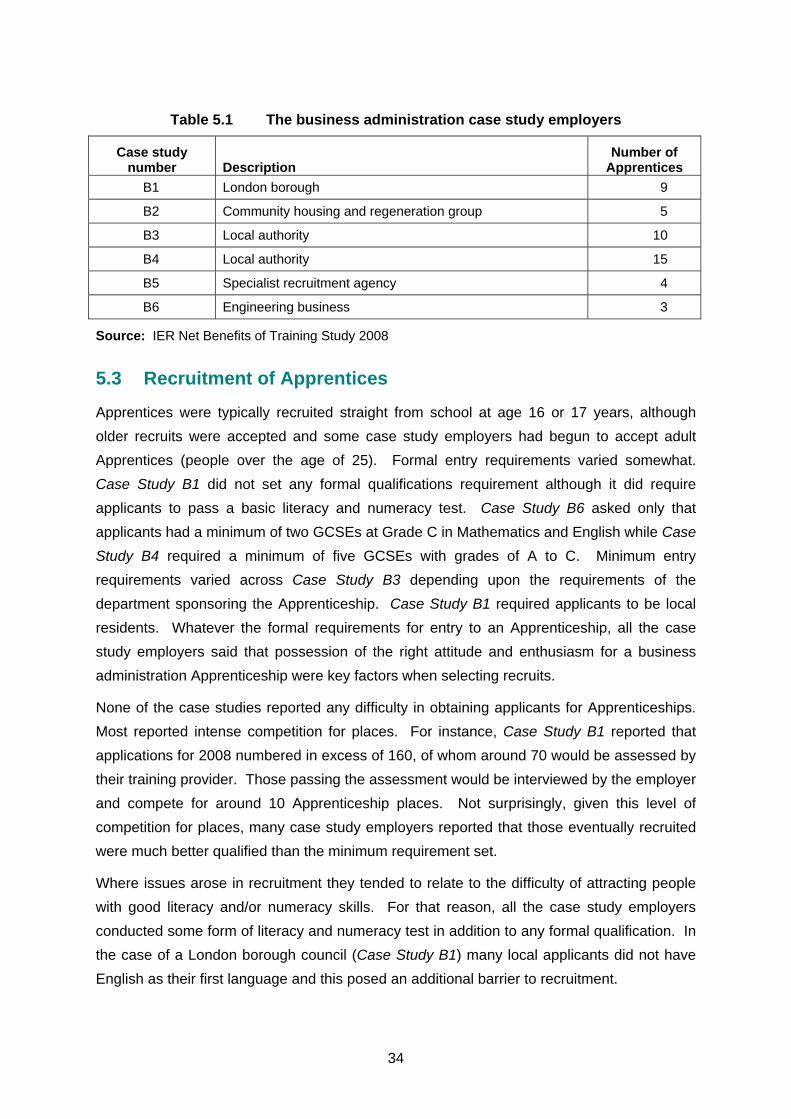
34
Table 5.1 The business administration case study employers
Case study number
Description
Number of Apprentices
B1 London borough 9
B2 Community housing and regeneration group 5
B3 Local authority 10
B4 Local authority 15
B5 Specialist recruitment agency 4
B6 Engineering business 3
Source: IER Net Benefits of Training Study 2008
5.3 Recruitment of Apprentices
Apprentices were typically recruited straight from school at age 16 or 17 years, although older recruits were accepted and some case study employers had begun to accept adult Apprentices (people over the age of 25). Formal entry requirements varied somewhat. Case Study B1 did not set any formal qualifications requirement although it did require applicants to pass a basic literacy and numeracy test. Case Study B6 asked only that applicants had a minimum of two GCSEs at Grade C in Mathematics and English while Case Study B4 required a minimum of five GCSEs with grades of A to C. Minimum entry requirements varied across Case Study B3 depending upon the requirements of the department sponsoring the Apprenticeship. Case Study B1 required applicants to be local residents. Whatever the formal requirements for entry to an Apprenticeship, all the case study employers said that possession of the right attitude and enthusiasm for a business administration Apprenticeship were key factors when selecting recruits.
None of the case studies reported any difficulty in obtaining applicants for Apprenticeships. Most reported intense competition for places. For instance, Case Study B1 reported that applications for 2008 numbered in excess of 160, of whom around 70 would be assessed by their training provider. Those passing the assessment would be interviewed by the employer and compete for around 10 Apprenticeship places. Not surprisingly, given this level of competition for places, many case study employers reported that those eventually recruited were much better qualified than the minimum requirement set.
Where issues arose in recruitment they tended to relate to the difficulty of attracting people with good literacy and/or numeracy skills. For that reason, all the case study employers conducted some form of literacy and numeracy test in addition to any formal qualification. In the case of a London borough council (Case Study B1) many local applicants did not have English as their first language and this posed an additional barrier to recruitment.
35
5.4 The structure of Apprenticeship training
All of the case study employers offered Apprenticeships in Business Administration at both NVQ Level 2 and NVQ Level 3. The time taken by an Apprentice to achieve these NVQ varied considerably. In three case studies Apprentices were expected to complete their NVQ Level 2 within the first year of their Apprenticeship training. In the others, Apprentices took between 15 months and two years to complete NVQ Level 2. There were similar differences in regard to NVQ Level 3. In two case studies Apprentices could complete NVQ Level 3 by the end of their second year. In two further cases the Level 3 Apprenticeship could be completed within three years and in the final two cases the Level 3 Apprenticeship would be completed during a forth year.
Even within a single organisation, the speed at which Apprentices progressed and completed their training was variable, reflecting the individual’s capability and preferences. In some instances where Apprentices completed their business administration NVQ Level 2 quickly they would a complete a further NVQ (for instance, in customer service) at the same level, or obtain a more specific qualification (such as the European Computer Driving License) before progressing to NVQ Level 3. In Case Study B6 Apprentices trained for the Chartered Institute of Purchasing and Supply’s (CIPS) Certificate (at Level 2) and Diploma (at Level 3) in addition to their NVQ. This was a reflection of that employer’s dissatisfaction with the content of business administration framework (that employer did not regard an Apprenticeship as complete until the Apprentice had attained the IPS Diploma and that extended the length of the Apprenticeship to around three and a half years).
Apprenticeship training was largely undertaken within the workplace. Precisely what was involved varied somewhat across organisations. In Case Study 3 Apprentices spent most of their time working alongside experienced administrators within the Department whose manager had ‘sponsored’ the Apprenticeship. This contrasted with Case Study B4 where Apprentices took on office-based junior administrator roles in different departments to broaden their experience and deepen their knowledge. A similar rotation of activities took place in Case Study B1 where Apprentices spent time working in different departments such as Revenues, Partnership and Development, Food Safety, Council Tax and Benefits, Legal Services and the Mayors Office. One consequence of the dominance of on-the-job training was that Apprentices made a significant productive contribution to the business (often estimated to be in the region of 80-90 per cent of a fully experienced worker).
Off-the-job training was limited but not non-existent. Most employers provided some form of induction programme for Apprentices, while Apprentices also received training that was common to all people recruited to the organisation, such as training in health and safety, equality and diversity, personal development and even stress awareness. In Case Study B1 Apprentices spent around one day per fortnight at a training provider’s facilities as part of

36
their Apprenticeship. In Case Study B3 Apprentices were able to spend one day per week at a local further education college. Case Study B6 did not offer any training on day release but Apprentices did undertake around three hours of distance learning per week (of which around half was in company time).
5.5 The net cost of training
The net costs to the employer of a business administration Apprenticeship is summarised in Tables 5.2 and 5.3. Table 5.2 shows the average net cost of training an Apprentice to NVQ Level 2 while Table 5.3 shows the average net cost of training to NVQ level 3. The time taken to achieve an NVQ Level 3 varied across case studies. Such variation affects both costs and benefits so Table 5.3 distinguishes between employers where Apprenticeships were completed at NVQ Level 3 in two, three and four years.
Table 5.2 Net cost of Level 2 business administration Apprenticeships
NVQ Level 2
Average wage of trainee 8,574
Productive contribution of trainee 67%
Fully experienced workers wage 1 18,150
Training Manager 34,108
Employer costs
Wage costs 10,244
National insurance contributions 534
Supervisory costs 2,844
Training manager 582
Other staff 5
Training costs 420
Other costs 212
Total 14,842
Employer benefits 0
Productive contribution 13,959
Other income 0
Total 13,959
Cost-benefit
Total 884
Total (with drop-out) 1,191
Source: IER Net Benefits of Training Study 2008
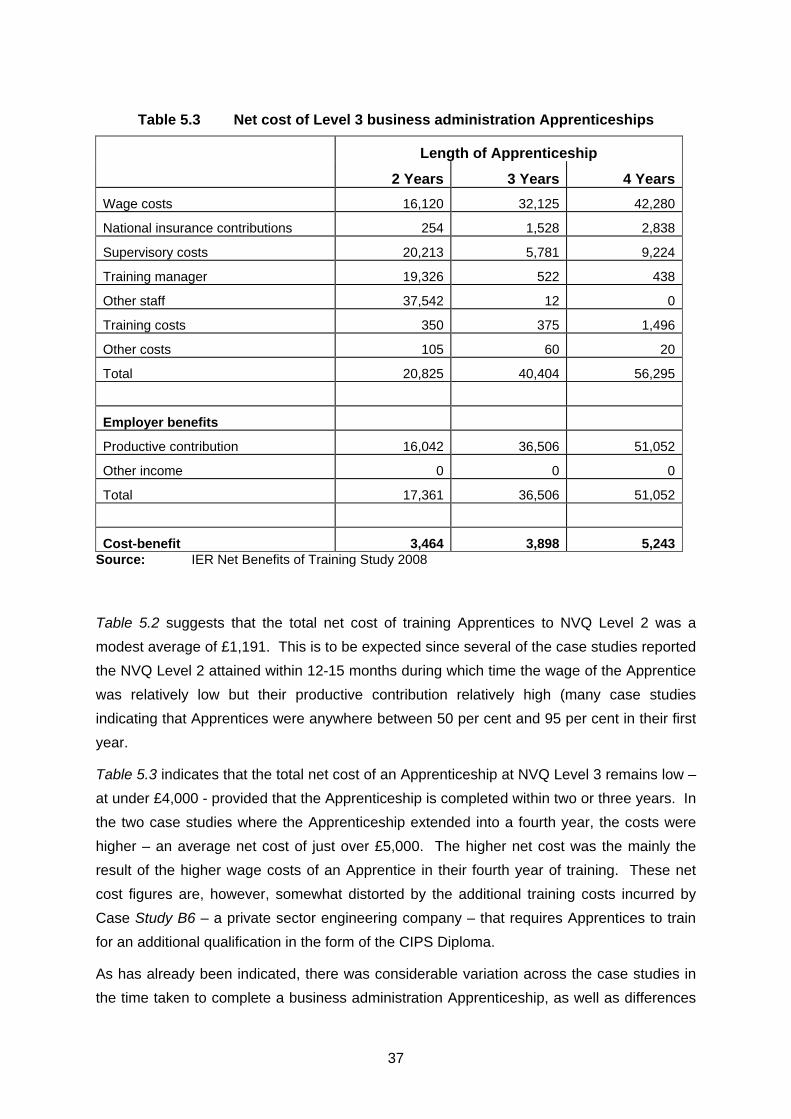
37
Table 5.3 Net cost of Level 3 business administration Apprenticeships
Length of Apprenticeship 2 Years 3 Years 4 YearsWage costs 16,120 32,125 42,280
National insurance contributions 254 1,528 2,838
Supervisory costs 20,213 5,781 9,224
Training manager 19,326 522 438
Other staff 37,542 12 0
Training costs 350 375 1,496
Other costs 105 60 20
Total 20,825 40,404 56,295
Employer benefits
Productive contribution 16,042 36,506 51,052
Other income 0 0 0
Total 17,361 36,506 51,052
Cost-benefit 3,464 3,898 5,243Source: IER Net Benefits of Training Study 2008
Table 5.2 suggests that the total net cost of training Apprentices to NVQ Level 2 was a modest average of £1,191. This is to be expected since several of the case studies reported the NVQ Level 2 attained within 12-15 months during which time the wage of the Apprentice was relatively low but their productive contribution relatively high (many case studies indicating that Apprentices were anywhere between 50 per cent and 95 per cent in their first year.
Table 5.3 indicates that the total net cost of an Apprenticeship at NVQ Level 3 remains low – at under £4,000 - provided that the Apprenticeship is completed within two or three years. In the two case studies where the Apprenticeship extended into a fourth year, the costs were higher – an average net cost of just over £5,000. The higher net cost was the mainly the result of the higher wage costs of an Apprentice in their fourth year of training. These net cost figures are, however, somewhat distorted by the additional training costs incurred by Case Study B6 – a private sector engineering company – that requires Apprentices to train for an additional qualification in the form of the CIPS Diploma.
As has already been indicated, there was considerable variation across the case studies in the time taken to complete a business administration Apprenticeship, as well as differences
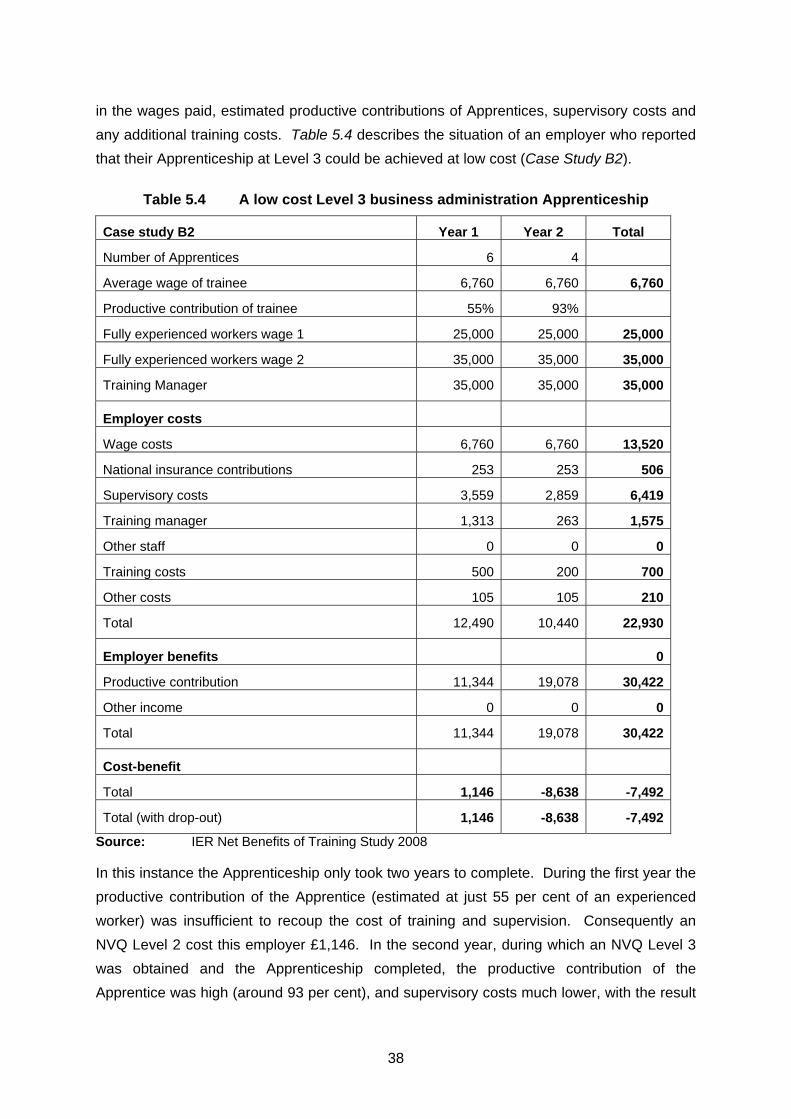
38
in the wages paid, estimated productive contributions of Apprentices, supervisory costs and any additional training costs. Table 5.4 describes the situation of an employer who reported that their Apprenticeship at Level 3 could be achieved at low cost (Case Study B2).
Table 5.4 A low cost Level 3 business administration Apprenticeship
Case study B2 Year 1 Year 2 Total
Number of Apprentices 6 4
Average wage of trainee 6,760 6,760 6,760
Productive contribution of trainee 55% 93%
Fully experienced workers wage 1 25,000 25,000 25,000
Fully experienced workers wage 2 35,000 35,000 35,000
Training Manager 35,000 35,000 35,000
Employer costs
Wage costs 6,760 6,760 13,520
National insurance contributions 253 253 506
Supervisory costs 3,559 2,859 6,419
Training manager 1,313 263 1,575
Other staff 0 0 0
Training costs 500 200 700
Other costs 105 105 210
Total 12,490 10,440 22,930
Employer benefits 0
Productive contribution 11,344 19,078 30,422
Other income 0 0 0
Total 11,344 19,078 30,422
Cost-benefit
Total 1,146 -8,638 -7,492
Total (with drop-out) 1,146 -8,638 -7,492
Source: IER Net Benefits of Training Study 2008
In this instance the Apprenticeship only took two years to complete. During the first year the productive contribution of the Apprentice (estimated at just 55 per cent of an experienced worker) was insufficient to recoup the cost of training and supervision. Consequently an NVQ Level 2 cost this employer £1,146. In the second year, during which an NVQ Level 3 was obtained and the Apprenticeship completed, the productive contribution of the Apprentice was high (around 93 per cent), and supervisory costs much lower, with the result
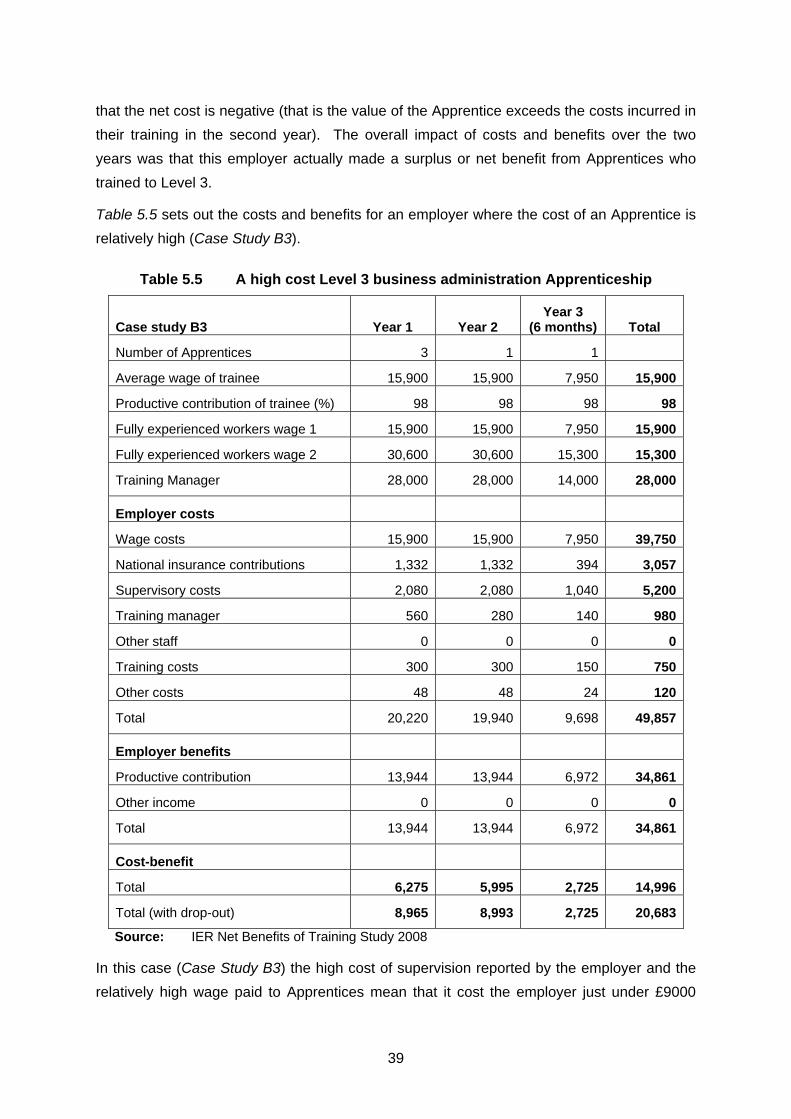
39
that the net cost is negative (that is the value of the Apprentice exceeds the costs incurred in their training in the second year). The overall impact of costs and benefits over the two years was that this employer actually made a surplus or net benefit from Apprentices who trained to Level 3.
Table 5.5 sets out the costs and benefits for an employer where the cost of an Apprentice is relatively high (Case Study B3).
Table 5.5 A high cost Level 3 business administration Apprenticeship
Case study B3 Year 1 Year 2 Year 3
(6 months) Total
Number of Apprentices 3 1 1
Average wage of trainee 15,900 15,900 7,950 15,900
Productive contribution of trainee (%) 98 98 98 98
Fully experienced workers wage 1 15,900 15,900 7,950 15,900
Fully experienced workers wage 2 30,600 30,600 15,300 15,300
Training Manager 28,000 28,000 14,000 28,000
Employer costs
Wage costs 15,900 15,900 7,950 39,750
National insurance contributions 1,332 1,332 394 3,057
Supervisory costs 2,080 2,080 1,040 5,200
Training manager 560 280 140 980
Other staff 0 0 0 0
Training costs 300 300 150 750
Other costs 48 48 24 120
Total 20,220 19,940 9,698 49,857
Employer benefits
Productive contribution 13,944 13,944 6,972 34,861
Other income 0 0 0 0
Total 13,944 13,944 6,972 34,861
Cost-benefit
Total 6,275 5,995 2,725 14,996
Total (with drop-out) 8,965 8,993 2,725 20,683
Source: IER Net Benefits of Training Study 2008
In this case (Case Study B3) the high cost of supervision reported by the employer and the relatively high wage paid to Apprentices mean that it cost the employer just under £9000
40
(net) to train an Apprentice in both their first and second year of Apprenticeship. This was despite the high level of productive contribution of the Apprentice. The net cost of an Apprentice dropped to an estimated £2,725 in the final year. This was mainly because the Apprentices only continued for six months into the third year. Overall, the net cost to this employer was well over £20,000 for the two and a half years taken to complete a Level 3 Apprenticeship.
5.6 Completion, drop out and career progression
Most case study employers reported high completion rates amongst Apprentices they had trained. For instance, Case Study B3 indicated that completion rates over the years as being in the order of 98 per cent, although Case Study B1 estimated their completion rate only at around 70 per cent. Most Apprentices were employed on fixed term contracts with no guarantee of a job on completion of the Apprenticeship. In most cases Apprentices had to apply for and compete for jobs alongside other suitably qualified applicants. It was generally the case that employers provided job search support to Apprentices nearing completion. This might involve helping with CV preparation or interview technique. One case study employers worked with local employers to secure jobs for Apprentices who could not be retained (particularly where the Apprentice did not succeed at Level 2 and could not continue their Apprenticeship).
Case study employers all pointed to people working in their organisations who were ex-Apprentices as evidence that retention and career progression was possible. Case Study B3 reported that around 80 per cent of Apprentices stayed with the organisation upon completing their Apprenticeship while in Case Study B1 around two thirds of Apprentices had found jobs within the organisation. Some concern was expressed that the number of entry-level jobs to which business administration Apprentices had moved on to on completion had decreased, raising the prospect of a lower take up of Apprentices in the future.
5.7 Conclusions
Apprenticeships in business administration, unlike those in more traditional types of Apprenticeship, are not sector specific but located across the economy. There is, however, a particular concentration of business administration Apprentices in the public sector, especially in local government. Analysis based on a number of case studies of employers providing business administration training places found considerable variety in the way that such Apprenticeships were delivered and the time taken to complete. Achieving an NVQ Level 3 Apprenticeship could take between two and four years depending upon the employer concerned. NVQs at Level 2 could be achieved in 12-15 months or sometimes less.

41
Business administration Apprenticeships appeared to represent a comparatively low cost investment for many employers, especially where the Apprenticeship can be completed at Level 3 in just two years. This reflects the high productive contribution of Apprentices resulting from the mainly on-the-job nature of the training. The comparatively high value of Apprentices to the business during training offsets the cost of supervision and assessment to a considerable degree. For the cases studies as a whole the total net cost of achieving a Level 3 Apprenticeship was £3,464 where the Apprenticeship was completed in two years and not much more (£3,898) if completed within three years. Two examples of Apprenticeships lasting into a fourth year were examined and for them the total net cost was, as might be expected, somewhat greater at £5,243. The latter figure was, however, distorted by one case study employer who required Apprentices to train for an additional Diploma before completing their Apprenticeship.
The benefits and return on investment in Apprenticeships is considered in greater detail in Chapter 8. The business administration case studies suggest a variety of short-term and long-term benefits to employers. The short-term benefits to the organisation of providing Apprenticeships had been:
• it had attracted greater numbers of young people;
• fresh ideas/new thinking had been infused into the organisation;
• young people had brought their energy and vigour into the workplace;
• young people had generally contributed more advanced and additional IT skills.
The long-term benefits to the organisation of providing Apprenticeships had been:
• to establishing a reputation with the local community as ‘a good employer’;
• to help address the issue of an ageing workforce and the succession issue;
• to provide greater job satisfaction and motivation amongst staff responsible for/or who passed on their knowledge and experience to Apprentices.

42
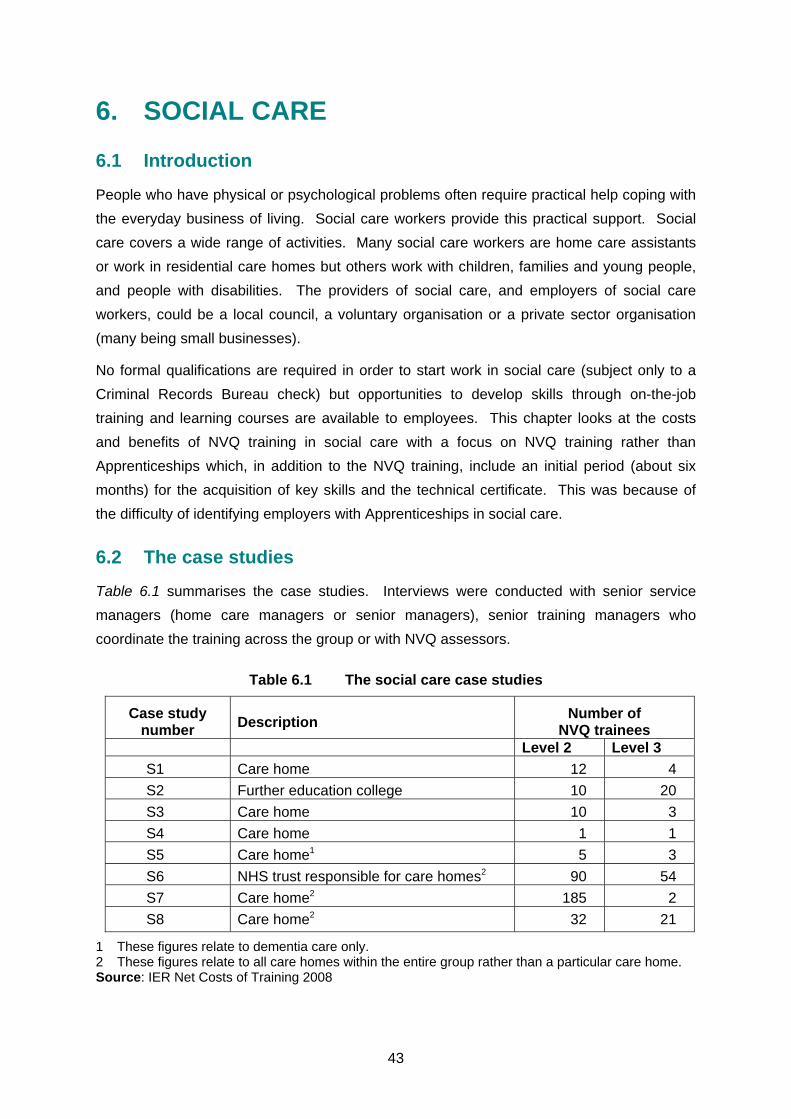
43
6. SOCIAL CARE
6.1 Introduction
People who have physical or psychological problems often require practical help coping with the everyday business of living. Social care workers provide this practical support. Social care covers a wide range of activities. Many social care workers are home care assistants or work in residential care homes but others work with children, families and young people, and people with disabilities. The providers of social care, and employers of social care workers, could be a local council, a voluntary organisation or a private sector organisation (many being small businesses).
No formal qualifications are required in order to start work in social care (subject only to a Criminal Records Bureau check) but opportunities to develop skills through on-the-job training and learning courses are available to employees. This chapter looks at the costs and benefits of NVQ training in social care with a focus on NVQ training rather than Apprenticeships which, in addition to the NVQ training, include an initial period (about six months) for the acquisition of key skills and the technical certificate. This was because of the difficulty of identifying employers with Apprenticeships in social care.
6.2 The case studies
Table 6.1 summarises the case studies. Interviews were conducted with senior service managers (home care managers or senior managers), senior training managers who coordinate the training across the group or with NVQ assessors.
Table 6.1 The social care case studies
Case study number
Description Number of
NVQ trainees Level 2 Level 3
S1 Care home 12 4 S2 Further education college 10 20 S3 Care home 10 3 S4 Care home 1 1 S5 Care home1 5 3 S6 NHS trust responsible for care homes2 90 54 S7 Care home2 185 2 S8 Care home2 32 21
1 These figures relate to dementia care only. 2 These figures relate to all care homes within the entire group rather than a particular care home. Source: IER Net Costs of Training 2008
44
Eight case studies were undertaken, mainly in independent residential and nursing care homes for the frail elderly and older people with dementia. These homes can be classed as small businesses (ranging from 36 employees to over 70 employees), but they were all part of a larger organisation. In addition, a public provider of training and care services (residential and day care, with a total of 200 employees) was included in the case studies.
Training in social care is largely driven by legislative requirements designed to improve the standards of care. This applies to NVQs and mandatory short courses in areas such as health and safety, first aid or the Protection of Vulnerable Adults (POVA). The new National Minimum Standards3 which came into effect in 2003 require that at least 50 per cent of staff is qualified to NVQ Level 2 by 2005, but a recent report indicates that these qualification standards in care homes have not been fully met (CSCI 2008)4. Financial penalties will apply if a provider does not meet the qualification standards.
6.3 Structure of training
Newly recruited care assistants undergo a 12-week induction programme. Upon completion of the probationary period (between three to six months) care assistants will be encouraged to embark on an NVQ Level 2 in health and social care. The qualification consists of six units; four of them mandatory (see Table 6.2 below for further details). These should be undertaken within 12 months, but extensions can and will be granted. The qualification was entirely work-based, i.e. where external NVQ assessors are deployed they meet the NVQ trainee at the workplace. Carers were on an employment contract from the day they started work, with continuous training being part of that contract. When carers embarked on an NVQ they were requested to sign a contract between themselves and the training provider.
The training that care assistants received during the induction programme enabled them to work unsupervised with the residents by the time they embarked on their NVQ Level 2. The experience staff gained during the induction programme could be used as evidence for their NVQ. Although this was not repeated in detail in every case study, this appeared to be a general feature of the training structure.
Some organisations ran in-house training programmes; others used external providers (colleges or private providers) or a mixture of both to increase training capacities. Some saw in-house training as preferential as it allowed the implementation of high standards throughout the organisation and helped get candidates through the NVQ more quickly, provided there is sufficient internal training capacity. One interviewee argued that the
3 For details see Commission of Social Care Inspection
http://www.csci.org.uk/professional/care_providers/all_services/national_minimum_standards.aspx 4 Commission of Social Care Inspection (2008) The state of social care in England 2006-07.
http://www.csci.org.uk/about_us/news/state_of_social_care_2007_ne-1.aspx (part 1)
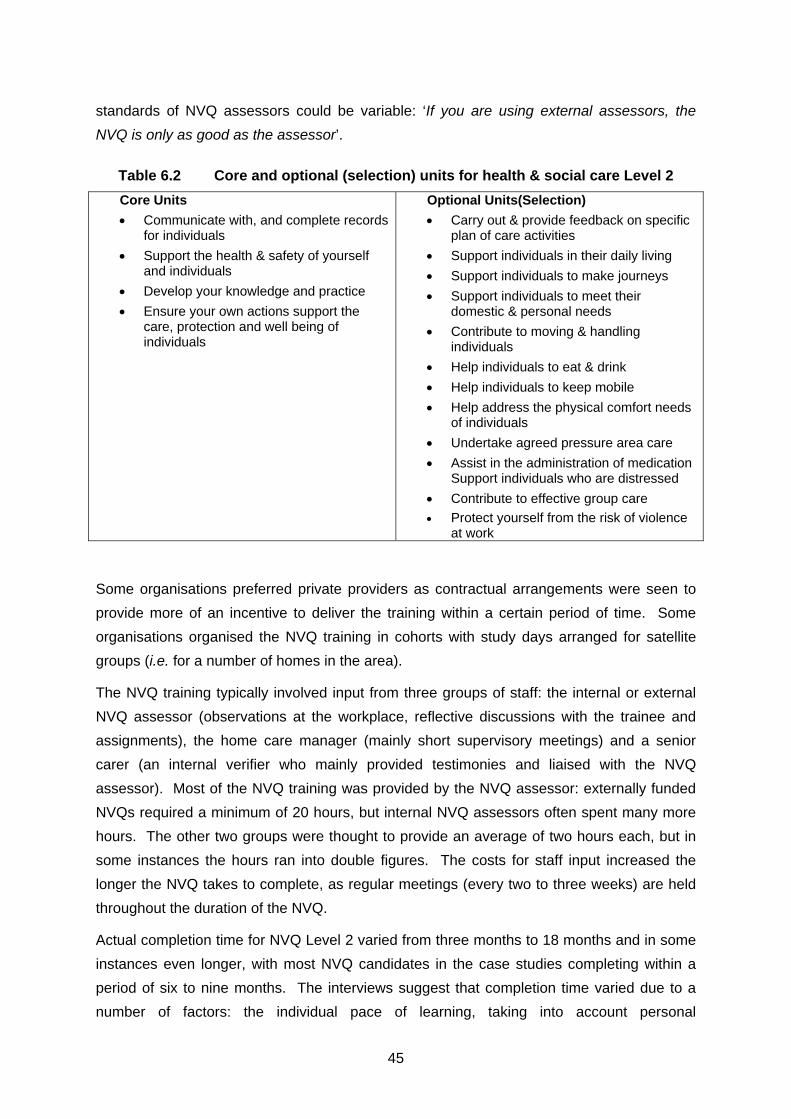
45
standards of NVQ assessors could be variable: ‘If you are using external assessors, the NVQ is only as good as the assessor’.
Table 6.2 Core and optional (selection) units for health & social care Level 2 Core Units
• Communicate with, and complete records for individuals
• Support the health & safety of yourself and individuals
• Develop your knowledge and practice • Ensure your own actions support the
care, protection and well being of individuals
Optional Units(Selection) • Carry out & provide feedback on specific
plan of care activities • Support individuals in their daily living • Support individuals to make journeys • Support individuals to meet their
domestic & personal needs • Contribute to moving & handling
individuals • Help individuals to eat & drink • Help individuals to keep mobile • Help address the physical comfort needs
of individuals • Undertake agreed pressure area care • Assist in the administration of medication
Support individuals who are distressed • Contribute to effective group care • Protect yourself from the risk of violence
at work
Some organisations preferred private providers as contractual arrangements were seen to provide more of an incentive to deliver the training within a certain period of time. Some organisations organised the NVQ training in cohorts with study days arranged for satellite groups (i.e. for a number of homes in the area).
The NVQ training typically involved input from three groups of staff: the internal or external NVQ assessor (observations at the workplace, reflective discussions with the trainee and assignments), the home care manager (mainly short supervisory meetings) and a senior carer (an internal verifier who mainly provided testimonies and liaised with the NVQ assessor). Most of the NVQ training was provided by the NVQ assessor: externally funded NVQs required a minimum of 20 hours, but internal NVQ assessors often spent many more hours. The other two groups were thought to provide an average of two hours each, but in some instances the hours ran into double figures. The costs for staff input increased the longer the NVQ takes to complete, as regular meetings (every two to three weeks) are held throughout the duration of the NVQ.
Actual completion time for NVQ Level 2 varied from three months to 18 months and in some instances even longer, with most NVQ candidates in the case studies completing within a period of six to nine months. The interviews suggest that completion time varied due to a number of factors: the individual pace of learning, taking into account personal

46
circumstances; the progress monitoring arrangements with the organisation; internal or external training capacity constraints; and contractual arrangements as indicated earlier.
In principle similar training arrangements apply for NVQ level 3 (although there are no Government targets as for NVQ Level 2). An NVQ Level 3 was often required for a senior carer or team leader position. Typically, carers need to acquire two years experience before progressing to NVQ Level 3. One respondent explained that care assistants will, in principle, be able to progress to the next level about a year after completion of NVQ Level 2 if they have assumed responsibility for the supervision of other staff. The NVQ candidate has to complete eight units: four core and four optional ones. The training takes about a year, with actual completion time varying from 8 months to 18 months in our case studies.
Access to career progression and NVQ Level 3 training depends on internal demand for senior carers and the availability of external funding or internal training capacities. Organisations thus have waiting lists for staff wanting to embark on NVQ Level 3 training. Opportunities to progress to NVQ Level 3 were thought to help retain staff and may even have a positive effect on recruitment. NVQ Level 4 training is the relevant qualification for care home managers and deputies. The case studies gathered data on these NVQ candidates but it was deemed outside the scope of the study to explore further details.
Care assistants taking the Apprenticeship route have to complete the key skills and the technical certificate before embarking on an NVQ Level 2. Despite recent efforts of Skills for Care to boost the literacy and numeracy skills among care workers, the qualification was not thought to be very popular among staff and some care providers. This was because it lengthened the training period by around six months; staff might be less keen to improve their skills in English5 and mathematics and, some care homes argued, there is no difference in the training outcomes compared to someone who had undertaken an NVQ Level 2 only. Some case studies suggested that funding arrangements also had implications for the propensity to offer Apprenticeships.
Carers are recruited mainly via newspaper advertisements, with some organisations also using the Jobcentre, the intranet (mainly for senior carers) and regular group-interviews to ensure a continuous supply of staff. Aptitude for the job (‘a caring nature’) was the key criterion for the recruitment of carers. Some organisations would welcome someone with experience in informal care for a relative; others would like candidates to have two years of experience with elderly people in a care organisation. An NVQ qualification might be desirable (to help meet the legislative targets), but it was not essential as training was provided in-house. One organisation had, however, recently decided to change its
5 One organisation, however, noted a lack of literacy skills among its largely foreign care workforce
and tried to incorporate language support into the NVQ training.

47
recruitment policy in view of its experience of high turnover and was opting henceforth for the recruitment of carers with an NVQ Level 2 qualification.
6.4 Net costs of training
The net costs of training depend on a number of factors such as the time taken to complete the NVQ (ranging from three to 18 months for NVQ level 2, the number of hours spent on NVQ training (with the time spent by the internal NVQ assessor being most relevant), whether the organisation used an internal or an external assessor, the salary costs and the productivity of the NVQ trainee (gauged to be between 50 to 100 per cent). Most carers worked part-time, with hours varying greatly to suit individual circumstances. For the purposes of this study it has been assumed throughout that NVQ trainees (Level 2 and 3) worked 25 hours per week.
Case Study S7 provides an example of a low cost NVQ (see Table 6.3). The low cost was mainly due to the short completion time for NVQ Level 2 (6 months), mid-range productivity assessment (70 per cent for NVQ Level 2 and 80 per cent for NVQ Level 3) and comparatively low number of hours spent by staff on NVQ training.
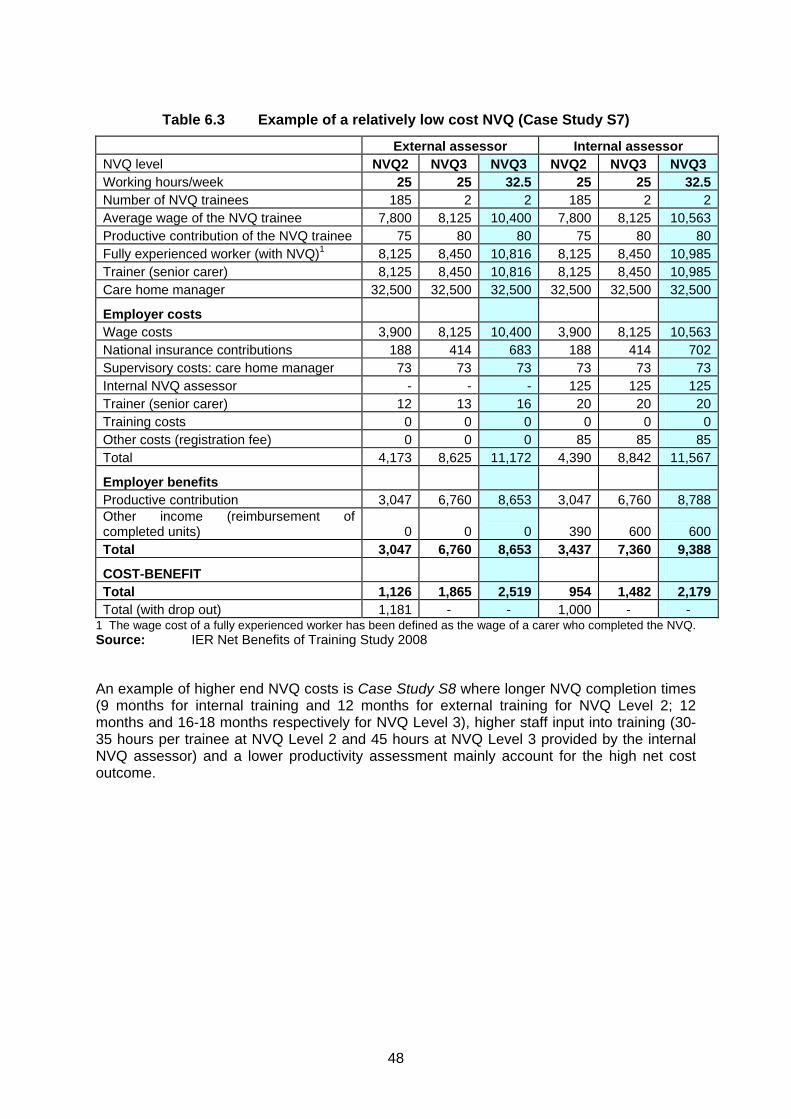
48
Table 6.3 Example of a relatively low cost NVQ (Case Study S7)
External assessor Internal assessor NVQ level NVQ2 NVQ3 NVQ3 NVQ2 NVQ3 NVQ3 Working hours/week 25 25 32.5 25 25 32.5Number of NVQ trainees 185 2 2 185 2 2Average wage of the NVQ trainee 7,800 8,125 10,400 7,800 8,125 10,563Productive contribution of the NVQ trainee 75 80 80 75 80 80Fully experienced worker (with NVQ)1 8,125 8,450 10,816 8,125 8,450 10,985Trainer (senior carer) 8,125 8,450 10,816 8,125 8,450 10,985Care home manager 32,500 32,500 32,500 32,500 32,500 32,500
Employer costs Wage costs 3,900 8,125 10,400 3,900 8,125 10,563National insurance contributions 188 414 683 188 414 702Supervisory costs: care home manager 73 73 73 73 73 73Internal NVQ assessor - - - 125 125 125Trainer (senior carer) 12 13 16 20 20 20Training costs 0 0 0 0 0 0Other costs (registration fee) 0 0 0 85 85 85Total 4,173 8,625 11,172 4,390 8,842 11,567
Employer benefits Productive contribution 3,047 6,760 8,653 3,047 6,760 8,788Other income (reimbursement of completed units) 0 0 0 390 600 600Total 3,047 6,760 8,653 3,437 7,360 9,388
COST-BENEFIT Total 1,126 1,865 2,519 954 1,482 2,179Total (with drop out) 1,181 - - 1,000 - -
1 The wage cost of a fully experienced worker has been defined as the wage of a carer who completed the NVQ. Source: IER Net Benefits of Training Study 2008
An example of higher end NVQ costs is Case Study S8 where longer NVQ completion times (9 months for internal training and 12 months for external training for NVQ Level 2; 12 months and 16-18 months respectively for NVQ Level 3), higher staff input into training (30-35 hours per trainee at NVQ Level 2 and 45 hours at NVQ Level 3 provided by the internal NVQ assessor) and a lower productivity assessment mainly account for the high net cost outcome.
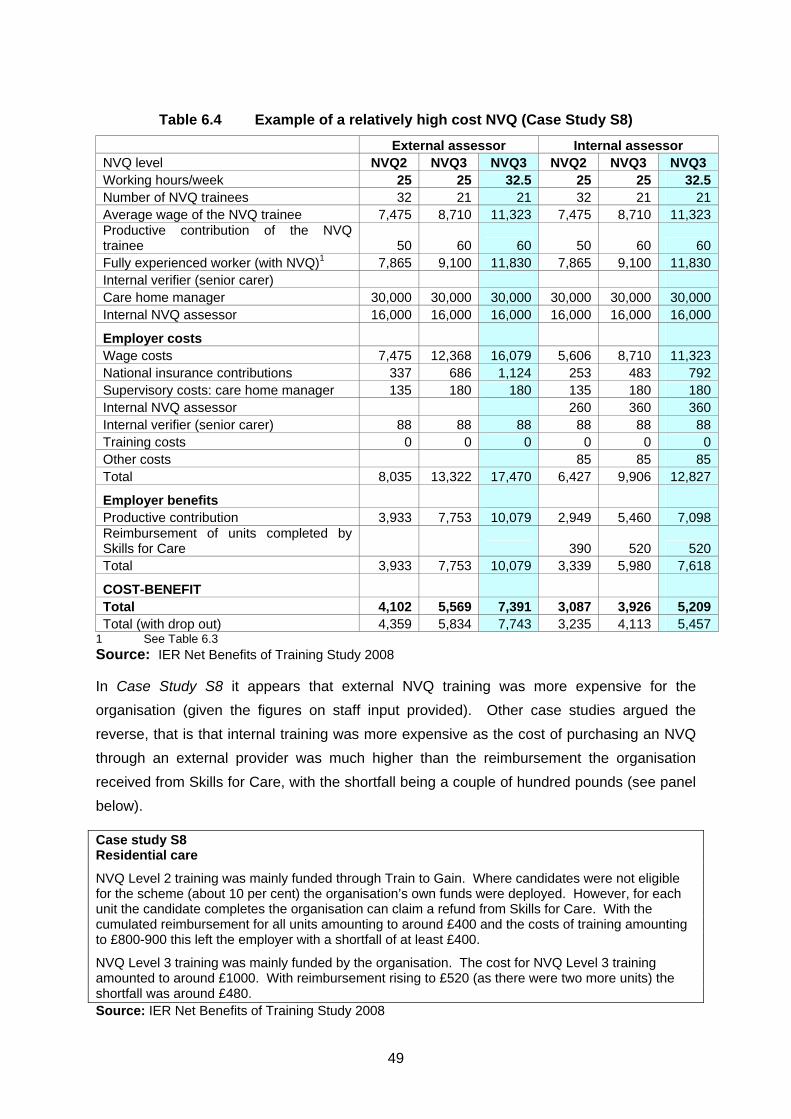
49
Table 6.4 Example of a relatively high cost NVQ (Case Study S8)
External assessor Internal assessor NVQ level NVQ2 NVQ3 NVQ3 NVQ2 NVQ3 NVQ3 Working hours/week 25 25 32.5 25 25 32.5Number of NVQ trainees 32 21 21 32 21 21Average wage of the NVQ trainee 7,475 8,710 11,323 7,475 8,710 11,323Productive contribution of the NVQ trainee 50 60 60 50 60 60Fully experienced worker (with NVQ)1 7,865 9,100 11,830 7,865 9,100 11,830Internal verifier (senior carer) Care home manager 30,000 30,000 30,000 30,000 30,000 30,000Internal NVQ assessor 16,000 16,000 16,000 16,000 16,000 16,000
Employer costs Wage costs 7,475 12,368 16,079 5,606 8,710 11,323National insurance contributions 337 686 1,124 253 483 792Supervisory costs: care home manager 135 180 180 135 180 180Internal NVQ assessor 260 360 360Internal verifier (senior carer) 88 88 88 88 88 88Training costs 0 0 0 0 0 0Other costs 85 85 85Total 8,035 13,322 17,470 6,427 9,906 12,827
Employer benefits Productive contribution 3,933 7,753 10,079 2,949 5,460 7,098Reimbursement of units completed by Skills for Care 390 520 520Total 3,933 7,753 10,079 3,339 5,980 7,618
COST-BENEFIT Total 4,102 5,569 7,391 3,087 3,926 5,209Total (with drop out) 4,359 5,834 7,743 3,235 4,113 5,457
1 See Table 6.3 Source: IER Net Benefits of Training Study 2008
In Case Study S8 it appears that external NVQ training was more expensive for the organisation (given the figures on staff input provided). Other case studies argued the reverse, that is that internal training was more expensive as the cost of purchasing an NVQ through an external provider was much higher than the reimbursement the organisation received from Skills for Care, with the shortfall being a couple of hundred pounds (see panel below).
Case study S8 Residential care
NVQ Level 2 training was mainly funded through Train to Gain. Where candidates were not eligible for the scheme (about 10 per cent) the organisation’s own funds were deployed. However, for each unit the candidate completes the organisation can claim a refund from Skills for Care. With the cumulated reimbursement for all units amounting to around £400 and the costs of training amounting to £800-900 this left the employer with a shortfall of at least £400.
NVQ Level 3 training was mainly funded by the organisation. The cost for NVQ Level 3 training amounted to around £1000. With reimbursement rising to £520 (as there were two more units) the shortfall was around £480. Source: IER Net Benefits of Training Study 2008
50
Across all the case study establishments, the productivity of an NVQ trainee compared to an experienced worker was generally difficult to gauge, partly due to individual differences in productivity, with estimates varying from 50 per cent to 100 per cent. Most care assistants embarking on the NVQ training were doing the same job as someone who has completed the NVQ training. The tasks undertaken were often unsupervised (although support was provided when needed). Where the productivity of those undertaking training differed from experienced care workers the reason was that experienced care assistants were more competent and got the work done quicker. On completion of the NVQ Level 2, productivity was estimated to have reached 100 per cent. The same productivity profile applied to care assistants embarking on NVQ Level 3, with one respondent suggesting the greater experience of the person embarking on NVQ Level 3 meant that their productivity was slightly higher (60 per cent) at the outset.
Where respondents could provide figures, drop out rates were generally low. It was argued that they mainly occurred when staff quit their job, presumed wanting to leave care work altogether. Where staff faced difficulty in completing their NVQ they were generally encouraged and supported to persevere. NVQ failure, one interviewee argued, was non-existent in her organisation as the units will only be submitted once the outcome was satisfactory. On the other hand, the completion rate was low in one organisation (judged to be just 10 per cent) because of a lack of internal training capacity, and this may well have led to drop-outs over time.
6.5 Conclusion
The evidence from the social care case studies is that training was comparatively expensive for the employer. If an employer participated in training to NVQ Level 2 then the cost to them could be as high as £4,359. If an employer were to train someone to NVQ Level 2 and then to NVQ Level 3 the total cost would be around £7,743. In both instances, the high costs resulted from the fairly formal structure of training and the time taken to achieve the qualifications.
51
7. THE CONSTRUCTION SECTOR
7.1 Introduction
Craft skills are the most important occupational category in construction and, as such, there is an on-going need to maintain a flow of new trainees into the industry. The Construction Industry Task Force in its 1998 publication “Rethinking Construction” referred to a crisis in training reflecting on the decline in the number of trainees since the 1970s. British construction has maintained a training board for some 50 years now and it operates a levy-grant system to pay for training throughout the industry. CITB-ConstructionSkills collect an annual levy from all in-scope employers and pays out grants to those companies that carry out training. Not all construction companies are in-scope to CITB; both smaller firms and some specialist sub-contractors (plumbers, electricians and heating and ventilating specialists) are out of scope. Construction companies with an annual wage bill in excess of £76,000 (including payments to labour-only sub-contractors) pay CITB a levy equal to 0.5 per cent of their wage bill for direct employees and 1.5 per cent of the value of any payments on labour-only sub-contracts. Often it is the smaller and medium-size companies (SMEs) that actually do the training in their role as sub-contractors, but it is the larger companies that also benefit from having a pool of skilled workers from which to recruit.
The levy system complicates cost-benefit comparisons between construction and other sectors, so for this reason it has been disregarded in these cost-benefit calculations. There is, however, another reason for disregarding it for comparative purposes. In the other sectors, the costs of training courses are covered by the LSC, via the training provider, such that employers in the construction industry who train, on balance, similarly incur no cost for training courses in the same way as employers in the other sectors. However, the levy has a significant impact on training behaviour, because it acts as an incentive to train, as employers seek to recoup their levy payments by engaging in Apprenticeship training. All but one of the case study companies that participated in the study were in-scope to CITB-ConstructionSkills.
The case studies are all concerned with companies training young people to Level 3 in carpentry, bricklaying, painting and decorating, or specialist trades (e.g. electricians for the construction industry). Companies indicated that they were willing to take on older people as Apprentices, but the tradition was primarily to take young people from age 16 to 18 years and train them over a three year period (sometimes slightly longer) in one of the construction trades. Health and safety regulations in some sectors of the construction industry meant that some companies preferred only to recruit Apprentices aged over 18 years. Level 3 was considered by employers to be the required standard to meet the needs of a construction site. Consequently, the costs of training Apprentices were relatively high compared to other
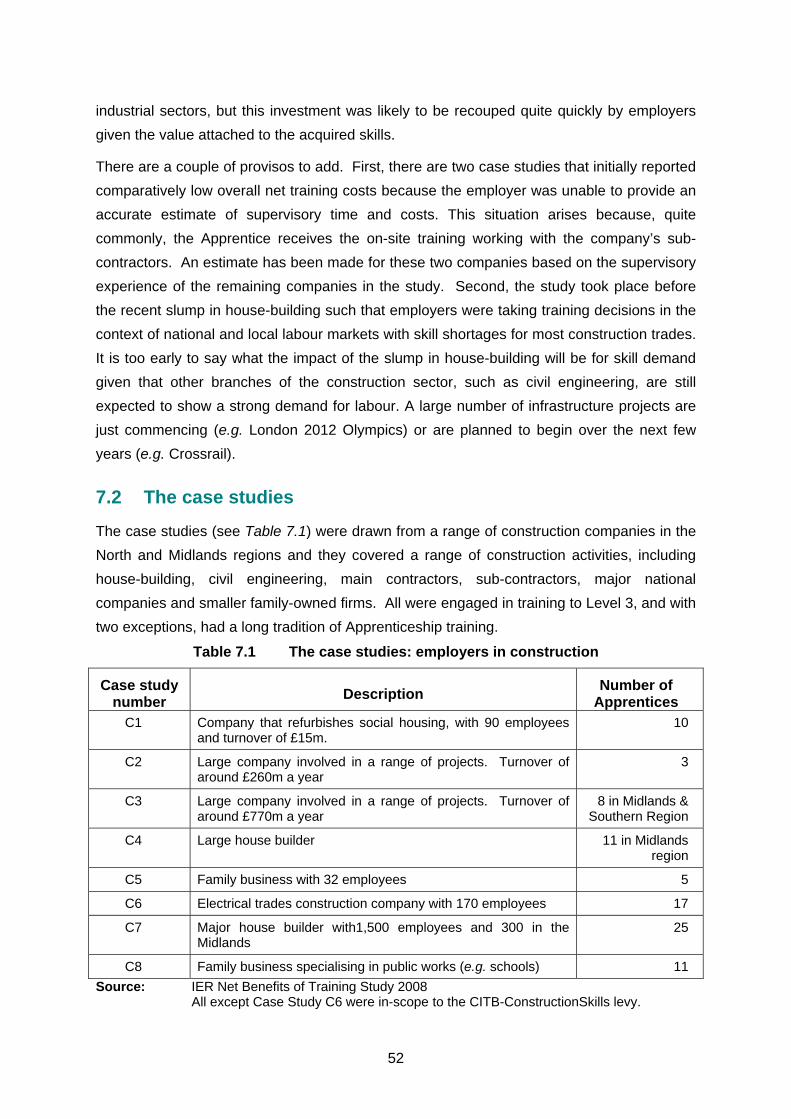
52
industrial sectors, but this investment was likely to be recouped quite quickly by employers given the value attached to the acquired skills.
There are a couple of provisos to add. First, there are two case studies that initially reported comparatively low overall net training costs because the employer was unable to provide an accurate estimate of supervisory time and costs. This situation arises because, quite commonly, the Apprentice receives the on-site training working with the company’s sub-contractors. An estimate has been made for these two companies based on the supervisory experience of the remaining companies in the study. Second, the study took place before the recent slump in house-building such that employers were taking training decisions in the context of national and local labour markets with skill shortages for most construction trades. It is too early to say what the impact of the slump in house-building will be for skill demand given that other branches of the construction sector, such as civil engineering, are still expected to show a strong demand for labour. A large number of infrastructure projects are just commencing (e.g. London 2012 Olympics) or are planned to begin over the next few years (e.g. Crossrail).
7.2 The case studies
The case studies (see Table 7.1) were drawn from a range of construction companies in the North and Midlands regions and they covered a range of construction activities, including house-building, civil engineering, main contractors, sub-contractors, major national companies and smaller family-owned firms. All were engaged in training to Level 3, and with two exceptions, had a long tradition of Apprenticeship training.
Table 7.1 The case studies: employers in construction
Case study number
Description Number of
Apprentices C1 Company that refurbishes social housing, with 90 employees
and turnover of £15m. 10
C2 Large company involved in a range of projects. Turnover of around £260m a year
3
C3 Large company involved in a range of projects. Turnover of around £770m a year
8 in Midlands & Southern Region
C4 Large house builder 11 in Midlands region
C5 Family business with 32 employees 5
C6 Electrical trades construction company with 170 employees 17
C7 Major house builder with1,500 employees and 300 in the Midlands
25
C8 Family business specialising in public works (e.g. schools) 11 Source: IER Net Benefits of Training Study 2008
All except Case Study C6 were in-scope to the CITB-ConstructionSkills levy.
53
7.3 Recruitment of Apprentices
Companies recruited Apprentices for a number of reasons:
• to recoup their levy payment; • to fulfil their own skill needs; • to help fulfil the skill needs of their main sub-contractors; • to ensure their workforce had Construction Skills Certification Scheme (CSCS) cards.
CSCS was set up to help the construction industry to improve quality and reduce accidents and CSCS cards are increasingly demanded as proof of occupational competence by contractors, public and private clients and others.
The companies were looking to recruit to the following trades:
• bricklaying; • carpentry; • painting and decorating; and • electrical trades;
In general, companies were looking to recruit 16-18 year olds, using contacts with schools, advertising on company websites, and informal methods (e.g. family connections) to attract applicants. Ideally, companies want applicants that have achieved at least three or more GCSEs at grade C or above but are willing to take on young people whose educational attainment is below this level if companies feel that they have the potential to complete a Level 3 Apprenticeship. The qualities companies were looking for in potential recruits included enthusiasm and motivation related to construction.
The recruitment process can be drawn out. Companies are keen to impress upon potential Apprentices what will be expected from them in completing their Apprenticeship and often family members are involved in the induction process so that they can help support the Apprentice through their training. In this way, drop-out from training is minimised.
Some companies reported that they had begun to experience significant difficulties with employing 16 and 17 year old trainees on sites where a marked tightening of health and safety procedures has severely restricted the productive role of these young Apprentices. In consequence, some companies, such as Case Study C6, were now looking to recruit from the 18 plus age group and considering restructuring their Apprenticeship programmes so that the school leavers complete two full years training in the college and only begin work on sites once they have reached age 18.
Demand for construction Apprenticeships usually far exceeds the available supply. Case Study C3 reported that it receives interest from 150 young people for the two Apprenticeship places they have on offer each year, and this is followed up by around 70 formal applications. This was typical across the case study companies.
54
7.4 The structure of training
The general pattern of training was for all trainees to be expected to achieve NVQ Level 3, and so Apprentices were expected to complete an advanced Apprenticeship from the commencement of their employment. Normally Apprentices attend college at the specialist training provider on one day a week throughout the three years of their training programme. Case Study C7 used one week residential blocs at the specialist college. Otherwise training is provided on-the-job, on-site. It should be noted that on-site training was frequently provided by sub-contractors rather than the Apprentice’s employer.
Upon completion of the Apprenticeship there was often scope for further progression. At Case Study C8, for example, Apprentices could continue to study for professional building qualifications in site management or quantity surveying. The company could point to members of the current management team as examples of people who had made the transition from craft workers to managers through obtaining professional level qualifications (NVQ Levels 4 and 5 or their equivalent).
The case study companies preferred Apprentices to achieve a Level 3 qualification. Case Study C4 explained that in the past this had been a problem. Apprentices sometimes chose not to progress from Level 2 to 3 because they could obtain immediate employment upon completion of the Level 2 (with their CSCS skills card). Other sub-contractors, who did not carry out any training but were desperate for craft skills, would offer relatively high rates of pay to the new trainees. As demand from sub-contractors had lessened over recent years, this was a less of a problem now.
In general, drop-out from the Apprenticeship programmes was not a problem with nearly all Apprentices going on to complete their Level 3. One company had hit upon a novel idea for encouraging completion: Apprentices were required to pay their own college fees in the first instance, but were reimbursed upon successful completion of each year of training.
Not every company subsequently directly employed Apprentices upon completion of the Apprenticeship but they were content for them to take-up employment with their principle sub-contractors. In this way the benefits to the company were retained so long as the relationship with the sub-contractor continued. It was, however, more usual for the Apprentice to be given direct employment with the company and in some instances the company guaranteed the Apprentice a job upon successful completion of their training.
7.5 The costs of training
Table 7.2 shows the average net costs of training across the case studies. There is limited opportunity in most construction companies to realise economies of scale from increasing the number of trainees, as all trainees typically receive their on-the-job training at individual
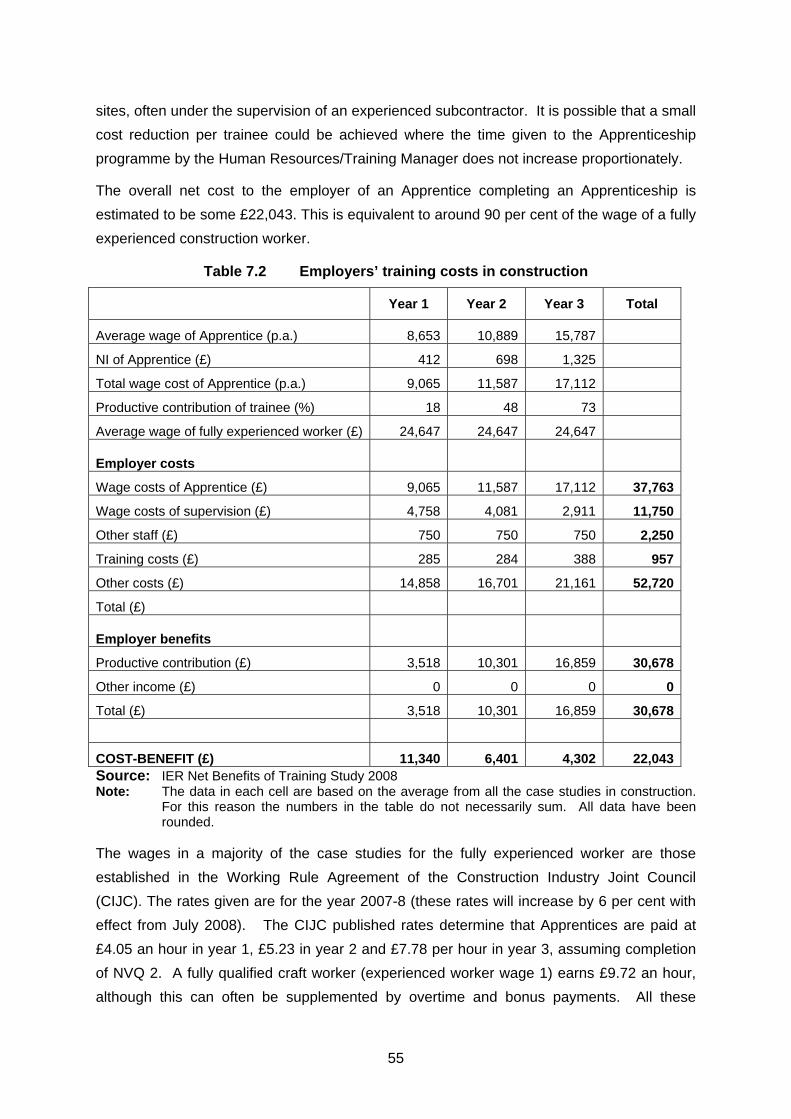
55
sites, often under the supervision of an experienced subcontractor. It is possible that a small cost reduction per trainee could be achieved where the time given to the Apprenticeship programme by the Human Resources/Training Manager does not increase proportionately.
The overall net cost to the employer of an Apprentice completing an Apprenticeship is estimated to be some £22,043. This is equivalent to around 90 per cent of the wage of a fully experienced construction worker.
Table 7.2 Employers’ training costs in construction
Year 1 Year 2 Year 3 Total
Average wage of Apprentice (p.a.) 8,653 10,889 15,787
NI of Apprentice (£) 412 698 1,325
Total wage cost of Apprentice (p.a.) 9,065 11,587 17,112
Productive contribution of trainee (%) 18 48 73
Average wage of fully experienced worker (£) 24,647 24,647 24,647
Employer costs
Wage costs of Apprentice (£) 9,065 11,587 17,112 37,763
Wage costs of supervision (£) 4,758 4,081 2,911 11,750
Other staff (£) 750 750 750 2,250
Training costs (£) 285 284 388 957
Other costs (£) 14,858 16,701 21,161 52,720
Total (£)
Employer benefits
Productive contribution (£) 3,518 10,301 16,859 30,678
Other income (£) 0 0 0 0
Total (£) 3,518 10,301 16,859 30,678
COST-BENEFIT (£) 11,340 6,401 4,302 22,043Source: IER Net Benefits of Training Study 2008 Note: The data in each cell are based on the average from all the case studies in construction.
For this reason the numbers in the table do not necessarily sum. All data have been rounded.
The wages in a majority of the case studies for the fully experienced worker are those established in the Working Rule Agreement of the Construction Industry Joint Council (CIJC). The rates given are for the year 2007-8 (these rates will increase by 6 per cent with effect from July 2008). The CIJC published rates determine that Apprentices are paid at £4.05 an hour in year 1, £5.23 in year 2 and £7.78 per hour in year 3, assuming completion of NVQ 2. A fully qualified craft worker (experienced worker wage 1) earns £9.72 an hour, although this can often be supplemented by overtime and bonus payments. All these

56
workers are paid for a 39 hour normal working week. The wages of more senior supervisory staff can vary across subcontracting firms but they tend to earn some 20 per cent more than the skilled craft worker.
On average, the supervisor will initially dedicate five hours of his weekly time to the first year Apprentice; this amount will decline as the Apprentice develops more skills in subsequent years of training. The training manager typically allocates about 12.5 per cent of his/her weekly time to all aspects of the Apprenticeship programme. This figure includes time for recruiting and selecting the first year trainees. Some case studies vary from these rates and it was notable that both Case Studies C7 and C8 appeared to incur higher costs because of additional levels of supervision the companies had put in place.
Employers’ national insurance contributions have been estimated at 12.8 per cent of the Apprentice wage above the threshold limit of £5,435. The training costs shown in Table 7.2 are the annual expense allowances that Apprentices can claim, mainly for travel to college and to site. Usually companies would not expect to pay their Apprentices any other costs, although occasionally Apprentices can earn bonuses or overtime payments.
Apprentice productivity is considered to be quite low in the first year with average Apprentice output yielding only just under 20 per cent of the fully experienced workers output. This percentage rises significantly in year 2 to just under 50 per cent and again in year 3 it increases further to about 75 per cent. Only when the Apprentice has achieved NVQ 3 will the productivity match that of an experienced craft worker.
7.6 Conclusion
Employers in the construction sector trained people for two principal reasons:
• to recoup levy payments; and • to ensure the supply of skilled workers.
In practice, there was little alternative to employers training people but where they did so there were significant benefits to the business. The training investment ensured that their business had the skills they required, and that their supply chain of sub-contractors was also suitably qualified. Moreover, the insistence that workers have a CSCS card also meant that there were significant potential contracts to be obtained providing staff were suitably skilled and qualified. Although employers incurred a considerable amount of expenditure training Apprentices, they were able to recoup this within a short-space of time – usually within two years of the Apprentice taking up employment as a fully trained worker with them. Training investment was seen as critical for the individual companies and their sub-contractors to improve skill retention.

57
8. THE BENEFITS OF APPRENTICESHIP
8.1 Investing in Apprenticeship training
So far the evidence presented in this report has focussed on the estimation of the net cost of undertaking Apprenticeship training. As has been shown, those costs can be substantial even after the productive contribution of Apprentices during training is taken into account. Employers are unlikely to incur such costs unless they believe such training will bring benefits to their business (although many respondents did say that they were motivated in part by a sense of “returning something to the community”, a desire to help young people get on in the labour market or a responsibility to contribute to the pool of skills in their industry). This chapter examines the longer-term benefits that accrue from Apprenticeship training.
Assessing the benefits of Apprenticeships to employers is superficially easy. Case study employers were only too willing to set out in qualitative terms the benefits that they believed they would get from Apprenticeship. A great deal of such qualitative evidence was collected during the case study interviews. Quantifying such benefits in a manner that allows the value of future benefits to be set against the net cost of Apprenticeships is another matter entirely. Respondents were seldom able to provide the data from which such quantitative estimates of the value of future benefits could be established.
In the light of respondents inability to quantify and value the benefits of Apprenticeship this chapter deals with the issue in two ways. First, a simple assessment is made of the time required to payback the investment made by the employer. The payback period is a crude but not uncommon technique used in investment appraisal. The method for this is explained below. Second, the qualitative evidence of benefits is considered with examples from selected case study interviews where employers were specific about the benefits they derived from Apprenticeships.
8.2 An approach to measuring benefits
One way of assessing the benefits of training is to consider the time taken to pay back the investment. To give an indication of the payback period, the following approach has been used. First, a net present value (NPV) of an Apprentice is calculated by summing the future benefits derived by the business from employing an ex-Apprentice (denoted by S) and then, second, deducting the net costs of training Apprentices from that NPV. Since the benefits (S) occur in the future they must be discounted by some discount rate (r) to a present value.

58
The calculation can be expressed as follows:
t=n
NPV of Apprenticeship = Σ[S1/(1+r) + S2/(1+r)2 + S3/(1+r)3 …+ Sn/(1+r)n] – C0 t=1
where Sn is the value of the Apprentice at time 1, 2, 3, …..n (n is the number of time periods), r is the discount rate and C0 is the cost of the Apprenticeship.
Much of the information required to estimate the NPV was not collected by the case study interviews so that the full value of the investment in Apprenticeships is impossible to establish. The appraisal framework can, however, still be used to assess the investment by asking how long would it take for the employer to have paid back their investment (that is, how many periods of employment must pass for the NPV of benefits to equal or exceed the net cost of training).
Referring back to Figure 1.1 in Chapter 1 suggests that employers will recoup their investment in training by paying a wage to experienced workers that is somewhat less than their marginal productivity. The size of such a gap in practice is hard to establish as this is a relatively under-research topic but, in a comparatively rare investigation of this issue, Dearden, Reed and Van Reenen (2000, 2005) found that training has tended to raise the wage by around half of the increase in productivity brought about by training. In other words, the value of the productivity gain from training tends to be shared equally between worker and employers. It is this difference that enables employers to bear the cost of training and yields a return on their investment. If this were the case for the case study businesses covered by this study then the ‘return’ to Apprenticeships would amount to half of the difference between the productivity of an unskilled worker and the fully experienced worker.
Establishing the productivity gain from training in the case study businesses is complicated by the absence of data on the wage of an unskilled employee. Data was collected relating to the wages of Apprentices and this might be used as a proxy measure for the unskilled wage (since employers would have to offer something akin to unskilled wages in order to retain Apprentices). Alternatively, the average productivity gap between Apprentices and experienced workers might provide a guide to the magnitude of the productivity gains. While neither is likely to be a perfect measure there is a notable similarity between the Apprentice wage as a proportion of the experienced worker wage and the productivity difference between the two. For instance, in the engineering case studies the average productivity of an Apprentice was estimated as being around 45 per cent of that of the experienced worker while Apprentice wages averaged around 49 per cent of the wages of experienced workers. Similarly, Apprentices in the hospitality case studies averaged 82 per cent of the productivity of experienced hospitality workers and were on average 80 per cent productive.
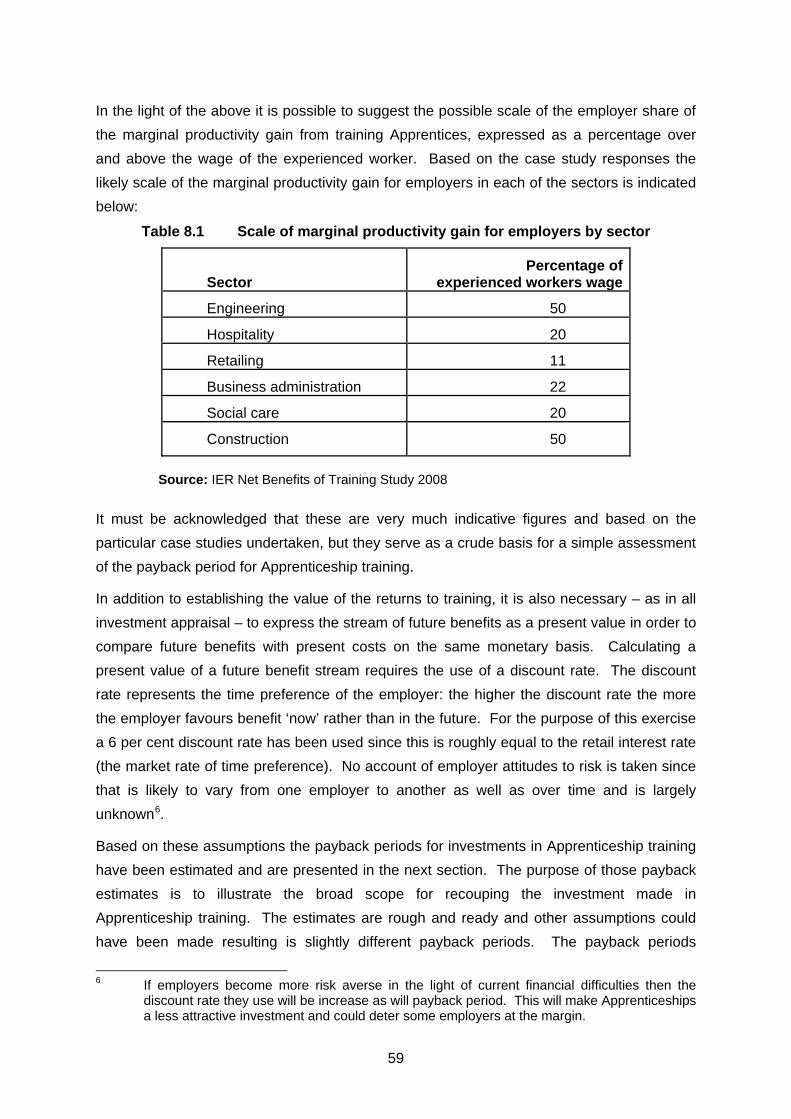
59
In the light of the above it is possible to suggest the possible scale of the employer share of the marginal productivity gain from training Apprentices, expressed as a percentage over and above the wage of the experienced worker. Based on the case study responses the likely scale of the marginal productivity gain for employers in each of the sectors is indicated below:
Table 8.1 Scale of marginal productivity gain for employers by sector
Sector
Percentage of experienced workers wage
Engineering 50
Hospitality 20
Retailing 11
Business administration 22
Social care 20
Construction 50
Source: IER Net Benefits of Training Study 2008
It must be acknowledged that these are very much indicative figures and based on the particular case studies undertaken, but they serve as a crude basis for a simple assessment of the payback period for Apprenticeship training.
In addition to establishing the value of the returns to training, it is also necessary – as in all investment appraisal – to express the stream of future benefits as a present value in order to compare future benefits with present costs on the same monetary basis. Calculating a present value of a future benefit stream requires the use of a discount rate. The discount rate represents the time preference of the employer: the higher the discount rate the more the employer favours benefit ‘now’ rather than in the future. For the purpose of this exercise a 6 per cent discount rate has been used since this is roughly equal to the retail interest rate (the market rate of time preference). No account of employer attitudes to risk is taken since that is likely to vary from one employer to another as well as over time and is largely unknown6.
Based on these assumptions the payback periods for investments in Apprenticeship training have been estimated and are presented in the next section. The purpose of those payback estimates is to illustrate the broad scope for recouping the investment made in Apprenticeship training. The estimates are rough and ready and other assumptions could have been made resulting is slightly different payback periods. The payback periods
6 If employers become more risk averse in the light of current financial difficulties then the
discount rate they use will be increase as will payback period. This will make Apprenticeships a less attractive investment and could deter some employers at the margin.
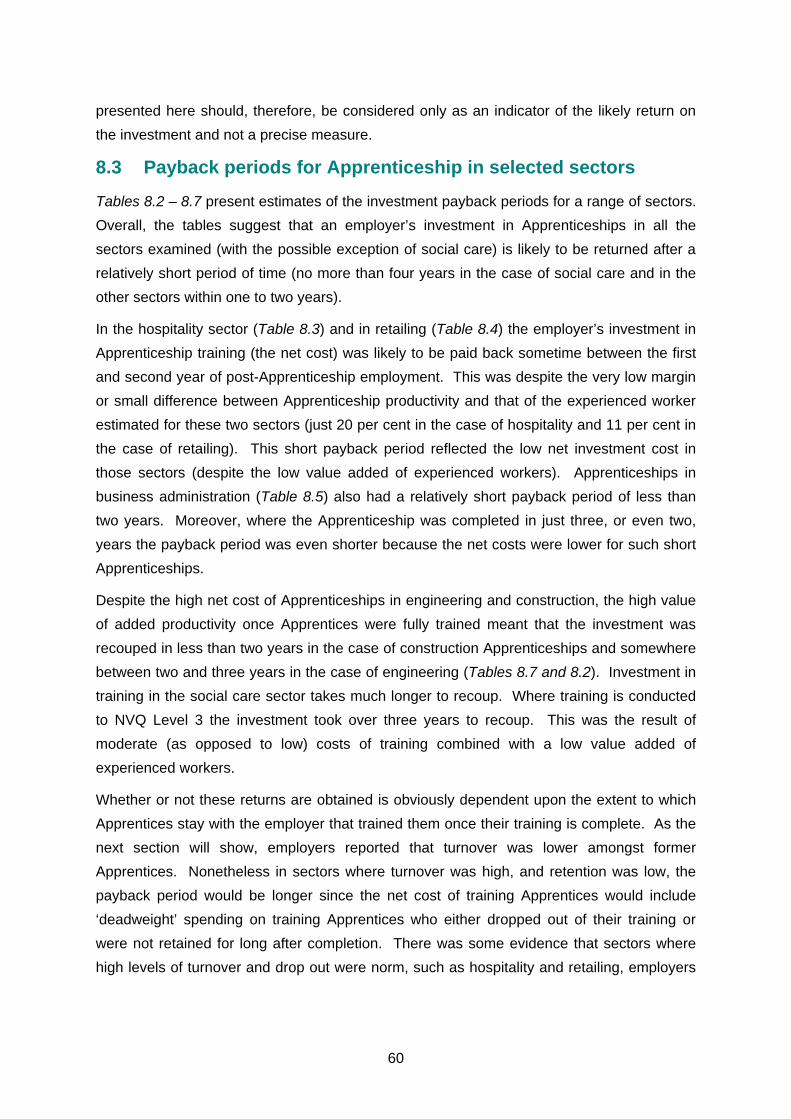
60
presented here should, therefore, be considered only as an indicator of the likely return on the investment and not a precise measure.
8.3 Payback periods for Apprenticeship in selected sectors
Tables 8.2 – 8.7 present estimates of the investment payback periods for a range of sectors. Overall, the tables suggest that an employer’s investment in Apprenticeships in all the sectors examined (with the possible exception of social care) is likely to be returned after a relatively short period of time (no more than four years in the case of social care and in the other sectors within one to two years).
In the hospitality sector (Table 8.3) and in retailing (Table 8.4) the employer’s investment in Apprenticeship training (the net cost) was likely to be paid back sometime between the first and second year of post-Apprenticeship employment. This was despite the very low margin or small difference between Apprenticeship productivity and that of the experienced worker estimated for these two sectors (just 20 per cent in the case of hospitality and 11 per cent in the case of retailing). This short payback period reflected the low net investment cost in those sectors (despite the low value added of experienced workers). Apprenticeships in business administration (Table 8.5) also had a relatively short payback period of less than two years. Moreover, where the Apprenticeship was completed in just three, or even two, years the payback period was even shorter because the net costs were lower for such short Apprenticeships.
Despite the high net cost of Apprenticeships in engineering and construction, the high value of added productivity once Apprentices were fully trained meant that the investment was recouped in less than two years in the case of construction Apprenticeships and somewhere between two and three years in the case of engineering (Tables 8.7 and 8.2). Investment in training in the social care sector takes much longer to recoup. Where training is conducted to NVQ Level 3 the investment took over three years to recoup. This was the result of moderate (as opposed to low) costs of training combined with a low value added of experienced workers.
Whether or not these returns are obtained is obviously dependent upon the extent to which Apprentices stay with the employer that trained them once their training is complete. As the next section will show, employers reported that turnover was lower amongst former Apprentices. Nonetheless in sectors where turnover was high, and retention was low, the payback period would be longer since the net cost of training Apprentices would include ‘deadweight’ spending on training Apprentices who either dropped out of their training or were not retained for long after completion. There was some evidence that sectors where high levels of turnover and drop out were norm, such as hospitality and retailing, employers

61
had become sanguine about such an eventuality, even if unhappy about it, as this quotation suggests:
‘Even if we took on an Apprentice or a trainee that worked with us for a year-and-a-half or two years, and then he went to London, and a lot of them do want to go to London to get more experience, and he went to one of our hotels in London, that’s good benefit, isn’t it. We’ve kept him. … If they go to another company, it’s heartbreak, but if they do go to London, at least if we’ve had two years out of him and another of our hotels has him. You can’t stop people going. Things do change’
(Human Resources Manager at Case Study H5)

62
Table 8.2 Payback period for an Apprenticeship in engineering
Yr 1 Yr 2 Yr 3 Yr 4 Yr 5
Wage of Apprentice as experienced worker 23,008 23,008 23008 23008 23008
Employer share of additional productivity (% of exp. worker wage) 0.5
Discount /interest rate (e.g. 10%=0.1) 0.06
Total net cost of training an Apprentice 28,762
Value of additional productivity 11,504 11,504 11504 11504 11504
PV of additional productivity 10,853 10,239 9659 9112 8596
Cumulative value of additional productivity 10,853 21,091 30750 39863 48459
Value of cumulative additional productivity less cost of training -17,909 -7,671 1988 11101 19697
Source: IER Net Benefits of Training Study 2008
Table 8.3 Payback period for an Apprenticeship in hospitality
Yr 1 Yr 2 Yr 3 Yr 4 Yr 5
Wage of Apprentice as experienced worker 14,495 14,495 14495 14495 14495
Employer share of additional productivity (% of exp. worker wage) 0.2
Discount /interest rate (e.g. 10%=0.1) 0.06
Total net cost of training an Apprentice 4,236
Value of additional productivity 2,899 2,899 2899 2899 2899
PV of additional productivity 2,735 2,580 2434 2296 2166
Cumulative value of additional productivity 2,735 5,315 7749 10045 12212
Value of cumulative additional productivity less cost of training -1,501 1,079 3513 5809 7976
Source: IER Net Benefits of Training Study 2008
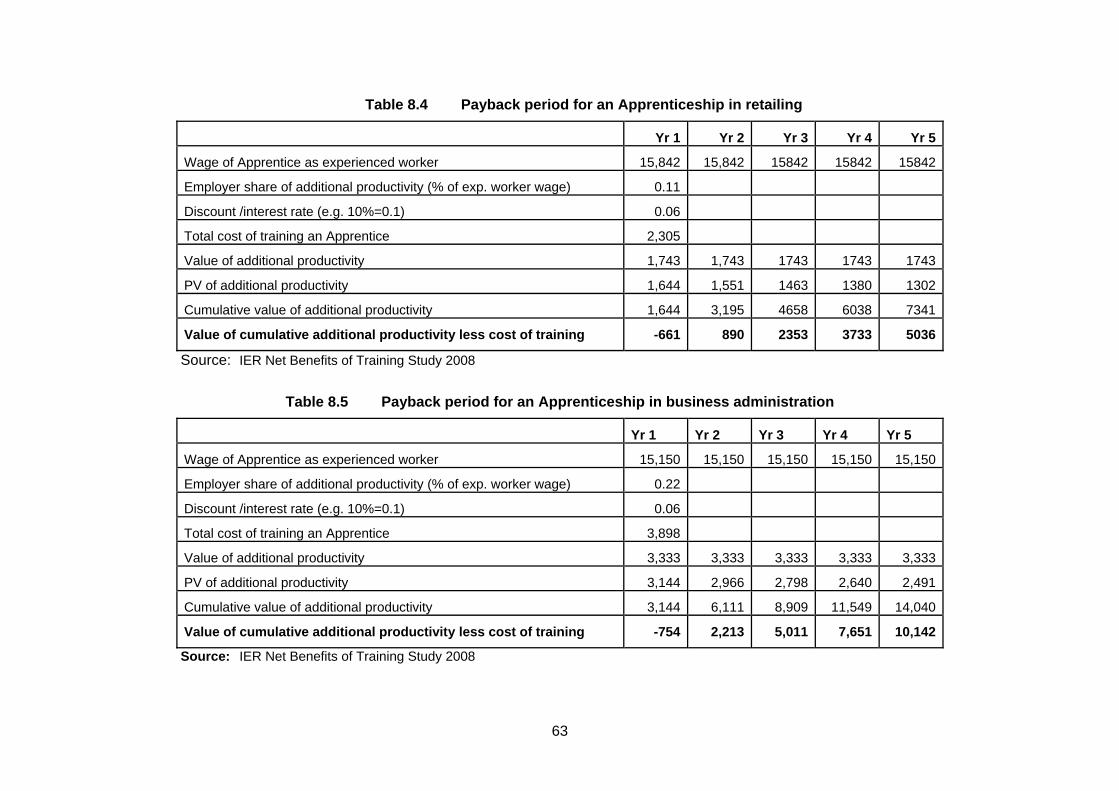
63
Table 8.4 Payback period for an Apprenticeship in retailing
Yr 1 Yr 2 Yr 3 Yr 4 Yr 5
Wage of Apprentice as experienced worker 15,842 15,842 15842 15842 15842
Employer share of additional productivity (% of exp. worker wage) 0.11
Discount /interest rate (e.g. 10%=0.1) 0.06
Total cost of training an Apprentice 2,305
Value of additional productivity 1,743 1,743 1743 1743 1743
PV of additional productivity 1,644 1,551 1463 1380 1302
Cumulative value of additional productivity 1,644 3,195 4658 6038 7341
Value of cumulative additional productivity less cost of training -661 890 2353 3733 5036
Source: IER Net Benefits of Training Study 2008
Table 8.5 Payback period for an Apprenticeship in business administration
Yr 1 Yr 2 Yr 3 Yr 4 Yr 5
Wage of Apprentice as experienced worker 15,150 15,150 15,150 15,150 15,150
Employer share of additional productivity (% of exp. worker wage) 0.22
Discount /interest rate (e.g. 10%=0.1) 0.06
Total cost of training an Apprentice 3,898
Value of additional productivity 3,333 3,333 3,333 3,333 3,333
PV of additional productivity 3,144 2,966 2,798 2,640 2,491
Cumulative value of additional productivity 3,144 6,111 8,909 11,549 14,040
Value of cumulative additional productivity less cost of training -754 2,213 5,011 7,651 10,142
Source: IER Net Benefits of Training Study 2008
64
Table 8.6 Payback periods for an Apprenticeship in social care
Yr 1 Yr 2 Yr 3 Yr 4 Yr 5
Wage of Apprentice as experienced worker 11,830 11,830 11830 11830 11830
Employer share of additional productivity (% of exp. worker wage) 0.2
Enter the discount /interest rate (e.g. 10%=0.1) 0.06
Total cost of training an Apprentice 7,743
Value of additional productivity 2,366 2,366 2366 2366 2366
PV of additional productivity 2,232 2,106 1987 1874 1768
Cumulative value of additional productivity 2,232 4,338 6324 8198 9966
Value of cumulative additional productivity less cost of training -5,511 -3,405 -1419 455 2223
Source: IER Net Benefits of Training Study 2008
Table 8.7 Payback periods for an Apprenticeship in construction
Yr 1 Yr 2 Yr 3 Yr 4 Yr 5
Wage of Apprentice as experienced worker 24,647 24,647 24647 24647 24647
Employer share of additional productivity (% of exp. worker wage) 0.5
Enter the discount /interest rate (e.g. 10%=0.1) 0.06
Total cost of training an Apprentice 22,043
Value of additional productivity 12,323.5 12,323.5 12323.5 12323.5 12323.5
PV of additional productivity 11,626 10,968 10347 9761 9209
Cumulative value of additional productivity 11,626 22,594 32941 42702 51911
Value of cumulative additional productivity less cost of training -10,417 55,1 10898 20659 29868
Source: IER Net Benefits of Training Study 2008
65
It is important to note that turnover and drop out was not reported to any significant degree by case study respondents, even in those sectors that are reputed to suffer from high turnover. This does not mean that drop out (and the associated cost to employers) was not important but it may mean that the case study sample was biased towards employers who offered ‘good Apprenticeships’ and retained their trainees. Good employers are more likely to be observed with an Apprentice in place than employers who do not offer attractive Apprenticeships, experience high levels of drop out and therefore will often be observed as having no Apprentices.
8.4 Other benefits from Apprenticeships
When interviewed case study employers identified a wide range of benefits from Apprenticeship training. While such qualitative assessments of benefits are difficult to value they are nonetheless real and are the fundamental reason why employers were prepared to invest in Apprenticeship training. A wide range of benefits were mentioned (although some were more important in some sectors than others). The benefits of Apprenticeships included the following:
i. they allowed the business to secure a supply of people with the skills and qualities that the business required and which were often not available on the external job market;
ii. they helped secure a supply of skilled young recruits was especially important for the replacement of an ageing workforce;
iii. even if external recruitment was possible, Apprenticeships were less expensive to recruit and train than experienced workers hired on the external labour market because of high recruitment costs plus the costs of induction and any necessary training;
iv. Apprenticeships contributed to a pool of skilled and certificated employees for the sector from which a company might recruit in the future;
v. they ensured that the supply-chain (i.e. sub-contractors) had a sufficiently skilled workforce;
vi. Apprentices tend to stay with the organisation and labour turnover was lower;
vii. Apprentices provided a cadre of employees from which to future managers could be selected;
viii. Apprenticeship training could increase interest in training amongst other employees;
ix. Apprenticeships demonstrated company’s commitment to the employee;
x. Apprenticeships were more practical and job-related than other forms of learning;
xi. Apprentices can bring new ideas and innovation to the business;
xii. a good Apprenticeship scheme could be reflected in an enhanced reputation for the business both within the industry and in the local community...
Case Study C6 in the construction sector was illustrative of the benefits conferred on the organisation by Apprenticeships:

66
Case Study C6 Electrical Contractor This company must continue to train if it is to produce the labour skills it needs for its core business. For several years now, the external labour market for skilled electricians has been very tight and the company cannot depend on external recruitment to meet all its labour requirements. Many of its trained Apprentices continue to work for the company after they complete their training (all are guaranteed jobs upon completing training). Often when those who have completed their training do leave the company’s direct employment they re-emerge as self-employed subcontractors and continue to work for the company but under an indirect working arrangement. Several of the company’s current managers are the product of its Apprenticeship programme.
Source: IER Net Benefits of Training Study 2008
Engineering Case Study E4 provided a similar explanation of the benefits of Apprenticeships:
Case Study E4: Manufacturer of Breathing Equipment
Unlike some of the other case study establishments, the company has relatively recently commenced with Apprenticeships - 10 years ago - when it found it difficult to recruit experienced setters capable of using the latest technologies. Since then they have taken on, on average, two Apprentices a year. They have a 100 per cent completion rate and no drop-out.
Due to the Apprenticeship scheme the establishment could point to approximately 50 per cent of all setters in the machine shop being company Apprentices, and others have gone on to higher levels within the company: one, for example, is currently studying for a B.Eng and another has moved into a supervisory position in quality control. Only one former Apprentice has left the company in the past 10 years. No Apprentice has achieved management status but this is only because the Apprenticeship programme has not been running long enough and it is expected that in future managers will be recruited from the cadre Apprentices.
In addition, the company invests in Apprenticeships because the local labour market is relatively weak with few suitably qualified and skilled people. In a weak labour market the Apprenticeship scheme allows the wage structure to remain in place (i.e. they do not have to pay a premium to attract skilled people which would eventually affect pay differentials in the establishment). The company Apprenticeship scheme also ensures that the training of young people meets the needs of the business and that employees possess the values of the company.
Source: IER Net Benefits of Training Study 2008

67
Engineering Case Study E3 similarly identified many of the benefits cited above:
Case Study E3: Manufacturer of Pumps
The company takes on Apprentices because the costs of not doing so are considered to be high. It needs skilled people to produce its range of products and these skills are difficult to find in the local labour market (with low levels of unemployment and several similar companies looking for the same skills). The company also reports that its own Apprentices are better steeped in the traditions of the company, are less likely to leave, and provide a pool form which future managers can be recruited.
The company also want to control its wage bill in a market that is in decline but where the company has an increasing share of the market. It finds it especially difficult to recruit design engineers. The company wants to control wage-inflation by paying the median wage for engineers in the area. By enticing Apprentices into the company – and being able to demonstrate to them the benefits of working for the company, such as stable employment – the company hopes to avoid facing strong pressures to increase its wage for, in this instance, design engineers by bringing in Apprentices.
Looking back at previous cohorts of Apprentices the company reports that it had the following retention rates of those completing in the following years:
2001-2005 cohort – 2, Apprentices, both still with the company 2002-2006 cohort – 2 Apprentices out of 4 stayed with the company 2003-2007 cohort – 2 Apprentices out of 3 stayed with the company 2004-2008 cohort – 3 Apprentices out of 3 stayed with the company
The establishment can also point to lots of examples of progression from Apprenticeships. Currently, the Director of Purchasing (with 40 people reporting to him), the Engineering Manager (60), and the Facilities Manager (30) are all former Apprentices in the company. In addition, there are many people in the business who have obtained a degree after completing their Apprenticeship, especially in product design. The company grants day-release to two local HE centres or block release if someone is especially talented.
Source: IER Net Benefits of Training Study 2008
In social care the benefits of Apprenticeship training were seen mainly in terms of improving service quality. Below are two relatively examples of how individual social care organisations viewed the benefits of the training:
Case Study S2 Care Home
Training changes attitudes (staff are more caring, more considerate) and work practice (skills improve as they are taught how to do it properly and the teamwork benefits as everybody has a got a good knowledge base). Training was thus considered to have a positive impact on the quality of work and customer satisfaction. Furthermore, a qualified workforce enhances the reputation among residents and prospective clients and is valued by the Commission for Social Care Inspection. Access to NVQs also facilitates staff recruitment.
Case Study S4 Care Home
Training ensures that standards of care are being met. It helps staff to develop their confidence. It contributes to their job satisfaction which will positively impact on the quality of the care provided and the residents’ levels of satisfaction. Training supports staff development and facilitates retention as staff can develop further within the organisation by moving on to different job roles.
Source: IER Net Benefits of Training Study 2008
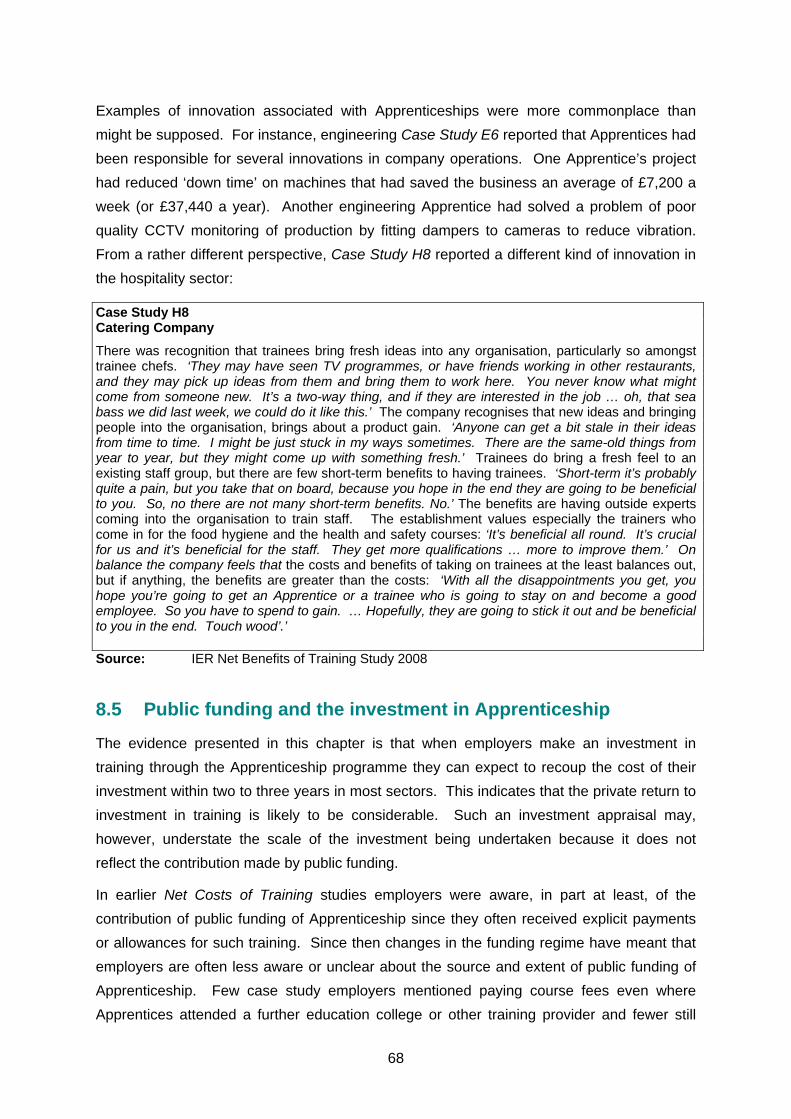
68
Examples of innovation associated with Apprenticeships were more commonplace than might be supposed. For instance, engineering Case Study E6 reported that Apprentices had been responsible for several innovations in company operations. One Apprentice’s project had reduced ‘down time’ on machines that had saved the business an average of £7,200 a week (or £37,440 a year). Another engineering Apprentice had solved a problem of poor quality CCTV monitoring of production by fitting dampers to cameras to reduce vibration. From a rather different perspective, Case Study H8 reported a different kind of innovation in the hospitality sector:
Case Study H8 Catering Company
There was recognition that trainees bring fresh ideas into any organisation, particularly so amongst trainee chefs. ‘They may have seen TV programmes, or have friends working in other restaurants, and they may pick up ideas from them and bring them to work here. You never know what might come from someone new. It’s a two-way thing, and if they are interested in the job … oh, that sea bass we did last week, we could do it like this.’ The company recognises that new ideas and bringing people into the organisation, brings about a product gain. ‘Anyone can get a bit stale in their ideas from time to time. I might be just stuck in my ways sometimes. There are the same-old things from year to year, but they might come up with something fresh.’ Trainees do bring a fresh feel to an existing staff group, but there are few short-term benefits to having trainees. ‘Short-term it’s probably quite a pain, but you take that on board, because you hope in the end they are going to be beneficial to you. So, no there are not many short-term benefits. No.’ The benefits are having outside experts coming into the organisation to train staff. The establishment values especially the trainers who come in for the food hygiene and the health and safety courses: ‘It’s beneficial all round. It’s crucial for us and it’s beneficial for the staff. They get more qualifications … more to improve them.’ On balance the company feels that the costs and benefits of taking on trainees at the least balances out, but if anything, the benefits are greater than the costs: ‘With all the disappointments you get, you hope you’re going to get an Apprentice or a trainee who is going to stay on and become a good employee. So you have to spend to gain. … Hopefully, they are going to stick it out and be beneficial to you in the end. Touch wood’.’ Source: IER Net Benefits of Training Study 2008
8.5 Public funding and the investment in Apprenticeship
The evidence presented in this chapter is that when employers make an investment in training through the Apprenticeship programme they can expect to recoup the cost of their investment within two to three years in most sectors. This indicates that the private return to investment in training is likely to be considerable. Such an investment appraisal may, however, understate the scale of the investment being undertaken because it does not reflect the contribution made by public funding.
In earlier Net Costs of Training studies employers were aware, in part at least, of the contribution of public funding of Apprenticeship since they often received explicit payments or allowances for such training. Since then changes in the funding regime have meant that employers are often less aware or unclear about the source and extent of public funding of Apprenticeship. Few case study employers mentioned paying course fees even where Apprentices attended a further education college or other training provider and fewer still
69
mentioned being in receipt of any form of training grant. The Net Cost telephone survey found that 63 per cent of employers contacted in engineering or retailing reported no direct training costs (course fees, assessor fees etc.) even though virtually all Apprenticeships involve at least some off-the-job training. Similarly, only 35 per cent of employers reported receiving any form of external funding for training from any source. Even where employers in the survey were aware of public funding, most were very unclear about the source of such public funding. Only a minority could identify the source of funding as the Learning and Skills Council while others thought, more vaguely, the source was ‘the government’.
Because of the lack of awareness of the form and scale of public funding amongst many of the case study employers, it is not possible to estimate the contribution such public funding made to those businesses directly from their interview responses. An alternative approach is to make such estimates indirectly using the funding rates for training published by the Learning and Skills Council (Learning and Skills Council, 2007). This is not, however, straightforward, as there are five different models for delivering Apprenticeships, ranging from situations where an employer sends Apprentices off-site for all their training and sees none of the funding (as it goes directly to the off site trainer), through mixed funding, to employers that deliver all their training in-house and receive all the public funding. This, clearly, was one of the reasons for the varied responses of case study employers.
In addition to different delivery models, the funding rates applicable to any specific Apprentice will depend on their age, the specific framework in which they are training, the level of NVQ and whether they complete the Apprenticeship. It is evident, therefore, that to establish the extent of the public contribution to the case study employers requires not only knowledge of the delivery model being used but also very specific information about individual Apprentices. The case studies were never designed to collect such specific information about individual Apprentices. For that reason it is not feasible to estimate the precise public contribution to case study employers’ investment in Apprentices in this instance (although any future study could collect the necessary information).
Despite the inability of this study to provide robust estimates of the value of public funding to individual case study employers, it is still important to have some indication of the contribution that the state makes towards the cost of employers’ investment in Apprenticeships. With the caveats discussed above in mind, Table 8.8 provides an indication of the scale of that public contribution together with the case study estimates of the private cost of an Apprentice for comparison. The funding rates shown relate to Apprentices who are 16-18 years old and distinguish between the funding of the NVQ qualification alone and total funding that consists of the funding of the NVQ, the technical certificate and key skills. It should also be noted that there is more than one possible and allowed combination of NVQ, technical certificate and key skills and the figures presented

70
here are based on the most common or typical combination of these three elements7. In the case of the hospitality sector where there are three pathways to Apprenticeship (funded at different rates) the funding rates cited relate to the food processing pathway, partly because that was a commonly encountered pathway in the case studies and because it is in the middle of the funding range.
Table 8.8 Private and public funding of Apprenticeships
Level of public funding (£)2
Framework Level Total private cost to the employer (£)1
NVQ only Total funding3
Engineering 3 28,762 6,481 (L2)
+6,638 (L3) = 13,119
19,690 (L3)
Hospitality 2 4,236 3,682 4,020
Retail 2 2,305 3,303 4,197
2 884 3,191 3,529 Business Administration 3 3,898 3,835 5,523
Social Care 2 5,209 3,635 5,145
Construction 3 22,043 5,838 (L2)
+ 4,850 (L3) = 10,688
15,167
1 Cost estimated on the basis of case study data. 2 Funding rates for 16-18 year olds. 3 Total funding comprises funding for NVQ plus technical certificate and key skills. Source: IER Net Benefits of Training Study 2008
Table 8.8 demonstrates just how large a contribution is made by public funding to the overall cost of investing in Apprenticeships. It must be stressed, again, that the numbers in the two public funding columns in Table 8.8 are not strictly comparable with the private costs shown for employers since the funding rates shown relate to 16-18 year olds only and a specific combination of NVQ, technical certificate and key skills whereas the private employer costs are an average across all Apprentices in the case study employers (with no account taken of the age of the Apprentice or model of delivery). Despite this incompatibility it is clear that there is a substantial public contribution being made towards the cost of investing in Apprenticeships with, very broadly speaking, employers and the state in partnership to share the cost of such training.
7 More information about the costs of delivering Apprenticeships can be obtained at: http://aci.lsc.gov.uk/overview/ .

71
9. CONCLUSIONS
9.1 Introduction
The IER’s Net Costs of Training studies have, since the mid 1990s, provided detailed estimates of the costs borne by employers in delivering training to NVQ Levels 2 and 3 under programmes that are now collectively referred to as Apprenticeship. The studies have fully captured the employer’s investment in training and provided evidence of the benefits that result. This study – a further contribution to the Net Costs of Training series – builds upon previous studies to quantitatively estimate the returns obtained by employers from their investment in Apprenticeships and, in doing so, suggests a win-win situation for employers: the acquisition of much needed skilled people with an affinity to the employer that trained them at a cost that is quickly recouped.
The overall aim of this study was to provide a detailed assessment of the gross and net costs and benefits to employers of providing Apprenticeship training to NVQ Level 2 and Level 3, and indicate some of the longer-term benefits to the employer from engaging in Apprenticeships. In short, if Apprenticeship is viewed as an investment, how much of an investment is the employer willing to make and how quickly can that investment be recouped.
The study provides:
• estimates of the costs in each year of the Apprenticeship; • the structure of training being offered; • an assessment of the scale of public funding of Apprenticeship; • an assessment of the impact of Apprenticeship on labour retention and recruitment; • an assessment of the relative productivity of the fully experienced worker trained via
employers’ Apprenticeship schemes compared to fully experienced workers recruited externally;
• an estimate of the payback period over which employers recoup their investment in Apprenticeship training.
Previous studies have indicated that employers engage in Apprenticeship training because they perceive long-term benefits from doing so, especially where the net costs of training to the end of the Apprenticeship are relatively high. Previous Net Costs studies have alluded to these findings, and they were very much to the fore in the Apprenticeship Task Force study “Employing Apprentices: the Business Case”.
The evidence for the study was drawn from a large number of case studies across six industrial sectors. The use of case studies followed the method used in earlier IER studies of the net cost of Apprenticeship. As part of the study a telephone survey was conducted
72
covering 102 employers in engineering and retailing to test the feasibility of conducting similar net cost studies using a telephone survey approach. While the survey was successful in generating basic information about businesses and their Apprentices, it proved difficult, if not impossible, to fully capture the detail and, at times, subtle nuances of the costs and benefits of Apprenticeship by that means. The way that Apprenticeships were delivered differed significantly across employers (even in the same sector) and a structured questionnaire had difficulty capturing such variation. In some instances employers were covered by the telephone survey and the case studies and it was possible to compare the data from each. Generally, the telephone survey tended to overstate the costs of Apprenticeship and understate the benefits. For the time being, it would seem that the case study method remains superior to that of a telephone survey for the purposes of the study.
9.2 Key messages
The evidence from the study highlights the following key messages.
• Training an Apprentice in engineering is relatively expensive compared to other sectors (£28762, on average, in the case studies) but such costs must be set against the potential benefits of training. The engineering case studies indicate that the employer’s investment is, on average, paid back within two years. More importantly, the evidence points to significant benefits to employers from investing in Apprenticeships through lower labour turnover, a better fit between the skills possessed by employees and the skills required by the company, and some control over skill-shortages potentially pushing up wage rates. There is also evidence of Apprentices bring innovation into workplaces.
• the cost of investing in Apprenticeship training in the hospitality sector is more modest in comparison and likely to be quickly recouped by employers. The average cost of a completed Apprenticeship in the hospitality sector case studies was £4,236. The main problems for employers relate to recruitment of young people to begin Apprenticeships and retention of Apprentices once they have completed their training.
• Apprenticeships in retail tend to be of short duration and mostly involve on-the-job training. The combination of low supervision costs and high productivity during the training period result in a net cost that is low compared to more traditional Apprenticeships. The average net cost across retail case studies of £2,305. At the lower end of the net cost range were some retail establishments for which Apprenticeships were virtually costless.
• Apprenticeships in business administration varied in the way that such Apprentices were delivered and the time taken to complete. Achieving an NVQ Level 3 Apprenticeship could take between two and four years depending upon the employer concerned. NVQs at Level 2 could be achieved in 12-15 months or sometimes less.
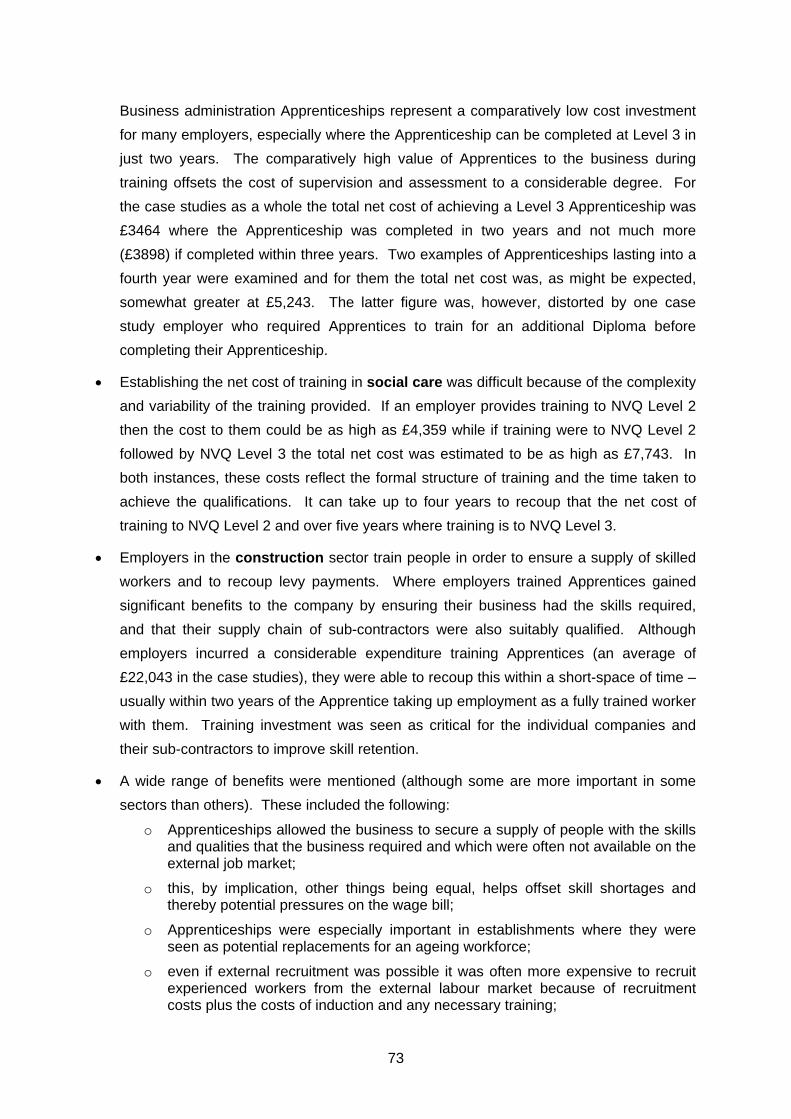
73
Business administration Apprenticeships represent a comparatively low cost investment for many employers, especially where the Apprenticeship can be completed at Level 3 in just two years. The comparatively high value of Apprentices to the business during training offsets the cost of supervision and assessment to a considerable degree. For the case studies as a whole the total net cost of achieving a Level 3 Apprenticeship was £3464 where the Apprenticeship was completed in two years and not much more (£3898) if completed within three years. Two examples of Apprenticeships lasting into a fourth year were examined and for them the total net cost was, as might be expected, somewhat greater at £5,243. The latter figure was, however, distorted by one case study employer who required Apprentices to train for an additional Diploma before completing their Apprenticeship.
• Establishing the net cost of training in social care was difficult because of the complexity and variability of the training provided. If an employer provides training to NVQ Level 2 then the cost to them could be as high as £4,359 while if training were to NVQ Level 2 followed by NVQ Level 3 the total net cost was estimated to be as high as £7,743. In both instances, these costs reflect the formal structure of training and the time taken to achieve the qualifications. It can take up to four years to recoup that the net cost of training to NVQ Level 2 and over five years where training is to NVQ Level 3.
• Employers in the construction sector train people in order to ensure a supply of skilled workers and to recoup levy payments. Where employers trained Apprentices gained significant benefits to the company by ensuring their business had the skills required, and that their supply chain of sub-contractors were also suitably qualified. Although employers incurred a considerable expenditure training Apprentices (an average of £22,043 in the case studies), they were able to recoup this within a short-space of time – usually within two years of the Apprentice taking up employment as a fully trained worker with them. Training investment was seen as critical for the individual companies and their sub-contractors to improve skill retention.
• A wide range of benefits were mentioned (although some are more important in some sectors than others). These included the following:
o Apprenticeships allowed the business to secure a supply of people with the skills and qualities that the business required and which were often not available on the external job market;
o this, by implication, other things being equal, helps offset skill shortages and thereby potential pressures on the wage bill;
o Apprenticeships were especially important in establishments where they were seen as potential replacements for an ageing workforce;
o even if external recruitment was possible it was often more expensive to recruit experienced workers from the external labour market because of recruitment costs plus the costs of induction and any necessary training;
74
o by training Apprentices the business contributed to the pool of skilled and certificated employees from which it might recruit in the future;
o Apprentices ensured that the supply-chain (i.e. sub-contractors) had a sufficiently skilled workforce;
o lower labour turnover – Apprentices tend to stay with the organisation;
o Apprentices provided a cadre of employees from which to future managers will be selected;
o Apprenticeship training could increase interest in training amongst other employees;
o shows company commitment to the employee;
o Apprenticeships were more practical and job-related than other forms of learning;
o Apprentices can bring new ideas and innovation to the business;
o a good Apprenticeship scheme could be reflected in an enhanced reputation for the business both within the industry and in the local community.
• Case study employers appeared largely unaware of the source or extent of public financial support for Apprenticeships, as such funding was often delivered through training providers and not directly to employers. For that reason it was not possible to measure directly the public funding received by those employers. An alternative, indirect approach using LSC funding rates to estimate the public funding received by case study employers was also difficult because the case studies did not collect the full range of information about delivery models used, or the characteristics of individual Apprentices that would enable such an estimation to be made. Nonetheless, setting the net cost of case study employers alongside LSC funding rates, while not strictly comparable, does highlight the substantial public investment that takes place in support of employers’ investment in Apprenticeships with, broadly speaking, the costs being shared by the employer and the state.
Overall, the evidence points to employers obtaining a range of qualitative benefits, as highlighted above, from the Apprenticeship training in which they invest, but importantly that investment is recouped in monetary terms within two to three years in most instances. If the employer can retain the Apprentice for a few years they will obtain a positive return on their investment and, moreover, if they view Apprenticeship as an investment then they will want to protect it by putting in place, as many employers do, those practices that will help retain Apprentices over the period of training and beyond. For the employer that appropriately husbands their investment in Apprenticeships there are significant returns to be had. This report provides the most concrete evidence to date to demonstrate this key point.

75
10. REFERENCES
Dearden L., Reed H. and Van Reenen J. (2000), Who Gains when Workers Train? Training and Corporate Productivity in a panel of British industries, Institute of Fiscal Studies, http://www.ifs.org.uk/wps/wp0004.pdf.
Dearden L., Reed H. and Van Reenen J. (2005), The Impact of Training on Productivity and Wages: Evidence from British Panel Data, Centre for Economic Performance
Discussion Paper No 674, London School of Economics, http://cep.lse.ac.uk/pubs/download/dp0674.pdf
Deloittes Haskins and Sells/IFF (1988) Training in Britain: Employers' Activities, London, HMSO.
Fuller, A. and L. Unwin (2007) ‘What Counts as Good Practice in Contemporary Apprenticeships? Evidence from Two Sectors in England’, Education and Training, Vol.49, No.2
Hasluck, C. and T. Hogarth (1997), Modern Apprenticeships: Survey of Employers, Department for Employment, HMSO.
Hogarth, T, G. Siora, G. Briscoe, and C. Hasluck (1996), The Net Costs of Training to Employers, Department for Employment Research Series, HMSO.
Hogarth, T., and C. Hasluck (2003) The Net Costs of Training to Employers: Apprenticeships, Department for Education and Employment Research Series, Sheffield.
Hogarth, T., C.Hasluck, and W.W. Daniel (2005) Apprenticeships: The Business Case, Modern Apprenticeship Task Force, London.
Hogarth, T., A. Brown, M. de Hoyos, and R.A. Wilson (2008) Initial Vocational Education and Training in Europe: Comparative Report, CEDEFOP, Thessaloniki.
House of Lords (2007) Apprenticeship: a key route to skills: Volume I - Report, House of Lords Select Committee on Economic Affairs, London, TSO.
IFF Research (2000) Modern Apprenticeships: Exploring the Reasons for Non-completion in Five Sectors, Department for Education and Employment, Research Report No.217, Sheffield
Learning and Skills Council (2007), Funding Rates – Changes for 2007/08, Publication reference LSC-P-NAT-070012, Coventry, January.
McIntosh, S. (2007) A Cost-Benefit Analysis of Apprenticeships and Other Vocational Qualifications, Department for Education and Skills Research Paper RR834, Sheffield.
Ryan, P. H. Gospel, and P. Lewis (2006), ‘Educational and Contractual Attributes of the Apprenticeship Programmes of Large Employers in Britain’ Journal of Vocational Education and Training, Vol. 58., No.3.
Thomas, B. , Moxon, J. , and Jones J.A.G. (1969) 'A Cost-Benefit Analysis of Industrial Training', British Journal of lndustrial Relations, Vol XII, pp. 231-264; 1. Jones (1986) 'Apprenticeship Training Costs in British Manufacturing Establishments' British Journal of Industrial Relations, Vol XXIV, pp338- 350.

76

77
ANNEX A Topic guide for case study interviews

78
___
IER : ‘APPRENTICESHIPS: NET COSTS OF TRAINING TO EMPLOYERS’ SEMI-STRUCTURED INTERVIEW SCHEDULE : SPRING/SUMMER 2008
___ ___ 1. BACKGROUND ON ORGANIZATION This section looks at the general characteristics of the organization, including:
i) the nature of the organization’s business / what the organization does ii) the size of the organization / the number of sites, etc. iii) how long the organization has been established iv) the number of employees / proportion of full and part-time employees v) the range of job types
2. ORGANIZATIONAL BUSINESS AND HR STRATEGY
This section seeks information on the organization’s activity and business
environment, including:
i) the organization’s business markets
ii) approximate annual financial turnover iii) current business strategies iv) general staff turnover / job areas for highest and lowest turnover v) staff retention characteristics / job areas for most and least difficult retention
3. TRAINING IN THE ORGANIZATION
This section looks at the need for, and priority of, training in the organization.
i) what are the skills’ needs in the organization ii) to what extent are the skills’ needs changing over time iii) how / in what ways is training important in meeting these needs iv) why has the organization chosen to be involved with Apprenticeships in particular v) who is involved in the Apprenticeship training programme:
- internal: e.g. the training department / at director level / line staff level / HR support level
- external: e.g. funding bodies / colleges / professional institutes or bodies / independent moderators

79
4. BACKGROUND ON THE APPRENTICES This section looks at the general characteristics and working context of the
organization’s Apprentices.
i) how many Apprentices are currently in the organization ii) what are the entry requirements to traineeship; e.g. age, qualifications iii) in which departments of the organization do the trainees work iv) stage by stage in the training programme, what do the trainees do v) what proportion of their time is spent in the workplace and elsewhere, e.g. in
college vi) what jobs do they do / what is their job content vii) how important are these work roles to the organization viii) what is the duration of the Apprenticeship training programme(s) ix) to what qualification level are they working - NVQ II / III x) do the trainees have contracts; do they receive staff benefits; if so, what are
these xi) do they have a guarantee of employment; do they get promotion after training xii) were / are the Apprentices easy or difficult to recruit; why xiii) How much management time is tied up trying to recruit Apprentices.
5. FUNDING OF MODERN APPRENTICESHIP SCHEME IN THE ORGANIZATION This is a key section of the interview: This section seeks information on the funding for the Apprentices during their training
in the organization.
i) how is the Apprentices’ training funded - from which sources; both outside and inside the organization - amount of funding for each Apprentice for each year of training
ii) who manages the budget for the Apprentices’ training iii) what elements of the training are costed
6. TRAINING COSTS FOR THE ORGANIZATION This is a key section of the interview: This section seeks information on the costs to the organization of having Apprentices in
the organization.
i) what is the amount of wages paid to each Apprentice for each year of training ii) what are the employer’s NI contributions iii) what are the costs of in-house supervision to the Apprentices for each year of
training: - line staff: who / prop. of time spent / salary - training officer or manager: who exactly / prop. of time spent / salary - supervisor: who / prop. of time spent / salary - other
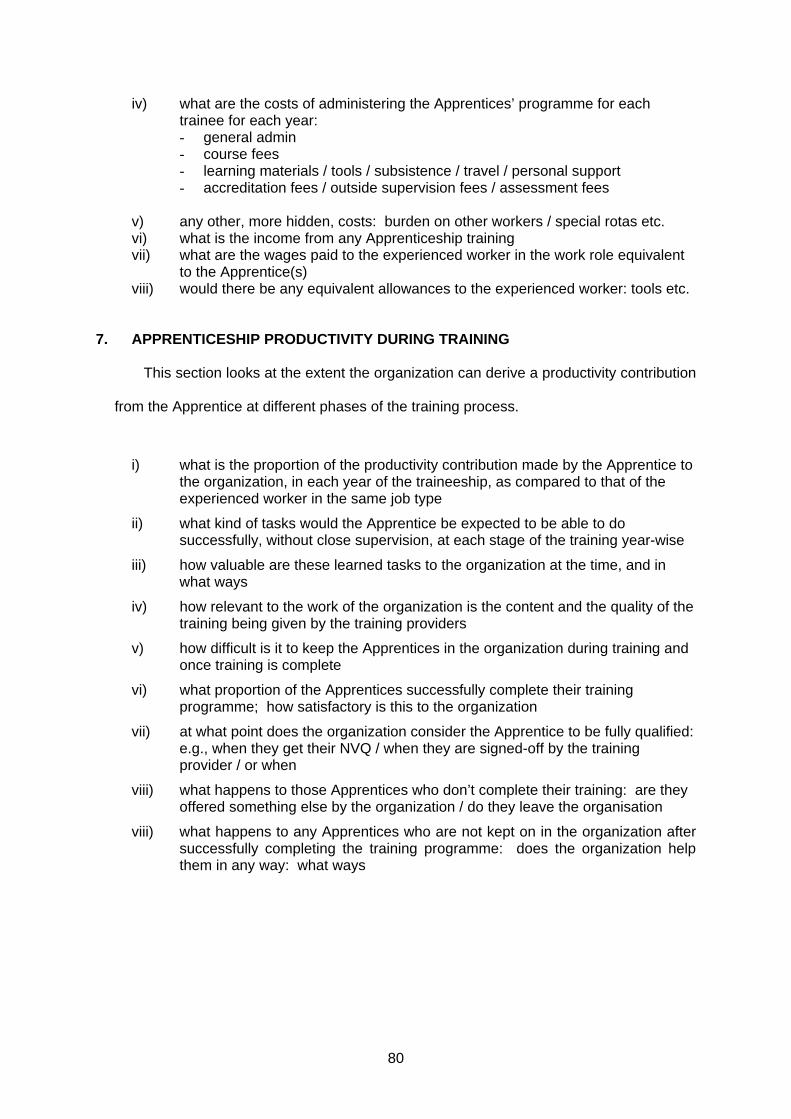
80
iv) what are the costs of administering the Apprentices’ programme for each trainee for each year: - general admin - course fees - learning materials / tools / subsistence / travel / personal support - accreditation fees / outside supervision fees / assessment fees
v) any other, more hidden, costs: burden on other workers / special rotas etc. vi) what is the income from any Apprenticeship training vii) what are the wages paid to the experienced worker in the work role equivalent
to the Apprentice(s) viii) would there be any equivalent allowances to the experienced worker: tools etc.
7. APPRENTICESHIP PRODUCTIVITY DURING TRAINING
This section looks at the extent the organization can derive a productivity contribution
from the Apprentice at different phases of the training process.
i) what is the proportion of the productivity contribution made by the Apprentice to
the organization, in each year of the traineeship, as compared to that of the experienced worker in the same job type
ii) what kind of tasks would the Apprentice be expected to be able to do successfully, without close supervision, at each stage of the training year-wise
iii) how valuable are these learned tasks to the organization at the time, and in what ways
iv) how relevant to the work of the organization is the content and the quality of the training being given by the training providers
v) how difficult is it to keep the Apprentices in the organization during training and once training is complete
vi) what proportion of the Apprentices successfully complete their training programme; how satisfactory is this to the organization
vii) at what point does the organization consider the Apprentice to be fully qualified: e.g., when they get their NVQ / when they are signed-off by the training provider / or when
viii) what happens to those Apprentices who don’t complete their training: are they offered something else by the organization / do they leave the organisation
viii) what happens to any Apprentices who are not kept on in the organization after successfully completing the training programme: does the organization help them in any way: what ways

81
8. BENEFITS OF TRAINING TO THE ORGANIZATION
This section looks at the benefits to the organization of taking-on Apprentices, both in the long and short term.
i) what are the benefits derived by the organization: e.g.:
- retention of staff / skills - positive effect on business / product gain - upgrading of skills all round - higher staff morale / motivation - maintenance of ages’ mix throughout the staffing group - invasion of fresh ideas from outside the organization
ii) what are the short term and the long term benefits to the organization iii) do the Apprentices bring new ideas / innovation into the organization, however
small: if so, what iv) are there any other spin-offs / wider benefits for the organization: e.g. having
outside training experts on the premises v) do the benefits and costs balance roughly: does one side outweigh the other
ANY OTHER COMMENTS Ends CAJ/8.04.08

82

83
ANNEX B Report on the net cost telephone survey

84
The net cost of Apprenticeship telephone survey Introduction Previous studies in the Net Costs series have used a case study method for collecting data on the costs and benefits of training. Such case studies have taken the form of in-depth interviews with one or more respondents in case study businesses, often preceded by providing the respondent with a datasheet indicating the type of data required (so that the respondent could prepare for the interview). Such a method is expensive and the samples consequently small. More fundamentally, such case studies do not provide a large, representative sample from which it is possible to generalise findings to industries or employers in general. As part of the current Net Costs project a feasibility study was conducted to see if it was possible to collect the required information in a different manner, using a telephone survey interview using a structured questionnaire. If successful, such an approach might be more cost effective than the case study approach and thus permit larger and representative samples to be interviewed. The telephone survey The scope of survey The Telephone survey was conducted by IFF Research on behalf of IER. The sample source for the survey was the National Employers Skills Survey (NESS07) commissioned by the LSC with DIUS and the then SSDA. NESS07 involved interviews with just over 79,000 establishments across England with fieldwork taking place during April to July 2007. A sub-sample of NESS07 employers was drawn where the employer:
• had agreed at the end of the NESS07 interview to be contacted again for further research;
• was in the Retail or Engineering sector as defined by SIC 2007; and • who answered:
o Yes to ‘Currently or over the last 12 months have you had any staff from this establishment undertaking Apprenticeships or Advanced Apprenticeships for which you or a training provider receive government funding?’
OR o One or more to ‘How many of these 16 to 24s, if any, were recruited [over
the last 12 months] to start an Apprenticeship or Advanced Apprenticeship for which you or a training provider receive government funding?’
From the total NESS07 sample, just 450 employers fitted these criteria. Before the main stage of interviewing, a small scale pilot was conducted (on 13 March 2008) to check and refine the questionnaire. The final questionnaire is provided at the end of this Annex. The main stage of fieldwork took place from 19 March to 10 April 2008, with all interviews conducted from IFF’s telephone centre in London. All respondents were sent a letter before the fieldwork explaining the nature of the study, and also listing the areas where data would be required. The average interview length was just over 20 minutes. Achieved sample and response rates: A total of 102 telephone interviews were achieved for the study. All were among retail or engineering / manufacturing employers with current Apprentices in either retail or in engineering, production or manufacturing frameworks at their establishment. Response rates were as follows:

85
Total Engineering Retail
Starting sample 450 164 286
Refusal 40 15 25
Ineligible – no current Apprentices 213 58 155
Ineligible – no Apprentices in relevant frameworks - - -
Withdrawn as called 12+ times and unlikely to yield interview 75 29 46
Still ‘live’ at the end of fieldwork 20 12 8
Quit mid-interview - - -
Interview 102 50 52
Source: IER Net Benefits of Training Study 2008
By the end of the fieldwork the survey faced considerable difficulty in achieving the initial targets of 50 interviews in each of Engineering and Retail, and by that point the remaining sample had been called on multiple (12 or more occasions). It was notable that despite the relatively currency of the NESS07 sub-sample many employers (56%) indicated that they had no current Apprentices. The characteristics of employers with Apprentices The number of Apprentices and frameworks within each business varied across the sample. Around half had only 5 or fewer Apprentices (Table B1). Roughly half of the sample covered Apprenticeships at Level 2 but many of these offered the prospect of Level 3 (Table B2).
Table B1: Number of Apprentices by sector
Number of Apprentices
Engineering or manufacturing Retail Total
1-5 35 49 846-10 8 0 811-24 8 1 925-49 1 0 1All 52 50 102
Source: IER Net Benefits of Training Study 2008
Table B2: Level of Apprenticeship
Level of first Apprenticeship Engineering or manufacturing Retail Total
NVQ level 2 15 21 36NVQ level 2 currently but will be going on to NVQ level 3 13 11 24
NVQ level 3 22 8 30Other (Please specify) 0 2 2Don't know 2 8 10All 52 50 102
Source: IER Net Benefits of Training Study 2008

86
Detailed information on one framework Respondents were asked to provide detailed information about one framework. A substantial proportion of respondents only had one framework to report but where the employer had Apprentices on more than one framework, the great majority reported on the first framework mentioned. Length and level of Apprenticeship
The length of Apprenticeships varied, from just six months to around five years (Table B3). Apprenticeships in the retail sector tended to be short with the majority (28 out of 50) being no more than one year in length. Engineering or manufacturing Apprenticeships were generally longer and two, three or four years were the norm.
Table B3: Average length of Apprenticeship
Average length of Apprenticeship Engineering or manufacturing Retail Total
Six months 0 8 8One year 1 20 21One and a half years (More than a year less that 2) 1 5 6
Two years 9 6 15Two and a half years (More than 2 years less that 3) 0 2 2
Three years 11 6 17Three and a half years (More than 3 years less that 4) 2 2 4
Four years 27 0 27More than four years 1 1 2 52 50 102
Source: IER Net Benefits of Training Study 2008 Table B4 shows the level of qualification associated with the Apprenticeships for which employers provided detailed information. Apprenticeships in engineering or manufacturing were tending to be aimed at achieving NVQ Level 3 qualifications, ultimately if not immediately. While many Apprenticeships in the retail sector also aimed for NVQ Level 3, a larger number were aimed only at NVQ Level 2 with no indication that such a qualification was a stepping stone to a higher level of qualification.
Table B4: Level of Apprenticeship by sector
Level of Apprenticeship Engineering or manufacturing Retail Total
NVQ level 2 13 22 35NVQ level 2 currently but will be go to NVQ level 3 15 11 26
NVQ level 3 23 8 31Other 0 2 2Don’t know 1 7 8All 52 50 102
Source: IER Net Benefits of Training Study 2008
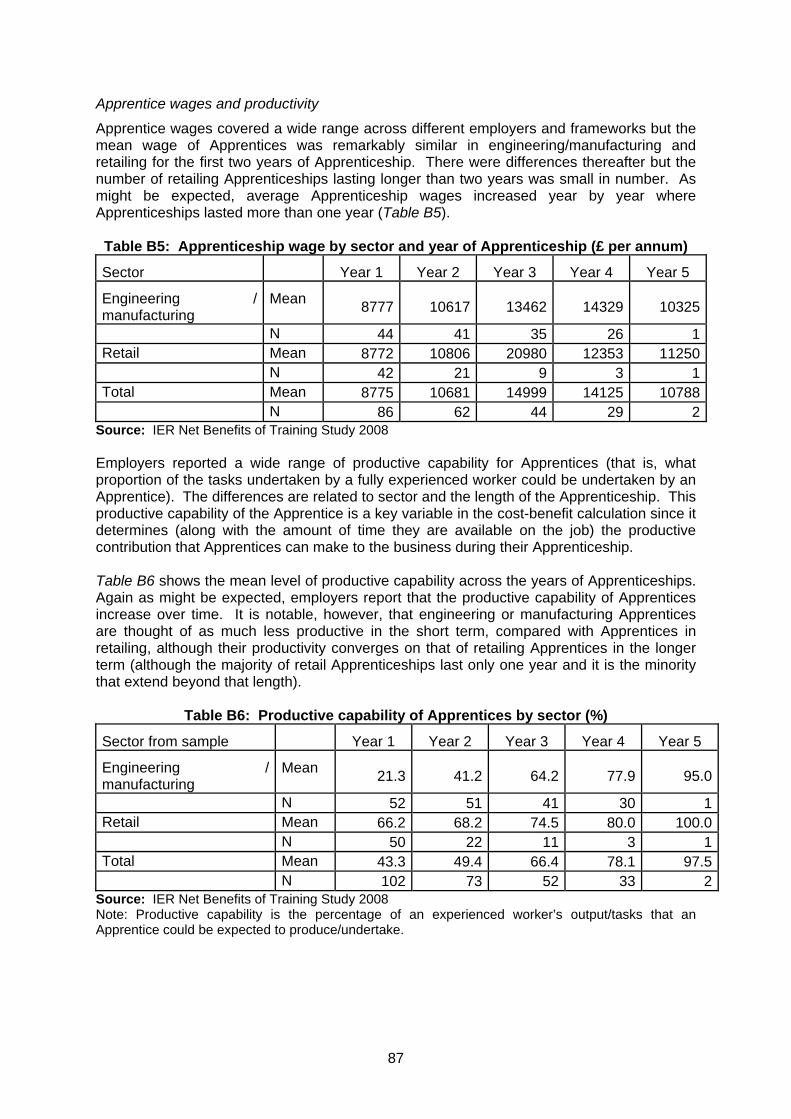
87
Apprentice wages and productivity
Apprentice wages covered a wide range across different employers and frameworks but the mean wage of Apprentices was remarkably similar in engineering/manufacturing and retailing for the first two years of Apprenticeship. There were differences thereafter but the number of retailing Apprenticeships lasting longer than two years was small in number. As might be expected, average Apprenticeship wages increased year by year where Apprenticeships lasted more than one year (Table B5).
Table B5: Apprenticeship wage by sector and year of Apprenticeship (£ per annum)
Sector Year 1 Year 2 Year 3 Year 4 Year 5
Engineering / manufacturing
Mean 8777 10617 13462 14329 10325
N 44 41 35 26 1Retail Mean 8772 10806 20980 12353 11250 N 42 21 9 3 1Total Mean 8775 10681 14999 14125 10788 N 86 62 44 29 2
Source: IER Net Benefits of Training Study 2008 Employers reported a wide range of productive capability for Apprentices (that is, what proportion of the tasks undertaken by a fully experienced worker could be undertaken by an Apprentice). The differences are related to sector and the length of the Apprenticeship. This productive capability of the Apprentice is a key variable in the cost-benefit calculation since it determines (along with the amount of time they are available on the job) the productive contribution that Apprentices can make to the business during their Apprenticeship. Table B6 shows the mean level of productive capability across the years of Apprenticeships. Again as might be expected, employers report that the productive capability of Apprentices increase over time. It is notable, however, that engineering or manufacturing Apprentices are thought of as much less productive in the short term, compared with Apprentices in retailing, although their productivity converges on that of retailing Apprentices in the longer term (although the majority of retail Apprenticeships last only one year and it is the minority that extend beyond that length).
Table B6: Productive capability of Apprentices by sector (%)
Sector from sample Year 1 Year 2 Year 3 Year 4 Year 5
Engineering / manufacturing
Mean 21.3 41.2 64.2 77.9 95.0
N 52 51 41 30 1Retail Mean 66.2 68.2 74.5 80.0 100.0 N 50 22 11 3 1Total Mean 43.3 49.4 66.4 78.1 97.5 N 102 73 52 33 2
Source: IER Net Benefits of Training Study 2008 Note: Productive capability is the percentage of an experienced worker’s output/tasks that an Apprentice could be expected to produce/undertake.
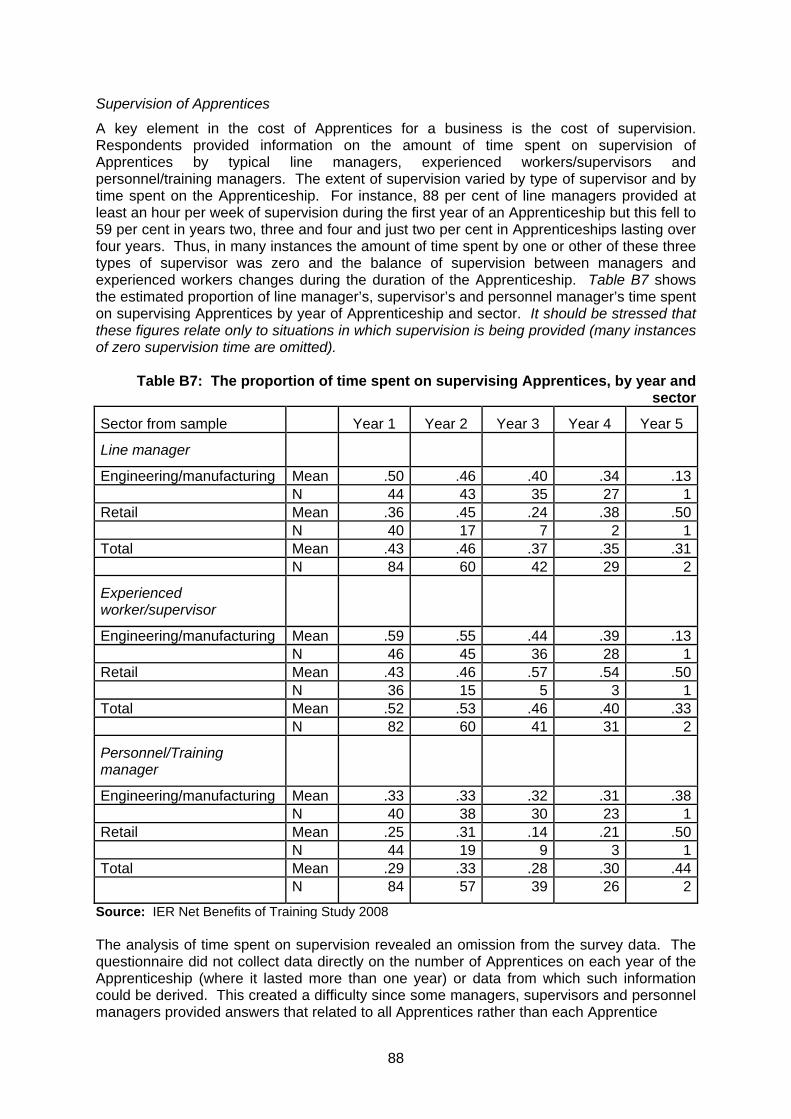
88
Supervision of Apprentices
A key element in the cost of Apprentices for a business is the cost of supervision. Respondents provided information on the amount of time spent on supervision of Apprentices by typical line managers, experienced workers/supervisors and personnel/training managers. The extent of supervision varied by type of supervisor and by time spent on the Apprenticeship. For instance, 88 per cent of line managers provided at least an hour per week of supervision during the first year of an Apprenticeship but this fell to 59 per cent in years two, three and four and just two per cent in Apprenticeships lasting over four years. Thus, in many instances the amount of time spent by one or other of these three types of supervisor was zero and the balance of supervision between managers and experienced workers changes during the duration of the Apprenticeship. Table B7 shows the estimated proportion of line manager’s, supervisor’s and personnel manager’s time spent on supervising Apprentices by year of Apprenticeship and sector. It should be stressed that these figures relate only to situations in which supervision is being provided (many instances of zero supervision time are omitted).
Table B7: The proportion of time spent on supervising Apprentices, by year and sector
Sector from sample Year 1 Year 2 Year 3 Year 4 Year 5
Line manager
Engineering/manufacturing Mean .50 .46 .40 .34 .13 N 44 43 35 27 1Retail Mean .36 .45 .24 .38 .50 N 40 17 7 2 1Total Mean .43 .46 .37 .35 .31 N 84 60 42 29 2
Experienced worker/supervisor
Engineering/manufacturing Mean .59 .55 .44 .39 .13 N 46 45 36 28 1Retail Mean .43 .46 .57 .54 .50 N 36 15 5 3 1Total Mean .52 .53 .46 .40 .33 N 82 60 41 31 2
Personnel/Training manager
Engineering/manufacturing Mean .33 .33 .32 .31 .38 N 40 38 30 23 1Retail Mean .25 .31 .14 .21 .50 N 44 19 9 3 1Total Mean .29 .33 .28 .30 .44 N 84 57 39 26 2
Source: IER Net Benefits of Training Study 2008 The analysis of time spent on supervision revealed an omission from the survey data. The questionnaire did not collect data directly on the number of Apprentices on each year of the Apprenticeship (where it lasted more than one year) or data from which such information could be derived. This created a difficulty since some managers, supervisors and personnel managers provided answers that related to all Apprentices rather than each Apprentice
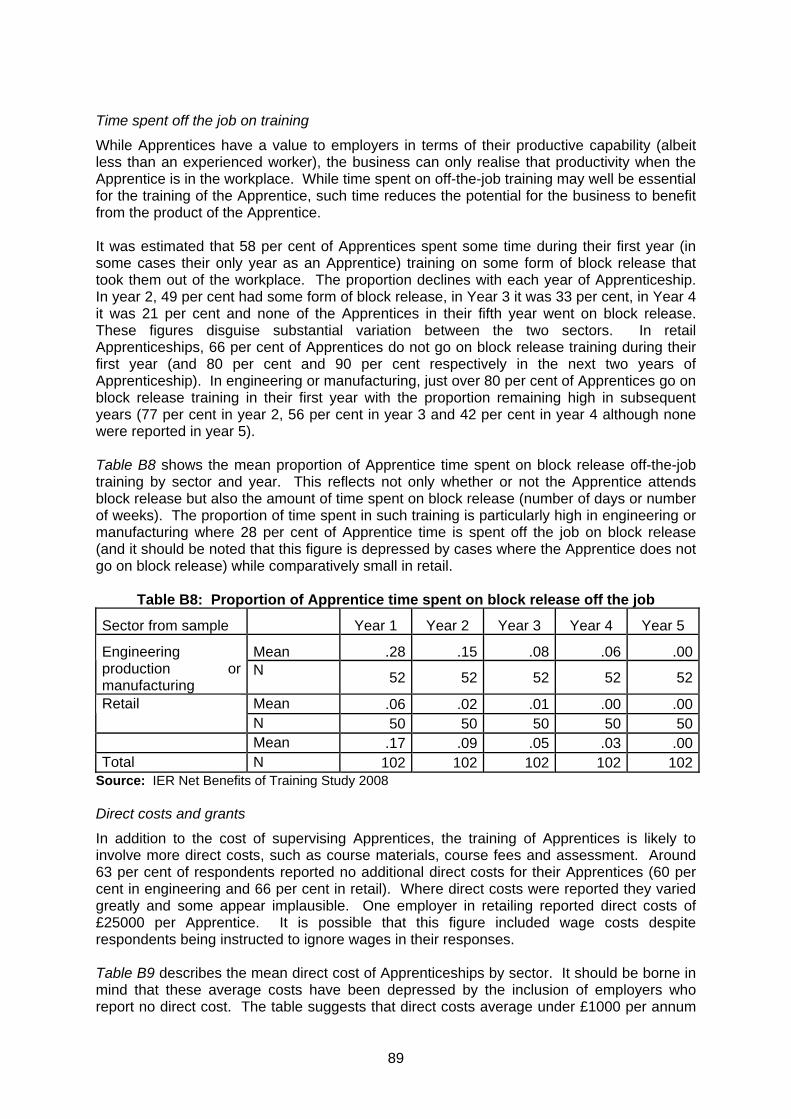
89
Time spent off the job on training
While Apprentices have a value to employers in terms of their productive capability (albeit less than an experienced worker), the business can only realise that productivity when the Apprentice is in the workplace. While time spent on off-the-job training may well be essential for the training of the Apprentice, such time reduces the potential for the business to benefit from the product of the Apprentice. It was estimated that 58 per cent of Apprentices spent some time during their first year (in some cases their only year as an Apprentice) training on some form of block release that took them out of the workplace. The proportion declines with each year of Apprenticeship. In year 2, 49 per cent had some form of block release, in Year 3 it was 33 per cent, in Year 4 it was 21 per cent and none of the Apprentices in their fifth year went on block release. These figures disguise substantial variation between the two sectors. In retail Apprenticeships, 66 per cent of Apprentices do not go on block release training during their first year (and 80 per cent and 90 per cent respectively in the next two years of Apprenticeship). In engineering or manufacturing, just over 80 per cent of Apprentices go on block release training in their first year with the proportion remaining high in subsequent years (77 per cent in year 2, 56 per cent in year 3 and 42 per cent in year 4 although none were reported in year 5). Table B8 shows the mean proportion of Apprentice time spent on block release off-the-job training by sector and year. This reflects not only whether or not the Apprentice attends block release but also the amount of time spent on block release (number of days or number of weeks). The proportion of time spent in such training is particularly high in engineering or manufacturing where 28 per cent of Apprentice time is spent off the job on block release (and it should be noted that this figure is depressed by cases where the Apprentice does not go on block release) while comparatively small in retail.
Table B8: Proportion of Apprentice time spent on block release off the job
Sector from sample Year 1 Year 2 Year 3 Year 4 Year 5
Mean .28 .15 .08 .06 .00Engineering production or manufacturing
N 52 52 52 52 52
Mean .06 .02 .01 .00 .00Retail N 50 50 50 50 50
Mean .17 .09 .05 .03 .00Total N 102 102 102 102 102
Source: IER Net Benefits of Training Study 2008 Direct costs and grants
In addition to the cost of supervising Apprentices, the training of Apprentices is likely to involve more direct costs, such as course materials, course fees and assessment. Around 63 per cent of respondents reported no additional direct costs for their Apprentices (60 per cent in engineering and 66 per cent in retail). Where direct costs were reported they varied greatly and some appear implausible. One employer in retailing reported direct costs of £25000 per Apprentice. It is possible that this figure included wage costs despite respondents being instructed to ignore wages in their responses. Table B9 describes the mean direct cost of Apprenticeships by sector. It should be borne in mind that these average costs have been depressed by the inclusion of employers who report no direct cost. The table suggests that direct costs average under £1000 per annum
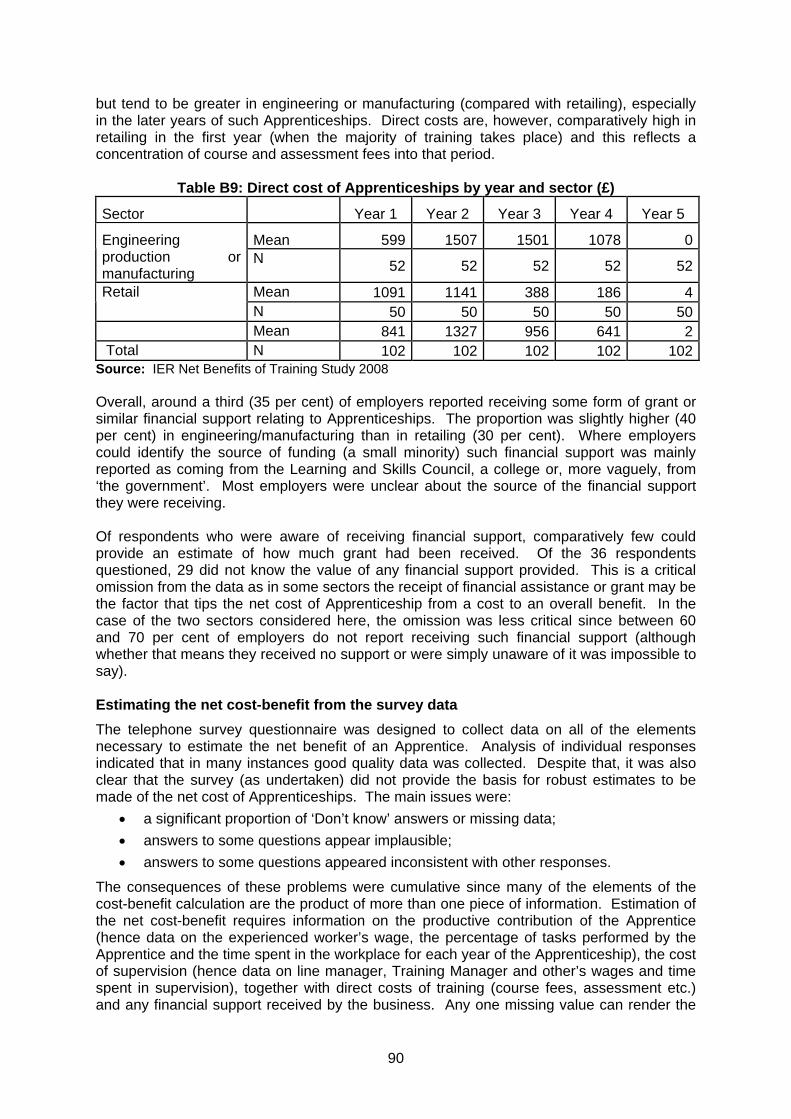
90
but tend to be greater in engineering or manufacturing (compared with retailing), especially in the later years of such Apprenticeships. Direct costs are, however, comparatively high in retailing in the first year (when the majority of training takes place) and this reflects a concentration of course and assessment fees into that period.
Table B9: Direct cost of Apprenticeships by year and sector (£)
Sector Year 1 Year 2 Year 3 Year 4 Year 5
Mean 599 1507 1501 1078 0Engineering production or manufacturing
N 52 52 52 52 52
Mean 1091 1141 388 186 4Retail N 50 50 50 50 50
Mean 841 1327 956 641 2 Total N 102 102 102 102 102
Source: IER Net Benefits of Training Study 2008 Overall, around a third (35 per cent) of employers reported receiving some form of grant or similar financial support relating to Apprenticeships. The proportion was slightly higher (40 per cent) in engineering/manufacturing than in retailing (30 per cent). Where employers could identify the source of funding (a small minority) such financial support was mainly reported as coming from the Learning and Skills Council, a college or, more vaguely, from ‘the government’. Most employers were unclear about the source of the financial support they were receiving. Of respondents who were aware of receiving financial support, comparatively few could provide an estimate of how much grant had been received. Of the 36 respondents questioned, 29 did not know the value of any financial support provided. This is a critical omission from the data as in some sectors the receipt of financial assistance or grant may be the factor that tips the net cost of Apprenticeship from a cost to an overall benefit. In the case of the two sectors considered here, the omission was less critical since between 60 and 70 per cent of employers do not report receiving such financial support (although whether that means they received no support or were simply unaware of it was impossible to say). Estimating the net cost-benefit from the survey data The telephone survey questionnaire was designed to collect data on all of the elements necessary to estimate the net benefit of an Apprentice. Analysis of individual responses indicated that in many instances good quality data was collected. Despite that, it was also clear that the survey (as undertaken) did not provide the basis for robust estimates to be made of the net cost of Apprenticeships. The main issues were:
• a significant proportion of ‘Don’t know’ answers or missing data; • answers to some questions appear implausible; • answers to some questions appeared inconsistent with other responses.
The consequences of these problems were cumulative since many of the elements of the cost-benefit calculation are the product of more than one piece of information. Estimation of the net cost-benefit requires information on the productive contribution of the Apprentice (hence data on the experienced worker’s wage, the percentage of tasks performed by the Apprentice and the time spent in the workplace for each year of the Apprenticeship), the cost of supervision (hence data on line manager, Training Manager and other’s wages and time spent in supervision), together with direct costs of training (course fees, assessment etc.) and any financial support received by the business. Any one missing value can render the
91
entire cost-benefit calculation impossible for that case. For instance, many respondents did not provide any information on supervisor’s wages. Others did not indicate how much of their time was spent on supervision (and it was not always clear whether supervision time reported was spent on all Apprentices or on each Apprentice). Some respondents answered all the necessary questions and for them a cost-benefit estimate was possible. Selecting such complete cases, however, reduced the size of the sample (and hence increased the size of the sampling error) and may have introduced bias (if missing values are not randomly distributed across employers). A comparison of data collection methods In a small number of cases, survey respondents were also included in the case study sample and where this was so it was possible to compare the survey derived estimates with those from the face-to-face case study interview. One example is briefly set out below. The company was a high street retailer of men’s and women’s fashions and household accessories with branches throughout the UK. The case study branch was in one of the UK’s major cities and employed 75 full-time equivalent staff. There were three Apprentices (one had recently completed and two were approaching completion) all studying towards a Level 2 qualification in Retail. This was expected to take one year to complete. The first three months were spent following the company’s own induction programme – all employees needed to complete this whether or not they were on the Apprenticeship programme. This is undertaken through a series of assessments carried out by the Training Manager. After that the core NVQ programme commenced and this is expected to take nine months to complete. Over a six month period the Apprentice spent, on average, two days a month away from the shop floor in the Training Room being instructed in various aspects of Retail as required by the NVQ. This was undertaken by the Training Manager or external trainers (e.g. in basic skills). This was recorded as block release in the telephone survey but should have been recorded as off-the-job training – but there was no double counting (i.e. this was not also recorded as off-the-job training). There was also on-the-job training but this did not affect the productive contribution of the employee or fully experienced worker because it could be undertaken during quiet times in the store. Comparison of the data collected from this employer via the telephone survey and the case study interview identified the following:
• the telephone survey over-estimated the cost to the employer because it treated some costs more crudely than the information collected face-to-face;
• the number of Apprentices in the telephone survey was less than the number recorded in the face-to-face discussion because one Apprentice had just left upon her completion;
• salary costs were incorrectly stated. The fully experienced worker rate was given as the Apprentice’s wage;
• the salary costs of the Apprentices comprised three separate rates and these were not picked up in the telephone survey. The separate elements were::
o for those aged under / over 18 years; o for those classified as trainees (i.e. still in the induction phase); o those considered to be in-training after induction;
• more detailed information was provided in the face-to-face discussion about supervisory time;
• the duration of off-the-job training was more precisely accounted for in the face-to-face discussion.
Table B10 compares the data collected by the two methods in one case study organisation highlights the differences between the two sets of findings.

92
Table B10 Net Costs of Training to the Employer:
Telephone and Case Study Approaches Compared Telephone
Survey Case Study Difference
Number of trainees 2 3 1 Average wage of trainee 11,700 10,302 -1,398 Productive contribution of trainee 90 90 0 Fully experienced workers wage 1 11,700 11,700 0 Employer costs Wage costs 11,700 10,302 -1,398 National insurance contributions 709 569 -140 Supervisory costs 800 800 0 Training manager 700 700 0 Production line staff 0 0 0 Other staff 0 0 0 Training costs 0 0 0 Other costs 1,300 1,300 0 Total 15,209 13,671 -1,538 Employer benefits Productive contribution 9,477 10,004 527 Other income 0 0 0 Total 9,477 10,004 527 Cost-benefit Total 5,732 3,667 -2,064 Source: IER Net Benefits of Training Study 2008 The telephone method also failed to capture the extent of drop-out. Of the three Apprentices taken on, one had resigned upon completion, one had just announced that she was leaving but will complete before doing so. Drop-out is measured at the end of the formal training period and so will not be collected by the questionnaire based approach, but the fact remains that the company needed to train three people to have one fully trained worker. Conclusions and assessment of the pilot survey It would be wrong to conclude that a structured telephone survey could never provide the necessary data from which to estimate the net cost-benefit of an Apprentice. A number of changes to the survey approach might improve the method and address some of the issues identified here. Those changes include:
• surveying a larger sample (thus providing a larger sub-set of respondents who provided a full set of data). This would involve greatly increased financial cost and substantial risk of bias. It is also unclear from where such a large sample could be drawn. Despite the very large sample in NESS07 the survey effectively ‘ran out of sample’ by the end of the fieldwork.
• modifying the questionnaire with the aim of reducing ‘Don’t know’ or missing responses. This could take the form of:
o greater focus on collecting the key data for estimating cost-benefit at the expense of removing less central questions (interesting contextual information about Apprenticeship or the business);

93
o greater structure in the questionnaire to ‘force’ respondents to provide unambiguous or consistent answers. A CATI programme, for instance, could enforce more quality and consistency checks.
• a less structured telephone survey in which experienced interviewers would have the flexibility to question the responses given and to probe for missing data. This option is, in effect, the case study approach conducted by telephone. Such an approach might not offer much advantage over case studies either in terms of cost (or sample size).
The returns to the employer from engaging in Apprenticeship training relate very much to the employer’s rationale for taking on Apprentices (such as a recognition of the future value an Apprenticeship will bring to the organisation), and the amount of investment they are willing to make in developing each Apprentice. The level of employer commitment can be measured by proxy indicators such as the cost attributed to the employer investment, but this is a narrow view. The case study approach is able to capture information about why the employer invests in Apprenticeships, obtain an indication of the commitment they are willing to make, such as guiding the Apprentice’s career decisions within the organisation during the Apprenticeship and generally nurturing their interest in the subject being studied, and understand how Apprenticeship is designed to meet future organisational needs. These factors are less readily captured by a survey approach. On balance, there is a need for both approaches, survey and case study, but for the time being there are risks to relying upon the survey method.

94
IFF RESEARCH LTD CHART HOUSE 16 CHART STREET . LONDON . N1 6DD TEL: +44 (0) 20 7250 3035 FAX: +44 (0) 20 7490 2490 EMAIL: [email protected]
PRIVATE & CONFIDENTIAL
COSTS OF APPRENTICESHIP Mainstage Questionnaire
J4525March 2008
FROM NESS INFORMATION: A) REGION:
North West 1 South West 7 North East 2 East 8 Yorkshire & Humberside 3 South East 9 West Midlands 4 London 10
East Midlands 5 B) TAKE SECTOR TYPE FROM SAMPLE:
Engineering 1 Retail 2
CHECK QUOTAS
C) NUMBER OF EMPLOYEES:
1 (i.e. respondent only) 1 2-4 2 5-10 3 11-24 4 25-99 5 100-249 6 250+ 7
D) NESS RESPONDENT NAME:

95
SCREENER: SA) Can I speak to [NAMED RESPONDENT FROM NESS]?
Yes 1 GO TO qSC Not available currently 2 MAKE APPOINTMENT Left the company 3 ASK qSB Refusal – not interested 4 ASK S1A AND THEN THANK AND CLOSE Other (SPECIFY) 5 CLOSE
IF NAMED RESPONDENT LEFT SB) Can I speak to the person responsible for training at the site?
Yes [take name if given] 1 GO TO qSC Not available currently 2 MAKE APPOINTMENT AND TAKE NAME No such person e.g. all decided at HQ 3 THANK AND CLOSE Other (SPECIFY) 5 CLOSE
ASK ALL WHERE TALKING TO LIKELY APPROPRIATE RESPONDENT SC) Good morning / afternoon. My name is _____________________ and I am calling from IFF
Research conducting a survey on behalf of the University of Warwick Institute for Employment Research. You will have recently received a letter about the study they are conducting on the net costs to employers of training Apprentices.
The Institute for Employment Research has been commissioned by the Apprenticeships Ambassador Network to undertake a survey of employers to find out how much they invest in training their Apprentices. The information collected is used by Government to calculate how much money should be provided to fund Apprenticeships, so it is important that we obtain a wide range of views.
I would like to ask you a few questions which will take around fifteen minutes to answer. All information collected will be treated in the strictest confidence and you and your organisation will not be identified in any report. Some quantitative information is needed – if you do not have an exact figure to hand please give your best estimate. A copy of the findings will be placed on the Apprenticeship Ambassadors Network at http://www.employersforApprentices.gov.uk/

96
IF REASSURANCES REQUIRED: If require any further information about the survey please contact: Terence Hogarth at the University of Warwick on 02476 524420 or [email protected]
IF CANNOT SPEAK NOW: ARRANGE TIME FOR CALL BACK
ASK ALL S1. Can I just check: do you currently have any Apprentices at the establishment where you
work? Yes 1 CONTINUE No 2 THANK RESPONDENT AND TERMINATE INTERVIEW Don’t know 3 THANK RESPONDENT AND TERMINATE INTERVIEW
IF YES: S2. Do you train Apprentices under any of the following frameworks or programmes…READ OUT
{MULTICODE FOR CODES 1 AND 2 OKAY} Engineering production or manufacturing 1 CONTINUE Retail 2 CONTINUE
Neither 3 THANK RESPONDENT AND TERMINATE INTERVIEW
S3. Can I just check that you are the appropriate person to talk with about Apprenticeships at this
establishment? Yes 1 GO TO MAIN QUESTIONNAIRE No 2 ASK S4
IF NO:
S4. Who is the appropriate person to talk with?
_________________________________ [OBTAIN NAME AND EITHER ASK TO BE TRANSFERED OR CALL BACK – GO TO qSC]

97
MAIN QUESTIONNAIRE
SECTION A
I would now like to ask you questions about Apprenticeships at this establishment, but first of all can you tell me…?
A1a. …how many people are employed at this site? Please include any staff on fixed-term contracts and all Apprentices and trainees? WRITE IN EXACT FIGURE AND CODE RANGE. IF DO NOT KNOW FIGURE READ OUT RANGES]
Exact number of employees: ____________________
IF DON’T KNOW:
A1aDK: Is it…READ OUT?
Less than 10 10-24
25-99 100-249 250-499 500-999 1,000 – 4,999 5,000 plus Don’t know
ASK ALL A1b. What is the main business activity of this establishment? ____________________________ [CODE TO SIC 3-digit AT ANALYSIS STAGE] A2. How many Apprentices do you employ? WRITE IN EXACT FIGURE AND CODE RANGE. IF
DO NOT KNOW FIGURE READ OUT RANGES] Exact number of Apprentices: ____________________
IF DO NOT KNOW: A2DK: Would you say it was?
1-5 5-10 11-24 25-49 50-99 100 or more
ASK ALL
A3a. What is the full name of the Apprenticeship they are working towards? [RECORD EACH DIFFERENT NAME OF APPRENTICESHIP SEPARATELY] i) ______________________________ ii) ______________________________ iii) ______________________________ iv) ______________________________ v) ______________________________

98
REPEAT FOR EACH APPRENTICESHIP MENTIONED @ A3a A3b. In general, at what level are [INSERT EACH A3a ANSWER SEPARATELY] Apprenticeships
being taken…READ OUT (i) (ii) (iii) (iv) (v) NVQ level 2 ALLOW DK NVQ level 2 currently but will be going on to NVQ level 3
ALLOW DK
NVQ level 3 ALLOW DK Other (Please specify) ALLOW DK A4. [IF ONE APPRENTICHESHIP ONLY @ A3a] Can I just confirm that this is an Apprenticeship
in [FRAMEWORK @ S2]? [IF MORE THAN ONE APPRENTICESHIP TYPE @ A3a] Can I just confirm that at least one of these Apprenticeships is in [FRAMEWORK @ S2] Yes 1 CONTINUE No 2 END INTERVIEW
Don’t know X END INTERVIEW
ASK ALL EXCEPT IF JUST ONE CATEGORY AT A3A AND AT A3B JUST ONE LEVEL A5. How many people are training in [APPRENTICESHIP MENTIONED AT A3a] at [EACH
LEVEL MENTIONED @ A3b]. REPEAT FOR EACH LEVEL AT A3B; THEN MOVE ON TO NEXT APPRENTICESHIP FROM A3A
Level
2 Level 2 currently going on to 3 Level
3 Apprenticeship (i) Apprenticeship (ii) Apprenticeship (iii) Apprenticeship (iv) Apprenticeship (v) SECTION B IF ONE APPRENTICESHIP AND ONE LEVEL ONLY @ A3a and A3b: I would now like to ask you some questions about the Apprenticeships you provide in [ANSWER AT QA3a] OTHERS: Which [SHOW ANSWER FROM S2: engineering / manufacturing AND / OR retail] Apprenticeship training are you best able to report on? LIST NAMES FROM A3a AND THEIR LEVEL FROM A3B AND GET RESPONDENT TO SELECT ONE: ________________________at level________________________ B1. How long, on average, does the Apprenticeship last? [WRITE IN EXACT FIGURE AND
CODE RANGE. IF DO NOT KNOW FIGURE READ OUT RANGES] ______ years ______ months

99
ALL
B1a [IF DO NOT KNOW AT B1] Would you say it was… READ OUT [IF GAVE EXACT YEAR OR MONTH ANSWER AT B1] INTERVIEWER CODE ANSWER (SCRIPT TO CHECK CONSISTENT NB NEED ANSWER FOR THESE RESPONDENTS TO BE THE BITS IN { } BELOW) [SINGLE CODE]
six months…………………………………………….………….1 nine months ……………………………………………………..2 one year…………………………………………………………..3 one and a half years {more than a year less than 2}………..4 two years…………………………………………………………5 two and a half years {more than 2 years less than 3}……….6 three years……………………………………………………….7 three and a half years {more than 3 years less than 4}……..8 four years………………………………………….....................9 more than four years……………………………………………10 don’t know………………………………………………………..11 B2. How much do you pay the Apprentices in each year of their Apprenticeship? First of all…..
CODE ‘NULL’ IF SAY DOESN’T TAKE THIS LONG ASK ALL
….. in Year 1 £_______ Don’t know ….X ALLOW REF
[ASK IF CODES 4-11 AT B1a] ….. in Year 2 £_______ Don’t know …. X ALLOW REF
[ASK IF CODES 6-11 AT B1a EXCEPT IF ANSWERED NULL AT B2] ….. in Year 3 £_______ Don’t know …. X ALLOW REF
[ASK IF CODES 8-11 AT B1a EXCEPT IF ANSWERED NULL AT B2] ….. in Year 4 £_______ Don’t know …. X ALLOW REF
[ASK IF CODES 10-11 AT B1a EXCEPT IF ANSWERED NULL AT B2] ….. in Year 5 £_______ Don’t know …. X ALLOW REF
B2a. [FOR EACH YEAR @ B2] Is the figure you have just given for year [SUBSTITUTE EACH
YEAR FROM B2] Year Month Four weeks Week
Day Hour Other (please specify) ______________ ASK ALL
B2b. How many hours are there in the Apprentice’s average working week? Please include any time off-job training undertaken in company time. ________ hours
IF DO NOT KNOW AT ANY YEAR @B2 B2c Annually, would you say in [INSERT EACH YEAR AS APPROPRIATE ie DK AT B2] it
was…READ OUT

100
£5,000 – £7,499 £7,500 - £9,999 £10,000 - £12,499 £12,500 - £14,999 £15,000 - £17,449 £17,500 - £19,999 £20,000 - £22,499 £22,500 - £24,999 25,000 or more Don’t know ASK ALL B3. Compared to the fully experienced workers they are training to become, what percentage of
the fully experienced worker’s usual tasks can the Apprentice carry out in year [SUSTITUTE EACH YEAR NOT NULL AT B2]
…. in year 1 __________%
…. in year 2 __________% …. in year 3 __________% …. in year 4 __________% …. in year 5 __________% IF DO NOT KNOW AT ANY YEAR @B3
Would you say it is…? 0% 1-10% 11-25% 26-50% 51-75% 75-99% 100%
SECTION C I would now like to ask you about the amount of time employers spend supervising Apprentices. By supervision is meant anytime spent arranging or delivering on-the-job training, organising off-the-job training, carrying out assessments, general monitoring, or simply looking after Apprentices. If you do not know the exact figure, please give your best estimate. C1. In the departments or sections of your workplace where Apprentices are employed, how
many hours per week does a typical line manager spend directly supervising Apprentices? [FOR EACH YEAR MENTIONED I.E. NOT NULL AT QB1] ALLOW NULL
….in year 1 _____ ALLOW NULL ….in year 2 _____ ALLOW NULL ….in year 3 _____ ALLOW NULL ….in year 4 _____ ALLOW NULL ….in year 5 _____ ALLOW NULL IF DO NOT KNOW AT ANY YEAR @C1
Would you say it is…? 0 1-5 6-10

101
11-15 16-20 21-24 25-30 More than 30
IF NOT 1 @ A2 C1a. Is this for all Apprentices or for each Apprentice?
All Apprentices…………..1 ALLOW NULL Each Apprentice…………2 ALLOW NULL
ASK ALL C1b How many line managers spend time directly supervising Apprentices?
___________________________ (write in number) C2. In the departments or sections of your workplace where Apprentices are employed how many
hours per week does a fully experienced worker or a supervisor spend directly supervising Apprentices? [FOR EACH YEAR MENTIONED AT QB1]
….in year 1 _____ ALLOW NULL ….in year 2 _____ ALLOW NULL ….in year 3 _____ ALLOW NULL ….in year 4 _____ ALLOW NULL ….in year 5 _____ ALLOW NULL
IF DO NOT KNOW AT ANY YEAR @C2 Would you say it is…? 0 1-5 6-10 11-15 16-20 21-24 25-30 More than 30
IF NOT 1 @ A2 C2a. Is this for all Apprentices or for each Apprentice?
All Apprentices…………1 ALLOW NULL Each Apprentice……….2 ALLOW NULL
ASK ALL C2b How many fully experienced workers or supervisors spend time directly supervising
Apprentices?
___________________________ (write in number – allow 0)
C3 And how many hours a week does the Training or Personnel Manager, or the person with overall responsibility for training at this establishment, spend managing the training of

102
Apprentices - Please include any time spent dealing with training providers or other organisations. So in [FOR EACH YEAR MENTIONED AT QB1]
….in year 1 _____ ALLOW NULL ….in year 2 _____ ALLOW NULL ….in year 3 _____ ALLOW NULL ….in year 4 _____ ALLOW NULL ….in year 5 _____ ALLOW NULL IF DO NOT KNOW AT ANY YEAR @C3
Would you say it is…? 0 1-5 6-10 11-15 16-20 21-24 25-30 More than 30
IF MORE THAN ONE APPRENTICE @ A2 C3a. Is this for all Apprentices or for each Apprentice?
All Apprentices………….1 ALLOW NULL Each Apprentice………..2 ALLOW NULL
ASK ALL C3b How many Training Managers spend time supervising Apprentices?
___________________________ (write in number)
C4. So that we can estimate the costs of supervising Apprentices, can you please give me the
salary or wage of…
[IF MENTIONED AT QC1] the typical line manager £ _________ [IF MENTIONED AT QC2] the typical fully experienced worker / supervisor £ ______ [IF MENTIONED AT QC3] the training manager or person with overall responsibility
for training £ __________

103
IF DK AT ANY SALARY AT C4 Annually, would you say the salary or wage is…?
Less than £5,000 per annum / less than £417 per month 1 £5,000 - £9,999 per annum / £417 - £832 per month 2 £10,000 – £14,999 per annum / £833 - £1,249 per month 3 £15,000 – £19,999 per annum / £1,250 - £1,666 per month 4 £20,000 - £29,999 per annum / £1,667 - £2,499 per month 5 £30,000 – £39,999 per annum / £2,500 - £3,332 per month 6 £40,000 - £49,999 per annum / £3,333 - £4,166 per month 7 £50,000 or above per annum / £4,167 or more per month 8 (DO NOT READ OUT) Don’t know 9 (DO NOT READ OUT) Refused 10
FOR EACH SALARY QC4 (BUT NOT IF DK AT C4) C4a What period that it cover?
Year Month Four weeks Week
Day Hour Other (please specify) ______________
ASK ALL
C4b. How many hours are there in an average working week for [OCCUPATION @ C4]? ________ hours
ASK ALL . I would now like to ask about off-the-job training that is training away from the individual’s
immediate work position, whether on your premises or elsewhere. C5a. Do trainees spend time on block release, that is training provided for a given number of days
over a series of weeks, at a college or training provider [FOR EACH YEAR OF THE APPRENTICESHIP @ B1]?
Yes No [ALLOW DK]
IF YES at C5a
C5b. How many days a week do they spend on block release [IN EACH YEAR @ C5a]
EXACT: ___________________ DAYS PER WEEK [ALLOW DK]
IF YES at C5a
C5c. And for many weeks are they on block release [IN EACH YEAR @ C5a]
EXACT: ___________________ NUMBER OF WEEKS [ALLOW DK]

104
ASK ALL C5d. [IF BLOCK RELEASE AT C5a: Excluding any time on block release…] On average, how
many hours a week of the Apprentice’s time is spent on off-the-job training…
[FOR EACH YEAR MENTIONED AT QB1]
EXACT: ___________________ HOURS PER WEEK
WRITE IN EXACT FIGURE AND CODE RANGE. IF DO NOT KNOW FIGURE READ OUT RANGES
IF DO NOT KNOW AT ANY YEAR @C5 Would you say it is…? 0 hours per week 1 hour per week / less than half a day per week / half a day per month 2 hours per week / less than half a day per week / a day per month 3 hours per week / less than half a day per week / a day and a half per month 4-5 hours per week / less than a day per week / two days per month 6-10 hours per week / less than 1½ days per week / between 3 and 5 days
per month 11-15 hours per week / less than 2 days per week / between 5 ½ and 8 days per
month 16-20 hours per week / less than 3 days per week / between 8 ½ and 10 days per
month 21-30 hours per week/ less than 4 days per week / between 10 ½ and 15 days per
month 31-40 hours per week / less than 5 days per week / between 15 ½ and 20 days per
month More than 40 hours per week / more than 5 days per week / more than 20 days per month
C6. Thinking about on-the-job training, that is any training or instruction that takes place whilst
the Apprentices carry-out their day-to-day work, on average, how many hours per week time is spent on on-the-job training…
[FOR EACH YEAR MENTIONED AT QB1]
EXACT FIGURE______ HOURS PER WEEK
IF DO NOT KNOW AT ANY YEAR @C6 Would you say it is…? 0 hours per week 1 hour per week / less than half a day per week / half a day per month 2 hours per week / less than half a day per week / a day per month 3 hours per week / less than half a day per week / a day and a half per month 4-5 hours per week / less than a day per week / two days per month 6-10 hours per week / less than 1 ½ days per week / between 3 and 5 days
per month 11-15 hours per week / less than 2 days per week / between 5 ½ and 8 days per
month 16-20 hours per week / less than 3 days per week / between 8 ½ and 10 days per
month 21-30 hours per week/ less than 4 days per week / between 10 ½ and 15 days per
month 31-40 hours per week / less than 5 days per week / between 15 ½ and 20 days per
month More than 40 hours per week / more than 5 days per week / more than 20 days per month

105
SECTION D D1. Excluding wages, how much do you spend on direct costs of training your Apprentices?
Please include the costs of courses, materials, and assessment, but excluding Apprentice’s wages. [FOR EACH YEAR MENTIONED AT QB1]
A year 1 of their Apprenticeship £____ B year 2 of their Apprenticeship £____ C year 3 of their Apprenticeship £____ D year 4 of their Apprenticeship £____ E Year 5 of their Apprenticeship £____
D1a1 What period does this cover? [FOR EACH YEAR MENTIONED AT QB1]
Year Month Four weeks Week
Day Other (please specify) ______________
IF MORE THAN ONE APPRENTICE @ A2 D1a [FOR EACH YEAR ASK] Is this for all Apprentices or for each Apprentice?
All Apprentices Each Apprentice
ASK ALL D2. Is the assessment of the Apprentice’s progress and achievements that needs to be
undertaken as part of the Apprenticeship carried out by this organisation or an outside body? ALLOW MULTICODE By this organisation……….1 By an outside body………..2 Neither ……………………..3 Don’t know………………….X
D3 there is no D3
ASK ALL D4. Do you incur any costs for additional activities such as study visits?
Yes……………………1 [ASK D4a – D4d] No……………………..2 [ASK D5] Don’t know…………..X [ASK D5]
If yes (OTHERS ASK D5) D4a. What are these costs?
_________________________ _________________________ _________________________

106
D4b Do you incur these costs just for Apprentices or other employees as well?
Yes, only for Apprentices No, for Apprentices and other employees as well
D4c. On average, how much do all these costs amount to each year? [FOR EACH YEAR
MENTIONED AT QB1] ….. Year 1 £_______ ….. Year 2 £_______ ….. Year 3 £_______ ….. Year 4 £_______ ….. Year 5 £_______ D4d [FOR EACH YEAR ASK & IF MORE THAN ONE APPRENTICE @ A2] Is this for all
Apprentices or for each Apprentice?
All Apprentices Each Apprentice
ASK ALL D5. Do you receive any grants or financial support from external organisations for training
Apprentices? [NB: NOT GRANTS FROM OTHER PARTS OF THE ORGANISATION OF WHICH THIS SITE MAY BE A PART OF]
Yes 1 CONTINUE
No 2 GO TO SECTION E Don’t know X GO TO SECTION E IF YES D6. From whom do you receive these grants or financial support?
____________________________________________________ D7. For what purposes do you receive these grants or financial support?
____________________________________________________ D8. How much income do you receive in… [FOR EACH YEAR MENTIONED AT QB1]
In Year 1 £______________ In Year 2 £______________
In Year 3 £______________ In Year 4 £______________ In Year 5 £______________
D9. [FOR EACH YEAR MENTIONED @ D8] Is this for all Apprentices or for each Apprentice? All Apprentices Each Apprentice

107
SECTION E ASK ALL E1. Thinking about the last 5 years, how many of your Apprentices complete their Apprenticeship
on average? READ OUT All Nearly all Around three quarters Around a half to three quarters About half to a quarter Around a quarter Almost none None
E2. What do you consider to be the point at which Apprentices have completed their Apprenticeship? PROMPT IF NECESSARY. MULTICODE
When they can carry out the tasks of the fully experienced worker At the end of the designated training period When they receive their NVQ When they receive their technical certificate When they receive their completion certificate When the assessor says they have completed it According to our internal assessment Other (please specify)
E3. Compared to the average fully experienced worker, how proficient are Apprentices when they
complete their Apprenticeships? READ OUT. CODE ONE ONLY
Just as proficient as a fully experienced worker Nearly as proficient as a fully experienced worker A little way short of full proficiency A long way short of full proficiency Other (SPECIFY)
E4. Upon completion of the Apprenticeship, how many will be given employment with the
company [WRITE IN PERCENTAGE OR NUMBER] EXACT: ___________________ IF DON’T KNOW PROMPT WITH: All Around three quarters Around a half Around a quarter Less than a quarter None IF NUMBER @ E4 = A2 OR % = 100% or ‘ALL’ @ E4 THEN GO TO SECTION F – OTHERS ASK E5
E5. Why not all? E6. Will you assist those not given employment to find a job? IF YES PROMPT WITH THE 2
CATEGORIES

108
Yes, with organisations in your supply chain Yes, with other organisations No
SECTION F
ASK ALL F1. Finally, I would like to ask you a few questions about why your organisation invests in
Apprenticeships. First, for how many years has this organisation taken on Apprentices, is it…READ OUT
… every year over the past ten years … most years over the past ten years … occasionally over the past ten years … this is the first year.
(DO NOT READ OUT) Don’t know F2. Why does this organisation take-on Apprentices?
____________________________________________________ ____________________________________________________ ____________________________________________________
F3. Thinking about the long-term, please tell me if you strongly agree, agree, disagree, strongly
disagree with the following statements..
Apprentices improve the profitability of the company The costs of Apprentices outweigh the benefits Apprentices help alleviate recruitment problems Good Apprentices are difficult to recruit Apprenticeships are good for community relations Apprentices do little to offset skill shortages
ASK ALL EXCEPT ‘THIS FIRST THIS YEAR @ F1’ F4. In the past have Apprentices, whilst still in the employment of this organisation, gone on
to…READ OUT AND CODE ALL THAT APPLY a Foundation Degree Higher Education Take other formal qualifications Have been promoted to supervisory positions
Have been promoted to management positions (DO NOT READ OUT) None of the above

109
ASK ALL F5. Finally, the University of Warwick Institute for Employment Research will be conducting
further research into the business benefits of Apprenticeships. Are you willing for them to contact you?
Yes No
THANK RESPONDENT AND CLOSE INTERVIEW
THANK RESPONDENT AND CLOSE INTERVIEW
I declare that this survey has been carried out under IFF instructions and within the rules of the MRS Code of Conduct.
Interviewer signature: Date:
Finish time: Interview Length Mins