the netgroup experience with management contracts in...
TRANSCRIPT

TANESCO MANAGEMENT SUPPORT SERVICES CONTRACT
The NETGroup Experience with Management Contracts in Tanzania
A Louw Pr. Eng.March 2004

World Bank Energy Week 2004
OVERVIEW
1. GENERAL OBSERVATIONS ON:– Utility lifecycles,– Common afflictions in ailing utilities,– NETGroup’s approach to Utility Management
Contracts.2. INTRODUCTIONS TO:
– Tanzania,– Tanesco.
3. THE CONTRACT– Goals,– NETGroup’s modus operandi,– Results achieved.
4. QUO VADIS TANESCO?5. CONCLUSION
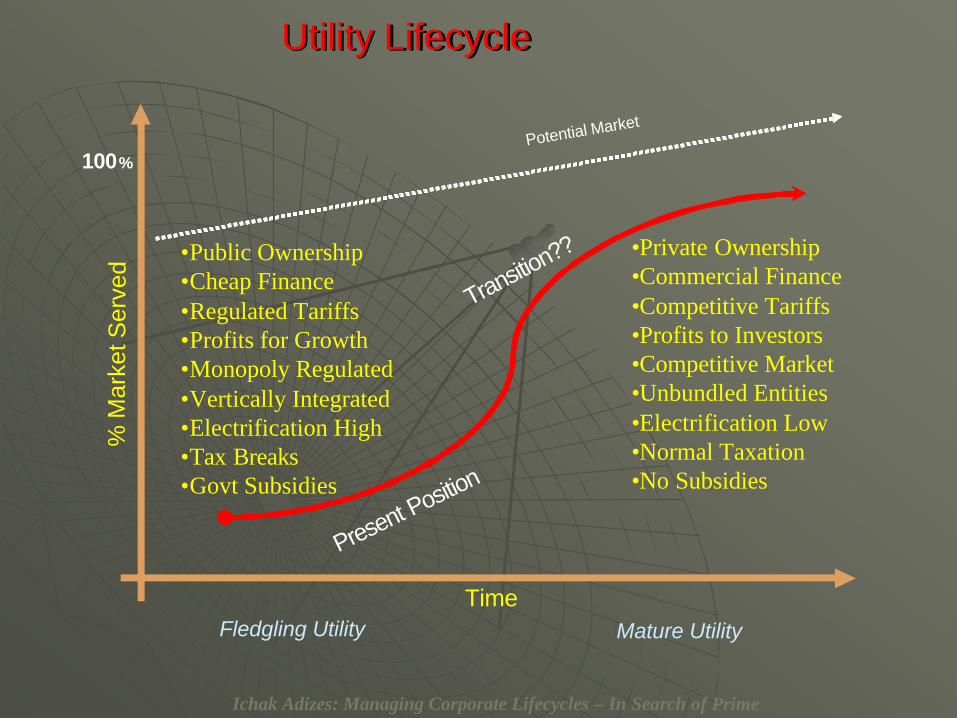
Utility LifecycleUtility Lifecycle
•Public Ownership•Cheap Finance•Regulated Tariffs•Profits for Growth•Monopoly Regulated•Vertically Integrated•Electrification High•Tax Breaks•Govt Subsidies
Ichak Adizes: Managing Corporate Lifecycles – In Search of Prime
•Private Ownership•Commercial Finance•Competitive Tariffs•Profits to Investors•Competitive Market•Unbundled Entities•Electrification Low•Normal Taxation•No Subsidies
Potential Market
Transition??
Present Position
Time
%M
arke
t Ser
ved
100%
Fledgling Utility Mature Utility

World Bank Energy Week 2004
Common Afflictions in Ailing Utilities
1. Corporate Governance Issues;– Government priorities override sound business
practice,– Utilities often not adequately involved in crucial
decisions affecting its viability e.g. Power Purchase Agreements for IPP’s.
2. Utility Management Lack of Accountability:– Insufficient management discipline leading to
unsavoury practices,– High rates of electricity theft,– Low levels of payment; especially MDA’s,– Inadequate customer and network data,
systems and management,– Inadequate funding, reliant on aid,– Losses blamed on technical aspects– No proper performance management,– No vision for Utility growth and development….

World Bank Energy Week 2004
NETGroup’s Approach to Utility Management Contracts1. Sound Macro-Fundamentals;
– Solid democracy, good financial infrastructure, independent judiciary, etc…
2. Government Commitment;– Some unpopular things need to be done,– Interaction with unions…
3. Management Discipline;– Intervention in all aspects,– MC management team an essential component,– Involvement of second tier management,
4. Turn-around Support Projects;– Revenue management and losses,– Network reliability and operational efficiency,– Tariff analysis and design,– Information systems,– Utility growth and expansion programs…

World Bank Energy Week 2004
Management Contractor
Resident Managers
Capacity Building & TrainingTurnaround
Support Projects Diagnostics
Support Project Implementation
Home Office Experts
Adding Value To Utilities through Turn-around Projects
Eff
icie
ncy
Time
Availability of Low Cost Financing Crucial

World Bank Energy Week 2004
NETGroup’s Approach to Utility Management (Contd.)
5. Reward Structure;– Balance risk between Government, Utility and
Contractor…– Incentives must be structured towards the
strategic objectives,– Performance based contract with a retainer,
support project remuneration and success fee recommended.
6. Duration;– Two years for financial turn-around,– Longer for sustainable technical turn-around,– Initial assessment period needed to evaluate
utility, define support projects and set realistic targets.

World Bank Energy Week 2004
Introduction to Tanzania
• Largest country in East Africa,• Independence gained in 1961,• 35 million people, density 32/km2
• Capital - Dar es Salaam,• 10% access to electricity,• Largely agricultural, some mining… • Commercial and industrial at Dar es Salaam,• 50% of the electrical load is near Dar es Salaam,• Structural reform program launched in 1992 –
driven by PSRC (Parastatal Sector Reform Commission),– 250 of 350 parastatals privatised or sold off...– plantations, sugar and sawmills, etc.– Current focus on TANESCO - (Dawasa, TTCL
privatized)


World Bank Energy Week 2004
Introduction to Tanzania Electric Supply Company - Tanesco
• State owned, vertically integrated,• Generation Capacity 763 MW (excl. IPP’s);
– Hydro 561MW (72%),– Thermal 202MW (28%).
• System Demand 500MW (Dec 2003).
• Generation 3,000GWh pa,– Energy sold 2,100GW pa (Losses 28%)
• 220/132kV transmission network,– Some interconnections to Uganda and Zambia,
• 33/11kV distribution network,• Number of customers: 500 000
– Potential 3 million,– Annual connections 30,000
• Domestic tariff - 70TShs/kWh (7c US).


World Bank Energy Week 2004
Critical Problems at Tanesco at Start of Contract:
• High system losses:
• Low revenue collection,• High payroll cost (6,500 employees),• Lack of expenditure control,• Serious liquidity crisis impacting on
operations…….
56%72%100%
CollectionsBilled Generated

World Bank Energy Week 2004
Other Issues:
• Shortage of hydro-generation due to drought,
• High cost of IPTL IPP,• Uncompetitive tariff for industry, • Unreliable supply (including frequent
national grid failures), • Transmission and distribution networks
in poor condition,• Corruption and fraud rife,• Electrification connection backlog,• Rural access to electricity based on
political considerations.

World Bank Energy Week 2004
Government Actions
• In 1999 Government decided to privatise the electricity sector,
• In 2001 Government decided to bring in a new management team for two years to:– Improve the company financially,– Better the quality and reliability of
supply, and– Assist with the unbundling of the Utility
and pave the way for privatization….

World Bank Energy Week 2004
CONTRACT AWARD:
• Competitive bid process administered by the PSRC according to World Bank procurement guidelines,
• Funding of retainer portion of the project by Sida through a Trust Fund established at the World Bank,
• Support projects directly financed by Sida,
• Success fee funded from increased revenue collections…..

World Bank Energy Week 2004
Cut – Off CampaignSTRUCTURE OF THE MSSC PROJECT:
• Management Team:– Managing Director: Mr. Rudi Huysen
– DMD – Generation & Transmission: Mr. Jimmy Adamson
– DMD – Distribution & Customer Serv:Mr. Steve v Staden
– DMD – Finance & Corp Service: Mr. Andrew Atterbury
• Home Office Support:– 25% of Contract Value,
• Turn-around support projects:– Tariff study to determine cost reflective issues,– Generation and transmission reliability upgrade,– Revenue management and meter audit,– Information system upgrade,– Distribution reliability upgrade.


World Bank Energy Week 2004
NETGroup Modus Operandi
• First focus financial:– Targeted revenue management initiative to
large industry and government agencies,– Cut-offs and media campaign,– Meter audits of major customers,– Collections increased from TSh9bn to
TSh16bn pm,
• Expenditure decreased by 10% through increased management discipline,
• With financial situation under control, funds available for operational and technical improvement…


World Bank Energy Week 2004
Management Support Projects
1. Financial Modeling and Tariff Analysis
2. Revenue Management and Meter Audits
3. Network Performance Improvement
4. Utility Information Systems Improvement
5. Distribution System Rehabilitation

Average selling price - Domestic Customers
0
2
4
6
8
10
12
14
US
c/kW
h
75kWh
South AfricaKenya
Malawi
Namibia
TanzaniaZambia
Zimbabwe
Uganda
Botswana
Mozambique
Mauritius
LesothoSwaziland

Scope of Works- $3 m recovered from electricity theft- Audit all Domestic Customers with Pemti- Test all Tariff T2 and T3 Customers- Collect meter data information-Marry field data with Custima billing system
Revenue Management and meter audits
World Bank Energy Week 2004
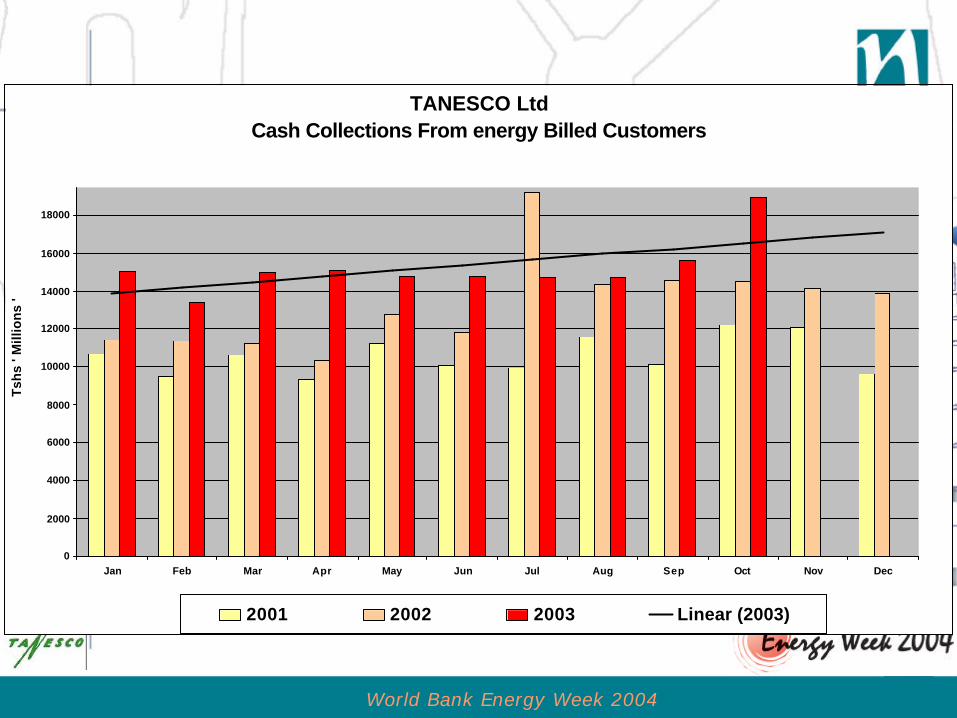
TANESCO LtdCash Collections From energy Billed Customers
0
2000
4000
6000
8000
10000
12000
14000
16000
18000
Jan Feb Mar Apr May Jun Jul Aug Sep Oct Nov Dec
Tsh
s ' M
illio
ns
'
2001 2002 2003 Linear (2003)

Network performance improvement
• IDENTIFY KEY ELEMENTS AFFECTING PERFORMANCE
• DEVELOP MODELS FOR ANALYSING AND PREDICTING NETWORK PERFORMANCE AND TRAIN STAFF TO USE THEM
• REPORT ON PHYSICAL CONDITION OF SUBSTATIONS
• PROVIDE SETTINGS AND GRADINGS FOR PROTECTION SYSTEM
• TEST AND REPORT ON ALL PROTECTION IN SUBSTATIONS
• PROVIDE AN UPDATED DATABASE OF ALL SUBSTATION EQUIPMENT

World Bank Energy Week 2004
Transmission Reliability
TANESCOTransmission Reliabilty
Graph 10
0
5
10
15
20
25
30
35
40
45
MAY JULY SEPTEMBER NOVEMBER JANUARY MARCH MAY JULY SEPTEMBER
Grid failures Partial grid Failures2002 2003

Information technology

Distribution System Rehabilitation:Demand & Energy Forecast

World Bank Energy Week 2004
SUCCESSES ACHIEVED
• Financial:– Cash collections up 65% (TSh9bn to
TSh16bn per month),– System losses down from 28% to 23%,– Reduced operational expenses (10%),– Liquidity positive from TSh33bn deficit,– TSh38bn invested in urgent
rehabilitation projects.
• Improved position with financiers,• $10m buy-down of AFUDC of IPP
generators (Songas) improving longer term financial viability.

World Bank Energy Week 2004
OTHER SUCCESSES ACHIEVED:
• Network reliability improved:– 1 national grid failure since May ’03 (3 per
month previously),
• Customer care index higher than benchmark,• Backlog on electricity connections improved,• Cost reflective tariff designed,• Customer and data records markedly
improved,• Annual load growth >6% maintained,• 21% of Tanesco workforce retrenched,
• Staff morale at all time high:– TMWC Resolution….

World Bank Energy Week 2004
Quo Vadis Tanesco?
• Restructuring Consultants:– 2 generation companies,– 2 distribution companies,– Transmission company,– System operator and Purchasing Agency.
Versus:
• Functional unbundling:– Generation, transmission and distribution
ringfenced into functional cost-centers

World Bank Energy Week 2004
Conclusion:
• Tanesco is turned around financially,– Technical turnaround currently demonstrating
visible improvements…..
• Future development and sustainability of the Tanzanian power sector is dependent on the leveraging of the current successes,
• Access to low-cost financing from is critically important in this transitional period to ensure the future sustainability of the Tanzanian Power Sector.

Asante Sana

1
Solidarity Between the City and the Electrical Utility – Key to Electricité d’Haiti’s Success
in Jacmel
Rosnick Grant (ED’H) and Philip Schubert (CIDA)

2
Introduction by CIDA• CIDA, along with other donors and IFIs,
has been working with Haiti’s state electrical utility, Electricité d’Haiti (ED’H), since the 1970s. – ED’H has been badly affected by the political
instability and changes of regime that have taken place.

3
Introduction by CIDA• ED’H has become the victim of a huge
vicious circle:– its inability to provide quality of service in
electricity has encouraged massive non-technical losses
– the resulting lack of revenue has made it impossible to provide quality of service.

4
Introduction by CIDA (cont’d)
• In 1998, CIDA and ED’H proceeded with a pilot project at Jacmel, a city of 40,000 people in the south of Haiti.– The basis of the project was to see if the provision of
quality of service in electricity was in fact the key to dealing with the problem of the non-technical losses.
– Haiti still has no electrical interconnections and thus cities like Jacmel have their own isolated electrical system.

5

6
Introduction by CIDA (cont’d)
• ED’H Jacmel had suffered from the same problems as ED’H elsewhere in Haiti:– only able to provide a few hours of electrical
service per day– very large non-technical losses.

7
Introduction by CIDA (cont’d)
• CIDA financed:– needed additions to the thermal power station at
Jacmel– rehabilitation of a small hydro plant and
incorporation of its output within the Jacmelsystem
– rehabilitation of the distribution system.

8
Introduction by CIDA (cont’d)
• In March 2000, the experiment began: – electrical service began to be provided 24 hours
per day (the only place in Haiti with this level of service at that time).
– ED’H Jacmel, from this point forward, • would either sink or swim on the basis of the income
from its consumers.

9
Introduction by CIDA (cont’d)
• The headquarters of ED’H had opened a local bank account with sufficient funds in it for several months of operation:– placed under the responsibility of ED’H Jacmel – ED’H Jacmel would be responsible for
operating the bank account

10
Introduction by CIDA (cont’d)
• the funds in the bank account, plus the payments made by Jacmel’s consumers, would have to pay for all the costs of operating ED’H Jacmel– with the exception of the salaries of the
employees and new investments.

11
Introduction by CIDA (cont’d)
• Expenses to be paid by ED’H Jacmelincluded fuel, consumables and all maintenance.

12
Introduction by CIDA (cont’d)
• Service on this basis, could only continue for more than a few months:– if the non-technical losses could be quickly and
dramatically reduced.• ED’H knew this• CIDA knew this• The inhabitants of Jacmel also knew it.

13
Introduction by CIDA (cont’d)
• The story of how the lights in fact stayed on, will be told by the Head of ED’HJacmel, Rosnick Grant.

14
Introduction by CIDA (cont’d)
• Hydro Quebec, under CIDA funding, also played a key role:– In carrying out the rehabilitation needed in
order to begin electrical service 24 hours per day
– In the provision of training and expertise.

15
Introduction by CIDA (cont’d)
The last Hydro Quebec expert left Jacmel in July 2003:– ED’H Jacmel has continued to operate
satisfactorily since then– in spite of needed brutal tariff adjustments to
off-set the important devaluation of the local currency due to Haiti’s on-going political crisis.

16
Introduction by CIDA (cont’d)

17
Exposé by Rosnick Grant -Introduction
• The city of Jacmel, founded July 28, 1698, was the first city in Haiti to be electrified, as of December 25, 1895.
• As of the 3rd of March, 2000, Jacmel has had electricity provided 24 hours per day, after being denied this for many long years.

18

19

20
Introduction (cont’d)• At that time:
– the Rate of Invoicing (= taux de facturation: the ratio of the total kilowatt-hours invoiced to the total kilowatt-hours distributed) was 42%
– the Rate of Collections (= taux derecouvrement: ratio of the amount in receipts collected versus the amount invoiced in the same period), was 30%
• This was the challenge we faced

21
Introduction (cont’d)
• The aid program included:– Rehabilitation and expansion of generation
(addition of two 1.25 MW diesels– rehabilitation of a 0.5 MW run-of-the-river
hydro unit and the incorporation of its output into the Jacmel system)
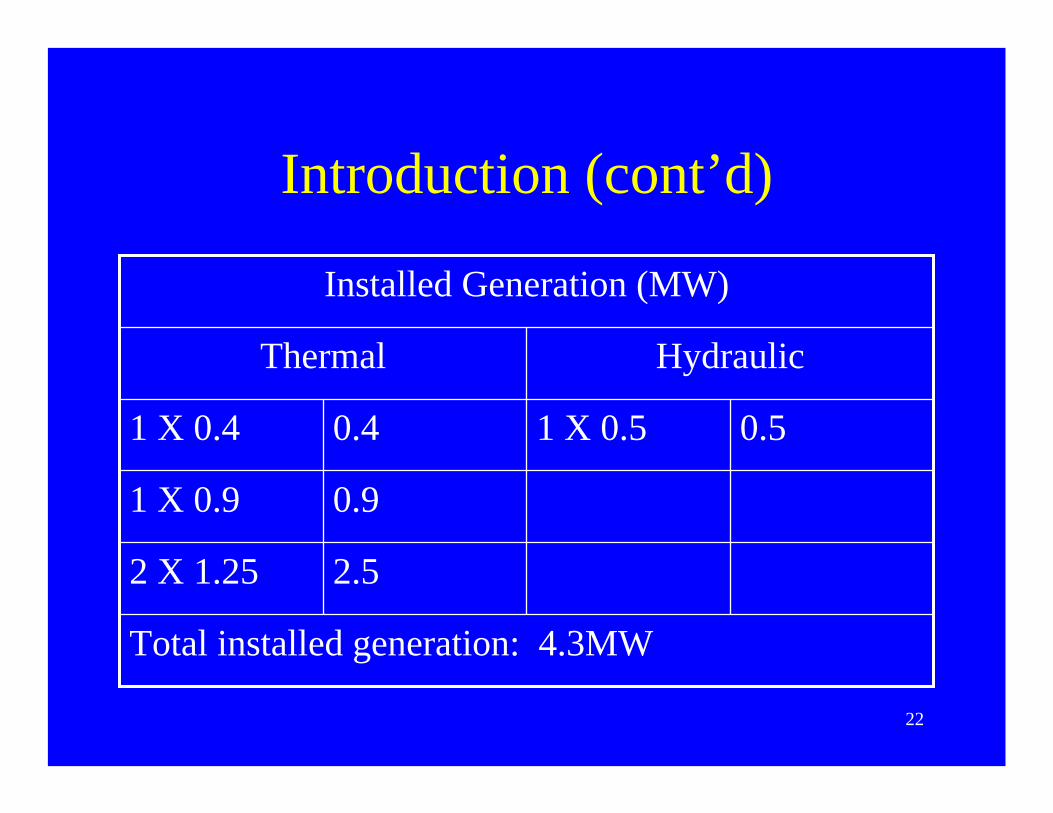
22
Introduction (cont’d)
Total installed generation: 4.3MW
2.52 X 1.25
0.91 X 0.9
0.51 X 0.50.41 X 0.4
HydraulicThermal
Installed Generation (MW)

23

24

25
Introduction (cont’d)
• The aid program also included:– Rehabilitation of the distribution system,
including the installation of 1000 additional customer meters;
– Assistance in the reorganization of the management systems and training at both the technical and management level.

26
The Keys to Success
• CIDA’s Financing– This allowed us to eliminate the vicious circle
• Support by ED’H Headquarters– Helped design the pilot project– Provided unconditional support– Got formal agreement for the decentralized approach– Opened the local bank account and put in the initial
funds in spite of overall grave financial problems

27
The Keys to Success (cont’d)
• Solidarity and a Team Approach – Strong involvement of both management and
personnel– Exchange of ideas in both directions
• Dedication and Motivation of the Personnel– Staffing is a combination of senior staff with
young “up and comers”– Sharing of credit at all levels

28
The Keys to Success (cont’d)
• Approaches to Recruitment– New recruits selected on the basis of
qualifications and testing– What you know and not who you know is what
counts

29
The Keys to Success (cont’d)
• Actions at a Commercial Level– “Se grès Kochon ki fri kochon”: With this, our battle
cry, we convinced the inhabitants of Jacmel that we either swim together or sink together
– It explains how the the Rate of Invoicing increased from 42% to 75% in a few short months, after the lights went on 24 hours per day, and now is averaging 86%
– The Rate of Collections increased from about 30% to an average of 92% at present

30
The Keys to Success (cont’d)
• Campaigns to motivate and inform the clientele and community are carried out via radio, television and schools.

31
The Keys to Success (cont’d)
• Key arrests of people committing fraud, including those occupying important positions in the city, were a necessary way of spreading the message:– This initially provoked animosity towards us– Time however worked to our advantage as the
lights stayed on (people became believers)– Our strongest opponents have now joined the
tide and even denounce cases of fraud

32
The Keys to Success (cont’d)
– If we ever needed support from our clientele, it has been over the past two weeks where the inhabitants of Jacmel protected our facilities from those crying out for “dechoukage”

33
The Keys to Success (cont’d)
• Quality of Service– In addition to providing electrical service 24
hours per day, a big effort has been made to improve the reception of clients and reduce the waiting time:
• in paying their bills • in the hook-up of new clients• in carrying out repairs

34
The Keys to Success (cont’d)
• Improved Logistics– Computerization of the billing process– Major overhaul of equipment done by our staff
(including diesel generators) – achieved by intensive training of our personnel
– We are much better equipped with service vehicles, tools and other key equipment than other ED’H systems

35
The Keys to Success (cont’d)
• Financial Autonomy of ED’H Jacmel– Protects us from the major financial problems
elsewhere within ED’H– Puts the full burden of our success or failure on
our shoulders– Allows us to make strategic choices as to how
we make purchases (e.g. we were able to quickly contract a foreign expert to resolve a specialized problem at our hydro plant)

36
The Keys to Success (cont’d)
• A Culture Based on Electricity– Jacmelians are very proud that their city is
known as the “city of light”– An evaluation of our project carried out by
independent evaluators indicated that this was the most important factor in our success

37
The Keys to Success (cont’d)
• Tariff Adjustments– The devaluation of Haiti’s money due to the political
instability of Haiti coupled with changes in the world price of oil has necessitated huge changes in tariffs
– The Haitian government has approved these changes in spite of the chaotic political climate, although with delays in the case of the most recent one
– This latter case in 2003 threatened the survival of ED’H Jacmel

38
The Keys to Success (cont’d)
• Tariff Adjustments (cont’d)– ED’H headquarters, with support from the government,
went to extraordinary lengths in 2003 to protect its pilot project in Jacmel, in sending shipments of fuel at no charge to ED’H Jacmel until the tariff adjustments took place
– The extraordinary solidarity between ED’H Jacmel and Jacmel’s consumers has resulted in there being no backlash, in terms of non-technical losses, in spite of brutal increases in tariffs in local money

39

40
41
CIDA is planning a final phase atJacmel
• ED’H Jacmel will be assisted by Hydro Quebec in becoming totally autonomous in terms of its expenses (including salaries and needed new investments in infrastructure).
• Assistance will also be provided in helping other parts of ED’H’s electrical system to learn from its pilot project in Jacmel.

42
CIDA is planning a final phase at Jacmel (cont’d)
• Several other cities in Haiti now have 24 hours per day electrical service:– needed additional generation provided by the
private sector– considerable work is still needed to reduce the
non-technical losses to the level of those atJacmel.

43
CIDA is planning a final phase atJacmel (cont’d)
• Support will be provided in:– EDH Jacmel becoming able to meet all of its
financial needs, including salaries and investment
– locating sources of financing for future investment needs (private banks, IFIs, private investors)
– feasibility studies of nearby hydroelectric sites

44
Conclusions
• The project at Jacmel is a means to an end, but not an end in itself:– It demonstrates that the key to the problem of
non-technical losses is the provision of quality of service
– This justifies the needed investments being made to provide quality of service through outEDH’s system

45
Conclusions (cont’d)
• It will be impossible to provide the electrical consumers at Jacmel with electrical tariffs as low as they would be if:– the city could be interconnected to the capital
city of Port-au-Prince– And the losses in this latter system could be
reduced to the level of those at Jacmel

46
Conclusions (cont’d)
• Nevertheless, making the electrical system at Jacmel completely self sustaining: – Assures that the inhabitants of Jacmel will receive
quality of electrical service, key to the economic and social development of Jacmel
– Assures the protection of the investments made while Haiti achieves the political stability needed for the model at Jacmel to be repeated for the remainder of the electrical systems in Haiti

47
Conclusions (cont’d)
• When this day is achieved, at last the country will be in a position to proceed with the electrification of the country and begin the push toward universal access to electricity

Small and Medium Enterprises Providing Electricity Services
Energy Week 2004Jordan SchwartzMukami Kariuki
Jon ExelMarch 9, 2004
A case from Cambodia &An update on The Global Mapping Initiative of
Small-scale Private Service Providers

Outline
• Case - Cambodia Rural Electricity Enterprises
• Update - Global Mapping Initiative of Small-scale Private Service Providers (SPSPs)
• Discussion - What role can the World Bank play?

Case - Cambodia Rural Electricity Enterprises
• 12.5 million people, 2.4 million households;
• GDP per capita US$250• Recovering from long, turbulent
civil war; stable since 1998 • Predominantly agriculture
economy; weak financial infrastructure
• Small grid system: 109 MW capacity, no transmission (yet)
Less than 10% of population has access to electricity

Cambodia: Supply options in a rural, post-conflict country
Household gen-sets3%
EDC-grid2%
Rural Electricity Enterprises
4%
None of these36%
Household batteries
55%
Rural Electricity Enterprises serve about 84,000 HH (1/2 million people)
Total population in Cambodia

218 Rural Electricity Enterprises identified in sample survey
• 184 registered at MIME Provincial DIME offices
• 34 not registered
About 600 REEs (Rural
Electricity Enterprises) nationwide

REE characteristics• 200 customers
• 11% customer growth per annum
• Installed capacity of 100 kW dieselgenerators
• 3 full time employees 53% with high school education 11% additional technical or management training
Many Rural Electricity Enterprises are village businessmen

REE characteristics (continued)
• Financing49% owner equity22% family borrowing23% informal debt6% micro-finance
• 82% have power losses of more than 20 percent• Limited service: 87% of customers desiring extended
service• Commercial prices ranging from 31 to 91 cents/kWh• Flat tariffs or 2-block decreasing block tariffs• Connections (and meters!) purchased by customers
• 85% of loans:12 months or less• Interest: 1% to 2% per month

What REEs request• Stable and predictable
business and regulatory environment
• Access to financial resources
• Access to technical and management training
Institutional platform from which to define, voice, and defend common interests – business associations

Cambodia – unique or part of a trend• Supply of micro-power systems continues to grow:
• Ltd. information from: Sri Lanka, Bangladesh, Laos, Yemen, Somalia, Mali, Bolivia
Off-grid, home based Decentralized increasingly acceptedCommunity-based initiativesTechnological advances
However, no comprehensive understanding of national, regional or global situation available
0.0
5.0
10.0
15.0
20.0
25.0
30.0
35.0
40.0
45.0
50.0
1990 1991 1992 1993 1994 1995 1996 1997 1998 1999 2000 2001 2002
Bill
ion
US$
dol
lars
Private participationMicro power systemsMicro power systems (trend)

Global Mapping and Policy Framework Initiative
• Objective 1: to identify, characterize, map and quantify the role of small-scale private service providers of water supply and electricity to illustrate the scale and level of importance of these organizations. (PPIAF)
• Objective 2: identify and support action by policy makers, investors, donor agencies, services providers and their associations to improve the quality of SPSP services, increase affordability of these services, and expand their business opportunities where appropriate. (w/ BNWP)

Phase 1 – Literature review & core database
Core questions:1. What is the scale and scope of SPSP activity in the
water supply and energy sectors?2. What are common typologies and characteristics of
SPSPs?3. What barriers do SPSPs encounter in trying to
establish and/or expand their business, improve the quality of their service and reduce their costs?
4. What actions can be taken to overcome the barriers faced by the SPSPs?
5. What cross-sectoral efficiencies can be identified?

Methodology and status: Phase 1
General search
Specialist referrals
Reference lists
Long list of references (~3,000)
Long list of relevant documents (~200)
Core data-base with answers to 5 core questions (~175)
Rough db-data into analytical document
Findings in main documentAdditional targeted
literature review on initial findings (~100)Draft conclusions
Focus group –expert review
Conclusions
Request for input from network
Final results

Preliminary Findings
• Scope and scale
• Characterization and typology
• Gap analysis
• Barriers/Action – Agenda for Success

What do we know of scope & scale?
• Where can we find SPSPs of electricity?• Where can we find SPSPs of water supply?• How many SPSPs are there worldwide?• How many clients are served by SPSPs?• What is their regional and global contribution?

World Map – 27 countries with SPSPs
Map of SPSPs of water supply and electricity

Map of SPSPs of electricity

-
1,000
2,000
3,000
4,000
5,000
6,000
7,000
8,000
EAP SAR AFR MENA LAC ECA Total
Num
ber
of S
PSPs
-
2.00
4.00
6.00
8.00
10.00
12.00
Num
ber
of c
lient
s (m
illio
n)
Phase I: Number of documented SPSPs and number of clients per region

SPSP Electricity cases documented
• EAP– Cambodia– Lao PDR– Philippines• Africa
– Kenya– Mali– Ethiopia– Somalia– Uganda– Mozambique
• SA– Bangladesh– Nepal– Sri Lanka
• MENA– Yemen• LAC
– Bolivia– Nicaragua

SPSP Typology
Distributor / dealers• over the counter sale of individual
home systems, sell systems on cash or credit basis
• individual system-owned distributor, lease/rent system to client
Distributor / fee for service• individual system leased to HH by
service company (franchised by the utility)
Point-source / charging stations• generate own electricity for
charging station, electricity sold to customers by the charged battery
Point-source / charging stations• extend utility network to battery
charging station, sell electricity on basis of charged battery
Mini-grid networks• generate own electricity and
distribute to customers through local network
Grid-connected networks• extend utility network, buy
electricity in bulk, sell electricity in utility and non-utility areas
IndependentDependent

SPSP Typology
Distributor / dealers• Dealers• Energy service company
Distributor / fee for service• Energy service company
Point-source / charging stations• Enterprises• Community based organizations
Point-source / charging stations• Enterprises
Mini-grid networks• Concessionaires / licensee• Cooperatives• Enterprises / corporations• Community based organizations
Grid-connected networks• Concessionaires / licensee• Cooperatives• Enterprises / corporations
IndependentDependent

Reasons for incidence of SPSP’s
• Poor coverage of national utilities
• Significant rural, disbursed population base
• Conflict / Post-conflict environment– Disrupted service from utilities, asset stripping– Low levels of private investment

Risk and FDI: No Correlation
1 0
2 0
3 0
4 0
5 0
6 0
7 0
8 0
-5 0 5 1 0 1 5 2 0 2 5 3 0
F D I /G D P (p e rc e n t )
Cou
ntry
Ris
kC o u n t ry R is k v s . F D I p e r G D P in D e v e lo p in g C o u n t r ie s

Risk and PPI: Correlation
0
20
40
60
80
0 1 2 3 4 5
PPI/GDP (percent)
COUNTRY_R I SK
Country Risk vs. PPI in Non-Conflict C

Risk and PPI (conflict): Correlation
1 0
2 0
3 0
4 0
5 0
6 0
0 .0 0 .4 0 .8 1 .2 1 .6 2 .0
P P I/G D P (percen t)
Cou
ntry
Ris
k R
atin
g (p
erfe
ct s
core
= 1
00)
C ountr y R is k vs . PPI in C onfl ic t C o untr ie s

Post-conflict investments in infrastructure
Percentage of PPI in Non-Conflict, All Conflict and Failed State Conflict Countries
.92%455632193641
278
112
917
33
.93%
.74%
46
15
665
7
AverageAnnual GDP(US$ billion)
Average GDPper Capita
(US$)
Total PPI ('90-'02) (US$
billion)
AverageAnnual PPI
(US$ million)
PPI/GDP Ratio
Non-conflictCountries
All ConflictCountries
Failed StateConflictCountries

Post-conflict investments by sector
Number of PPI Projects by Sector
0
4
8
12
16
0 1 2 3 4 5 6 7 8
Year After Conflict
PPI P
roje
cts
TransportWaterEnergyTelecom

Post-conflict countries – slow to see large-scale energy investment
Number of PPI Energy projects
0
2
4
6
8
0 1 2 3 4 5 6 7 8
Year After Conflict
PPI P
roje
cts Gas Distribution
Electricity GenerationElectricity Distribution

Post-conflict countries: Small-scale response in Cambodia
Estimated Annual Establishment of New REE Firms,1990-2000
0%
2%
4%
6%
8%
10%
12%
Before1990
1991 1992 1993 1994 1995 1996 1997 1998 1999 2000
Initial Peace
agreementArmed
conflict; Coup d’etat
New elections

Gap analysisSPSPs
Cross sectoralCharacteristics
Barriers
Scope & Scale
Actions
Representative
Ric
hnes
s
Clients
Countries with SPSPs
SPSPs in countries
Machinery
Organizational
FinancingProductsCustomer service
Revenue collectionHuman resources
Results
Gap analysis for core study areas
Volume of documentation
Level of D
etailed Treatm
ent

Gap analysis
• Scope & scale – Sampling is random; entire countries and sub-regions not covered
• Characteristics – Little known on business sizes; operating, technical or financial characteristics; customer profiles; pricing
How did authors of sample identify Barriers and Actions while there is only limited information on details of SPSPs available?

Conclusions of Phase I• Gap analysis
– Scope & scale of SPSP’s: substantial gaps– Operating & financial characteristics: substantial gaps – Barriers and actions: speculative (Mismatch between
detailed information and barriers/actions)
• Scope and scale– Documented about 7,000 SPSP worldwide in 27 countries
serving about 11 million clients– EAP and SA most documented regions

Next StepsQuantify – Global Mapping Initiative (PPIAF)
– Comprehensive data sets – “all types? all locations?” – link to MDGs, database at country level
– More in-depth look at specific issues – tariffs, prices, investment, staffing,
Qualify – Policy Reform Initiative (BNWP & PPIAF)– Support for reforms - legal status /regulatory regime, – Develop and initiate capacity building/training - business
environment, regulation, policy setting– Assist project/program pilots investment, subsidy design, market
development– Address financing constraints: Technical support, Credit
Facilities,

What is the potential role of the Bank?• Business Enabling Environment
– Regulation, contracts, licensing– Policy, sector laws, plan for convergence
• Access to Finance– Debt finance– Private capital– Connection subsidies
• Capacity Building– SPSPs, community/end users, associations

Supporting an enabling environment 1
Rural ElectricityEnterprises
Ministry (MIME)
Consumers
Utility
(EdC)
Registration

Supporting an enabling environment 2
Rural ElectricityEnterprises
Regulator (EAC)
Licensing
Service
Ministry (MIME)
Consumers
Utility
(EdC)
Sector Policies and Legal Framework

Supporting an enabling environment 2
Rural ElectricityEnterprises
Regulator (EAC)
Licensing
Service
Ministry (MIME)
Consumers
Utility
(EdC)
Association and Capacity Building

Supporting an enabling environment 3
Rural ElectricityEnterprises
Regulator (EAC)
Licensing
Service
Ministry (MIME)
Consumers
Utility
(EdC)
Association and Capacity Building
Financing
TechnicalAssistance
Sub-grants for connection subsidies
Rural Electrification
Fund
Local Financial Institutions
Model PPA’s