the network scale-up method (nsum) christopher mccarty october 30, 2012
TRANSCRIPT
The Network Scale-Up Method (NSUM)
Christopher McCarty
October 30, 2012

The NSUM team
• H. Russell Bernard (University of Florida)
• Peter D. Killworth (Southampton Oceanography Centre)†
• Christopher McCarty (University of of Florida)
• Eugene Johnsen (UC-Santa Barbara)
• Gene A. Shelley (Georgia State University/CDC)

Outline
• Origin and Evolution of Network Scale-up Method (NSUM)
• How to do it
• Compromising assumptions
• Current application in international health

Origin and Evolution of Network Scale-up Method (NSUM)

Populations of Interest
• Public health and public policy advocates are interested in certain populations
• We know a lot about each population, but we don’t know how many there are
• For many reasons these populations are virtually impossible to count
• HIV positive
• IV Drug Users
• Migrants
• Homeless
• Men Who Have Sex with men (MSM)
• Female Sex Workers
The Problem
How do you estimate the size of a population that you cannot count?

Mexico City Earthquake - 1985
Government estimates were 7,000 dead
“Everyone seemed to know someone who died” –H. Russell Bernard
In a city of 18 million people, could the number of dead be 7,000 if everyone knew someone who died?

Estimate network sizeEstimating the Size of an Average Personal Network and of an Event Subpopulation
H. Russell Bernard, Peter D. Killworth, Eugene C. Johnsen, Scott Robinson In: The Small World, ed. M. Kochen, 159-75 (1989)
Funded by NSF grant BNS-8318132 and UF Graduate School
• Mexico City divided into 20 grids, 20 respondents per grid, or 400 respondents
• 91 of 400 (23%) knew someone who died
• But this did not reveal how many people died
• For this they needed to know the personal network size of each respondent
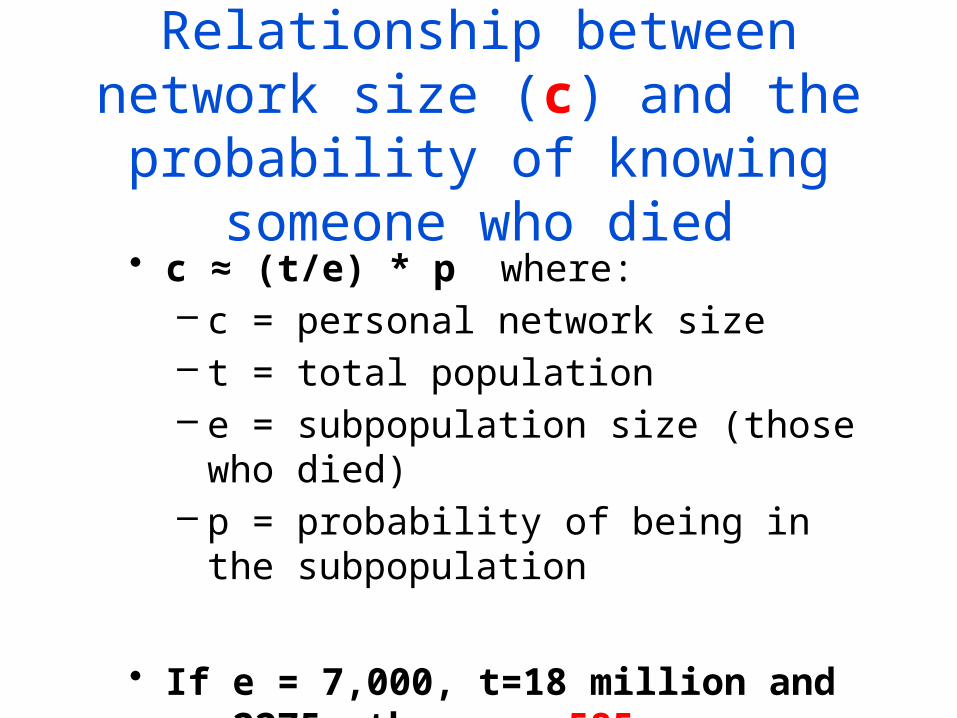
Relationship between network size (c) and the probability of knowing
someone who died• c ≈ (t/e) * p where:
– c = personal network size– t = total population– e = subpopulation size (those who died)– p = probability of being in the
subpopulation
• If e = 7,000, t=18 million and p=.2275 then c = 585

Back estimate an unknownEstimating the Size of an Average Personal Network and of an Event Subpopulation: Some Empirical Results
H. Russell Bernard, Peter D. Killworth, Eugene C. Johnsen, Scott Robinson Social Science Research 20: 109-121 (1991)
Presented at American Statistical Association (1987)Funded by NSF grant BNS-8318132 and UF Graduate School
• Survey in Mexico City of 2,260 respondents
• Solved for the personal network size that best fit all subpopulations (c=220)
• Applied this to reported unknown m (rape victims).
• Best estimate for the number of rape victims in Mexico City (the unknown) was 6,303 ≤ e ≤ 8,811
Subpopulation Event population size (e)
Probability of knowing someone (p)
Network size (c)
Doctors 30,426 .3889 173
Mailmen 14,728 .1473 116
Bus Drivers 11,696 .2571 272
Quake Victims 10,000 .2668 332
TV Repairmen 4,013 .2619 810
Priests 1,595 .2854 2254

A Primitive modelEveryone’s network in a society reflects the distribution of subpopulations in that society
– t = the size of a population (e.g. the U.S.)
– e = the size of some subpopulation within it (e.g. diabetics).
– m = the number of members of the subpopulation known by any one person (e.g. diabetics)
– c = personal network size
How to do it
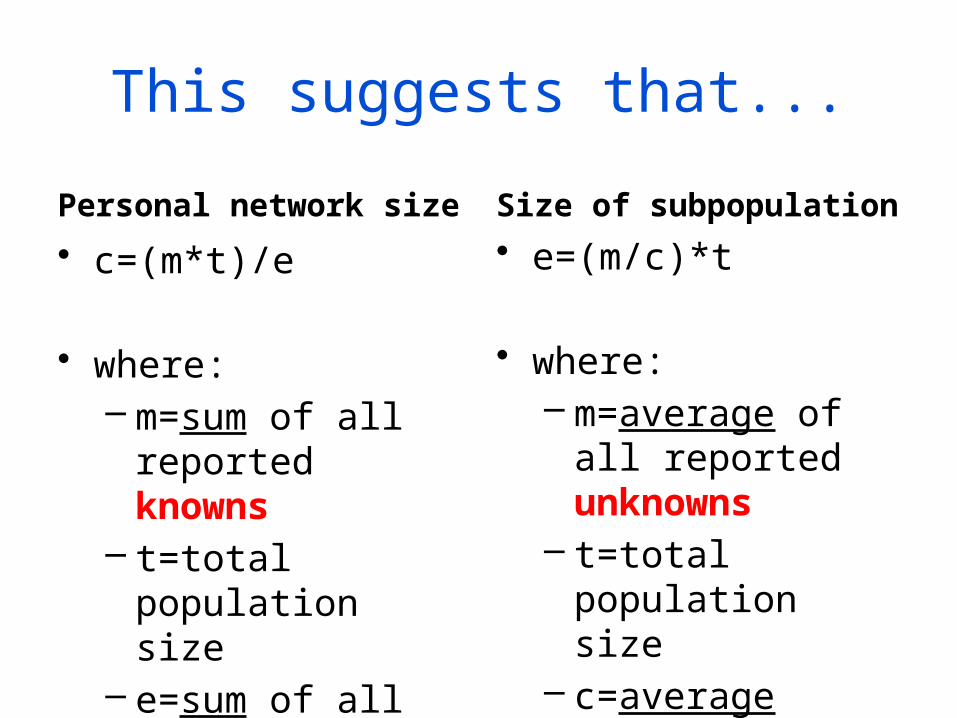
This suggests that...
Personal network size
• c=(m*t)/e
• where:– m=sum of all
reported knowns– t=total population
size– e=sum of all known
population sizes
Size of subpopulation
• e=(m/c)*t
• where:– m=average of all
reported unknowns– t=total population
size– c=average network
size

To recap: NSUM is a 2-step process
• Step 1: Estimate personal network size– Use estimates of the number known (m) in a set of
known populations to estimate network size for each respondent
• Step 2: Use this to scale-up unknowns– Use the reports of the unknowns to scale-up to the
unknown population
• Note that under-reporting of known m will result in lower estimates of c, and bigger e. Under-reporting of unknown m will result in lower e.
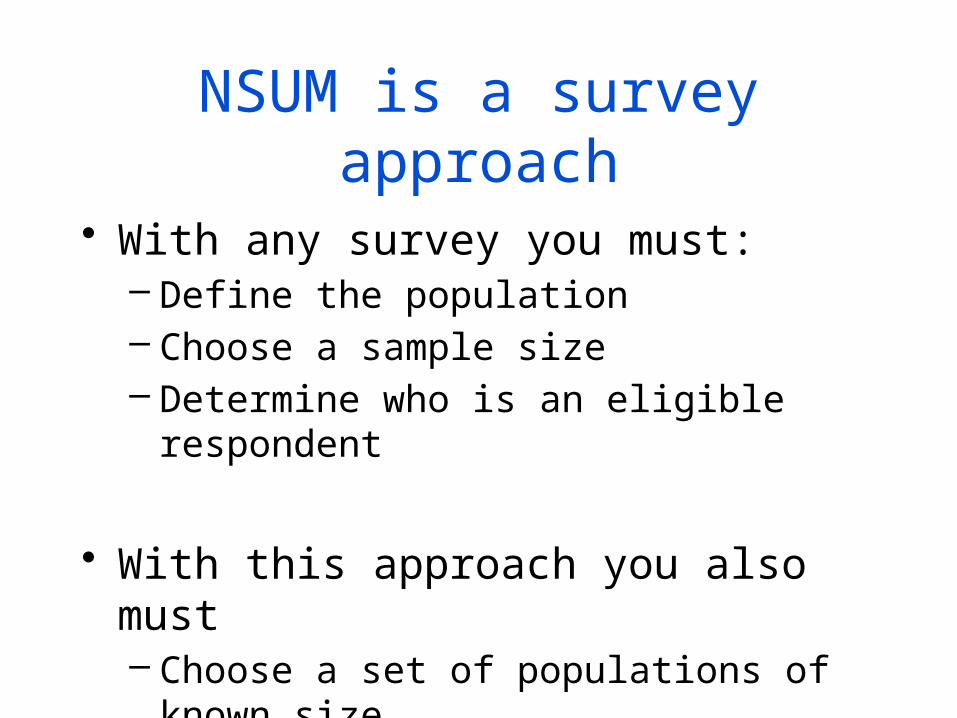
NSUM is a survey approach
• With any survey you must:– Define the population– Choose a sample size– Determine who is an eligible respondent
• With this approach you also must– Choose a set of populations of known size

Select respondent population
• Respondent population is not the same as the population to be estimated (target population)
• Respondents are sampled from the population within which the subpopulation exists– Interview U.S. respondents to estimate
homeless population in the U.S.– Interview Barcelona respondents to estimate
heroin users in Barcelona
• You must know the size of the respondent population (t) (e.g. the U.S. or Barcelona)

Choose sample size
• As in all surveys, sample size should be based on expected margins of error. If the thing you are estimating varies a lot, then the sample should be larger to capture that
• Margins of error could be calculated on either network size (c) or on the values for the unknowns (m)– Matthew Salganik is working no this problem
• Our data suggest that a survey of 400 respondents would generate a margin of error of ±26 network alters
• A survey of 1,000 in the U.S. would generate a margin of error of ±16 network alters

Alter boundary
• Definition of who is an alter can have enormous effects on the estimate of network size, and therefore then size of the unknown subpopulation
• Early studies of network size used ever known, while our studies used currently known
• Our definition:– You know them and they know you by sight or by
name. You have had some form of contact with them in the past two years and you could contact them if you had to

Selecting known populations
• Known populations should vary in size and type– DO NOT limit study to populations related to, say, health
conditions, although plentiful, may introduce error– DO NOT use only large populations (such as men or people over
age 65). This introduces recall error– DO NOT use only small populations. This introduces error from
very few hits– A rough guide is to use populations between .1% and 4% of the
total population
• Ideally collection of sub-population data will be recurring so that they can be used in subsequent years
• It is important that the data all reflect the same year (be aware that some population data lags)

Potential Sources in the U.S.
• U.S. Statistical Abstract• U.S. Census• FBI Crime Statistics• State and city-level Vital Statistics• Surveys by organizations• Voter Registration databases

We experimented with names
• The U.S. Census provides estimates of both first name and last names
• The advantage of names is that they vary in size and are typically ascribed
• Countries and cultures vary in the way they use names
• They are also prone to what’s called barrier error (more about this in a minute)

Peter D. Killworth, Christopher McCarty, Eugene Johnsen, Gene A. Shelley and H. Russell Bernard. (1998) A Social Network Approach to Estimating Seroprevalence in the United States. Evaluation Review 22:289-308
Funded by NSF grant SES-8803577Estimating the Size of Hard-to-Count Populations
• Telephone survey of 1,524 Florida respondents
• Respondents estimated:– How many they knew in six known subpopulations (four different
sets of six)– If they knew someone with certain first names– How many they knew who tested positive for HIV and those with
AIDS
• Average network size was estimated to be 105 (s.d. 92)
• This approach was limited by using only six known populations for each respondent and not asking how many people were known with first names
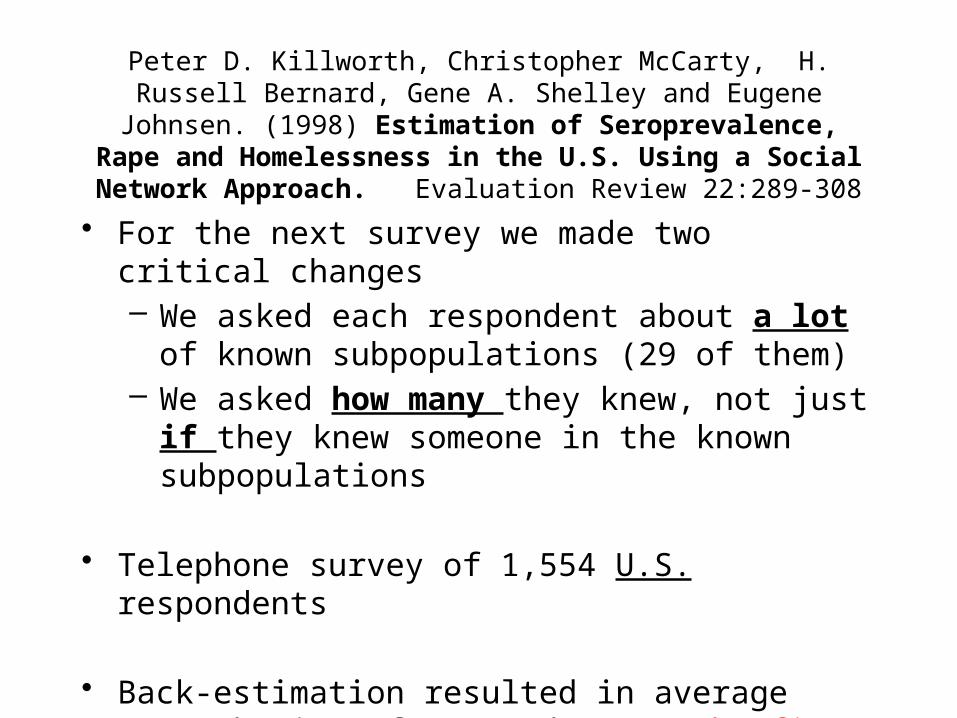
Peter D. Killworth, Christopher McCarty, H. Russell Bernard, Gene A. Shelley and Eugene Johnsen. (1998) Estimation of Seroprevalence,
Rape and Homelessness in the U.S. Using a Social Network Approach. Evaluation Review 22:289-308
• For the next survey we made two critical changes– We asked each respondent about a lot of known
subpopulations (29 of them)– We asked how many they knew, not just if they knew
someone in the known subpopulations
• Telephone survey of 1,554 U.S. respondents
• Back-estimation resulted in average network size of 286 s.d. 291 (the first instance of an estimate near 290)

Summation method
• Previous attempts estimated network size by back-estimating from known subpopulations
• We thought of an alternative approach:– Ask respondents how many people they know
in mutually exclusive and exhaustive relation categories
– Sum the estimates in those categories to get network size

Relation categoriesH. Russell Bernard, Peter D. Killworth, Christopher McCarty. (1982)
INDEX: An Experiment in Social Structure. Social Forces 61:99-133
• Immediate family• Other birth family• Family of spouse or significant other• Co-workers• People at work but don't work with directly• Best friends/confidantes• People know through hobbies/recreation• People from religious organization• People from other organization• School relations• Neighbors• Just friends• People known through others• Childhood relations• People who provide a service• Other
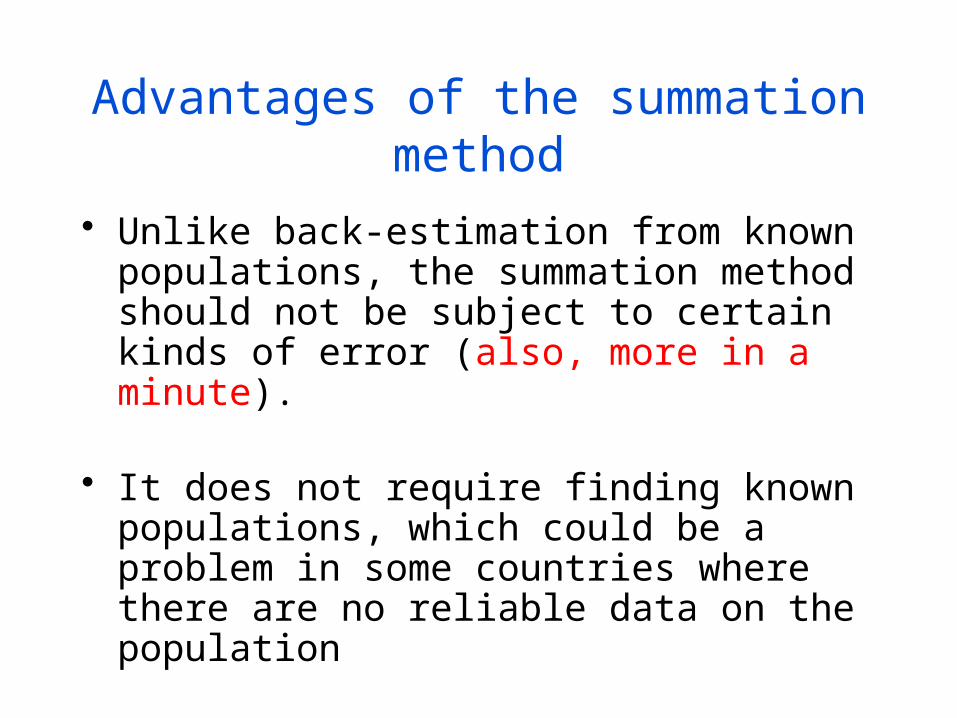
Advantages of the summation method
• Unlike back-estimation from known populations, the summation method should not be subject to certain kinds of error (also, more in a minute).
• It does not require finding known populations, which could be a problem in some countries where there are no reliable data on the population
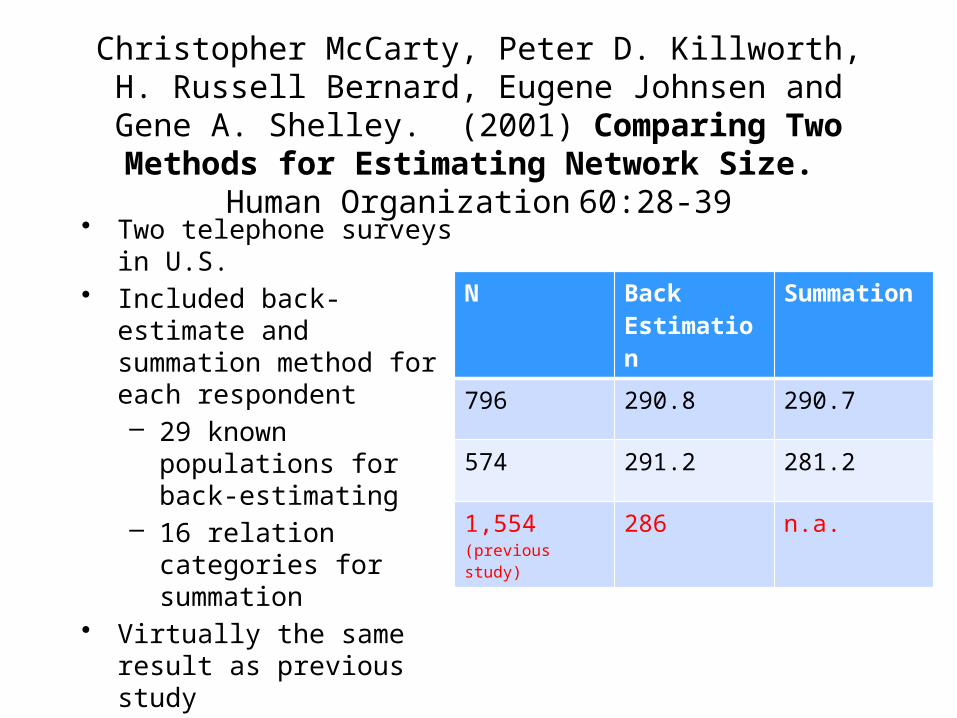
Christopher McCarty, Peter D. Killworth, H. Russell Bernard, Eugene Johnsen and Gene A. Shelley. (2001) Comparing
Two Methods for Estimating Network Size. Human Organization 60:28-39
• Two telephone surveys in U.S.• Included back-estimate and
summation method for each respondent– 29 known populations for
back-estimating– 16 relation categories for
summation• Virtually the same result as
previous study• Correlation between methods is
either fully or only .56
N Back Estimation
Summation
796 290.8 290.7
574 291.2 281.2
1,554 (previous study)
286 n.a.

Reliability check
Change the data• We changed reported values at or
above 5 to a value of 5 precisely. The mean dropped to 206, a change of 29%.
• We set values of at least 5 to a uniformly distributed random value between 5 and 15. We repeated the random change (5 – 15), but only for large subpopulations (with >1 million). The mean increased to 402, a change of 38% -- in the opposite direction.
Survey of clergy• We surveyed a national
sample of 159 members of the clergy – people widely thought to have large networks.
• Mean c = 598 for the back-estimation method
• Mean c = 948 for the summation method

So, 290 was not a coincidence
1. Two different methods of counting similar results
2. Changing the data produced large changes in the results, and in the expected directions
3. People who are widely thought to have large networks did have large networks

The distribution of c

The data track
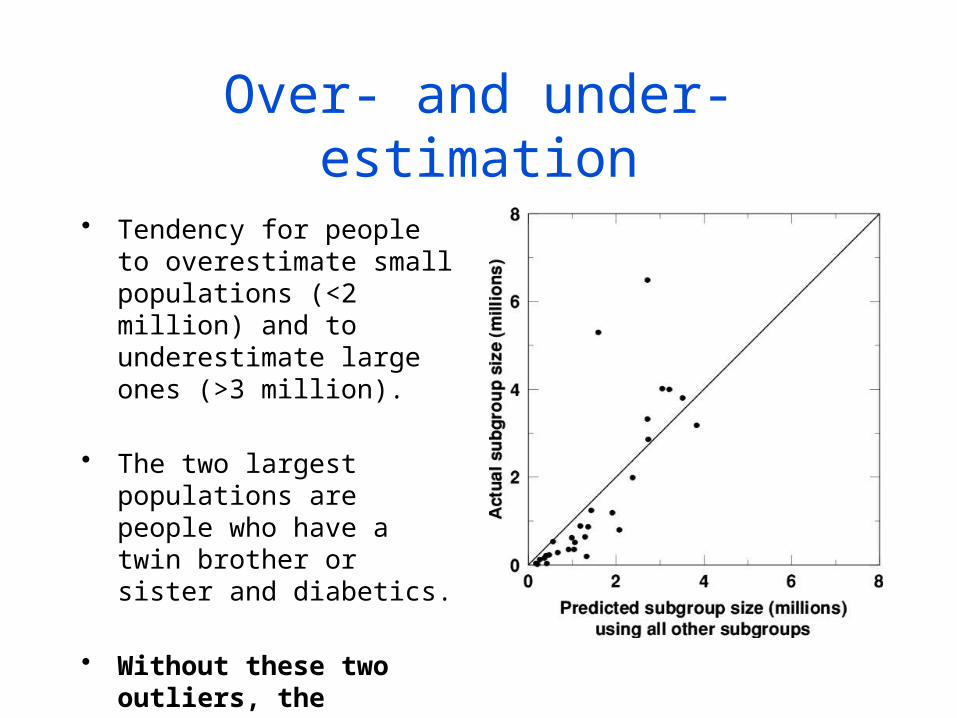
Over- and under-estimation
• Tendency for people to overestimate small populations (<2 million) and to underestimate large ones (>3 million).
• The two largest populations are people who have a twin brother or sister and diabetics.
• Without these two outliers, the correlation rises from r = .79 to r = .94
Compromising assumptions
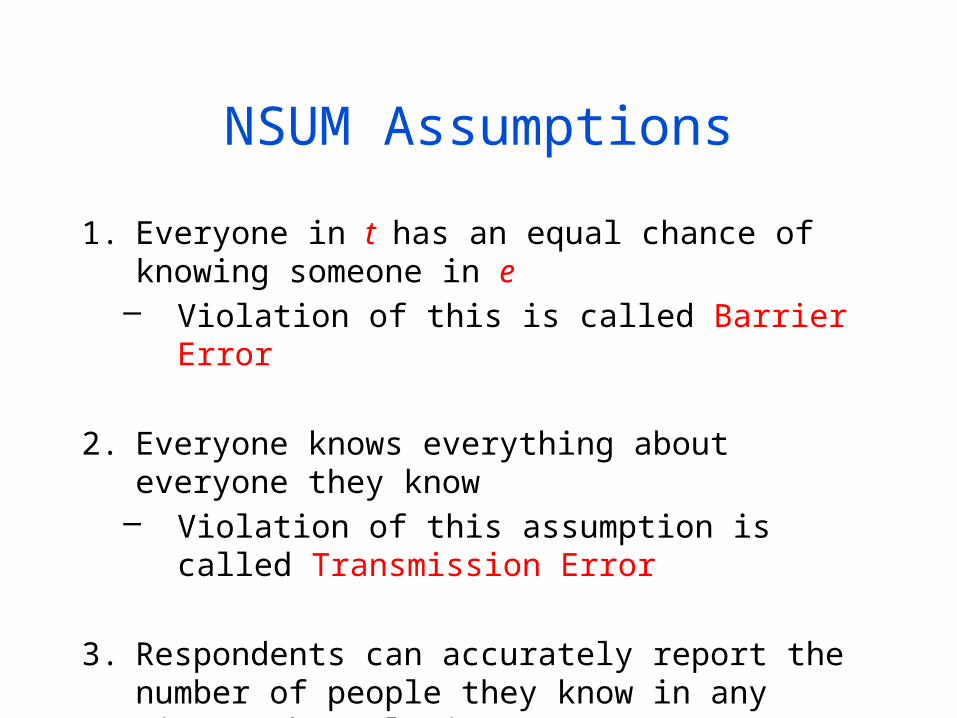
NSUM Assumptions
1. Everyone in t has an equal chance of knowing someone in e
– Violation of this is called Barrier Error
2. Everyone knows everything about everyone they know– Violation of this assumption is called Transmission
Error
3. Respondents can accurately report the number of people they know in any given subpopulation
– Violation of this is called Recall Error
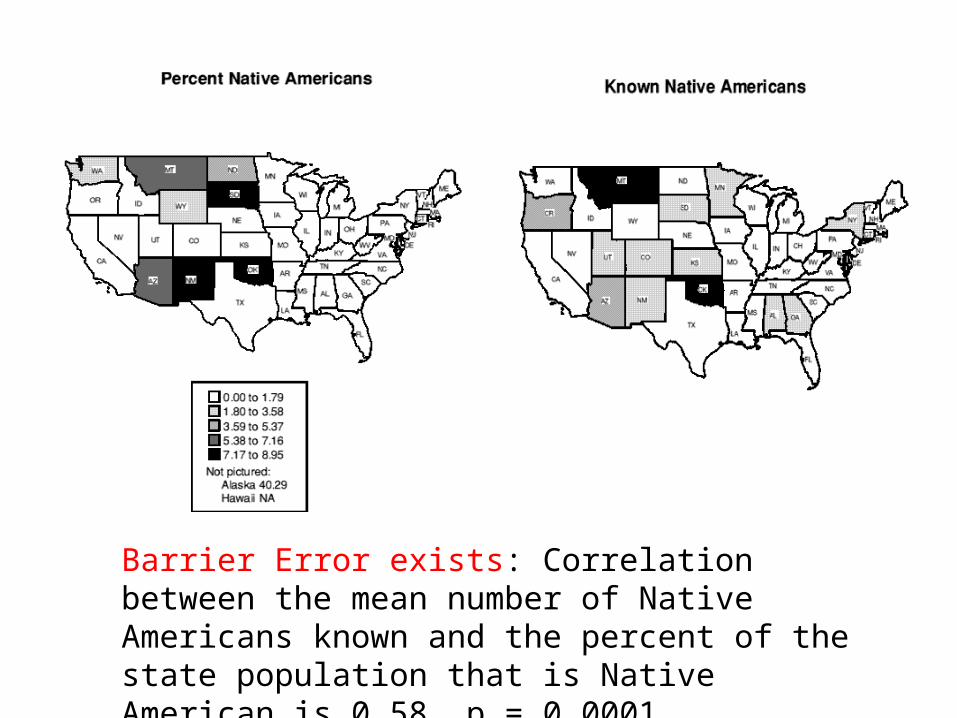
Barrier Error exists: Correlation between the mean number of Native Americans known and the percent of the state population that is Native American is 0.58, p = 0.0001.

Population State Sex Race Age Education Marital status
Work status
Religion Political Party
Native Americans Gave birth in past 12 months
Adopted a child in past year
Widow(er) under 65 years
On kidney dialysis Postal worker Commercial pilot Member of Jaycees Diabetic Opened a business in year
Have a twin brother or sister
Licensed gun dealer Came down with AIDS Males in prison Homicide victim in past year
Suicide in past year Died in wreck in past year
Women raped in past year
Homeless HIV positive
Known populations and their relationship to demographic variables (Barrier Error – there are many dots!)
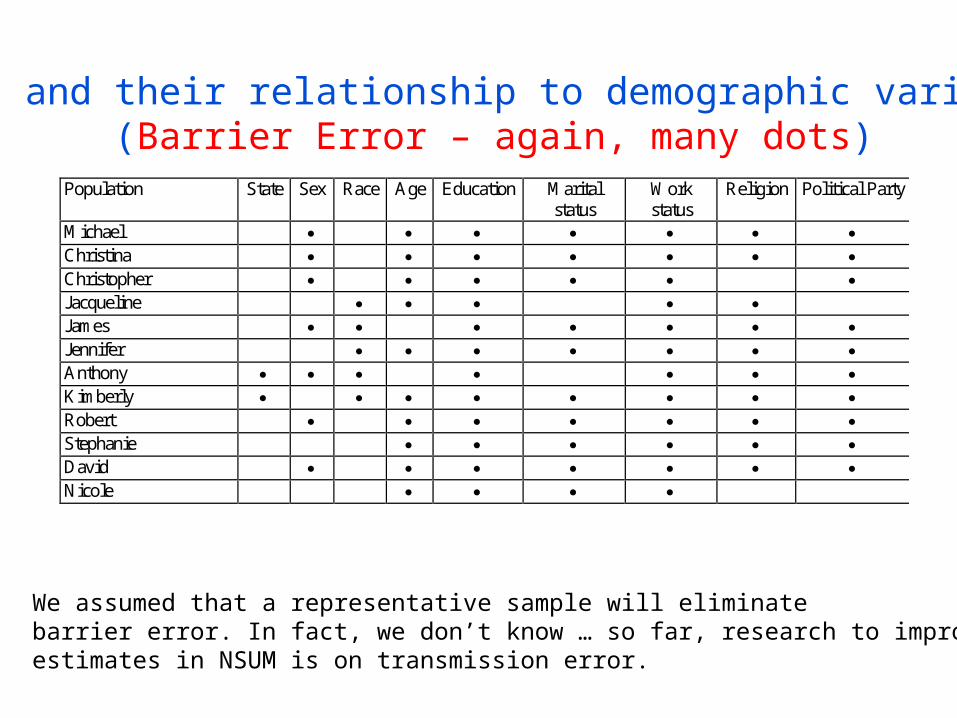
Names and their relationship to demographic variables (Barrier Error – again, many dots)
Population State Sex Race Age Education Marital status
Work status
Religion Political Party
Michael Christina Christopher Jacqueline James Jennifer Anthony Kimberly Robert Stephanie David Nicole
We assumed that a representative sample will eliminate barrier error. In fact, we don’t know … so far, research to improve estimates in NSUM is on transmission error.
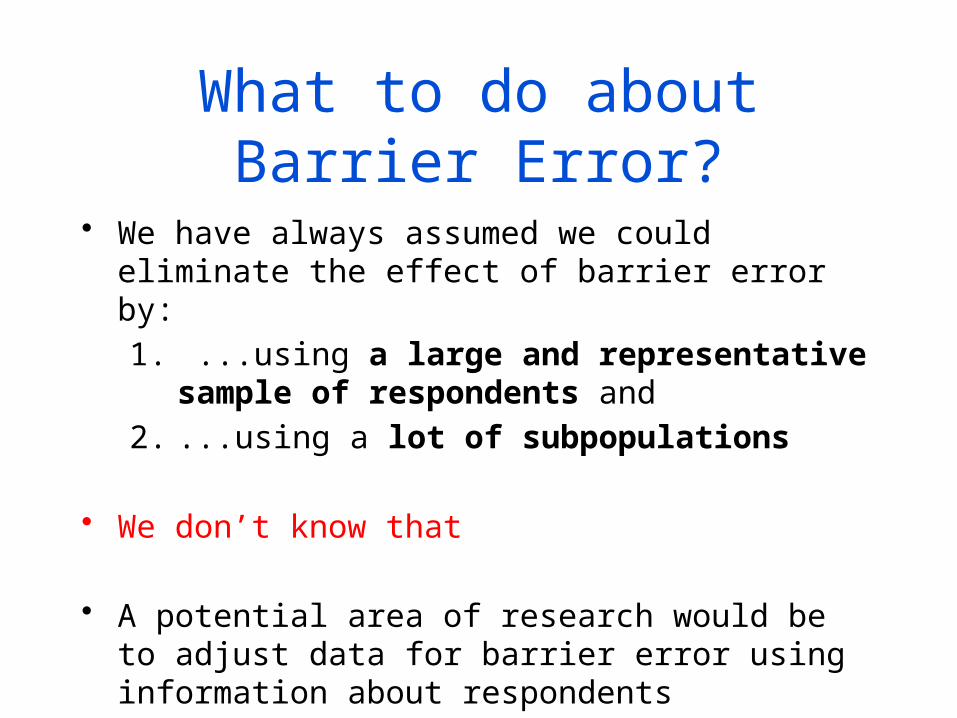
What to do about Barrier Error?
• We have always assumed we could eliminate the effect of barrier error by:
1. ...using a large and representative sample of respondents and
2. ...using a lot of subpopulations
• We don’t know that
• A potential area of research would be to adjust data for barrier error using information about respondents
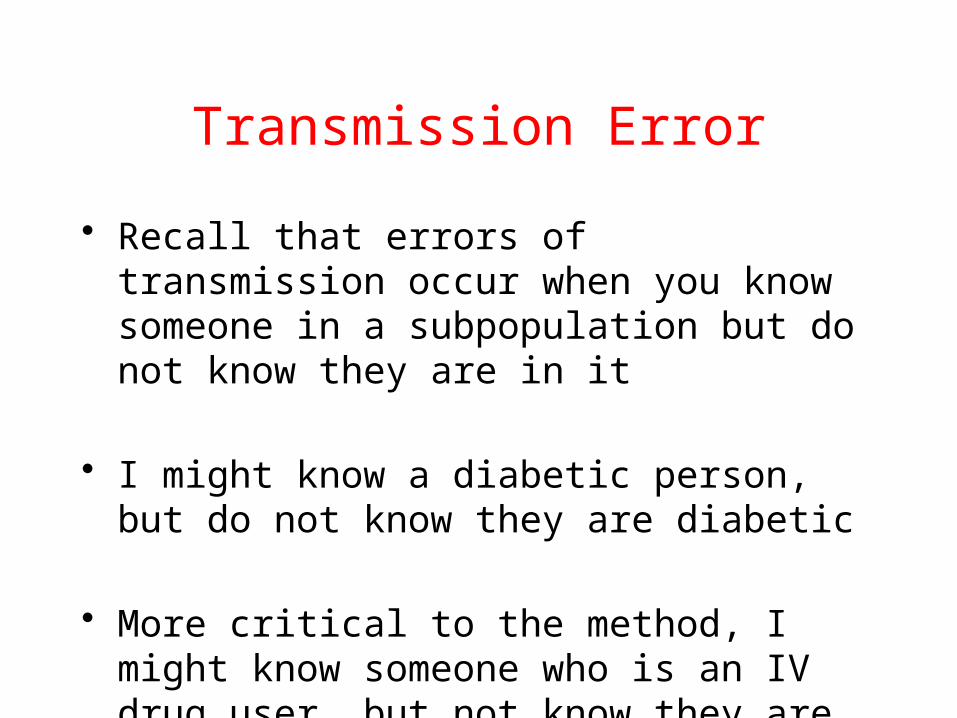
Transmission Error
• Recall that errors of transmission occur when you know someone in a subpopulation but do not know they are in it
• I might know a diabetic person, but do not know they are diabetic
• More critical to the method, I might know someone who is an IV drug user, but not know they are an IV drug user
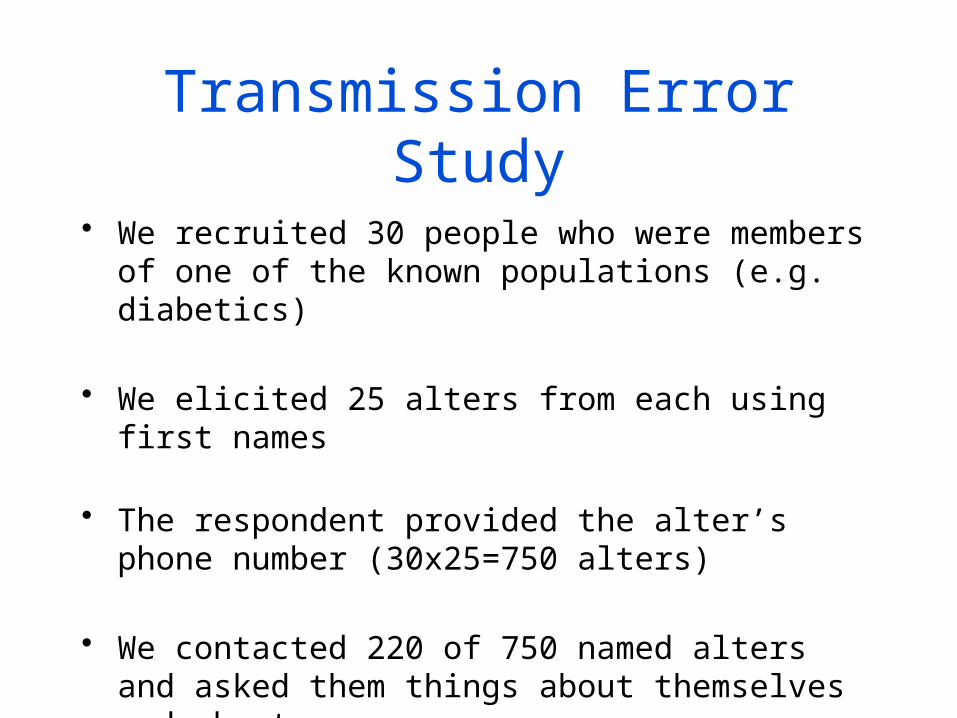
Transmission Error Study
• We recruited 30 people who were members of one of the known populations (e.g. diabetics)
• We elicited 25 alters from each using first names
• The respondent provided the alter’s phone number (30x25=750 alters)
• We contacted 220 of 750 named alters and asked them things about themselves and about ego.

Population % who knew
% who did not know
Respondents
# of alters
Am. Ind. 100 0 2 12
Diabetic 55 45 6 44
Birth in last 12 mos. 93 7 3 27
Gun dealer 92 8 1 12
Member of JC’s 58 42 1 12
Dialysis 88 12 5 26
Business in last 12 mos. 75 25 4 16
Postal worker 100 0 1 10
Has twin 88 12 2 24
Widowed <65 97 3 4 38
Results of Transmission Study

Findings from the alter study
• Some things are more visible (kidney dialysis versus diabetic)
• Some things are very easy to know (99% know marital status of ego)
• Some things are hard to know (52% knew how many siblings ego had)

Some people withdrawGene A. Shelley, Peter D. Killworth, H. Russell Bernard, Christopher McCarty, Eugene C. Johnsen, Ronald E. Rice. (2006) Who knows your HIV status II:
Information propagation within social networks of seropositive people. Human Organization 65: 430-445
• Gene Shelley conducted ethnographic work with a sample of HIV+ respondents
• People said that they withdrew from their network in order to limit the number of people who knew their HIV status
• Eugene Johnsen confirmed that HIV+ people have, on average, networks that are one-third the average of others in the U.S.
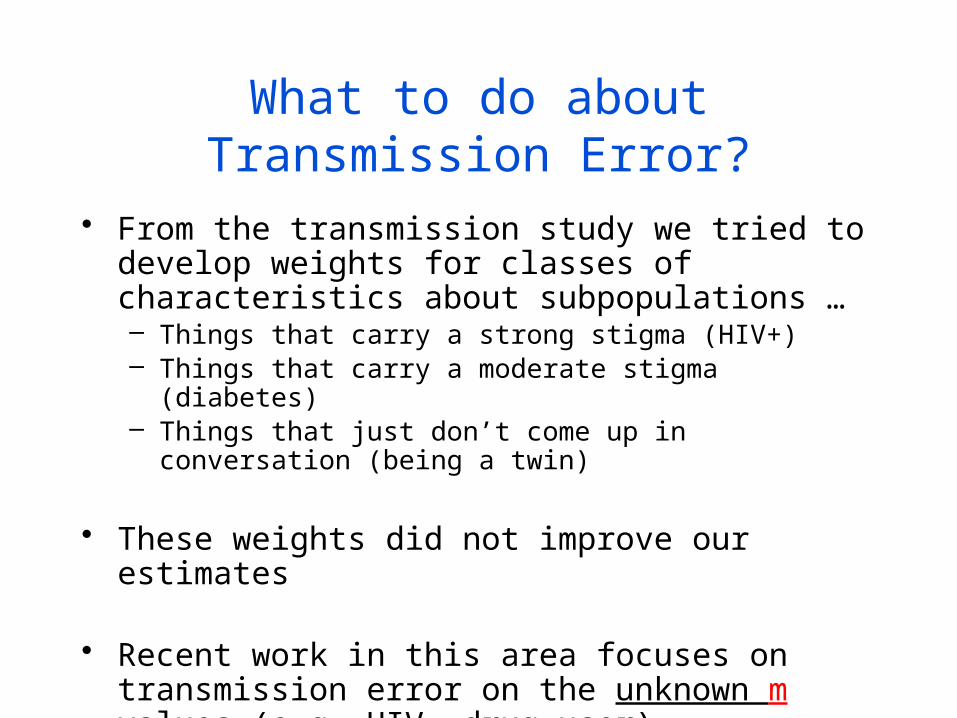
What to do about Transmission Error?
• From the transmission study we tried to develop weights for classes of characteristics about subpopulations …– Things that carry a strong stigma (HIV+)– Things that carry a moderate stigma (diabetes)– Things that just don’t come up in conversation (being a twin)
• These weights did not improve our estimates
• Recent work in this area focuses on transmission error on the unknown m values (e.g. HIV, drug user)
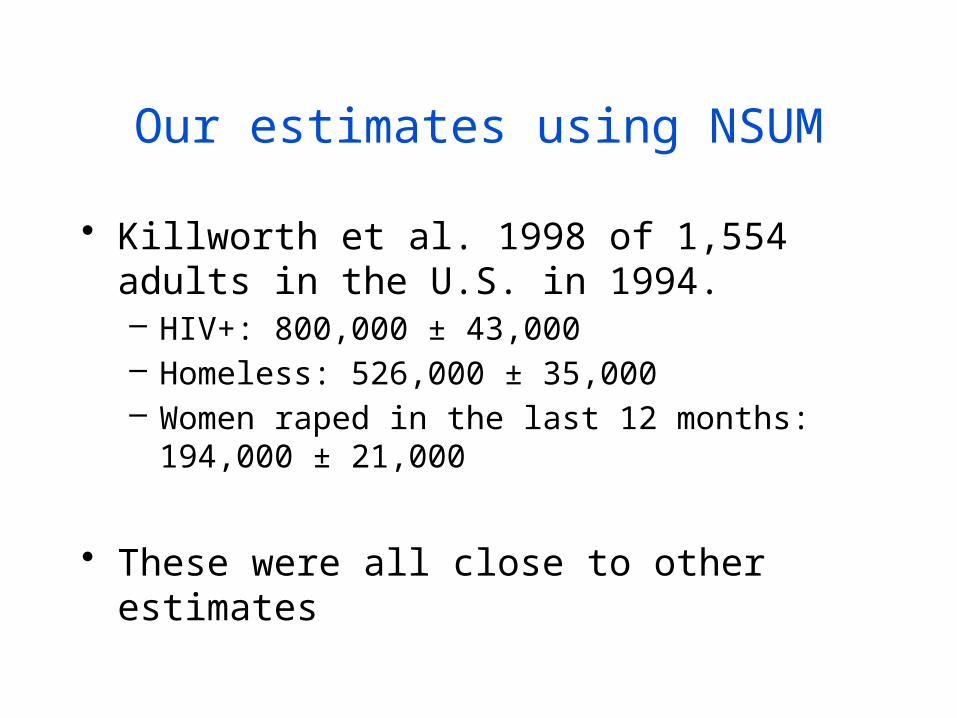
Our estimates using NSUM
• Killworth et al. 1998 of 1,554 adults in the U.S. in 1994.– HIV+: 800,000 ± 43,000– Homeless: 526,000 ± 35,000– Women raped in the last 12 months: 194,000 ± 21,000
• These were all close to other estimates
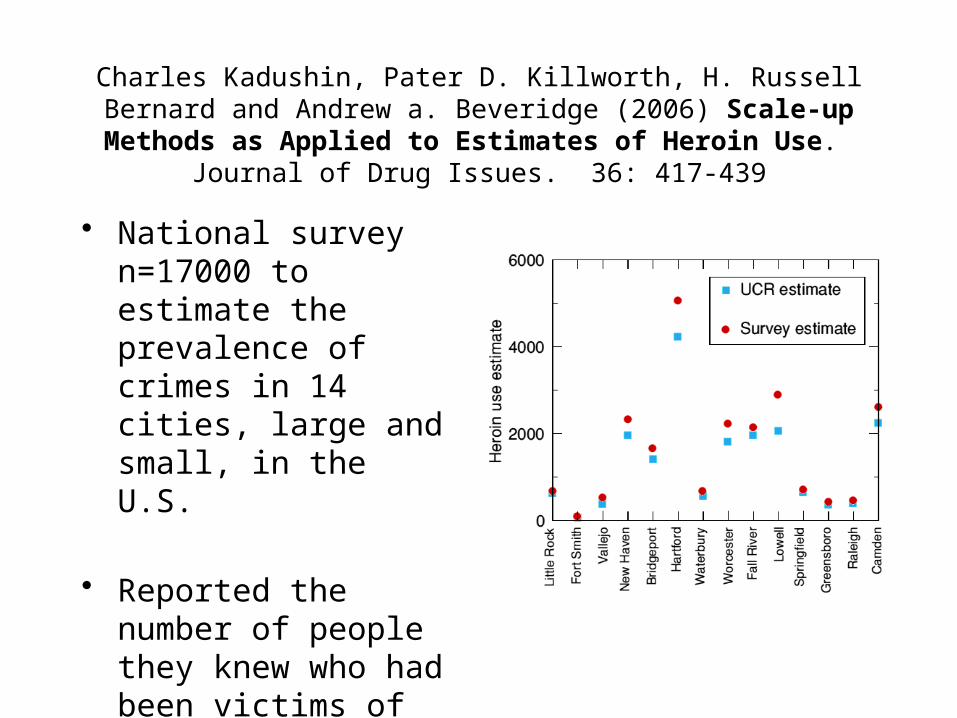
Charles Kadushin, Pater D. Killworth, H. Russell Bernard and Andrew a. Beveridge (2006) Scale-up Methods as Applied to Estimates of Heroin
Use. Journal of Drug Issues. 36: 417-439
• National survey n=17000 to estimate the prevalence of crimes in 14 cities, large and small, in the U.S.
• Reported the number of people they knew who had been victims of six kinds of crime and the number of people they knew who used heroin regularly.

Tian Zheng, Matthew Salganik and Andrew Gelman (2006) How many people do you know in prison?: Using overdispersion in count data to estimate social
structure in networks. Journal of the American Statistical Association 101(474) 474: 409-423
• Re-analyzed NSUM data from Killworth et al. (1998)
• Developed a method to estimate social structure using NSUM survey data– Respondents varied in the number of acquaintances– Respondents varied in propensity to form ties to people
in some groups, and not in others
• This was a critical turning point as this was the first independent group to work on statistical improvements to the method
Current application in international health

MARPs• Certain populations are at high risk for contracting and
spreading HIV
• Most At Risk Populations (MARPs) typically fall into one of three categories– Female Sex Workers– Men Who Have Sex With Men– IV Drug Users
• Much is known about the prevalence of HIV among these groups, but not much about the size of the groups, especially at the country level

Methods to Estimate the Size of MARPs(http://data.unaids.org/pub/Manual/2003/20030701_gs_estpopulationsize_en.pdf)
• Methods that require a sample frame– Census
• Counting all members
– Enumeration: • Counting members in a sample frame then scaling up
– Population Survey: • Draw a representative sample (similar to enumeration)
• Methods that do not require a sample frame– Capture-Recapture – Multiplier

Problems with these approaches
• All these methods require interviews with members of the target population
• The Census, Enumeration and Population Surveys require sample frames which are lacking for hidden or elusive populations
• The Capture-Recapture and Multiplier methods are difficult to do across large geographies
• NSUM was viewed as a way to triangulate these estimates
WHO and UNAIDS and international HIV surveillance
• Rob Lyerla (UNAIDS) and Kevin O’Reilly (WHO) worked in global HIV/AIDS surveillance
• They were looking for a way to estimate the size of at-risk populations at the country level
• They convened a workshop in 2008 to discuss the possibility of using NSUM
Advantages of NSUM
• Does not require contact with target populations who may be difficult to reach
• Can be done at city, region or country level
• Should be relatively inexpensive compared to other methods
• Can use back-estimation of known populations to validate estimates

NSUM has been applied in several countries since 2008
• Thailand• Brazil• Rwanda• Ukraine• Moldova• China• Japan
• There have been innovations in some of these in attempts to improve the method

Ukraine
• Face to face survey n=11,000 (500 per oblast)
• NSUM estimates sensitive to under-reporting on unknown m values
• Added scale of perceived stigma to adjust for transmission error on unknown m values
• Using perceptions of population membership stigma to weight the m values
Numbers are political!
• NSUM estimates were reasonable for some populations, not for others
• Estimates of IV drug users were lower than other estimates
• Groups with investment in numbers — NGOs, goverment agencies, journalists
• Controversy with MSM (men who have sex with men) population as the method does not involve interviews with target– (Nothing about us without us!)

Thailand
• National survey of 8,600
• Used procedure to create mutually exclusive and exhaustive categories of knowing in native language for summation method
• Estimates of IV drug users were within expectations
• Estimates of migrants were far below prevailing estimates
• Prevailing estimates may be a challenge
BrazilSalganik, M.J., Mello, M.B., Abdo, A.H., Bertoni, N., Fazito, D., and Bastos, F.I. (2011) The Game of Contacts: Estimating the Social
Visibility of Groups. Social Networks Vol.33 No.1, pp.70-78.
• Survey of 500 in Curitiba, Brazil
• Used game of contacts– Respondents in the target population (drug users) were presented
with first names.– If they knew a name they then identified if the person was or was
not a drug user– Also reported if respondent knew they were a drug user
• This resulted in a measure of transmission error that could be used to up-weight estimates

Rwanda
• Survey n=5,000 by region
• Attempt to use recent Demographic Health Survey (DHS) to create known populations in places where they are difficult to get
• Used alternative definitions of knowing• Know by sight or by name• Would eat a meal with

Cost Estimates
Country Cost USD Sample size Cost per complete USD Mode Geography
USA 10,500 1500 7 Telephone Country
Japan 10,000 1500 7 Web Country
China 25,000 3000 8 FTF City
Kazakhstan 10,000 1200 8 FTF City
Thailand 130,000 8600 15 FTF Country
Ukraine 180,000 11000 16 FTF Country
Brazil 20,000 500 40 FTF City
Rwanda 400,000 5000 80 FTF Country
Current efforts• Most current research is focused on transmission error of
estimates for the target population
• So far it has been applied in circumstances where known populations sizes are available
• More research is needed in refining the protocol for collecting the data
• Statisticians are working on modeling efforts to improve estimates with existing method

Thank You
Questions?