the new agilent 7200 q-tof for gc/ms · the new agilent 7200 q-tof for gc/ms ... matrix interferant...
TRANSCRIPT

Page 1 RAFA 2011
7200 GC-QTOF
The New Agilent 7200 Q-TOF for GC/MS
The benefits of accurate mass GC/MS for the analysis of
targets and unknowns
Ben Baars
Product Specialist Organic Mass Spectrometry
Chemical Analysis Group
Agilent Technologies Benelux
7200 GC-QTOF
Worksop
Bristol. September 2011
Pesticides in Tea
7000 GC-QQQ
May 2012
Page 2
Content
• Product introduction – why a GC-Q/TOF?
• Features
• Instrumental aspects
• Benefits of accurate mass MS and MS/MS for
Quantitative analysis
• Benefits of accurate mass MS and MS/MS for
Qualitative analysis
• Conclusions and Summary

Page 3
7000 TQ
5975C SQ
5975E SQ 5975T LTM SQ
240 IT 220 IT
The Agilent Portfolio of
Benchtop
GC/MS Systems
What’s next?
Page 4
FPRW 2011
GC-QTOF Overview
Chris Sandy, July 2011
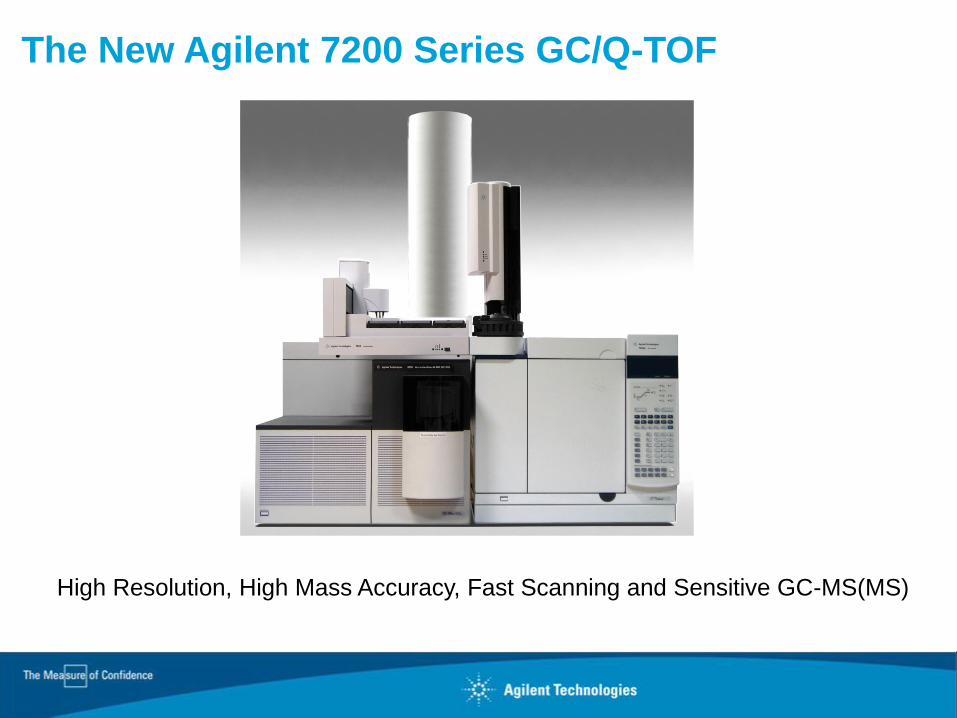
The New Agilent 7200 Series GC/Q-TOF
High Resolution, High Mass Accuracy, Fast Scanning and Sensitive GC-MS(MS)

Page 5
What Will GC/Q-TOF Do For You?
• TOF mode (full spectrum acquisition) • High resolution full scan spectra
• Accurate mass measurements
• Fast scanning of full spectra
• Q-TOF mode (MS/MS) • Full spectrum of Product Ions (SIM-TOF)
• With high resolution and accurate mass
• Selectivity beyond any “triple quad” MRM method
• Confirm TOF spectrum without interferences
• High sensitivity structural elucidation tool
Ideal tool for solving complex analytical problems
Page 6
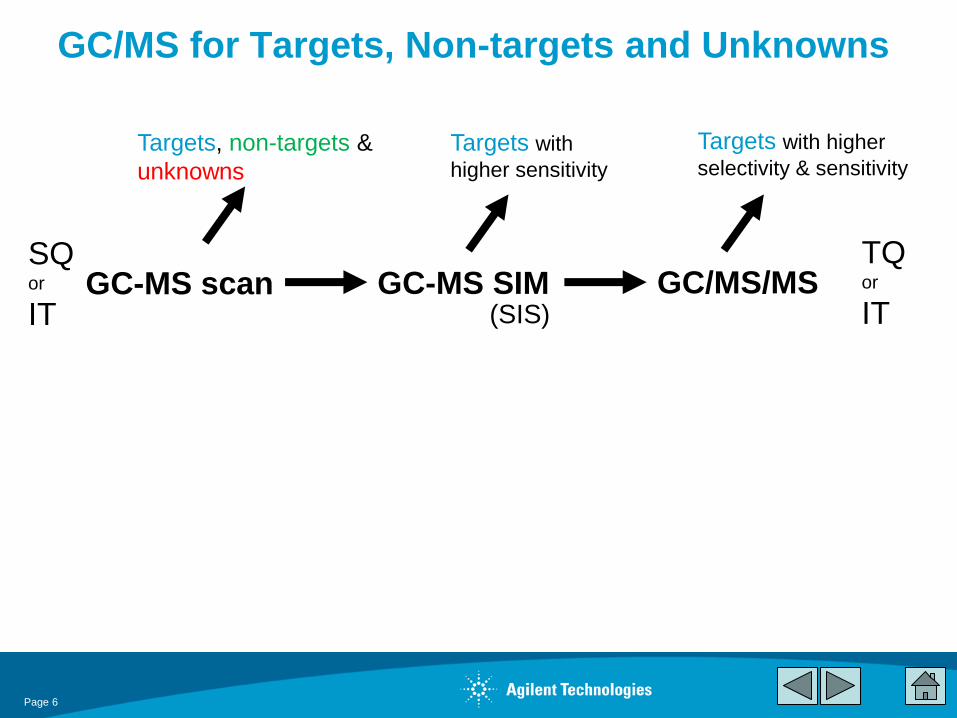
GC/MS for Targets, Non-targets and Unknowns
Targets with higher
selectivity & sensitivity Targets, non-targets &
unknowns
Targets with
higher sensitivity
TOF GC/MS ‘scan’
Targets, non-targets &
unknowns
Higher resolution
Accurate mass
Higher data rate
Better sensitivity
Q-TOF GC/MS/MS
Targets with higher
selectivity & structural
elucidation
Product ion spectra
Higher resolution
Less sensitivity
TOF has no SIM or
SIS equivalent
GC-MS scan GC/MS/MS GC-MS SIM (SIS)
SQ or
IT
TQ or
IT

Page 7
Why the Demand for High Resolution and
Accurate Mass MS and MS/MS?
The Analytes Are the Same (MS or MS/MS)
Demand Is Driven by the
MATRIX COMPLEXITY
High Res & MS/MS Increase Selectivity
Demand Is Driven by the
ANALYSIS OF NON_TARGETS & UNKNOWNS
Accurate Mass, Especially with MS/MS,
Greatly Facilitates Qualitative Analysis

Page 8
GC/MS for Targets, Non-targets and Unknowns
Targets with higher
selectivity & sensitivity Targets, non-targets &
unknowns
Targets with
higher sensitivity
TOF GC/MS ‘scan’
Targets, non-targets &
unknowns
Higher resolution
Accurate mass
Higher data rate
Better sensitivity
Q-TOF GC/MS/MS
Targets with higher
selectivity & structural
elucidation
Product ion spectra
Higher resolution
Less sensitivity
TOF has no SIM or
SIS equivalent
GC-MS scan GC/MS/MS GC-MS SIM (SIS)
SQ or
IT
TQ or
IT
Page 9
High Res Mass Spectrometry
The Agilent 7200 GC/Q-TOF is a high res instrument.
What does this mean?
Page 10
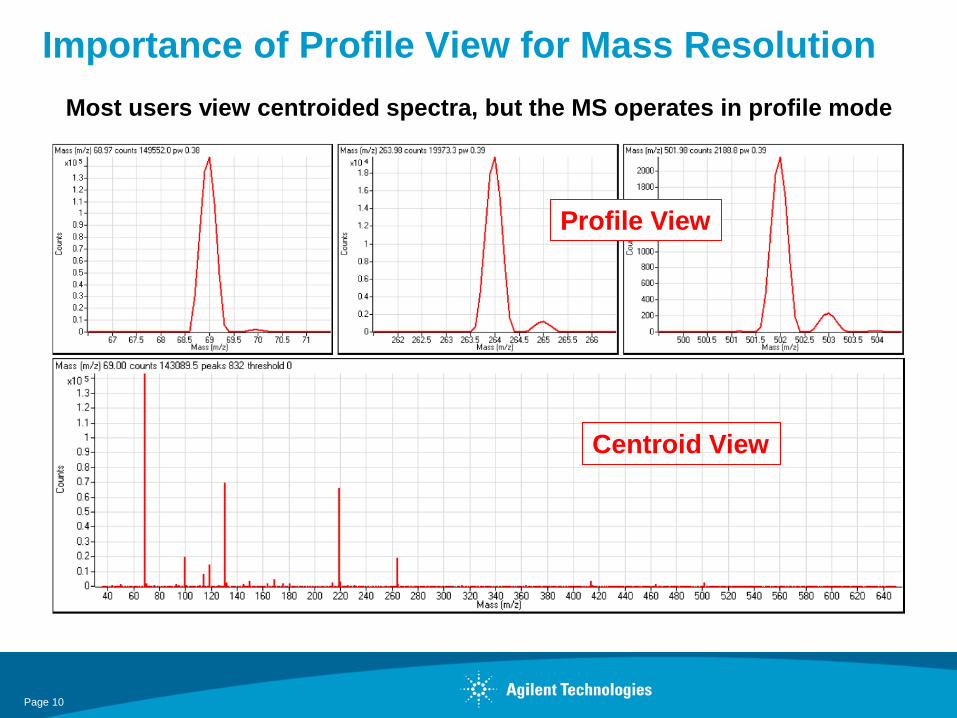
Importance of Profile View for Mass Resolution
Centroid View
Profile View
Most users view centroided spectra, but the MS operates in profile mode

Page 11
Zoom on MSD mass peaks: 0.1 u steps
Baseline resolution between
m/z 614 and 615 not quite
achieved
614.0
614.1 613.9
615.0

Page 12
Similar plot from 7200 Q-TOF . . .
614.0
614.1
615.0
Baseline
Resolution
As high resolution
holds great
benefit for GC
separations . . .
High resolution
hold benefits for
mass spectra . . .
Page 13
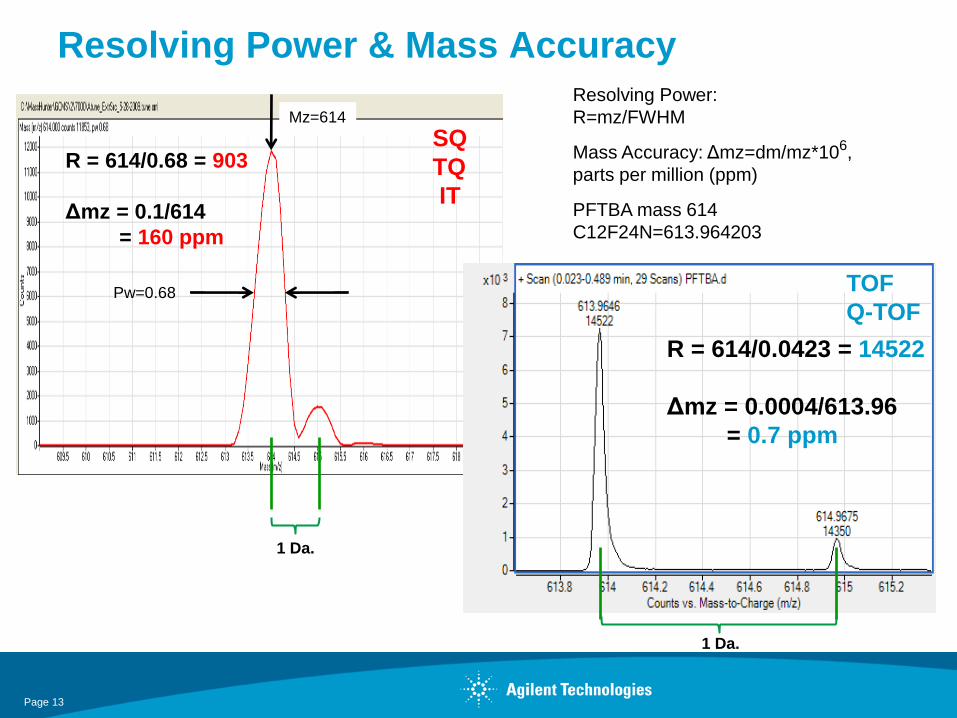
Resolving Power & Mass Accuracy
R = 614/0.68 = 903
Δmz = 0.1/614
= 160 ppm
Pw=0.68
Mz=614
SQ
TQ
IT
TOF
Q-TOF
R = 614/0.0423 = 14522
Δmz = 0.0004/613.96
= 0.7 ppm
Resolving Power:
R=mz/FWHM
Mass Accuracy: Δmz=dm/mz*106,
parts per million (ppm)
PFTBA mass 614
C12F24N=613.964203
1 Da.
1 Da.
Page 14
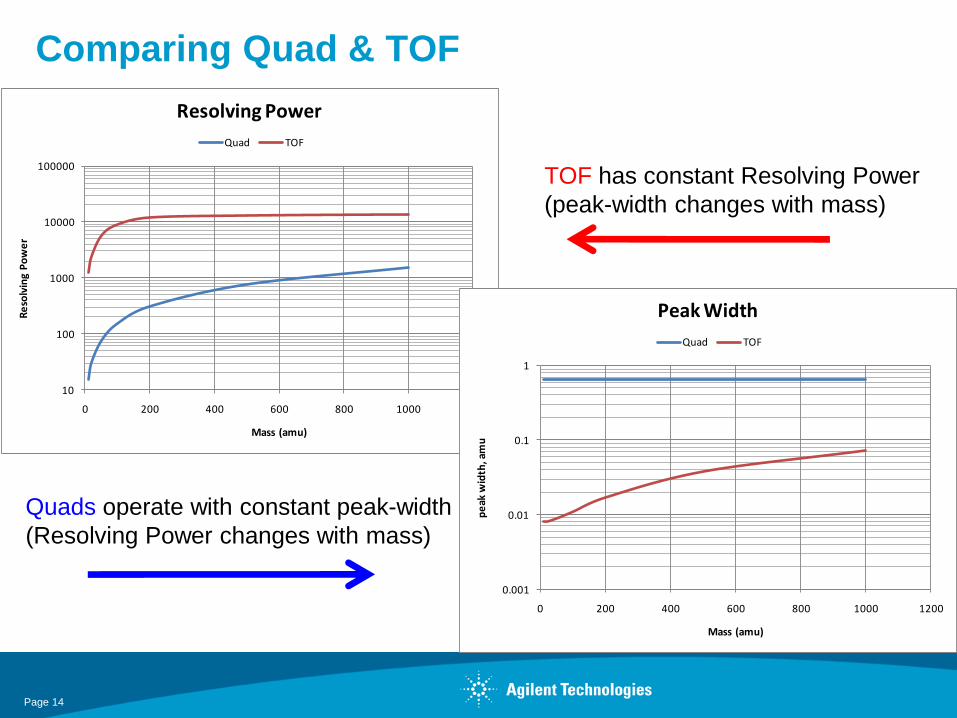
Comparing Quad & TOF
10
100
1000
10000
100000
0 200 400 600 800 1000 1200
Re
solv
ing
Po
we
r
Mass (amu)
Resolving Power
Quad TOF
0.001
0.01
0.1
1
0 200 400 600 800 1000 1200
pe
ak w
idth
, am
u
Mass (amu)
Peak Width
Quad TOF
TOF has constant Resolving Power
(peak-width changes with mass)
Quads operate with constant peak-width
(Resolving Power changes with mass)

Page 15
240.1218
240.0785
Flurenol methyl ester
m/z = 240.0781
Mass error = 1.7 ppm
Dimetilan
m/z = 240.1217
Mass error = 0.4 ppm
~13,500 resolution FWHM
High Res TOF to increase mass selectivity Appears as Single 240 u Mass Peak for Any Unit Mass Resolution MS
15
No Internal Reference Mass (IRM)
corrections applied
Δ m/z = 0.0433

Page 16
Okra QuEChERS Extract
Matrix interferant ion (b-Tocopherol)
150.06839 Da
Analyte Indoxacarb ion (100pg)
150.01195 Da (fragment ion)
Dm = 0.05644 Da.
Extraction window
+/-0.5 amu (~ 300ppm)
Indoxacarb b-Tocopherol
Indoxacarb
TOF Accurate Mass to Eliminate Matrix Interferants
Tocopherol
interference
eliminated in
MS mode
If even more selectivity is needed, option of MS/MS
MS/MS with high resolution and accurate mass!
Extraction window
+/-0.010 amu (~ 6ppm)

Page 17
= +
Let’s have a look at the system first
It’s our newest GC/MS . . .
built upon many well proven parts:
Almost one thousand 7000 TQs
Over one thousand 6500 TOFs and Q-TOFs
Many thousand 7890 GCs
Page 18
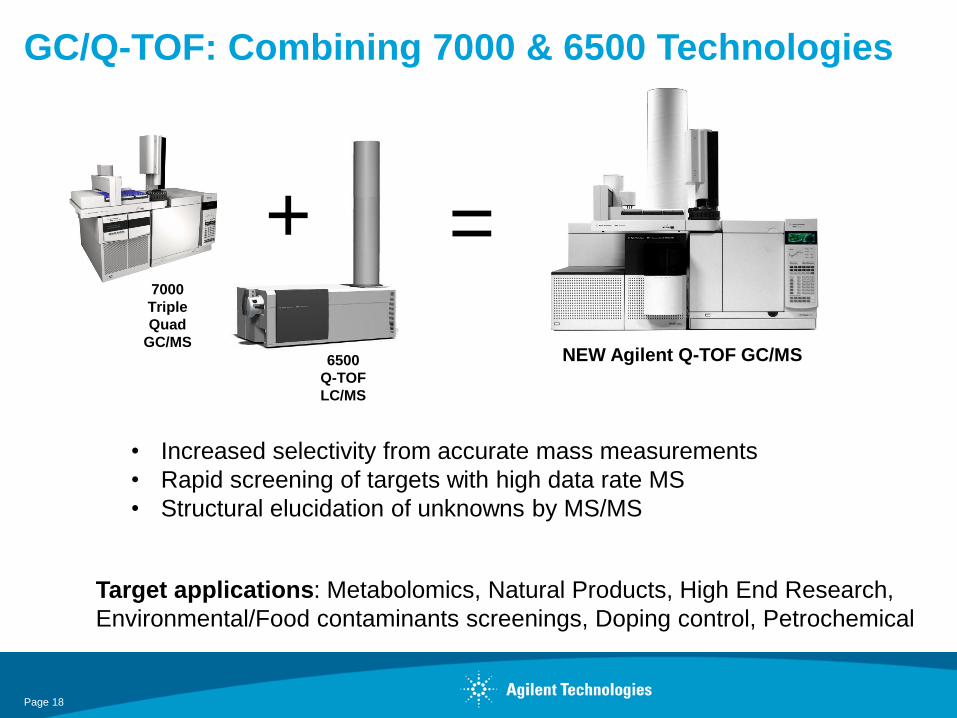
GC/Q-TOF: Combining 7000 & 6500 Technologies
• Increased selectivity from accurate mass measurements
• Rapid screening of targets with high data rate MS
• Structural elucidation of unknowns by MS/MS
Target applications: Metabolomics, Natural Products, High End Research,
Environmental/Food contaminants screenings, Doping control, Petrochemical
= + 7000
Triple
Quad
GC/MS
6500
Q-TOF
LC/MS
NEW Agilent Q-TOF GC/MS

Page 19
The merging of two platforms
Turbo 2
Ion Pulser
Turbo 3
Ion Source
Turbo 1b Turbo 1a
Quad Mass Filter (Q1)
Collision Cell
Transfer
optics
6500 LC/MS
Q-TOF based
7000 GC/MS
QQQ based
Ion Mirror
Ion Detector

Page 20
7200 Q-TOF Component
7000B TQ 6500 Q-TOF
NEW
Optics NEW
Removable
Ion Source
Two
300 L/s Turbos
Four stages of pumping

Page 21
Dual-stage ion mirror improves
second-order time focusing for
high mass resolution.
Hexapole collision cell accelerates
ion through the cell to enable faster
generation of high-quality MS/MS
spectra without cross-talk
Split-flow turbo differentially
pumps the ion source and
quadrupole analyzer compartments
4GHz ADC electronics enable a high
sampling rate (32 Gbit/s) which improves
the resolution, mass accuracy, and
sensitivity for low-abundance samples.
Dual gain amplifiers simultaneously
process detector signals through both low-
gain and high gain channels, extending the
dynamic range to 105.
Analog-to-digital (ADC) Detector:
Unlike time-to-digital (TDC) detectors
which record single ion events, ADC
detection records multiple ion events,
allowing very accurate mass
assignments over a wide mass range
and dynamic range of concentrations.
New Removable Ion
Source includes repeller,
ion volume, extraction lens
and dual filaments, no need
to break the vacuum for
exchange EI/CI
Proprietary INVAR flight tube
sealed in a vacuum-insulated
shell eliminates thermal mass
drift due to temperature changes
to maintain excellent mass
accuracy, 24/7. Added length
improves mass resolution.
Hot, quartz monolithic quadrupole
analyzer and collision cell identical
to the 7000 Quadrupole MS/MS New Internal Reference Mass
can be delivered to the source
at a low and high concentration
for mass axis “locking” and
mass correction
Two 300L/s t urbos pump the
focusing optics and flight tube
New GC/Q-TOF System . . . Yet Totally Proven
RAFA 2011
7200 GC-QTOF
Page 22
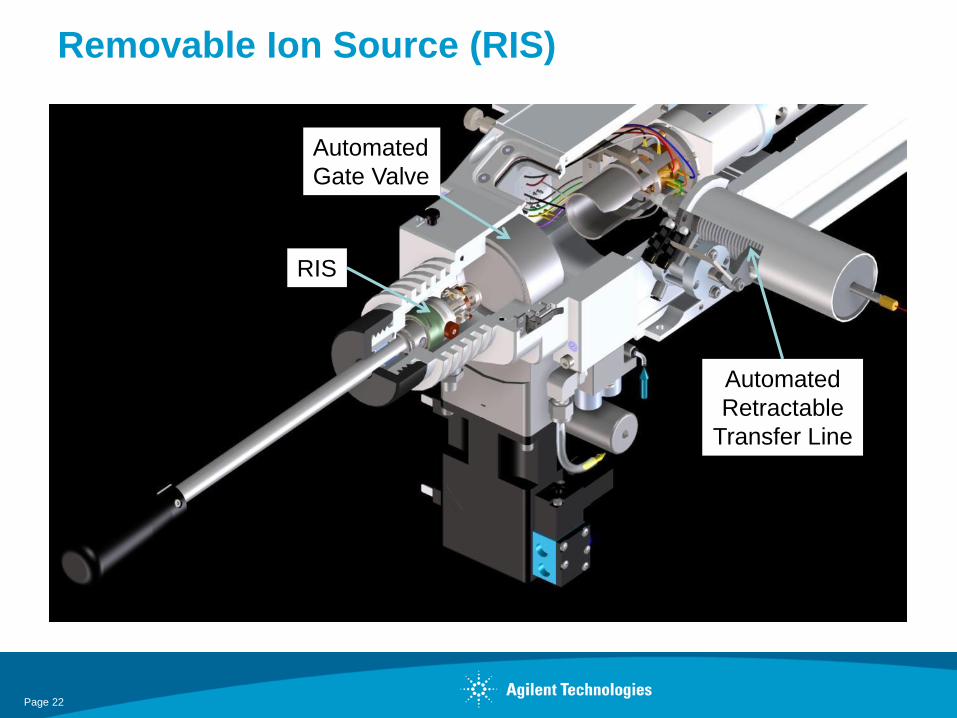
Removable Ion Source (RIS)
Automated
Retractable
Transfer Line
RIS
Automated
Gate Valve
Page 23
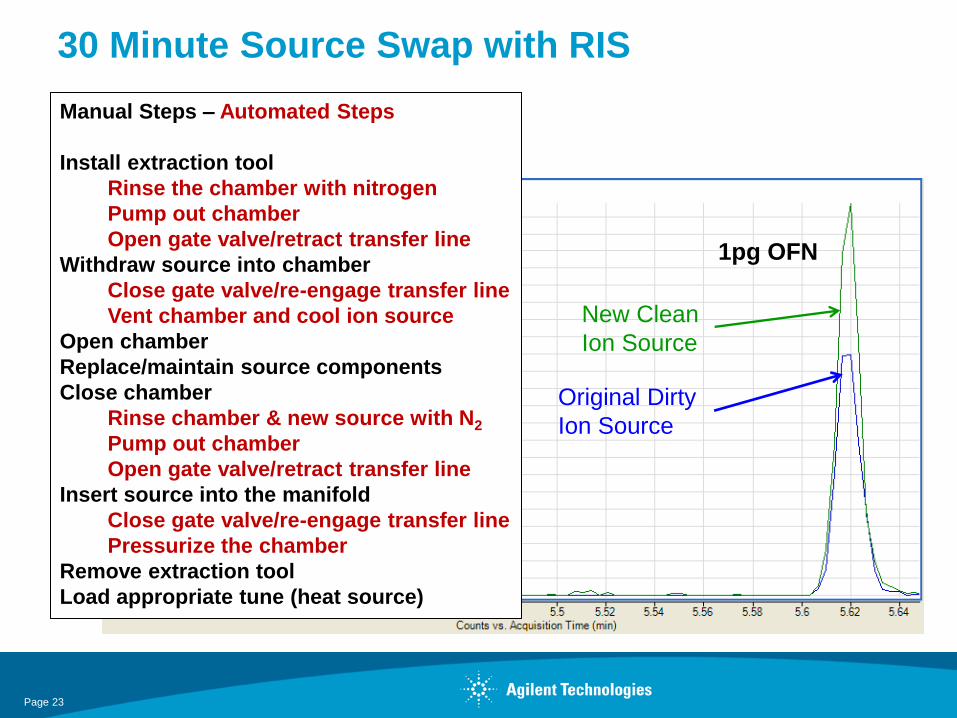
30 Minute Source Swap with RIS
New Clean
Ion Source
Original Dirty
Ion Source
1pg OFN
Manual Steps – Automated Steps
Install extraction tool
Rinse the chamber with nitrogen
Pump out chamber
Open gate valve/retract transfer line
Withdraw source into chamber
Close gate valve/re-engage transfer line
Vent chamber and cool ion source
Open chamber
Replace/maintain source components
Close chamber
Rinse chamber & new source with N2
Pump out chamber
Open gate valve/retract transfer line
Insert source into the manifold
Close gate valve/re-engage transfer line
Pressurize the chamber
Remove extraction tool
Load appropriate tune (heat source)
Page 24
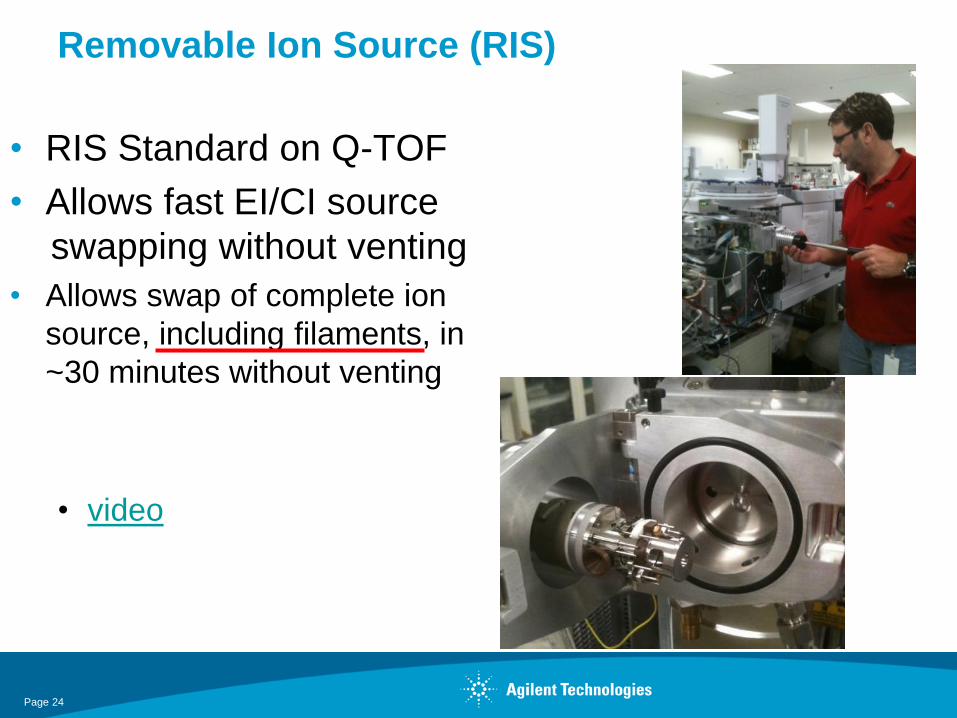
Removable Ion Source (RIS)
• RIS Standard on Q-TOF
• Allows fast EI/CI source
swapping without venting
• Allows swap of complete ion
source, including filaments, in
~30 minutes without venting
• video
Page 25
Internal Reference Mass (IRM)
• Engineering goal: minimize source of drift
• Proprietary INVAR flight tube
• Sealed in a vacuum-insulated shell eliminates thermal
mass drift due to temperature
• IRM correction often not needed
• IRM ions may be an interference with analyte ions
• Proprietary IRM delivery system is “backup”
correction
• “Locks” mass axis to known background ions
• Tris(pentafluoroethyl)-s-triazine
• “On the fly” mass axis correction

Page 26
calc mass obs mass ppm Error obs mass ppm Error
2-formyl thiophen 111.9977 111.9967 -8.9 111.9973 -3.6
2-acetyl-thiazole 127.0086 127.0078 -6.3 127.0085 -0.8
2-formyl thiophen 111.9977 111.9972 -4.5 111.9972 -4.5
2-acetyl-thiazole 127.0086 127.0084 -1.6 127.0085 -0.8
2-formyl thiophen 111.9977 111.9978 0.9 111.9974 -2.7
2-acetyl-thiazole 127.0086 127.0091 3.9 127.0085 -0.8
2-formyl thiophen 111.9977 111.9966 -9.8 111.9974 -2.7
2-acetyl-thiazole 127.0086 127.0076 -7.9 127.0087 0.8
2-formyl thiophen 111.9977 111.9968 -8.0 111.9974 -2.7
2-acetyl-thiazole 127.0086 127.0080 -4.7 127.0086 0.0
2-formyl thiophen 111.9977 111.9969 -7.1 111.9976 -0.9
2-acetyl-thiazole 127.0086 127.0079 -5.5 127.0088 1.6
2-formyl thiophen 111.9977 111.9966 -9.8 111.9977 0.0
2-acetyl-thiazole 127.0086 127.0080 -4.7 127.0088 1.6
2-formyl thiophen 111.9977 111.9970 -6.3 111.9975 -1.8
2-acetyl-thiazole 127.0086 127.0084 -1.6 127.0088 1.6
2-formyl thiophen 111.9977 111.9973 -3.6 111.9980 2.7
2-acetyl-thiazole 127.0086 127.0083 -2.4 127.0084 -1.6
2-formyl thiophen 111.9977 111.9980 2.7 111.9979 1.8
2-acetyl-thiazole 127.0086 127.0086 0.0 127.0084 -1.6
Average ABS Error 5.0 1.7
Standard Deviation of Error 4.0 2.0
Excellent: < 5 ppm Excellent: < 5 ppm
Good: < 10 ppm Good: < 10 ppm
2 pg on col DG
5 pg on col DG
10 pg on col DG
1000 pg on col DG
20 pg on col DG
50 pg on col DG
100 pg on col DG
200 pg on col DG
500 pg on col DG
uncorrected IRM corrected
1 pg on col DG
IRM correction example Mass accuracy of 2-formyl thiophene and 2-acetyl thiazole in spiked Whiskey
Average mass error < 2 ppm over X1000 concentration range

Page 27
Large dynamic range detection system ADC is important for chromatographic peaks
TDC has limited linear range and
is quantitative over a small
concentration range
Time-to-Digital Converter Analog-to-Digital Converter
ADC has greater linear range and
is quantitation over a larger
concentration range
Ions
Response
Ions
Response

Page 28
Response linearity and mass accuracy ADC advantages
5 Hz acquisition, RIS LOD about 0.01 pg
R^2=0.9991

Page 29
What about TOF SPEED?
TOF always collects full mass range
Q-TOF always display full product ion spectrum
• Spectral Rate:
• Typical max rate: 25-200 spectra/sec (Hz) to disk
• Usable rate is limited by signal level (ion count)
• New analysis opportunities for GC/MS:
• Fast GC and Ultra high resolution GC: ~ 20-40Hz
• GCxGC: ~50-200 Hz

Page 30
What about TOF SPEED?
Is high speed always better?
Speed may effect:
Sensitivity
Mass accuracy
Mass Stability
Data file size and data processing

Page 31
And what about Q-TOF Speed?
• Typical file sizes for pesticide analysis
• MSD SIM – 0.8-1 MB/18-min run
• MSD scan – 3-5 MB/40-min run
• TQ MRM – 5 MB/20-min run
• TQ scan – 8 MB/20-min run
• IT MS/MS – 2.5 MB/45-min run (99 compounds)
• TOF or Q-TOF Typical run
• 800-1200 MB/20-min run at 5 Hz, profile
• Centroid only reduces 5-10X
Note: File size depends on the threshold, number of target compounds,
number of masses/compound, and runtime etc.

Page 32
GC/Q-TOF vs GCxGC/TOF
GC/Q-TOF
• 3 stages selectivity
• Best chemical noise reduction
• Requires MS method set-up
• Conventional software
• Added value to structural
elucidation: • 1-1 correlation precursor-product
• neutral loss
• Bonding strength correlated to CID
voltage
• Suited for qualitative and
quantitative analysis
• Use of deconvolution software to
compensate for lacking
chromatography
GCxGC/TOF
• 3 stages of selectivity
• Moderate chemical noise reduction
• Requires GC method set-up
• Dedicated software
• Added value to chemically similar
components
• Quantitation is more difficult
There are more differences, like
robustness, data file size, sensitivity

Page 33
High data rate = better deconvolution
Slow data rate will not
pick each peak apex
Fast data rate will allow
deconvolution of closely
eluting peaks
Time Time

Page 34
High data rate = better deconvolution
Slow data rate will not
pick each peak apex
Fast data rate will allow
deconvolution of closely
eluting peaks
Time Time
The 7200 Q-TOF in TOF mode
will have:
•Faster Data Rates
•Maintain Excellent S/N
•New MassHunter Deconvolution

Page 35 RAFA 2011
7200 GC-QTOF
GC/Q-TOF Performance Specifications
• Resolving Power: > 12.5K at m/z 272
– 13K to 15K typical
• Mass Accuracy: < 5 ppm at m/z 272
– < 2 ppm typical
• MS Sensitivity >400:1 at m/z=272
• MS/MS Sensitivity is between SRM and Product Ion
scan of a Tandem Quad MS
• Dynamic Range: 3-5 orders of magnitude
• Quad Mass range: 20-1050 Da (0.7-4.0 Da FWHM)
• TOF Mass range: 20-1700 Da
• Spectral Rate: up to 50 Spectra/sec

Page 36
Quantitative Analysis
Target Confirmation and Selectivity of
MS/MS
Page 37
Bristol MS Users Meeting
GC-QTOF
Chris Sandy, September 2011
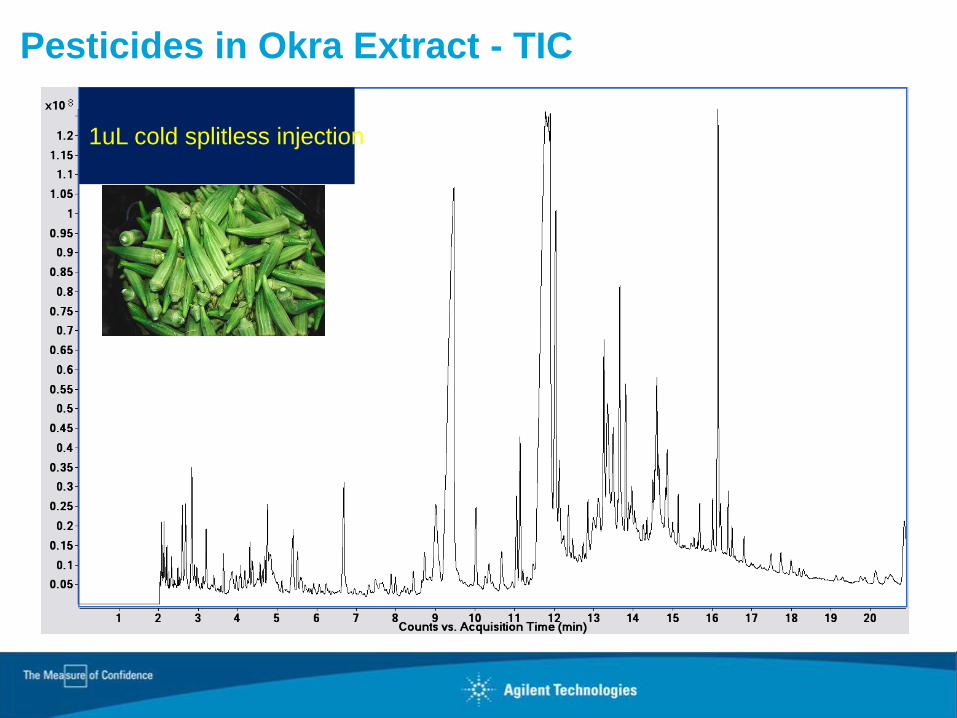
Pesticides in Okra Extract - TIC
1uL cold splitless injection
Page 38
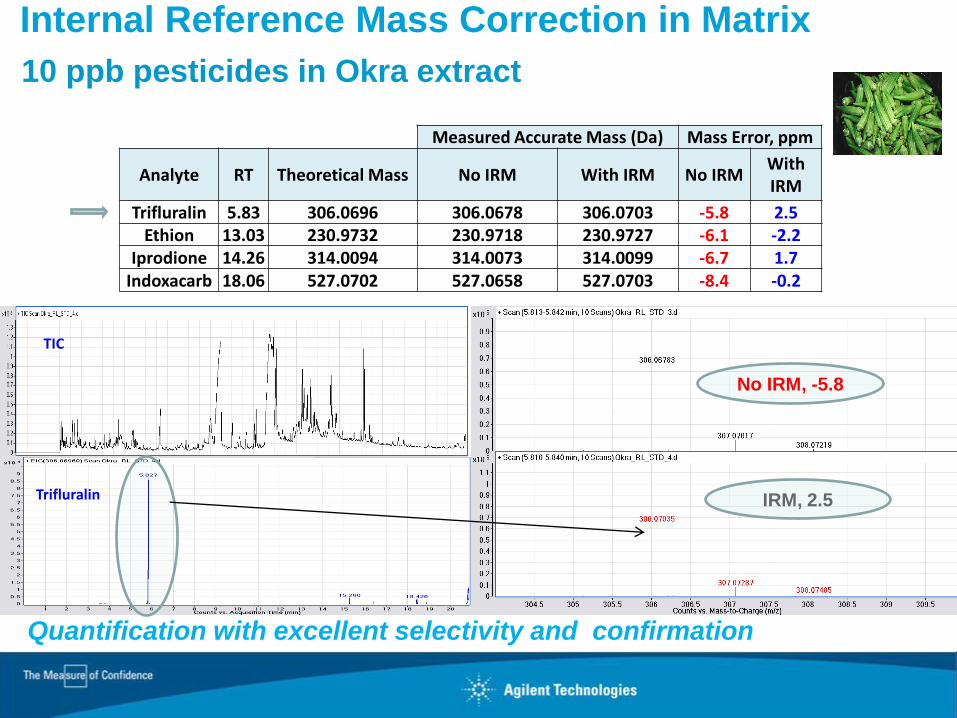
Internal Reference Mass Correction in Matrix
10 ppb pesticides in Okra extract
Measured Accurate Mass (Da) Mass Error, ppm
Analyte RT Theoretical Mass No IRM With IRM No IRM With IRM
Trifluralin 5.83 306.0696 306.0678 306.0703 -5.8 2.5 Ethion 13.03 230.9732 230.9718 230.9727 -6.1 -2.2
Iprodione 14.26 314.0094 314.0073 314.0099 -6.7 1.7 Indoxacarb 18.06 527.0702 527.0658 527.0703 -8.4 -0.2
+EI TIC
+EI EIC(306.0696)
No IRM, -18.9ppm
IRM, -0.7ppm
Quantification with excellent selectivity and confirmation
Trifluralin
No IRM, -5.8
IRM, 2.5
TIC
Page 39
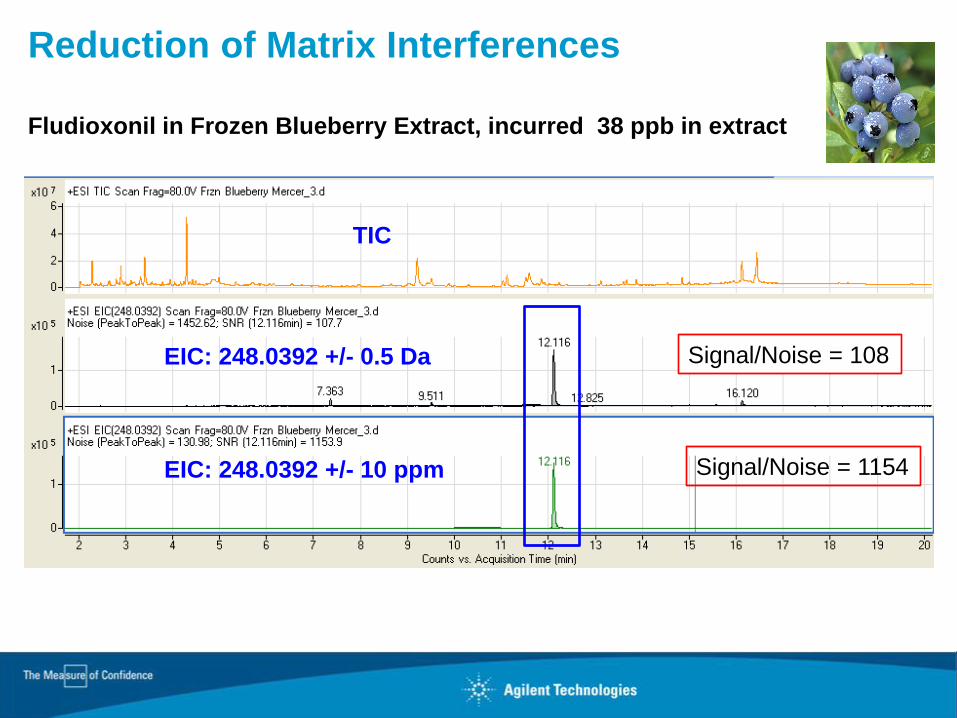
Reduction of Matrix Interferences
Fludioxonil in Frozen Blueberry Extract, incurred 38 ppb in extract
TIC
EIC: 248.0392 +/- 0.5 Da
EIC: 248.0392 +/- 10 ppm
Signal/Noise = 108
Signal/Noise = 1154
Page 40
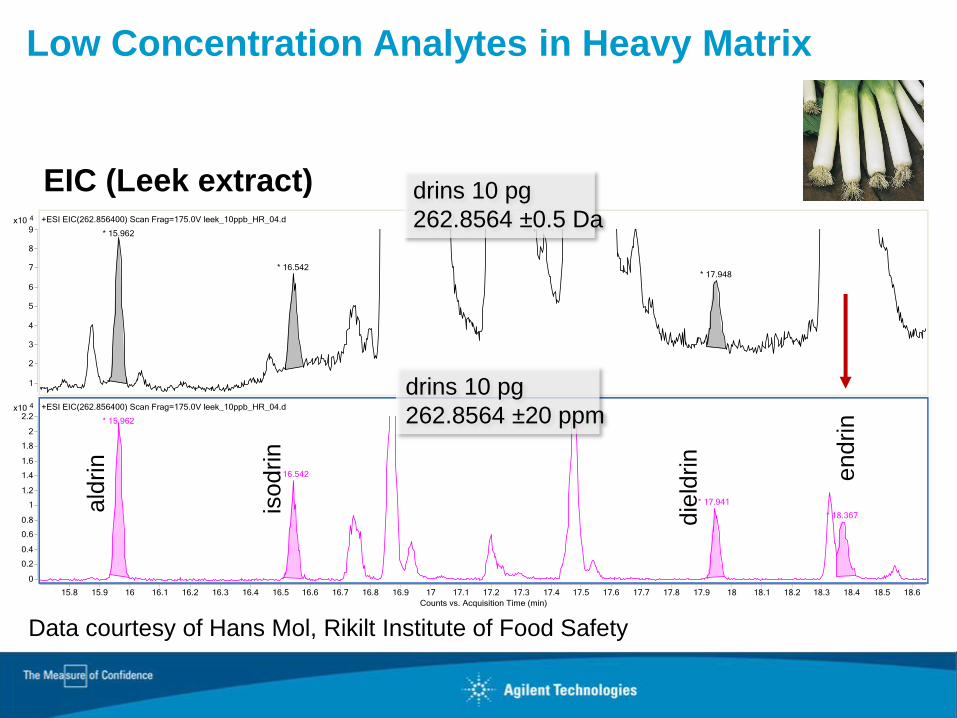
Low Concentration Analytes in Heavy Matrix
EIC (Leek extract) drins 10 pg
262.8564 ±0.5 Da
drins 10 pg
262.8564 ±20 ppm
ald
rin
isodrin
die
ldrin
endrin
Data courtesy of Hans Mol, Rikilt Institute of Food Safety
Page 41
Sometimes the combined power of
GC Resolution (Agilent)
+
MS Resolving Power (Agilent)
Why Add ‘Q’ to TOF to Make Q-TOF?

Page 42
Sometimes the combined power of
GC Resolution (Agilent)
+
MS Resolving Power (Agilent)
Is not enough based upon:
Small ΔMass Defect (Nature)
+
Intense Matrix Ions (Sample)
Add ‘Q+CID’ to TOF solution
High resolution MS/MS can solve some of these problems
Why Add ‘Q’ to TOF to Make Q-TOF?

Page 43
• When high res TOF still has interferences
• 3 stages of selectivity
• Best chemical noise reduction
• Conventional software for qualitative and quantitative analysis
• Better Confirmatory data for identified targets
For Targets: Where and why is MS/MS Used?
Page 44
Qualitative Analysis
• What about non-targets and unknowns?
• When no spectral / library match is seen
• Or too many library matches
• Or not confirmatory enough

Page 45
Many possible formulas with an MSD or IT But only a few with TOF
1
10
100
1000
10000
0.1 1 10 100 1000
# P
oss
ible
Ch
emic
al F
orm
ula
s
mass uncertainty, ppm
Possible Number of Chemical Formulas at m/z 272
Formulas made of:
C,H,N,O,F, & Cl
mass uncertainty
ppm amu # of Possible
Formulas 1000 0.3 7657
368 0.1 4050 100 0.03 1223
37 0.01 466 10 0.003 120
4 0.001 43 1 0.0003 11
0.4 0.0001 5 0.1 0.00003 2
Octafluoronaphthalene (CAS
313-72-4)
C10F8 = 271.98667
Accurate mass reduces risk of investing effort on the wrong molecule

Page 46
C7H2Cl5 -1.67 ppm diff
Determine all possible molecular ion or fragment ion formulas consistent with the
measured mass and compare it with the calculated exact masses in order to known
elemental compositions
In-built Formula Calculator in MassHunter

Page 47
Calculated
Molecular Ion Measured Fragment Ions
1 2 3 4
Pesticide m/z Formula
Δ
ppm Formula
Δ
ppm Formula
Δ
ppm Formula
Δ
ppm Formula
Chlorpyrifos
-methyl 320.8944 C7H7Cl3NO3PS
-0.7 C7 H7 Cl [37Cl] N O3 P S 0.0 C7 H7 Cl2 N O3 P S 0.0 C2 H6 O2 P S
215.4 C6 H2 Cl3 N O2 P S
Dichlorvos 219.9454 C4H7Cl2O4P 1.6 C4H7ClO4P -0.9 C2H6O3P 3.7 C4 H7[37Cl] O4 P
336.5 C3 H2 Cl2 O3 P
Endosulfan
sulfate 419.8112 C9 H6 Cl6 O4 S
-2.1 C9 H6 Cl4[37Cl] O4 S -0.7 C5 Cl5[37Cl] 0.0 C5 Cl4[37Cl]2
-220.9 C8 H3 Cl5
Propachlor 211.0758 C11 H14 Cl N O -1.0 C10 H11 Cl N O 1.1 C11 H14 N O 1.8 C8 H8 Cl N O -3.9 C6 H5
771.6 C2 H2 Cl O
Fluazifop-p-
butyl 383.1339 C19 H20 F3 N O4
-2.2 C19 H20 F2 N O4 -1.1 C14 H11 F3 N O2 -1.3 C12 H7 F3 N O 2.1 C6 H3 F3 N
-494.2 C7 H14 O3
Triazophos 313.0645 C12 H16 N3 O3 P S -1.4 C10 H12 N3 O3 P S -2.7 C8 H8 N3 O3 P S -0.6 C8 H7 N3 O -1.9 C8 H8 N3 O
-47.7 C11 H14 N2 O3 P S -54.1 C9 H10 N2 O3 P S
Fragment Ion Mass with High Mass Accuracy Helps unambiguously identify fragment ions
Examples from building accurate mass pesticide library
Most probable
fragment ion
Page 48
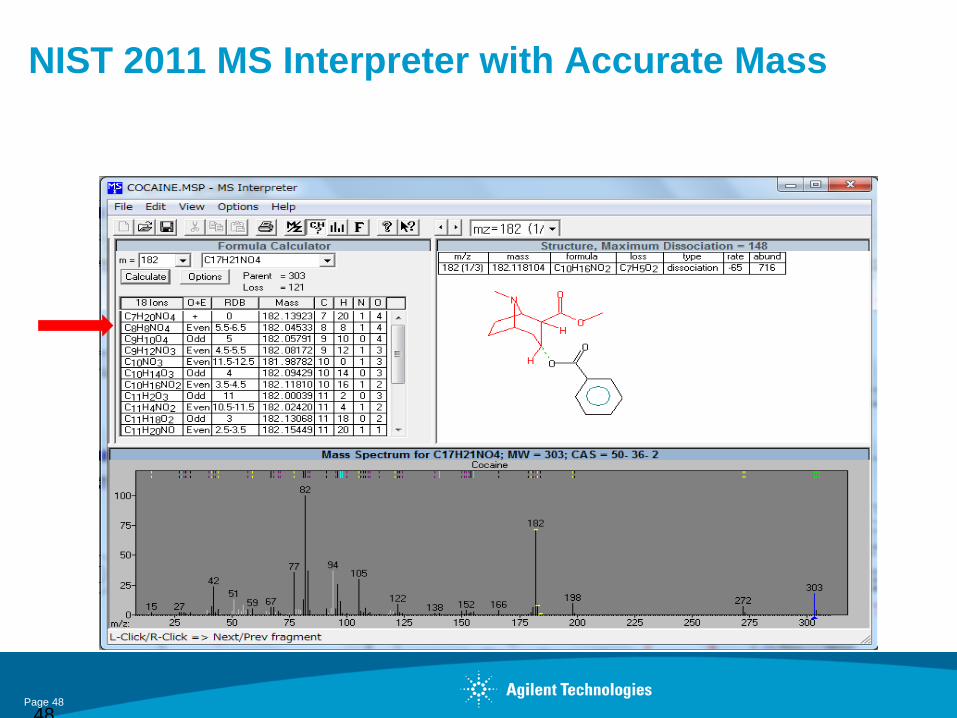
NIST 2011 MS Interpreter with Accurate Mass
48

Page 49
Software tools
NIST MS Interpreter (and MassHunter) tools to make routine operations easier
The most useful tools are:
•Empirical formula generator from measured mass with mass error estimates
•Isotopic abundance calculator
•Automatic listing of neutral losses and their empirical formulas
•Automatic listing of empirical formulas for each mass fragment
NIST MS Interpreter has some of these.
LC MassHunter has some of these and most are planned to be in GC MassHunter.

Page 50
• To improve selectivity • When high res TOF still has interferences
• Structural elucidation from product Ion spectra using high resolution and
accurate mass
• Higher level of Confirmation for an identified unknown
Where and how is MS/MS Used?
• Structural Elucidation from product Ion spectra using high resolution and
accurate mass
• Start will full scan EI spectrum
• Use CID on each fragment mass to confirm structure of fragment
• Select Fragment 1 to be precursor 1 Product ions
• Select Fragment 2 to be precursor 2 Product ions
Page 51
Ion molecular formula confirmed by accurate mass
Precursor-product ion relationship is documented with much better
1-to-1 correlation than fragments in an EI spectrum
Neutral losses confirmed by accurate mass
Bonding strength info vs CID voltage
Requires multiple analyses and much more sensitive than NMR
Will not replace NMR, but will complement nicely
Benefits of MS/MS for Structure elucidation

Page 52
Molecular Ion Fragment Ions
1 2 3 4
Pesticide m/z Formula
Δ
ppm Formula
Δ
ppm Formula
Δ
ppm Formula
Δ
ppm Formula
Chlorpyrifos
-methyl 320.8944 C7H7Cl3NO3PS
-0.7 C7 H7 Cl [37Cl] N O3 P S 0.0 C7 H7 Cl2 N O3 P S 0.0 C2 H6 O2 P S
215.4 C6 H2 Cl3 N O2 P S
Dichlorvos 219.9454 C4H7Cl2O4P 1.6 C4H7ClO4P -0.9 C2H6O3P 3.7 C4 H7[37Cl] O4 P
336.5 C3 H2 Cl2 O3 P
Endosulfan
sulfate 419.8112 C9 H6 Cl6 O4 S
-2.1 C9 H6 Cl4[37Cl] O4 S -0.7 C5 Cl5[37Cl] 0.0 C5 Cl4[37Cl]2
-220.9 C8 H3 Cl5
Propachlor 211.0758 C11 H14 Cl N O -1.0 C10 H11 Cl N O 1.1 C11 H14 N O 1.8 C8 H8 Cl N O -3.9 C6 H5
771.6 C2 H2 Cl O
Fluazifop-p-
butyl 383.1339 C19 H20 F3 N O4
-2.2 C19 H20 F2 N O4 -1.1 C14 H11 F3 N O2 -1.3 C12 H7 F3 N O 2.1 C6 H3 F3 N
-494.2 C7 H14 O3
Triazophos 313.0645 C12 H16 N3 O3 P S -1.4 C10 H12 N3 O3 P S -2.7 C8 H8 N3 O3 P S -0.6 C8 H7 N3 O -1.9 C8 H8 N3 O
-47.7 C11 H14 N2 O3 P S -54.1 C9 H10 N2 O3 P S
MS/MS product ion mass with high mass accuracy Helps unambiguously identify product ions
Examples from building accurate mass pesticide library
Most probable
production
Page 53
1. Internal Reference Mass for routine sub 5ppm mass
accuracy even in heavy matrix
2. Removable Ion Source for quick source cleaning,
filament replacement and EI/CI swapping without
breaking vacuum
3. Q-TOF MS/MS:
• Chemical noise reduction
• Selectivity
• Structural information
• Method development
4. Software tools – formula calculator
Key Features of the 7200
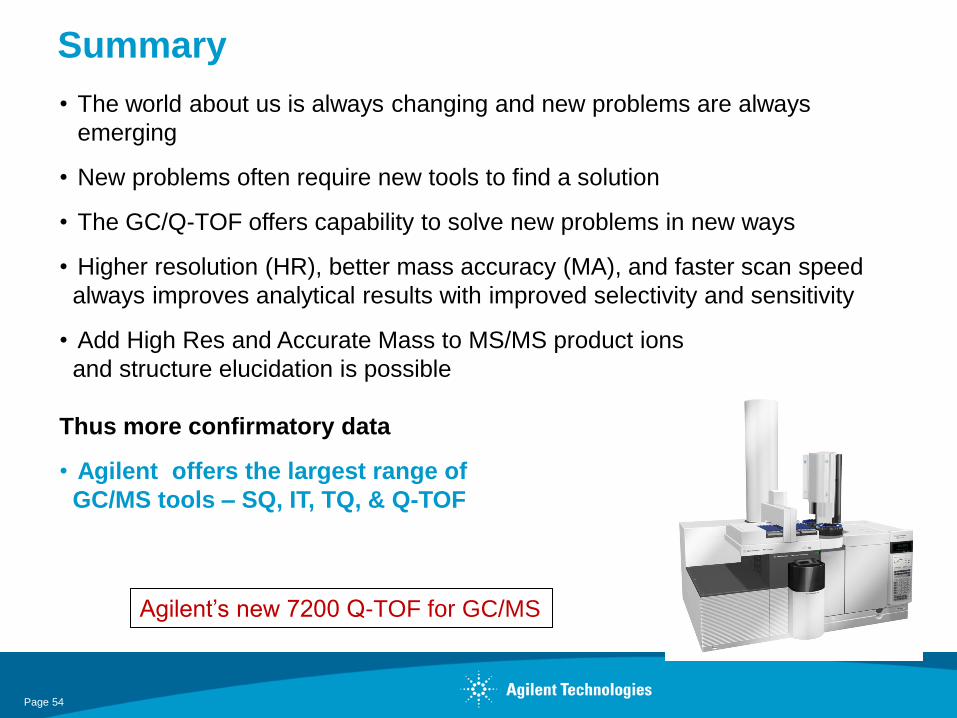
Page 54
• The world about us is always changing and new problems are always
emerging
• New problems often require new tools to find a solution
• The GC/Q-TOF offers capability to solve new problems in new ways
• Higher resolution (HR), better mass accuracy (MA), and faster scan speed
always improves analytical results with improved selectivity and sensitivity
• Add High Res and Accurate Mass to MS/MS product ions
and structure elucidation is possible
Thus more confirmatory data
• Agilent offers the largest range of
GC/MS tools – SQ, IT, TQ, & Q-TOF
Summary
Agilent’s new 7200 Q-TOF for GC/MS
Page 55
7200 Series Q-TOF for GC/MS A new analytical tool for solving complex analytical problems
Thanks to
Terry Sheehan, Agilent GC/MS Marketing Manager, USA
Sofia Aronova, Agilent GC/Q-TOF Application Chemist, USA
Hans Mol
RIKILT, NL
Nobuo Ochiai and Kikuo Sasamoto
Gerstel, Japan