the new ghana cocoa boom in the 2000s - cirad
TRANSCRIPT
The new Ghana Cocoa Boom in the 2000s From Forest Clearing to Green Revolution
A report prepared for the Ministry of Finance and Economic Planning, Ghana
Financed from the 9th European Development Fund and by CIRAD
Contract number: 9 ACP GH 6 / 23
Francois Ruf CIRAD / University of Ghana
Final Version November 2007
"The views expressed in this report are those of the Consultant and do not necessarily reflect those of the European Commission or the Government of Ghana"
The new Ghana Cocoa Boom in the 2000s - F. Ruf (CIRAD, November 2007)
2
The new Ghana Cocoa Boom in the 2000s From Forest Clearing to Green Revolution Report prepared for the Ministry of Finance and Economic Planning, Ghana
Francois Ruf CIRAD / University of Ghana
Final version
November 2007 Abstract. Ghanaian cocoa production, after collapsing in the 1970s and 1980s and with a low of 200,000 tonnes in 1983, started to recover slightly in the 1990s and suddenly doubled to 600,000 tonnes in the first half of the 2000s. The main objective of this paper is to analyze the statistical breakdown of this cocoa boom in the 2000s. What was the relative weight of smuggling of cocoa beans from Côte d’Ivoire to Ghana compared to the real cocoa production increase in Ghana? What was the role of new cocoa production area compared to increasing cocoa yields? If yields increased, has there been any increased adoption of modern inputs such as insecticides, fungicides and fertilizers? A panel of 450 farms was progressively built to analyse production changes at the farm and household level. The first survey was conducted in 2004 on a sample of 150 farms in three districts of the Western region (Amenfi East, Amenfi West and Aowin Suanman) and one in the Eastern region (Kade), and then re-surveyed and extended to 200 farms in 2005. Then in 2007, the same panel was re-surveyed and extended to 450 farms in 8 districts, including Hemang (Central region), Afigya Sekyere (Ashanti region), Dormaa (Brong Ahafo region) and Nzema-Est (Western region). Over the 6-year period between 2001/02 and 2006/07, cocoa production increased by 60%: 10% smuggling from Côte d'Ivoire and 50% real increase in national production, itself explained by the combination of a 15% increase in cocoa production area and a 30-35% increase in yields per hectare. The latter is for the greater part explained by the increased use of pesticides and the adoption of fertilizers, accompanied by increased farmers’ efforts towards weed control and pruning. The adoption of new cocoa hybrids starts to have an impact as well. Moreover, various forms of climate change effects and more certainly regional production shifts play a role in making production more regular throughout the year. As the most impressive factor of increasing cocoa production is the intensification per unit of land, at least partially based on the adoption of modern inputs, this boom can be seen as the start of a green revolution in the Ghanaian cocoa sector, thereby diminishing its dependency on tropical forests. However, forest tree cutting still continues and new environmental problems related to modern inputs may arise. This calls for a kind of ‘double green’ revolution. Finally, the role of labour, either through the additional effort of individuals already engaged in cocoa farming, or through labour saving technologies, or through additional workers brought to the cocoa sector needs to be clarified by further investigation.

The new Ghana Cocoa Boom in the 2000s - F. Ruf (CIRAD, November 2007)
3
The new Ghana Cocoa Boom in the 2000s From Forest Clearing to Green Revolution Contents 1. Method and Sample 2. Cocoa Production: macro/micro-economics and smuggling 3. The increasing weight of the ‘light’ crop
3.1 Climate change: an hypothesis 3.2 Geographic change: production shift towards the south of the Western region 3.3 Fertilizer: the major breakthrough in the early 2000s 3.4 Selected planting material and tree youth effect
4. New cocoa farms and a new generation of farmers in the 1990s 5. New cocoa farms and a new generation of farmers in the 2000s 6. Farmers’ age: an encouraging signal for the cocoa sector 7. Cocoa production area
7.1 About the definition of one acre or one hectare of cocoa 7.2 Production area: a production factor and an asset
8. Yields per hectare 8.1 Difficulties in estimating cocoa production 8.2 A net increase 9. Insecticides: Mass spraying and individual spraying
9.1 Mass spraying 9.2 Individual spraying
10. Fungicides: Mass spraying and individual spraying 10.1 Mass spraying 10.2 Individual spraying
11. The cocoa production shift to ‘cocoa unsuited’ regions 12. Fertilizers: the major breakthrough in the 2000s 13. Interaction of non-labour and labour inputs and limits of the survey Conclusion Brief recommendations
The new Ghana Cocoa Boom in the 2000s - F. Ruf (CIRAD, November 2007)
4
The new Ghana Cocoa Boom in the 2000s
From Forest Clearing to Green Revolution Report prepared for the Ministry of Finance and Economic Planning, Ghana
Francois Ruf CIRAD / University of Ghana
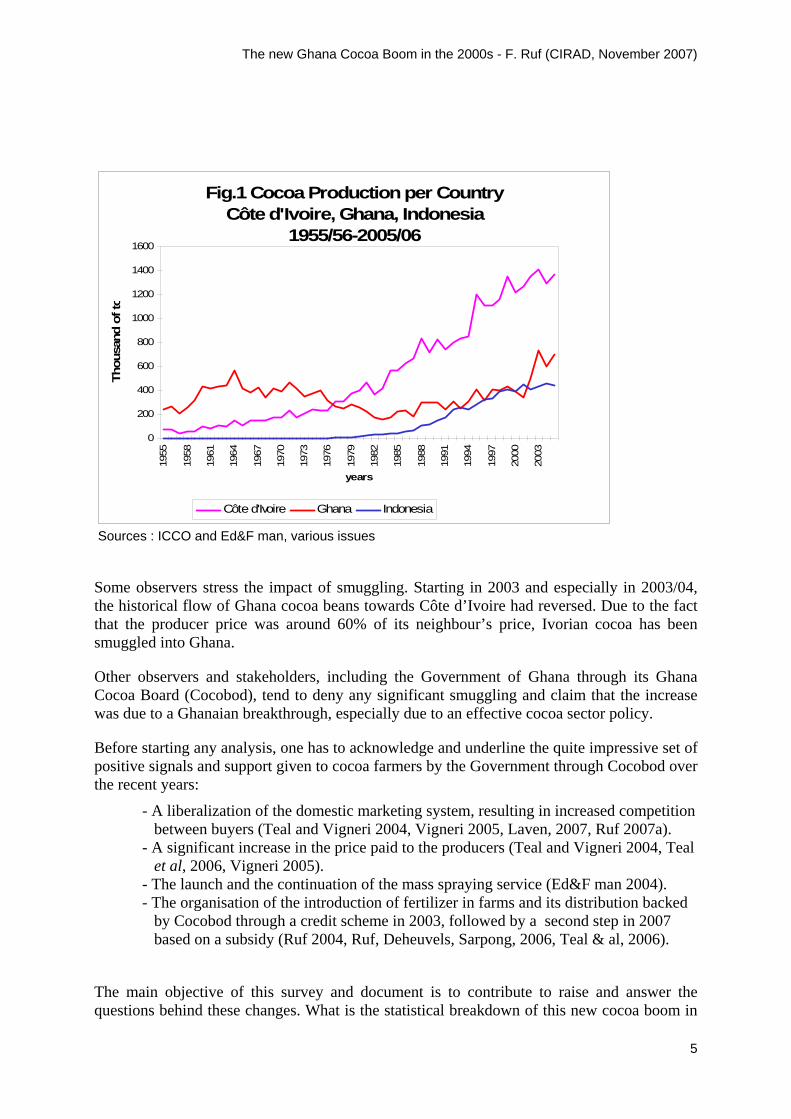
Final version November 2007 Up to the late 1970s, Ghana was the world leader in cocoa production, reaching a yearly output above 400,000 tonnes before losing this position to Côte d’Ivoire in 1978. In the 1980s, the Ghanaian cocoa sector output fell to 200,000 tonnes, which can be partially explained by the collapse of the cocoa producer price, but also and more generally as a result of the global political ‘cocoa and chaos’ situation in the country (Mykell, 1969). The impact of the 1983 drought and plantation fires are sometimes overlooked by economists but these did play a role as well. The 1990s were the first decade of the recovery, with output reaching around 300-400,000 tonnes. This was the result of a major shift of the last pioneer fronts towards the forests of South-Western Ghana (Anglaaere et al, 2007), demonstrating a kind of repetition of a ‘universal’ history of cocoa, made up of massive migrations and forest encroachment (Ruf 1995, 2007b). In addition, despite ecologists’ wish to see more trees in the cocoa farms, the migration effect was probably enhanced by cultivation techniques without shade, a practice widely observed in the Western Region. This technique results in higher yields, hence can be considered as a kind of intensification, at least in the short term (Ruf, Deheuvels and Sarpong 2006). In the 2000s, within two to three years, Ghana almost doubled its production, at an output above 600,000 tonnes (Fig.1). What were the driving forces behind this impressive change?
The new Ghana Cocoa Boom in the 2000s - F. Ruf (CIRAD, November 2007)
5
Fig.1 Cocoa Production per CountryCôte d'Ivoire, Ghana, Indonesia
1955/56-2005/06
0
200
400
600
800
1000
1200
1400
1600
1955
1958
1961
1964
1967
1970
1973
1976
1979
1982
1985
1988
1991
1994
1997
2000
2003
years
Thou
sand
of t
o
Côte d'Ivoire Ghana Indonesia
Sources : ICCO and Ed&F man, various issues
Some observers stress the impact of smuggling. Starting in 2003 and especially in 2003/04, the historical flow of Ghana cocoa beans towards Côte d’Ivoire had reversed. Due to the fact that the producer price was around 60% of its neighbour’s price, Ivorian cocoa has been smuggled into Ghana.
Other observers and stakeholders, including the Government of Ghana through its Ghana Cocoa Board (Cocobod), tend to deny any significant smuggling and claim that the increase was due to a Ghanaian breakthrough, especially due to an effective cocoa sector policy.
Before starting any analysis, one has to acknowledge and underline the quite impressive set of positive signals and support given to cocoa farmers by the Government through Cocobod over the recent years:
- A liberalization of the domestic marketing system, resulting in increased competition between buyers (Teal and Vigneri 2004, Vigneri 2005, Laven, 2007, Ruf 2007a). - A significant increase in the price paid to the producers (Teal and Vigneri 2004, Teal et al, 2006, Vigneri 2005). - The launch and the continuation of the mass spraying service (Ed&F man 2004). - The organisation of the introduction of fertilizer in farms and its distribution backed by Cocobod through a credit scheme in 2003, followed by a second step in 2007 based on a subsidy (Ruf 2004, Ruf, Deheuvels, Sarpong, 2006, Teal & al, 2006).
The main objective of this survey and document is to contribute to raise and answer the questions behind these changes. What is the statistical breakdown of this new cocoa boom in

The new Ghana Cocoa Boom in the 2000s - F. Ruf (CIRAD, November 2007)
6
Ghana? What is the evolution of the various production factors? Do we still observe massive new planting? Or is the change mostly due to the adoption of hybrids, insecticides, fungicides fertilizers? What are the respective roles of mass spraying and individual spraying? Insecticides or fungicides? What is the current degree of fertilizer adoption?
Unless the smuggling flows play a major role, the production increase in the 2000s is so intense that one can use the word “boom”. Behind all these specific questions, the fundamental one is included in the title: Forest Clearing or Green Revolution? Is the boom mostly explained by a repetition of the ‘old stuff’, massive migrations and new plantings at the expense of the forests? Or does a significant set of technological breakthrough represents the main explanation behind the production increase? If “intensification” is confirmed, can it be interpreted as the beginning of a green revolution?
1. Method and sample
The method relies on a preliminary survey carried out in 3 districts (1 in the Eastern region, 2 in the Western region) in 2004 on some 150 farms and on an additional 300-farm sample built in 2007. A 350-farm survey was the initial target (See Annex 1). By updating the previous one and enlarging the sample to seven to eight districts or part of districts (one in the Eastern region, one in the Central region, one in the Ashanti region, one in the Brong Ahafo region, and three to four in the Western region, where more that 50% of the cocoa is produced) the sample was finally extended to 442 households. The choice of selecting half of the sites in the Western region is justified by the massive migrations and specific increase in production in that region (Fig.2).
Fig.2. Cocoa Production of Ghana per region
0
100000
200000
300000
400000
500000
600000
700000
60/6
1
63/6
4
66/6
7
69/7
0
72/7
3
75/7
6
78/7
9
81/8
2
84/8
5
87/8
8
90/9
1
93/9
4
96/9
7
99/0
0
tonn
es
Ashanti Brong Ahafo Central Eastern Western Volta
Sources : Cocobod This survey was done in May-July 2007. In each district, a cluster effect was deliberately searched by selecting only 1 to 4 villages. The first reason was to conserve and build
The new Ghana Cocoa Boom in the 2000s - F. Ruf (CIRAD, November 2007)
7
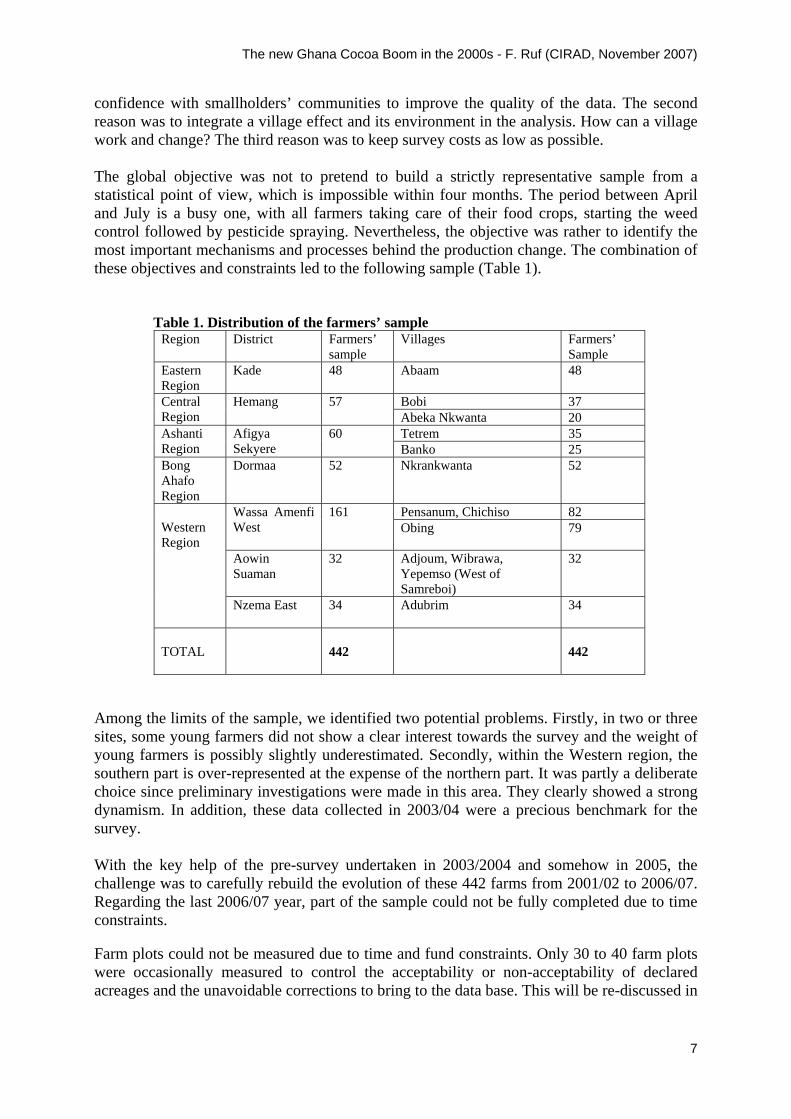
confidence with smallholders’ communities to improve the quality of the data. The second reason was to integrate a village effect and its environment in the analysis. How can a village work and change? The third reason was to keep survey costs as low as possible. The global objective was not to pretend to build a strictly representative sample from a statistical point of view, which is impossible within four months. The period between April and July is a busy one, with all farmers taking care of their food crops, starting the weed control followed by pesticide spraying. Nevertheless, the objective was rather to identify the most important mechanisms and processes behind the production change. The combination of these objectives and constraints led to the following sample (Table 1).
Table 1. Distribution of the farmers’ sample
Region District Farmers’ sample
Villages Farmers’ Sample
Eastern Region
Kade 48 Abaam 48
Bobi 37 Central Region
Hemang 57 Abeka Nkwanta 20 Tetrem 35 Ashanti
Region Afigya Sekyere
60 Banko 25
Bong Ahafo Region
Dormaa 52 Nkrankwanta 52
Pensanum, Chichiso 82 Wassa Amenfi West
161 Obing 79
Aowin Suaman
32 Adjoum, Wibrawa, Yepemso (West of Samreboi)
32
Western Region
Nzema East
34 Adubrim 34
TOTAL
442
442
Among the limits of the sample, we identified two potential problems. Firstly, in two or three sites, some young farmers did not show a clear interest towards the survey and the weight of young farmers is possibly slightly underestimated. Secondly, within the Western region, the southern part is over-represented at the expense of the northern part. It was partly a deliberate choice since preliminary investigations were made in this area. They clearly showed a strong dynamism. In addition, these data collected in 2003/04 were a precious benchmark for the survey. With the key help of the pre-survey undertaken in 2003/2004 and somehow in 2005, the challenge was to carefully rebuild the evolution of these 442 farms from 2001/02 to 2006/07. Regarding the last 2006/07 year, part of the sample could not be fully completed due to time constraints. Farm plots could not be measured due to time and fund constraints. Only 30 to 40 farm plots were occasionally measured to control the acceptability or non-acceptability of declared acreages and the unavoidable corrections to bring to the data base. This will be re-discussed in

The new Ghana Cocoa Boom in the 2000s - F. Ruf (CIRAD, November 2007)
8
the section where it really matters, about production areas and yields per hectare (sections 7 and 8). Among the other limits of such surveys made on relatively large samples, one must also stress the huge complexity of institutional arrangements between indigenous and migrants, and also within each family, either autochtons or migrant. Although these institutional arrangements are not the topic of that survey, they really impact on it. For instance, one needs to pay a great attention to the risk of under-declaration of production. This is universal since farmers are just like every one. They can forget and they do not easily declare all their revenues openly. However, these risks are enormously enhanced when interviewed farmers are under production sharing contracts, either formal or informal. As many may tend to dissimulate part of the production and thus keep a bigger share, they are certainly not ready to tell all the truth to researchers and enumerators. Finally, taking into account the extreme time constraints for such an ambitious objective of establishing a statistical breakdown of the recent cocoa boom, priority has been given to the quality of data collection, with a lot of data screening, verifications and occasional re-surveys. The analysis remains voluntarily close to the data, without econometric analysis. This may come later on with additional time and funding. 2. Cocoa Production: macro/micro economics and smuggling How does the production of the 442-farm sample evolve compared to the ‘official’ national production, at least with the production figures acknowledged and published by International institutions and companies such as ICCO and Ed&F Man? Although the sample was not conceived to be strictly representative, the comparison of production seems to give it some credibility. At least, with the exception of the last 2006/07 results which are still provisional, the two time series go in the same directions every year (Tables 2 and 3). Table 2. Total cocoa production of the 442-farm sample. 2001/02 to 2006/07. (a)
2001/02 (b) 2002/03
(c) 2003/04
(d) 2004/05
(e) 2005/06
(f) 2006/07
(e+f)-(a+b) / (a+b) (in %)
Total Cocoa production (number of 62.5kg bags)
4662
5177
6124
6110
7355
7461 (1)
% increase over one year n/(n-1)
+11%
+18%
-0,2%
+20%
+1%
+51%
(1) Provisional findings in 2006/07 Source: Author’s survey Table 3. First estimate of the national cocoa production in Ghana. 2001/02 to 2006/07. (a)
2001/02 (b) 2002/03
(c) 2003/04
(d) 2004/05
(e) 2005/06
(f) 2006/07
(E+f)-(a+b) / (a+b) (in %)
National Cocoa production (x 1000 tonnes)
340
497
736
600
705
650
% increase over one year n/(n-1)
+46%
+48%
-18%
+18%
-8%
+62%
Sources: ICCO and Ed&F Man
The new Ghana Cocoa Boom in the 2000s - F. Ruf (CIRAD, November 2007)
9
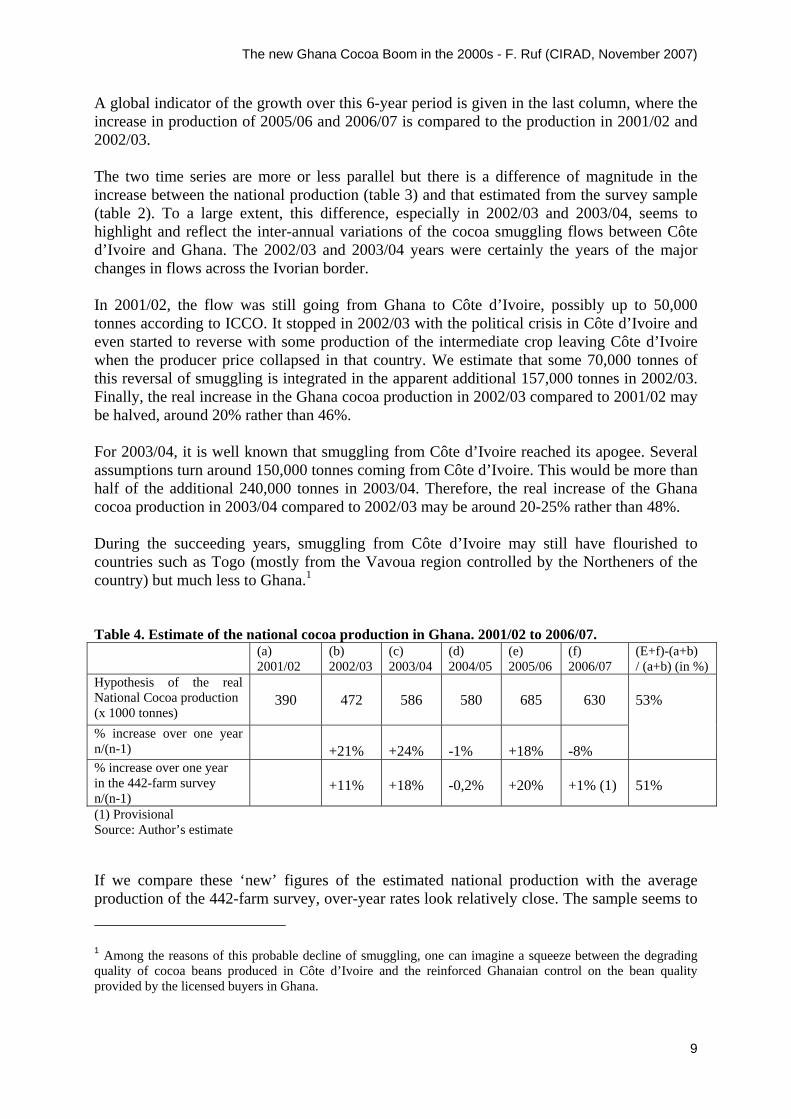
A global indicator of the growth over this 6-year period is given in the last column, where the increase in production of 2005/06 and 2006/07 is compared to the production in 2001/02 and 2002/03. The two time series are more or less parallel but there is a difference of magnitude in the increase between the national production (table 3) and that estimated from the survey sample (table 2). To a large extent, this difference, especially in 2002/03 and 2003/04, seems to highlight and reflect the inter-annual variations of the cocoa smuggling flows between Côte d’Ivoire and Ghana. The 2002/03 and 2003/04 years were certainly the years of the major changes in flows across the Ivorian border. In 2001/02, the flow was still going from Ghana to Côte d’Ivoire, possibly up to 50,000 tonnes according to ICCO. It stopped in 2002/03 with the political crisis in Côte d’Ivoire and even started to reverse with some production of the intermediate crop leaving Côte d’Ivoire when the producer price collapsed in that country. We estimate that some 70,000 tonnes of this reversal of smuggling is integrated in the apparent additional 157,000 tonnes in 2002/03. Finally, the real increase in the Ghana cocoa production in 2002/03 compared to 2001/02 may be halved, around 20% rather than 46%. For 2003/04, it is well known that smuggling from Côte d’Ivoire reached its apogee. Several assumptions turn around 150,000 tonnes coming from Côte d’Ivoire. This would be more than half of the additional 240,000 tonnes in 2003/04. Therefore, the real increase of the Ghana cocoa production in 2003/04 compared to 2002/03 may be around 20-25% rather than 48%. During the succeeding years, smuggling from Côte d’Ivoire may still have flourished to countries such as Togo (mostly from the Vavoua region controlled by the Northeners of the country) but much less to Ghana.1 Table 4. Estimate of the national cocoa production in Ghana. 2001/02 to 2006/07. (a)
2001/02 (b) 2002/03
(c) 2003/04
(d) 2004/05
(e) 2005/06
(f) 2006/07
(E+f)-(a+b) / (a+b) (in %)
Hypothesis of the real National Cocoa production (x 1000 tonnes)
390
472
586
580
685
630
% increase over one year n/(n-1)
+21%
+24%
-1%
+18%
-8%
53%
% increase over one year in the 442-farm survey n/(n-1)
+11%
+18%
-0,2%
+20%
+1% (1)
51%
(1) Provisional Source: Author’s estimate If we compare these ‘new’ figures of the estimated national production with the average production of the 442-farm survey, over-year rates look relatively close. The sample seems to
1 Among the reasons of this probable decline of smuggling, one can imagine a squeeze between the degrading quality of cocoa beans produced in Côte d’Ivoire and the reinforced Ghanaian control on the bean quality provided by the licensed buyers in Ghana.

The new Ghana Cocoa Boom in the 2000s - F. Ruf (CIRAD, November 2007)
10
slightly underestimate the first increase in 2002/03 and possibly slightly overestimate the 2004/05 production, but the global indicator is virtually the same, slightly above 50%. The average of the last two years (2005/06 and 2006/07) is 50% above the average of the first two years (2001/02 and 2002/03). To a certain extent, this 442-farm sample helps to validate part of the hypothesis about smuggling. As a corollary and more importantly, these estimates somewhat validate the use of the sample to better understand the breakdown of the production increase in recent years. At the national level, once the residual cocoa smuggling is put aside, the 50% increase to be explained represents some 215,000 tonnes. Where do they come from? 3. The increasing weight of the ‘light’ crop A first interesting result is the increasing weight of the intermediate or light crop. At least until the 1980s, it was common to have a light crop (Late May to August, possibly September) hardly representing 10-15% of the total annual production. According to our survey, this percentage clearly increases in the 2000s (table 5). Table 5. Evolution of the percentage of the intermediate crop in Ghana compared to the total annual production. 2001/02 to 2006/07. (a)
2001/02 (b) 2002/03
(c) 2003/04
(d) 2004/05
(e) 2005/06
(f) 2006/07
Estimated percentage (442-farm survey)
20%
21%
22%
23%
25%
21% (1)
(1) provisional Some precaution is required since the definition of the ‘light crop’ has ambiguous time frontiers. A premium for the main crop is at stake, at the export level as well as at the farmers’ level. However, this increasing role of the light crop looks like a fact. What remains is to explain it. Five factors could interact.
- A climate change in all cocoa producing regions of Ghana - A structural cocoa production shift towards the Western region where there is abundant rainfall throughout the year - The new adoption of fertilizer - The recent increase in the rate of adoption of hybrids - The tree youth effect
3.1 Climate change hypothesis Some experts put forward climate change in recent years. If it is confirmed, and contrary to pre-conceived ideas, this is not always negative for agriculture and cocoa. Total rainfall may have decreased over recent or less recent years but a smoother dry season and a less unequal monthly distribution of rainfall could account for this higher weight of the intermediate crop, which ends up with a total increase in cocoa production in Ghana and West-Africa in general. As we do not have rainfall data available, this is considered here as a mere hypothesis, that would remain to be demonstrated.
The new Ghana Cocoa Boom in the 2000s - F. Ruf (CIRAD, November 2007)
11
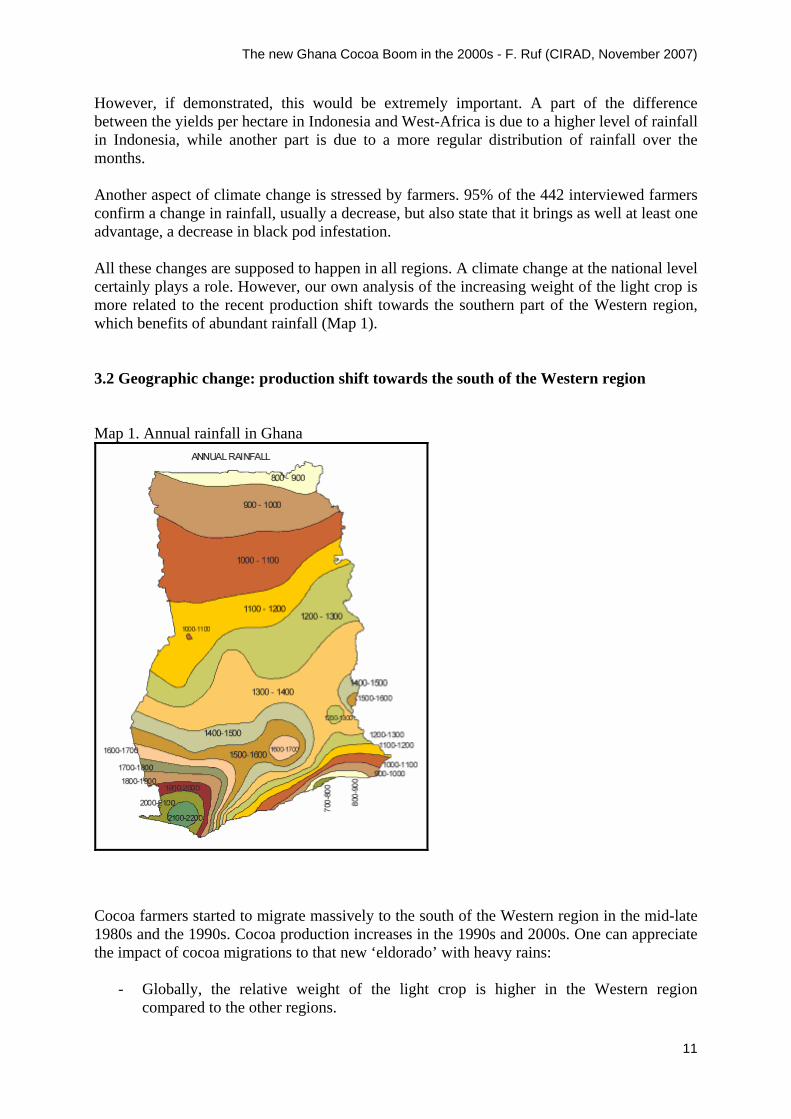
However, if demonstrated, this would be extremely important. A part of the difference between the yields per hectare in Indonesia and West-Africa is due to a higher level of rainfall in Indonesia, while another part is due to a more regular distribution of rainfall over the months. Another aspect of climate change is stressed by farmers. 95% of the 442 interviewed farmers confirm a change in rainfall, usually a decrease, but also state that it brings as well at least one advantage, a decrease in black pod infestation. All these changes are supposed to happen in all regions. A climate change at the national level certainly plays a role. However, our own analysis of the increasing weight of the light crop is more related to the recent production shift towards the southern part of the Western region, which benefits of abundant rainfall (Map 1). 3.2 Geographic change: production shift towards the south of the Western region Map 1. Annual rainfall in Ghana
Cocoa farmers started to migrate massively to the south of the Western region in the mid-late 1980s and the 1990s. Cocoa production increases in the 1990s and 2000s. One can appreciate the impact of cocoa migrations to that new ‘eldorado’ with heavy rains:
- Globally, the relative weight of the light crop is higher in the Western region compared to the other regions.
The new Ghana Cocoa Boom in the 2000s - F. Ruf (CIRAD, November 2007)
12
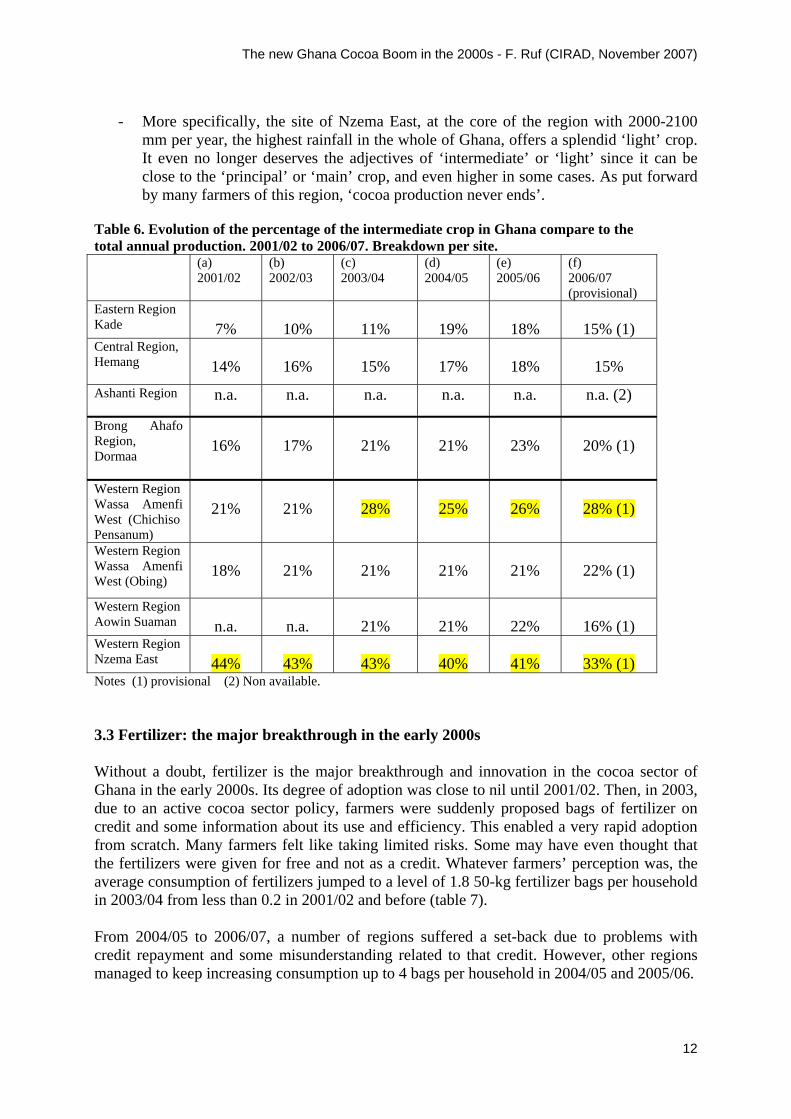
- More specifically, the site of Nzema East, at the core of the region with 2000-2100
mm per year, the highest rainfall in the whole of Ghana, offers a splendid ‘light’ crop. It even no longer deserves the adjectives of ‘intermediate’ or ‘light’ since it can be close to the ‘principal’ or ‘main’ crop, and even higher in some cases. As put forward by many farmers of this region, ‘cocoa production never ends’.
Table 6. Evolution of the percentage of the intermediate crop in Ghana compare to the total annual production. 2001/02 to 2006/07. Breakdown per site. (a)
2001/02 (b) 2002/03
(c) 2003/04
(d) 2004/05
(e) 2005/06
(f) 2006/07 (provisional)
Eastern Region Kade
7%
10%
11%
19%
18%
15% (1)
Central Region, Hemang
14%
16%
15%
17%
18%
15%
Ashanti Region
n.a. n.a. n.a. n.a. n.a. n.a. (2)
Brong Ahafo Region, Dormaa
16%
17%
21%
21%
23%
20% (1)
Western Region Wassa Amenfi West (Chichiso Pensanum)
21%
21%
28%
25%
26%
28% (1)
Western Region Wassa Amenfi West (Obing)
18%
21%
21%
21%
21%
22% (1)
Western Region Aowin Suaman
n.a.
n.a.
21%
21%
22%
16% (1)
Western Region Nzema East
44%
43%
43%
40%
41%
33% (1)
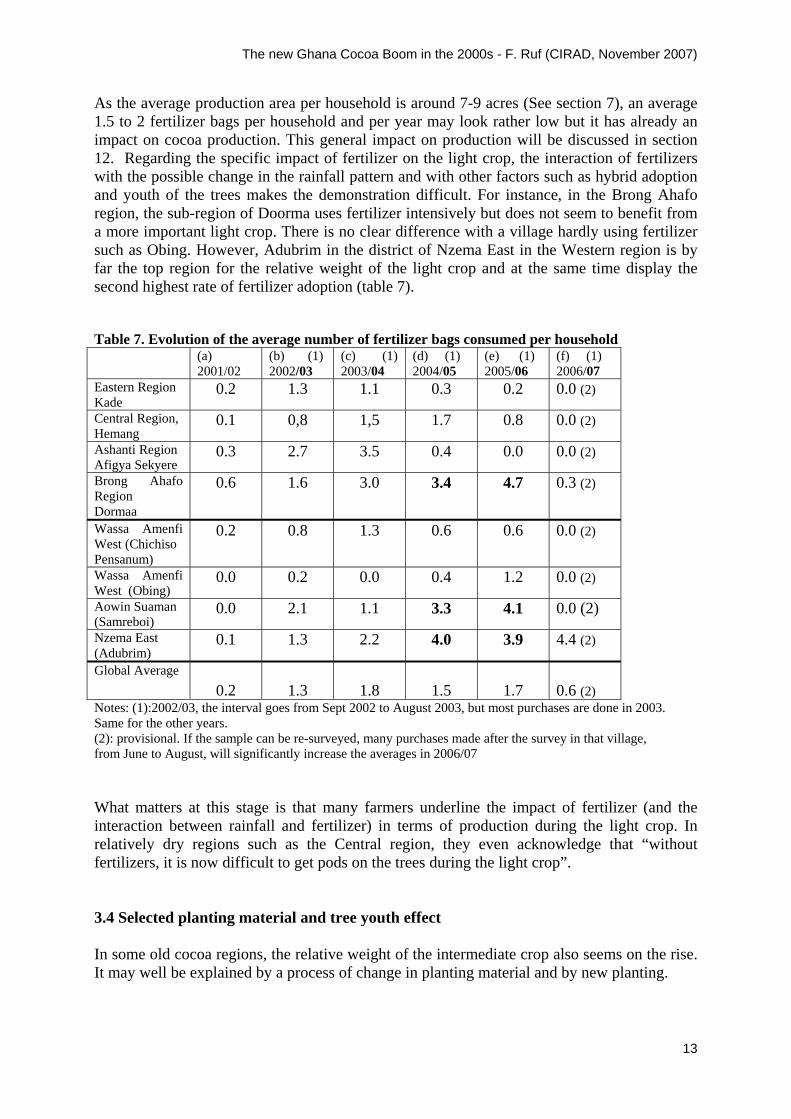
Notes (1) provisional (2) Non available. 3.3 Fertilizer: the major breakthrough in the early 2000s Without a doubt, fertilizer is the major breakthrough and innovation in the cocoa sector of Ghana in the early 2000s. Its degree of adoption was close to nil until 2001/02. Then, in 2003, due to an active cocoa sector policy, farmers were suddenly proposed bags of fertilizer on credit and some information about its use and efficiency. This enabled a very rapid adoption from scratch. Many farmers felt like taking limited risks. Some may have even thought that the fertilizers were given for free and not as a credit. Whatever farmers’ perception was, the average consumption of fertilizers jumped to a level of 1.8 50-kg fertilizer bags per household in 2003/04 from less than 0.2 in 2001/02 and before (table 7). From 2004/05 to 2006/07, a number of regions suffered a set-back due to problems with credit repayment and some misunderstanding related to that credit. However, other regions managed to keep increasing consumption up to 4 bags per household in 2004/05 and 2005/06.
The new Ghana Cocoa Boom in the 2000s - F. Ruf (CIRAD, November 2007)
13
As the average production area per household is around 7-9 acres (See section 7), an average 1.5 to 2 fertilizer bags per household and per year may look rather low but it has already an impact on cocoa production. This general impact on production will be discussed in section 12. Regarding the specific impact of fertilizer on the light crop, the interaction of fertilizers with the possible change in the rainfall pattern and with other factors such as hybrid adoption and youth of the trees makes the demonstration difficult. For instance, in the Brong Ahafo region, the sub-region of Doorma uses fertilizer intensively but does not seem to benefit from a more important light crop. There is no clear difference with a village hardly using fertilizer such as Obing. However, Adubrim in the district of Nzema East in the Western region is by far the top region for the relative weight of the light crop and at the same time display the second highest rate of fertilizer adoption (table 7). Table 7. Evolution of the average number of fertilizer bags consumed per household (a)
2001/02 (b) (1) 2002/03
(c) (1) 2003/04
(d) (1) 2004/05
(e) (1) 2005/06
(f) (1) 2006/07
Eastern Region Kade
0.2 1.3 1.1 0.3 0.2 0.0 (2)
Central Region, Hemang
0.1 0,8 1,5 1.7 0.8 0.0 (2)
Ashanti Region Afigya Sekyere
0.3 2.7 3.5 0.4 0.0 0.0 (2)
Brong Ahafo Region Dormaa
0.6 1.6 3.0 3.4 4.7 0.3 (2)
Wassa Amenfi West (Chichiso Pensanum)
0.2 0.8 1.3 0.6 0.6 0.0 (2)
Wassa Amenfi West (Obing)
0.0 0.2 0.0 0.4 1.2 0.0 (2)
Aowin Suaman (Samreboi)
0.0 2.1 1.1 3.3 4.1 0.0 (2)
Nzema East (Adubrim)
0.1 1.3 2.2 4.0 3.9 4.4 (2)
Global Average
0.2
1.3
1.8
1.5
1.7
0.6 (2)
Notes: (1):2002/03, the interval goes from Sept 2002 to August 2003, but most purchases are done in 2003. Same for the other years. (2): provisional. If the sample can be re-surveyed, many purchases made after the survey in that village, from June to August, will significantly increase the averages in 2006/07 What matters at this stage is that many farmers underline the impact of fertilizer (and the interaction between rainfall and fertilizer) in terms of production during the light crop. In relatively dry regions such as the Central region, they even acknowledge that “without fertilizers, it is now difficult to get pods on the trees during the light crop”. 3.4 Selected planting material and tree youth effect In some old cocoa regions, the relative weight of the intermediate crop also seems on the rise. It may well be explained by a process of change in planting material and by new planting.
The new Ghana Cocoa Boom in the 2000s - F. Ruf (CIRAD, November 2007)
14
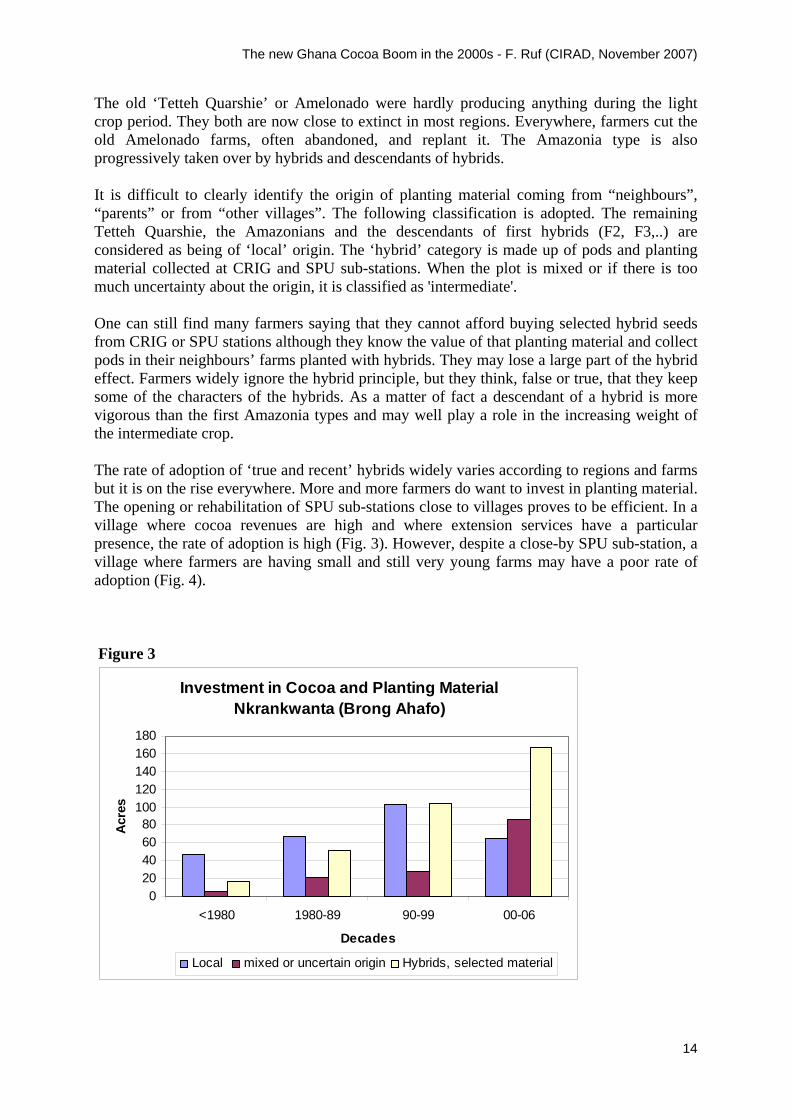
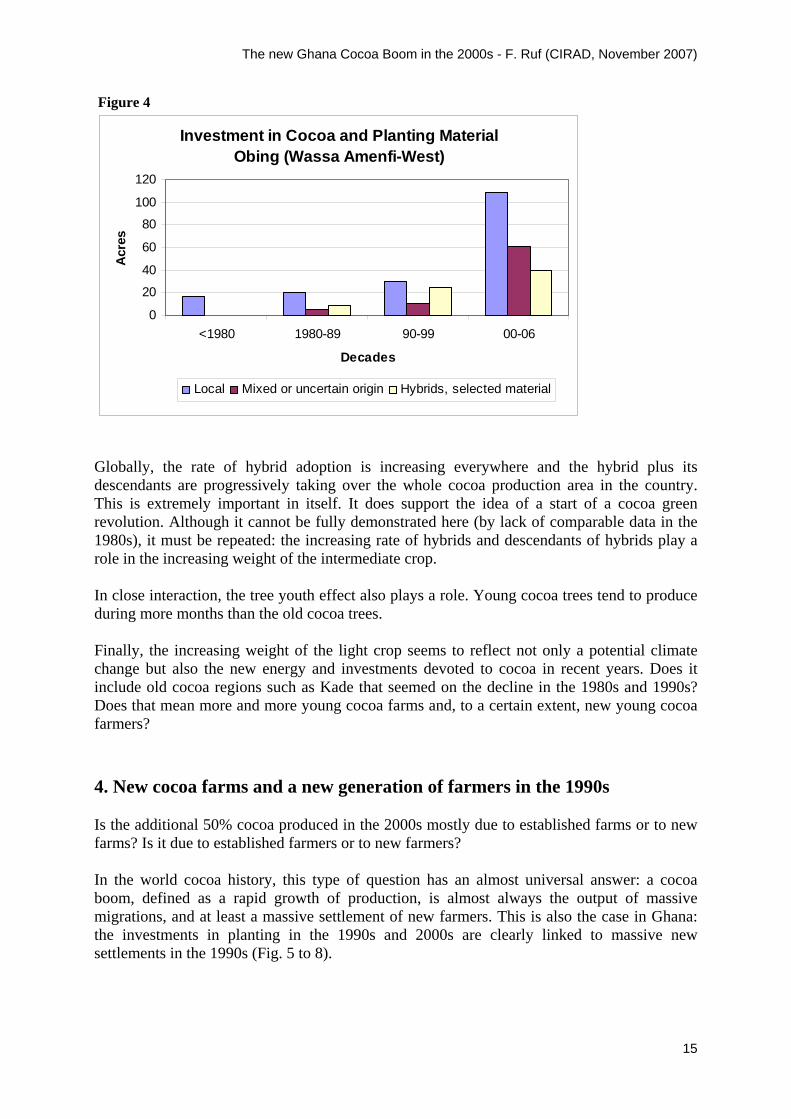
The old ‘Tetteh Quarshie’ or Amelonado were hardly producing anything during the light crop period. They both are now close to extinct in most regions. Everywhere, farmers cut the old Amelonado farms, often abandoned, and replant it. The Amazonia type is also progressively taken over by hybrids and descendants of hybrids. It is difficult to clearly identify the origin of planting material coming from “neighbours”, “parents” or from “other villages”. The following classification is adopted. The remaining Tetteh Quarshie, the Amazonians and the descendants of first hybrids (F2, F3,..) are considered as being of ‘local’ origin. The ‘hybrid’ category is made up of pods and planting material collected at CRIG and SPU sub-stations. When the plot is mixed or if there is too much uncertainty about the origin, it is classified as 'intermediate'. One can still find many farmers saying that they cannot afford buying selected hybrid seeds from CRIG or SPU stations although they know the value of that planting material and collect pods in their neighbours’ farms planted with hybrids. They may lose a large part of the hybrid effect. Farmers widely ignore the hybrid principle, but they think, false or true, that they keep some of the characters of the hybrids. As a matter of fact a descendant of a hybrid is more vigorous than the first Amazonia types and may well play a role in the increasing weight of the intermediate crop. The rate of adoption of ‘true and recent’ hybrids widely varies according to regions and farms but it is on the rise everywhere. More and more farmers do want to invest in planting material. The opening or rehabilitation of SPU sub-stations close to villages proves to be efficient. In a village where cocoa revenues are high and where extension services have a particular presence, the rate of adoption is high (Fig. 3). However, despite a close-by SPU sub-station, a village where farmers are having small and still very young farms may have a poor rate of adoption (Fig. 4). Figure 3
Investment in Cocoa and Planting MaterialNkrankwanta (Brong Ahafo)
020406080
100120140160180
<1980 1980-89 90-99 00-06
Decades
Acr
es
Local mixed or uncertain origin Hybrids, selected material
The new Ghana Cocoa Boom in the 2000s - F. Ruf (CIRAD, November 2007)
15
Figure 4
Investment in Cocoa and Planting MaterialObing (Wassa Amenfi-West)
0
20
40
60
80
100
120
<1980 1980-89 90-99 00-06
Decades
Acr
es
Local Mixed or uncertain origin Hybrids, selected material
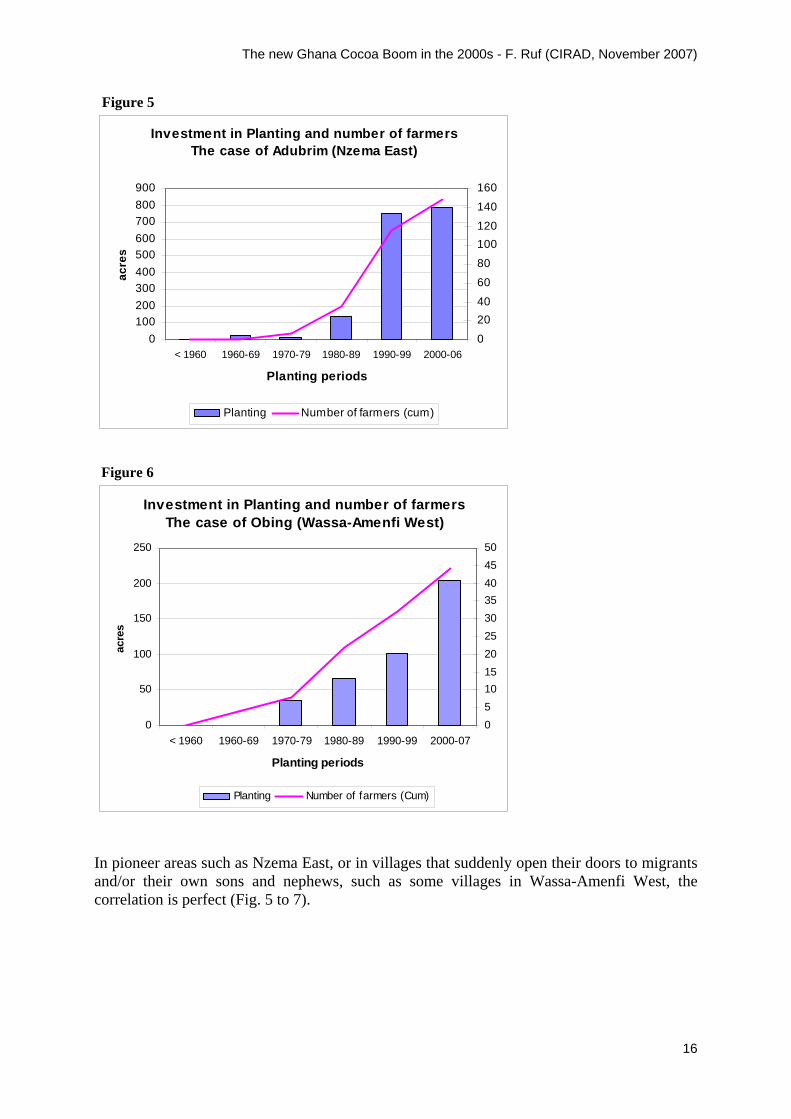
Globally, the rate of hybrid adoption is increasing everywhere and the hybrid plus its descendants are progressively taking over the whole cocoa production area in the country. This is extremely important in itself. It does support the idea of a start of a cocoa green revolution. Although it cannot be fully demonstrated here (by lack of comparable data in the 1980s), it must be repeated: the increasing rate of hybrids and descendants of hybrids play a role in the increasing weight of the intermediate crop. In close interaction, the tree youth effect also plays a role. Young cocoa trees tend to produce during more months than the old cocoa trees. Finally, the increasing weight of the light crop seems to reflect not only a potential climate change but also the new energy and investments devoted to cocoa in recent years. Does it include old cocoa regions such as Kade that seemed on the decline in the 1980s and 1990s? Does that mean more and more young cocoa farms and, to a certain extent, new young cocoa farmers? 4. New cocoa farms and a new generation of farmers in the 1990s Is the additional 50% cocoa produced in the 2000s mostly due to established farms or to new farms? Is it due to established farmers or to new farmers? In the world cocoa history, this type of question has an almost universal answer: a cocoa boom, defined as a rapid growth of production, is almost always the output of massive migrations, and at least a massive settlement of new farmers. This is also the case in Ghana: the investments in planting in the 1990s and 2000s are clearly linked to massive new settlements in the 1990s (Fig. 5 to 8).
The new Ghana Cocoa Boom in the 2000s - F. Ruf (CIRAD, November 2007)
16
Figure 5
Investment in Planting and number of farmersThe case of Adubrim (Nzema East)
0100200300400500600700800900
< 1960 1960-69 1970-79 1980-89 1990-99 2000-06
Planting periods
acre
s
0
2040
60
80
100120
140
160
Planting Number of farmers (cum)
Figure 6
Investment in Planting and number of farmersThe case of Obing (Wassa-Amenfi West)
0
50
100
150
200
250
< 1960 1960-69 1970-79 1980-89 1990-99 2000-07
Planting periods
acre
s
05101520253035404550
Planting Number of farmers (Cum)
In pioneer areas such as Nzema East, or in villages that suddenly open their doors to migrants and/or their own sons and nephews, such as some villages in Wassa-Amenfi West, the correlation is perfect (Fig. 5 to 7).
The new Ghana Cocoa Boom in the 2000s - F. Ruf (CIRAD, November 2007)
17
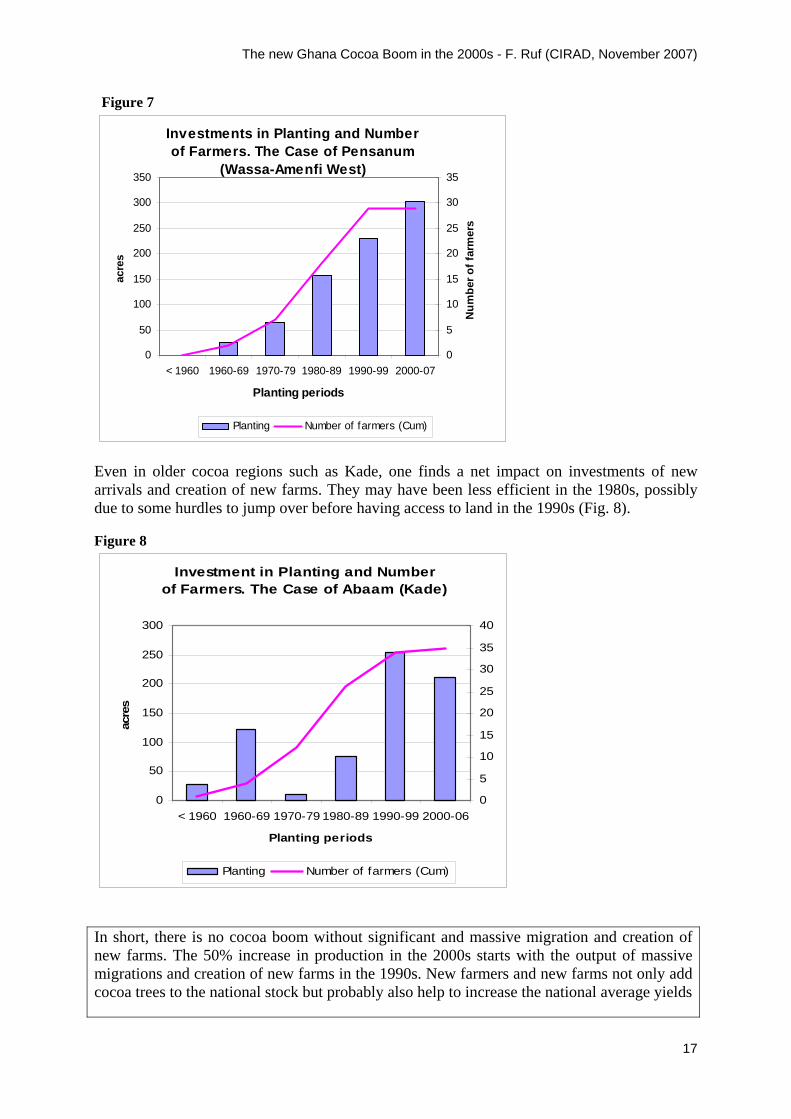
Figure 7
Investments in Planting and Number of Farmers. The Case of Pensanum
(Wassa-Amenfi West)
0
50
100
150
200
250
300
350
< 1960 1960-69 1970-79 1980-89 1990-99 2000-07
Planting periods
acre
s
0
5
10
15
20
25
30
35
Num
ber o
f far
mer
s
Planting Number of farmers (Cum)
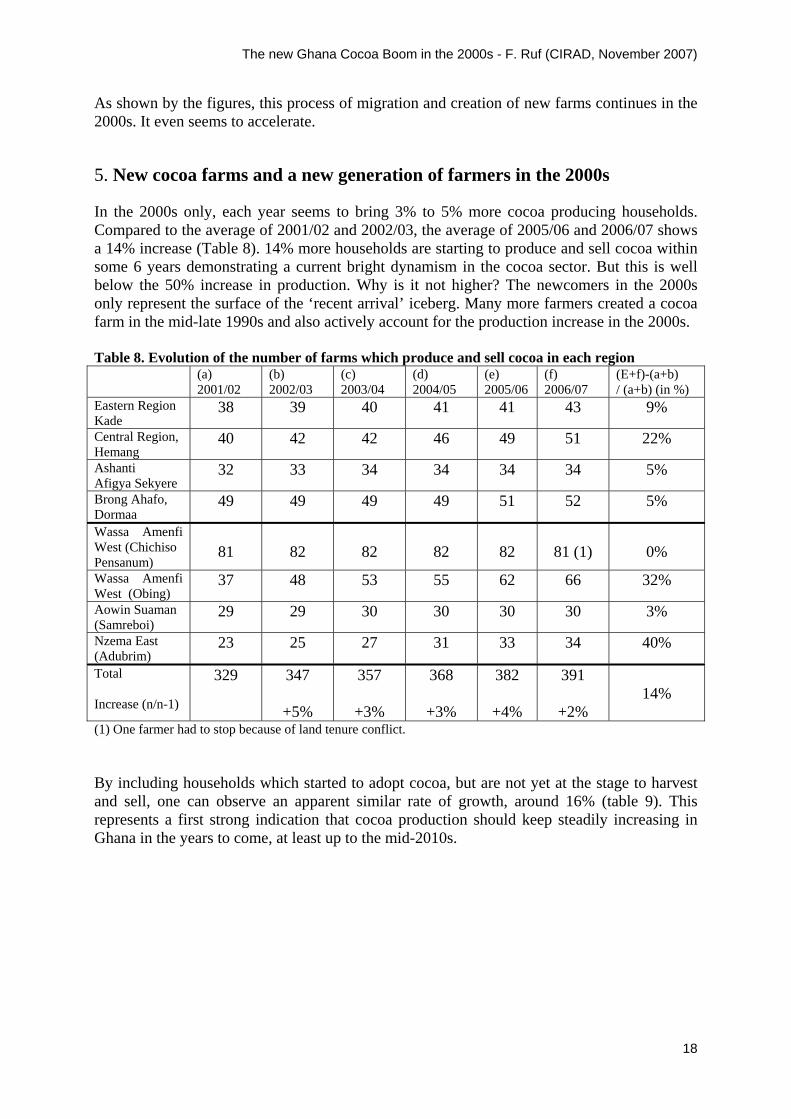
Even in older cocoa regions such as Kade, one finds a net impact on investments of new arrivals and creation of new farms. They may have been less efficient in the 1980s, possibly due to some hurdles to jump over before having access to land in the 1990s (Fig. 8). Figure 8
Investment in Planting and Number of Farmers. The Case of Abaam (Kade)
0
50
100
150
200
250
300
< 1960 1960-69 1970-79 1980-89 1990-99 2000-06
Planting periods
acre
s
0
5
10
15
20
25
30
35
40
Planting Number of farmers (Cum)
In short, there is no cocoa boom without significant and massive migration and creation of new farms. The 50% increase in production in the 2000s starts with the output of massive migrations and creation of new farms in the 1990s. New farmers and new farms not only add cocoa trees to the national stock but probably also help to increase the national average yields
The new Ghana Cocoa Boom in the 2000s - F. Ruf (CIRAD, November 2007)
18
As shown by the figures, this process of migration and creation of new farms continues in the 2000s. It even seems to accelerate. 5. New cocoa farms and a new generation of farmers in the 2000s In the 2000s only, each year seems to bring 3% to 5% more cocoa producing households. Compared to the average of 2001/02 and 2002/03, the average of 2005/06 and 2006/07 shows a 14% increase (Table 8). 14% more households are starting to produce and sell cocoa within some 6 years demonstrating a current bright dynamism in the cocoa sector. But this is well below the 50% increase in production. Why is it not higher? The newcomers in the 2000s only represent the surface of the ‘recent arrival’ iceberg. Many more farmers created a cocoa farm in the mid-late 1990s and also actively account for the production increase in the 2000s. Table 8. Evolution of the number of farms which produce and sell cocoa in each region (a)
2001/02 (b) 2002/03
(c) 2003/04
(d) 2004/05
(e) 2005/06
(f) 2006/07
(E+f)-(a+b) / (a+b) (in %)
Eastern Region Kade
38 39 40 41 41 43 9%
Central Region, Hemang
40 42 42 46 49 51 22%
Ashanti Afigya Sekyere
32 33 34 34 34 34 5%
Brong Ahafo, Dormaa
49 49 49 49 51 52 5%
Wassa Amenfi West (Chichiso Pensanum)
81
82
82
82
82
81 (1)
0%
Wassa Amenfi West (Obing)
37 48 53 55 62 66 32%
Aowin Suaman (Samreboi)
29 29 30 30 30 30 3%
Nzema East (Adubrim)
23 25 27 31 33 34 40%
Total Increase (n/n-1)
329 347
+5%
357
+3%
368
+3%
382
+4%
391
+2%
14%
(1) One farmer had to stop because of land tenure conflict. By including households which started to adopt cocoa, but are not yet at the stage to harvest and sell, one can observe an apparent similar rate of growth, around 16% (table 9). This represents a first strong indication that cocoa production should keep steadily increasing in Ghana in the years to come, at least up to the mid-2010s.

The new Ghana Cocoa Boom in the 2000s - F. Ruf (CIRAD, November 2007)
19
Table 9. Evolution of the number of cocoa farms in each region, including those which do not yet produce and sell cocoa (very new and young farms) (a)
2001/02 (b) 2002/03
(c) 2003/04
(d) 2004/05
(e) 2005/06
(f) 2006/07
(E+f)-(a+b) / (a+b) (in %)
Eastern Region Kade
43 43 48 48 48 48 12%
Central Region, Hemang
42 43 46 52 55 57 31%
Ashanti Afigya Sekyere
34 34 35 43 47 60 38%
Brong Ahafo, Dormaa
50 51 52 52 52 52 3%
Wassa Amenfi West (Chichiso Pensanum)
82
82
82
82
82
82
0%
Wassa Amenfi West (Obing)
58 59 69 75 76 79 32%
Aowin Suaman (Samreboi)
30 30 30 30 30 30 0%
Nzema East
31 32 34 34 34 34 6%
Total
370 374 396 416 424 442 16%
6. Farmers’ age: an encouraging signal for the cocoa sector As also recently seen by Assulming-Brempong and Sarpong (2006), the average farmer’s age is another indicator of the cocoa sector dynamism. An average age of 48 years and an apparent homogeneity in the different locations seems to remind us the long history and experience of Ghana in cocoa: on one hand, a large percentage of old farmers over 60 years, especially in the old cocoa regions such as the Ashanti and the Eastern regions; on the other hand a trend of a new generation in their 20s or 30s is coming in (and as briefly mentioned in section 2, is probably slightly under-estimated in the sample) (Table 10).
Table 10. Average farmers’age District Farmer’s age Kade
51
Hemang 49
Afigya Sekyere 52
B. Ahafo, Dormaa 56 49 Wassa Amenfi
West 44 Aowin Suaman
49
Nzema East
44
All
48
The new Ghana Cocoa Boom in the 2000s - F. Ruf (CIRAD, November 2007)
20
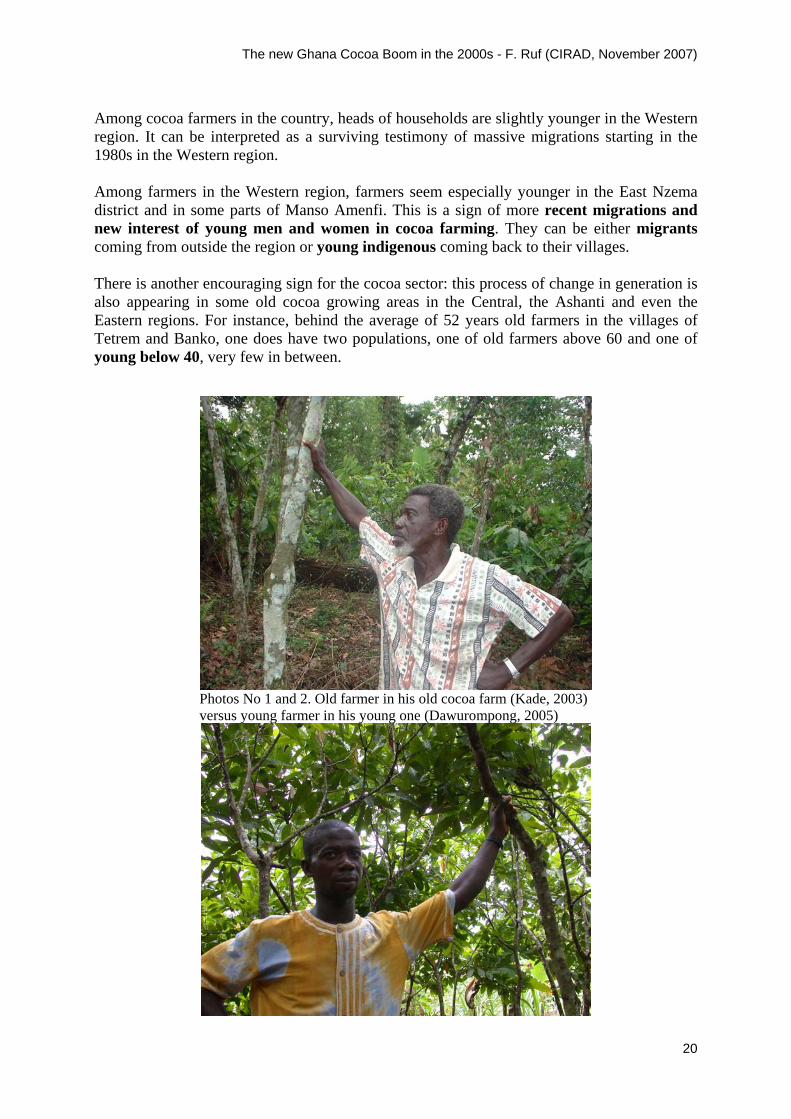
Among cocoa farmers in the country, heads of households are slightly younger in the Western region. It can be interpreted as a surviving testimony of massive migrations starting in the 1980s in the Western region. Among farmers in the Western region, farmers seem especially younger in the East Nzema district and in some parts of Manso Amenfi. This is a sign of more recent migrations and new interest of young men and women in cocoa farming. They can be either migrants coming from outside the region or young indigenous coming back to their villages. There is another encouraging sign for the cocoa sector: this process of change in generation is also appearing in some old cocoa growing areas in the Central, the Ashanti and even the Eastern regions. For instance, behind the average of 52 years old farmers in the villages of Tetrem and Banko, one does have two populations, one of old farmers above 60 and one of young below 40, very few in between.
Photos No 1 and 2. Old farmer in his old cocoa farm (Kade, 2003) versus young farmer in his young one (Dawurompong, 2005)
The new Ghana Cocoa Boom in the 2000s - F. Ruf (CIRAD, November 2007)
21
7. Cocoa production area 7.1 About the definition of one acre or one hectare of cocoa The very first difficulty is to accurately estimate one “declared” unit of surface area. Although rarely discussed in the literature, most farmers in the Western region and in the Central region use the unit ‘pole’ whose definition can be ‘elastic’ depending on the region and on the individual. Many farmers say it means either “30 x 30” or “36 x 36” or “40 x 40” but do not know exactly what unit is referred to by these figures. It is supposed to be the distance between the tips of a man’s two outstretched arms, but some farmers say it is the distance between two electric poles. After interviewing many farmers in Manso Amenfi, our preliminary estimate was that two poles are equivalent to three acres. This was confirmed by a professor in Economics. However, like squares or rectangles, angles “in the bush, are not always of 90°”, acreage is somewhat tricky and generally overestimated. After interviewing a few extension officers, and according to some measures made by a logging company in Samreboi, a first ‘consensus’ is that two declared poles are equivalent to one hectare or to 2.5 acres, but this estimate proved to be far from perfect. In other parts of the Western region, among a wide range of opinions, some farmers state the opposite: a pole is smaller than an acre. Most farmers do not seem to have a clear idea of what an acre is, but after measuring some 30 farm plots in the Nzema district, we discovered that what most farmers refer to as a pole in this district is effectively less than one acre.
A = 0.85 P – 0.15 (r2 = 0.91). A = Area in acres p = area in Poles
As it was not possible to measure farm plots in other districts, here we will use two cautious preliminary hypotheses to estimate the area under cocoa. Hyp 1: 1 pole = 0.50 ha = 1.24 acre Hyp 2: 1 pole = 0.36 ha = 0.90 acre The second problem concerns the definition of a cocoa farm itself. Above what threshold should we consider a farm to be abandoned and thus no longer to be included in the cocoa production area? The most obvious cases are Afigya Sekyere in the Ashanti region, Kade in the Eastern region, and Wassa Amenfi in the Western region, where a number of quasi-abandoned old farms are still declared as ‘cocoa farms’. These farms can have returned to forest or conversely have become plantations scattered with parks and fallows. As it is extremely difficult to identify which farm plots are under full production and which are not, it is almost impossible to estimate the exact percentage of a cocoa farm that is no longer productive, or farms that in fact no longer exist, here we prefer to estimate the ‘production area” according to the declared areas and the two hypotheses (1/ One declared pole is equivalent to 1.25 acre; 2/ equivalent to 0.90 acre). It must just be kept in mind that that some parts of the cocoa farms are still very young while other parts are abandoned or dead, all of which reduce average yields (Section 8).

The new Ghana Cocoa Boom in the 2000s - F. Ruf (CIRAD, November 2007)
22
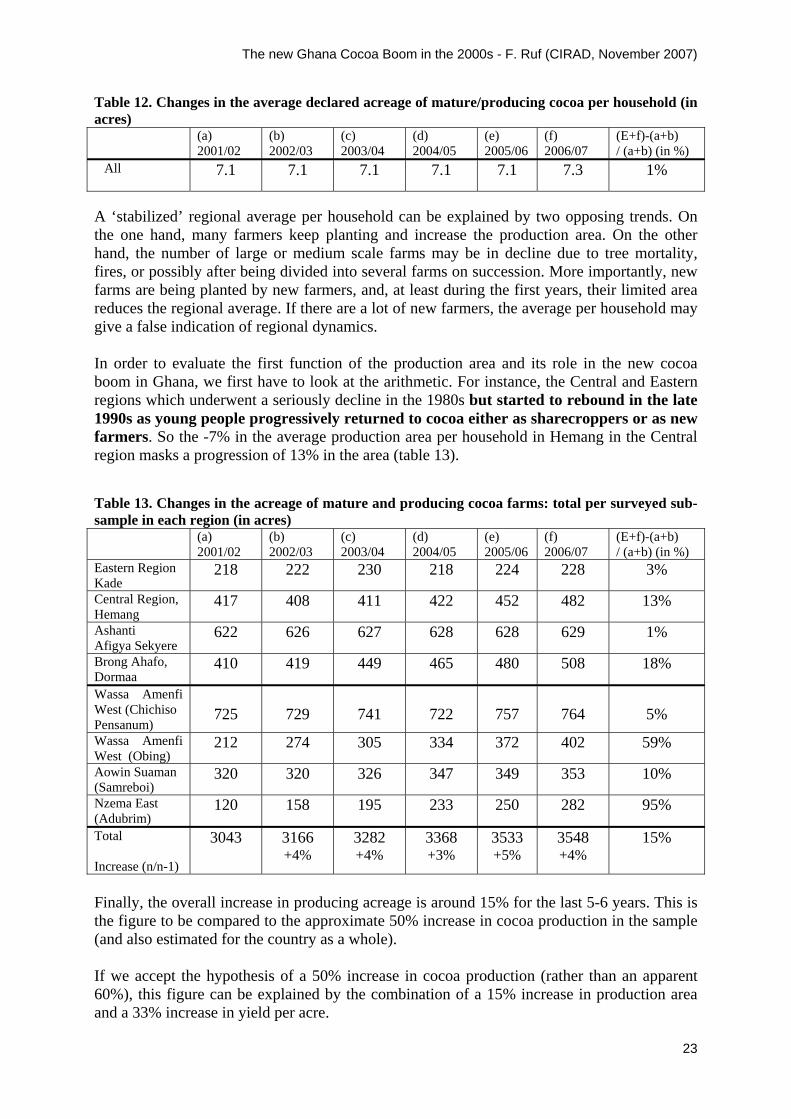
However, what really matters here is not the absolute average of the production area but the relative changes in acreage over the years. 7.2 Production area: a production factor and an asset The cocoa production area is simultaneously 1/ the main production factor in the farming system, 2/ an achievement in itself, an indicator of the tree stock, the main patrimony and wealth built by farmers. The average area per household is a good indicator of the latter (table 11). However, this indicator of wealth needs to be nuanced by other factors, mainly the age structure of the cocoa orchard. For instance, the average age of the cocoa area in the Ashanti Region, which is twice that of other regions, is more a testimony of past wealth than an indicator of current wealth. Plantations and planters are old and are now facing the replanting problem. The cocoa production area is declining slightly in some regions and increasing in others, especially in some parts of the Western region, but the most interesting output may well be the trade-off: an apparent overall stabilisation: a steady average of 9.2 – 9.3 acres per household. This at least represents the average of data obtained by interview and by using the first estimate of one pole being equivalent to 0.5 hectare and 1.24 acre (table 11). Table 11. Changes in the average declared acreage of mature/producing cocoa per household (in acres) (a)
2001/02 (b) 2002/03
(c) 2003/04
(d) 2004/05
(e) 2005/06
(f) 2006/07
(E+f)-(a+b) / (a+b) (in %)
Eastern Region Kade
5.7 5.7 5.7 5.3 5.5 5.5 -6%
Central Region, Hemang
10.4 9.7 9.8 9.2 9.2 9.5 -7%
Ashanti Region Afigya Sekyere
19.4 19.0 18.4 18.5 18.5 18.5 -4%
Brong Ahafo Region Dormaa
8.5 8.8 9.2 9.5 9.4 9.8 11%
Wassa Amenfi West (Chichiso Pensanum)
8.9
8.9
9.0
8.9
9.2
9.4
5%
Wassa Amenfi West (Obing)
5.7 5.7 5.7 6.1 6.0 6.1 6%
Aowin Suaman (Samreboi)
11.0 11.0 10.9 11.6 11.6 11.8 6%
Nzema East (Adubrim)
3.6 5.2 6.4 7.2 7.5 7.8 72%
All
9.2 9.1 9.2 9.2 9.2 9.3 1%
If we use the 2nd estimate of one pole being equivalent to 0.90 acre (in the five districts of the Western region where farmers declared their production area in “poles”), we obtain an average of around seven acres (table 12). The main result, the apparent stabilized average acreage, remains the same.
The new Ghana Cocoa Boom in the 2000s - F. Ruf (CIRAD, November 2007)
23
Table 12. Changes in the average declared acreage of mature/producing cocoa per household (in acres) (a)
2001/02 (b) 2002/03
(c) 2003/04
(d) 2004/05
(e) 2005/06
(f) 2006/07
(E+f)-(a+b) / (a+b) (in %)
All
7.1 7.1 7.1 7.1 7.1 7.3 1%
A ‘stabilized’ regional average per household can be explained by two opposing trends. On the one hand, many farmers keep planting and increase the production area. On the other hand, the number of large or medium scale farms may be in decline due to tree mortality, fires, or possibly after being divided into several farms on succession. More importantly, new farms are being planted by new farmers, and, at least during the first years, their limited area reduces the regional average. If there are a lot of new farmers, the average per household may give a false indication of regional dynamics. In order to evaluate the first function of the production area and its role in the new cocoa boom in Ghana, we first have to look at the arithmetic. For instance, the Central and Eastern regions which underwent a seriously decline in the 1980s but started to rebound in the late 1990s as young people progressively returned to cocoa either as sharecroppers or as new farmers. So the -7% in the average production area per household in Hemang in the Central region masks a progression of 13% in the area (table 13). Table 13. Changes in the acreage of mature and producing cocoa farms: total per surveyed sub-sample in each region (in acres) (a)
2001/02 (b) 2002/03
(c) 2003/04
(d) 2004/05
(e) 2005/06
(f) 2006/07
(E+f)-(a+b) / (a+b) (in %)
Eastern Region Kade
218 222 230 218 224 228 3%
Central Region, Hemang
417 408 411 422 452 482 13%
Ashanti Afigya Sekyere
622 626 627 628 628 629 1%
Brong Ahafo, Dormaa
410 419 449 465 480 508 18%
Wassa Amenfi West (Chichiso Pensanum)
725
729
741
722
757
764
5%
Wassa Amenfi West (Obing)
212 274 305 334 372 402 59%
Aowin Suaman (Samreboi)
320 320 326 347 349 353 10%
Nzema East (Adubrim)
120 158 195 233 250 282 95%
Total Increase (n/n-1)
3043 3166 +4%
3282 +4%
3368 +3%
3533 +5%
3548 +4%
15%
Finally, the overall increase in producing acreage is around 15% for the last 5-6 years. This is the figure to be compared to the approximate 50% increase in cocoa production in the sample (and also estimated for the country as a whole). If we accept the hypothesis of a 50% increase in cocoa production (rather than an apparent 60%), this figure can be explained by the combination of a 15% increase in production area and a 33% increase in yield per acre.
The new Ghana Cocoa Boom in the 2000s - F. Ruf (CIRAD, November 2007)
24
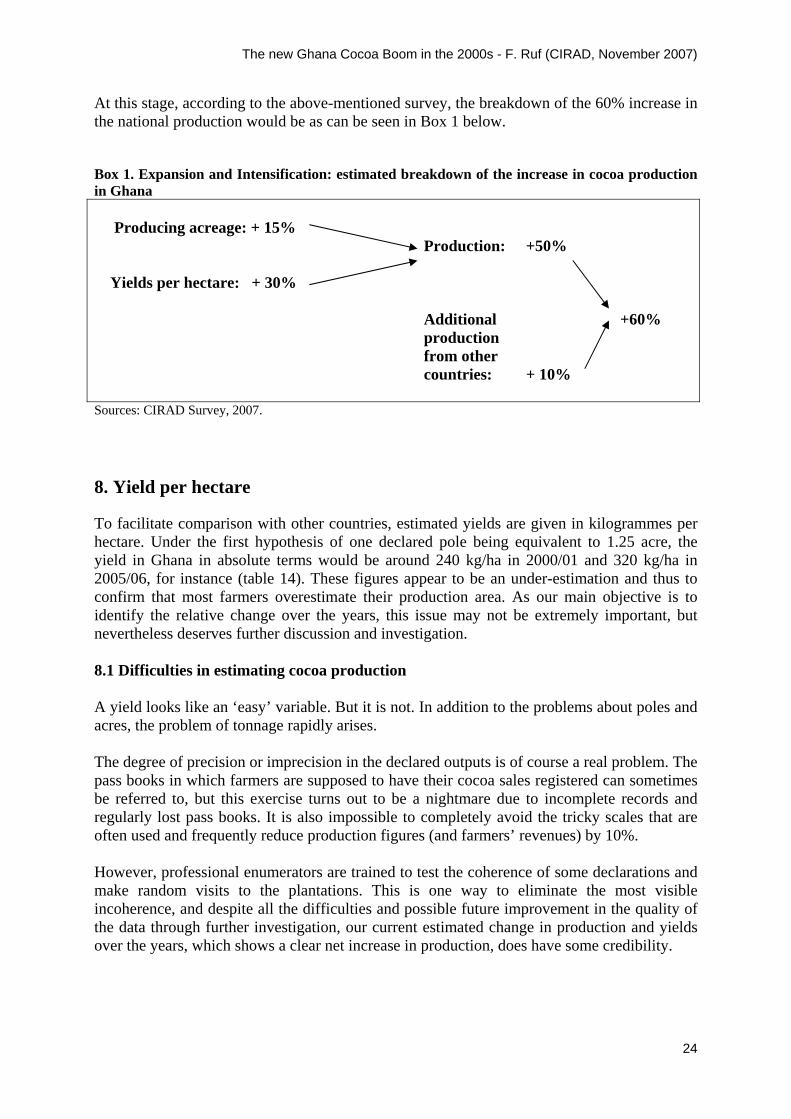
At this stage, according to the above-mentioned survey, the breakdown of the 60% increase in the national production would be as can be seen in Box 1 below. Box 1. Expansion and Intensification: estimated breakdown of the increase in cocoa production in Ghana Producing acreage: + 15% Production: +50% Yields per hectare: + 30% Additional +60%
production from other countries: + 10%
Sources: CIRAD Survey, 2007. 8. Yield per hectare To facilitate comparison with other countries, estimated yields are given in kilogrammes per hectare. Under the first hypothesis of one declared pole being equivalent to 1.25 acre, the yield in Ghana in absolute terms would be around 240 kg/ha in 2000/01 and 320 kg/ha in 2005/06, for instance (table 14). These figures appear to be an under-estimation and thus to confirm that most farmers overestimate their production area. As our main objective is to identify the relative change over the years, this issue may not be extremely important, but nevertheless deserves further discussion and investigation. 8.1 Difficulties in estimating cocoa production A yield looks like an ‘easy’ variable. But it is not. In addition to the problems about poles and acres, the problem of tonnage rapidly arises. The degree of precision or imprecision in the declared outputs is of course a real problem. The pass books in which farmers are supposed to have their cocoa sales registered can sometimes be referred to, but this exercise turns out to be a nightmare due to incomplete records and regularly lost pass books. It is also impossible to completely avoid the tricky scales that are often used and frequently reduce production figures (and farmers’ revenues) by 10%. However, professional enumerators are trained to test the coherence of some declarations and make random visits to the plantations. This is one way to eliminate the most visible incoherence, and despite all the difficulties and possible future improvement in the quality of the data through further investigation, our current estimated change in production and yields over the years, which shows a clear net increase in production, does have some credibility.
The new Ghana Cocoa Boom in the 2000s - F. Ruf (CIRAD, November 2007)
25
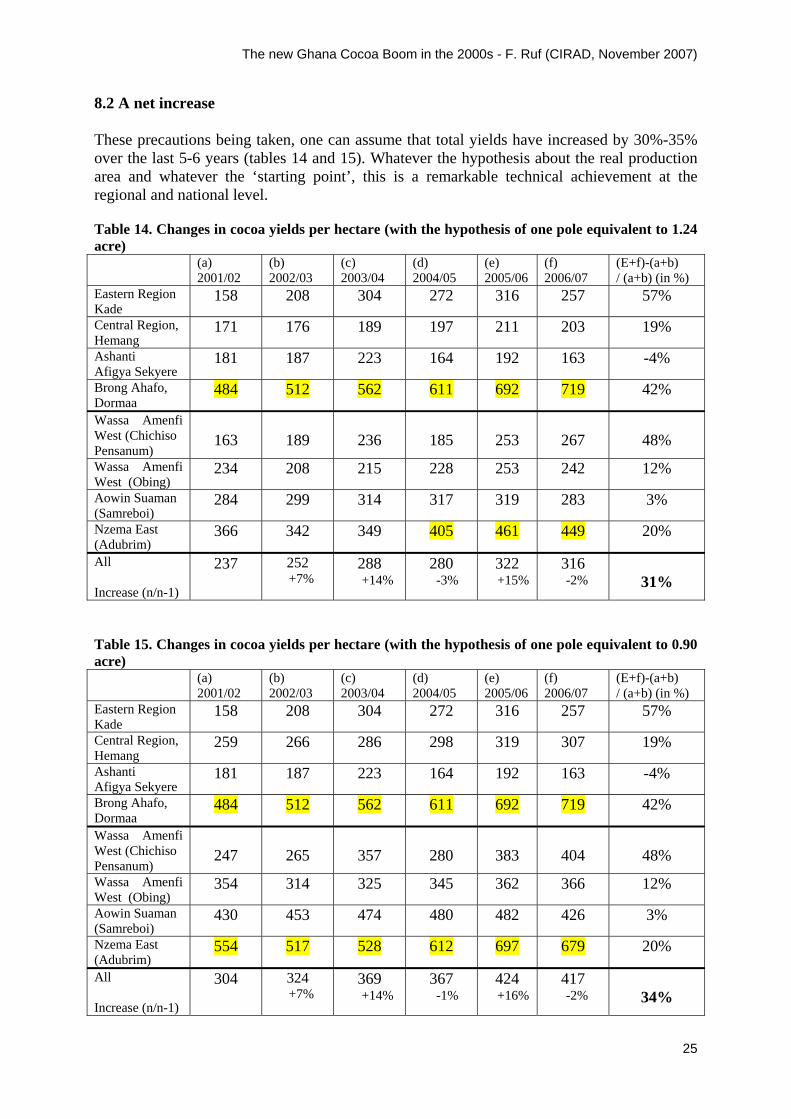
8.2 A net increase These precautions being taken, one can assume that total yields have increased by 30%-35% over the last 5-6 years (tables 14 and 15). Whatever the hypothesis about the real production area and whatever the ‘starting point’, this is a remarkable technical achievement at the regional and national level. Table 14. Changes in cocoa yields per hectare (with the hypothesis of one pole equivalent to 1.24 acre) (a)
2001/02 (b) 2002/03
(c) 2003/04
(d) 2004/05
(e) 2005/06
(f) 2006/07
(E+f)-(a+b) / (a+b) (in %)
Eastern Region Kade
158 208 304 272 316 257 57%
Central Region, Hemang
171 176 189 197 211 203 19%
Ashanti Afigya Sekyere
181 187 223 164 192 163 -4%
Brong Ahafo, Dormaa
484 512 562 611 692 719 42%
Wassa Amenfi West (Chichiso Pensanum)
163
189
236
185
253
267
48%
Wassa Amenfi West (Obing)
234 208 215 228 253 242 12%
Aowin Suaman (Samreboi)
284 299 314 317 319 283 3%
Nzema East (Adubrim)
366 342 349 405 461 449 20%
All Increase (n/n-1)
237 252 +7%
288 +14%
280 -3%
322 +15%
316 -2%
31%
Table 15. Changes in cocoa yields per hectare (with the hypothesis of one pole equivalent to 0.90 acre) (a)
2001/02 (b) 2002/03
(c) 2003/04
(d) 2004/05
(e) 2005/06
(f) 2006/07
(E+f)-(a+b) / (a+b) (in %)
Eastern Region Kade
158 208 304 272 316 257 57%
Central Region, Hemang
259 266 286 298 319 307 19%
Ashanti Afigya Sekyere
181 187 223 164 192 163 -4%
Brong Ahafo, Dormaa
484 512 562 611 692 719 42%
Wassa Amenfi West (Chichiso Pensanum)
247
265
357
280
383
404
48%
Wassa Amenfi West (Obing)
354 314 325 345 362 366 12%
Aowin Suaman (Samreboi)
430 453 474 480 482 426 3%
Nzema East (Adubrim)
554 517 528 612 697 679 20%
All Increase (n/n-1)
304 324 +7%
369 +14%
367 -1%
424 +16%
417 -2%
34%
The new Ghana Cocoa Boom in the 2000s - F. Ruf (CIRAD, November 2007)
26
Two sites, Dormaa in the Brong Ahafo and Adubrim in the Western region are well above the average. This will require specific attention in the analysis of intensification factors. Annual rainfall variations interact, with obvious ‘good’ climatic years in 2003/04 and 2005/06 (and 2007/08, seen in August 2007 as a likely candidate for a very productive cocoa year). However, less favourable climatic conditions in 2004/05 and 2006/07 do not seem to impact that much on average yields: five main reasons seem behind that steady yield increase:
- At least in some regions such as Adubrim in the N’Zema district, most cocoa farms are less than 12 years old and thus naturally gain in production every year; however, it also works the other way when many very young farms, below 7-8 years, enter a regional average. It is the case in Adubrim where the potential level of yields per hectare is still much higher than the average 400 kg/ha. Another example is in the Ashanti region, the only survey site where the average yield is declining: the decline is not only due to ageing farms and tree mortality but also to the very new young farms which will gain in production in the years to come.
- The shift of production towards the forests and abundant rainfall of the Western region
remains a fundamental factor - Additional labour: increasing attention and care are paid to the cocoa farms: weeding
and basic maintenance operations such as pruning and elimination of the famous epiphyte, called Loranthus.
- For any observer travelling in the country side, the removal of giant trees and the
general trend towards zero shade systems is obviously another factor.
- Last but certainly not least, and probably the first factor, as seen above, the new and recent adoption of fertilizers, together with the increasing use of insecticides and fungicides, represent a major change in the country.
9. Insecticides: Mass spraying and individual spraying Once it is established that yield increase plays a major role in the recent surge of the national production, one can study the rate of adoption and consumption of various inputs through averages established per household. 9.1 Mass spraying Mass spraying was an electoral promise made by presidential candidate Kufuor and, after election, well respected by President Kufuor. The pesticides and labour are free, the latter usually brought by a basic permanent staff and young people temporarily hired in the villages. Blowers are provided by the programme. CODAPEC (Cocoa Disease and Pest Control Programme) started belatedly and quite partially in 2001/02 and was generalised in 2003/04. In some regions such as Dormaa in the Brong Ahafo region, it was rapidly acknowledged that the main constraint was not the mirids but
The new Ghana Cocoa Boom in the 2000s - F. Ruf (CIRAD, November 2007)
27
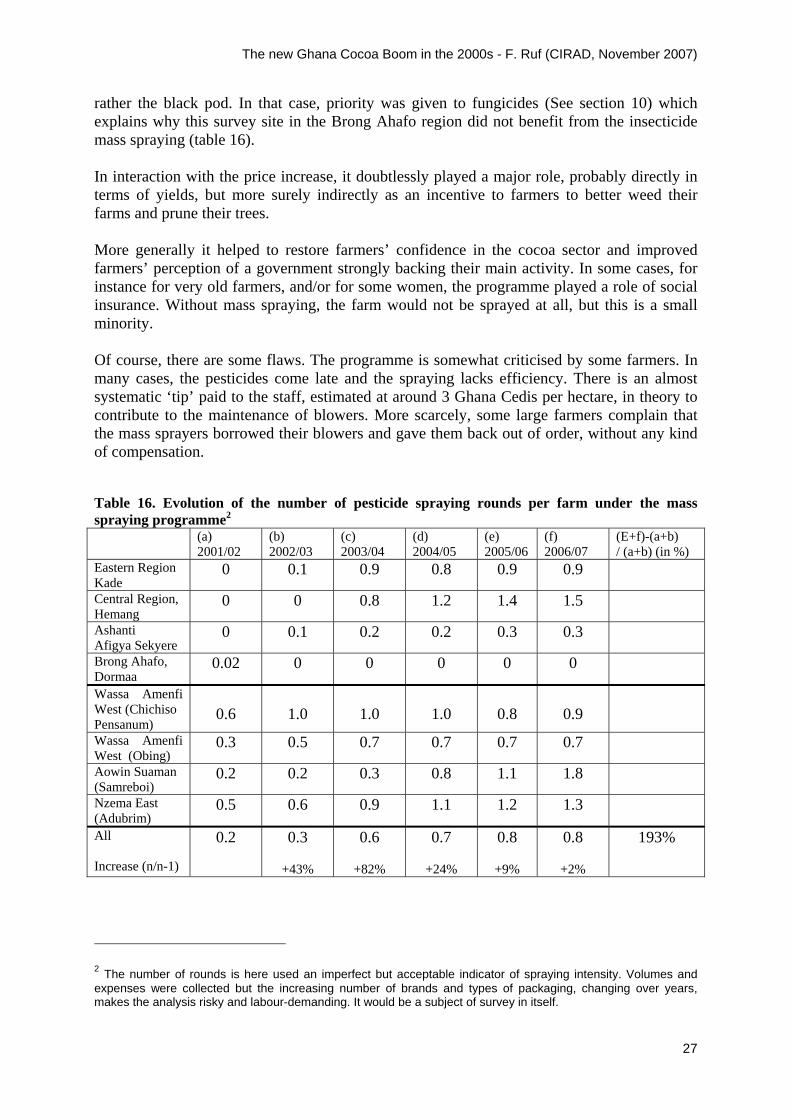
rather the black pod. In that case, priority was given to fungicides (See section 10) which explains why this survey site in the Brong Ahafo region did not benefit from the insecticide mass spraying (table 16). In interaction with the price increase, it doubtlessly played a major role, probably directly in terms of yields, but more surely indirectly as an incentive to farmers to better weed their farms and prune their trees. More generally it helped to restore farmers’ confidence in the cocoa sector and improved farmers’ perception of a government strongly backing their main activity. In some cases, for instance for very old farmers, and/or for some women, the programme played a role of social insurance. Without mass spraying, the farm would not be sprayed at all, but this is a small minority. Of course, there are some flaws. The programme is somewhat criticised by some farmers. In many cases, the pesticides come late and the spraying lacks efficiency. There is an almost systematic ‘tip’ paid to the staff, estimated at around 3 Ghana Cedis per hectare, in theory to contribute to the maintenance of blowers. More scarcely, some large farmers complain that the mass sprayers borrowed their blowers and gave them back out of order, without any kind of compensation. Table 16. Evolution of the number of pesticide spraying rounds per farm under the mass spraying programme2 (a)
2001/02 (b) 2002/03
(c) 2003/04
(d) 2004/05
(e) 2005/06
(f) 2006/07
(E+f)-(a+b) / (a+b) (in %)
Eastern Region Kade
0 0.1 0.9 0.8 0.9 0.9
Central Region, Hemang
0 0 0.8 1.2 1.4 1.5
Ashanti Afigya Sekyere
0 0.1 0.2 0.2 0.3 0.3
Brong Ahafo, Dormaa
0.02 0 0 0 0 0
Wassa Amenfi West (Chichiso Pensanum)
0.6
1.0
1.0
1.0
0.8
0.9
Wassa Amenfi West (Obing)
0.3 0.5 0.7 0.7 0.7 0.7
Aowin Suaman (Samreboi)
0.2 0.2 0.3 0.8 1.1 1.8
Nzema East (Adubrim)
0.5 0.6 0.9 1.1 1.2 1.3
All Increase (n/n-1)
0.2 0.3
+43%
0.6
+82%
0.7
+24%
0.8
+9%
0.8
+2%
193%
2 The number of rounds is here used an imperfect but acceptable indicator of spraying intensity. Volumes and expenses were collected but the increasing number of brands and types of packaging, changing over years, makes the analysis risky and labour-demanding. It would be a subject of survey in itself.
The new Ghana Cocoa Boom in the 2000s - F. Ruf (CIRAD, November 2007)
28
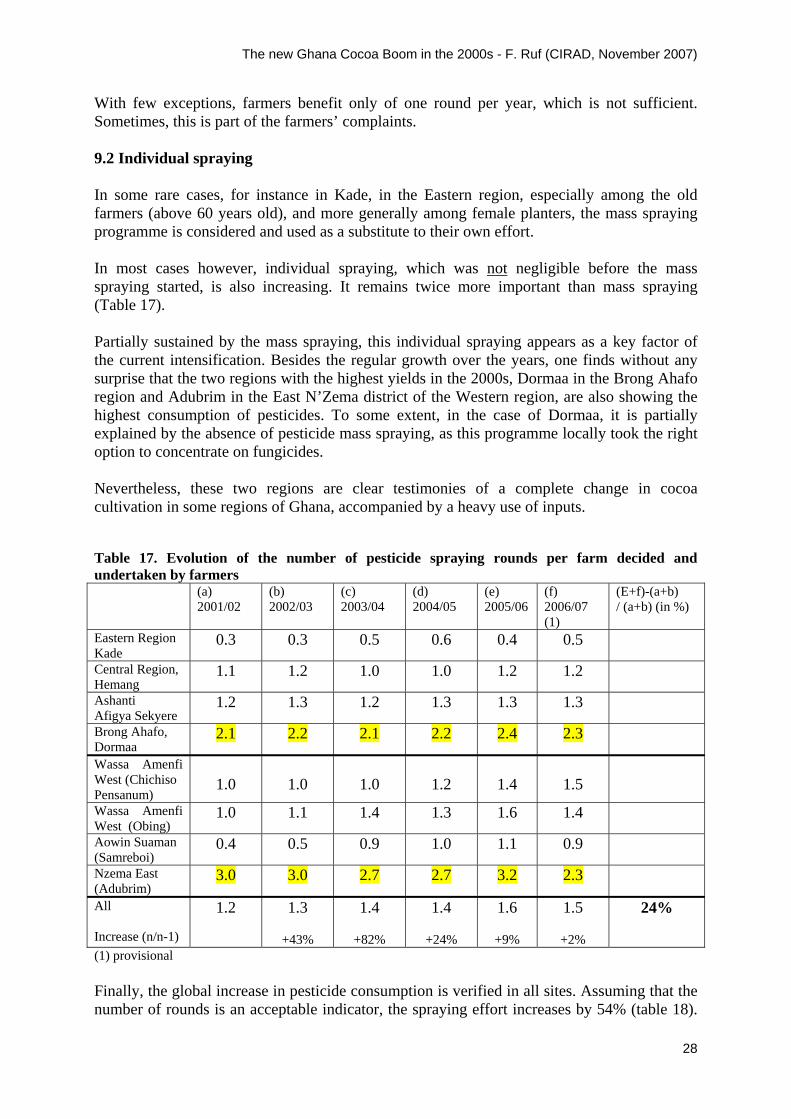
With few exceptions, farmers benefit only of one round per year, which is not sufficient. Sometimes, this is part of the farmers’ complaints. 9.2 Individual spraying In some rare cases, for instance in Kade, in the Eastern region, especially among the old farmers (above 60 years old), and more generally among female planters, the mass spraying programme is considered and used as a substitute to their own effort. In most cases however, individual spraying, which was not negligible before the mass spraying started, is also increasing. It remains twice more important than mass spraying (Table 17). Partially sustained by the mass spraying, this individual spraying appears as a key factor of the current intensification. Besides the regular growth over the years, one finds without any surprise that the two regions with the highest yields in the 2000s, Dormaa in the Brong Ahafo region and Adubrim in the East N’Zema district of the Western region, are also showing the highest consumption of pesticides. To some extent, in the case of Dormaa, it is partially explained by the absence of pesticide mass spraying, as this programme locally took the right option to concentrate on fungicides. Nevertheless, these two regions are clear testimonies of a complete change in cocoa cultivation in some regions of Ghana, accompanied by a heavy use of inputs. Table 17. Evolution of the number of pesticide spraying rounds per farm decided and undertaken by farmers (a)
2001/02 (b) 2002/03
(c) 2003/04
(d) 2004/05
(e) 2005/06
(f) 2006/07 (1)
(E+f)-(a+b) / (a+b) (in %)
Eastern Region Kade
0.3 0.3 0.5 0.6 0.4 0.5
Central Region, Hemang
1.1 1.2 1.0 1.0 1.2 1.2
Ashanti Afigya Sekyere
1.2 1.3 1.2 1.3 1.3 1.3
Brong Ahafo, Dormaa
2.1 2.2 2.1 2.2 2.4 2.3
Wassa Amenfi West (Chichiso Pensanum)
1.0
1.0
1.0
1.2
1.4
1.5
Wassa Amenfi West (Obing)
1.0 1.1 1.4 1.3 1.6 1.4
Aowin Suaman (Samreboi)
0.4 0.5 0.9 1.0 1.1 0.9
Nzema East (Adubrim)
3.0 3.0 2.7 2.7 3.2 2.3
All Increase (n/n-1)
1.2 1.3
+43%
1.4
+82%
1.4
+24%
1.6
+9%
1.5
+2%
24%
(1) provisional Finally, the global increase in pesticide consumption is verified in all sites. Assuming that the number of rounds is an acceptable indicator, the spraying effort increases by 54% (table 18).
The new Ghana Cocoa Boom in the 2000s - F. Ruf (CIRAD, November 2007)
29
(As for many other variables, the data of 2006/07 are necessarily provisional, probably to be slightly increased, as one last round may have been decided after our last day of presence in the villages). Table 18. Evolution of the number of pesticide spraying rounds per farm : total of mass spraying programme and individual programme (a)
2001/02 (b) 2002/03
(c) 2003/04
(d) 2004/05
(e) 2005/06
(f) 2006/07 (1)
(E+f)-(a+b) / (a+b) (in %)
All farms Increase (n/n-1)
1.5
1.6
10%
2.0
21%
2.2
11%
2.4
13%
2.3
-5%
54%
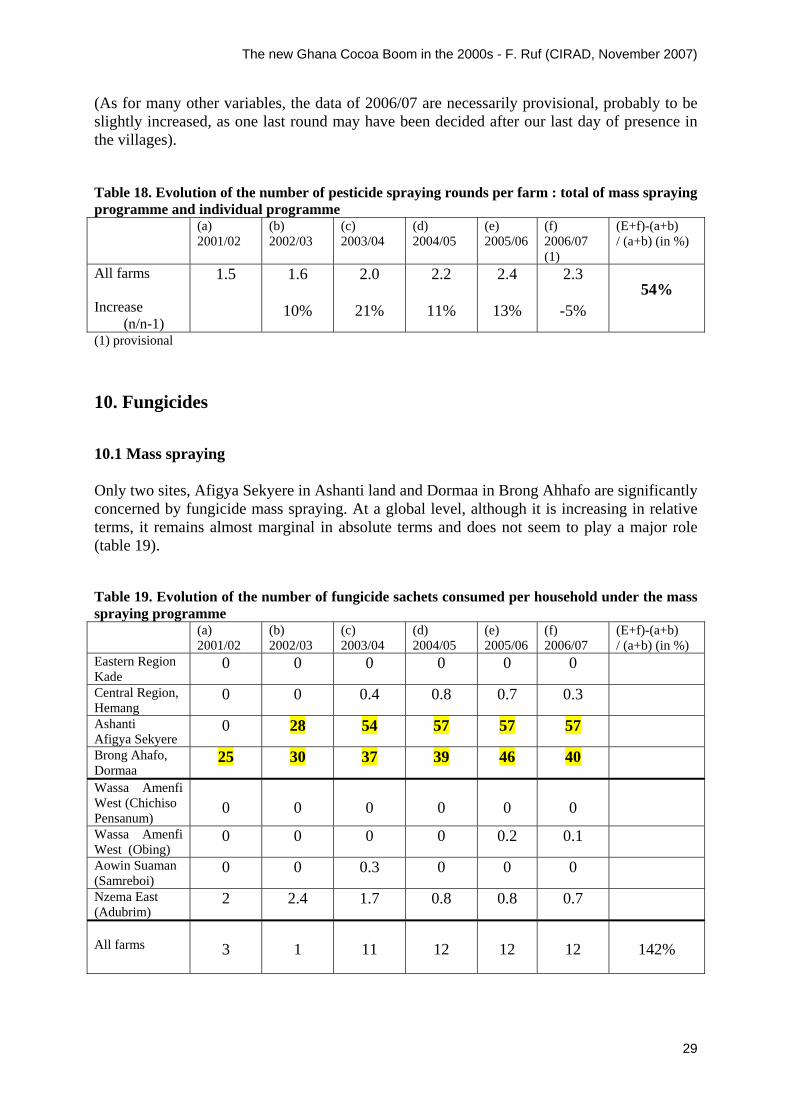
(1) provisional 10. Fungicides 10.1 Mass spraying Only two sites, Afigya Sekyere in Ashanti land and Dormaa in Brong Ahhafo are significantly concerned by fungicide mass spraying. At a global level, although it is increasing in relative terms, it remains almost marginal in absolute terms and does not seem to play a major role (table 19). Table 19. Evolution of the number of fungicide sachets consumed per household under the mass spraying programme (a)
2001/02 (b) 2002/03
(c) 2003/04
(d) 2004/05
(e) 2005/06
(f) 2006/07
(E+f)-(a+b) / (a+b) (in %)
Eastern Region Kade
0 0 0 0 0 0
Central Region, Hemang
0 0 0.4 0.8 0.7 0.3
Ashanti Afigya Sekyere
0 28 54 57 57 57
Brong Ahafo, Dormaa
25 30 37 39 46 40
Wassa Amenfi West (Chichiso Pensanum)
0
0
0
0
0
0
Wassa Amenfi West (Obing)
0 0 0 0 0.2 0.1
Aowin Suaman (Samreboi)
0 0 0.3 0 0 0
Nzema East (Adubrim)
2 2.4 1.7 0.8 0.8 0.7
All farms
3
1
11
12
12
12
142%

The new Ghana Cocoa Boom in the 2000s - F. Ruf (CIRAD, November 2007)
30
10.2 Individual fungicide spraying On”average”, the intensity of individual fungicide spraying starts from an higher threshold to finish at a level similar to that of mass spraying but it is quite heterogeneous (table 20). It remains nil in Kade, which is coherent with the quasi absence of black pod. Less “logically”, it is also nil in the Ashanti region site, which shows that old Ashanti farmers let the mass spraying programme protect their farms against black pod. They have neither the energy nor the capital to do it by themselves. The golden age is far away. There is a beginning of personal effort in Wassa Amenfi, Samreboi and even in the drier Central region. Cocoa farms are still shaded in that region, hence conserving some humidity, which can be a triumph when droughts occur but a flaw when rainfall is frequent. It may explain why a few farmers try to use fungicides in that region. More importantly, it is again in the two leading sites of Dormaa and Adubrim where one can find an intensive use of fungicides. Table 20. Evolution of the number of fungicide sachets consumed per household under an individual investment decision (a)
2001/02 (b) 2002/03
(c) 2003/04
(d) 2004/05
(e) 2005/06
(f) 2006/07
(E+f)-(a+b) / (a+b) (in %)
Eastern Region Kade
0 0 0.1 0 0 0
Central Region, Hemang
2. 2 2.2 6.4 6.4 4
Ashanti Afigya Sekyere
0 0 0 1 0 0
Brong Ahafo, Dormaa
23 34 34 33 37 38
Wassa Amenfi West (Chichiso Pensanum)
0.6
1.0
4.8
5.6
10.6
13.2
Wassa Amenfi West (Obing)
0.4 0.2 1.1 2.3 2.3 2.7
Aowin Suaman (Samreboi)
0 0 3.4 8.4 9.8 11.5
Nzema East (Adubrim)
73 71 64 48 44 38
All
10
11
13
13
14
13
27%
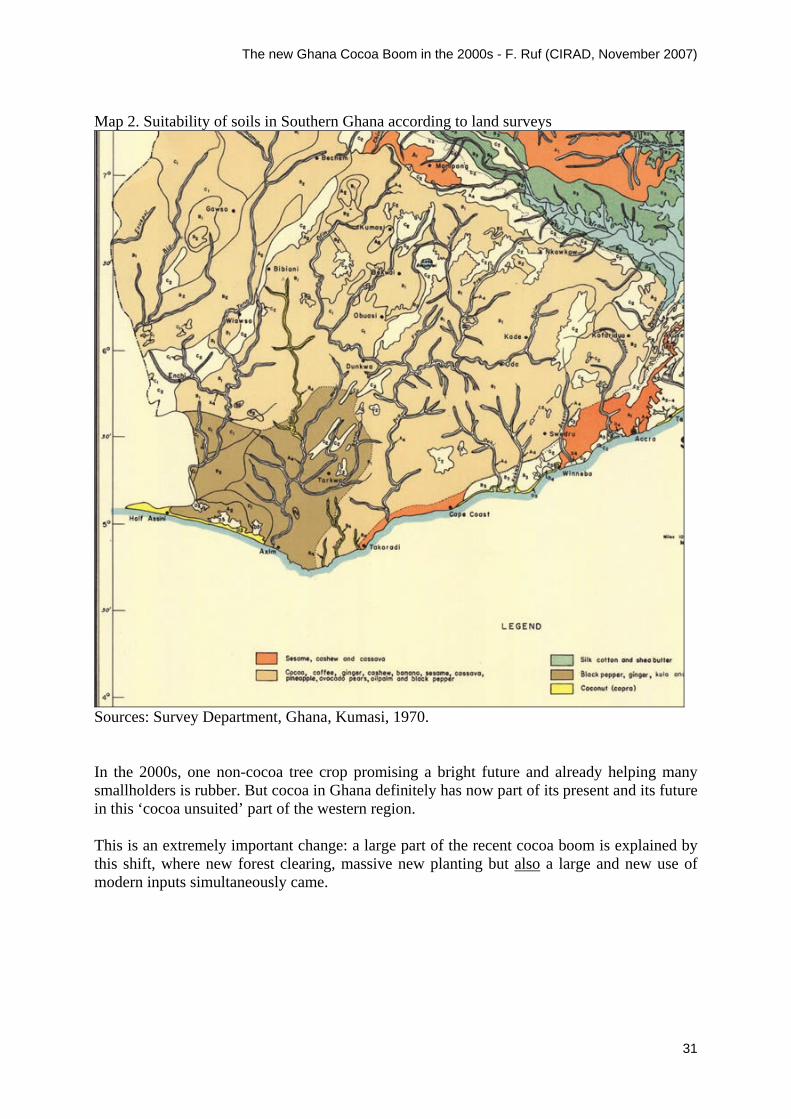
The true champions of fungicide adoption are the migrants coming to Adubrim. The apparent decline in the number of sachets in the late 2000s is only due to the emergence of new farms, with a smaller size and with younger trees, hence a lower purchase of fungicides. Nevertheless, this site perfectly reflects a totally new way to produce cocoa in Ghana, especially in these areas where soil institutes and agricultural experts used to consider this southern part of the Western region as unsuitable to cocoa, and likely to be devoted to other crops such as coconuts and black pepper (Map 2).
The new Ghana Cocoa Boom in the 2000s - F. Ruf (CIRAD, November 2007)
31
Map 2. Suitability of soils in Southern Ghana according to land surveys
Sources: Survey Department, Ghana, Kumasi, 1970. In the 2000s, one non-cocoa tree crop promising a bright future and already helping many smallholders is rubber. But cocoa in Ghana definitely has now part of its present and its future in this ‘cocoa unsuited’ part of the western region. This is an extremely important change: a large part of the recent cocoa boom is explained by this shift, where new forest clearing, massive new planting but also a large and new use of modern inputs simultaneously came.

The new Ghana Cocoa Boom in the 2000s - F. Ruf (CIRAD, November 2007)
32
11. The cocoa production shift to ‘cocoa unsuited’ regions Four of the eight sites of this survey belong to that cocoa unsuited region. One of them, Adubrim, especially close to the coast, is the most dynamic. This may be a limit of the sampling in itself but at the same time it clearly illustrates the massive shift of cocoa production to ‘unsuited cocoa’ soils and regions. What happened? Several rough periods occurred in the 1970s and 1980s. Cocoa was introduced by migrants, but had difficulty taking off. A number of failures led to abandonment or stagnation of the crop. Then cocoa surged again for different reasons. Technical breakthrough: from "Tetteh Quarshie" and "Amazonians" to new hybrids The first reason is technical and varietal. The varieties that were available in the region "Tetteh Quarshie" (Amelonado) and "Amazonia" were not suited to the regional ecology. The plants failed to grow satisfactorily or worse, rapidly died. The native inhabitants observed what was happening and took no further interest in cocoa. In the 1970s, the majority of native inhabitants became and remained coconut planters. But at the end of the 1990s, newly arrived migrants and extension services introduced hybrids that were more vigorous and grew very well under this climate. Ecological change The discovery of cocoa in the area coincided with the first serious attacks of the lethal yellowing disease on coconuts in the coastal villages, and the native inhabitants started paying more attention to cocoa. Those who could obtain access to land a short way away from the sandy soil of the coastal strip started to plant cocoa. At the same time there was an influx of migrants who had heard about the latest success with cocoa. Further ecological change: deforestation and a reduction in rainfall The Axim region has abundant rainfall reaching nearly 2000 mm per year. This type of climate makes drying the cocoa very difficult. A number of planters mentioned that they consider that deforestation plays a positive role in that it reduces rainfall and makes post-harvest operations easier. Most of all, this type of climate often results in cocoa beans of mediocre quality. Badly dried and black, and a high percentage becomes moldy. Planters need to be sure of finding a buyer for these cocoa beans. In the 1970s, during the period when the cocoa marketing board had a purchasing monopoly, this quality of bean was refused. Economic and political change: liberalization of the sector The liberalization of the purchase of cocoa from planters resulted in new opportunities. Several planters spoke openly about better sales conditions for cocoa after the 1990s when several buyers established themselves in the region leading to competition favorable for planters with payment in cash.
The new Ghana Cocoa Boom in the 2000s - F. Ruf (CIRAD, November 2007)
33
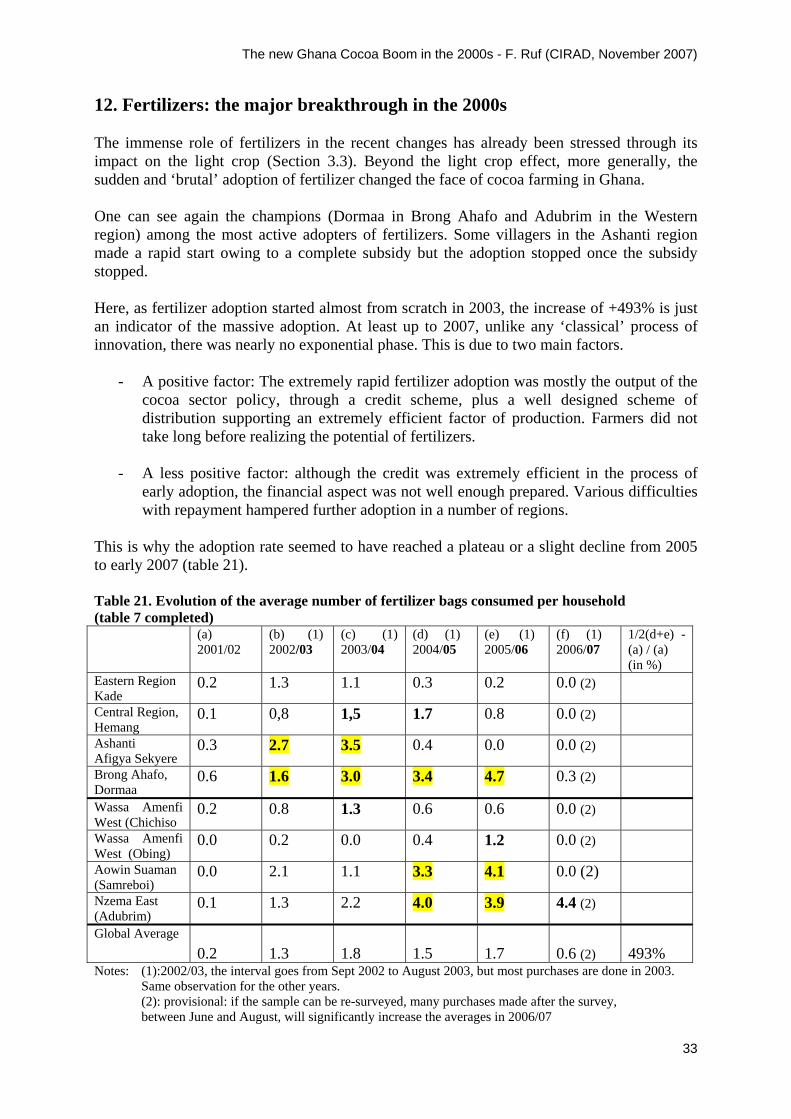
12. Fertilizers: the major breakthrough in the 2000s The immense role of fertilizers in the recent changes has already been stressed through its impact on the light crop (Section 3.3). Beyond the light crop effect, more generally, the sudden and ‘brutal’ adoption of fertilizer changed the face of cocoa farming in Ghana. One can see again the champions (Dormaa in Brong Ahafo and Adubrim in the Western region) among the most active adopters of fertilizers. Some villagers in the Ashanti region made a rapid start owing to a complete subsidy but the adoption stopped once the subsidy stopped. Here, as fertilizer adoption started almost from scratch in 2003, the increase of +493% is just an indicator of the massive adoption. At least up to 2007, unlike any ‘classical’ process of innovation, there was nearly no exponential phase. This is due to two main factors.
- A positive factor: The extremely rapid fertilizer adoption was mostly the output of the cocoa sector policy, through a credit scheme, plus a well designed scheme of distribution supporting an extremely efficient factor of production. Farmers did not take long before realizing the potential of fertilizers.
- A less positive factor: although the credit was extremely efficient in the process of
early adoption, the financial aspect was not well enough prepared. Various difficulties with repayment hampered further adoption in a number of regions.
This is why the adoption rate seemed to have reached a plateau or a slight decline from 2005 to early 2007 (table 21). Table 21. Evolution of the average number of fertilizer bags consumed per household (table 7 completed) (a)
2001/02 (b) (1) 2002/03
(c) (1) 2003/04
(d) (1) 2004/05
(e) (1) 2005/06
(f) (1) 2006/07
1/2(d+e) -(a) / (a) (in %)
Eastern Region Kade
0.2 1.3 1.1 0.3 0.2 0.0 (2)
Central Region, Hemang
0.1 0,8 1,5 1.7 0.8 0.0 (2)
Ashanti Afigya Sekyere
0.3 2.7 3.5 0.4 0.0 0.0 (2)
Brong Ahafo, Dormaa
0.6 1.6 3.0 3.4 4.7 0.3 (2)
Wassa Amenfi West (Chichiso
0.2 0.8 1.3 0.6 0.6 0.0 (2)
Wassa Amenfi West (Obing)
0.0 0.2 0.0 0.4 1.2 0.0 (2)
Aowin Suaman (Samreboi)
0.0 2.1 1.1 3.3 4.1 0.0 (2)
Nzema East (Adubrim)
0.1 1.3 2.2 4.0 3.9 4.4 (2)
Global Average
0.2
1.3
1.8
1.5
1.7
0.6 (2)
493%
Notes: (1):2002/03, the interval goes from Sept 2002 to August 2003, but most purchases are done in 2003. Same observation for the other years. (2): provisional: if the sample can be re-surveyed, many purchases made after the survey, between June and August, will significantly increase the averages in 2006/07
The new Ghana Cocoa Boom in the 2000s - F. Ruf (CIRAD, November 2007)
34
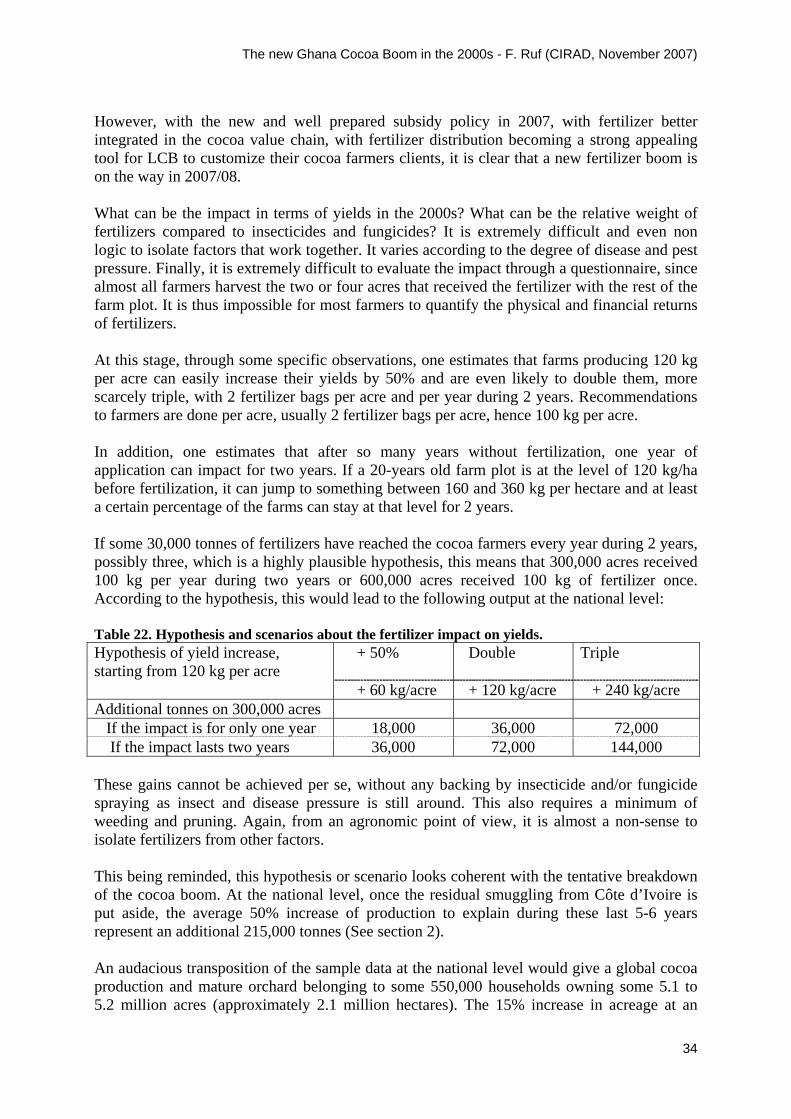
However, with the new and well prepared subsidy policy in 2007, with fertilizer better integrated in the cocoa value chain, with fertilizer distribution becoming a strong appealing tool for LCB to customize their cocoa farmers clients, it is clear that a new fertilizer boom is on the way in 2007/08. What can be the impact in terms of yields in the 2000s? What can be the relative weight of fertilizers compared to insecticides and fungicides? It is extremely difficult and even non logic to isolate factors that work together. It varies according to the degree of disease and pest pressure. Finally, it is extremely difficult to evaluate the impact through a questionnaire, since almost all farmers harvest the two or four acres that received the fertilizer with the rest of the farm plot. It is thus impossible for most farmers to quantify the physical and financial returns of fertilizers. At this stage, through some specific observations, one estimates that farms producing 120 kg per acre can easily increase their yields by 50% and are even likely to double them, more scarcely triple, with 2 fertilizer bags per acre and per year during 2 years. Recommendations to farmers are done per acre, usually 2 fertilizer bags per acre, hence 100 kg per acre. In addition, one estimates that after so many years without fertilization, one year of application can impact for two years. If a 20-years old farm plot is at the level of 120 kg/ha before fertilization, it can jump to something between 160 and 360 kg per hectare and at least a certain percentage of the farms can stay at that level for 2 years. If some 30,000 tonnes of fertilizers have reached the cocoa farmers every year during 2 years, possibly three, which is a highly plausible hypothesis, this means that 300,000 acres received 100 kg per year during two years or 600,000 acres received 100 kg of fertilizer once. According to the hypothesis, this would lead to the following output at the national level: Table 22. Hypothesis and scenarios about the fertilizer impact on yields.
+ 50%
Double Triple Hypothesis of yield increase, starting from 120 kg per acre
+ 60 kg/acre + 120 kg/acre + 240 kg/acre Additional tonnes on 300,000 acres If the impact is for only one year 18,000 36,000 72,000 If the impact lasts two years 36,000 72,000 144,000 These gains cannot be achieved per se, without any backing by insecticide and/or fungicide spraying as insect and disease pressure is still around. This also requires a minimum of weeding and pruning. Again, from an agronomic point of view, it is almost a non-sense to isolate fertilizers from other factors. This being reminded, this hypothesis or scenario looks coherent with the tentative breakdown of the cocoa boom. At the national level, once the residual smuggling from Côte d’Ivoire is put aside, the average 50% increase of production to explain during these last 5-6 years represent an additional 215,000 tonnes (See section 2). An audacious transposition of the sample data at the national level would give a global cocoa production and mature orchard belonging to some 550,000 households owning some 5.1 to 5.2 million acres (approximately 2.1 million hectares). The 15% increase in acreage at an
The new Ghana Cocoa Boom in the 2000s - F. Ruf (CIRAD, November 2007)
35
average of 280 kg/ha would bring an additional 90,000 tonnes and the intensification process would put 125,000 tonnes on the table. The intermediate hypothesis of fertilizers enabling to double yields of most farms, with some partial interaction of insecticides and fungicides, producing an additional bulk of cocoa between 38,000 and 72,000 tonnes seems in line with these estimates. 13. Interaction of non-labour and labour inputs and limits of the survey Fertilizers, insecticides and fungicides, and new hybrids have started to play a decisive role in the current cocoa boom. However, the structural shift to the forests of the south-west, and possibly changes in the rainfall pattern, which, by contributing to enhance the light crop, play a more positive role than often believed, complete the picture. The process of removing shade should also not be forgotten. While many agricultural experts and ecologists continue to talk about the expected ecological services of biodiversity and trees to cocoa farmers, these same cocoa farmers are embarking on a massive programme of tree removal and zero shade cultivation. Nevertheless, this type of structural change is difficult to evaluate in terms of yields for a short period like 5-6 years. Beyond the spectacular increase in non-labour inputs, and despite the adoption of a new labour-saving technology such as herbicide application, (that deserves a whole report to itself), a cocoa boom cannot occur without an increase in effective manual labour and more generally, without additional labour. Besides herbicide spraying, manual weed control, pruning, loranthus eradication, and the removal of giant trees require additional labour. In their surveys, Teal and Vignery found quite an interesting result concerning labour: an apparent gain in labour productivity in the late 1990s and early 2000s (2003/04 compared to 2001/02). This gain in productivity is not yet fully explained, but individuals engaged in cocoa farming appear to have increased their number of working days (Teal and Vigneri 2004, Teal et al, 2006). This is probably true. It is likely that, encouraged by higher cocoa prices, farmers and their families were encouraged to work more in recent years, for instance on eradicating loranthus. However, it is likely that young people, either young indigenous people or young migrants who obtain land and become new cocoa farmers (see section 6) bring their own additional labour force to the cocoa sector. Another reasonable hypothesis is that, besides a possible gain in labour productivity, additional workers are attracted to cocoa farm by higher cocoa prices (section 7). Finally herbicides probably started playing a decisive role in improving labour productivity in the mid 2000s. However, all these assumptions are hypothetical and require further investigation.
The new Ghana Cocoa Boom in the 2000s - F. Ruf (CIRAD, November 2007)
36
Conclusion It can be reasonably concluded that the expansion itself is real, but probably accounts for no more than 40% of the increase in cocoa production. Concerning expansion and intensification, it should also be mentioned that expansion towards the Western region with its abundant rainfall - where zero shade systems look ‘sustainable for some time’ - plays a role in the increase in yield. Again, new farmers with new farms play a decisive role. They also produce higher yields. With the possible help of climate change, the beginning of technical change (including the significant removal of shade) and intensification already account for most of the increase in production. This is so clear that it can be considered the beginning of a green revolution. And in fact, all the necessary ingredients are united for a green revolution: new planting material, new types of hybrids that have been clearly identified by farmers as a major breakthrough: more vigour, more precocity, increasing the chances of replanting successfully. Modern inputs such as fertilizer and pesticides are now available to farmers, which, again, is a tremendous change with respect to previous decades. Public policies clearly played a major role with the liberalization of the domestic sector, associated with significant increases in the price paid to producers and with new highly-appreciated services such as mass spraying, credit and subsidies on fertilizers. Research has played its role satisfactorily, at least in terms of genetics and planting material, which is an enormous achievement in itself. Input distributors have also obviously played a role in this success story. Regarding labour in its broadest sense, young farmers are arriving in masses responding to public policies but also contributing their own initiative and expertise. The objective of this survey was not to deepen the approach to the social dimension of this new cocoa boom, but this change in production is being accompanied by deep social and demographic changes that deserve to be investigated in depth. Finally, this new cocoa boom is well on track. All the ingredients appear to be united -from new young farmers planting and replanting, to new planting material and with a coming boom in fertilization- for Ghana to rapidly pass the threshold of one million tonnes. Is it the best future for the country? This of course depends to a great extent on the behaviour of competing cocoa producing countries. If Côte d’Ivoire and Indonesia also increase their production, the world price will tumble again. If not, Ghana planters and state will benefit and share a deserved windfall. Brief Recommendations In terms of research, there is a need for further investigation into the role of labour and labour-saving technologies such as herbicides. The role of labour, either through the additional effort of individuals already engaged in cocoa farming, or through labour saving technologies, or through additional workers brought to the cocoa sector is still a complicated issue that needs to be clarified by further investigation. The quality of data on production and acreage could also be improved with reasonable additional funding.
The new Ghana Cocoa Boom in the 2000s - F. Ruf (CIRAD, November 2007)
37
In terms of public policy, one can foresee three or four tracks of varying significance and varying cost. In order of increasing cost, our suggestions, which are mostly technical, would be: a. Official encouragement to farmers to keep their pass books in better order The principle of recording weights and income from sales is excellent but in most cases badly applied. Each buying agent provides his own pass book, which ends up with farmers being completely unable to monitor their production which is sold to three or four different buyers. As mentioned in section 1, about methodology, this is far from being only due to mismanagement by traders unwilling to pay a bonus to farmers. Some cocoa planters who are under various kind of sharing contracts voluntarily loose some ‘weights’. This may also happen between fathers and sons, brothers and sisters, etc. However, there is also a kind of involuntary mismanagement. In order to reduce that component, each farmer should be encouraged to have only one pass book and to keep all the records himself. This would also help them understand the impact of their own decisions with respect to cocoa production. b. A tool to eradicate loranthus Farmers only have their machetes and ladders to climb the cocoa trees and remove epiphytes such as Loranthus, alternatively they make their children climb the trees. Some more appropriate tools do exist but they are difficult to find in Ghana. It should not be too costly nor too complicated for the cocobod to start importing some tools and then to launch a bid for an internal supply in Ghana. c. Cocoa drying Although post-harvest operations are not included in this report, field surveys gave us the opportunity to observe a shortage of driers, despite a relatively active domestic market in hand-made driers at the village level (at a cost of around 30 Ghana Cedis per drier). Maybe this ‘local industry’ could be helped to improve its efficiency. The supply of transparent plastic sheets to improve sun drying is also a domain where cocobod could help farmers at relatively low cost and at the same time protect the reputation of bean quality in Ghana especially in areas where abundant rainfall prevents cocoa beans from drying properly and results in them turning black,. d. Mass spraying. This service rendered to farmers will be extremely difficult to maintain in the long term. The logistic is complex and it is no surprise that numerous delays reduce its efficiency. There is frequently either a shortage of blowers or of insecticides or of labour. The most difficult constraint to be solved by farmers is the lack of blowers. If the programme is to be continued in the years to come, the cocobod should explore the possibility of investing in more blowers or helping farmers to invest in blowers and, more importantly, providing some support for a completely decentralized and private capacity to maintain and repair the blowers, at the village level.
e. Control of blackpod As blackpod is spreading, there is a need for more fungicides in regions that did not really need them in previous years. If approved by CRIG, combined spraying of insecticides and fungicides by hand-sprayers could be also tested and, if shown to be efficient, their use promoted.

The new Ghana Cocoa Boom in the 2000s - F. Ruf (CIRAD, November 2007)
38
f. Village equipment, tracks and roads Although Ghana is one of the cocoa producing countries that invest significantly in roads and infrastructure, especially in new roads, there is still a need for better maintenance of the tracks from the mains roads to the cocoa villages. Beyond its economic efficiency, this would also send a strong signal farmers who would see their cocoa farming activity is still backed by the public sector. Thanks Special thanks to Koen Duchateau for his careful reading of this paper, which does not prevent all my personal responsibilities in the analysis and possible mistakes References Anglaaere, L., McDonald, M, Sinclair, F., and J. Cobbina, 2007. Developing the potential of undomesticated, indigenous forest species, as cacao companion trees in Ghana. Contributed paper to the 2nd International Symposium “Multistrata Agroforestery Systems with Perennial Crops”, Turrialba, Costa Rica, 17-21 Sept, 10 p. Assuming-Brempong, K.S and D. Sarpong, 2006. Pilot Labour Survey in Cocoa Production in Ghana. Department of Agricultural Economics and Agribusiness, University of Ghana. Legon. 120 p. Cocoa Board, 2000. Ghana Cocoa Board handbook. 8th edition. Ghana Cocoa board, Accra. ED&F Man, 20O04. Cocoa Market report No 371. International Cocoa Organisation, (ICCO), 2006. Quarterly Bulletin of Cocoa Statistitics. Laven, A. forthcoming. The Risky Business of Cocoa in Ghana: Local Entrepreneurs in a Buyer-Driven Chain. In Business on the Rise: Conglomerates and Economic Groups in Developing Countries and Transition Economies Under Globalization, edited by B. Hogenboom and A. E. F. Jilberto. London: Routledge.
Mikell, G., 1989. Cocoa and Chaos in Ghana. Paragon House. 284 p. Norde, D-J and J.A. van Duursen, 2003. Identifying and assessing convergences of interest for stakeholders in the cocoa chain, in order to increase farm income and wider sustainable production. (http://www.sustainable-prize.Net/cocoa.html. Nyanteng, V.K., 1995. Prospects for Ghana Cocoa’s Industry in the 21st century. In: Ruf, F. and P.S. Siswoputranto eds). Cocoa Cycles. The economics of cocoa supply. Woodhead Publishing. Cambridge, 179-207. Ruf, F., 1995. Booms et crises du cacao. Les vertiges de l'or brun. Karthala, Paris, 459 p. Ruf, F., 2004. La révolution verte du cacao. La Tribune. 3 Nov 2004. p.27.
Ruf, F., 2007a. Boom du cacao au Ghana, fruit de la libéralisation ? Grains (38): 5-6.

The new Ghana Cocoa Boom in the 2000s - F. Ruf (CIRAD, November 2007)
39
Ruf, F., 2007b. Current Cocoa production and opportunities for re-investment in the rural sector. Côte d’Ivoire, Ghana and Indonesia. Contributed paper presented at the World Cocoa Foundation (WCF) meeting, Amsterdam, 23-24 May, 2007. (http://www.worldcocoafoundation.org/about/documents/FRuf_paper.pdf). WCF, Washington, 35 p. Ruf, F , Deheuvels, O, and D. Sarpong, 2006. Intensification in cocoa cropping systems: is Agroforestry a solution for sustainability ? The Case of Manso Amenfi, Western region, Ghana. Contributed paper to the 15th International Cocoa Research. San José, Costa Rica, Oct 2006, 15 p. Teal, F. and M. Vigneri, 2004. Production changes in Ghana cocoa farming households under market reforms. The Bekerley Electronic Press (http://www.bepress.com/case/paper216). Teal, F. Zeitlin, A. and H. Mamaah, 2006. Ghana Cocoa farmers survey 2004: Report to Ghana Cocoa board. Vigneri, M., 2005. Trade Liberalization and Agricultural Performance. Contrasting Macro and micro evidence. Rom Ghana. Thesis. Univesrity of Oxford. 180 p.
The new Ghana Cocoa Boom in the 2000s - F. Ruf (CIRAD, November 2007)
40
ANNEX I - TERMS OF REFERENCE
1. BACKGROUND INFORMATION
1.1. Beneficiary country
Republic of Ghana.
1.2. Contracting Authority
The National Authorising Officer of the European Development Fund, Ministry of Finance and Economic Planning, Accra, Ghana.
1.3. Relevant country background
According to the Growth and Poverty Reduction Strategy (GPRS II), the central goal of the policy is to accelerate the growth of the economy so that Ghana can achieve middle-income status within a measurable planning period. One of the GPRS pillars is to modernize agriculture and to achieve annual agricultural growth rates of 6% over the next four years, with livestock and crops leading the sector's performance. The majority of Ghana’s working population continues to depend on farming activities for their livelihood as smallholder farmers.
Ghana is the 2nd cocoa producing country in the world, behind its neighbour, Côte d’Ivoire, and cocoa remains the backbone of the national and regional economy. Any negative change in production and prices has an impact on the livelihood of hundreds of thousands of rural people and downstream on the national capacity for savings and investments. This situation demands for a reasonable understanding of changes in the cocoa sector in terms of prices, taxation, subsidies and also environment, direct promotions of cocoa replanting and/or diversification. Any increase in cocoa output may be related to some kind of deforestation, a link that needs to be evaluated.
1.4. Current state of affairs in the cocoa sector
Until the late 1970s, Ghana was the world leader in cocoa production with a yearly output above 400,000 tonnes, after which it lost this position to Côte d’Ivoire. In the 1980s, the Ghanaian cocoa output fell to 200,000 tonnes, mainly as a response to the chaotic situation the country was experiencing. In the 1990s, a recovery at around 300-400,000 tonnes was the result of a major shift of the cocoa pioneer front towards the forests of the south-western Ghana, using cultivation techniques without shade, resulting on the one hand in a higher yield, but on the other hand in a less sustainable cocoa production. In the 2000s, over the recent two to three years, Ghana has almost doubled its production, with a current output above 600,000 tonnes.
With regards to cocoa marketing, Ghana is the country which, by the gradual and progressive introduction of changes into its cocoa sector, seems to be holding out best as compared to a wave of excessively rapid cocoa sector liberalisations in other countries. Cocobod (Ghana Cocoa Board), a Government agency, is still very active and dominant, while gradually getting the private sector more involved.
There is currently a lack of understanding of the reasons behind this recent upsurge in output of cocoa beans in Ghana. Different explanations are given, but supporting data to substantiate the claims are not readily available. For example, some observers stress the importance of smuggling of cocoa beans into Ghana. In 2002/03 and 2003/04, the historic flow of Ghana cocoa beans towards Côte d’Ivoire has reversed. As the producer price in Côte d'Ivoire is almost only half of the price in Ghana, there are indications that Ivorian cocoa is now pouring into Ghana. Cocobod however denies any significant
The new Ghana Cocoa Boom in the 2000s - F. Ruf (CIRAD, November 2007)
41
smuggling and claims that the progressive liberalisation is the key explanation for the recent cocoa boom, while mentioning as well the successful ‘mass spraying’ exercise (CODAPEC) launched during the first term of President Kufuor.
1.5. Related programmes and other donor activities
The EU attaches great importance to agricultural commodities in the fight against poverty, through a strong commitment to support Commodity Dependent Developing Countries in addressing the specific challenges they are facing in a coherent and coordinated manner (COM(2004)89). This support will largely hinge on the development of commodity strategies by the recipient country.
EC assistance to agriculture through STABEX funds has targeted cocoa, Ghana’s major export commodity. One of the main components was the Cocoa Swollen Shoot Project – Phases 1 and 2, which compensated farmers for the loss of income after the cutting out of Swollen Shoot infected cocoa trees and assisted them with replanting more resistant hybrid cocoa seedlings. This project may have played a role in the recent cocoa production increase.
The future EDF-financed Cocoa Sector Support Programme Phase 2 aims to support Ghana in the development and implementation of a more participatory cocoa strategy, engaging all stakeholders of the commodity chain (input providers, farmers, producer organisations, buyers, transport and warehouse providers, processors, exporters, the chocolate industry, financial and government institutions, conservationists), while focusing on the development of a more sustainable cocoa sector and the replanting of cocoa in denuded areas.
Since the mid 1990s, other development partners did not contribute significant amounts to the cocoa sector, exacerbating the relatively poor knowledge and understanding about the economic changes in the cocoa sector.
2. OBJECTIVE, PURPOSE & EXPECTED RESULTS
2.1. Overall objective
The overall objective of this contract is to contribute to an improved knowledge on the driving forces of the rural economy in cocoa growing areas.
2.2. Purpose
The purpose of this contract is an improved knowledge on the factors driving the recent sudden and massive increase in cocoa output in Ghana.
2.3. Results to be achieved by the Consultant
An evidence-based assessment of the sustainability of the recent increase in cocoa output in Ghana.
3. ASSUMPTIONS & RISKS
The assumption is that the consultant will have full collaboration with and access to existing data at Cocobod.
An identified risk is that Licensed Buying Companies will not make available their district disaggregated data for confidentiality reasons. A proper explanation on the purpose of requesting the data from the LBCs should facilitate the access of the consultant to their data.
The new Ghana Cocoa Boom in the 2000s - F. Ruf (CIRAD, November 2007)
42
4. SCOPE OF THE WORK
4.1. General
4.1.1. Project description
This research project aims to understand precisely the unexpected and amazing revival of the Ghanaian cocoa sector and evaluate its strength and sustainability. This implies to take the national cocoa sector history into consideration at each step of the project, from sampling to analysis. In 2000, Ghana reached the end of a century of cocoa production after three major regional cycles. - The first (1920s) boom corresponded to the rapid development of the Eastern Region. - The second boom that was in preparation during the 1950s and which came to fruition in the 1960s
was due to migration waves into the centre of the country, into Ashanti Region and the initial limits of the Western Region, then towards the Brong Ahafo Region.
- The recovery seen in the late 1980s and 1990s was the result of a third major shift of the last pioneer fronts towards the whole of the Western Region, this time using cultivation techniques without shade, techniques that provide higher yield, but aggravate deforestation and environmental degradation.
In Ghana, the westward movement of the pioneer fronts largely corresponds to a typical progression of the cocoa cycle, with migrants looking for cheap forest and land, as well as seeking to avoid the pests and diseases that had developed in the older cocoa-producing areas. It’s an example of the archetypal cocoa cycle. Although not proven by evidence, the price differential between Côte d’Ivoire and Ghana may have been influential. In the 1980s and 1990s, the extensive installation of plantations near the border with Côte d’Ivoire might be partially explained by price policies in Côte d’Ivoire. In the 1990s, in the old cocoa growing zones in the Eastern region and in Ashanti country, cocoa trees were producing declining yields and in the Volta region, they have even nearly disappeared. A few traces of this past wealth remain in old cocoa growing regions in the form of several decades old plantations, and new agricultural and non-agricultural economies have replaced cocoa. In some cases, such as the oil palm sector of Kade, they have been able to lift the populations out of poverty. Eventually, in the mid-1990s, there was a relative consensus among experts to say that Ghana’s cocoa economy seemed to remain fragile, especially because of the disappearance of the tropical forest and the rural exodus by the young people, and seemed stuck at a production threshold of 350-400,000 tonnes. In the 2000s, the national production pierced that threshold. The research project aims at precisely understanding the following: - Can it be interpreted as a fourth regional cycle caused by new planting in new regions by new
families? In that case, where are these ‘new’ regions, what varieties do they plant and who are these new families? Is that ‘fourth’ cocoa cycle following the old classical way, developing at the expense of ‘forests’? Or does it bring some innovations by using fallows and degraded land more intensively than in the past?
- Are mass spraying and individual spraying, and more generally the adoption of new basic techniques, such as the increased use of fertilisers, playing a new and major role? Do they open new paths towards more modern and more sustainable cocoa cultivation? Are they compatible with the reconstruction of forest ecologies?
- How do various price/subsidy/taxation and other policies interact in this economic and ecological change? Which lessons can be drawn for the future?
The new Ghana Cocoa Boom in the 2000s - F. Ruf (CIRAD, November 2007)
43
4.1.2. Geographical area to be covered
The Western Region is the largest cocoa producing region in Ghana consisting of 10 cocoa growing districts. Out of these districts, 4 will be randomly selected. In the Brong Ahafo, Ashanti, Central and Eastern regions one district each will be randomly selected.
4.1.3. Target groups
The results are aimed at: - Policy makers and development partner agencies. - Interviewed farmers’ communities who will get a survey feedback of the main findings and
recommendations. - Students who will work on case studies and a tool of farm references for the future.
4.2. Specific activities
(1) Collect existing data from Cocobod, LBCs, STCP and other relevant institutions. (2) Identify and tentatively quantify the determinants of the sudden and massive increase in cocoa
output in Ghana. Evaluate the relative weights of these determining factors, likely to be among the list below: − Migration and its impact on investment. − Increase of newly planted area (deforestation?). − Who increased the cocoa area? Established cocoa farmers or new cocoa farmers. − Increase in insecticide and fungicide use on cocoa farms, due to mass spraying exercise
(CODAPEC) or by individual decision − Increase in fertilizers use? − Spontaneous changes in other aspects of farm management? − Impact of extension campaigns (public, private, projects) − National programmes such as attempts to eradicate swollen shoot (STABEX, GoG)? − Change in access to family and non-family labour within established farms? − Smuggling from Côte d’Ivoire?
(3) Evaluate the interactions between these changes in farming systems and changes in the smallholders’ environment:
− Interactions with economic and political environment (price, liberalisation, mass spraying, …).
− Potential interactions with climatic changes. (4) Elaborate a methodology to evaluate these economic changes in the cocoa sector, to enlarge
and replicate the study two years later, if the findings of this first study show their interest.
4.3. Project management
4.3.1. Responsible body
The Ministry of Finance and Economic Planning, through the Head of the ACP/EU Unit, and the Rural Development section of the Delegation of the European Commission to Ghana will provide advice and guidance to the consultant.
4.3.2. Management structure
The Consultant will provide a team leader and will carry out the study in close collaboration with a university in Ghana, knowledgeable on cocoa issues and statistical surveys.

The new Ghana Cocoa Boom in the 2000s - F. Ruf (CIRAD, November 2007)
44
4.3.3. Facilities to be provided by the Contracting Authority and/or other parties
None.
5. LOGISTICS AND TIMING
5.1. Location
The project will be based in Accra., but for data collection field trips to the districts selected as described in 4.1.2. will be necessary.
5.2. Commencement date & Period of execution
The tentative commencement date is 1 May 2007 and the period of execution of the contract is fixed at a maximum of 4 months. Please refer to Articles 4 and 5 of the Special Conditions for the actual commencement date and period of execution.
6. REQUIREMENTS
6.1. Personnel
Key expert 1: Team Leader
Qualifications and skills
Senior economist, with a PhD or equivalent in Social and Human sciences.
General professional experience
More that 15 years of experience in cocoa farming systems and a large set of publications on cocoa economics.
Specific professional experience
At least four years in Ghana and a good knowledge of the country.
6.1.1. Other experts
Not applicable.
6.1.2. Support staff & backstopping
The field research will be conducted by technical staff under the direct supervision of the team leader.
6.2. Office accommodation
Office accommodation for the expert is provided by the Consultant.
6.3. Facilities to be provided by the Consultant
The Consultant shall ensure that the expert and its staff are adequately supported and equipped.
The new Ghana Cocoa Boom in the 2000s - F. Ruf (CIRAD, November 2007)
45
6.4. Equipment
The Consultant shall ensure that the expert and its staff have access to all necessary equipment. No equipment will be specifically purchased under this contract.
7. REPORTS
The language of all communications and reports must be English.
A draft version of the final report/documents is to be submitted to the Contracting Authority 3 months after the commencement date of the contract. The Contracting Authority will have 14 calendar days to formulate comments, after which the consultant will have 14 calendar days to complete the final report/documents.
Copies of the draft and final report/documents will be submitted with the following distribution:
• NAO 2 paper copies and 1 electronic copy
• Cocobod 4 paper copies and 1 electronic copy
• EC Delegation 4 paper copies and 1 electronic copy