the new political economy of agricultural...
TRANSCRIPT

Doctoral Thesis Reviewed
By Ritsumeikan University
The New Political Economy of Agricultural Development and Food Security in sub-Saharan Africa
( )
March 2016
2016 3
Doctoral Program in International Relations, Graduate School of International Relations,
Ritsumeikan University
RAJAONARISON Haja Michel
Supervisor: Professor ITAKI Masahiko
i
Acknowledgements
Dis ducibus, benigno numine, Deo optimo maximo!
First and foremost, I would like to express my gratitude to my supervisor and mentor,
ProfessorItaki Masahiko, who took me under his wings during my studies in Japan. He provided me
his guidance with patience and a dedicated support and encouragement, particularly during the time
when I encountered obstacles these last five years. He has been a source of intellectual inspiration
through our insightful hours of discussions and more importantly for the opportunity he offered me
to
which I really enjoyed to study and explore during my academic journey.
I would like to express my heartfelt gratitude to Professor Matsuda Masahiko, with whom I
learnt many things about agriculture. Learning from his experiences and insightful advices has been
for me a great source of inspirations.
I am extremely grateful to Professor Pascale Hatcher for her insights and ongoing supports
throughout my studies. Her detailed comments, the guidance on methodology have proven to be
significant on the development of my research. Not only did she edit patiently my manuscript, she
has also been a role model for me. Her enthusiasm has been a great source of inspiration.
I further would like to extend my deepest gratitude to Professor. Matsubara Toyohiko with
whom, I spent few semesters at the department of economics of Ritsumeikan University. His advices
and teaching have been valuable to my entire study. A special thanks to Professor Koyama Masahisa
who shared his comments and ideas about my work. My sincerest gratitude and appreciation to
Professor Nakatsuji Keiji and Professor Fukumi Sayaka, for the opportunity they gave me to learn
from their experiences while serving as their Teaching Assistant. To all the staff of the Graduate
School of International Relations who provided their support and guidance.
This thesis is the result of the financial support of the Japanese Government via the Ministry
of Education, Culture, Sports, Science and Technology (Monbukagakusho). I further would like to
acknowledge my home institution, the Graduate School of International Relations of Ritsumeikan
University, for all the great opportunity I had during my studies.

ii
Abstract
From a political economy perspective, this thesis explains why the recent agriculture and food
security policy in sub-Saharan Africa, adopted by development institutions alongside with the
private sector is not working and seeks to advocate solution to tackle it. The thesis
problematises the topic according to three narratives: first, introducing the topic of agriculture in
the theme of development; second, mobilisation of resources as a big push to agriculture and
finally, the stabilisation of the grain markets to ensure global food security.
The thesis argues that the introduction of the mechanism of public, private partnership
(PPP) and value chain is marginalising the ability of African countries to manage their
agricultural development and food security programme. The thesis elaborates that such
mechanism which concentrates on agricultural development inhibits the path of structural
transformationof the region, which in turn affect the sustainability of the food system, the social
and economic development.
This thesis concludes that the reintroduction of the PPP mechanisms and the market-driven
value chain are marginalising African smallholders economically, socially and politically.
Global food security that transcends through the global to national and household level
represents an impossible trinity, firstly, due to the difference in market mechanisms. Secondly,
due to the self-driven interest pursued by countries to secure their own food control, and finally,
to the trade-off faced by smallholder between the production of food for self-consumption and
high-value commodity for export. Although agriculture represents an important share of the
Gross Domestic Product, its role as a leading sector was outstripped by other industries since
1990s. This leading role since then has been led by a hybrid dualism between manufacturing
and agriculture.
The contributions of the thesis are threefold: to the background theory of political economy
while dealing with the interplay between the economy and politics relative to the present theme.

iii
To the focal theory that arises from the theoretical and empirical evidences stemming from this
-
technique of orbit analysis and its application to the analysis of economic information.

iv

v
Content
Acknowledgements......................................................................................................................................iAbstract.......................................................................................................................................................ii
.............................................................................................................................................................ivList of Figures...........................................................................................................................................viiList of Tables........................................................................................................................................... viiiAcronyms...................................................................................................................................................ixChapter 1: The new political economy of agricultural development and food security in sub-SaharanAfrica an introduction................................................................................................................................1
Introduction.............................................................................................................................................1
1.1. Keeping track on the recent food problem: general backgrounds.....................................................4
1.2. Aim and significances.....................................................................................................................14
1.3. Research questions..........................................................................................................................15
1.4. Theoretical framework....................................................................................................................16
1.5. Methodology...................................................................................................................................21
1.6. Structure of the dissertation............................................................................................................24
Chapter 2: Food and human security in sub-Saharan Africa......................................................................262.1. Introduction....................................................................................................................................26
2.2. A new modus operandi to tackle food security...............................................................................27
2.3. market- ...................................................................................35
2.4. The process of altered marginalisation...........................................................................................41
2.5. ...........................................................................................46
2.6. Conclusion......................................................................................................................................54
Chapter 3: The Trilemma of Agricultural Development and Food Security in sub-Saharan Africa..........563.1. Introduction....................................................................................................................................56
3.2. Analytical framework and scope of the analysis ............................................................................58
3.3. Market, security and pro-poor approach: the food security trilemma.............................................62
3.4. Discussions.....................................................................................................................................70
3.5. Conclusion......................................................................................................................................78
Chapter 4: Differences in Intersectoral Linkages and its Implications for sub-Saharan Africa: Evidencesfrom the orbit analysis................................................................................................................................80
4.1. Introduction....................................................................................................................................80
4.2. Method, data and specifications......................................................................................................83
4.3. Results ............................................................................................................................................87
4.4. Discussions: policy implications ..................................................................................................101

vi
4.5. Conclusion....................................................................................................................................126
Chapter 5: In the search of the driving force of sub-analysis.....................................................................................................................................................129
5.1 Introduction...................................................................................................................................129
5.2. Literature review...........................................................................................................................131
5.3. Model, method and data calibration..............................................................................................133
5.4. Results ..........................................................................................................................................135
5.5. Discussions...................................................................................................................................143
5.6. Conclusion....................................................................................................................................153
Chapter 6: Conceptualising Capacity-driven approach the way forward .............................................1566.1. Introduction..................................................................................................................................156
6.2. Analytical framework...................................................................................................................157
6.3. Identifying policy interfaces.........................................................................................................161
Conclusion...........................................................................................................................................169
Chapter 7: Conclusion..............................................................................................................................172Why are the recent policies not working and what can be done about it ...........................................173
The new modus operandi and the stabilisation of the world grain markets.........................................175
What did we learn from orbit analysis policy and theoretical implications......................................177
Sustainable agricultural development and food security in sub-Saharan Africa..................................179
References................................................................................................................................................181Appendix..................................................................................................................................................200

vii
List of FiguresFigure 1 - Conceptual Framework.............................................................................................21
Figure 2 - Map of the GAFSP and G8 New Alliance for Food Security and Nutrition.............29
Figure 3 - Illustration of the GAFSP and G8 New Alliance segments of value chain...............34
Figure 4 - Hard and soft commodity index 1970-2015..............................................................40
Figure 5 - Demographic transition in SSA 1960-2010..............................................................48
Figure 6 - Yield, land and share of employment in SSA...........................................................50
Figure 7 - Share of employment male and female in percentage of employmentin agriculture
for SSA ..............................................................................................................................51
Figure 8 - Pattern of inequality in the Non-New Alliance and New Alliance countries 1980-
2010...................................................................................................................................53
Figure 9 - Results of the orbit analysis for SSA ........................................................................90
Figure 10 - Weighted results of orbit analysis, decomposition 1972-2011 ...............................91
Figure 11 - First and last scores of each sector, GDP decomposition 1973-2011 .....................92
Figure 12 - Leading-following relations between agriculture and manufacturing in SSA ........96
Figure 13 - Leading-following relations between agriculture and other activities in SSA........97
Figure 14 - Leading-following relations between agriculture and mining in SSA....................98
Figure 15 - Leading-following relations between agriculture and transport in SSA .................99
Figure 16 - Leading-following relations between agriculture and wholesale in SSA..............100
Figure 17 - Leading-following relations between agriculture and construction in SSA..........101
Figure 18 Distribution by group, agriculture and mining in percentage of GDP, SSA ........112
Figure 19 - Intensity of activity, mining and agriculture in % share of GDP..........................113
Figure 20 - Construction leading over agriculture, SSA, 2008-2013 ......................................122
Figure 21 - Wholesale leading over agriculture, SSA, 2008-2013..........................................123
Figure 22 - Transport leading over agriculture, SSA, 2008-2013............................................124
Figure 23 - Other activities leading over agriculture, SSA, 2008-2013...................................125
Figure 24 - Mean of the 9-year moving average for 38 SSA countries, 1970-2012................135
Figure 25 - Extreme points of the kick-starters of 38 countries SSA in 1972 and 2012..........136
Figure 26 - Leading-following relations by sub-regional decomposition,...............................139

viii
Figure 27 - Leading-following relations among G8 and non-G8 New Alliances and
institutional settings.........................................................................................................141
Figure 28 - Leading-following relations considering the business environment for 38 countries
in SSA..............................................................................................................................143
Figure 29 - Main aggregates in Percentage of GDP for 38 SSA countries, 1970-2013...........144
Figure 30 - Homogeneous panel of leading-following relations for 38 countries in SSA 1972-
2012.................................................................................................................................204
List of TablesTable 1 - Profile of the GAFSPand G8 New Alliance countries......................................................30
Table 2 - GDP Sectoral Decomposition SSA, in percentage, 1970-2013.........................................88
Table 3 - Leading-following relations across countries, SSA 1972-2011.........................................93
Table 4 - Count outcome of a leading agriculture, SSA countries, 2000-2012...............................106
Table 5 - Count outcome of leading mining sector in SSA 2000-2012..........................................111
Table 6 - Count outcome of leading manufacturing sector from 2000-2013 in SSA......................115
Table 7 - List of 38 SSA countries and their geographic distributions...........................................134
Table 8 - Leading-following relations across sub-regional category, 38 SSA countries 1972-2012
...............................................................................................................................................137
Table 9 - Pattern of the leading-following relations in of trade and investment, SSA, 2003-2012.151
Table 10 - Capacity-driven matrix..................................................................................................161
Table 11 - Description of the variables from the World Bank Development Indicators.................200
Table 12 - Summary Statistics of WDI data...................................................................................200
Table 13 - Description of the raw data SSA ...................................................................................201
Table 14 - Correlation table of the intersectoral data by industry...................................................202
Table 15 - Correlation table of the aggregate demand data............................................................202
Table 16 - Summary statistics of the orbit analysis output 9-yearmoving average........................202
Table 17 - Summary statistics of the results of orbit analysis at a country level ............................203
Table 18 - Summary statistics of the results of orbit analysis for the aggregate demand ...............203

ix
AcronymsADB Asian Development Bank
AfDB African Development Bank
BRICS Brazil, Russia, India, China and South Africa
CAADP Comprehensive Africa Agriculture Development Programme
CFS Committee on World Food Security
EGARCH Exponential Generalised Autoregressive Conditional Heteroscedastic
EIU Economist Intelligence Unit
FAO Food and Agriculture Organization of the United Nations
FDI Foreign Direct Investments
G20 Group of Twenty
G8 Group of Eight
GAFSP Global Agriculture and Food Security Program
GDP Gross Domestic Product
IAASTD International Assessment of Agricultural Knowledge, Science and
Technology for Development
ICMM International Council of Mining and Minerals
ICT Information and Communications Technology
IFAD International Fund for Agricultural Development
IFC International Finance Corporation
IFPRI International Food Policy Research Institute
ISIC International Standard Industrial Classification
Kcal Kilocalorie
MBA Market-Based Approaches
NEPAD New Partnership for Africa's Development
NGOs Non-Governmental Organization
OECD Organisation for Economic Co-operation and Development
R&D Research and Development
x
ReSAKSS Regional Strategic Analysis and Knowledge Support System
SMEs Small and Medium sized Enterprises
TNCs Transnational corporations
UK United Kingdom
UN-DESA United Nations Department of Economic and Social Affairs
UNDP United Nations Development Program
UNSCN United Nations Standing Committee on Nutrition
UNSD United Nations Statistics Division
US United States of America
USAID United States Agency for International Development
WFP World Food Program

1
Chapter 1: The new political economy of agricultural
development and food security in sub-Saharan Africa an
introduction
Yet food is something that is taken for granted by most world leaders despite
the fact that more than half of the population of the world is hungry. Norman
Borlaug (1914-2009)
Introduction
It goes without saying that the world saw great changes in recent years. With the
emergence of countries like China, Brazil and India, where the economic and social
transformations were impressive, the epicentre of the global economy has therefore
shifted from its past location. New players are also rapidly advancing onthe world stage,
having as a consequence a political, economic and social reconfiguration in the relations
between countries. Indonesia, Malaysia, Saudi Arabia and Mexico are among the
countries that have experienced significant progress in their economies in the recent
decade. However, these transformations are also bringing with them far-reaching
consequences. One of these major consequences concerns food and its future production.
As a matter of fact, a real threat is hanging over the sustainability of food production as
the earthis losing its capacity to soften scarcity (Brown, 2011).
Addressing food insecurity is, by and large, the biggest challenge of the 21st
century. Indeed, according to the FAO (2009), an additional 80 million people need to
be fed every year. On the top of this figure, the current hunger and malnutrition issues
also have to be taken into consideration in the future policies. In 2010 for instance, due
to income failure, 950 million people did not have access to adequate food, and out of

2
this figure, 98 percent were located in developing countries (FAO, 2010). Therefore, to
be able to meet the demand of the 2 billion additional world populations by the horizon
2050, food production needs to be increased 70-100 percent of its current level (FAO,
2009). However, feeding the world population poses a complex policy challenge due to
the fact that the food problem is jammed in the top of multifaceted global issues such as
climate change, agricultural trade and poverty to name a few. These multidimensional
elements impose major constraints to develop independent policies that could rapidly
unravel the issues.
Agriculture and food security are nowadays repeatedly debated at the highest
international stages and prominent forums as they constitute a global threat to the world
stability. The rapid emergence of the responses of these recent years reflects the
importance of the issue on the agenda of the majority of international institutions. The
United Nations (UN) and the G20, with the Global Agriculture and Food Security
Ag
in 2013, the African Union (AU) with the Malabo Declaration on Accelerated
Agricultural Growth and Transformation for Shared Prosperity and Improved
Livelihoods in 2014 are few examples of initiatives that have emerged since 2008.
Furthermore, individual states, private companies, civil societies and NGOs are also
harnessing their efforts to work on a comprehensive agenda towards a sustainable food
and agricultural systems to combat poverty and eradicate hunger.
Technical solutions were quickly found to address this issue. If the problem is
about food scarcity, then, it is necessary to scale-up agricultural productivity where it is
still possible to do so. Moreover, these solutions presented themselves as a boon, as

3
millions of people are suffering from poverty and hunger in the regions such as sub-
Saharan Africa (SSA), South and Central America where agricultural development is
still achievable. For that reason, bringing solutions in these regions could bring a
significant impact for economic and social development.
SSA was identified as a major player in this new saga given the richness of its
natural resources and its large reserve of arable land. However, this new role is also
giving rise to an intertwined social, political, economic and strategic interest subjugated
by a power struggle. Three major narratives have been constructed to embrace this new
context. First, the reintroduction of the topic of agriculture in the development thinking
-
Second, resource mobilisation coupled with supports channelled through the PPP and
value chain. And finally, the stabilisation of the food and grain markets with the idea
that the trade mechanism would help food import dependent countries to ensure their
future supply. Unequivocally, at first glance, these solutions appear as a salvation, and
timely for SSA, where agriculture has been under-valued for a long time. However, the
way how these policies are arranged and carried out contradict the realities that prevail
in the countries towards which they are intended for.
This thesis seeks to shed light on the three narratives mentioned above. In
pursuing such endeavour, it aspires to provide theoretical as well as empirical evidences
on the change in modus operandi in the governance of the global food system. It seeks
to
development strategies to enhance private control of the African food system.
Furthermore, this manuscript explores to what extent the recent agricultural
development and food security policies are in contradiction with the ostensible realities
in SSA, particularly, with regards to economic conditions, poverty, as well as food

4
access and availability. In a nutshell, the central theme of this thesis is why the recent
policies intended to promote agriculture and eradicate food insecurity in SSA are not
working and what can be done about it.
The main objective of this chapter is to familiarise the readers to the general
framework of this study and to present the major stakes that justi n
discipline of political economy when the topic of agriculture, food security and SSA are
placed at the core of the discussions.
The remainder of this chapter is organised as follows. The next section presents
further details about the three narratives mentioned above and documents the literature
that informs the subject. The aim and significances of the thesis are laid out in section
two. The subsequent section presents the conceptual framework that guides this
manuscript. This framework identifies the logical sequences, the context and theoretical
- focal contribution of this
thesis. The choice of the methods of analysis is introduced in the ensuing section. It
briefly presents the qualitative and quantitative approaches to support the arguments of
the present thesis. In addition, the section covers the scope and limitations of this study
and its framework within time and space. The last section of this chapter introduces the
structure of this manuscript.
1.1. Keeping track on the recent food problem: general backgrounds
In late 2007, the World Bank released its annual World Development Report 2008
(WDR2008) entitled This publication was not trivial as
the last report focusing on the topic dated back to 19821. Special emphasis was placed
1 The World Development Report 1982 concentrates on agriculture and reckons the importance of the sector to be the main source of
income for the poor. (see: World Bank, 1982)

5
on the role that agriculture can play for the poor, in particular as a means of livelihood,
and as asource of income as well as food security (World Bank, 2007, p. 8).
Agricultural development and food security are two concepts that are closely
linked together, albeit they are intertwined within a different space. Agricultural
development in its broad sense is a set of processes and strategies, to enhance
agricultural productivity, embracing land and labour. From the viewpoint of the
mainstream economic literature inspired by the modernisation theory, agricultural
development can be understood as an early stage of structural transformation (Rostow,
1960, p. 4-16). According to the mainstream point of view, structural transformation is
both equally a cause and effect of economic growth (Timmer, 2009, p. 5). Syrquin
(2006, p. 602) points out the main changes highlighted in development literature driven
by structural transformation: increase of the rate of accumulation, changes in the
sectoral composition of the economic activities characterised by industrialisation,
relocation of the economic activities in urban areas, demographic transition and income
distribution (Kuznets, 1966; Lin, 2012, p. 3; Syrquin, 2006, p. 602; Timmer, 2009, p. 5).
Accordingly, agriculture has been considered as the starting point of economic and
social development. To this extent, Timmer (2009, p. 3), stated that with the exception
of Hong Kong and Singapore, no single country was able to sustain a rapid transition
out of poverty without enhancing its agricultural productivity.
Food security is related to the problem of food and its physical availability,
sufficiency and access. Although there are a dozen definitions of food security, this
thesis is particularly interested in the definition which emerged from the 1996 World
Food Summit, stipulating that:
Food security, at the individual, household, national, regional and global levels (is
achieved) when all people, at all times, have physical and economic access to

6
sufficient, safe and nutritious food to meet their dietary needs and food preferences
for an active and healthy life (FAO, 1996).
The WDR2008 acknowledged that agriculture can contribute to food security,
especially for the poor who directly produce their food through their activities (World
Bank, 2007, p. 8). As such, bringing back the topic of agriculture in development has
been the focal points to poverty reduction and food security, not only for the World
Bank but also for other major international public institutions particularly after the price
spike of 2007-2008. The new solutions advanced to address the food problem were
crafted on the basis of the three narratives mentioned earlier, which present themselves
as the main problems of the presentmanuscript.
1. The Silver lining: bringing back the topic of agriculture in development
withthe WDR2008
The fact of bringing back the topic of agriculture in development is on one hand,
problematised with the fuzziness of the empirical evidences between agriculture and
growth and on the other hand, to the fact that African countries are nowadays at a
different stage of their development.
The positive analysts underline the fact that sustained economic growth reduces
poverty (Nallari & Griffith, 2011, p. 64). A wide range of empirical evidences supports
the role of agriculture in development, particularly the role of the growth stemming
from agriculture on poverty reduction (Bravo-Ortega & Lederman, 2005; Christiaensen
& Demery, 2007; De Janvry & Sadoulet, 2010; Diao, Hazell & Thurlow, 2010; Foster
& Rosenzweig, 2003; Gollin, Parente, & Rogerson, 2002; Irz et al., 2001; Ravallion &
Datt, 1996). Furthermore, De Janvry and Sadoulet (2010), specified that growth can

7
offer multiplicity of pathways out of poverty, depending on the sector where it is
generated.
It is important to note that the effects of growth on poverty differ in time and
space and therefore, growth strategies should not only focus on agriculture but also on
other strategic sectors. Gemmell, Lloyd, and Mathew (2000) for instance, illustrate the
importance of other sectors of the economy and its relations to agriculture using time
series data of Malaysia. The study assessed how manufacturing and service are affecting
the expansion of agriculture from 1966 to 1991. Their findings underlined that over the
long run, expansion in the manufacturing sector is associated with the expansion of
agriculture. Conversely, service sector showed a little incidence on agriculture. Other
studies by Hasan and Quibria (2004) used cross-country data to examine the
relationship between poverty, growth and sectoral variation across regions. The two
authors observed that agriculture was a key driver of poverty reduction in South Asia
and SSA while the industrial and service sectors respectively played a key role in East
Asia and Latin America. Furthermore, Loayza and Raddatz (2010), who emphasised on
the importance of unskilled-labour intensity, specified that agriculture and construction
are the sectors that have a robust effect on poverty reduction compared to the other
industries.
Nonetheless, Tsakok and Gardner (2007) raised some issues about these
empirical findings, particularly the ones that seek to establish causal relations between
tric analyses
Gollin (2010, p.
3825 3866) attempted to bring some clarification to the debate, the results of the
findings are still constructed on empirical assumptions and techniques that led to the
same discussions. Such inconsistency matters insofar development strategies are

8
devised and defended according to the empirical evidences and that policy towards an
agriculture-based country is different from resource-rich or industrialised one in terms
of factor and resource allocations.
The categorisation of SSA as an agriculture-based economy stems from two
metrics: on the one hand, the share of agriculture in the GDPand on the other hand, the
proportion of the poor engaged in activities related to agriculture. However, this
classification poses a major problem to the trajectory of the African structural
transformation since the continent already experienced structural transformation yet
with the missing agricultural linkages. Since 2000s, SSA saw a new wave of social and
economic changes characterised by rapid growth of the economy and the population.
Nonetheless, the real problem lies at the level of the capacity of absorption of these
industries to create sustainable economic activities and livelihood for the people who
migrate to urban areas.
The demographic transition driven by the new wave of social and economic
progress also poses major problems to the African food security. According to the
studies of the Population Reference Bureau (2013), 1.3 out of the 2 billion people who
need to be fed by 2050 will be hailing from the African continent. This rapid increase of
population in majority young is also expected to cause rapid urbanisation having as a
consequence the recrudescence of poverty and inequality in urban areas (AfDB, 2012).
In this regards, differences in economic classification matters for an appropriate policy
as a wrong signal given to a particular sector of the economy might undermine or
reverse the path of structural transformation in SSA.

9
2. The mobilisation of resources: a big push towards agriculture
Resource mobilisation is the second narrative explored and discussed in this
essay. African countries have been historically locked on a pathway leading to a
framework, reducing undertake their own development policies.
Agricultural aid channelled through the PPP and value chain is today the new elements
embedded in the African development program to facilitate the private control of SSA
food system. As a matter of fact, the African countries initiative to promote agriculture
has barely obtained the support from the community of donors for many decades. In
2003 for instance, the African head of states gathered at the AU summit in Maputo,
created a new initiative called Comprehensive Africa Agricultural Development
Program (CAADP) under the framework of the New Partnership for Africa's
Development (NEPAD). The CAADP main target was to increase public expenditures
going to agriculture up to 10 percent of the GDP and to achieve an annual growth of 6
percent by 2008 (AU, 2003; Zimmermann, 2009). Nevertheless, despite the political
will to enhance the productivity and reduce the dependency to the international markets,
as the initiative was led by the African leaders, the majority of the stakeholders
struggled to find further supports to carry out their agenda. This failure to carry out
independent policies is not trivial, due to the strong ties of the NEPAD framework to an
embedded neoliberal proclivity. The NEPAD has, indeed, often been criticised since its
establishment in 2001 for its features modelled on the so-called Washington Consensus.
Such model is contextualised on the idea of partnership and ownership (Bush, 2007;
Owusu, 2003; Sahle, 2008). Consequently, after the failed attempts to implement an
African-led agricultural policy coupled with the recent food crisis, SSA was tamed by a
group of transnational corporations that have sought to integrate the market for
along time (Steinbrecher, 2003).

10
The 2007-2008 food crisis offered new openings for transnational corporations
(TNCs) to integrate the African food systems with the PPP and value chain. By the time
these new waves of proposal came in, food price had increased dramatically and global
markets have since then become very volatile. To soften this hike, the solutions
suggested by the international community were to call the private giant corporations
who were eager to bring the skills and knowledge to scale-up the poor agricultural
performance in the region and to contribute to the stabilisation of the international
markets. However, the private sector part of the new initiative represents a small group
of interest from the food industry. This group specialises in biotechnology and together
controls about half of the global certified seed market (ETC Group, 2008). The
participation of this group of interest in the new food system can now threaten the
proper functioning of market mechanisms as monopolies may arise, particularly for
vulnerable countries, including most of the African economies which are net food
import dependent since the 1980s (Rakotoarisoa, Lafrate, & Paschali, 2011).
3. The stabilisation of the grain markets to ensure food security
Since most of the SSA countries are nowadays net food import dependent, a
tendency to stabilise the international markets has gradually nested the international
policies. The idea behind the market stabilisation was motivated by the fact that import
dependent countries could rely upon trade mechanisms to ensure their future supply at a
reasonable price and that such process would transcend through the global, national and
household level.
Getting back on some episodes that occurred in 2008, the impact of the global
financial crisis started to spread all over the western countries creating a general malaise
and social unrests. In line with these events, a series of heat waves affected major grain

11
producers such as Russia and Kazakhstan while floods prompted crop losses in Pakistan
and its neighbouring countries. In other parts of the world, mainly in North and Latin
America, the increase of demand for biofuel was choices to divert
their activity rather than sticking to the usual grain-fed cultivation (Levi, 2013, p. 120-
125). More importantly, climate conditions were not very favourable as many
developing countries faced crop failures for successive years (Dinar, 2008, p. 49-50).
These series of events engendered a general panic within the grain markets (Jeffries,
2011, p. 736-737). An export ban was adopted by Russia, leading to the same response
in Argentina and other grain exporting countries. Given the supply was less than the
demand; the price of foodstuff skyrocketed, hitting the most vulnerable food import
dependent countries (Williams, 2012, p. 121-122).
With the major advances in the financial industries in recent years, food
commodity markets have become a very volatile environment. Taking into
consideration all these condi
longer a viable option for agriculture as pointed out by the International Assessment of
Agricultural Knowledge, Science and Technology for Development (IAASTD, 2009).
The so- supposed to transcend through the three levels: global, national
and household, reacts to different forces driven by incitation. Market forces, in an
uncertain environment might yield into a marginalisation of the poor and import
dependent countries. Market failures and externalities together with other uncertainties
represent a danger for vulnerable countries since they are sources of political and social
instability. Evidences from the World Bank research indicated that 51 food riots
occurred between the periods of 2007-2014 causing severe social unrest across the
globe with waves of violence, destabilising governments and social order (World Bank,
2014a).

12
4. The elusive debate onlarge versus small agriculture
The size and the style of the reforms intended to be implemented in SSA are
other important debates that need to be untangled in the present thesis. These elements
bridge policies to theoretical grounds as well as to the different practices that have
emerged from the recent food crisis. These are about th
and the problem of land grabbing.
The severity of the threats to global stability, particularly for African countries,
led to a multitude of responses which bring into conflicts: political, economic, security,
social as well as public and private interests. These conflicts of interest are addressing
the challenge of feeding the world by 2050, yet, they are also posing some issue on the
practical side. The various issues such as environmental problems, changes in the global
economic order, the financial crisis and many other risks, have been recently added to
the pressures on food security. Consequently, producing more food has become a hard-
hitting battle not only in third world countries, but also for the developed ones. In
addition, the future food production, therefore, will have to take into consideration a
very complex environment, climate, economic and institutional conditions (Pretty,
2012; Sachs et al., 2010).
With regards to the practice that emerged from the crisis, three groups of
countries were identified in the literature as the main players in the new food game:
Group 1: resource-rich and high-income countries (China);
Group 2: non-oil resource-poor but high-income countries (Japan, South
Korea, etc.);
Group 3: oil-rich, resource-poor countries (Saudi Arabia, Qatar, etc.).
The modus operandi of these players also varies according to their degree of
resilience, or their capacity to absorb shocks in an event of a price spike. Group 1 for
13
instance, is generally using its long-term presence in the continent to integrate different
projects and secure the supply of food (Brautigam, 2010, p.236-241). Group 2 is mainly
relying on its private sector to secure its food supply in the long run via Foreign Direct
Investments (FDI) in the countries where arable land is abundant (Cotula, 2012). This
group also uses the support of the multilateral public institutions to integrate its targeted
countries. Group 3 is mainly relying on petrodollar and the financial resources from its
own sovereign wealth funds to secure its supply over the long run (Cotula, 2012).
Further discussions about these actors will be presented throughout this study, but what
is worth mentioning so far is the fact that to date, different sets of literature on land and
water grabbing, have been presenting the negative consequences of these investments
(Borras et al., 2011; De Schutter,
2011; Hall, 2011).
Ideas are also divided in the academic community with regards to the size and
the style of the reforms to be implemented in the region. On the one hand, the positive
analysis school is fostering the idea that agriculture should be market-oriented. Such
perspective postulates that downstream and upstream actors in and organised global
value chain would share mutual benefits while interacting together (Farole & Winkler,
2014). On the other hand, a school of thought that brings together sociologists,
anthropologists, geographers, alongside with Marxist, neo-Marxist, activists, anarchists
(Borras, 2008). However, the large versus small agriculture
conundrum has been too much focused on ideological debates, and has provided little
practical solutions that address the social and economic conditions of individual
countries in SSA.

14
1.2. Aimand significances
This thesis looks beyond the simple approach to agricultural development implemented
as a technical fix to solve the current issue of food security. It stresses that such
development should take place in a manner that SSA countries would be able to
establish the missing linkages between agriculture and the modern sector, based on the
potential and real economic conditions. This approach beyond the simple agricultural
development would contribute to the sustainability of the policies aiming at eliminating
poverty and ensuring food security. -
is theoretically and empirically developed in order to embrace this process.
The objectives of this thesis are twofold. The thesis sets forth the wave of
changes in the governance of the African food system influenced by international
development institutions and discusses the impacts of these transformations on the way
of life of the African smallholders. Moreover, examines the interplays between
agriculture and food security at the global, national and household level to identify the
future trajectories agricultural development and food security in the region.
Furthermore, this manuscript examines the categorisation of SSA countries as
agriculture-based economy and discusses whether such categorisation is justified albeit
the dynamics of the other industries supporting the growth of the recent years.
Additionally, this thesis seeks to investigate the driving forces of the SSA economy to
draw some policy implication for agriculture and food security. Second, this thesis
explores and proposes a framework to address the current agriculture and food security
inconsistency with the concept of capacity-driven approach.
As part of the theoretical contribution, the paper also, offers new insight on the
debates on political economy while considering the role of the international policies that
influence national government decision and the interplay between politics and economy.

15
Moreover, the approach to data theory also explains to the readers how data can be
interpreted through the lens of orbit analysis.
This thesis also brings an innovative solution to policy approaches towards
agriculture and food security which discards the one size-fits-all consideration while
dealing with policies in SSA. It is however prudent to mention some caveats regarding
this thesis to avoid misunderstanding that can lead the readers to a hasty conclusion.
The paper recognises the importance of agriculture in Africa and does not embrace a
pessimistic idea of the role of agriculture in food security. Rather, it believes that
agriculture can play a role in the rapidly transforming Africa.
1.3. Research questions
As previously introduced, this thesis investigates why the recent policies
promoted by international development institutions with their partners are not working,
and what can be done about it
. This question sets forthfive sub-research questions asking:
Why and how the changes in modus operandi in agricultural development
and food security policies, particularly, the market-led paradigm, affect the
modes of production and the way of life of the smallholders in a holistic
manner in SSA How this modus operandi socially, politically and
economically marginalises the people in this region
Does the stabilisation of the international markets and the interplay between
international, national and household level converge homogeneously Does
it enable the food import dependent countries to ensure their future food
supply and security

16
To what extent does the classification of the region as an agriculture-based
inhibits the development of the other sectors of the economy and the
trajectory of its structural transformation
Whatare the driving forces of the economy in the region
-
agricultural and food security policy
In order to address these questions, the argumentation of this thesis is structured around
five propositions: first, agricultural development and food security guided by market
forces and the incentives from the donors and of their partners lead to an economic,
political and social marginalisation of smallholders in the target countries. Second,
stabilising the world grain market via the reliance on trade mechanism to ensure that
food security would transcend through the global, national, and household level is not a
viable option in the long run due to the numerous inconsistency of policies at each level.
Third, SSA has already embraced the shifts from the missing agricultural linkages in
which other modern sector of the economy is leading. Fourth, the structural
transformation of SSA is accompanied by one or more driving forces that support and
stimulate the recent economic performance. Hence, the classification of the region as
-
investments in other promising sectors. Fifth, -
over three pillars: 1) facing rural challenges, 2) handling urban migration, 3) embracing
globalisation is presented as policy recommendations to tackle the current African
agriculture and food security issues.
1.4. Theoretical framework

17
different from the earlier time, mainly after 2008, that deserves to be discussed in depth.
For a long time, debates about development policies have been centred on technical
solutions to technical problems as argued by Easterly (2014, p. 13). However,
agricultural development as we shall see in this thesis is more than a technical problem
that justifies a close outlook. For this reason, in this essay, political economy is adopted
as an organisational method. This discipline is par excellence, the most appropriate tool
to analyse the various changes that occurred over the past years, particularly in the way
how food is produced and its modes of production. Also, the richness of the discipline
makes it possible to conduct analysis through different angles, and in this sense,
Peet and Thrift (2001, p. 3):
The theoretical sources of this dissertation arise from the combination of three
branches of political economy: structuralism, agency and positive analysis schools of
(Peet & Thrift, 2001, p. 3), constructed
on a class-oriented approach. The third school derives its theoretical groundwork from
-
(Friedman, 1953, p. 4).
Political economy is also, deeply embedded in the analysis of the major shifts in
the mode of production, such as the transition from subsistence farming to commercial
agriculture (Atkins & Bowler, 2001, p. 21). As the present inquiry is focused on the
study of different social groupings such as TNCs, smallholder farmers, and the role of
the states, the adoption of political economy falls into what Redclift (1984, p. 5 cited in
Atkins & Bowler, 2001, p. 22) described as the economic analysis of the changes within

18
a social group in terms of costs and benefits it might bring to them. Also, as stated by
Atkins and Bowler, when it comes to the study of the agro-food system, political
economy pinpoints all chain across the production process, from the farm gate to the
marketing, and thus, extracts analytical meaning of the changes and the interactions that
occurs within it.
developed by Friedman and
McMichael (1989) are used as a tool to understand the historical restructuration of the
food system in a capitalist world (see also: McMichael, 2009a; McMichael, 2009b;
McMichael, 2012a; McMichael, 2012b).
From another lens, the individual is placed prior the society when it comes to
discussing food security. This shift in the analysis of the subject matter is primarily
guided by the fact that the purpose of food security policies is intended and directed to
an agent- la Via
Campesina in 1996, makes it possible to draw some analytical tool in regard to the
rights of the smallholders in developing countries, particularly about their rights as an
tudies
which presents informed survey by Desmarais (2007) for instance, puts forth the
struggles of peasants in developing countries to stay on their land to cultivate what they
want and build a viable community while facing the pressure and competition from the
multinational corporations supported by international institutions government policies.
In another case study, Tansey and Rajotte (2008, p. 176-196), describe the responses of
the propagation of intellectual property and other similar instruments to control the food
system. Madeley (2008, p. 26-46) points out how TNCs seek to impose this control
through instruments such as seeds, patents, terminators, pesticides, trade and the land

19
causing the impoverishment of millions of people in developing countries. Considering
solution for food security (Schanbacher, 2010, p. 53-76).
Lastly, the sources of this present inquiry would not be complete without the
theoretical works stemming from the positive analysis school, particularly, when the
analysis has been for a long time influencing
policy making. The s often approached with the understanding of what
interests the government officials are defending and why in the view of the
inconsistency between policy and democratic norms2. Barrett, Carter and Timmer
(2010) argue that public policy formation occurs based on a self-interested rationality of
policy makers (see: Krueger, Schiff, & Valdes, 1991; Lindert, 1991; Thies & Porche,
2007). To this end, Gorter and Swinnen (2010) identified four key elements that the
positive analysis model took into account in policy making: individual preferences of
citizens; the collective action of lobby groups; the preferences of politicians and
political institutions. Positive analysts also conceptualise food security in different
ways: availability-based view, which is aiming at achieving self-sufficiency; entitlement
approach, built over human rights, legal institutions, and the state (Sen, 1981); and
finally, the population health/ risk management approach which pays close look to the
issue of poverty (Barrett, Carter &Timmer, 2010). Furthermore, the positive analysis
school puts an emphasis on empirical analysis to defend policy recommendations. The
reintroduction of agriculture in the theme of development for example, empirically
assumes that growth originating from agriculture is more effective in poverty reduction
compared to the ones generated in other industries (World Bank, 2007, p. 28).
2 African agriculture received less support despite the proportion of rural population engaged in farming activities. However, rural
populations are used to gain votes during elections.

20
Accordingly, the concept of intersectoral linkages is also an important analytical tool
used in the present manuscript. It offers a wide range of perspectives to study the
dynamics of economic sectors and to identify the role played by agriculture among
other industries. The major framework of the intersectoral analysis derives from the
work of Chenery, Syrquin, and Elkington (1975); Johnston and Mellor (1961); Lewis
(1954); Ranis and Fei (1961) as well as Jorgenson (1961).
After presenting the various sources of the theoretical foundation of this study,
the following section is therefore presenting how it can be represented as a conceptual
framework.
1.4.1. Conceptual framework
The conceptual framework builds on two systematic approaches combining qualitative
and quantitative analyses constructed from the theoretical framework presented earlier.
-driven
The underpinnings of the theoretical, factual and institutional issues constructed
on agency/structuralist-oriented political economy are illustrated inFigure 1 below, in
the box on the left side. It outlines the elements that influence the changes in the global
food system and the inconsistency of policies, particularly in SSA.

21
Figure 1 - Conceptual Framework
Source: Author. 1
The second approach, shown in the middle, depicts a series of quantitative
studies constructed on positive analysis approach, illustrates the importance of elements
such as economic conditions, intersectoral linkages and economic transition at a macro-
level. The last part of the framework embarks on the synthesis of the empirical and
-
agricultural development and food security.
1.5. Methodology
The qualitative method mainly builds on the studies of the relevant literature covering
the research field of the political economy of agricultural development and food
security. With regards to data theory, the technique of orbit analysis is used as an
alternative method to inferential statistics to avoid the risks of empirical biases.
Establishing causal relations is one of the main goals of social sciences. Such
- (Itaki, 2014).
However, despite its popularity among the academic community, the method is flawed
and presents many risks that might lead to spurious results. In this section, we present
22
some of the theoretical features of the regression methods and the risks it might induce.
Let us have a simple look at the definition of this causal relation:
Variable x is said to Granger-cause a variable y if, given the past value of y, past
value of x are useful for predicting y. A common method for testing Granger-
causality is to regress yon its own lagged value and on lagged value of xand tests
the null hypothesis that the estimated coefficients on the lagged value of x are
jointly zero. Failure to reject the null hypothesis is equivalent to failing to reject the
hypothesis thatxdoes not Granger-cause y. (StataCorp, 2011, p. 595).
Techniques build on regression analysis, such as the autoregressive models are
common methods to test these causal relations. However, this method presents some
risks due to the rigours of the conditions of its assumptions that should be meticulously
observed and meet to obtain a reliable estimation results. An example of these rigorous
assumptions is the ones derived from the classical linear regression model: linearity and
additivity, statistical independence of the errors, homoscedasticity, and the normality of
the error distribution (Mamingi, 2005, p. 10). All violations of these assumptions are
leading to a regression bias. Econometricians correct bias by transforming the data or by
using other rigorous techniques of estimations. Berk (2010) however, mentioned that
The inconsistency of empirical evidences casts doubt on the relevance of the
inferential techniques adopted by the positive analysts to test the relations between
agriculture and economic growth. Albeit this contradiction, econometric analyses has
become a main empirical tool used by the international development institutions to
defend policy prescriptions. To avoid the empirical biases, orbit analysis is adopted as a
core method to data theory. Further information on the basic principles and assumptions

23
of orbit analysis will be provided with details in the empirical part of this essay, but for
now, let us mentiona few words about the description of the method.
Orbit analysis is a statistical method applied to a consistent time series, whose
main analytical framework is based on leading-following relations. The technique was
developed by Itaki (2014) to analyse one or multiple variables that implicitly has a
regression or autoregressive models, orbit analysis traces one by one, across time, the
position of each analysed variable. As the original technique of orbit analysis was
devised for time series analysis, this paper, therefore, contributes to the extension of the
method of graphical and cross-country analysis.
1.5.1. Data sources
Since this study reviews and critiques the various policies on agricultural
development and food security, the data used for this purpose are retrieved from
secondary sources. The main data supporting the empirical part of this thesis are
retrieved from different databases provided by various international development
institutions. The UN database national accounts for the main aggregates, the World
etc. lastly, political freedom and civil liberty from the Freedom in the World, the World
Bank Doing Business Indicator (DBI), etc., are used to construct a new dataset for the
empirical analysis. The detailed information regarding these data is presented in the
supplement of information of this manuscript.
1.5.2. Scope and limitations
This thesis focuses on the study of agricultural development and food security policies

24
carried out within the framework of the GAFSP and G8 New Alliance projects in
Africa. The geographic scope of this study covers SSA defined by the UN as follows:
esignation sub-Saharan Africa is commonly used to indicate all of Africa except
northern Africa, with the Sudan included in sub-Saharan Africa UNSD, 2014).
Due to limited data availability, 38 countries, covering four sub-region of SSA
(organised through geographic, political and institutional classifications) have been
selected for this study. The study covers the period 1970-2013 and sets forth some
major changes before and after 2008.
1.6. Structure of the dissertation
This dissertation is organised into seven chapters. The present introductory chapter sets
the scene and the framework of this thesis. Chapter 2 seeks to approach the paradigm of
human security from the perspective of food security, which brings in the discussions of
the new patterns of policies adopted in six countries in SSA. It discusses about the
emergence of a market-led food security, guided by market forces and incentives
created by the GAFSP and New Alliance project. Furthermore, the chapter identifies the
impact of these changes on the smallholders in the targeted countries.
In line with this topic of transformation, Chapter 3 investigates and discusses the
relations between global, national and household food security and its implication on
agricultural development policies and food security in SSA. It seeks to understand
whether such goals are converging towards the same direction or diverging taking into
consideration the ideological debates on the topic. It will be argued that the three goals
t nsequently affects the ultimate goal of combating
hunger and poverty in the region. This chapter bridges the qualitative analysis to the
empirical analysis of this dissertation.

25
Chapter 4 discusses the arguments presented by the international development
institutions to categorise SSA as an agriculture-based economy. Using multivariate orbit
analysis, the chapter constructs new dataset to compare different arguments based on
sectoral linkages to draw some implications for policy making with respect to
agriculture in the region. Furthermore, sector-to-sector
comparison between agriculture and other industries of the economy. In addition, the
chapter compares the performances of the countries benefiting from the supports of the
donor agencies with the rest of the other countries in SSA.
Chapter 5 draws some diagnostic tools from the aggregate demand, and
examines the structural transformation using panel orbit analysis. Variables such as
consumptions, government expenditures, investments and trade, are incorporated into
Chapter 6 focuses on policy advocacy regarding the management of agricultural
and food policy in SSA. The chapter elaborates on the concept of capacity-driven
approach to address the issue of agricultural development and food security in the
region as opposed to the policies advocated in the three narratives mentioned earlier.
The conclusion chapter summarises the findings and draws policy implications
for sustainable agriculture and food security in Africa. The last chapter also presents
further researches for a better understanding and the application of the concepts
presented in the present manuscript.

26
Chapter 2: Food and human security in sub-Saharan Africa
2.1. Introduction
of the UNDP (1994)
per se remains a bit vague and very often idealistic, the
study of concrete examples is essential to formalise meaningful contributions.
Since 2008, two multilateral programmes have influenced agricultural
development and food security policies in SSA. On the one hand, the UN GAFSP
pioneered by the G20 at the summit inPittsburgh in 2009 and on the other hand, the G8
New Alliance for Food Security and Nutrition in Africa an initiative adopted at the
Camp David summit in May 2012. The two programmes brought together 12 countries
of SSA3 where the mechanisms of the PPP and value chain were introduced as a
framework to tackle food security and to some extent, chronic poverty (UNSCN, 2015).
Using political economy as a method of analysis, this chapter attempts to
describe the institutional framework governing the new changes within SSA food
system. It seeks to approach the paradigm of human security from the perspectives of
food security, which brings into play discussions of the new patterns of policies adopted
in 12 countries in the region. Furthermore, it puts forth the existing partnership between
the public and private sectors to tackle the issue via the GAFSP and New Alliance
3 The numbers of recipient countries are based on information compiled from the GAFSP and USAID as of 2013.

27
The central questions the chapter will attempt to answer are the followings: Why
and how the changes in modus operandi in agricultural development and food security
policies, particularly, the market-led paradigm, affect the modes of production and the
way of life of the smallholders in a holistic manner in SSA How this modus operandi
socially, politically and economically marginalises the people in this region
This chapter argues that the incentives signalled by the GAFSP and New
Alliance are creating a market-led food security which in turn, engenders a cycle of
altered marginalisation of the African smallholders.
The remainder of this chapter is structured as follows: firstly, it discusses the
general background of the GAFSP and New Alliance and the countries targeted by the
two initiatives. It stresses on the model that emphasises on the role of private and public
sectors and their approach to food security. Secondly, the chapter discusses the
paradigm of market-led food security as a result of food commoditisation and the
different market incentives that are favouring it. Thirdly, the chapter identifies the
various impacts on the SSA smallholders resulting from the market-led model of the
organisation of production. And finally, the chapter briefly explores two concepts:
-
developed in Chapter 6 of this manuscript. The last section concludes
and bridges the present chapter to discussions related to policy mechanisms.
2.2. A new modus operandi to tackle food security
Recent changes in policy by various multilateral organisations are sending signals to a
particular group of interests, for the most part, the giant corporations that are
dominating the world food system. As a global response to the price spike of foodstuff
in 2008, in September 2009, the G20 created the GAFSP a special fund that aims to

28
improve income and food security in low-income countries through the increase of
agricultural productivity. This programme consists of two components: the public one,
led by a steering committee comprising major international institutions such as the
World Bank, the FAO, IFAD, WFP, Regional banks such as the AfDB and ADB, civil
society, and the representative of the Secretary General of the UN. The second
component is a private one, led by the private arm of the World Bank Group: the IFC.
This private window aims to provide funding to increase the commercial potential of the
agribusiness and SMEs by bridging the local, national and international value chain.
llholders to improve
productivity, support to companies to develop technologies related to agriculture, and
finally, investment and support in the riskiest sector which cannot attract investment.
Although the GAFSP was born under the G20, 10 donors principally committed to fund
the programme: Australia, Canada, Ireland, Japan, Korea, Netherlands, Spain, United
Kingdom, United States and the Bill & Melinda Gates Foundation. As of May 2014, the
public sector window already contributed to $979.20 million and the private sector
window $238 million(GAFSP, n.d.).
Nearly two years later, on May 18-19th, 2012, the G8 held its annual meeting at
Camp David in Maryland, United States, to discuss usual agenda related to global
governance, such as the global economy, climate change or security issues. However,
what marked this summit was the fact that specific measures were adopted to support
the African continent with regards to agriculture and food security. The New Alliance
was devised to foster the role of the private sector by mobilising private capital, scaling
up technology and reducing the risk faced by the most vulnerable people.
The compilation of the information related to the GAFSP and G8 New Alliance,
gives rise to the map illustrated below.

30
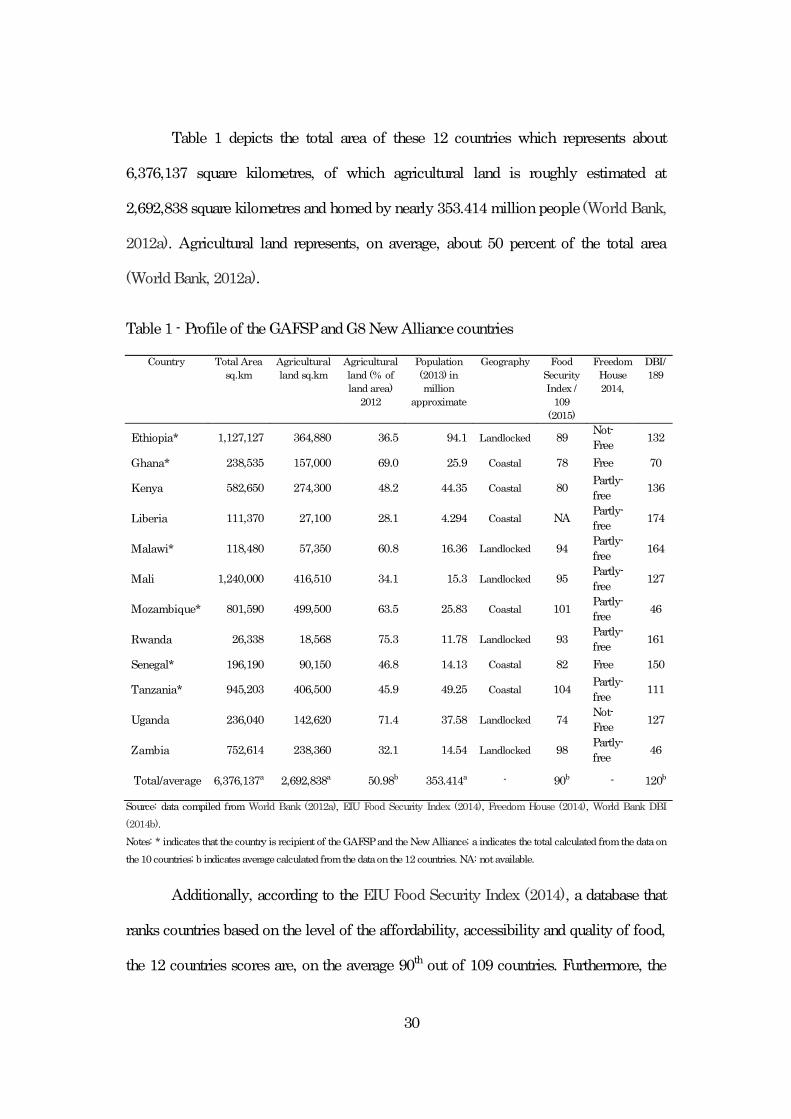
Table 1 depicts the total area of these 12 countries which represents about
6,376,137 square kilometres, of which agricultural land is roughly estimated at
2,692,838 square kilometres and homed by nearly 353.414 million people(World Bank,
2012a). Agricultural land represents, on average, about 50 percent of the total area
(World Bank, 2012a).
Table 1 - Profile of the GAFSPand G8 New Alliance countries
Country Total Areasq.km
Agriculturalland sq.km
Agriculturalland (% ofland area)
2012
Population(2013) inmillion
approximate
Geography FoodSecurityIndex /
109(2015)
FreedomHouse2014,
DBI/189
Ethiopia* 1,127,127 364,880 36.5 94.1 Landlocked 89 Not-Free 132
Ghana* 238,535 157,000 69.0 25.9 Coastal 78 Free 70
Kenya 582,650 274,300 48.2 44.35 Coastal 80 Partly-free 136
Liberia 111,370 27,100 28.1 4.294 Coastal NA Partly-free 174
Malawi* 118,480 57,350 60.8 16.36 Landlocked 94 Partly-free 164
Mali 1,240,000 416,510 34.1 15.3 Landlocked 95 Partly-free 127
Mozambique* 801,590 499,500 63.5 25.83 Coastal 101 Partly-free 46
Rwanda 26,338 18,568 75.3 11.78 Landlocked 93 Partly-free 161
Senegal* 196,190 90,150 46.8 14.13 Coastal 82 Free 150
Tanzania* 945,203 406,500 45.9 49.25 Coastal 104 Partly-free 111
Uganda 236,040 142,620 71.4 37.58 Landlocked 74 Not-Free 127
Zambia 752,614 238,360 32.1 14.54 Landlocked 98 Partly-free 46
Total/average 6,376,137a 2,692,838a 50.98b 353.414a - 90b - 120b
Source: data compiled from World Bank (2012a), EIU Food Security Index (2014), Freedom House (2014), World Bank DBI(2014b).Notes: * indicates that the country is recipient of the GAFSP and the New Alliance; a indicates the total calculated from the data onthe 10 countries; b indicates average calculated from the data on the 12 countries. NA: not available.
Additionally, according to the EIU Food Security Index (2014), a database that
ranks countries based on the level of the affordability, accessibility and quality of food,
the 12 countries scores are, on the average 90th out of 109 countries. Furthermore, the

31
Freedom House Index of Civil and Political Liberty (Freedom House, 2014), a
comparative index, assessing the global political rights and civil liberties indicated that,
among the 12 countries, 2 are categorised as free , 8 partly-free and 2 not-free . In
addition to these indicators, the Doing Business Index (World Bank,
2014b), which ranks countries corresponding to the quality of their business
environment, on average, places these countries, around the 120th position out of 189.
At first glance, these figures might prove to be confusing to understand as the
data in Table 1 shows heterogeneous characteristics relative to each country. However,
viewed from the lens of the value chain one finds that the recipient countries are
concentrated on Eastern and Western Africa. Furthermore, the compilation of the
information in Table 1 indicates that six countries are serving as rallying points of the
GAFSP and the New Alliance, namely: Ethiopia, Ghana, Malawi, Mozambique,
Senegal and Tanzania.
With the three major crises that hit the world simultaneously in 2007-08, the so-
(Addison & Tarp, 2010), a
new modus operandi was gradually embedded in the global food production system,
transforming the relations and the role of different economic actors at different levels.
Two major causes have triggered this turning point in food security policy. On
the one hand, there is a strong belief in the need to reduce the social divide, in line with
the Millennium Development Goals (MDGs) with the ambitious target of halving
poverty by 2015 which represents about 980 million people in 2012 (Pretty, 2012, p. 37-
52; UNDP, 2012). On the other hand, the very characteristics of food security have
taken on new dimensions. If prior to 2008, insecurity was either chronic, i.e. long-term
and persistent food security; or transitory, short-term inability to cope with food security
it now occurs under mixed patterns, repetitive and uncertain.

32
As the prevailing idea is to increase production by maintaining an affordable
price to keep pace with the increasing food demand within a short period of time, the
involvement of the private sector was perceived as the most appropriate way to tackle
the issues of food security. The long-term experiences in R&D as well as the potential
to enhance private investment are the strong leverage advocated by the GAFSP and the
New Alliance (Chambers et al., 2014, p. 64-65). Moreover, as land productivity has
always been low in SSA, the integration of the private sector was consequently believed
to enhance this capacity. In 2009, for instance, land productivity in value, accounted for
an average 239 US$ per hectare of agricultural land in the twelve countries (IFPRI,
2012) with an average yield of 1.35 tonnes per hectare (World Bank, 2013b).
Nevertheless, such process would require the control of the means of production either
by an overtaking of the farmland or the integration of the production system. Moreover,
SSA government capabilities to deliver public goods are very limited and as the time
factor is playing a crucial role in the adaptation process, delaying any actions to
improve agricultural productivity would afflict a disastrous consequence especially for
the poor people as shocks would be frequent and uncertain. Such additional difficulty
suggests that if African governments do not find the necessary and appropriate
resources to address these new challenges, any constraints or new burden on future
public expenditures would result inthe deterioration of the social welfare (Nelson et al.,
2010). The New Alliance for instance, is trying to embrace this context with three
guiding principles: i) mobilising private capital; ii) taking innovation to scale and iii)
managing risks. Points that are believed to get 50 million people out of chronic poverty
within the next ten years (White House, 2012, May 18). As of April 2013, 27 TNCs and
21 local companies across SSA have signed a letter of intent pledging an investment of
nearly $3 billion US (USAID, 2013).

33
With the heated debate propelled by some NGOs on the fact that the G8 project
is spreading land grabbing 4 (see: GRAIN, 2012), the value chain approach was
gradually introduced to defend the new policy, particularly for the companies involved
in the GAFSPand New Alliance.
The concept of value chain is defined as the process that involves different
activities brought together, from the design5 of a givenproduct(orservice), the different
phases of its production to the delivery to the final consumers. Gereffi and
Fernandez-Stark (2011) define global value chainas follows:
A value chain identifies the full range of activities that firms undertake to bring a
product or a service from its conception to its end use by final consumers. At each
step in the chain, value is added in some form or other. Driven by offshoring and
mounting interconnectedness, the activities that make up the value chain of many
products and services have become increasingly fragmented across the globe and
between firms. Various tasks along the production chain can be carried out in
distant locations, depending on the respective comparative advantages of different
countries. The interconnected production process that goods and services undergo
fromconception and design through production, marketing and distribution is often
referred to as a global value chain or an international production network. (Gereffi
& Fernandez-Stark, 2011 cited inAfDB, OECD, & UNDP, 2014, p. 124).
The definition given above is placing an important focus on the role of the
private sector, the main stakeholder in the GAFSP and New Alliance. Nonetheless, one
thing that is noticed about the two programmes is the fact that it regroups most of the
prominent TNCs specialised in banking, biotechnology, agricultural equipment,
4 Such event sparked a series of controversy about the global land deals giving rise to hostile tension in the host countries
5 Design can also embrace conception.

34
irrigation, insurance and food distribution. The interactions between the public and
private sectors within the framework of the two programmes can be regrouped under the
following segments highlighted in Figure 3: inputs, capital, equipment and irrigation,
distribution, risk management, and information.
Figure 3 - Illustration of the GAFSP and G8 New Alliance segments of value chain
Source: Author.
The segments under which the GAFSP and New Alliance are operating are presented as
follows:
Inputs one the one hand, a segment that brings into plays giants TNCs mainly
specialised in biotechnology companies such as DuPont, Monsanto, Syngenta
AG and United Phosphorus Limited and one the other hand, Yara, a company
specialised in fertiliser.
Capital involves private institutions such as the Rabobank, the investment
firm Armajaro, the IFC and public financial institution such as the AfDB. This
initiative is believed to give a new dimension to the long-
in agriculture in the region.

35
Equipment and irrigation a unit that regroups TNCs specialised in
agricultural equipment and irrigation such as AGCO, Jain Irrigation and
Netafirm.
Distribution a segment that involves giant corporations specialised in food
and beverages such as Diageo plc, SABMiller plc, and Unilever.
Risk management involving the Swiss RE specialised in reinsurance to
guaranty the investments.
Information - In addition to the risk packages, Vodafone a giant mobile
industry was also taking part of this consortium to offer new mobile services and
technology that might serve farmers.
Indisputably, the way these public and private sectors are organised
demonstrates the fact that for the GAFSP and New Alliance to be successfully carried
out within the next ten years, the twelve African countries targeted by the project would
have to experience a shift towards the market-
issue that poses critical debates is about the dimension and direction towards which the
transition is heading to as the notion of market- -
- -oriented agriculture. Hence, the major concerns with
regards to hu
would have on their agriculture, and the real beneficiaries of these transformations.
After a brief description of the institutional framework designed by the New Alliance,
the next section is addressing the question of why food security in SSA is falling into a
market-led paradigm.
2.3. market-
As mentioned in the previous section, there are two forms of agricultural transition that

36
are influencing - - -
oriented agriculture. One of the discourses in the New Alliance postulates on the fact
that the initiative would lift 50 million people out of chronic poverty an argumentation
that seeks to find its ground in the modernisation traditions with respect to the role that
agriculture plays in such process. Modernisation theory however failed to provide
clarifications regarding the process under which this transformation would take place. It
is within this gap that the proponent of the private sector draws their main arguments by
keeping the idea of transforming the economy of subsistence into a market-oriented
economy, yet governed by a very corporatist penchant. Two main arguments are
advanced here to explain the driving force of market-led food security: first, the
dynamic of the market and secondly, the incentives created by the New Alliance.
Revisiting the literature on the role of agriculture in development, Timmer (2009,
p. 5) underlines that from an historical perspective, with the exception of Singapore and
the
role of agriculture in development was established by Lewis (1954) who suggests that
developing countries are characterised by a dual economy composed by a low
productivity sector (agriculture) and a modern high-productivity sector (manufacturing,
service, etc.). Lewis proposes that under this form the role of agriculture is to supply
cheap foods and provide low wage labour in the modern sector. In addition, Johnston
and Mellor (1961) put forward the following direct linkages that highlight the role of
agriculture in development: supply of labour for the industry, supply of food for
domestic consumption, supply of savings for industrial investments, sources of foreign
currencies through the export of agricultural products, which allows the import of
intermediate and capital goods. To these direct linkages, Timmer (1995) emphasises

37
that the improvement of the agricultural sector indirectly enables the poor to have
access to better food, rich in nutrients, and at the same time it contributes to food
availability, price stabilisation and poverty reduction. In addition, various empirical
evidences support the contribution of agriculture to economic growth and poverty
reduction as stated in the previous chapter. Despite the reluctance and criticism on these
linkages for the African countries, other literature such as the World Bank (2007) and
Diao, Hazell and Thurlow (2010) argue that African countries cannot bypass agriculture
to transform their economy. Therefore, in line with the global belief that aims at
eradicating poverty, the New Alliance project found a solid background to channel its
effort in transforming African agriculture.
The context under which the role of agriculture is interpreted through these
different theories saw dimensional and directional shifts where market forces and
incentives are playing driving forces that influence the organisation of the production on
factors such as the supply and demand of food, the market information, the quality of
the products, geographical organisation of the production, and industrial conditions.
that determines the price of a given product (Dwivedi, 2009, p. 27). Over these last
years, the dynamics of the market forces saw a dramatic alteration within time and
space which explains the rising interest of the private sector, and particularly the TNCs
to invest in agrarian capitalism with a new dimension that embraces the developing
this section to explain the relations through which food is produced under a specific
form of hegemony. In this section, a special attention would be paid on the
neoliberal/corporate hegemony (McMichael, 2009b).

38
Seminal work of food regime was elaborated by Friedmann and McMichael
(1989) by the late 1980s, which interprets the process of agricultural development at
different periods with a specific institutional framework combined with a relevant
standards regarding the organisation of production, income distribution, exchange and
consumption to explain the functioning and reproduction of global capitalism (see also:
Atkins & Bowler, 2001; Holt Gimènez, 2011).
Albeit the different interpretations of the period in which food regime changes
the relations of production and consumption of food, McMichael (2009b) listed three
distinct periods. The first food regime (1870-1930s) was characterised by the cheap
food and raw materials hailing from the tropical and colonised countries to support
industrialisation in Europe. Such structure is marked by the development dynamics
stressing on the agriculture-industry nexus. The second regime (1950-1970) was
characterised by the spread of industrial agriculture marked by advances in research in
massive use of subsidies, fertiliser, pesticides, irrigation and agricultural machinery in
some countries in the global south. In the meantime, the surplus of food generated in
some industrialised countries like the United States, was also used to serve ideological
purposes, during which, food aid was used to fight against the rise of Communism (Holt
Gimènez, 2011). The third regime 1980-present, emerged from the global economic
crisis of the 1970s and 1980s, which was also marked by the advent of the neoliberal
agenda (McMichael, 2009b)
during the adjustment era in Africa which limited the progress in agricultural researches
and led to the suppression of several policies that support smallholders such as
agricultural extension and services (Chang, 2009). Additionally, the boom of the

39
supermarkets and the wave of globalisation gave more room for the commercial
agriculture to take control of the global food system.
Despite the increasing power of the corporate food industries during the third
regime, food problems in Africa remained unsettled over several decades. The corporate
regime rather enabled industrialised countries to generate a surplus over a long period.
Nonetheless, the market forces driven by the three crises of 2007-08 reversed these
trends. The rapid growth of the world population coupled with the pervasive effects of
climate change, the economic recession, thorny global energy policy and the
transformation in some emerging countries had a considerable impact on the global
production and consumption. The era of cheap food has reached its limit as described by
the magazine The Economist (2008, December 6), which stresses that food prices have
increased dramatically despite the fact that we still live in a period of abundance.
The supply and demand of food experienced major changes since the late 2007.
On the one hand, the emergence of a new middle class in countries like China and India
has boosted demand for meat, which production requires the use of more grain (3kg per
kilo of pork and 4-8kg per kilo of beef6). But the villain of the 2007-2008 food crises
was the rush to biofuel production supported by industrialised countries. Biofuel
production increased by 800 percent over 2004-2008 (McMichael, 2012a, p. 60-82). In
addition, since the ethanol has become more profitable than food production, producers
responded positively to the price signals. On the other hand, from the other side of the
equation, supply has been affected by climate change which reduced the capacity of net-
exporting countries to meet the market demands. The result of these market forces
triggered the change in land use and export restrictions causing the general malaise in
the rest of the world and particularly, for the net-importing countries.
6 See: The Economist (2014, January 18)

40
In addition to market forces, the New Alliance squared another signal by
incentivising the private sector via deregulations and important financial commitment to
agriculture and food security. As part of the declaration of Aquila the G8 pledged an
investment of 22 billion US$ (Dethier & Effenberger, 2012). Therefore, since 2008,
agriculture in itself has become a speculative investment and a safe haven to hedge
against the market risks (McMichael, 2012a, p. 60-82). As a matter of fact, the way
markets react since 2008, show that the soft commodity index was nearly behaving like
the hard ones. Figure 4 depicts this degree of high volatility of the agricultural index
among metals and minerals and crude oil.
Figure 4 - Hard and soft commodity index 1970-2015
Source: author, dataadapted fromthe World Bank (2015)
The linkages between incentives and market forces as part of the New Alliance
project have strengthened the targeting of African countries where agricultural
expansion is still possible. However, these countries have recorded weak governance
and limited financial capabilities a weak linkage that enables to channel international
41
investments and facilitate the overtaking of the private sector in the food system. The
incentives and market forces are not limited to TNCs they are also transposable to
African producers who might respond in the same way to the signals dictated by the
food industries. In this case, what African countries will produce will depend on the
incentives channelled from the upstream level. For that reason, food security which is
already fragile in the continent might be subdued to the two main drivers which in turn
-
2.4. The process of altered marginalisation
The second question this chapter is trying to answer is to what extent this new
modus operandi affects the way of life and the smallholders organisation of production
in a holistic manner. This section shifts the focus of analysis to the conditions related to
the changes that go along the new system based on this market-led food security in the
12 targeted countries. This section stresses on the discussions that put forth the degree
of control that SSA countries would have on their own food system as well as its impact
-based perspective. Seven points divided
in two groups are here used to discuss about this degree of control in the context of
market-led food security, namely: first, seeds, patents, genetic modification and
terminator; second, pesticides, trade and land use.
2.4.1. Seeds, patents, genetically modified seeds, and terminator
In recent years, seeds have become a very profitable business for the TNCs.
According to Madeley (2008, p. 28-29), 10 companies are actually controlling nearly
half of the global certified seed market, among which, companies such as DuPont,
Monsanto, Syngenta AG and United Phosphorus Limited, stakeholders of the New
Alliance are playing a key leading role. TNCs are selling their seeds as technical

42
packages which require its user to purchase other products such as pesticides and
fertilisers. Hence, the inherent risk for smallholders is here linked to such kind of
technical packages under an oligopolistic market conditions. Moreover, the technical
packages form a single unit that is protected by patents. The discourses that TNCs are
very often using with regards to patents lay on the fact that no company can run the risk
of investing in R&D without a guaranty to yield return on their investments. Therefore,
smallholders could lose the control of their own system of production and could become
increasingly dependent on the TNCs. The real danger in this process is the fact that
market-led leanings that is prevailing today may push some companies to speculate over
the future African agricultural produce, a process that would be developed in depth in
Chapter 3.
Furthermore, another topic that fuels heated debates is about crop adaptation that
relies on genetic engineering. The problem in the use of genetically modified products
(GM) is related to the choice of the product and the risks related to its use. Madeley
(2008, p. 29) explained that a wrong choice can ruin the genetic basis of all production,
making it impossible to plant another crop and thus endangering the livelihood of small
farmers. Moreover, Madeley added that coexistence of GM plants with other species is
almost impossible since there is a risk that the wind will carry these seeds to a long
distance up to another plot of land. Such an event has led to many legal disputes as the
agrochemical industries claimed that no matter the unintentional use of the GM, farmers
must pay royalties. From 1997 to date, for instance, Monsanto has recorded 145 legal
suits related to these disputes mentioned previously (Monsanto, n.d.). Furthermore,
another problem associated with GM seeds is about herbicide applications which can
kill other animal or vegetal species. Although African governments have always been
reluctant to the use of GM, the GAFSP and New Alliance projects are giving new

43
opportunities for TNCs to introduce and commercialise their products in SSA.
Nevertheless, the use of these types of seeds can engender political tensions between
African states insofar that invasive GM could reach and affect species in non-GM users.
The use of GM seeds is limited and cannot be re-used in the cultivation process.
Advances in genetic engineering enabled the agrochemical industries to terminate the
plant reproductive capacity. Farmers who are adopting such kind of techniques are
therefore subjugated in a long-term contract with the seed suppliers. Last but not least,
the effect of the GM on human organism remains unclear. Indeed, Seralini et al. (2012)7,
who conducted experiments using Monsanto GM maize to feed rats, found that GM
maize caused tumour to their experimental subjects. This gives rise to very critical
questions of food safety to human beings and therefore, presents an inherent risk to the
future African consumers, particularly in the 12 countries part of the GAFSP and G8
New Alliance.
2.4.2. Pesticides, trade and land use
The New Alliance is regrouping the most prominent TNCs specialised in pesticide
production such as DuPont, Monsanto and Syngenta. These three companies are among
the big six corporations controlling over 85 percent of the pesticide sales of
28.8 billion US$8 (ETC Group, 2008). TNCs are seeking to introduce a moderntype of
farming which will increase the use of fertiliser and other chemicals. To date a vast
array of literature is also dealing with the negative effects of pesticides in developing
countries such as the poisoning cases (see:World Bank, 2007), which can threaten the
7 The first article created a polemic among the academic community was retracted by the Journal Food and chemical toxicology and
republished by the Environmental Sciences Europe in 2014.
8 Data for the year 2007
44
sustainability of future food production. In addition, the same three TNCs part of the
New Alliance are controlling global maize seed markets, which accounts for 10.2
billion US$, nearly 42 percent of the world maize seed market (ETC Group, 2008). Not
only had the TNCs integrated the African production system through vertical integration,
but also expanded their business with other investments. Cargill, one of the giant food
and beverage corporations whose world market share represents about 26.5 billion
US$ in 2007, has for instance established its control over the cocoa processing in Cote
(ETC Group, 2008).
Barriers to trade and competition are among the main arguments supported by
the World Bank to explain the lack of performance in African agriculture. Five
obstacles were mainly highlighted by a World Bank report on Africa (World Bank,
2012b)9, namely:
Inputs of seeds, fertiliser and extension services;
High transportation cost;
Opaque and unpredictable trade policies that are curbing private sector
investments;
Relative risks when crossing borders;
And finally, inefficient distribution services.
The World Bank Group via its active role in the GAFSP is also playing an
influential role in African countries through the policy advocacy that matches with the
New Alliance targets. Similar points such as: facilitating private sector investment,
facilitating access to land for the local people and the private investors, removing trade
barriers are often occurring in the series of document describing the cooperation
9 nal trade in food

45
framework for the GAFSP recipient countries issued by the USAID (2013) and UK
Government (2013).
The GAFSP and New Alliance initiative are seeking to alter the land use and
distribution to acquire property rights in SSA. GRAIN (2012, p. 131-134) argues that
support for private investment was conditioned by the facilitation of land titling
programme so that private companies would be able to buy this right from the
smallholders. Since land plays an important role in the development of any agricultural
project, land titling was used to overcome the problems of land rights issue. The
Millennium Challenge Account, one of the US new schemes of foreign assistance was
aiming at easing land titling in many developing countries including SSA. The
Millenium Challenge Account program enables private companies to operate under
sound legal framework when acquiring property in the host countries (GRAIN, 2012, p.
135). Indeed, there is no guaranty that the smallholder once awarded a land title would
not sell this right with an appropriate incentive. This explains the rush in land titling
project, which takes different forms in various countries of SSA: facilitation of the
and Mozambique; or the use of base map to register individual land rights in Ethiopia
(Byamugisha, 2013, p. 2-3).
The new modus operandi towards agriculture is marginalising the African
smallholders in an altered manner: economic, social and political. Economic
marginalisation is mainly related to the dispossession of the sources of livelihood. The
way policies are gradually imbedded these recent years unveil some inconsistencies
with the main findings acknowledged by development institutions such as the World
Bank. On the paper, the WDR2008 underlines the importance of agriculture as a source
of livelihood and food security. This economic marginalisation closely relates to social

46
marginalisation as a result of the cycle of poverty trap, and which might transcend from
one generation to another one. Furthermore, economic and social discontents are not
only restricted to the way of life of the smallholders but also take a wider dimension
when political element is taken into consideration. Both governments and the
population are likely to be affected directly or indirectly due to the decreasing degree of
control over food. This declining degree of control is a potential source of political
instability and the social unrests. To this regards, according to the World Bank (2014a)
Food Price Watch report, 51 food riots associated with hunger occurred during the
period 2007-2014 due to price inflation and shortage of food supply.
Given the major stake brought forth by the new change in modus operandi in
agricultural development policy and food security, the rest of this chapter, will elaborate
on a few points that could be corrected through transformative and accompanying
policy, which, at the end of this thesis, will help to conceptualise the notion of capacity-
driven approach.
2.5. Centring population in policydesign
The previous sections focused on the impact of the market-led food security on
smallholders and the altered marginalisation that they are likely to experience under the
institutional framework of the GAFSP and New Alliance. In these processes, the PPP
and the value chain approaches gained a great popularity in recent years and were
incorporated into the new policies designed to promote agriculture and food security
through the private sector. Nonetheless, the adoption of the value chain approach is also
subject to strong criticism as its final purpose is not serving the interest of the
smallholders but rather that of the giant corporations in control of the food system.
Cotula (2013, p. 33) -

47
pushing TNCs to concentrate on commercial returns in processing and distribution. Lee,
Gereffi and Beauvais (2012) put forth that in a buyer-driven commodity chain, TNCs
are integrating a global sourcing network of smallholders. Therefore, producers
(smallholders in developing countries) are bound to the sophisticated requirements of
the buyers such as food standards. To comply with these requirements poor
smallholders would not have choices other than the integration into the TNCs value
chain which can provide the necessary items to maintain their activities. Furthermore,
the buyer-driven model is closely connected to markets which dictate trends and
preferences. Thus, countries that cannot keep pace with these trends can encounter a
severe shock when the network is shifted in other locations.
In addition, the main motive of the PPP mechanism remains vague, especially
governments and populations. Yescombe (2007, p. 2) pointed out that in international
development, PPP is referred to as joint government, aid agency and private sector
initiative. Populations are often called beneficiaries who are receiving the government
Easterly (2014, p. 13) who claims that the cause of poverty is due to the absence of
political and economic rights of the poor. Easterly explained that economic
development is viewed by donors and governments as a technical problem that can be
solved with technical solutions crafted on policy prescriptions which bypass the rights
of the poor (Easterly, 2014, p. 13). In the case of agricultural development and food
security in SSA, the new modus operandi
rights. The economic, social and political marginalisation as well as the constraints
associated with the new modes of production guided by markets, impose a burden to

48
smallholders and their freedom to cultivate what they want, when they want, commonly
The movement and the dynamics of the population is one of the factors that
make possible policy makers to understand the future mechanism of production in the
rural and urban area. Hence, centring population in policy is an essential component that
woul -
As mentioned in the introduction in Chapter 1, population is one of
the major problems that policies have to address in SSA. Indeed, rural and urban
population are both increasing at a very rapid pace in SSA. The proportion of people in
the urban and rural area is almost equal as depicted in the following graph.
Figure 5 - Demographic transition in SSA 1960-2010
Source: Author, datacompiled fromthe World Bank Development Indicator (World Bank, 2012a)
Figure 5 on the left side, shows that about 64 percent of the population is rural,
and this proportion is following a sharp declining trend, meaning that both rural and
urban agglomeration will home the same number of people in the future. As shown in
the right side of the same figure, the annual growth of rural populations accounted for
1960 1970 1980 1990 2000 2010Year
1960 1970 1980 1990 2000 2010Year

49
nearly 1.7 percent (World Bank, 2012a). Although indecline, this rate is still considered
very high since the ability of African governments to handle demographic pressures are
very limited.
African governments are facing two types of demographic pressures within the
rural and urban areas. Pressures in the rural area are characterised on the one hand by
the rapid growth of the population, and on the other hand, the decline in the share of
employment related to agriculture. In the urban area, population growth is growing
rapidly and is intensified by rapid urbanisation. As a result, due to the decline of
activities related to agriculture, rural populations are migrating to the urban
agglomeration. However, the transition from rural to urban areas is also creating
poverty and inequality. People who are migrating into the urban area are facing
difficulties to find adequate jobs to sustain their livelihood as the labour market is
highly competitive and very often requires skills and knowledge (AfDB, 2012). And
since the people from rural area, in most instances, do not have enough and appropriate
skills and knowledge, they are again trapped in the cycle of poverty.
Two major concepts are proposed in this chapter to address policy design
centring on population, namely: the productive capacity and the absorptive capacity.
These two concepts are organised according to the rural and urban world. This gives
rise to the notion of rural productive and absorptive capacity and the urban productive
and absorptive capacity.
The productive capacity is the ability of one sector of the economy to sustain
economic activity and employments. Nevertheless, even if jobs are created, it does not
translate into a perfect match with the supply of labour. Therefore, the ability of this
The
absorptive capacity, in the rural and urban area, is conditioned by a well-designed

50
modern sector, which can attract the surplus of labour when it is freed from farming
activities.
Figure 6 - Yield, land and share of employment in SSA
Source; Author, adapted from the World Development Indicator (World Bank, 2012a)
Notes: the upper graph depicts the surface of arable land under cereal production in million hectares inSSA between 1960 and 2012. During this period, the surface dedicated for cereal cultivation increasednearly fourfold its size in 1980. The lower graph, however, exhibits a stagnating yield, which indicatesdeclining land productivity in region across time. Moreover, the relation between land and yield forcereal exhibits a negligible positive correlation of 0.2643 implying that an increase of one unit incultivated surface is not followed by a significant increase of yield.
In the majority of SSA countries, the rural productive capacity is characterised
by a stagnating condition. Although the size of the land under cereal production has
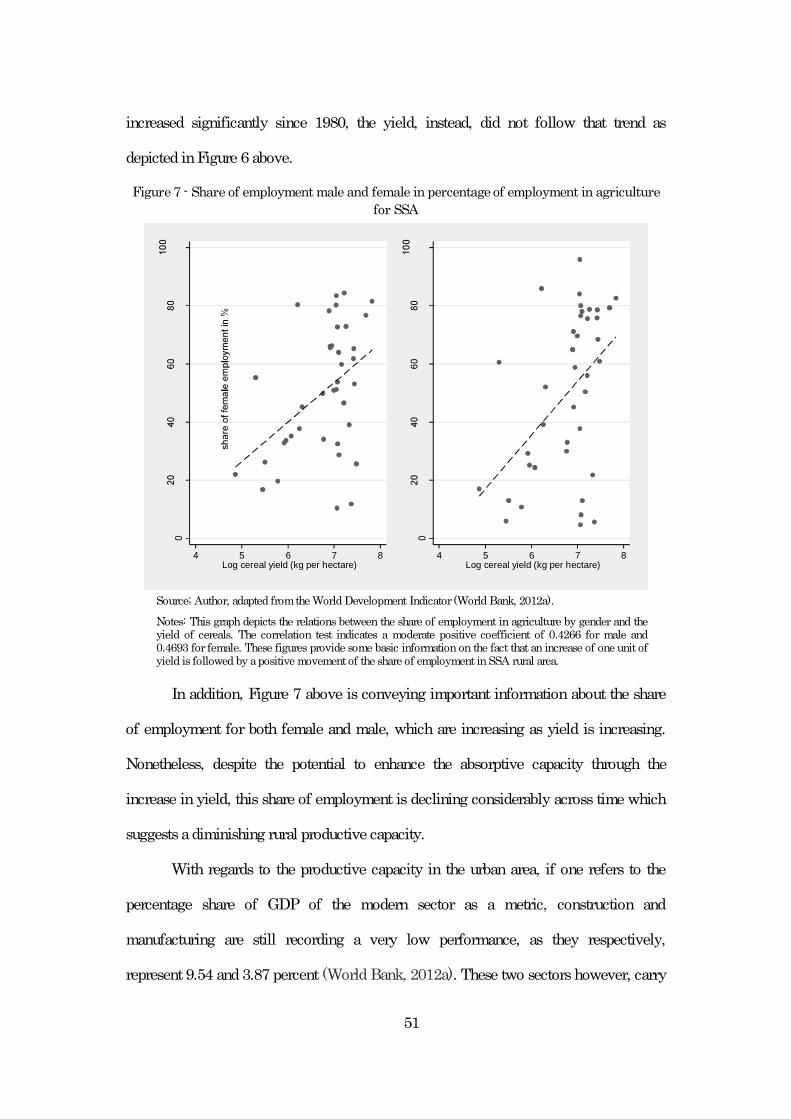
51
increased significantly since 1980, the yield, instead, did not follow that trend as
depicted inFigure 6 above.
Figure 7 - Share of employment male and female in percentage of employment in agriculturefor SSA
Source; Author, adapted from the World Development Indicator (World Bank, 2012a).
Notes: This graph depicts the relations between the share of employment in agriculture by gender and theyield of cereals. The correlation test indicates a moderate positive coefficient of 0.4266 for male and0.4693 for female. These figures provide some basic information on the fact that an increase of one unit ofyield is followed by a positive movement of the share of employment in SSA rural area.
In addition, Figure 7 above is conveying important information about the share
of employment for both female and male, which are increasing as yield is increasing.
Nonetheless, despite the potential to enhance the absorptive capacity through the
increase in yield, this share of employment is declining considerably across time which
suggests a diminishing rural productive capacity.
With regards to the productive capacity in the urban area, if one refers to the
percentage share of GDP of the modern sector as a metric, construction and
manufacturing are still recording a very low performance, as they respectively,
represent 9.54 and 3.87 percent (World Bank, 2012a). These two sectors however, carry
4 5 6 7 8Log cereal yield (kg per hectare)
4 5 6 7 8Log cereal yield (kg per hectare)

52
a huge potential of absorptive capacity. If properly developed with the right package of
policy, construction and light manufacturing can offer opportunities to create unskilled-
labour intensive activities (Loayza & Raddatz, 2010).
The absorptive capacity at the rural level can be addressed with the rural
nonfarm activities. In recent years, the importance of the rural nonfarm economy has
been gradually recognised as one of the ways to diversify the source of livelihood for
farmers in Africa. A wide range of literature indicates that, most of African farm
households are relying heavily on nonfarm activities to diversify their earnings (Barrett,
Reardon & Webb, 2001), which represents on average 45 percent of the share of SSA
(Reardon, 1997).
The lastelement that needs to be pointed out in this section is about poverty and
inequality among the two groups of countries subject of this study. One of the major
contrasts between the two groups is the pattern of inequality. Figure 8 provides an
overview of the evolution of the between the New Alliance and non-New Alliance
countries. The Gini coefficient in the New Alliance countries depicts an upward trend
whereas that of the non-New Alliance countries shows a declining tendency.

53
Figure 8 - Pattern of inequality in the Non-New Alliance and New Alliance countries 1980-2010
2a)
As of 2010, countries targeted by the New Alliance home about 353.41 million
people, of which about 105 million rural poor are estimated to live under the poverty
line of 1.25$ a day (IFAD, 2010). In view of these circumstances, SSA still needs a
comprehensive programme that supports not only agriculture but also the other sectors
of the economy that have a relatively significant absorptive capacity to address the
problem of poverty. The New Alliance programme for instance, aims at lifting 50
million people out of poverty over the next 10 years. Nevertheless, even if the
programme will be carried out successfully, with the rapid population growth, other
development programmes will be needed to embrace the rest of the population living
under the poverty line.
1980 1990 2000 2010Year
New Alliance
1980 1990 2000 2010Year
Non-New Alliance
0 perfect equality, 100 perfect inequality

54
Increasing the productive and the absorptive capacity both in urban and rural
area, is therefore, crucially needed, to avoid that 90 million people fall into another
2.6. Conclusion
This chapter attempted to answer the question why and how the changes in
modus operandi in agricultural development and food security policy, are affecting the
way of life of the smallholders in SSA. To this question, this chapter describes the
institutional framework of the GAFSP and G8 New Alliance programmes, and their
approach through the PPP and the concept of value chain.
The chapter highlighted the existing discourse on the need to scale-up
agriculture in SSA where theories of development are differently interpreted to channel
a transformation of a subsistence economy to a market-oriented economy, but yet
governed with a very corporatist leaning. Similarly, discussions drawn from the case of
the GAFSP and the New Alliance underline that the two models are marginalising their
targeted countries. The altered marginalisation would give rise to a weakening degree of
control of the African state on their food via the different clusters on which the
framework of the GAFSP and G8 stakeholders was constructed.
-
addressing the notions of productive capacity and absorptive capacity at the rural and
urban level. An important point can be drawn from this process, which takes the shape
of three arrows. The first arrow, with an upward movement, is indicating a positive
relation between land productivity and the share of employment in the rural area. The
second arrow is the straight type. It represents stagnating land productivity. The last

55
arrow, with a downward movement, is representing the decline of the share of
employment in agriculture over time. Those three arrows are conveying important
information about the direction and the dimension of the agricultural and food security
policy in SSA particularly, with regards to the structural transformation and the
intersectoral linkages that would be addressed in Chapter 4 and 5.
While the present chapter addressed the changes in the new modus operandi to
tackle poverty and food security with the market-led food security or pro-corporatist
approach, the following chapter will discuss whether this quest for food security
through the stabilisation of international markets and the interplay between
international, national and household level converge in a homogenous way to enable all
the food imports dependent countries to ensure their future food supply and their food
security

56
Chapter 3: The Trilemma of Agricultural Development and Food
Security in sub-Saharan Africa
3.1. Introduction
Since the price spike of the major grain commodities in 2008, global food security has
become an international issue whichhas engendered new policy challenges. Business as
usual is no longer a viable option and therefore, future policies will have to take into
consideration complex environmental conditions and sustainable use of the scarce
resources. In addition, these future policies should incorporate the increase of food
production, poverty reduction and social justice (Godfray et al. 2010; Rosin, Stock &
Campbell, 2013).
The food crisis of the recent years has been interpreted as a technical issue that
can be fixed with technical solutions. In other words, the disruption of food supply is a
phenomenon caused by market failure. Stabilising the international grain market has
therefore become another policy target followed by the international development
institutions. Policy makers from the positive analysis school advance that net food
import dependent countries can rely upon trade mechanism to ensure their future
supply. In addition, stabilising the grain markets would enable importing countries to
enjoy the benefit of a trickle-down effect where food security would transcend through
the global, national then to the household level.
Three main patterns of policy goals, then, emerged from this turnaround namely:
global, national and household food security. Pinstrup-Andersen (2009), explains that
global and national food security are focused on the supply side of the food equation,
often related to the availability of food. Global food security therefore encompasses the
accessibility of food within the international markets, while national food security

57
embraces the existence of enough production to meet the local food demand. Household
food security, as suggested by Pinstrup-Andersen (2009)
that deals with daily food intakes of an individual.
Such a multitude of responses matters for two main reasons. First, the three
multifaceted goals: global, national, and household food security are influencing and
dragging agricultural development policies in SSA. Second, if not properly conducted,
the effect of the failures would have a tremendous impact on the region insofar as 1.3
billion out of the 2 billion additional people that need to be fed by the middle of the
century will be hailing from an African country (Population Reference Bureau, 2013).
The purpose of this chapter is therefore to investigate and discuss the relations
between the global, national and household food security and their implications on
agricultural development policies in SSA. It seeks to understand whether such goals are
converging towards the same direction or diverging heterogeneously. Moreover, this
chapter will discuss the great divide between large versus small agriculture by
examining the ideologies and their extent to future policies related to agricultural
development and food security in SSA.
The chapter argues that the way these three goals are arranged today constitute
a trilemma which, consequently, have a significant impact on the ultimate goal of
combating hunger and eradicating poverty in the region for the coming years and that
the weakness of SSA countries to handle their own agricultural and food security
programmes is giving room the neoliberal/corporatist ideology to influence policy
making.
For this purpose, the chapter presents different cases that embrace each
dimension of food security and discusses the following elements: market, security and

58
poverty, stemming from the ideas presented in the previous chapter, alongside with the
ideological perspectives dominating the debate on the present issue.
The remainder of this chapter is organised as follows: the next section will
present the analytical framework and the scope of this chapter. The ensuing section will
elaborate on the main arguments that explain the existing trilemma between the three
goals. The third section will present the discussions on the implications of the
interactions of each food security goal. The last section will conclude the chapter and
draws some implications - .
3.2. Analytical framework and scope of the analysis
The political economy of agriculture and food security in the context of African
countries is influenced by different driving forces and interactions between international
institutions, governments and local population that animate policy making.
Accordingly, this section will begin to present the three patterns of the food security
within the scope of this analysis. Second, it highlights its linkages with agricultural
development. Third, it briefly presents the cases discussed in the chapter.
3.2.1. Food security in a broad sense and its three patterns
food s
analysis will be retained in this chapter:
Food security exists when all people, at all times, have physical and economic
access to sufficient, safe and nutritious food to meet their dietary needs and food
(FAO, 1996).
A household is considered food secure if it has the ability to acquire the food
needed by its members to be food secure. A distinction is frequently made between
59
transitory and permanent food insecurity, where the former describes periodic food
insecurity as for example, seasonal food insecurity, while the latter describes a
long- (Pinstrup-Andersen, 2009).
As these two definitions are too broad, three themes will be explored here to
guide the present analysis: availability, affordability and sustainability.
Food Availability is the first element of food security closely linked to
agricultural development. Availability embraces the physical existence of food at any
time and any places. Availability depends enormously on the proper functioning of all
the food chain process from the production, transportation, storage to the marketing.
Food Affordability availability
condition. Available food may not be always reasonably cheap enough for the people in
low-income countries where major share of the income is spent on food. Income matters
in food security, particularly if the country is a net food importer. Although SSA is
classified as an agriculture-based region (see: World Bank, 2007), most of its countries
have been net food importers since the 1980s.
Sustainability is closely related to the two previous elements, particularly when
national level could be fulfilled if a given country can manage properly its own food
system from the farm to the final consumers. Moreover, this condition could also be
satisfied at the household level if the individual in question has the adequate financial
resources to purchase food at the market price over the long run. When a country
becomes food secure, the surplus it generates also contributes to the global food
security.

60
3.2.2. The three patterns of food security and their approaches: market, security
and pro-poor
To fulfil the three conditions mentioned above, three approaches are today
dominating the policy making processes, as presented as follows:
Global food security through the market approach: The first pattern of
food security is located at the global level and aims at stabilising the supply
within the international markets. This approach takes into consideration the
fact that international trade mechanisms are the most effective tools to
achieve food security at all levels. Therefore, net food surplus countries can
trade with the net food importing ones, which in turn would achieve
national and household food security. This approach rests on the argument
that international market would provide higher quality food with lower
prices. This pattern is supposed to transcend through the global, national
and then household level. The advocates of this approach are mainly the
international institutions and TNCs.
National food security by achieving self-sufficiency (security approach):
Four categories of countries fall under this context: Group 1, resource-rich
and high-income countries; Group 2, non-oil resource-poor but high-income
countries; Group 3, oil-rich, resource-poor countries, the last category, and
main element of the present analysis, regroups the countries of SSA food
import dependent, rich in land but low-income economies. Although the
level of security differs significantly among the four categories, policy
options can be casted to one or the combination of the followings: increase
of productivity both in quantity and quality, outsourcing via the use of FDI
or bilateral agreements, trade and food aid. Two major narratives of food

61
security arise from this classification: on the one hand, SSA countries in
quest of self-sufficiency and on the other hand, the other three groups
motivated by resource-seeking.
Household food security via pro-poor approach: deals with the
smallholders or those who are engaged directly in the agricultural activities.
In developing countries, a great part of the produce is consumed by the
farmers themselves. Advocates of household based approach are constituted
by school of thought regrouped as agrarian populists, Marxists, anarchists,
environmentalists and feminists (see: Borras, 2008).
3.2.3. Some financial challenges to ensure food security
As introduced in the very beginning of this manuscript, based on different
estimates and scenarios, the world population is projected to reach 9 billion by 2050
(FAO, 2009). The FAO (2009) emphasised that to be able to feed the world population
by 2050, food production needs to increased 70-100 percent of its current level. Since
business as usual is not anymore a possible option, solutions to increase food production
will have to consider the effects of climate change, economic uncertainty, global energy
policy and the transformation in some emerging countries. The same report pointed out
that doubling food production will require an annual net investment of about 83 billion
US$ (FAO, 2009). Moreover, other experts who contributed to the report estimated an
indispensable cumulative investment of approximately 9.2 trillion US$ (in 2009 dollars)
over the period of 2007-2050 (Schmidhuber, Bruinsma & Boedeker, 2009). To mitigate
the effect of climate change Msangi, Tokgoz, Batka, and Rosegrant (2009) weighed up
the amount of required investments of 392 billion US$ for developing countries of
which 171 billion US$ in SSA, 78 billion US$ in South Asia, and 68 billion US$ in

62
Latin America. In addition, Ramasamy (2011) outlined four dimensions that would be
mainly affected by climate change: the availability of food from domestic production
and imports, access to resources to produce or buy food, the stability of food supply,
both ecological and macroeconomic, the use of food, including consumer preferences
and safety of food and water.
3.3. Market, security and pro-poor approach: the food security trilemma
This chapter critically analyses the three approaches to tackle food security:
market, security and pro-poor approach and then look at the ideological debates that
might influence policies. It draws its arguments from historical narratives over several
case-highlights. The view of SSA is here approached from a broad perspective based on
the similar characteristics that the countries in the region share with respect to challenge
of improving food security.
3.3.1. The market approach and the differences of mechanisms
The m
organisation of the economy. Although there are several forms of markets, this section
focuses on domestic and international markets. As mentioned earlier, the main
challenge of global food security is to ensure the availability of the supply at the
international level at an affordable price so that all net food importing countries are able
to enjoy the benefit of trade with more choices and better quality. However,
international incentives are mainly signalling the TNCs which consequently adopted a
resource-seeking behaviour by integrating and creating a monopoly within the global
food system. Additionally, the way food is exchanged within the international markets
gave room to speculations and made the grain market more volatile.

63
Linking the smallholders to markets and mainly to the international markets is
one of the strategies frequently advocated in the agricultural development policies of the
recent years, and this through the value chain approach. However, domestic markets
often do not exist or do not operate properly. Hence, during the last fifteen years,
development institutions and scholars have attempted to address the issue through the
concept of market-based approaches (MBAs). Accordingly, with the increasing demand
for food, the idea was taken up in the programmes such as the GAFSP and G8 New
Alliance through the PPP, joint government, aid agency and private sector initiatives
(Yescombe, 2007, p. 2) and the value chain, in order to establish linkages with the
international market. In agriculture, such approach takes place through three steps: 1)
the development of the private supply chain; 2) the development of the value chain; and
3) the transformation of traditional industries (Heierli, 2008).
The development of supply chain seeks to create products or services that
directly address the needs of the poor. The GAFSP and New Alliance are promoting
special packages such as seeds, finance, irrigation, agricultural machinery, information
technology and risk management that address these specific needs. For example,
Syngenta, the leading agribusiness corporation has invested in a project known as
Also,
as part of its expansion, the company announced the acquisition of two leading seed
developers in Zambia: MRI Seed Zambia Ltd and MRI Agro Ltd (Syngenta, 2013). In
the development of value chain, the GAFSP and New Alliance underscore the
importance of PPP which aims to link small farmers to the market. To this extent, the
MBAs are believed to contribute extensively to the improvement of rural livelihood and
enhance food security as agricultural products can be produced on a large-scale, with

64
higher quality and at a lower cost replicating the Lewis, Johnston-Mellor, and Timmer
linkages discussed inan earlier chapter.
The MBAs nevertheless leave many questions unanswered, particularly
regarding the linkages between poverty reduction and food security. Recalling the
importance of structural change in the goal pursued by SSA countries, the emergence of
the modern sector plays an important role in the process. Although the initiative is quite
recent, its effect on the 10 countries of the New Alliance for instance, appears to be
disproportionate taking into consideration the 220 companies and the 10 billion
US$ investment portfolio committed to this end (Ford, 2014). According to Ford
(2014), the US development authority claimed that the programme has created 650,000
jobs and would have benefited 5 million smallholders across the New Alliance
countries. It is however worth mentioning that these 10 countries account for about 476
million people (Ford, 2014) of which rural poor represents about 105 million10 (IFAD,
2010).
As a source of cheap food, international markets are likely to become unstable
due to the growing tendency of a monopolistic control of the markets coupled with the
speculative practices on the new financial instruments related to grain commodities.
Between2004 and 2008 for instance, in line with the financial crisis, the price of staple
crops peaked at 101.9 percent (Headey & Fan, 2008), this price increase lingered in the
subsequent years and picked to 130.06 in February 2011 (World Bank, 2015).
TNCs seek to secure their strategic position, devise strategic choice for the
future and then turn these strategies into actions (Johnson, Scholes, & Whittington,
2005, p. 15-16). To materialise these actions, TNCs use vertical integration and
different mode of entry such as exporting, joint venture, strategic licensing or FDI. The
10 Estimates of 2010, data compiled from the Rural Poverty Portal World Bank (2013)

65
branded seeds market for example, reflects how the New Alliance stakeholders are
materialising their strategic management. According to the ETC Group (2011), about 67
percent of the total market share was dominated by only 10 companies in 2007, of
which Monsanto, DuPont and Syngenta (top three leading companies and stakeholders
in the New Alliance) accounted respectively for 23, 15 and 9 percent of the proprietary
seed market, representing about $US10,278 million. Therefore, to keep this
oligopolistic position, and with the emergence of the new demand for food globally,
these companies seek to control the chain of production at the upstream level giving rise
to the recent massive investment in farmland in SSA.
Moreover, the mechanism, under which international markets operate,
particularly for the commodity markets where staple food is traded, is different from the
traditional type. Unlike the latter, commodity markets use financial instruments called
Chisholm (2004, p. 1)
Futures, forwards, swaps and
options are today the most used derivatives in the commodity transactions. Generally,
TNCs use derivatives to hedge against various risks such as changes in interest rates,
commodity prices, debts, or fluctuations of exchange rates. Monsanto for instance,
indicates that a 10 percent change incommodity prices might engender a negative effect
of $57 million loss in its financial instruments (USSEC, 2012). However, with the
spectacular progress in the financial world with an increasingly integrated and
globalised financial system, derivatives, in most instances, are circulating among
financial institutions as an instrument of speculations. As explained in the World
Development Movement reports (World Development Movement, 2010; 2013), due to
the financial crisis of 2008, financial institutions were speculating on food commodities.

66
In 2012, for instance, Goldman Sachs earned about 400 million US$ in 2012 from
speculations on food (World Development Movement, 2013).
Market-led agricultural development and food security therefore still show a
large difference in terms of market mechanism which does not bridge the local, global
and then national markets to capture the linkages to poverty reduction and food security
issues.
3.3.2. Security approach: human versus traditional security
National food security is an ultimate goal pursued by all countries in the world. This
aspect of food security is mainly focused on the improvement of the domestic
conditions by making food accessible at an affordable price. Global food security
therefore would be achieved when all the countries would be able to secure their own
food. Nevertheless, this also creates a conflicting situation among the four types of
countries cited above. With the recent global instability engendered by the price spike,
the dimension of security also saw a slight drift not only within the SSA countries, but
in the other resource-poor but financially rich economies. The interactions between
human security and traditional security will therefore be used as a tool of analysis in this
section.
The concept of human security and traditional security are entangled in a
complex relations guided by different interests and motivated by different purposes. At
the level of the SSA countries, human security prevails over national security, owing to
the fact that reducing poverty is likely to enhance food security and to this extent
provides more stability at the national level. Since the early 1990s, vast arrays of
literatures have beenburgeoning dealing wi
the benchmark of the UNDP Human Development Report (UNDP, 1994). The UNDP

67
key document emphasised that human security is focused on a concept called People-
Based Approach. Jahan (2006, p. 266-271) described other features of human security
such as: local, national or global issue, whose components are interdependent, and
whose solutions are often focused on early preventions 11. In line with such principle,
all initiatives related to human security conditions that menace
survival, the continuation of daily life and dignity of human beings (UNESCO cited in
Martin & Owen, 2010).
For the groups of countries (Group 1, 2 and 3), when related to food security,
traditional security is leading over the human security due to the differences in terms of
magnitude and exposure to various shocks such as price spike or supply disruption. As
part of the global governance, PPP approach influenced policies since 2008.
Nevertheless, these actions were not-free of interests. Countries in the three groups are
also facing uncertain and inherent risk relating to food insecurity today (Daniel, 2011, p.
27), which in turn gives rise to land and water grabbing as well as other forms of
appropriations.
Land grabbing or land acquisition demonstrates the enormous discrepancy
between collective and individual actions towards food security. The individual actions
of these three groups via their multinationals, sovereign wealth funds or state-owned
enterprises are demonstrating the resource-seeking behaviour aiming at stabilising their
food supply for the future. Despite the existence of common platform such as the
GAFSP and the New Alliance, individual countries are also independently
implementing their own programmes. Brazil, China, Japan and US, for example, are
11 distinctive element of human security is its focus on early prevention to minimize
the impacts of insecurity, to engender long-term solutions, and to build human capaci (UN,
2009)

68
part of the G20 which pioneered the GAFSP in 2009 at the summit of Pittsburgh.
However, US and Japan instead of supporting this initiative have created with the other
members of the G8 the New Alliance which is very comparable to the GAFSP.
development in Africa, the two countries are also competing to defend their own
interests (Scoones, Cabral, & Tugendhat, 2013).
Hence, as countries are pursuing a security-led policies (human and national),
such self-centred policies give rise to a conflicting interests among SSA and other
countries. Under such situation, the pursuit of national food security for rich countries
could affect the national food security in SSA to the extent of household and global
food insecurity.
3.3.3. Pro-poor approach
By the 1990s, a new concept had emerged with an idea centred on the poor, more
- Nallari and Griffith (2011, p. 70) explains that
pro-
added more technical explanations as a result of literature studies, and retained two
major definitions presented as follows:
The first focuses on whether the distributional shifts accompanying growth favour
the poor that is, whether poverty falls in response to growth by more than it
would have if all incomes had grown at the same rate. The second focuses on
whether economic growth benefits poor people in absolute terms, as reflected by
changes in an appropriate measure of poverty. (Nallari & Griffith, 2011, p. 70).

69
A pro-poor agricultural growth is concentrated on the development of small and
medium sized farms. A thematic issue on pro-poor growth in agriculture conducted by
the OECD (2006) explains that the increase of the incomes of the poor stimulates the
demand for consumer goods and services which in turn boosts the economy and
produces a positive effect on poverty reduction. Household food security is expected to
transcend through the national and global level.
Pro-poor growth in the agricultural sector focuses on the transformation of the
economy and rural diversification (Timmer, 2005). Timmer explains that this process
follows two steps: first, diversifications marked by a shift from the grain production to
high-value commodities, and second, a step that links and shifts the base of economic
growth from agriculture to the modern sectors. However, such shift depends on
population density and the quality of human capital.
Rural diversification implies the reallocation of production resources such as
land, which remains a major issue in African agriculture. Indeed, producing high-valued
commodities requires an adoption of new techniques of cultivation and technology
upgrading if one wants to improve land productivity while meeting the demand in cash
crops. However, the size of land matters as the average holding in SSA is less than two
hectares (Lowder, Skoet & Singh, 2014). Hence, market and security are two inherent
risks impending on the linkages between pro-poor approaches, both of which are related
to land issues.
Smallholders are facing a trade-off between income and food security under the
scenario of diversification. Smallholder type of farming contributes directly to
household food security as the farm products are partly auto-consumed. Therefore,
choosing diversification implies that rural household income will only depend on the
marketing of high-value commodities, whose gains will be used to purchase food and

70
other goods. Nonetheless, , and the degree
of exposure to diverse types of risk, such as crop loss due to climate change or
increasing barriers to trade with respect to standards and regulations African
smallholders might lose the source of income and food.
In addition, diversification affects national food security as land for food
production is diverted to other purposes. Most of the countries in SSA are today food
import dependent. To meet food demand, SSA countries compensate their local
production with imports. Diversification might induce changes in land use12 depending
on market trends, and have as a consequence the decline of the local crop production.
Therefore, decline in grain production might have huge effect on the food bill if the
exchange value of the high-value commodity does not offset the food imports.
Given the condition of agriculture and food security in SSA, a theoretical
approach based on a poverty-led initiative still shows a theoretical gap in terms of
capturing the linkages between markets and security. It further fails to address
transitions through national and global food security.
3.4. Discussions
The previous sections underlined the complexity of achieving food security in a broad
manner, i.e. at a global, national and household level. Such complexity was referred to
as to the trilemma of agricultural development and food security brought forth by the
impossible trinity of markets, security and poverty. The remainder of this chapter will
reflect discussions on food security elements towards SSA. These discussion points will
look at food availability and the limits of interventions as well as food affordability. The
12 Land use change could be land for food production to biofuel or land for food crops to non-food crops. See: Borras and Franco
(2012).

71
final point of discussions will focus on the polarised debate on large versus small
agriculture and the influences that ideologies have on the trajectory of policy in SSA.
3.4.1. Food availability: the limits of interventions of SSA countries
Today, according to the FAO (2002), there is enough food to feed the global population
considering the fact that the world produces more food than it consumes. According to
this organisation, the current production could meet a dietary intake of 2,720 kcal per
day per person for the entire population in the world (FAO, 2002).
However, even if this statistics seems to be promising, it does not reflect the
conditions at the regional level, particularly the region of SSA. The FAO (2013) annual
report on the State of Food Insecurityshowed that the regionrecorded a high prevalence
of malnourished people, with a proportion of one to four people of the total population.
The same report emphasised that such occurrence is mainly due to social, political and
institutional conflicts coupled with a precarious condition of the soil and physical
environmentwhich represent a barrier for sustainable agricultural activities.
Political and social instability is, for instance, one of the major barriers to stable
agricultural development as agriculture requires a considerable time to be sustained,
from sowing to the harvest period. Increase in food prices leads to national insecurity.
Fluctuation within the international markets between 2008 and 2011, strongly affected
the capacity of net food importing poor countries to smoothen the price shock on their
domestic markets, causing waves of violent protests and serious impact on the
economy. A report released by the World Bank (2014a) for instance, reported that 51
food riots against hunger occurred during the period 2007-2014. This research
categorised two types of food riots: Type 1 related to movement motivated by food
price inflation and generally directed towards the government and other public

72
authorities and Type 2 includes riots that usually arise in response to severe shortages
of food supply (World Bank, 2014a).
In addition to the social and political unrests, most of the African countries have
failed to strengthen public policies intended to promote agriculture. As mentioned in
Chapter 1, the failure to realise the Maputo Declaration of 2003 demonstrates a clear
standing with respect to the initiative to invest in the sector. The declaration aimed at
increasing public expenditure in agriculture up to 10 percent of the GDP and an annual
agricultural growth of 6 percent by 2008 (NEPAD, 2003). However, according to the
Regional Strategic Analysis and Knowledge Support System (ReSAKSS, 2013), the
overall expenditure of African governments to agriculture saw a considerable increase,
from 0.39 billion $US in 2003 to 0.66 billion $US in 2010. Nonetheless, on the overall,
only 13 countries out of the 54 members of the AU, managed to reach this target.
Since 2012, the EIU has compiled data and scores from 0-100 (not available to
totally available) relative to the global food security. One of its indicators is
f
sufficiency of the national food supply, the risk of supply disruption, national capacity
to disseminate food and research efforts to expand agricultural output (EIU, 2014). The
assessment is built on comprehensive indicators: sufficiency of supply, public
expenditure on agricultural R&D, agricultural infrastructure, volatility of agricultural
production, political instability, corruption, urban absorption capacity, and food loss.
scored on average 37.7 out of 100 (EIU, 2014).
3.4.2. Food affordability
Dependency on foreign markets makes SSA countries vulnerable to price volatility. To

73
avoid any shocks, governments must allocate significant subsidies to smooth social and
political risks. However, this cannot be always sustained, as the capacity of
governments to manage their risk portfolio could be overwhelmed and end up in
escalating tension as it was the case in 2007-2008.
Similar to the availability indicator, the SSA region is also scoring low: 27 out
of 100 with respect to food affordability (EIU, 2014). The EIU methodology indicated
shocks and the presence of programmes and policies to support clients when shocks
consumption of food as a share of
household expenditure, proportion of population below the poverty line, GDP per
capita, agricultural import tariffs, access to finance for farmers and the presence safety
net programmes (EIU, 2014).
Thus far, this chapter has unveiled the trilemma between agricultural
development and food security policies at three levels: global, national and household.
The ensuing sections will discuss the ideologies directly and indirectly influencing
agriculture and food security towards SSA.
3.4.3. Ideological debates and the influences on policy making
As the debate on contemporary agricultural development policy is diverse, and is
interpreted through different perspectives, highlighting discussions about ideologies and
their attributes is also an essential step to understand their linkages to policy making.
First, epistemologically, ideology is defined as the study of ideas. Definition in the
dictionary describes a system of general ideas constituting a body of
philosophical and political doctrine based on individual or collective behaviour
(Advanced Oxford Learner's Dictionary, 2015). Ball, Dagger and O'Neil (2014, p. 4-5),

74
put it in a simple way, conceptualising it
More precisely, ideology performs four functions: explanatory, evaluative,
indicative and programmatic. First, it gives explanations on why economic, political and
social conditions are as they are, especially during the time of crisis. Its second function
is to provide a standards and norms that allow people to evaluate and judge economic,
political and social conditions and therefore, distinguish things from what is right or
wrong. Ideolog third attribute is to give a sense of orientation and identity13, and
finally, it provides a political agenda which tells about what to do and how to do it, and
translated into a prescriptive function with comprehensive economic, political and
social actions (Ball, Dagger, & O'Neil, 2014, p. 5-6).
a. Neoliberal/corporatistapproach to agriculture
Today, there is an amalgam of literatures that deals with neoliberalismreferring
to this ideology as a set of policy that puts particular focus on economic liberalisation,
privatisation, free trade, deregulation, market liberalisation, reduction of government
interventions in the economy to give room for the private sector. Neoliberal proponents
argue -
which is a policy focused on the private sector. To this extent continuous increases in
productivity will therefore lead to growth and will in turn have an effect on poverty
(Harvey, 2005, p. 64; Jilberto, 2004; Stiglitz, 2012). As a political agenda, Steger and
Roy (2010) illustrate the deregulation-liberalisation-privatisationformula.
13 Ball, Daggerand O'Neil (2014, p.6) An ideology supplies its adherent with an
orientation and a sense of identity of who he or she is, the group (race, nation, sex, and so on) to which he or she belongs, and
how he or she is related to the rest of the world.

75
If the objective is to raise agricultural productivity, for the proponent of the
neoliberal/corporatist agricultural development, the use of biotechnology, massive
investment in irrigation and mechanisation is the way forward to address the African
issue (Smith, 2010). As core competences, the neoliberal/corporatist agricultural
development and food security approach is structured on interrelated segments namely:
finance, technology, distribution, risk and information. Finance segment plays a pivotal
role to get agriculture moving in SSA and represents a remedy to the underinvestment
in the sector. Banks and private institutions are now at the forefront of this segment,
especially for the case of IFC and Rabobank. TNCs also possess innovative
technologies to meet the challenge of agriculture, such as: GM seeds, farm equipment,
machinery, fertilisers, pesticides, and irrigation systems. Moreover, agro-industry and
major retailing firms also have a strong distribution network implanted in the various
targeted countries. In addition, with the recent development in the mobile industries in
SSA, ICT can now be used to disseminate information effectively. Finally, the security
of the investments can be achieved in two ways through the risk and information
segment in which the IFC and insurance company such as Swiss RE are playing a
fundamental role.
However, such kind of approach is confronted withsome obstacles. Internal and
external political barriers are the most challenging issues to implement the neoliberal
agenda. Internal political obstacles can be reflected by the fragility of the political
institutions and the lack of capacity of government to smooth social unrest with respect
to land use management and the policies it embraces. In many instances, the large-scale
type of farming involves the use of a huge surface of cultivated area which translates
into an appropriation of the smallholders land described by the peasant movement as
ld therefore be

76
addressed in the structural transformation strategies. The external political obstacle
could result from the altercations between different actors that privilege the power of
market-oriented food security. Indeed, countries like China and India are now playing a
major role in global governance alongside with their peers within the BRICS forum.
These latter are today seeking to strengthen their relations with African countries
through the South-South cooperation and offer alternatives to carry out the African
agricultural development. However, as these countries cited earlier are pursuing
different objectives, their actions could be an element of discord with respect to policy
outcomes.
Within the coming years, SSA countries could then expect more supports from
the international public institutions with regards to the development of infrastructures,
irrigation facilities on the one hand, and a more integrated rural development project in
which TNCs could intervene through the use of improved seeds, fertiliser, pesticides
and various agricultural equipment on the other hand. Likewise, a dynamic lobby to
deregulate the agricultural sector and to promote free trade is likely to continue to
influence future policies in SSA particularly from the community of donors on their
policy recommendations and programmes. In addition, a vast land titling program to
secure private land property is likely to occur as a stage in the appropriation to create in
a second stage a land market where international investors can buy land rights.
b. The nature of movements: small-scale approach
Neoliberalism and the corporate agro-industry political agenda face major
neoliberal/corporatist ideology which is influenced by the discipline of mainstream
economics, the agrarian movements are rather influenced by the disciplines of sociology

77
(Borras et al., 2008, p.
1).
same beliefs and cause. The peasant or agrarian movement explains that neoliberalism
has completely transformed the dynamics of agricultural production and gave rise to a
wide disparity between the North South Relations (Borras et al., 2008, p. 1). In
addition, it stresses the fact that globalisation and the neoliberal political agenda have
undermined rural agrarian society through restructuring that privilege the private sector
represented by a minority of powerful multinationals, agro-industry and agribusinesses
whose actions makes the poor poorerBorras et al. (2008, p. 76).
As an alternative political agenda, the agrarian movements are advocating the
. The concept was defined in the declaration of Nyéléni of
2007 as follows:
to healthy and culturally appropriate food produced through
ecologically sound and sustainable methods and their right to define their own food
and agriculture systems. (Via Campesina, 2007).
Holt-Giménez (2009) emphasised that the concept of food sovereignty
embraces higher targets than the food security : the former highlights the
food system. Food sovereignty stands against all forms of idea that seeks to speculate or
to make profits or simply, the 'commodification' of food. In this scenario, the control of
the food system should always be under the control of those who are at the base of the
pyramid and excludes a market approach to agriculture, particularly one that bypasses
the circuit of local, regional and national levels. Such approach puts more emphasis on

78
people, on those who are producing the food, namely, the local farmers. It also seeks to
build knowledge and skills at the local level and more importantly, it promotes agro-
ecology to preserve the environment.
3.5. Conclusion
This chapter discusses the relations between food security at the international,
national and household level and tried to analyse whether these three elements are
moving in the same direction or in different paths. The chapter assesses whether the
recent policies promoted by the international institutions, with the private sector, can
match with their goals to connect the African smallholders to markets.
The arguments and cases presented here show that the three dimensions of food
security carry many significant differences among, within and across the three goals:
market, security and poverty making it a trilemma. At the global level, arguments
mainly discuss the discrepancy on the tendency of the market approach to create more
instability due to the strategic management pursued by the TNCs and the speculative
practices made possible by an advanced market mechanism. At the national level,
driven by security, discussions are related to the human versus the national interest
conundrum. Such discussions highlighted that the quest for food security is first and
foremost serving national interest, both for the resource-seeking countries as well as the
SSA economies. Lastly, household food security or pro-poor approach presented
complex conditions to really capture food security ina broad sense due to the constraint
and the limitation of the productive and absorptive capacity, as introduced in the earlier
chapter.
Furthermore, while bridging the discussions to the notion of food security, the
capacity of SSA countries to ensure availability and affordability are still weak. Such

79
weakness is giving more room for the market approach food security to influence
agricultural development policies. Since policy cannot be separated from ideological
debates, especially when international institutions and African governments are brought
into play, issues related to the size and the style of the reforms intended to be carried out
in the continent, are dividing the neoliberal and the transnational movements. Thus far,
the ideas presented by each camp failed to offer a clear and sound solution when
centring the population in policy design as their approach are either too utopic or too
technical. Nonetheless, when assessing the core competences of each camps to address
the issues of agricultural development and food security in the region, the resources-
seeking type of policies are likely to lead the way in SSA.
The two previous chapters looked closely at the change of the modus operandi
in agriculture and food security policy and offered critical arguments towards the
narratives presented by international institutions to promote development and tackle
food security. The introduction of the agriculture in the development and the quest for
the stabilisation of the grain markets were at the centre of that inquiry. In this process,
SSA was tagged as an agricultural-based economy, a conceptual approach that fuelled a
wrong signal to policy makers as investments are going massively into agriculture,
without an accompanying policy that seeks to establish the linkages that enhance the
productive and the absorptive capacity in rural and urban area.
Hence, examining the World Bank approach, categorising SSA as agriculture-
based economy and identifying the sectors with potential productive and absorptive
capacity through the concept of structural transformation and intersectoral linkages, will
therefore, be the object of the next chapter. Thus far, if the analytical framework was
arranged under agency and structuralism perspectives, the ensuing chapter will examine
this inquiry through the lens of the positive analysis school.

80
Chapter 4: Differences in Intersectoral Linkages and its
Implications for sub-Saharan Africa: Evidences fromthe orbit
analysis
4.1. Introduction
The relations between agriculture and other sectors of the economy known as
ve been widely studied in development literature, particularly
in economic discipline. However, with the progress of the empirical studies on
economic growth of the recent decades, the scholarship regarding this topic has
gradually lost its momentum until the publication of the World Bank WDR2008, with a
focus on the role of agriculture in development presented briefly in Chapter 1.
With the challenges of feeding the world population by the mid of this century,
recent development policies are advocating that SSA should seek to increase its
agricultural productivity and take advantage of this opportunity to address the issues of
poverty and food security, a policy recommendation that has been addressed via the
PPP and value chain approaches as presented in the previous chapters. Moreover, such
advocacy is defended by the idea that agriculture can reduce poverty three to four times
higher compared to the other industries. In this regards, the WDR2008 classifies the
region of SSA as an griculture-based economy (see: World Bank, 2007). Such
categorisation is, in many instances, based on the share of GDP and employment. The
World Bank report stated:
Agriculture is a major source of growth, accounting for 32 percent of GDP growth
on average mainly because agriculture is a large share of GDP and most of the
poor are in rural areas (70 percent). This group of countries has 417 million rural

81
inhabitants, mainly in Sub-Saharan countries. Eighty-two percent of the rural Sub-
Saharan population lives in agriculture-based countries. (World Bank 2007, p. 4).
The African economy is however at a different stage of its development path. The
dynamics of other industries such as mining, manufacturing, transportation or ICT
industries are today playing an important role alongside with agriculture with respect to
-
economy will have enormous implications for development support and policy making
in the region.
Theories of intersectoral linkages are often associated with the concept of
structural transformationand its effecton the other sectors of the economy historically
characterised by a decline in the share of agriculture in percentage of GDP and
employment related to farm activities, accompanied by a demographic transition from
the rural to the urban area (Timmer, 2009, p. 4). A comprehensive review of literature
on these linkages are covered by Barrett, Carter and Timmer (2010) as well as Dethier
and Effenberger (2012), underlining various topics of the role of agriculture in
economic development and poverty reduction.
Three major interrelated connections therefore stem from this topic. Firstly,
early development literature pioneered by Lewis (1954), extended by the work of Ranis
and Fei (1961) as well as Jorgenson (1961) put forth the transition through a dual-sector
model. As argued by Chenery, Syrquin and Elkington (1975), lately revisited by Zhao
and Zhang (2009), transfer of low productivity labour from the rural to the urban area is
the major source of growth. Second, on this form of transition, Johnston and Mellor
(1961), underline the relations between the urban and rural economy through the
linkages such as: supply of labour for the industry, supply of food for domestic
consumption, supply of savings for industrial investments, sources of foreign currencies

82
through the export of agricultural products, which allows the import of intermediate and
capital goods. The third linkages look at the elements bridging the two previous worlds
through the examination of the relations between rural and non-rural farm economy,
extensively studied by Haggblade, Hazell, and Reardon (2007) and briefly discussed in
Chapter 2, on policies to enhance rural absorptive capacity.
As recommended by Sachs (2005, p. 50):
good differential diagnosis of the specific factors that have shaped the economic
conditions of a nation . It is therefore important to capture the dynamics of each sector
to address new policy making with regards to agriculture in the region. Hence, the
objectives of this chapter are, firstly, to discuss whether the percentage share of GDP
and the share of the population engaged in the rural area, justify the so-called
- categorisation. This objective takes into consideration the context in
the region with respect to the dynamics of the other industries and the fact that SSA
already shifted to another stage of development with the missing linkages in agriculture.
Secondly, to identify the leading sectors in SSA economies, where the productive and
absorptive capacity is higher that can be connected to the missing agricultural linkages
as proposed by the recent neoliberal/corporatist agricultural development and food
security policies.
To avoid the empirical hunch, the chapter uses the method of orbit analysis as an
alternative to inferential statistics on the GDP sectoral decomposition of the value added
aggregate for the region, for the period 1970-2012. It is argued that SSA has already
shifted from being an agriculture-based economy and therefore, agricultural
development strategies should seek to embrace the dynamics of the other sectors as they
are likely to exert influential policy leverage in decision making.

83
The remainder of this chapter is organised as follows: the next section describes
the methods, the principle of calculation of orbit analysis and the data specifications.
The third section reports the results. Section four discusses the policy implications of
the findings. Section five concludes.
4.2. Method, data and specifications
The orbit analysis, a method developed by Itaki (2014), is a statistical technique
-
time series. The method offers a wide range of analytical perspectives, particularly for
smaller and larger data which may not apply to the regression analysis subject to
various conditions to be valid.
Some example of a very primitive form of orbit analysis is for instance used by
Cairo (2013, p. xix) to illustrates the relationship between the GINI index versus the
GDP in Brazil in 1980-2011 under different presidencies. The result of this study
indicates that across time inequality was falling while the GDP was increasing,
particularly under President Lula. Parlapiano and Giratikanon (2013) use an orbit chart
to represent the long run analysis of inflation and unemployment in the US. Vucevic
and Yaddow (2012, p. 64-67) point out
disastrous campaign in Russia in 1812-1813. In agriculture, the WDR2008 also uses
similar chart to show the declining share of agricultural employment while agricultural
GDP increases (World Bank, 2007, p. 28). Similar graphics are also used by De Janvry
and Sadoulet (2010) and the CFS (2013).
In econometric analyses, very often a large set of data is required to ensure
reliable results. These regression results are sensitive to the model specification.
Freedman (2009) explains that statistical procedure is often defended on the basis of its

84
asymptotic property when the sample is large. Moreover, econometric estimations are
subject to rigorous assumptions such as: linearity of the parameter, statistical
independence, homoscedasticity and normality of the error distribution (see: Mamingi
2005, p. 39). In case of violation of these assumptions, econometricians are correcting
their estimation techniques by transforming the data until the assumption is exhibiting
acceptable results.
This transformation matters insofar the data might lose their real meaning, but
more importantly, wrong estimation method or biased model may lead to a spurious
empirical results. One example that illustrates the problem of econometric analysis
often cited in academic literature is the so-
fact that decisions of economic agents vary systematically with changes in policy,
which implies that regression coefficients, usually invariant, would not be the best
predictor in case of policy changes (Ljungqvist, 2008). Although new techniques have
been developed to deal with the estimation problems this approach does not exclude the
possibility of errors during the statistical procedures.
Thus, this chapter takes a different approach to handle economic data with the
method of orbit analysis. This technique seeks to explain to the most accurate way the
interactions of the studied variables without major transformations, particularly in the
case of the presence of heteroscedasticity. It also seeks to interpret analytical
information from the outliers. One important principle in orbit analysis is the
assumpti
Additionally, the size of the observation and the goodness-of-fit do not matter
for the orbit analysis, to this regards Itaki (2014) explains:
ognise all points as a whole at one time, but rather,
traces them along time, if they are time series data, and attempts to extract certain

85
statistical information out of the rotation of an orbit that the points linked together
depict. It is not a high correlation coefficient or determination coefficient that
convey an important statistical meaning to observers. (Itaki, 2014).
ing changes in other
Although the power of traction exerted by a leading variable might be weak, its
cumulative effect (or resultant force effect) would be massive and could tract large
variables one after another.
4.2.1. Principle of calculation and patterns of the direction of orbit
According to Itaki (2014), in principle, a minimum of three points is needed to calculate
the direction of orbit rotation. The calculation is based on the parallel transport of
triangle formed by the three points. The inverse tangent is then used to calculate the
degree of the newly formed angle. If the angle is between 0 and in radians (i.e.
between 0 and 180 in degrees), the rotation is anticlockwise; if the angle is between 0
and - in radians (i.e. between 0 and -180 in degrees), the rotation is clockwise (Itaki,
2014). Six patterns therefore can be observed from this process:
Positive correlation and an anticlockwise rotation (x leading, y following);
Positive correlation and a clockwise rotation (y leading, xfollowing);
Negative correlation and a clockwise rotation (x leading, y following);
Negative correlation and an anticlockwise rotation (y leading, x following);
An anticlockwise circular movement;
A clockwise circular movement.

86
In practice, the direction and rotation of the variables are analysed with the help
of a pre-programmed spreadsheet showing both the rotation in radians and in degrees as
ading-
format programmed by Itaki (2014). The result of this step reveals over the long run the
ranking position occupied by each variables subject of this study. It also shows the 5-,
7- and 9-year moving average of this ranking. Given the medium-term variation of the
data, Itaki (2014) recommends the use of the 9-yearmoving average out of the 5 and 7.
4.2.2. Data and specifications
The data were retrieved from the UN national accounts main aggregates current $US.
Two types of data are then extracted for the purpose of this study. First, time series data
with 42 observations from 1970 to 2012. Second, a cross-sectional data of 1970-2013
composed of 1672 observations regarding the economic sectors of the 38 countries of
SSA. The collected data are for the following variables: agriculture, hunting, forestry,
fishing (ISIC A-B), mining, manufacturing, utilities (ISIC C-E), manufacturing (ISIC-
D), construction (ISIC-F), wholesale, retail trade, restaurants and hotels (ISIC G-H),
transport, storage and communication (ISIC-I), and other activities (ISIC J-P).
The following identity formalises the model explored in this chapter:
(1)
Where:
GDP is Gross Domestic Product and value added is the sum of the value added
of each sector described in detail in the preceding paragraph.

87
The variables are computed using an Excel spreadsheet designed by Itaki
(2014)14. Furthermore, the initial form of orbit analysis applies to two or multiple
variables if they are time series but not to a panel data. To construct a cross-sectional
data, first, orbit analysis is replicated individually for each country and then, the results
of this process are compiled together to construct a new dataset treated with STATA®.
The cross-sectional data take the form: where i is the individual
dimension and t is the time dimension. A series of descriptive and graphical analysis are
conducted with the new dataset in order to highlight the dynamics of the GDP
aggregates, and to draw implications for policy discussions.
For the res
agriculture, hunting, forestry, and fishing (ISIC A-
(ISIC- -
restaurants and hotels (ISIC G-
(ISIC-I).
4.3. Results
This section reports the different ways in which economic sectors are presented. It
begins with the common representation of an economy based on the percentage share of
GDP. The second part of the section presents the output results of the computation from
orbit analysis as it is depicted in the Excel spreadsheet. The last part will focus on the
results of the sector-to-sector analysis with respect to agriculture and other industries.
14 The materials used for the computation of the data are detailed in Itaki (2014). Orbit analysis of leading following relations among
multiple variables. Ritsumeikan Kokusai Kenkyu, 27, 1-34.
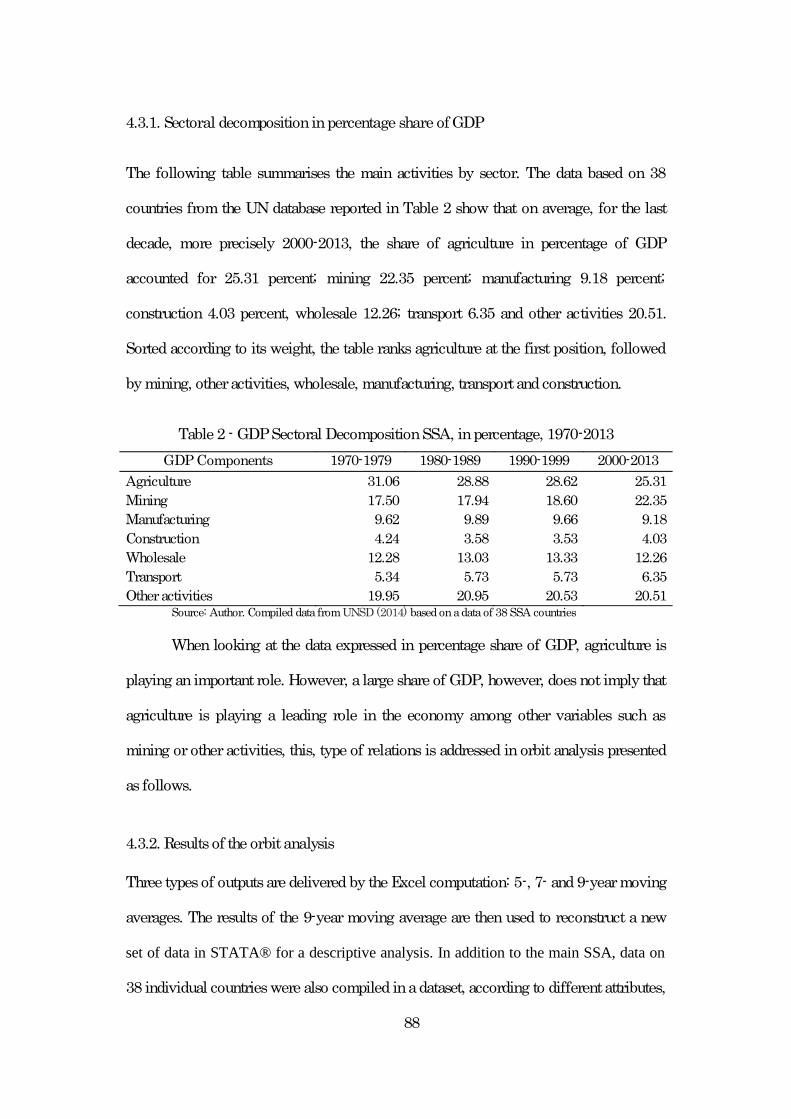
88
4.3.1. Sectoral decompositioninpercentage share of GDP
The following table summarises the main activities by sector. The data based on 38
countries from the UN database reported in Table 2 show that on average, for the last
decade, more precisely 2000-2013, the share of agriculture in percentage of GDP
accounted for 25.31 percent; mining 22.35 percent; manufacturing 9.18 percent;
construction 4.03 percent, wholesale 12.26; transport 6.35 and other activities 20.51.
Sorted according to its weight, the table ranks agriculture at the first position, followed
by mining, other activities, wholesale, manufacturing, transport and construction.
Table 2 - GDP Sectoral Decomposition SSA, in percentage, 1970-2013GDP Components 1970-1979 1980-1989 1990-1999 2000-2013
Agriculture 31.06 28.88 28.62 25.31Mining 17.50 17.94 18.60 22.35Manufacturing 9.62 9.89 9.66 9.18Construction 4.24 3.58 3.53 4.03Wholesale 12.28 13.03 13.33 12.26Transport 5.34 5.73 5.73 6.35Other activities 19.95 20.95 20.53 20.51
Source: Author. Compiled data fromUNSD (2014) based on a data of 38 SSA countries
When looking at the data expressed in percentage share of GDP, agriculture is
playing an important role. However, a large share of GDP, however, does not imply that
agriculture is playing a leading role in the economy among other variables such as
mining or other activities, this, type of relations is addressed in orbit analysis presented
as follows.
4.3.2. Results of the orbit analysis
Three types of outputs are delivered by the Excel computation: 5-, 7- and 9-yearmoving
averages. The results of the 9-year moving average are then used to reconstruct a new
set of data in STATA® for a descriptive analysis. In addition to the main SSA, data on
38 individual countries were also compiled in a dataset, according to different attributes,

89
such as the sub-region cluster, geographic conditions, the fact of being part of the New
Alliance project, political freedom and the business environment.
The graphical output from the Excel spreadsheet is reproduced in Figure 9
below, which reports the output of the 9-yearmoving average and its summary statistics
are reported in the appendix. Then, extreme points,
value of each sector, are plotted to look how they changed over time. It shows how
agriculture interacted with other industries. Accordingly, agriculture will be used as the
key variable inthis analysis.
The results of the output table of the 9-year moving average are showing the
broad picture, how the data interacted among each other across time. Nevertheless, with
multiple variables, the figure presented below might be slightly problematical for the
interpretation. Hence, for a more detailed analytical purpose, descriptive statistics using
Figure
9 to understand this concept of intersectoral linkages.


91
Figure 10 shows the scores recorded by each sector on average to compare how
each variable outperformed during the period of study. This graph compares two data.
First a weighted average of the aggregated data of SSA and second the individual
analysis.
Figure 10 - Weighted results of orbit analysis, decomposition 1972-2011
On average, manufacturing (3.25797) was leading in the sense of orbit analysis
followed by agriculture (3.1436), other activities (3.12602), mining (3.05734), transport
(2.93066), wholesale (2.068545) and construction (2.4075). In other words,
manufacturing exerts a stronger pulling force that heralds changes among other
variables.
To understand the changes over the studied period, the first (non-missing value)
and last value of the score recorded by each sector are depicted below showing the
extreme points i.e. the initial and final period (here 1973-2011). This study points out
3.1436 3.057343.25797
2.40752.68545
2.930663.12602
Mean of 9-years Moving average Sub-Saharan Africa
1-Agriculture 2-Mining3-Manufacturing 4-Construction5-Wholesale 6-Transport7-Other

92
two types of kick-starter. Type 0 (1972 kick-starter) considers all the time span of the
period of analysis and type I (2011 kick-starter) which is the highest score at a time t
within a period of analysis.
Figure 11 - First and last scores of each sector, GDP decomposition 1973-2011
In Figure 11, the first graph (on the left side) exhibits that in the initial period
(1973), other activities, construction, agriculture, manufacturing, and transport are the
kick-starters and its sequential followers. On the right hand side of the same figure,
manufacturing, mining, other activities, agriculture, construction, transport and
wholesale sectors are respectively ranked in the same manner in the final period.
The results of the disaggregated data according to geographical decomposition
are slightly different from time series type. Therefore, the average score of the first year
will therefore be applied to the analysis. The data are also presented according the sub-
regional category, namely: Western, Southern, Eastern and Middle Africa.
3.16667
2.33333
3.16667
3.5
2
3.16667
3.66667
First Non-Missing Points
2
3
4.4
1.8
1.4
1.8
2.4
Last Non-Missing Points
SSA aggregated
1-Agriculture 2-Mining3-Manufacturing 4-Construction5-Wholesale 6-Transport7-Other

93
Table 3 - Leading-following relations across countries, SSA 1972-2011
Rank Western Africa SouthernAfrica
Eastern Africa Middle Africa
1 Manufacturing(3.077)
Agriculture(3.336)
Mining(3.083)
Manufacturing(3.109)
2 Agriculture(3.032)
Transport(3.053)
Agriculture(3.066)
Agriculture(3.012)
3 Wholesale(2.962)
Mining(2.989)
Transport(3.012)
Wholesale(3.010)
4 Mining(2.926)
Wholesale(2.934)
Manufacturing(2.961)
Transport(2.926)
5 Construction(2.916)
Construction(2.844)
Construction(2.865)
Mining(2.825)
6 Transport(2.893)
Manufacturing(2.783)
Wholesale(2.837)
Construction(2.789)
7 Other(2.808)
Other(2.675)
Other(2.792)
Other(2.705)
1972 kick-starters1 Construction
(3.240)Transport(3.750)
Construction(3.712)
Construction(3.190)
2 Agriculture(3.219)
Agriculture(3.625)
Agriculture(3.212)
Agriculture(2.976)
3 Manufacturing(3.146)
Mining(3.167)
Mining(2.924)
Wholesale(2.929)
4 Transport(3.010)
Wholesale(2.792)
Manufacturing*(2.833)
Transport(2.667)
5 Wholesale(2.958)
Manufacturing*(2.708)
Wholesale*(2.833)
Other(2.548)
6 Mining(2.802)
Other*(2.708)
Transport(2.803)
Manufacturing(2.524)
7 Other(2.625)
Construction(2.250)
Other(2.682)
Mining(2.357)
2011 kick-starters1 Agriculture
(2.000)Manufacturing
(2.250)Mining(2.341)
Mining(2.339)
2 Construction(1.977)
Mining(2.125)
Manufacturing(2.045)
Agriculture(2.089)
3 Manufacturing(1.969)
Other(2.000)
Transport(2.034)
Transport(2.071)
4 Transport(1.875)
Construction(1.938)
Other(1.807)
Manufacturing(2.054)
5 Mining(1.852)
Agriculture(1.844)
Agriculture(1.693)
Wholesale(1.786)
6 Wholesale(1.742)
Transport(1.500)
Construction(1.614)
Other(1.536)
7 Other(1.703)
Wholesale(1.469)
Wholesale(1.591)
Construction(1.536)
Degree of variations1 Other
(0.714)Agriculture
(0.857)Agriculture
(0.838)Construction
(0.774)2 Transport
(0.683)Construction
(0.731)Wholesale
(0.664)Agriculture
(0.762)3 Mining
(0.679)Transport(0.724)
Mining(0.648)
Mining(0.729)
4 Wholesale(0.669)
Mining(0.675)
Other(0.642)
Other(0.688)

94
continued5 Agriculture
(0.663)Manufacturing
(0.666)Construction
(0.633)Manufacturing
(0.637)6 Construction
(0.650)Wholesale
(0.659)Transport(0.614)
Transport(0.624)
7 Manufacturing(0.619)
Other(0.571)
Manufacturing(0.607)
Wholesale(0.603)
Source: Author. Notes: score of the ranking points in parentheses.* indicates variablesrecording the same scores.
The degree of variation indicates the intensity of the changes of one variable
across time measured by the standard deviation. The degree of variation helps to
understand the deviation of the leading and following variables. The results in Table 3
indicate that across the region, on average:
Manufacturing was a leading sector in Western and Middle Africa; agriculture in
Southern Africa and finally, mining in Eastern Africa. For the four regions, with
the exception of Southern Africa, agriculture is playing the role of a following
variable.
Among the 1972 kick-starters, the variables recording highest scores at the
beginning of the period of analysis across the region are construction in Western,
Eastern and Middle Africa, whereas in the Southern region, it was led by
transport.
The variables that are leading at the end of the period of study, or 2011 kick-
starter are agriculture in Western Africa, manufacturing in Southern Africa, and
mining in Eastern and Middle Africa.
The variables that recorded the great degree of variation or the sector of activity
that has changed actively across time are other activities in Western Africa
agriculture in Southern and Eastern Africa and construction in Middle Africa.
Nonetheless, comparing the value of each sector at the beginning and the end of
the period of study is not enough to appreciate the changes across time. For the rest of

95
other sectors of the economy.
4.3.3. Sector-to-sector analysis
The sector-to-
leading-following relations and major turning points among the two. Various graphs
compiled around the 9-year moving average output of the orbit analysis are used to
support this step in which the scores are compared in a time series with the differences
a. Agriculture and manufacturing (ISIC-D)
The result of the 9-year moving average is showing that over the period of the study,
manufacturing and agriculture scored respectively, on average, at the first and second
position, followed by other activities, mining, transport, wholesale, and finally by
construction. Figure 12 depicts the interactions between agriculture and manufacturing
in the region for 1973-2011.
In the initial period, both variables are recording the same scores and are among
-s
started to thrive. Indeed, for the region of SSA, the major turning point took place in
1992-onward where manufacturing took the lead over agriculture whose progress was
heading towards a downward movement as depicted by the impulse bar in the same
figure.
The agricultural sector is also the most dynamic regarding the density of
changes in the overall economy. According to the implicit correlation tests agriculture
and manufacturing show aweak positive correlation. However, the resultant force of the

96
manufacturing sector makes it one of the leading industries in the region followed by
agriculture.
Figure 12 - Leading-following relations between agriculture and manufacturing in SSA
b. Agriculture and other activities (ISIC J-P)
In percentage share of GDP, for the period 2000-
occupies the third position after the mining industries. In the initial value of the orbit
72 kick-
Likewise, in the final value of the same analysis, it ranks at the third position.
Across time, as highlighted in Figure 13, the sector was exceeded by agriculture in 1993.
Then after this period, it again saw a steady growth, leaving agriculture lagging behind.
The impulse bar is also revealing two major periods with respect to agriculture and
1970 1980 1990 2000 2010year
Agriculture ManufacturingAgriculture vs. Manufacturing
9 year moving average - 1970-2011
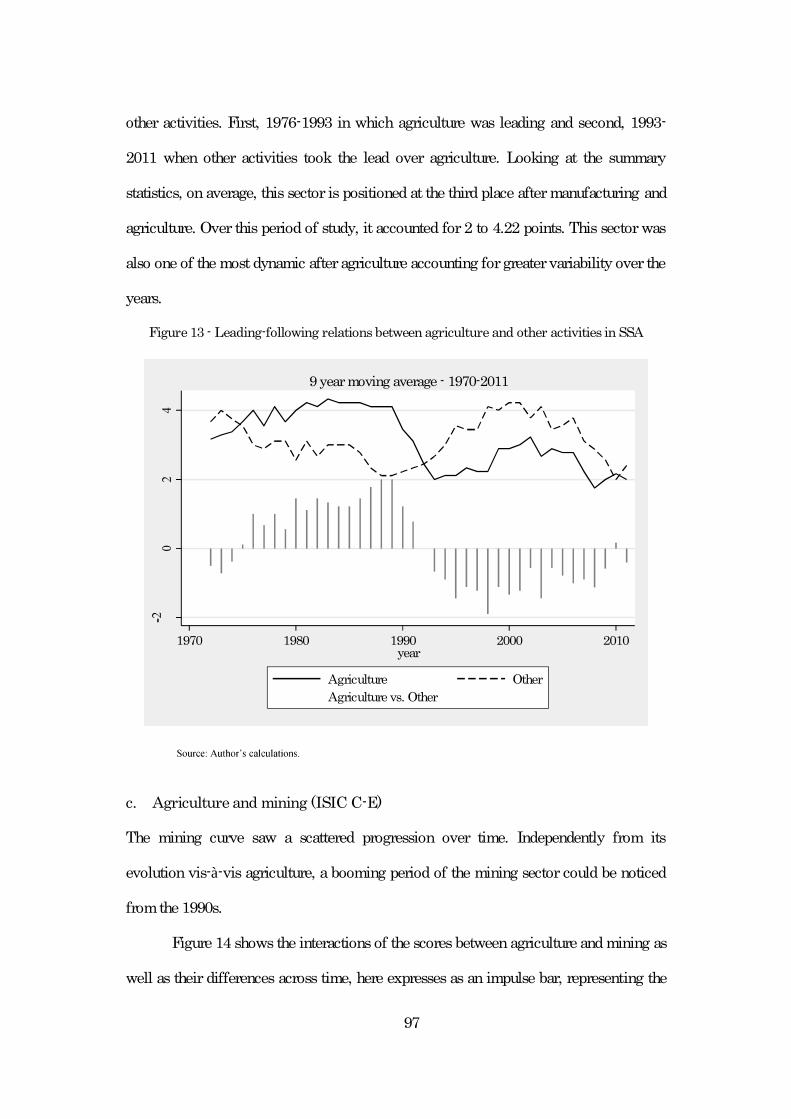
97
other activities. First, 1976-1993 in which agriculture was leading and second, 1993-
2011 when other activities took the lead over agriculture. Looking at the summary
statistics, on average, this sector is positioned at the third place after manufacturing and
agriculture. Over this period of study, it accounted for 2 to 4.22 points. This sector was
also one of the most dynamic after agriculture accounting for greater variability over the
years.
Figure 13 - Leading-following relations between agriculture and other activities in SSA
c. Agriculture and mining (ISIC C-E)
The mining curve saw a scattered progression over time. Independently from its
evolution vis-à-vis agriculture, a booming period of the mining sector could be noticed
from the 1990s.
Figure 14 shows the interactions of the scores between agriculture and mining as
well as their differences across time, here expresses as an impulse bar, representing the
1970 1980 1990 2000 2010year
Agriculture OtherAgriculture vs. Other
9 year moving average - 1970-2011

98
period between 1973 and 2011. The major turning point appeared in 1992 when mining
surpassed agriculture. For this period, mining held leading position as exhibited by the
impulse bar. Mining activities in percentage share of GDP represent the second industry
in the region. The results of the orbit analysis show that on average, mining ranked at
the fourth positionover 1972-2011 (see: Figure 10).
Figure 14 - Leading-following relations between agriculture and mining in SSA
d. Agriculture and transport, storage and communication (ISIC-I)
Transport, storage and communication has on average scored at the fifth position. This
sector saw a scattered progress from 1970 to the mid-2000s. The impulse bar is
revealing two important periods with respect to agriculture and transport. The first
period is 1973-1991 in whichagriculture was leading in the sense of orbit analysis, over
transport and second, 1991-onward when transport took the lead over agriculture. This
leading-following relation is showninFigure 15.
1970 1980 1990 2000 2010year
Agriculture MiningAgriculture vs. Mining
9 year moving average - 1970-2011

99
Figure 15 - Leading-following relations between agriculture and transport in SSA
e. Agriculture and wholesale, retail trade, restaurants and hotels (ISIC G-H)
The wholesale, retail trade, restaurant and hotels recorded a steady development
between 1970 and 1980. It started to decline significantly after the 1980s. On average,
this sector ranks at the sixth position after transport and accounted for 1.44-3.77 with a
variation 0.62 point over 1970-2011. Similar to the other sectors of the economy, a
turning point also occurred in 1991 in this sector in which a major convergence could be
noticed in terms of ranking points. The only difference with the other industries is the
fact that it tumbled around 2010.
Figure 16 exhibits the relations and differences across time between agriculture
and wholesale over the period 1973-2011.
1970 1980 1990 2000 2010year
Agriculture TransportAgriculture vs. Transport
9 year moving average - 1970-2011

100
Figure 16 - Leading-following relations between agriculture and wholesale in SSA
Source: Author
The relations between agriculture and wholesale saw up and down movements
across time. Wholesale lagged behind agriculture, according to their differences across
time, except for the period between 1991 to 1999 when wholesale was leading over
agriculture.
f. Agriculture and construction (ISIC-F)
The c 1972 kick-starters As it can be noticed from
Figure 17, it soon saw a declining phase, following the agriculture trend line. On
average, it accounted for 1.66-3.55 point with a variation of 0.51 overall the period
covered by the study. The construction sector ranks at the seventh position on average,
following the wholesale sector.
Furthermore, the difference shows that agriculture has been leading over
1970 1980 1990 2000 2010year
Agriculture WholesaleAgriculture vs. Wholesale
9 years moving average - 1970-2011

101
kick-
after agriculture. The impulse bar is also revealing that the differences in score across
time were greater in 1972-1991. However, these differences started to narrow from
1992 to the present.
Figure 17 - Leading-following relations between agriculture and construction in SSA
After the brief presentation of the results of orbit analysis, the following section
presents the discussions around the question posited at the beginning of this chapter.
4.4. Discussions: policy implications
Thus, through the results of the previous analysis, agriculture will be used as a core
element to be compared with other industries, highlighting its linkages and implications
in policy making.
To begin with, it is necessary to mention some caveats regarding the
fundamental question inquired in the present case. Second, as part of the core
1970 1980 1990 2000 2010year
Agriculture ConstructionAgriculture vs. Construction
9 years moving average - 1970-2011

102
discussions on policy implications, four points will be explored here: firstly, the
assumption, i.e. SSA is an agriculture-based economy. This first point was presented as
a new concept in the WDR2008 (World Bank, 2007) and is often cited in academic
literature. The second point highlights the case derived from Table 2 in which mining
represents the second largest industry after agriculture in percentage of GDP. The
subsequent element of discussion takes the result of orbit analysis highlighting the fact
that SSA is led by manufacturing sectors. A close look at the regional decomposition
will be appended to this analysis in order to exemplify the differences and similarities
across countries and industries. In addition, the implications of the orbit analysis will be
discussed and connected to the notion of productive and absorptive capacity that was
discussed inChapter 2. Regarding the non-policy implications, this chapter brings some
clarification on the role of each industry in SSA over and across time according to
leading-following perspectives.
4.4.1. Some caveats regarding the analysis
This chapter discusses whether SSA is an agriculture-based economy and looks at the
implications of this attribute on policy making. It also attempts to identify the leading
industries across countries and regions to contribute to the conceptualisation of the
-
economy of the region which could enhance the productive and absorptive capacity of a
ition
this chapter also identifies some missing linkages that can be connected together in
agricultural development and food security.
The caveat is about the method to treat SSA as a whole regional economic block
due to the existence of recent policy convergence with respect to agriculture namely the

103
CAADP on which international development institutions, forums and other private
sectors are aligning their one-size-fits-all policy. Nonetheless, even if the region is
considered as a single economic block, the chapter also acknowledges the importance of
individual country-strategy, and thus, presents an additional analysis into the discussion.
4.4.2. SSA as an agriculture-based economy
As introduced in the very beginning of this thesis, one of the narratives of the
development institutions and their stakeholders was to categorise SSA as an agriculture-
based economy, signalling the strategic positioning of the aid allocation for the coming
years. This assumption emerged from the sidelines of the major food price spike of
2008 coupled with the new challenge to feed the world population by the middle of this
century projected to reach the threshold of nine billion. The main discussion point to
this assumption, therefore, is whether the percentage share of GDP and the proportion
of people in the rural area are sufficient criteria to categorise the region as an
e- also have played an important role
to support the growth of the region in the recent years. The section begins with the
role of agriculture in development. It then looks at the recent responses from the
international community in terms of investments and discuss about its impacts. Finally,
the section draws some comparative grounds between agriculture and mining and their
importance in the economy to bridge the discussion to the next assumption showing that
SSA is a mine-based economy.
The Bank, through its WDR2008 (World Bank, 2007) emphasised three
important role agriculture can do for development: as an economic activity, as a
livelihood and as a source of environmental services. The report explains, as an

104
economic activity, agriculture contributes to economic growth, which is two to four
times more effective for poverty reduction compared to the other sectors of the
economy (World Bank, 2007).
African agriculture has often been ignored due to its low performance and
competitiveness. But, with the increase of the demand for food from the emerging,
resource-rich and high-income countries, such as China, India, Japan, Korea and the
countries in the Gulf (Group1, 2 and 3), the sector has become a new opportunity for
FDI. This flow of FDI is believed to contribute to global food security and job creation
which in turn would raise productivity and generate positive externalities with respect to
food security especially for the import dependent countries. Such a process not only
would hedge the country against the foreign currencies risks and constraints but also,
will make possible the investment in other social sectors (see: Farole & Winkler, 2014,
p. 163-205).
Furthermore, agriculture is not only an economic activity, but also a livelihood
for millions of people living in the rural areas. Rural employment, farm and nonfarm
activities resulting from agriculture engage a large proportion of the poor in developing
countries. One of the major issues in the region is the rapid increase of both urban and
rural populations, accounting respectively, for 4 and 1.7 percent annual growth (World
Bank, 2012a). The major task for policy making is therefore to create sufficient
economic activities at two levels. First, at the rural level through the rural nonfarm
economy and second at the urban level (nationwide perspective) by promoting other
industries to establish the Lewis as well as the Johnston and Mellor linkages. To achieve
Plan 2013- (World Bank, 2013a) focused on five programmes: increased
productivity in the targeted countries, linking farmers to markets, reducing risks and
105
vulnerabilities, improving non-rural farm and rural employment, develop a more
environmentally friendly agriculture. Moreover, the Bank reported that it has committed
to finance agricultural development with a portfolio of 8-10 billion $US, on which, the
major part of its assistance would be directed to SSA (World Bank, 2013a). In addition,
the Bank also underlined that in 2010-
an amount of 1.4 billion $US, of which 73 percent was allocated to enhance
productivity and 20 to improve access to markets (World Bank, 2013a).
Not only had the categorisation of the World Bank propelled the enthusiasm of
the community of donors, civil society, NGOs, as well as African leaders, but also
sparked the interest of many private entities. Nonetheless, the PPP and value chain
approaches towards agricultural development in SSA raise major concerns as a growing
land and water grabbing issues hindered the rights of the poor and creates negative
social impacts. A vast array of literature is today highlighting the inconsistency of the
large-scale investment in land and water in SSA with the idea of reducing poverty and
enhancing food security (see: Allan, 2013; Borras et al., 2011; GRAIN, 2012; Matondi,
et al. 2011; Pearce, 2012). According to various studies on land deals summarised by
Cotula (2012), 40-67 million hectares were subject to transactions for foreign
ownership, most of which relates to African countries. The main criticisms of these
transactions are firstly related to the appropriation of the small-scale lands on which the
majority of the rural poor derived their source of livelihood. Second, land use is also
diverted into the production of biofuels or food for exports, which leaves a little room
for small-scale farmers to ensure their own food security as most of the production is
self-consumed (Borras & Franco, 2012).
Chapter 3 explains the strong tendency in policies aiming at stabilising the
international food markets to enable food deficit and import dependent countries to rely

106
upon trade mechanisms to ensure future food supply. The outcome of such policy is
built over the fact that once the market stabilised, its benefit would transcend through
three levels: global, national and household. However, the chapter adds that such
approach presents a trilemma since the market mechanism at the global level is neither
concomitant with the self-centred objectives pursued by each country at the national
level, nor suitable to the trade-off faced by smallholders regarding land use.
Furthermore, it is difficult to apply crop diversification as the land size is relatively
small, which makes this approach virtually risky.
Not all of the African countries are recording a vibrant agricultural sector. The
following table disaggregates the data at sub-regional level. Using categorical variables
it compares two periods: 2000-2008 (benchmark) and 2008-2012. The count outcome of
was outstripping all other sectors15. The count outcome identifies over the two periods
the robustness of the power of agriculture to herald changes over other variables. Higher
frequency is translated into a robustness of the sector analysed.
Table 4 - Count outcome of a leading agriculture, SSA countries, 2000-2012
2000-2008 (8 years) 2008-2013 (4 years)New Alliance countries
Countries Freq. Agriculture % GDP* Countries Freq. Agriculture % GDP*Malawi 7 33.35 Malawi 3 29.04Mali 5 33.93Senegal 1 14.23
Non-New AllianceEquatorial Guinea 7 3.88 Chad 3 19.91Niger 7 42.22 Equatorial Guinea 3 1.41Mauritania 6 28.85 Gambia 3 25.07Swaziland 6 6.68 Swaziland 2 5.27Zimbabwe 2 19.57 Guinea 2 23.56
15 A strict condition that the ranking point recorded by agriculture over the other sectors. The frequency (Freq) indicates the number
of time agriculture was leading over all sectors, across the benchmark period (8 years) and the post2008 period (4 years).

107
continuedCote d'Ivoire 1 23.18 Togo 2 42.99Gambia 2 23.53Botswana 1 2.44Burkina Faso 1 31.95Central AfricanRep. 1 39.32Chad 1 27.86Gabon 1 5.39Guinea-Bissau 1 44.61Lesotho 1 8.19
Source: Author. Note: Freq requency adapted fromUNSD (2014).
The count outcome exhibits that three New Alliance countries Malawi, Mali and
Senegal record robust scores of agriculture in the benchmark period. However, from
post-2008, only Malawi managed to keep this robust performance of agriculture. In
contrast, 12 countries of the non-New Alliance group saw the agricultural sector
leading: Equatorial Guinea, Niger, alongside Mauritania and Swaziland are ranked at
the top performers with sustained scores. Comparing this benchmark with the period
after 2008, the results reported in Table 4 show that six countries from the non-New
Alliance, namely, Chad, Equatorial Guinea, Gambia, Swaziland, Guinea and Togo show
good agricultural performances. With regards to other attributes such as political
freedom and civil liberty in addition to the geographical conditions, one can find that
- -New Alliance countries in the Western and Middle Africa are
accounting for a sustained leading agriculture. However, the share of agriculture in
percentage of GDP is very different among those countries. While looking at the period
2008-2012 for instance, it accounted for a very small part in Equatorial Guinea and
Swaziland, respectively, 1.41 and 5.27 percent, whereas in other countries such as
Mauritania, Gambia, and Guinea it was on average between 20-25 percent. Nonetheless,
the key information conveyed by the leading-following relation is that, most of the few
agriculture-led economies, for 2008-2013, are located in the Western and Middle Africa.
in these two regions, agriculture represents 1-42 percent of the GDP and ranks at the

108
second position of the leading-following relations i.e. the expansion of agriculture
follows the expansion of manufacturing.
4.4.3. SSA as a mine-based economy
Mining is an important industry of which share in percentage of GDP represents about
25.31 percent for the period 2000-2013. Given the importance of this sector, this section
turns to the political economy of natural resource management to enrich the element of
discussion of the perspective of SSA as mined based economy. According to the UNSD
(2008, p. 79), mining activities are defined as follows:
Extraction of minerals occurring naturally as solids (coal and ores), liquids
(petroleum) or gases (natural gas). Extraction can be achieved by different methods
such as underground or surface mining, well operation, seabed mining etc.
African countries are renowned for the abundance of their underground
resources, including oil, gas, uranium, diamond, rare earth, as well as the various
gemstones to name a few which are strongly demanded in the industrialised
economies (Moyo, 2013, p.10-20). Based on the representation in percentage share of
GDP, mining is also generating economic growth and constitute a large share of value
added in the SSA economic aggregate. Hence, the importance of mining activities is
also having a significant influence on policy making.
Similar to agriculture, mining contributes to economic growth as an economic
activity through several linkages namely: exports, which generate foreign currencies. It
also attracts FDI and to some extent source of job creation, but more importantly, taxes
and royalties from mining is a major source of government revenue. According to the
International Council of Mining and Minerals (ICMM, 2012) which compiled a
database on the Mining Contribution Index from a panel of 212 countries, for low and
109
middle income economies, mining represents about 60-90 percent of the total FDI and
30-60 percent of the total exports. Furthermore, its contributions to the host countries
are estimated about 3-20 percent as part of the government revenues, 3-10 percent of the
total national income, and 1-2 percent of the total employment (ICMM, 2012).
Nevertheless, being a resource-rich country can cause various social, economic,
political and institutional issues: such as corruption, bad governance or rent-seeking
behaviour and to some extent, it could be a trap for the low-income countries. For
developing economies endowed with abundant natural resources, access, use and the
control can turn into a thorny issue that can create instability. Collier (2000) for instance,
argued that for any period of years, the risk of civil war in an African country rich in
natural resource is 23 percent against only one percent for resource-poor countries.
Because the natural resources are concentrated in a few places, access and the
distribution of the revenue resulting from mining exploitation are sources of potential
conflicts (UNEP, 2009, p. 15). The UNEP emphasised that this exploitation might affect
the degradation of the natural environments and land needed for agriculture as a direct
impact (UNEP, 2009, p. 15). Furthermore, several case studies show that corruption is
caused by the abundance of natural resources. As a matter of fact, Askari, Rehman and
Arfaa (2010, p. 59) suggest that corruption is determined by a number of factors,
including: the size of government and the calibre of its bureaucracy, the extent of the
distortion in the economy, low government capacity to manage privatisation process,
low rule of law and enforcement mechanism, low government salaries and the
abundance of natural resources (see also: Campbell, 2009; Mbaku, 2007; Petermann et
al., 2007).
The second knotty elements that need to be discussed here is the relations
between agriculture and mining. Both are still considered as primary sectors in which a

110
large proportion of people could be engaged in albeit the two activities are not
compatible. Indeed, both industries are using the land on which underground and above
ground resource are overlapping. Also, mining and agriculture are using water, which
might cause environmental depletion. Usher and Vermeulen (2006), for instance,
highlight the case of water surface pollution due to the extent of mining in South Africa.
Such kind of situation is not an isolated case, but could happen in many countries where
agriculture is still playing a key role in the economy.
The third element of discussion in this section is about the relations of these two
sectors and the market forces/externalities. In the past decades, agricultural markets
have been stable until 2008, after which food commodity prices skyrocketed and futures
contracts related to agricultural sectors became speculative instruments for banks and
financial institutions. In addition, mining products are also subject to the same law of
volatility which could be a curse or a blessing for the mining exports dependent
economies. Those two types of commodities are therefore subject to market signals
which might affect decision making to opt either for a mining-led or agriculture-led
growth strategies. Under this perspective, policy orientation would be directed towards
the sector that has the strongest market signal and the lowest negative externalities.
Agriculture and mining are falling respectively into the designated category of
corn, wheat, coffee, sugar, cotton, cocoa, soybean, rice, etc. The subcategory of hard
commodities includes: precious metals (gold, silver, platinum, etc.), industrial metals
(aluminium, copper, nickel, zinc, etc.), and energy (crude oil, gasoil, natural gas,
heating oil, etc.). Both sectors are sensitive to market signals and to a greater extent, to

111
economic information. Chevallier and Ielpo (2013, p. 117-143) used an EGARCH16
economic news in 2008-2009 using 16 Bloomberg database comprising times series of
1999-2011, derived from three geographic regions: US, European Monetary Union and
China. One of the empirical findings of the study concluded that agricultural
commodities and precious metals are the most sensitive to economic news (Chevallier
& Ielpo, 2013, p. 128). This sensitivity to economic information for the two sectors
implies that policies towards agriculture and mining industries in the coming years are
likely to be subject to stronger influences of market forces. On the other hand, the
emergence of these new changes could be a catalyst of foreign investment for the region
especially for countries endowed with a vast territory. A similar count outcome is used
to identify the countries where mining was leading and its robustness for before and
after 2008. The benchmark period and the categorical variables remain unchanged.
Table 5 - Count outcome of leading mining sector in SSA 2000-2012
2000-2008 (8 years) 2008-2012 (4 years)New Alliance
country Freq. %GDP mining country Freq. %GDP miningEthiopia 5 5.95 Ethiopia 3 5.90Kenya 1 14.41 Zambia 3 12.27Liberia 1 8.54 Ghana 2 15.81
Uganda 2 12.54Rwanda 1 7.59
Non-New AllianceBurundi 5 11.60 Botswana 3 28.39Nigeria 4 18.46 Congo 3 66.62Benin 2 8.46 Mauritania 3 38.30Congo 2 69.56 Angola 1 53.19DRC 1 25.08 Burundi 1 10.35
Source: Author. Note: * indicates data adapted from UN Database (UNSD, 2014). Frequency (Freq)
indicates the number of time mining was leading.
16 Exponential generalized autoregressive conditional heteroscedastic

112
Table 5 shows that only Ethiopia accounts for a robust score with regards to
mining as a leading variable. For the non-New Alliance group, Burundi and Nigeria
rank among the countries where this leading role has been sustained over time.
Figure 18 Distribution by group, agriculture and mining in percentage of GDP, SSA
(UNSD, 2014)Note: This graph shows the distribution agricultural and mining in percentage of GDP for member countriesnot members of the alliance in SSA. The graph is given the following information from bottom to top: theminimum value, the lower quartile, the median, upper quartile, maximum value, and the outliers. A greatnumber of countries in the New Alliance are recording a share of agriculture above the median. In the non-New Alliance countries, a great number of countries are recording agriculture lower the median. Mining inthe New Alliance are to a great extent located under the median, whereas for the non-New Alliance it agreat numbers of countries are recording mining above the median.
The share of GDP in mining in the New Alliance countries is significantly
distributed under the median 12.38 percent, whereas in the non-New Alliance countries
it is almost distributed around the median 23.52 percent. The agriculture share in
percentage of GDP, for the New Alliance countries, is, in majority distributed above the
median 26.43, with less disparity in contrast to the non-New Alliance, where the points
are concentrated under the 20.18 percent.
New Alliance Non New Alliance
Graphs by G8NA Non-G8NA
AgricultureNew Alliance Non New Alliance
Graphs by G8NA Non-G8NA
Mining

113
Figure 19 - Intensity of activity, mining and agriculture in % share of GDP
Database (UNSD, 2014)
Three patterns of structure can be drawn from the figure above. From the left
side high-intensity of mining with less agriculture for countries like the Congo, Gabon,
Swaziland, and Botswana and from the right side, high-intensity of agriculture, less
mining for Ethiopia, Rwanda, Sierra Leone, Liberia, Burundi etc., and finally, the
17 A huge gap
in the economic structure is not a very good sign as it might create an economic and
social divide in a given society. As a matter of fact, natural resources are not equally
distributed among the population of a resource-rich SSA economy, and this can cause
social tensions as well as an economic marginalisation of those living in the non-
resource regions.
The long run decline of agriculture to mining activities illustrated in Figure 14,
particularly from 1991, implies that, during these last years, mining activities were
gaining more importance to lead in the SSA economies, particularly in Eastern Africa.
Although mining is playing a major role in macro-economy, as a source of government
revenue and foreign exchanges, its absorptive capacity is however still weak and
17

114
hazardous. Unlike agriculture, mining is attracting fewer unskilled labours (Loayza &
Raddatz, 2010). Furthermore, with regards to the problem of food security and
agricultural development, the environmental degradation caused by mining can affect in
the long run agriculture, making it a competing rather than a complementing industry.
Such kind of condition might happen in case where the gap across sector between
mining and agriculture is large.
4.4.4. SSAmanufacturing-led economy
The last discussion point in this section concerns the manufacturing sector. To
understand these interactions, it is important to capture the role of manufacturing in
economic development. Such a step would make it possible to bridge some linkages
towards agriculture. Manufacturing is defined by the UNSD (2008) as:
The physical or chemical transformation of materials of components into new
products, whether the work is performed by power-driven machines or by hand,
whether it is done in a factory or in the worker's home, and whether the products
are sold at wholesale or retail. Included are assembly of component parts of
manufactured products and recycling of waste materials. (p. 85).
Similar to the previous sections, a variety of studies show that manufacturing
sector is the activity that offers the greatest opportunity in terms of sustainable growth, a
source of employment and catalyst for poverty reduction in Africa (UNCTAD, 2011).
Similarly, studies conducted by Ciarli and Di Miao (2014) underlining the importance
of manufacturing in the modern economy, show that industrialisation is the pathway to
sustained economic growth and modernisation via the following linkages: technology
diffusion and innovation, synergy and spillover effects towards other sectors of the

115
economy, source of demand, backwards and forwards linkages that induce investments,
employment and productivity as well as trade.
Similar to the count outcome presented above, this section presents the results of
orbit analysis and identifies the countries where manufacturing was playing a leading
role during the two periods ranging from 2000-2013.
Table 6 - Count outcome of leading manufacturing sector from 2000-2013 in SSA
2000-2008 (8 years) 2008-2012 (4 years)
country Freq. % GDP 2008 country Freq. % GDP 2013Mozambique 6 12.34 Mozambique 3 9.80Tanzania 6 6.77 Kenya 2 10.23Ghana 4 7.36 Mali 2Rwanda 4 5.13 Ghana 1 5.49Kenya 1 11.74 Rwanda 1Mali 1 5.50
Burkina Faso 7 7.57 Gabon 3 5.91Guinea 6 6.98 Lesotho 3 12.41Chad 5 5.30 Angola 2 5.60Lesotho 5 15.64 Burkina Faso 1 6.98Namibia 4 12.00 Sierra Leone 1 1.64Guinea-Bissau 3 11.16Botswana 2 5.94Gabon 2 3.99Benin 1 7.25Cote d'Ivoire 1 14.24Sierra Leone 1 2.46
database (UNSD, 2014).Frequency (Freq.) indicates the number of time manufacturing was leading. Countries highlighted in greycolorare the one recording robust performance of manufacturing in the two compared periods.
For the benchmark period (2000-2008), Table 6 indicates that manufacturing
was robust in Mozambique and Tanzania for the New Alliance group. This performance
was moderate in Ghana and Rwanda, very modest in Kenya and Mali. In the post-2008
timeframe, only Mozambique managed to sustain a leading manufacturing sector
despite the declining share of its manufacturing in percentage of GDP recorded in 2013.

116
Burkina Faso, Guinea, Chad and Lesotho accounted for a vigorous performance in the
non-New Alliance group. The other seven countries recorded moderate and poor
performances during the benchmark period. Nonetheless, the sustained manufacturing
sector was disrupted in the post-2008 period for the majority of the non-New Alliance
group except for Burkina Faso.
Despite the disparity of the manufacturing sector at the individual level, the
results of the long run analysis of the driving force of the SSA economy are firm. The
power of the manufacturing sector to herald changes on the other sectors is clearly
indicating that the expansion of manufacturing can lead to the change among other
variables, particularly for agriculture which immediately follows manufacturing in
Western, Eastern and Central Africa. A dualism between manufacturing and agriculture
can be noticed from the leading-following relations analysis given the importance of the
agricultu Discussion on the factors that matter in the development
of manufacturing is therefore necessary to draw policy implication for the region.
Technology diffusion and innovation do matter in SSA. Innovation is essential
for developing economies insofar it can improve well-being and promotes the access to
business opportunities. In this regards, the OECD reports on innovation and
development highlighted that in the early stage of development, these two elements can
improve efficiency of business and public services which in turn lead to the
improvement of the well-being but more importantly induces economic growth (OECD,
2012).
Manufacturing is correspondingly inducing synergy and the spillover effect
towards the other sectors of the economy. To this regards, UNCTAD (2011) illustrates
that this sector is a key source of demand for other services industries such as banking,
transport, insurance and communication but more importantly, it also boosts growth in

117
the agricultural sectors, a key linkage highlighted in the early literature of economic
development (Lewis, 1954; Johnston & Mellor 1961). As there are linkages between
manufacturing sector and other sectors of the economy, such a process, in turn, gives a
momentum to the demand. With suc
taking into consideration that with an increase of per capita income the share of
expenditure in food falls while demand for manufactured goods would rise (UNCTAD,
2011; Ciarli & Di Maio, 2014).
Lastly, manufacturing is also a source of job creation and to a greater extent
supports the transition of an economy during the process of structural transformation.
The theories of structural transformation suggest that the excess of labour in the
agricultural sector would shift towards the modern sectors. In this regards, during the
process of urbanisation, manufacturing also would help to absorb the surplus labour
from the rural area.
In the context of sustainable development strategy, agriculture and
manufacturing are and should be closely interrelated and interdependent. De Janvry and
Sadoulet (2010) in this regards, argue that agriculture can foster competitive advantage
in the manufacturing sector. In the present days, agriculture and manufacturing offers
opportunities for African trade, particularly, for countries endowed with a great
agricultural potential. Export derived from agriculture and manufactured goods would
also provide an important source of foreign currencies that enable to purchase capital
goods and services to enhance productivity. The UNCTAD (2013) for instance, is
promoting a new concept that links the two sectors across the short and long run via the
opportunities in the short run due to the rising global and regional demand of food and
arable land. And, in the long run, the industry would take the lead to boost the intra-
118
African exports, which accounts for only 11 percent of its total exports (UNCTAD
2013). Furthermore, the result of orbit analysis is also confirming such pathway, where
manufacturing has been supporting the economy on the average since the 1990s. The
results of our findings suggest SSA is not an agriculture-based economy and the
difference and ambiguity of economic classification controvert such assumption.
4.4.5. Identifying the potential in the enabling sectors
Construction is also, one of the sectors that can enhance the absorptive capacity
of the rural and urban world. In point of fact, when people in the rural area are
migrating to the urban agglomeration, the sector that carries more unskilled-intensive
labour opportunity is in construction. The definition of the UNSD (2008, p. 172) stated
that:
includes general construction and specialised construction
activities for buildings and civil engineering works. It includes new work, repair,
additions and alterations, the erection of prefabricated buildings or structures on
the site and also construction of a temporary nature.
Nevertheless, across time, construction has always been weak representing on
average 3.76 percent of the GDP. Nonetheless, construction has been leading over
agriculture in recent years, as presented in Figure 20.
Democratic Republic of Congo, Guinea-Bissau, Kenya, Madagascar, Nigeria, Rwanda,
Senegal, Sierra Leone and Tanzania, are the most vibrant countries where construction
has been playing a leading role.
As stated by the definition given above, construction is related to general
building and civil engineering. Accordingly, construction is related to the public
investment and aid in road constructions, schools, hospital, programmes that has been

119
tremendously promoted by the development institutions since the 1960s. Millions if not
billions of dollars are invested every year to develop infrastructures. Nevertheless. The
impact of construction sector on the life of the poor is still small compared to the
investments dedicated to it. Policy challenge and implication is therefore, to make
to the development of infrastructures should find the best option to create more
unskilled-labour intensive employment and a more inclusive construction.
Wholesale industry is another potential cluster that has been compared to
agriculture, which enabled to identify the following countries presented in Figure 21.
Mozambique, Rwanda, Senegal, Sierra Leone and Zimbabwe among other countries
exhibit a leading position over agriculture. Wholesale is defined by the UNSD (2008, p.
179) as follows:
Wholesale and retail sale (i.e. sale without transformation) of any type of goods
and the rendering of services incidental to the sale of these goods. Wholesaling and
retailing are the final steps in the distribution of goods. Goods bought and sold are
also referred to as merchandise.
Wholesale, in percentage share of GDP, for all countries represents about 12
percent. Wholesale and retail activities carry an important linkage with respect to
markets and all the sectors of the economy. Indeed, the activities generated by
wholesale and retail can be connected to the urban and rural area and can work in a
bidirectional way. In this sense, wholesale and retailing activities are playing a profound
role that can contribute to ensure food security and connect the rural world to the market.
Although the rise of supermarkets in SSA these recent years, saw a major change, given

120
the fact that most of the local people do not have appropriate tools to conserve their
food. Retailing industries, more precisely, micro retailing industry is therefore playing
consumers good and services. What makes retailing industry as a good tool to connect
people to market is the fact that the sector has not been touched by the supply chain.
Across the sub-regions, the percentage share of GDP in agriculture decreases as
wholesale GDP increases in Western and Eastern Africa, whereas it increases alongside
wholesale in Southern and Middle Africa. Therefore, policy design should devise the
best policy interface to interconnect this activity to the other sectors of the economy to
generate positive linkages.
Alongside with wholesale, construction, manufacturing and agriculture,
transport sector is also an important vehicle of development and food security. As
defined in Chapter 3, availability and accessibility of food are two essential elements to
ensure food security. The transport sector is defined by the UNSD (2008, p. 194) as:
The provision of passenger or freight transport, whether scheduled or not, by rail,
pipeline, road, water or air and associated activities such as terminal and parking
facilities, cargo handling, storage etc. Included in this section is the renting of
transport equipment with driver or operator. Also included are postal and courier
activities.
Transport industry is accounting on average, about 6 percent in percentage share
of GDP. Figure 22 depicts in details the countries where transport has been leading over
agriculture.
Angola, Burundi, Central African Republic, Cameroon, Madagascar, Namibia,
Nigeria, Sierra Leone, Tanzania, and Uganda, among others are showing, a dynamic
and robust transport industry. Graphical analysis presented in the appendix is showing
121
that across Western, Eastern Africa and Middle Africa the percentage share of GDP in
agriculture tends to decrease while transport increases. Whereas in Southern Africa, it
tends to increase as transport rises.
Transportation sector enables the mobility of labour, goods and services, but, it
also connects the other sectors of the economy through its activities, similar to the
wholesale and retailing industries, the transport sector is playing an enabling role in the
intersectoral linkages, and thus depends on policy interface on which it is connected
with.
The last enabling sector to be explored here is the other activities, defined by the
UNSD (2008, p. 262) as follows:
This section (as a residual category) includes the activities of membership
organisations, the repair of computers and personal and household goods and a
variety of personal service activities not covered elsewhere in the classification.
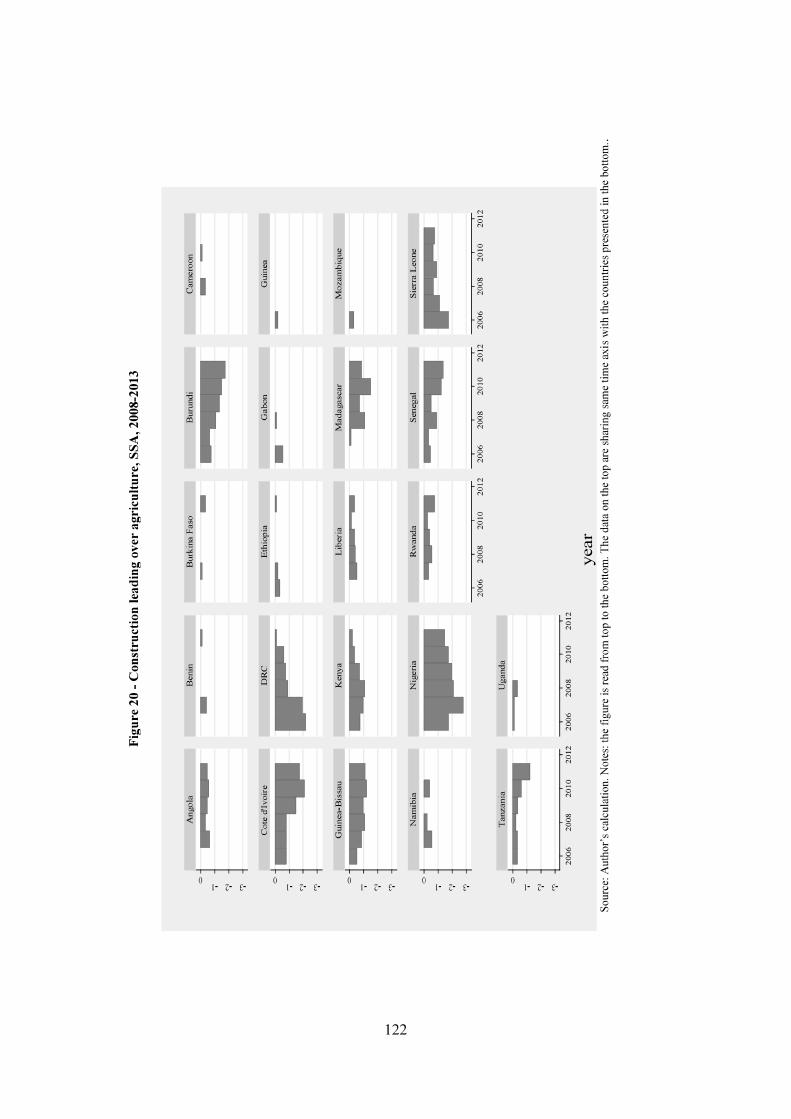
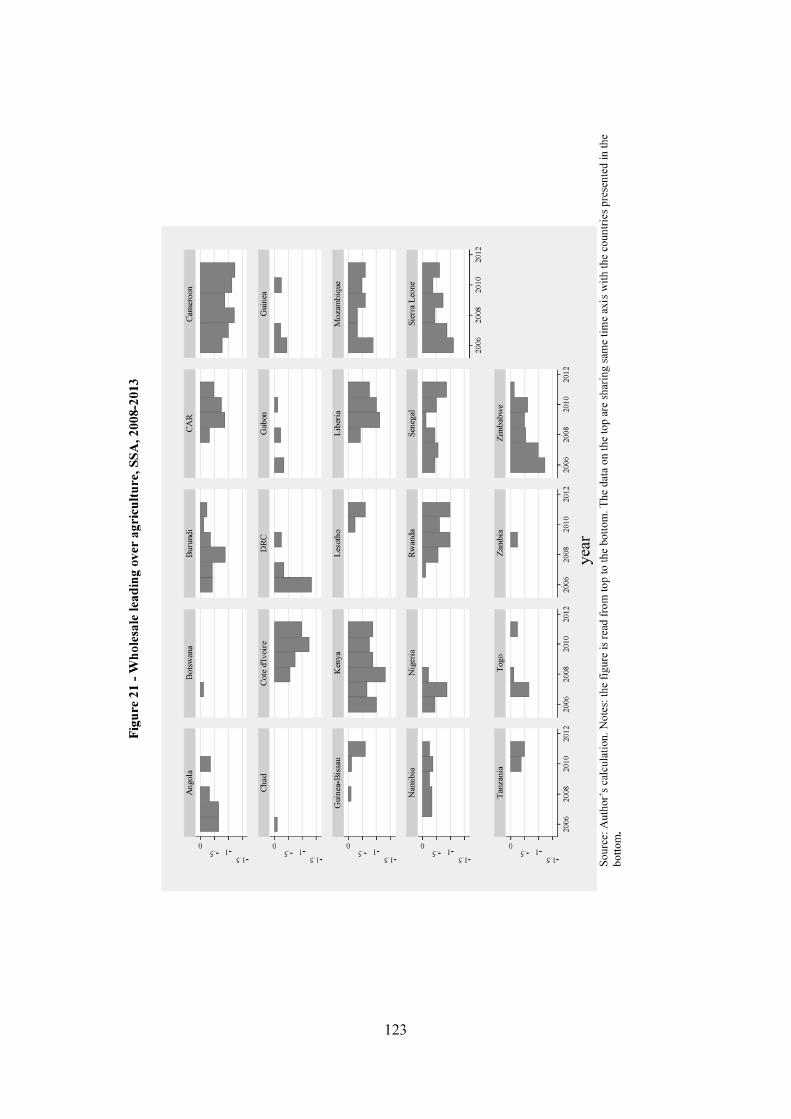

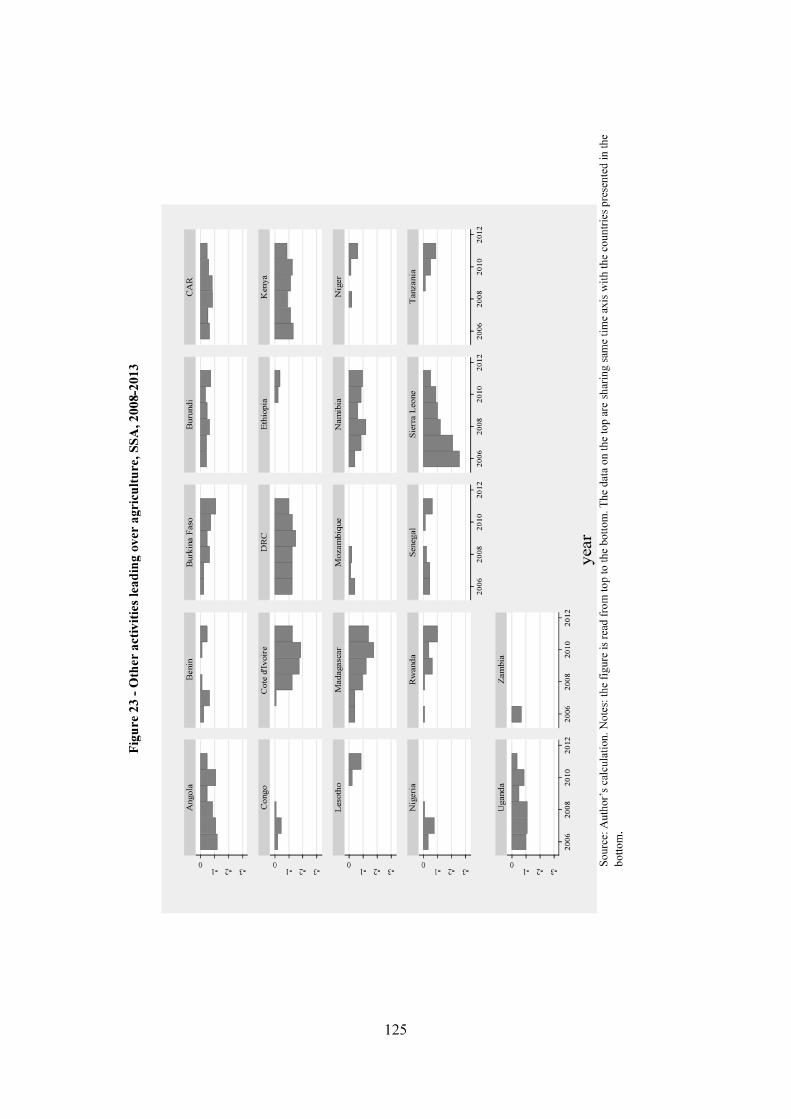

126
In anera of new technology, other activities as an economic activity have also played an
important leading role over agriculture. Despite the ambiguous definition, other
activities account on average, 20.51 percent of the SSA economies. Across the sub-
regions, the share of agriculture in percentage of GDP tends to decline as other activities
increase in Western, Eastern and Middle Africa whereas it takes an opposite movement
in Southern Africa.
Angola, Burkina Faso, Burundi, Central African Republic, Cote ,
Democratic Republic of Congo, Kenya, Madagascar, Namibia, Sierra Leone and
Uganda, among others are showing a robust leading role of other activities in the
economy. Other activities as mentioned earlier are an enabling sector, which with its
productive capacity supports the linkages with the other sectors. Therefore, policy
challenge is to maintain the role of these activities as a provider or productive capacity
to support the growth of other industries (Figure 23).
4.5. Conclusion
This chapter discussed whether SSA is an agriculture-based economy and its
implication to policy making. The comparison of the different ways to represent the
prevailing economic sectors demonstrated that there is a multiple pathway for the region
based upon three plausible assumptions of being an agriculture-based, mine-based or
manufacturing, agriculture-based economy. This amalgam of assumptions brings forth
another critical question about policy making, particularly for resource allocation and
the arrangement of development strategies for the continent.
While discussing the fundamental question inquired by the present chapter,
based on the percentage share of GDP, agriculture is leading the economy. In a second
d by

127
hybrid dualism characterised by and leading-following relations between manufacturing
eation,
opportunities for investments and trade, as well as a potential source of foreign
currencies. The differences probably lie in the policy arrangement and choices. As each
sector has its own pros and cons, the context across time and space is likely to influence
decision making for individual countries in SSA and in this regards, key issues such as
the land management, human capital development, business environment among other
elements would play an essential role to spur sustainable development.
The chapter also, identified the countries where all of those sectors have been
leading over agriculture. Each sector of the economy demonstrated some potential tool
in policy arrangement and choices. The discussion section, in this regard, highlighted
elements that enabled to draw two types of tools, namely the
mining, transport, and other activities). The identification of such tools will therefore be
used -
with the productive capacity and absorptive capacity.
The findings deriving from orbit analysis underline sequences of period from
which major turning points occurred in the region starting from1990 when agriculture
lost its position as a leading sector to mining, then manufacturing, transport and
wholesale in 1991, construction in 1992 and other activities in 1993. The sector-to-
sector comparisons clearly indicate that agriculture was superseded by other industries,
which imply that SSA economy has reached another stage of its development that goes
beyond th -
for poverty and food security, sustaining the resource allocation and strengthening the

128
transfer-linkages with other industries is also an important point to be taken into
consideration in the future policy making which could be shadowed by the fact that all
signals are now directed to investments in agriculture.
Regarding non-policy implications, this chapter contributes to the application of
orbit analysis to the intersectoral linkages between aggregate macroeconomic data. It
presented a new way to interpret the results of its output based on the seminal chapter of
Itaki (2014) through the use of descriptive statistics and graphical presentation. The
method also contributes to the better understanding of the relationship between
agriculture and other industries from the perspective of leading-following rather than
the preceding-lagging relations which test the causal effect of variable x ony, and if this
causal link is unidirectional or bidirectional in the short or long run depending on the
adopted estimation methods.
The structural transformation theory requires an outlook of both sectoral
linkages and aggregate demand. Therefore, to complement this chapter with more
empirical evidences, the next chapter will play a close look to macroeconomic
conditions.

129
Chapter 5: In the search of the driving force of sub-Saharan
economy: an approach from orbit analysis
5.1 Introduction
The economy of SSA has been one of the most dynamic in recent years, albeit the
financial turmoil of 2007-2008 causing a general malaise in the majority of the
advanced financial economies in North America and Europe. As a matter of fact, SSA
records an annual average growth rate of 5-6 percent since 2000 and continues to grow
steadily (World Bank, 2015).
A vast ground of literature highlights that the recent African growth stems from
different sources. The McKinsey Global Institute (2010), for instance, explains that one
third of the growth is due to the rise of commodity prices. The other two thirds, from the
increase in productivity in wholesale and retail sectors accounting for 13 percent,
transport and telecommunication 10 percent and manufacturing 9 percent. Other
accounts for this economic boom underscore the importance of six factors, namely: i)
political stability, ii) intensity of interregional trade, iii) young, growing labour force,
vi) abetter education and schooling achievement, v) the booming of the mobile industry,
and vi) the potential for commercial agriculture with the untapped stock of arable land
(The McKinsey Global Institute, 2010). In addition, the report not only highlights the
sustainability of this growth due to the emergence of a new demand of primary
commodities from emerging economies such as China and India, but also emphasises on
the size of the African consumers estimated to reach an important maturity by 2030 (the
McKinsey Global Institute, 2010).
Despite the importance of the six factors mentioned above, agriculture chiefly
dominated the debates on the African political economy of development in recent years,

130
noticeably, in the early 2008, when the price of food commodities saw a sharp rise in
initiative through the WRD2008 resulted in a
strong signal to private sectors as well as rich countries to invest in agriculture beyond
their borders. Despite the fact that African agriculture has often suffered from a lack of
investment, the major turning point of 2008 led to a considerable inward capital flow
into the region (see: Deininger et al., 2011; UNCTAD, 2009). Nonetheless, two major
problems arise from this turnaround. The first is related to the negative externalities
engendered by these investment flows, particularly with the problem of land and water
grabbing and the rights of the poor. The nature of the resource-seeking behaviour of the
investments is weighted in favour of the TNCs and foreign countries, but not to the
local farmers, which in the process are losing their source of livelihood (De Schutter,
2011; Deininger, 2011; Li, 2011; Matondi, 2011). The second is related to what the
famous development economist Easterly (2014, p. 13)
a policy fix without a consideration of the prevailing
historical and dynamic conditions in the continent, the latter is associated to the fact that
ture-
already shifted to a different stage of their development as presented by the McKinsey
reports or by other academic publications advancing evidences on the existing structural
changes in Africa (IMF, 2012; OECD, 2013). Furthermore, the previous chapter
underlines that manufacturing is leading the economy of SSA despite its small share in
percentage of GDP.
Using the technique of panel orbit analysis, this chapter investigates what is
driving the economy of SSA from the perspective of aggregate demand. It seeks to
understand what is leading the economy from a long run perspective and how factors
such as regional location, geographical condition, and the fact of being a donor-

131
supported or less supported country affect this dynamic. It draws policy implications for
the region with respect to the recent massive flow of investments in agriculture.
The organisation of this chapter is as follows: the next section presents some key
literatures related to the present inquiry. The ensuing section describes the data and
other specifications required for the panel orbit analysis. The fourth section reports the
results. The fifth section discusses the results and draws policy implications for
development policies for the region. The last section concludes this chapter.
5.2. Literature review
Development experts and particularly, the mainstream economists have always been
fascinated by the study of the factors that can induce economic growth, which in recent
years was central to poverty reduction. This proclivity is justified by the development of
theoretical and empirical studies showing that sustained growth can reduce poverty
(Nallari & Griffith, 2011, p. 64). The two authors presented stylised facts on the
development of research on growth from the 1990s to 2005, and identified different
positive empirical results stemming from education, financial development, low
government burden, infrastructures, governance, trade openness and macroeconomic
stabilisation (Nallari & Griffith, 2011, p. 58-59). The WDR2008 also, argued that
growth coming from agriculture is more effective for poverty reduction compared to the
other sectors of the economy (De Janvry & Sadoulet, 2010; World Bank, 2007, p. 22).
However, it is important to note that the effects of growth differ in time and space. The
study of Hasan and Quibria (2004) for instance, indicated that agriculture played a key
role in poverty reduction in SSA and South Asia, whereas, in Latin America and East
Asia, industry and service sectors played this role. Another essential element to
sustained economic growth, and therefore poverty reduction, is the linkages between the

132
different sectors of the economy and the cycle of structural transformation (Barrett,
Carter, & Timmer, 2010; Kuznets, 1966). Structural transformation is characterised by a
decline in the share of agricultural GDP and the rise of the modern sector, a
demographic shift, accompanied by a migration to urban area (Timmer, 2009, p. 5).
Agriculture in Africa, unlike East Asia has missed the Green Revolution that has
made possible the rise of productivity and the improvement of food security conditions.
African agriculture experienced a paradox characterised by a concept described by
Lipton (1977)
urban areas albeit the majority of the population are rural. Under such conditions, the
lack of investments and heavy taxation system was mainly paralysing the farmers.
Howeve
which concentrate all the attention and support to the rural area and pay little attention
to urban migration expected to double by 2030 in SSA (Hove, Ngwerume, &
Muchemwa, 2013), and the intersectoral linkages that should accompany the decline of
rural population alongside with the process of structural transformation. A new
framework for development, however, was presented by the former Vice-President and
Chief Economist of the
(Lin, 2012). Lin puts emphasis on three important elements to take into
consideration: i) infrastructure endowments, the level of development and the economic
structures of developing countries; ii) the role of the state and market at each level as
well as the mechanism of transition from each stage; and iii) the focus on economic
distortions and government strategies to handle them (Lin, 2012, p. 38). Nonetheless,
these ideas did not see any fu
Bank in 2012.

133
5.3. Model, method and data calibration
The method section of the previous chapter explains the principle of calculation
in orbit analysis.The same principle is used in this chapter. The model of structural
transformation is written according to the following identity:
(2)
Where Yis GDP, C is household consumption expenditure (including non-profit
institutions serving households), G is general government final consumption
expenditure, I is gross capital formation, E is exports of goods and services, M is
imports of goods and services.
5.3.1. Data and treatments
The data were retrieved from the United Nations database under the section
national accounts main aggregates database for 38 countries listed in Table 7. These
countries were divided and categorised into four geographical regions composed by
Western, Southern, Middle and Central Africa. Data are in current $US for 1672
observations for the period 1970-2013 for the following variables: C, G, I, E, Mdefined
above.
To construct a cross-sectional data, first, orbit analysis is replicated individually
for each country and then, the results of this process are used to construct a new dataset
treated with STATA®. The data therefore take the following form:
where i is the individual dimension and t is the time dimension.
After the treatment and calibration, the output of orbit analysis retains 1558 of the 5-, 7-
and 9-yearmoving averages. The 9-yearmoving average is selected out of the 5- and 7-
year moving averages given the medium-term variability of the data (Itaki, 2014). A
new series of descriptive and graphical analysis are conducted with the new data sets in

134
order to highlight the dynamics of the GDP aggregates, and to draw implications for
policy discussions.
5.3.2. Geographical definition and calibration
The countries subject to this study are divided into two main categories: the
donor-supported countries receiving assistance from the New Alliance and the GAFSP
(hereafter G8NA) and the less supported countries (hereafter non-G8NA).
These countries are sorted by geographical regions composed by Western,
Southern, Middle and Southern Africa. Other categorical variables are used as a dummy
instrument to assess variations across the groups and regions. These factors are the sub-
regional location, the geography (landlocked or coastal), the political freedom and the
ease of doing business. The following table summarises the structures of these
specifications necessary for these stages.
Table 7 - List of 38 SSA countries and their geographic distributions
G8 countries non-G8 countriesEthipia, Ghana, Kenya, Liberia, Malawi, Mali,Mozambique, Rwanda, Senegal, Tanzania,Uganda, Zambia
Angola, Benin, Botswana, Burkina Faso, Burundi,Central African Republic, Cameroon, Chad,Congo,Cote d'Ivoire, Democratic Republic ofCongo, Equatorial Guinea, Gabon, Gambia,Guinea, Guinea-Bissau, Lesotho, Madagascar,Mauritania, Namibia, Niger, Nigeria, Sierra Leone,Swaziland, Togo, Zimbabwe
Coastal LandlockedAngola, Benin, Cameroon, Cong, Cote D'Ivoire,Democratic Republic of Congo, Equatorial Guinea,Gabon, Gambia, Ghana, Guinea, Guinea-Bissau,Kenya, Liberia, Madagascar, Mauritania,Mozambique, Namibia, Nigeria, Senegal, SierraLeone, Togo, Tanzania
Botswana, Burkina Faso, Burundi, Central AfricaRepublic, Chad, Ethiopia, Lesotho, Malawi, Mali,Niger, Rwanda, Swaziland, Uganda, Zambia,Zimbabwe
Western Africa Southern Africa Eastern Africa Middle AfricaAngola, Benin, BurkinaFaso, Cote D'Ivoire,Gambia, Ghana,Guinea, Guinea-Bissau,Liberia, Mali,Mauritania, Niger,Nigeria, Senegal, SierraLeone, Togo
Botswana, Lesotho,Namibia, Swaziland
Burundi, Ethiopia,Kenya, Madagascar,Malawi, Mozambique,Rwanda, Uganda,Tanzania, Zambia
Cameroon, CentralAfrica Republic, Chad,Congo, DemocraticRepublic of Congo,Equatorial Guinea,Gabon
Source: Author

135
5.4. Results
On average and without any geographical distinction, exports historically leads
the SSA economy, followed by the gross capital formation (investments), imports,
household consumption and finally the government expenditures, all in the sense of
orbit analysis. These results are depicted in Figure 24.
Figure 24 - Mean of the 9-year moving average for 38 SSA countries, 1970-2012
Source: Author
Orbit analysis uses various concepts to describe the changes and variations in a
given analysis. A kick-starter indicates the variable that records the highest ranking
variables. This
study points out two types of the kick-starter. Type 0 (1972 kick-starter) considers all
the time span of the period of analysis and type I (2012 kick-starter), the highest score at
a time twithin a period of analysis.
The degree of variation indicates the intensity of the changes of one variable
across time measured by the standard deviation. The degree of variation helps to
understand the deviation of the leading and following variables.
1.88292 1.84004
2.04055 2.071761.97069
Household Consumption Government Final ConsumptionGCF ExportsImports

136
Figure 25 shows that across the 38 countries, investments play the role of kick-
starter at the beginning of the period of analysis. At the end of this period, imports lead
the economy supported by investments. Four major important periods can be associated
to this long run dynamics across countries, namely: 1974-1983; 1989-1991; 1993-2000
and finally, 2002-onward (see: Figure 30 in the appendix).
Figure 25 - Extreme points of the kick-starters of 38 countries SSA in 1972 and 2012
Source: Author.
1974-1983 is a period marked by the oil shock of 1973 and 1979. The
positions of the imports and the government expenditures slightly rise while
exports and private investment are declining.
1989-1991 coincides with the implementation of the Structural Adjustment
Policy in Africa, and is marked by a significant rise of the rank of the
government expenditures in the leading-following relations.
1993-2000 depicts a rising investment which is heralding changes during
this period. Household consumption significantly rises while export tumbles.
2002-onward: exports lose its pace, whereas public and private investments
pick-up. Major convergence is taking place, that is to say, all the variables

137
are pointing towards one point. SSA also started to record robust growth. At
the end of the period of analysis in 2012, the imports are leading the
economy.
With respect to the degree of variation, across time and countries, gross capital
formation, exports, government expenditures, household consumption and finally
imports are respectively recording a variation from a greater to a lesser extent.
5.4.1. Changes across sub-regional category and geographical conditions
The decomposition at a sub-regional level indicates that the leading-following
relation is changing across time and countries. Table 8 reports these changes across sub-
regions, the kick-starters and the degree of variation across time. The weights of the
data are structured by regions as follows: 42.11; 10.53; 28.95 and 18.42 percent
respectively for the: Western, Southern, Eastern and Middle Africa.
Table 8 - Leading-following relations across sub-regional category, 38 SSA countries 1972-
2012
Rank Western Africa Southern Africa EasternAfrica
Middle Africa
1 E(2.07)
I(2.12)
E(2.15)
I(2.10)
2 I(2.05)
E(2.02)
M(1.99)
M(2.01)
3 M(1.96)
C(1.96)
I(1.95)
E(1.98)
4 C(1.91)
M(1.90)
G(1.89)
C(1.84)
5 G(1.82)
G(1.82)
C(1.84)
G(1.82)
1972 kick-starters1 I
(2.31)I
(2.54)I
(2.39)I
(2.21)2 E
(2.13)E
(2.21)E
(2.06)E
(2.05)3 M
(1.94)C
(2.04)C
(1.94)G
(1.76)4 G
(1.83)M
(1.71)M
(1.94)M
(1.71)5 C
(1.79)G
(1.50)G
(1.67)C
(1.67)2012 kick-starters
1 C(1.68)
I(2.10)
E(2.00)
M(1.97)
2 I(1.66)
M(1.85)
M(1.78)
E(1,83)
3 E(1.63)
G(1.70)
I(1.47)
C(1.46)
4 M C G I

138
(1.56) (1.20) (1.42) (1.46)5 G
(1.48)E
(1.15)C
(1.33)G
(1.29)Degree of variations
1 E(0.517)*
E(0.519)
I(0.542)
G(0.542)
2 I(0.499)
C(0.450)
E(0.497)*
I(0.518)*
3 G(0.483)
G(0.447)
G(0.495)
C(0.482)
4 M(0.450)
I(0.446)*
C(0.495)
E(0.453)
5 C(0.439)
M(0.442)
M(0.473)
M(0.394)
Source: Author.Notes: Detailed data are presented in the supplement of information of this manuscript. Eindicates exports, I indicates gross capital formation, M indicates imports; C indicates householdconsumption; G indicates government expenditures.
Table 8 shows that on average, whereas investments take the lead in Southern
and Middle Africa. In other words, exports and investments in Western Africa,
investments in Southern Africa, exports in Eastern Africa and imports for Middle Africa.
The order of the degree of variation indicates which variable is changing more than
others. Table 8 for instance as the top changing variables within the GDP aggregates. In
Southern Africa this deviation is moderate, while in Eastern and Middle Africa the
changes of the leading variables rank
5.4.2. Leading-following relations under coastal and landlocked conditions
The previous section broadly shows which variable is leading the economy of
one specific sub-region. On the one hand, exports lead the economy of Western and
Eastern Africa, and on the other hand, investments lead in Southern and Central Africa.
makes it possible to better understand the effects of geographical conditions on SSA
economies as well as the stability of the factors that trigger the growth.

139
Figure 26 - Leading-following relations by sub-regional decomposition,
38 SSA countries 1972-2012
Source: Author
Box whisker diagrams depicted inFigure 26 are used to compare the variation of
the leading-following relations. The diagram makes it possible to visually compare the
variables across the region based on five elements: the lowest and highest value
highlighted by the whisker, the lower and upper quartiles and finally the median. The
length of the whisker enables to understand the variation of the ranking points for one
Western coastal Western landlocked
Southern coastal Southern landlocked
Eastern coastal Eastern landlocked
Middle coastal Middle landlocked
Household Consumption Government ConsumptionGross Capital Formation ExportsImports

140
variable over time. The density of the box gives information on the distribution of one
variable vis-à-vis the median and vis-à-vis the other variables.
When disaggregated, the leading variable (exports) in Western Africa shows
slight differences across the costal and landlocked countries. The distribution of the
ranking points in the Western coastal Africa (WCA) is more stable among the other
variables. Interpreted from the viewpoint of convergence, this stability suggests that
exports carry stronger pulling forces on other variables over time.
Exports are slightly dispersed in Western landlocked Africa (WLA) compared to
other variables. The graphical interpretation indicates that exports and investments are
playing an alternate role to herald changes among variables. In other words, over time,
exports are not stable enough to exert traction on other variables.
Similar to the case of Western Africa, the pattern of the distribution and the
deviation of the leading variable investments show a significant contrast when
disaggregated. In Southern coastal Africa (SCA), investments are exerting a stronger
traction on government expenditures and exports compared to household consumption
and imports. In Southern landlocked Africa (SLA), the pulling force of the investments
is more significant on exports and household consumption compared to its pulling
effects on government expenditures and imports.
In Eastern Africa, both coastal (ECA) and landlocked (ELA) countries reveal a
convergence relative to the pulling force exerted by exports on other variables. The
graphical representation of Middle Africa illustrates a significant contrast between
coastal and landlocked countries. In Middle coastal Africa (MCA) the patterns of the
whisker box are similar to the ones in ECA and WCA where investments are almost
equally exerting traction on the other variables. In Middle landlocked Africa (MLA),

141
investments are concentrated despite some lower outliers. Investments are exerting
more significant pulling force on government expenditures than on other aggregate.
5.4.3. Leading-following relations under G8 New Alliance and non-New Alliance
countries and Political freedom
The previous section gives important information of the leading component of the GDP,
its stability, differences as well as similarities across the region. This section explores
the patterns of the convergence among the GDP components while considering political
freedom and the fact of being a donor-supported and less supported country. The
weights of the data are distributed as follows: 13.16 percent of the countries subject to
- -
Figure 27 - Leading-following relations among G8 and non-G8 New Alliances and institutionalsettings
Source: Author2

142
The whisker box makes it possible to compare vertically and horizontally how
institutional settings influence the performance of the countries within the two groups.
-free' countries the pulling force of the leading variables is not equally the same on
the following variables. In other words, exports/investments (leading variable) exert
more pulling traction on investments compared to other following variables. For the
non-New Alliance countries, the pulling traction of the leading variable is almost
equally distributed across the three categories. In other words, when exports/
investments are leading, the other following variables are following in a similar way
like a chain reaction.
-
more stability from the perspective of convergence, i.e. the pulling traction of the
leading variable is leading to a general movement or chain reaction on other variables.
5.4.4. Leading-following relations and the investment climate
Five ranges of interval sorted in a quintile were constructed to classify all the
countries from the best to the lowest performing category. The quintiles were
distributed as follows: the first top ten represents 13.51 percent, the second quintile
27.03, the third quintile 18.92, the fourth quintile 27.03 and the fifth quintile 13.51
percent. In other words, the majority of the countries is falling under the range [10-20]
and [30-40] while the rest are equally distributed across the extreme ranges. The results
of this classification in Figure 28 can be interpreted horizontally across the quintiles.
Figure 28 shows that countries in the second, third and fourth quintiles
demonstrate that the pulling forces generated by the leading variable create a nearly

143
equal chain reaction on the following variables. That is to say, the responses of other
variables are similar when the leading variable exports/investments are moving.
Figure 28 - Leading-following relations considering the business environment for 38 countriesin SSA
Source: Author1
For countries in the first and the fifth categories, the pulling force of the leading
variable is disparate. Investments for example react to a great extent to exports in the
first quintile group. For the case of the fifth quintile, consumption to a great extent
reacts to the pulling force triggered by the investments. After the presentation of the
results the next section is presenting some discussion points about the implications of
these findings for policy making.
5.5. Discussions
To begin, it is necessary to recall the main purpose of this chapter which is the
inquiry of the long run dynamics of the leading-following relations of the driving forces
1st quintile 2nd quintile 3rd quintile
4th quintile 5th quintile
Household Consumption Government ConsumptionGross Capital Formation ExportsImports
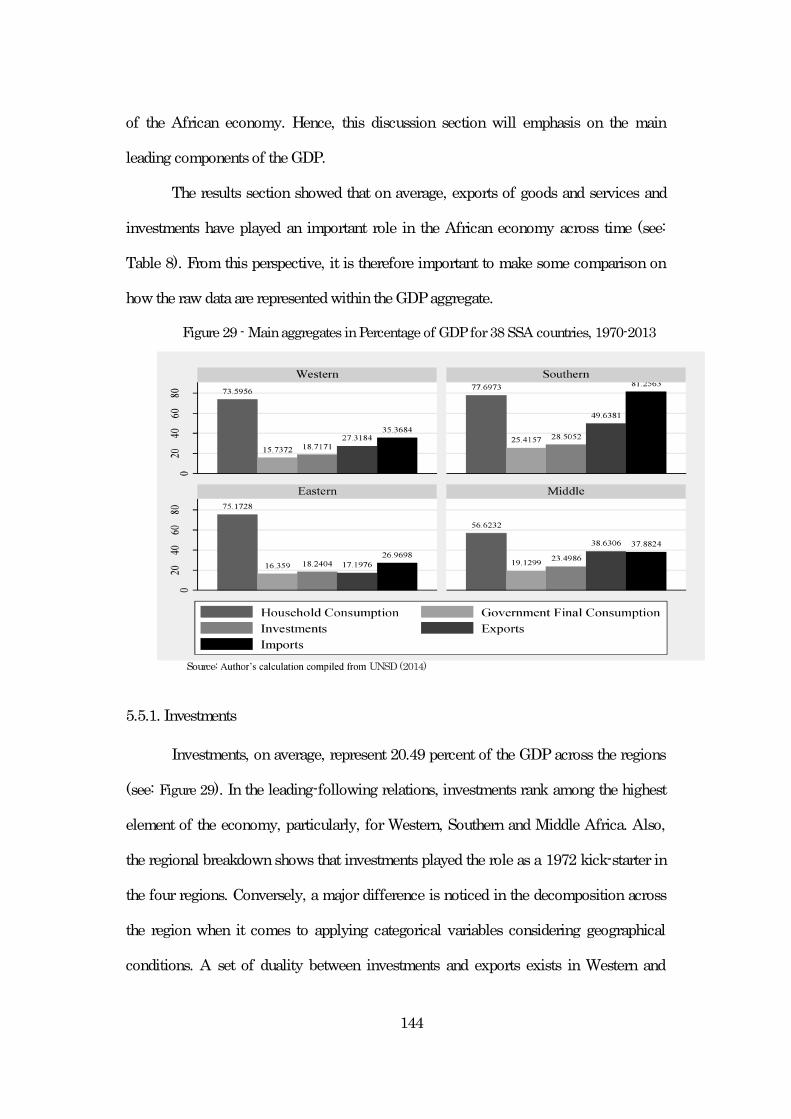
144
of the African economy. Hence, this discussion section will emphasis on the main
leading components of the GDP.
The results section showed that on average, exports of goods and services and
investments have played an important role in the African economy across time (see:
Table 8). From this perspective, it is therefore important to make some comparison on
how the raw data are represented within the GDP aggregate.
Figure 29 - Main aggregates in Percentage of GDP for 38 SSA countries, 1970-2013
Source: UNSD (2014)
5.5.1. Investments
Investments, on average, represent 20.49 percent of the GDP across the regions
(see: Figure 29). In the leading-following relations, investments rank among the highest
element of the economy, particularly, for Western, Southern and Middle Africa. Also,
the regional breakdown shows that investments played the role as a 1972 kick-starter in
the four regions. Conversely, a major difference is noticed in the decomposition across
the region when it comes to applying categorical variables considering geographical
conditions. A set of duality between investments and exports exists in Western and
145
Southern Africa, both for coastal and landlocked. For the New Alliance and non-New
Alliance -
investments, with imports and exports. While looking to the business environment,
investments are positioned at the core of the leading-following relations where the same
three-way relationship with imports and exports exist.
Despite its small proportion to the percentage share of GDP, its rank in the
leading-following relations makes it one of the important determinants of economic
development across time and countries. Moreover, albeit the reluctance about African
investment environment, return on investments in the continent is today one of the
highest in the world as stated by Cooke and Downie (2014), making the region one of
the most attractive place for investment. In policy, such dynamic force implies a
potential for an investment-driven growth. However, there is a little information about
the composition of these investments, whether they are formed by domestic or foreign
sources. Traced across time, investments in the 38 countries were playing a kick-starter
role over time and rank among the highest in the hierarchy of leading-following
relations, but some contractions can be noticed during the period 1986-1989, when
investments were falling while government expenditure increased. A test of correlation
indicates a medium and negative relation (-0.3011) between government expenditures
and investments for 1986-1992.
In macroeconomic theory, domestic investment has been understood as a
function of saving, yet over time, policies stressed more on the importance of FDI to
create positive linkages to the host countries. Indeed, early development theories
underline the importance of saving as a means for private companies to invest, create
jobs and enhance their productivity. Nonetheless, when most of African countries
gained their independence, the saving was missing and was replaced by foreign aid to

146
spur economic growth (Moyo, 2009, p.30). However, this policy did not yield into the
expected results as many countries saw their domestic saving declining while aid was
increasing (Moyo, 2009, p.71). As policies were seeking to replace foreign aid, in the
late 1980s, theories highlighting the importance of FDI were burgeoning, giving
account to its effect on growth. From 2000-2010, the FDI inflows going to Africa
accounted for $40 billion, and are expected to reach the $ 150 billion by 2015. A wide
range of literature highlights that the FDI inflows depend on: market size, price level,
trade barriers, production cost, cost of capital, the indicator of stability and so on. Also,
there is an important debate with regards to the effects of FDI on development in the
host countries. The nature and type of the investments might have positive, negative or
mixed eff (see: Moran et al., 2005; Alfaro et al.,
2010). Recent studies of the World Bank on FDI, combining theoretical and field
are not
necessarily positive in the short-term, but can be beneficial to local participants and
suppliers in the medium to long- (Farole & Winkler, 2014). Nevertheless, as
mentioned earlier, the mixed effect can be misleading. Not only are the FDI effects
different from time and space, but its type also plays a key determinant in the positive
development in the host countries.
The destination of the FDI going into Africa, both for greenfield and mergers
and acquisitions (M&A), is primarily in the secondary and tertiary sector, however, in
the recent years, international institutions led by the World Bank is persistently
fostering investment in agribusiness. FDI going into Africa are two types: Greenfield-
type, which is establishing a new business in the host country and M&A-type in which a
foreign company is taking over the control of a domestic one. These investments can be
directed to the different sector of the economy, such as agriculture, manufacturing,

147
telecommunications and new technology, services and so on. Studies conducted by
Moran et al. (2005) explain that these mixed results are due to the differences at the
level of the host countries in terms of human resources, the sophistication of the private
sector (related to the existence of supply chain linkages) and the politics of the host
governments towards investments and trade. The World Investment Report of 2014
indicates that for Africa, greenfield investments are constantly growing, the announced
value of these FDI amounted a total of $281 billion distributed across the region for
2009-2013, furthermore, the reports stated that 3 percent in primary sector, 48 and 49
percent, respectively in the secondary and tertiary sectors (UNCTAD, 2013).
Nonetheless, since the publication of the WDR2008, the Bank unremittingly
embarked on a series of policies aiming at developing value chain in the continent under
the framework of PPP, and the transformation of African agriculture into a market-
oriented model. The timeline of the publications of the Bank for instance, highlighted
such eagerness to pursue the idea of scaling up African agriculture18. All of these
technical documents were stressing the importance of the agribusiness, the creation of
value chain and PPP. Although, the McKinsey report projected that African food,
apparel and consumer goods would worth $185 billion by 2030, the World Bank report
of 2013 stated that Africa can create a $3 trillion food market which represents an
18 This series includes: Larsen et al., (2009) ; Webber and Labaste (2010) on
value ; Devèze (2011) on
Challenges for African agriculture ; Deininger and Byerlee (2011) interest in farmland: can it yield
; Aksoy (2012) .
Losch et al., (2012) late developing countries in a
. The same year,
another publication by Byamugisha (2013)
Farole and Winkler (2014) -Saharan Africa: Local
spillovers and competitiveness in global value chain

148
important business opportunity more than the investments in other sectors. The
agribusiness lobby was changing their approach to enter SSA through a new modus
operandi which stresses on the PPP. However, such model poses some issues as the
agro-corporation which already controls 60-70 percent of the world food markets are
teaming up with governments, other transnational companies and the international
institutions to increase their control over the food system (Rajaonarison, 2014).
Moreover, recent policy aiming at developing agriculture and ensuring food security,
such as the G8 New Alliance is putting an emphasis on the stabilisation of international
markets that will be organised by value chain (Rajaonarison, 2015). Nonetheless, this
organisational framework also failed to generate the expected effect, especially about
job creation relative to the size of their investments. In addition, other important
problem such as the difference in market mechanism as well as the objective pursued by
the investors and the host countries and the missing linkages at the household level,
policy makers are facing a trilemma while solving the problem of scaling up agriculture
(Rajaonarison, 2015). And finally, the categorisati -
s of the economy to attract
FDI and expand its absorption capacity relative to the rapid population growth and the
urbanisation.
For policy implications, this means that it is necessary for African countries to
devise a new approach to investments taking into considerations the context mentioned
above, such as the population growth, urbanisation, growing consumer markets, and the
need for an upgrade of the skills and knowledge. These sets of policies are crucial for
host countries to create enough room for the modern sectors to absorb the migrating
rural population. Furthermore, the results of the orbit analysis that use the investment
climate as a categorical variable show that investments are accompanied by trade

149
regardless of the regional distribution. Therefore, future policies should be accompanied
by an enabling investment and trade policies in a first stage and promoting a
consumption-driven growth in the long run.
5.5.2. Exports and imports of goods and services:
In this section, the analysis of exports and imports of goods and services are combined
together, as the two variables directly interact each other to form trade. Hence, the
discussions in this section will touch briefly on the results of the orbit analysis, then, it
will focus on the characteristics of trade across the continent and its sub-regions.
In the hierarchy of the leading-following relations, exports alongside with the
investments are playing the role of kick-starters across countries. These two variables
are also among the most influential ones across time. In the percentage share of GDP,
exports represent, on average, 28.47 percent, and for the period 2000-2013, it saw a
steady rise of about 6 points compared to its value in 1972-1982. Nonetheless, despite
this slight increase, the results of the orbit analysis show that the ranking position of the
exports is homogeneously declining. While looking at the sub-regional decomposition,
the results of the orbit analysis does not show a major difference across the regions in
their distributions, except for Western coastal and landlocked, Eastern landlocked in
which the ranking point across countries is slightly scattered, yet, not much different
from the other regions. For the fact of being part or not being part of the New Alliance
countries associated with the political freedom and liberty, exports are predominantly
ontrast
can be noticed for the New Alliance not-free countries (Ethiopia and Uganda), where
exports and imports are mainly leading. Additionally, the categorisation of the business

150
environment shows mixed results highlighting a leading-following altered sequence
between investment-exports-imports.
Imports of goods and services in percentage share of GDP represent on average
38.23 percent, while the results of orbit analysis rank it, on average, at the third position.
At the regional decomposition, imports show feature similar to the general ranking for
Western coastal and landlocked, Southern coastal and landlocked, and Eastern coastal
and middle coastal Africa. This feature is slightly different in Eastern and Middle
landlocked Africa. While looking at the differences, whether these relations change with
the category of being a G8NA or non-G8NA, associated with the political freedom,
imports are leading in the free, non-G8 countries, partly-free G8NA and non-G8NA and
in the not-free G8NA and non-G8NA. Furthermore, while looking at the business
environment conditions, imports are playing more important role in the countries ranked
in the second and third quintile. Although the findings present mixed results with
regards to the geographical decompositions, coastal countries are more involved in
imports of goods and services than the landlocked ones. Beside, political freedom
coupled with the fact of being a G8NA or non-G8NA does not show major difference
among countries, a new opening for further research is to know whether free, and
partly- -
how the hierarchy of leading-following relations is changing while looking at the
business environment indicated that: countries having medium quality are more
engaged in the activity of imports of goods and services.
The characteristics of leading-following relations are a dynamic alteration of
investment, imports and exports. By looking at the pattern of the interaction of these
variables between 2003-2012, three main features are as follows: first, countries,
predominantly engaging in trade, in which imports and exports are playing a dynamic

151
role of leading/following (EM/ME). The second pattern that could be extracted from the
analysis is the IE/EI type, in which investments and exports are playing a dynamic role
of leading/following, and finally, the IM/MI pattern, in which investments and imports
are dynamically leading and following. Countries that exhibit these different types are
regrouped in the following table:
Table 9 - Pattern of the leading-following relations in of trade and investment, SSA, 2003-2012
Western Southern Eastern MiddleEM/ME : Imports exports
Angola Ethiopia DRCGambia Kenya CameroonMauritania MadagascarSierra Leone Uganda
ZambiaZimbabwe
IE/EI type: Investment ExportsBenin Namibia Malawi CongoBurkina Faso BurundiCote d'Ivoire RwandaGuineaNigeriaGuinea-BissauNiger
IM/MI type: Investment ImportsGhana Botswana Mozambique ChadMali Lesotho Tanzania Equatorial GuineaTogo Swaziland CARSenegal GabonLiberiaSource: Author.
The categorisations of these countries, according to the patterns of the
investment/trade relations give rise to the following policy implications:
For the countries solely engaging in trade EM/ME type: to ensure that trade will
be geared towards the establishment of the missing linkages not only with
agriculture but also with the other leading sectors of the economy. Early
literature stated that agricultural exports provide a supply of foreign currencies

152
that enable to purchase capital goods and services needed in the modern sector
(Johnston & Mellor, 1961). And trade instruments can be used to level-up the
labour-absorptive capacity of the modern industries. This latter, however, would
not take off if an enabling environment and human capital are missing,
therefore, policy instruments such as aid or government intervention to create a
learning society are likely to accompany this pattern.
For IE/EI type countries: exports and investments combined together have
positive and negative sides. The two variables have an enormous potential to
improve the productive capacity of a given country, which eventually can create
jobs, but this will only have a positive externalities if the investments are not
mainly coming from foreign sources and the exports not concentrated on natural
resources. Indeed, a massive inflow of FDI coupled with the earnings in foreign
currencies from exports might engender negative externalities such as the
ies, which will have as an
effect the decline of competitiveness over time. In addition, if the investments
are capital intensive, it might not create enough jobs to level-up the labour-
absorptive capacity of the modern sectors. The sophistication of the exports also
matters for the sustainability of its resultant force to lead the economy. The
trends reported by the UNCTAD (2013) in the greenfield investments are
showing that the secondary and third sectors are the targets in which the FDI
inflows are directed to, hence, potential exports and development for the host
countries can be derived from these two sectors in the long run while commodity
driven export could be adopted as a kick-starter in the short run.
For IM/MI type countries: Investments coupled with imports can stimulate the
level of productivity of the African economies and open up another opportunity

153
to enhance export capacity for trade-led strategies. Nonetheless, the role of
imports in the investments varies within the short and the long run and according
to its composition. The trajectory of the orbit analysis indicates that over time,
the role played by imports, government expenditures and consumption are
shifting to an upward movement while exports and investments are following a
declining trend. As stated earlier, trade openness or the importance of trade
relative to the economic activities, is increasing across time and such degree of
openness is getting stronger in Western, Eastern and Middle Africa while it
changes a little in the Southern region. Imports of goods and services will
continue to support the development of the countries in SSA taking into
consideration the inflows of investments going to the secondary and tertiary
sectors. It would play a key role alongside exports and investments both in the
short and long run. In the short run, imports of goods and services would be
associated with the investments in the leading-following relations, whereas, in
the long run, it would follow the leading elements of the GDP.
Imports, investments and exports in the coming years would play a crucial role
in agricultural policy and food security. Since the majority of the countries in SSA are
today net food importers, creating trade and investment policies enhancing the
productive and the absorptive capacity across all sectors would lead to sustainable
economic activities and livelihood for the rapidly changing Africa.
5.6. Conclusion
This chapter investigated the long run driving forces of the SSA economy using the
technique of panel orbit analysis to construct a dynamic hierarchy of leading-following
relations across 38 countries in SSA. While pursuing such endeavour, the method

154
reveals that over the long run, exports and investments are, on average, leading in the
sense of orbit analysis across time and countries.
Regarding the categorisation of SSA as an agriculture-based economy, this
chapter draws from the previous discussions that the strong signal sent by the World
Bank and its partners is inhibiting the productive and absorptive capacity of the modern
sectors which are the main determinant of the future development and food security
policy challenge for the rapidly growing young African population. The discussions
also highlighted that the role of governments has been weakened and faces severe
constraints during major reforms imposed by international institutions.
The analyses of the dynamics of the economy across sub-regions also indicated
there is only a slight difference between the countries studied in this chapter. The same
slight differences can also be noticed while applying categorical variable such as the
fact of being landlocked or coastal economies. Furthermore, the data also show a very
little difference between countries part of the New Alliance and the others, the same
hold for the category of being free, partly-free or not-free country. Therefore, the
chapter draws the conclusion that countries selected in the New Alliance were not
chosen according to their good institutions. This opens up to further research to
understand the criteria from which the countries part of this initiative were selected.
Three patterns of trade and investments were also identified in this chapter,
namely: EM/ME type, IM/MI type and IE/EI type on which common policy could be
devised for agriculture and its linkages to the other sector of the economy.
This chapter also, highlighted some key policy points as a determinant for a
successful and sustainable structural transformation in the region of SSA. It supports the
premise that SSA governments should seek to increase their potential in the other

155
sectors of the economy while devising an appropriate and acute policy towards
investments and trade.

156
Chapter 6: Conceptualising capacity-driven approach the way
forward
6.1. Introduction
Food security and agricultural development policies are changing at a bewildering speed
these recent years, posing new challenges to policy makers and development
practitioners. Producing sufficient, safe and affordable food with fewer resources is one
of the most important development challenges of the coming decades. Such amalgam of
alteration, including the shift to the Sustainable Development Goals, gives rise to the
issue of convergence in terms of policy making not only at the global but also at the
very national level.
The purpose of this chapter is twofold. Firstly, to conceptualise a new approach
that better fits to the versatile conditions of SSA with respect to agriculture and food
security. Therefore, with the organisational tool of policy convergence, it identifies
interfaces that connect the driving and enabling forces with the rural and urban
productive and absorptive capacity. Secondly, this chapter discusses how the current
agriculture and food security issues can be addressed by the capacity-driven approach.
It is argued that the issues of agricultural development and food security are not
solely about bringing technical solutions such as the value chain and the PPP to the rural
area in SSA. The problem of agricultural development and food security is deeply
embedded in the versatility of the relationships between the various sectors of the
economy and conditioned by endowments (enabling and driving forces) each country
possesses.
Policy convergence, which is
, will be guiding the analytical framework of this final chapter. This

157
chapter is structured as follows: the next section will be focusing on the presentation of
the analytical framework of this document. The ensuing section identifies and
elaborates on policy interfaces linking agriculture and food security to the different
elements presented above. The last section concludes this chapter with the definition of
capacity-driven approach.
6.2. Analytical framework
The objectives of this section are to clarify the analytical framework guided by
and to explaining different concepts such as policy context, the
degree of convergence and direction of convergence.
Policy convergence stems from diverse interpretations that rely on
multidimensional perspectives which embrace political, sociological, economical
phenomena. Among definitions that reached common grounds on public policy
literature is the one of Kerr (1983, p. 3) which,
a later interpretation of convergence, Bennett (1991) defined five possible features that
explain the concept of convergence:
i. Policy goals which embrace the willingness to address common policy
problems;
ii. Policy content
i.e. official mechanism such as regulations, normalisation, legal
documents, etc.;
iii. Policy instruments

158
iv. Policy outcomes that deals with the impact or consequences, the result
v. Policy style
Alternatively, due to the complex characteristic of public policy, convergence
has been interpreted across different levels: macro and micro-perspectives to explain
how it occurs (Bennett, 1991). Alongside with the development of industrialisation, not
only had the industrial countries are facing common policy problems but also the
eagerness to go beyond borders unfolds the driving forces of convergence. Therefore, at
the macro-level, convergence accounts for a range of social and economic forces
produced by industrialisation (Bennett, 1991). At the micro-level, the analysis of policy
convergence takes upon case studies which enable to draw unique features that vary
from country to country or from a given unit of analysis. Besides, there are many
discrepancies about the sources Drezner (2001)
e e postulates that society has an influence on the
convergence and emphasises the fact whether convergence occurs because of the
primacy of structural forces or because of the pressures exerted by autonomous agents.
The former highlights the s
dependent variable that implies that different national policies are homogenised into a
global policy. The latter puts forth the agent-
(Drezner, 2001)
organisation of the different elements of a complex body or activity so as to enable them
(OED, 2013).

159
One critique of the previous study on policy convergence is the perspective from
which it has been conducted, i.e. a focus on industrialised countries and their similar
problems. However, policy convergence can also be extended to different context across
time and space especially, when applied to the framework of global food security and
the policy responses devised for it. Particularly, at a very micro-level where policy
inconsistencies exist, as it is the case for the missing linkages in agriculture with the
other sectors of the economy and the external approaches that seek to fix it. Hence, by
coordinated for a very specific goal.
It is also important to mention that the scope of this chapter is not about the
analysis of the cause of policy convergence, but rather on the application of the
theoretical analysis to specific case related to agriculture and food security at sectoral
and territorial levels and their potential connection to the global policy initiative.
Furthermore, as policy interpretation may differ from the angle it is perceived, this
chapter will be mainly discussed from the perspective of SSA countries. Therefore, as a
conceptual framework, this chapter will try to -driven
through three elements:
Policy context and the scope of convergence: It is importantto clarify the context of
policy, the relevant elements that give impulse to countries and institutions to
elaborate harmonised policies. In this case, the context is referred to as the main
target towards which all actors are heading to. Agriculture finally got attention from
the global society, yet the solutions to feed the nine billion populations still divide
ideas. On the one hand, mainstream economists are advocating market solutions
and private sector-led initiative. On the other hand, rural sociologists and
anthropologists defend the importance of the peasantry. Taking a different

160
perspective, this study approaches the policy context of African countries according
to the three arrows: the upward type, indicating a positive relation between land
productivity and the share of employment in the rural area; the straight type,
representing stagnating land productivity; the declining type, representing the
decline of the share of employment in agriculture over time.
The main goal pursued in this case is to increase the productive and absorptive
capacity, -being by removing all the obstacles that
cause inadequate access to food and to build a sustainable agriculture and food system
alongside sectoral linkages. This choice is justified by the fact that most African
countries have not yet reached their potential in terms of maximum achievable yield
amid a great potential relative to large agricultural land and disconnected leading
sectors.
Degree of policy as mentioned by (Holzinger, Knill and Arts, 2008, p. 31) some
distinctions should be made between policy outputs adopted by the governments
and policy outcomes, i.e. the actual effect of policy in terms of achievable goals. To
this extent, policy outputs will be directed to the analysis of the achievement of
some SSA countries based onresults of leading-following relations.
Direction of policies according to Holzinger and Knill (2005), the direction of
convergence consists of the upward or downward movement of policies across
time. This exercise has been explored, through the orbit analysis revealed the
leading-following relations which enabled to draw some patterns across the studied
countries namely, the driving forces and enabling forces. However, as these
patterns are not connected together to reach the policy goals of increasing the
productive and absorptive capacity, policy interfaces needed are the next element to
be identified.

161
Policy interfaces can be described as the common ground where similar elements of
policies are identical yet may differ in terms of content, instrument and style. In this
manner, policy interfaces are therefore the linkages between two common spaces
where policies are evolving together.
After this brief clarification, the following section is focusing on identifying interfaces
for countries in SSA. In this chapter, we categorise interface into three groups: rural,
urban, global interfaces which take into consideration the four elements: productive
capacity, absorptive capacity, driving forces and enabling forces.
After a brief description of the analytical framework of this document, the
purpose of this section is to identify policy interfaces with respect to agriculture and
other sectors of the economy as a result of the previous analyses.
6.3. Identifying policy interfaces
Policy interfaces involve solving problems at three levels: rural, urban and global levels.
These interfaces are constructed from the findings of the present manuscript. Since
economic conditions may vary over time, policy goals, contents and instruments are
e of
direction of convergence is flowing.
Table 10 - Capacity-drivenmatrix
Rural interfaces: facing rural challengesPolicy goals Policy contents Policy
instrumentsPolicy outcomes
ProductivecapacityR1. Positiverelations betweenland and share ofemployment
creatingsustainableeconomicactivities in therural world,willingness tosolve theproblem with thedonors andprivate sectors
Expansion of productionoriented land titling
Land titlinginstitutions
Expansion of theshare of peopleengaged inagriculture

162
R2. Stagnatingland productivity
create researchbased solutionswith untiedtechnology
Increase expenditures inR&D / facilitate accessto improved seeds
GovernmentResearchInstitutes
Positive increase inoutput
AbsorptivecapacityR3. Decliningshare ofemployment overtime
creating Ruralnonfarmactivities,capacitybuilding,
creating alearning society,education andtraining
Improving rural services:Education, training,activity oriented course
RuralCommunityServices
Improvement ofentrepreneurshipcapacity
Improvededucation
Urban Interfaces: handling migrationDriving forcesU1. Manufacturing/Agriculture
Creatingindustrial policymainlyunskilled-intensiveindustry
Improving businessenvironment.Create lightmanufacturing garmentsEnhance skills andknowledge throughinternational labourmarkets
One-Stop-ShopPrivateSector
Increase innumbers of thelightmanufacturingindustry
And developmentof modern industry
Increase ofunskilled-intensivejobs
U2.Mining/Agriculture
Balancingeconomicstructure
Reducing the share ofmining/ agriculture in %GDP to a balanced level
Level-up skill andknowledge
Create service industry
SovereignWealth FundPrivateSector
Increase in thenon-oil or mineralactivities
Decrease inresource basedactivities/agriculture-based
U3. Agriculture/transport
Specialisation inagribusiness andTransport
Trade
Create industrial farmwith an integrated valuechainCreate goodinfrastructure
One-Stop-Shop (forbusinessdevelopment)PrivateSector
Increase inagricultural exportsIncrease indomestic outreach
Enabling forcesU4. Construction Infrastructure
Development:Roads, schools,irrigationfacilities
RuralInfrastructures
Supporttransport
Develop unskilled-intensive labour packagewith the governmentprogram
GovernmentPrivateSector
Increase in thenumbers ofinfrastructuresurban and rural
Increase ofunskilled-labourengaged inconstruction
U5. Wholesale/ Improving local Facilitating ease of Government Increase of micro

163
retailing retail industriesto ensure foodsecurity
Use transport
access of consumergoods, storage facilities
Community-basedPrivateSector
retailing industry /small shops as amarket place
U6. Transport Improvingtransportationnetwork tosupportwholesaleactivitiesImprovingmobility
Connecting the linkageswith construction/wholesale
GovernmentPrivateSector
Increase in numberof transportationvehicles
Increase ofUnskilled-labourjob
U7. Other activities Development ofservicesinfrastructures:
Creating serviceindustries
GovernmentPrivateSector
Increase of servicesjobs
Global Interface: embracing globalisationG1. Trade (EM) Increasing the
degree ofopenness
Enabling trade policy Government Increase in volumeand value of trade
G2.exports/Investment (IE/EI)
Creating andstrengtheningtrade andinvestment
Createsophisticatedexports goods
Export led policySoundmacroeconomic/Monetary policy
Connection withmanufacturing andmining
GovernmentCentralBank
Increase of volumeof trade andForeign currencies
G3.Imports/InvestmentIM/MI
Improvingproductivecapacity withmoderncapital goods
Promoting greenfieldinvestments
Enabling trade policy
Government Increase in modernmachinery,equipment
Source: Author
6.3.1. Facing rural challenges
Based on the findings of this thesis, the fundamental policies related to agricultural
development and food security should address the main problems of productivity and
employment in the rural area. As elaborated in earlier instances, most of African
countries have not yet achieved their maximum yield, which, if addressed with some
Access to land is one possible way that might enhance the absorptive capacity of
agriculture to create economic activities and thus create the Lewis, Johnston and Mellor

164
and Timmer linkages. Two important points to be taken into consideration are about the
stagnating yield and the possible effect of climate change. Government policy to
increase research capabilities would soften these externalities.
In the long run, as the share of employment in agriculture would decline, rural
economic activities, therefore, should be accompanied by nonfarm activities that would
embrace capacity building in education and training as well as entrepreneurship.
Improving rural services are crucial elements to address these issues.
There is a possibility that rural activities cannot embrace the supply of labour, as
a possible outcome of an improved technology or as a result of job market friction, and
other incentives, rural people, would decide to move to the urban area. The evidences
presented inChapter 2 (Figure 5) exhibita sharp increase of the transition from the rural
area to the urban agglomeration.
6.3.2. Handling migration in the urban area
leading the economy. From the findings of this thesis, they can be three types:
manufacturing/agriculture or mining/agriculture and agriculture/transport. To achieve
some degree of prosperity, creating activities through manufacturing is an essential
ingredient for a sustainable economy.
Devising industrial policy is the pathway for manufacturing to work. However,
not all types of manufacturing can match with the African environment due to the
degree of skills and sophistication of the industry. To avoid any major gap in terms of
skills mismatch, unskilled-intensive labour type of manufacturing would enhance the
absorptive capacity in the sector. Light manufacturing textile industry is one of the

165
possible options to direct policy focuses. Government-led initiative to create a signal
and incentive for special investment in this cluster is very essential. The desired
outcome would therefore be the emergence of a new light manufacturing industry with a
major increase in the unskilled-labour intensive jobs.
The second type of driving forces, leading the African economy as seen in the
previous chapters is the economy led by mining/agriculture activities. According to the
findings of this thesis, there are three types of economic structure relying on
mining/agriculture (Figure 19). The first type is characterised by mining activities that
represent more than fifty percent of the percentage share of GDP and a significant gap
with agriculture. The second type is the inverse form of the previous one, where
agriculture takes an important share of the economic activities with a significant gap
with mining. The third type of countries is those having a balanced mining and
agriculture. For the two first types of countries, reducing the gap between the two
sectors and balancing the economy would therefore be the policy challenges. For this to
happen, there is a need to level-up the skills and knowledge to diversify the economic
activities, and open other opportunities in the service industry. For the oil resource-rich
countries, sovereignwealth funds, provided it exists, can offermultiplicity of support to
such initiative.
For the second type of countries, where agriculture is leading over mining, the
same policy goals apply, which consist of reducing the dependence on agriculture, and
to reduce the gap between the sectors. For this type of countries, the problem solving
starts againfromU1, addressing the issue inthe rural area.
Agriculture/transport is the last category of countries identified in this thesis.
Similar to the previous type, problem solving for an agriculture-based economy begins
at the rural level U1. The policy option for this type of countries is the specialisation in

166
agribusiness and transport (including international transportation). This specialisation is,
however, conditioned with the presence of good infrastructure to make it possible for
transport to connect by rural world to the urban, regional and international level. Trade
is one of the global interfaces that goes with these activities, as it will be developed later.
There are three patterns that can be matched with such form of activities EM/ME,
IM/MI/ EM. The outcome of such policy option would yield an increase of agricultural
exports, and the connectivity of the domestic network.
according to the policy goals of a given country.
The enabling forces embrace, construction, transport, and other activities.
The construction sector, as discussed in Chapter 4, carries an enormous potential
to create unskilled-intensive activities. Construction can connect both rural and urban
areas through infrastructure development led by governments. The major policy
absorptive capacity to create jobs and other economic activities that will emerge with it.
The wholesale and retail sectors are playing another enabling force to connect
rural and urban area. A special focus underlined here is on micro retailing industries
which are playing a key role in food security. Not only this industry can serve as a
market platform where people in the rural area can trade their products, but also, it can
be used as a storage system for specific goods and services to enable people in the rural
area to have better access to food. Another aspect of the micro-industry is the sale in
small quantity which is adjustable to the level of income in the rural area. Wholesale
also depends on the transport for the mobility of the goods and services and
construction for the creation of infrastructure and the activity it can generate.

167
Transport activities consist of improving the mobility and the connectivity of a
given country through the transportation network. This activity also connects the two
interfaces of urban and rural areas alongside construction and wholesale. Moreover,
transport can connect the rural areas to the domestic markets and can serve as a storage
facility for the food products, which contributes to better access to food.
e also playing an enabling
role to support the rest of the economy despite the limitation of its absorptive capacity.
The services offered in the other activities can contribute to the maintenance of other
sectors. T creation of services industries is therefore one policy option that can be
addressed by governments and private sectors. Bringing such types of services to the
rural area is also an important challenge in relations with U1, U2 and U3. The last
interface policy can be connected to the two previous interfaces is related to trade and
investment.
6.3.3. Embracing globalisation with the global interface
Globalisation is a phenomenon that should be embraced in the future policy
design for SSA. One of the major findings of this thesis is the fact that trade and
investments are both leading SSA economies on which three patterns of relations arise:
Trade exports-imports (EM) type; exports/Investment type (IE/EI) and
Imports/Investment IM/MI types.
Trade can offer a multiplicity of pathways to SSA to increase its productive
capacity and the level of its technology. Nevertheless, trade should be handled with
careful interpretation, as its outcome might cause an adverse effect to the entire
economy. Trade therefore should be complemented with the other sectors. Particularly

168
to the urban interface connected to U1, U2 and U3. Governments are playing an
essential role in this regard.
exports/Investment type, as discussed in Chapter 5, should be managed with
caution as the outcomes of this pattern can cause severe damage to the economy. Sound
macroeconomic policy and monetary policy are concomitant to the massive flow of
foreign currencies in which a government and a central bank are playing an important
role as a safeguard. Also, manufacturing and agriculture are connected to this type of
trade as far as the degree of sophistication is concerned. Goods and services from
agriculture and manufacturing in the long run should be level-up and diversified to keep
pace with the changing global environment as well as the domestic condition where the
relations among countries would be reshuffled.
Imports/Investment IM/MI type similar to the previous patterns of trade, IM/MI
type should be approached with some degree of prudence, as explained in the discussion
part of Chapter 5, IM/MI type can contribute to the improvement of the productive
capacity, when imports are related to capital goods and services. This pattern, however,
cannot be sustained over time as it might induce a diminishing productive capacity
when domestic industries would not be able to keep their competitiveness. Therefore,
governments are playing an important role to gear these policies towards the other
sectors of the economy within time and space.
6.3.4. Where did the private sector go And what should be the role of donors
The private sector did not disappear in this process. Indeed, as the interface was devised
to channel their activities, signalling the type of investments can therefore devised from
the prevailing conditions in the other interfaces. Question therefore should be posed to
understand such patterns:

169
Investing in what Exporting what Or investing in what And importing what
These questions might yield different responses depending on the country context, and
could be channelled into mining, manufacturing or agriculture.
Not all of the private sector investments in large-scale farming are bad. Indeed,
in an agriculture-led economy, the private sector can play a key to increase the degree
of specialisation of a given country and its competitiveness. However, left alone without
accompanying policies they might induce adverse effects to the local people.
Similarly, not all of the African countries are good places to invest in large-scale
farming. Depending on the patterns and structure of their economy, some sectors might
be more promising than others. Investing in agriculture in a mine-led country, for
instance, might be problematic due to existing trade-off between the two sectors. Also,
land size, geographic conditions and business environment all matter for this type of
investments.
Donors alongside governments are playing a versatile role across the three
interfaces. As discussed in Chapter 5, when a major policy turnaround occurs,
particularly fromthe donors, governments are playing adynamic role to soften negative
externalities. Therefore, alignment and harmonisation can be devised through the three
interfaces depending on the degree of interaction and the interplay between
governments and donors.
Conclusion
This final chapter outlined the major points explored in this thesis, in which through
theoretically and empirically addressed. It then, summarised the major findings and

170
-dri
findings of this thesis with the theoretical tool of policy convergence. To this extent, the
micro-level with policy related to agricultural development and food security.
The use of this tool made possible the identification of three policy interfaces
where various goals, instruments, and outcomes were embedded in the rural, urban and
global interfaces in which different interactions related to productive capacity and
absorptive capacity are taking place.
Three challenges of development were presented alongside these interfaces:
facing rural challenges, handling migration and embracing globalisation. In addition, the
chapter underlined that not all of the private sector investments in agriculture are bad
provided that they are accompanied by other measures. It also stresses on the fact that
not all of the African countries are good places to invest in large-scale farming. This
therefore discards the one-size-fits-
-
Capacity-driven approach is a versatile policy tool centring population at the core of its
purpose, to solve multi-layered, sequenced and sometimes, conflicting problems
arranged through the notion of productive and absorptive capacity with the instrument
of policy interfaces productive capacity in this sense, is the ability of one sector of
the economy to sustained economic activity and employments and the absorptive
capacity is the ability of this sector to match with the supply of labour arisen from
different transition across the interfaces.
This contribution looks beyond the simple approach to agricultural development,
implemented as a technical fix to solve the current issue of food security. It stresses that

171
such development should take place in a manner that SSA countries would be able to
establish the missing linkages with agriculture-based on their economic conditions to
support the driving forces. Such a process will determine the sustainability of their
transformation.

172
Chapter 7: ConclusionAt the dawn of the transition from the MDGs towards the SDGs19, combating poverty
and hunger remains by far the key challenges for developing countries and particularly
for SSA where one out of four people still goes to bed malnourished (FAO, 2013). The
emphasises ending poverty in all its forms anywhere, and the latter about ending hunger,
achieving food security and improved nutrition as well as sustainable agriculture. While
African countries have experienced a significant progress regarding the quality of life of
its population, according to the general assessment of the UN on the MDGs report of
2012 (UN, 2012), there are still much to do regarding the management of effective
policies towards poverty and hunger to keep this progress moving forward and avoid
potential drawbacks as it was the case after 2008. Over the last decade, the proportion of
people living under extreme poverty was falling to 24 percent in 2008 compared to its
(UN, 2012). However, the rise of global food prices
after 2008 pushed 44 million people into poverty according to the estimation of the
World Bank (2011). For that reason, an effective management of food policies that are
affecting poverty in a positive direction is the essential point of the issue of food
sustainability for the coming years.
Additionally, the rise of the African continent is also accompanied by negative
externalities which threaten the sustainability of the access to food due to rapid
population growth. As a reminder, by 2030, 1.3 out of 2 billion additional population
projected by the Population Reference Bureau (2013) will be hailing from the African
continent. With the threat that such transformation represents, the responses of the
multilateral institutions, individual countries, civil societies and the private sector have
19 Sustainable Development Goals

173
been unanimous in emphasising the need to provide solutions built on three narratives:
firstly, reintroduction of agriculture in development thinking which led the
categorisation of SSA countries as an agriculture-based economy. Secondly,
introduction of a new scheme of support based on the PPP mechanism, mainly
dominated by TNCs and buyer-driven value chain into the global food system. And
finally, stabilisation of international market to ensure that countries dependent on
imports will no longer undergo the consequence of the severe shock due to price spikes.
However, despite the fervour with regard to the African continent often ignored for long
time, this thesis highlights significant inconsistencies that cast doubt on the
effectiveness and sustainability to scale-up agriculture, ensure food security and poverty
reduction.
Whyare the recent policies not working and what can be done about it
Shedding light on the three narratives mentioned above and their implications
for agricultural development and food security policies in SSA is the overarching
objective of this manuscript. Additionally, the thesis seeks to propose a new framework
to address the policy inconsistency detected throughout the different inquiries in this
document. It provides theoretical and empirical arguments on the policies that aim to
promote agriculture in the African continent based on a mode of production prioritising
the PPPand value chain.
To this extent, this thesis was set out to answer how the mechanism of PPP and
the concept of value chain are introduced in development strategies to enhance
the private control of the food system and to what extent these strategies are in
contradiction with the apparent realities related to economic conditions, food security
and poverty. Five sub-research questions were posed in the beginning of this manuscript
to address this central question:

174
Why and how the changes in modus operandi in agricultural development
and food security policies, particularly, the market-led paradigm, affect the
modes of production and the way of life of smallholders in a holistic manner
and how this modus operandi socially, politically and economically
marginalises the people in SSA ;
Does the quest for food security through stabilisation of international
markets and the interplay between international, national and household
levels converge in a homogenous way to enable all the food imports
dependent countries to ensure their future food supply and their food
security ;
To what extent does the classification of the region as an agriculture-based
economy inhibit the development of the other sectors of the economy and
the trajectory of its structural transformation
Whatare the driving forces of the economy in the region
-
agricultural and food security policies
To answer these questions, this manuscript was built on two systematic
approaches with respect to the new change in African agriculture and its food security
policy -
core contribution of this manuscript. The first approach examines the problem of food
from the lenses of agency and structuralist schools of political economy and addresses
the first two sub-research questions.
The second approach addresses the data theory to highlight the contradictions in
the implementation of agricultural development and food security policies in SSA
region. The approach explores empirical evidences through the technique of orbit

175
analysis to highlight the contradictions on the evidences presented by the positive
analysis school of political economy on the sectoral decomposition and the relations
between agriculture and other sectors of the economy. Furthermore, using the same
perspective, the thesis also highlights the driving forces of the African economy from
the aggregate demand. The second approach gives an answer to the third and fourth sub-
research question mentioned above.
The new modus operandi and the stabilisation of the world grain markets
The examination of the new modus operandi to address the current African
agricultural and food security problem stresses discussions related to the market-led
paradigm, the PPP and value chain as well as their effects on the African smallholders.
From this perspective, the thesis underlines that the change in modus operandi
marginalises the African smallholder in multiple ways: economically, due to the loss of
the source of livelihood, socially due to the cycle of the poverty trap engendered by that
loss, and politically, due to the loss of control over food.
Additionally, the same theoretical tools stemming from the agency/Structuralist
schools were used to analyse the second narrative related to the stabilisation of the
world grain markets insofar that food security would transcend through three levels,
global, national and household. The thesis draws three concluding points regarding this
topic. Firstly, the differences of market mechanisms, more precisely, how the local and
global grain markets work and their interactions are inconsistent. Local markets are
often non-existent and still need to be created notwithstanding the constraints attached
to them. Global grain markets are nowadays functioning under a complex exchange
mechanism using financial instruments that give room for speculations making the
market more unpredictable. Secondly, the political motives that influence the food
policy at the level of individual countries are other constraints to the second narrative.
176
Each individual country has different conditions with regards to food security and
different resources to address them. The severity of these conditions and the availability
of the resources are two important factors that make it possible for a given country to
address and soften their vulnerabilities. Also, the priority for advanced countries and
SSA countries are also different in their content and directions. High-income countries20
are more directed to the traditional security lenses while the African countries are more
focused on policies that ensure food security through agricultural development and
poverty reduction. And finally, the constraints faced by African agriculture in dealing
with technical/technological barriers as well as physical conditions of the land, led this
thesis to conclude that there is an existing trilemma or an impossible trinity to ensure
food security at the three levels previously mentioned. Moreover, a thorough
examination of the ideological debates with the focus on core competencies, strengths
and expectations of pro-corporatists and the transnational movements indicates that the
African agriculture is changing with the influence of the strong neoliberal proclivities.
In other words, the neoliberal ideology is gaining ground to the grassroots type of
agricultural development.
The thesis proposed as an alternative to the pro-corporatist approach that centres
population in policy design in which productive capacity and absorptive capacity were
partly presented to contribute to the conceptualisation of the capacity-driven agricultural
development and food security. This thesis also gave an insight into the characteristics
of the African agricultural problem represented by three arrows for policy challenges:
the upward type, indicating a positive relation between land productivity and the share
of employment in the rural area; the straight type, representing stagnating land
20 Countries defined in the three Groups

177
productivity and the declining type, representing the decline of the share of employment
in agriculture over time.
What did we learn fromorbit analysis policy and theoretical implications
Another contribution of this thesis is related to data theory, more precisely, the
application of a simple but implacable technique of orbit analysis. Agricultural
development and food security policies advanced by the GAFSP and the New Alliance
are built on empirical evidence that derives from positive analysis. These empirical
studies underline in particular the relations between agriculture and the other sectors of
the economy and more precisely their incidences on poverty reduction. As technical
fixes are prescribed to tackle agricultural development and food security in SSA,
development institutions propel a signalling process, by tagging the region as an
-
for the poor. Such technical solution advances evidences built upon empirical and
thorny methods, yet, with false interpretations with the one-size-fits-all policy packages.
This signalling was ignoring the prevailing conditions in SSA economy, where
structural transformation already took place without the agricultural linkages.
Orbit analysis was adopted to untangle the debate on the chicken-and-eggs on
the role of agriculture in the economy by analysing SSA economic conditions pointed
out by Tsakok and Gardner (2007). Indoing so, this thesis identified various patterns of
. The empirical findings observed from the orbit
analysis clearly shows that the agricultural sector in SSA was outstripped by other
industries since the 1990s. In addition, the regional decomposition, the use of
categorical variables such as political freedom, geographical condition, and the business

178
environment, support that, on the short run21, the leading role played by agriculture was
only robust in a few countries, particularly for countries not part of the GAFSP and
New Alliance. On the long run, the empirical findings suggest that economy of the
continent is led by a hybrid dualism of manufacturing/agriculture.
Moreover, while investigating the long run driving force of the SSA economies
from the perspective of aggregate demand, the thesis draws three other patterns
resulting from the relations between the main aggregates on investments and trade,
namely: trade type, imports-investment type and investment-exporting type. When
coupled with the sectoral decomposition, these three types of categorisation make it
possible to design a new analytical framework that goes beyond the simple
cla -
In this manuscript, we also presented the extension of the orbit analysis. The
method was originally designed by Itaki (2014) to analyse time series data to highlight
the leading and following relations among the analysed variables. The method also
offers a new alternative to the so- -
statistics to determine causal relations. The empirical analysis in this thesis highlights
that orbit analysis not only applies to time series data but also to a panel or longitudinal
type of data. The extension of the method uses the same principle of treatment of the
original orbit analysis and stacks the variables into panel form. Descriptive statistics and
graphical analysis using statistical software (like STATA for the present case) also
makes it possible to understand dynamic movements of each variable and identify on a
time scale its power to pull or to be pulled. Consequently, the method offers acute and
precise information on the study of the possible origins in the change of an economic
21 Based on comparative benchmarks 2000-2008 and 2008-2013.

179
phenomenon at a time t and therefore makes it possible to identify the policy that
triggered those changes.
- of
this thesis,
productive capacity and absorptive capacity at the rural and urban level. Moreover, a
new insight into the concept of policy convergence was introduced in the
conceptualisation of the capacity-driven approach in which three policy interfaces were
identified. The thesis brought forth that the interplay between rural development, urban
migration and globalisation are the essence of the new political economy of agricultural
development and food security.
Sustainable agricultural development and food security in sub-Saharan Africa
The capacity-driven approach is relevant to policy thinking and policy making relative
to the analysis of the nature, the dimension and the direction of policies to be
implemented in the Sustainable Development Goals.
In recent years, several ideas were exchanged on the sustainable development
solution network particularly influenced by Sachs (2015)
ned various ideas related to the development challenges to be
addressed from 2015 to 2030. The challenges for agricultural development and food
security are practically known and exposed by a vast ground of literature. However, as
the initiative is relativ
The theoretical and empirical foundations of the capacity-driven approach offer a
framework to initiate this process. This thesis points out that the problems of
agricultural development and food security begins at the rural level and is extended
systematically to the national and international level. The versatility of this framework

180
will make it possible to devise clear policy design at different level according to the
driving, enabling, productive and absorptive capacity.
Other points however require in depth studies as the focus of this thesis were
based on the combinations of historical facts and empirical studies from data available
on the public domain about the GAFSP and New Alliance. Further country-wide and
micro-perspectives studies are necessary to assess the real conditions on the ground on
the location where agricultural development policy can be conducted, the condition of
the markets, the various economic activities, the quality of the infrastructure, and all the
elements that solely data cannot explain. Further researches that supplement the
capacity-driven approach are therefore expected in the future.

181
References
Addison, T., Arndt, C., & Tarp, F. (2011). The triple crisis and the global aidarchitecture. African Development Review, 23(4), 461-478.
African Development Bank, Organisation for Economic Co-operation and Development& United Nations Development Programme. (2014). African economic outlook2014: global value chain and Africa's industrialisation. Paris: OECD Publishing.
African Development Bank. (2012). Urbanization in Africa. African DevelopmentBank. Retrieved 12-12-2014, fromhttp://www.afdb.org/en/blogs/afdb-championing-inclusive-growth-across-africa/post/urbanization-in-africa-10143/
African Union. (2003). Comprehensive Africa Agriculture Development Programme.Midrand, South Africa: NEPAD.
Aksoy, M. A. (2012). African agricultural reforms: The role of consensus andinstitutions. Washington, D.C: World Bank.
Allan, J. A. (2013). Handbook of land and water grabs in Africa: foreign directinvestment and food and water security. Abingdon, United Kingdom; New York,NY: Routledge.
Askari, H., Rehman, S. S., & Arfaa, N. (2010). Corruption and its manifestation in thePersian Gulf. Cheltenham; Northampton: Edward Elgar.
Atkins, P. J. & Bowler, I. R. (2001). Food in society: economy, culture, geography.London; New York: Arnold.
Ball, T., Dagger, R., & O'Neil, D. (2014). Political ideologies and the democratic ideal.(Ninth ed.) Boston: Pearson.
Barrett, C. B., Carter, M. R., & Timmer, C. P. (2010). A century-long perspective onagricultural development. American Journal of Agricultural Economics, 92(2),447-468.
Barrett, C. B., Reardon, T., & Webb, P. (2001). Nonfarmincome diversification andhousehold livelihood strategies in rural Africa: concepts, dynamics, and policyimplications. Food policy, 26(4), 315-331.
Bennett, C. J. (1991). What is policy convergence and what causes it British journal ofpolitical science, 21(2), 215-233.

182
Berk, R. (2010). What you can and can't properly do with regression. Journal ofQuantitative Criminology, 26(4), 481-487.
Bond, P. (2005). Neoliberalism in sub-Saharan Africa: from structural adjustment toNEPAD. In A. Saad-Filho & J. Deborah (Eds.), Neoliberalism: a critical reader(pp. 230-236). London; Ann Arbor, MI: Pluto Press.
Borras Jr, S. M. (2008). La Vía Campesina and its global campaign for agrarian reform.
Journal of Agrarian Change, 8(2-3), 258-289.
Borras Jr, S. M., Hall, R., Scoones, I., White, B., & Wolford, W. (2011). Towards abetter understanding of global land grabbing: an editorial introduction. TheJournal of Peasant Studies, 38(2), 209-216.
Borras Jr, S. M., McMichael, P., & Scoones, I. (2010). The politics of biofuels, land andagrarian change: editors' introduction. The Journal of Peasant Studies, 37(4),575-592.
Borras, S. M. & Franco, J. C. (2012). Global land grabbing and trajectories of agrarianchange: a preliminary analysis. Journal of Agrarian Change, 12(1), 34-59.
Borras, S. M., Edelman, M., & Kay, C. (2008). Transnational agrarian movementsconfronting globalization. Malden, MA: Wiley Online Library.
Brautigam, D. (2010). The dragon's gift: the real story of China in Africa. Oxford; NewYork: Oxford University Press.
Bravo-Ortega, C. & Lederman, D. (2005). Agriculture and national welfare around theworld: causality and international heterogeneity since 1960. World Bank PolicyResearch Working Paper no.3499.
Brown, L. (2011). The new geopolitics of food: from the Middle East to Madagascar,high prices are spawning land grabs and ousting dictators. Welcome to the 21st-century food wars. Foreign Policy. May/June, pp53 62 Retrieved 06-07-2012.http://foreignpolicy.com/2011/04/25/the-new-geopolitics-of-food/
Brown, L. R. (2012). Full planet, empty plates: the new geopolitics of food scarcity.New York: W.W. Norton & Company.
Bush, R. (2007). Poverty and neoliberalism: persistence and reproduction in the globalsouth. London: Pluto.

183
Byamugisha, F. K. (2013). Securing Africa's land for shared prosperity: a program toscale-up reforms and investments. Washington, D.C.: World Bank.
Cairo, A. (2013). The functional art: an introduction to information graphics andvisualization. Berkeley, CA: New Riders.
Campbell, B. K. (2009). Mining in Africa regulation and development. London; NewYork: Pluto Press.
-Guillaume P.; Sengupta, Debdatta; Hokanson, Karen. (2014). GM agriculturaltechnologies for Africa: A state of affairs. Washington, D.C.: International FoodPolicy Research Institute (IFPRI).
Chang, H. J. (2009). Rethinking public policy in agriculture: lessons from history,distant and recent. The Journal of Peasant Studies, 36(3), 477-515.
Chenery, H. B., Syrquin, M., & Elkington, H. (1975). Patterns of development 1950-1970. Oxford: Oxford University press.
Chevallier, J. & Ielpo, F. (2013). The economics of commodity markets. Hoboken:Wiley, 2013.
Chisholm, A. (2004). Derivatives demystified: a step-by-step guide to forwards, futures,swaps and options. Chichester; Hoboken, NJ: John Wiley & Sons.
Christiaensen, L. J., Demery, L., & Paternostro, S. (2002). Growth, Distribution andPoverty in Africa: Messages from the 1990s. Washington, D.C: World Bank.
Ciarli, T. & Di Maio, M. (2014). Theoretical Arguments for Industrialization-DrivenGrowth and Economic Development. In F.A.S.T.Matambalya (Ed.), Africanindustrial development and European Union co-operation: prospects for areengineered partnership (pp. 30-68). Abingdon, Oxon; New York, NY:Routledge.
Collier, P. (2000). Economic causes of civil conflict and their implications for policy.Washington, DC: World Bank. Retrieved 10-08-2011 from,http://go.worldbank.org/HBOXCW5CZ0

184
Committee on World Food Security. (2013). Investing in smallholder agriculture forfood security: A report by the High Level Panel of Experts on Food Security andNutrition. Rome: FAO.
Cooke, J. G., & Downie, R. D. (2014). Africa at a crossroads: Overcoming theobstacles to sustained growth and economic transformation. Washington, D.C.:Center for Strategic and International Studies.
Cotula, L. (2012). The international political economy of the global land rush: A criticalappraisal of trends, scale, geography and drivers. Journal of Peasant Studies,39(3-4), 649-680.
Cotula, L. (2013). The great African land grab : Agricultural investments and theglobal food system. London; New York: Zed Books.
Daniel, S. (2011). Land grabbing and potential implications for world food security. InM. Behnassi, S. A. Shahid, & J. D'Silva (Eds.), Sustainable AgriculturalDevelopment (pp. 25-42). Dordrecht; New York: Springer.
De Gorter, H., & Swinnen, J. (2002). Chapter 36 Political economy of agriculturalpolicy. In L.G.a.G. Bruce (Ed.), Handbook of Agricultural EconomicsAgricultural and Food Policy (Volume 2, Part B ed., pp. 1893-1943).Amsterdam; New York : Elsevier.
De Janvry, A. & Sadoulet, E. (2010). Agricultural Growth and Poverty Reduction:Additional Evidence. The World Bank Research Observer, 25(1), 1-20.
De Schutter, O. (2011). How not to think of land grabbing: three critiques of large-scaleinvestments in farmland. The Journal of Peasant Studies, 38(2), 249-279.
Deininger, K. (2011). Challenges posed by the new wave of farmland investment. TheJournal of Peasant Studies, 38(2), 217-247.
Deininger, K. W., & Byerlee, D. (2011). Rising global interest in farmland: Can it yieldsustainable and equitable benefits . Washington, D.C: World Bank.
Desmarais, Annette Aurélie (2007). Keeping People on the Land. Low External Inputand Sustainable Agriculture Magazine,Vol.23, Number 1, March. Retrieved 08-02-2014, fromwww.agriculturesnetwork.org/magazines/global/how-farmers-organise/keeping-people-on-the-land/at_download/article_pdf

185
Dethier, J. J. & Effenberger, A. (2012). Agriculture and development: A brief review ofthe literature. Economic systems, 36(2), 175-205.
Devèze, J. C. (2011). Challenges for African agriculture. Paris; Washington, D.C.:Agence Française de Developpement; World Bank.
Diao, X., Hazell, P., & Thurlow, J. (2010). The role of agriculture in Africandevelopment. World Development, 38(10), 1375-1383.
Dinar, A. (2008). Climate change and agriculture in Africa: impact assessment andadaptation strategies. London; Sterling, VA: Earthscan.
Drezner, D. W. (2001). Globalization and policy convergence. International studiesreview, 3(1), 53-78.
Dwivedi, D. N. (2009). Principles of Economics, 2E. New Delhi: Vikas PublishingHouse Pvt Ltd.
Easterly, W. (2013). The tyranny of experts: economists, dictators, and the forgottenrights of the poor. New York: Basic Books.
Economist (The). (2007). Food prices The end of cheap food. The Economist[Electronic version]. Available: http://www.economist.com/node/10252015
Economist (The). (2014). Meat and greens. The Economist. Retrieved 9-03-2015, fromhttp://www.economist.com/news/international/21594348-lot-can-be-done-make-meat-eating-less-bad-planet-meat-and-greens
Economist Intelligence Unit. (2014). Food Security Index. Retrieved 23-7-2014, fromhttp://foodsecurityindex.eiu.com/
ETC Group. (2008). Who Owns Nature : Corporate Power and the Final Frontier inthe Commodification of Life. ETC Group. Retrieved 02-07-2014, fromhttp://www.etcgroup.org/sites/www.etcgroup.org/files/publication/707/01/etc_won_report_final_color.pdf
ETC Group. (2011). Who Will Control the Green Economy ETC Group. Retrieved 15-10-2014, fromhttp://www.etcgroup.org/sites/www.etcgroup.org/files/publication/pdf_file/ETC_wwctge_4web_Dec2011.pdf

186
FAO. (2002). The State of food insecurity in the world 2002. Rome: Food andAgriculture Organization of the United Nations.
FAO. (2009). How to feed the world 2050: Expert meeting, proceedings of a technicalmeeting of experts, Rome, 24-26 June 2009. Rome: Food and AgricultureOrganization of the United Nations.
FAO. (2010). The state of food insecurity in the world 2010: addressing food insecurityin protracted crises. Rome: Food and Agriculture Organization of the UnitedNations.
FAO. (2013). The State of Food Security in the World 2013 The Multiple Dimension ofFood Security. Rome: Food and Agriculture Organization of the United Nations.
Farole, T., Winkler, D., & World Bank. (2014). Making foreign direct investment workfor Sub-Saharan Africa: Local spillovers and competitiveness in global valuechain. Washington, D.C.: The World Bank.
Food and Agriculture Organization of the United Nations (FAO). (1996). Romedeclaration on world food security and world food summit plan of action: WorldFood Summit, 13-17 November 1996, Rome, Italy. Rome: Food and AgricultureOrganization of the United Nations.
Ford, L. (2014). US criticised over increased private sector investment in Africa.Retrieved 1-11-2014, fromhttp://www.theguardian.com/global-development/2014/aug/07/us-criticised-private-sector-investment-africa
Foster, A. D. & Rosenzweig, M. R. (2002). Household division and rural economicgrowth. Review of Economic Studies,64(9) 839-869.
Freedman, D. A. (2009). Limits of Econometrics. International Econometric Review(IER), 1(1), 5-17.
Freedom House. (2014). Freedom in the World 2014: The Annual Survey of PoliticalRights and Civil Liberties. Retrieved 27-01-2015, fromhttps://freedomhouse.org/sites/default/files/FOTP2015%20Category%20Breakdown%201989-2014.xlsx
Friedman, M. (1989). Essays in positive economics. Chicago: University of ChicagoPress.

187
Friedmann, H. & McMichael, P. (1989). Agriculture and the state system: The rise anddecline of national agricultures, 1870 to the present. Sociologia ruralis, 29, 93-117.
Gemmell, N., Lloyd, T. A., & Mathew, M. (2000). Agricultural Growth andIntersectoral Linkages in Developing Economy. Journal of AgriculturalEconomics, 51, 353-370.
Global Agriculture and Food Security Program. (n.d.) Funding. Retrieved 05-08-2014from, http://www.gafspfund.org/content/funding
Godfray, H. C., Beddington, J. R., Crute, I. R., Haddad, L., Lawrence, D., Muir, J. F. etal. (2010). Food Security: The Challenge of Feeding 9 Billion People. Science,327(5967), 812-818.
Gollin, D. (2010). Chapter 73 Agricultural Productivity and Economic Growth. InPrabhu Pingali and Robert Evenson (Ed.). Handbook of Agricultural Economics(Volume 4 ed., pp. 3825-3866). Amsterdam; New York: Elsevier.
Gollin, D., Parente, S., & Rogerson, R. (2002). The role of agriculture in development.American Economic Review,92(2), 160-164.
GRAIN. (2012). The Great Food Robbery: How Corporations Control Food, GrabLand and Destroy the Climate. Cape Town: Pambazuka Press.
Haggblade, S., Hazell, P. B., & Reardon, T. (2007). Transforming the rural nonfarmeconomy: Opportunities and threats in the developing world. Washington, D.C.:IFPRI.
Hall, R. (2011). Land grabbing in Southern Africa: the many faces of the investor rush.Review of African Political Economy, 38(128), 193-214.
Harvey, D. (2005). A brief history of neoliberalism. Oxford; New York: OxfordUniversity Press.
Hasan, R. & Quibria, M. G. (2004). Industry matters for poverty: A critique ofagricultural fundamentalism. Kyklos, 57(2), 253-264.
Headey, D. & Fan, S. (2008). Anatomy of a crisis: the causes and consequences ofsurging food prices. Agricultural Economics, 39(s1), 375-391.

188
Heierli, U. (2008). Market Approaches that work for development - how the privatesector can contribute to poverty reduction. Swiss Agency for Development andCooperation. Retrieved 08-06-2014, fromhttp://www.poverty.ch/documents/Synthesis.pdf
Holt-Giménez, E. & Shattuck, A. (2011). Food crises, food regimes and foodmovements: rumblings of reform or tides of transformation The Journal ofPeasant Studies, 38(1), 109-144.
Holt-Giménez, E. (2009). From food crisis to food sovereignty. Monthly Review, 61(3),142-156.
Holzinger, K. & Knill, C. (2005). Causes and conditions of cross-national policyconvergence. Journal of European public policy, 12(5), 775-796.
Holzinger, K., Knill, C., & Arts, B. (2008). Environmental policy convergence inEurope: The impact of international institutions and trade. Cambridge, UK; NewYork: Cambridge University Press.
IFPRI. (2012). 2012 global hunger index: the challenge of hunger ensuringsustainable food security under land, water, and energy stresses. Washington,D.C.: IFPRI
International Assessment of Agricultural Knowledge, Science and Technology forDevelopment. (2009). Agriculture at a crossroads. Washington, DC: Island Press.
International Council on Mining and Metals. (2012). The Role of Mining in NationalEconomies. Retrieved 15-1-2015, fromhttp://www.icmm.com/the-role-of-mining-in-national-economies
International Fund for Agricultural Development.(2010). Rural Poverty Portal.Retrieved 11-1-2014, fromhttp://www.ruralpovertyportal.org/topic/statistics/tags/indigenous_peoples
Irz, X., Lin, L., Thirtle, C., & Wiggins, S. (2001). Agricultural productivity growth andpoverty alleviation. Development policy review, 19(4), 449-466.
Itaki, M. (2014). orbit analysis of leading-following relations among multiple variables.Ritsumeikan Kokusai Kenkyu (Ritsumeikan Journal of International Studies),27(1), 1-33.

189
Jahan, S. (2006). Human Security. In Clark, D. (Ed). The Elgar companion todevelopment studies (pp. 266-267). Cheltenham, Glos: Edward ElgarPublications.
Jeffries, I. (2011). Economic developments in contemporary Russia. Milton Park,Abingdon, Oxon; New York: Routledge.
Jilberto, A. E. F. (2004). The Political Economy of Neoliberal Governance in LatinAmerica. In J.Demmers, A. E. F. Jilberto, & B. Hogenboom (Eds.), Goodgovernance in the era of global neoliberalism: conflict and depolitisation in LatinAmerica, Eastern Europe, Asia, and Africa. (pp. 33-55). London; New York:Routledge.
Johnson, G., Scholes, K., & Whittington, R. (2005). Exploring corporate strategy.Harlow, England; New York: Financial Times Prentice Hall.
Johnston, B. F. & Mellor, J. W. (1961). The role of agriculture in economicdevelopment. The American Economic Review, 51(4), 566-593.
Jorgenson, D. W. (1961). The development of a dual economy. The Economic Journal,71(282), 309-334.
Kerr, C. (1983). The future of industrial societies: convergence or continuing diversity Cambridge, Mass.: Harvard University Press.
Krueger, A. O., Schiff, M., & Valdes, A. (1991). The political economy of agriculturalpricing policy. Vol. 1: Latin America. Vol 2: Asia. Baltimore; London: Publishedfor the World Bank [by] Johns Hopkins University Press.
Kuznets, S. (1966). Modern economic growth: rate, structure, and spread. New Haven:Yale University Press.
Larsen, K., Kim, R., & Theus, F. (2009). Agribusiness and innovation systems in Africa.Washington, D.C.: World Bank.
Lee, J., Gereffi, G., & Beauvais, J. (2012). Global value chains and agrifood standards:challenges and possibilities for smallholders in developing countries. Proceedingsof the National Academy of Sciences, 109(31), 12326-12331.
Levi, M. A. (2013). Power surge: energy, opportunity, and the battle for America'sfuture. Oxford: Oxford University Press.

190
Levine, R., Loayza, N., & Beck, T. (2000). Financial intermediation and growth:Causality and causes. Journal of monetary Economics, 46(1), 31-77.
Lewis, W. A. (1954). Economic development with unlimited supplies of labour. Themanchester school, 22(2), 139-191.
Li, T. M. (2011). Centering labor in the land grab debate. The Journal of PeasantStudies, 38(2), 281-298.
Lin, J. Y. (2012). New structural economics: A framework for rethinking developmentand policy. Washington, D.C: World Bank.
Lindert, P. (1991). Historical patterns of agricultural policy. In C.P.Timmer (Ed.),Agriculture and the State: Growth, Employment, and Poverty in DevelopingCountries (pp. 29-83). Ithaca: Cornell University Press.
Lipton, M. (1977). Why poor people stay poor: urban bias in world development.Cambridge: Harvard University Press.
Ljungqvist, L. (2008). Lucas critique. In S.N. Durlauf & L. E. Blume (Eds.), The NewPalgrave Dictionary of Economics. Basingstoke: Palgrave Macmillan..
Loayza, N. V. & Raddatz, C. (2010). The composition of growth matters for povertyalleviation. Journal of Development Economics, 93(1), 137-151.
Losch, B., Freguin-Gresh, S., & White, E. T. (2012). Structural transformation andrural change revisited: challenges for late developing countries in a globalizingworld. Washington, D.C.: World Bank.
Lowder, S. K., Skoet, J., & Singh, S. (2014). What do we really know about the numberand distribution of farms and family farms in the world Background paper forThe State of Food and Agriculture 2014. ESA Working Paper No.14-02. Rome,Food and Agriculture Organization.
Madeley, J. (2008). Big business, poor peoples: how transnational corporationsdamage the world's poor. London; New York; New York, NY: Zed Books;Distributed in the USA exclusively by Palgrave Macmillan.
Mamingi, N. (2005). Theoretical and empirical exercises in econometrics. Kingston,Jamaica: University of the West Indies Press.

191
Martin, M. & Owen, T. (2010). The second generation of human security: lessons fromthe UN and EU experience. International Affairs, 86(1), 211-224.
Matondi, P. B., Havnevik, K. J., & Atakilte, B. (2011). Biofuels, land grabbing andfood security in Africa. London; New York; New York: Zed Books; Distributedin the USA exclusively by Palgrave Macmillan.
Mbaku, J. M. (2007). Corruption in Africa: causes, consequences, and cleanups.Lanham, MD: Lexington Books.
McKinsey Global Institute. (2010). Lions on the move: The progress and potential ofAfrican economies. Retrieved 19-7-2013, fromhttp://www.mckinsey.com/insights/africa/lions_on_the_move
McKinsey Global Institute. (2012). McKinsey Africa Consumer Insights Center Report-The rise of the African consumer. Retrieved 07-03-2013, fromhttp://www.mckinsey.com/~/media/McKinsey%20Offices/South%20Africa/PDFs/Rise_of_the_African_consumer-McKinsey_Africa_Consumer_Insights_Center_report.ashx
McMichael, P. (2009a). A food regime analysis of the 'world food crisis'. Agricultureand human value, 26(4), 281-295.
McMichael, P. (2009b). A food regime genealogy. The Journal of Peasant Studies,36(1), 139-169.
McMichael, P. (2012a). Biofuels and the financialization of the global food system. InC Rosin, P Stock, H Campbell (Eds). Food Systems Failure: The Global FoodCrisis and the Future of Agriculture (pp. 60-82). Oxon: Earthscan.
McMichael, P. (2012b). Reframing development: global peasant movements and thenew agrarian question. Revista Nera,10, 57-71.
McMichael, P. (2012c). The land grab and corporate food regime restructuring. Journalof Peasant Studies, 39(3-4), 681-701.
Monsanto (n.d.). Monsanto - saved seed and farmer lawsuits. Retrieved 12-7-2013,fromhttp://www.monsanto.com/newsviews/Pages/saved-seed-farmer-lawsuits.aspx

192
Moran, T. H., Graham, E. M., Blomstrom, & Magnus. (2005). Does foreign directinvestment promote development Washington, D.C.: Institute for InternationalEconomics: Center for Global Development Retrieved fromhttp://site.ebrary.com/id/10251768
Moyo, D. (2009). Dead aid: why aid is not working and how there is a better way forAfrica. New York: Farrar, Straus and Giroux.
Moyo, D. F. (2013). Winner Take All: China's Race for Resources and what it Meansfor the World. New York: Basic Books.
Msangi, S., Tokgoz, S., Batka, M., & Rosegrant, M. (2009). Investment requirementsunder new demands on world agriculture: feeding the world with bioenergy andclimate change. In FAO. How to feed the world 2050: expert meeting,proceedings of a technical meeting of experts, Rome, 24-26 June 2009 (pp. 1-18).Rome: Food and Agriculture Organization of the United Nations.
Nallari, R. & Griffith, B. (2011). Understanding growth and poverty: theory, policy,and empirics. Washington, D.C.: World Bank.
Nelson, G. C., Rosegrant, M. W., Palazzo, A., Gray, I., Ingersoll, C., Robertson, R. etal. (2010). Food security, farming, and climate change to 2050: scenarios,results, policy options. Washington, D.C.: IFPRI.
NEPAD (2003). Comprehensive Africa Agriculture Development Programme.Retrieved 1-11-2014, fromhttp://www.nepad.org/system/files/caadp.pdf
Organisation for Economic Co-operation and Development (2006). Promoting pro-poorgrowth agriculture. Paris: Organisation for Economic Co-operation andDevelopment (OECD).
Organisation for Economic Co-operation and Development (2012). Innovation forDevelopment: a Discussion of the Issues and an Overview of the OECDDirectorate for Science, Technology and Industry. Online. Retrieved 15-1-2015,fromhttp://www.oecd.org/sti/inno/
Owusu, F. (2003). Pragmatism and the gradual shift from dependency to neoliberalism:The World Bank, African leaders and development policy in Africa. WorldDevelopment, 31(10), 1655-1672.

193
Oxford English Online Dictionary. (2013). Coordination. Oxford English onlinedictionary. Retrieved fromhttp://www.oxforddictionaries.com/definition/english/coordination
Oxford Learners Dictionaries. (2015). Ideology. Oxford English online dictionary.Retrieved 15-03-2015, fromhttp://www.oxfordlearnersdictionaries.com/definition/english/ideology q=ideology
Parlapiano, Alicia & Giratikanon, Tom (2013). Janet L. Yellen, on the EconomyTwists and Turns. The New York Times. Retrieved 29-4-2015, fromhttp://www.nytimes.com/interactive/2013/10/09/us/yellen-fed-chart.html
Pearce, F. (2012). The land grabbers: the new fight over who owns the Earth. Boston:Beacon Press.
Peet, R. & Thrift, N. (1989). New models in geography: the political economyperspective Vol. 1. London: Unwin Hyman.
Petermann, A., Guzman, J. I., & Tilton, J. E. (2007). Mining and corruption. ResourcesPolicy, 32(3), 91-103.
Pinstrup-Andersen, P. (2009). Food security: definition and measurement. Foodsecurity, 1(1), 5-7.
Population Reference Bureau. (2013). World population data sheet of the PopulationReference Bureau 2013. Retrieved 26-07-2014, fromhttp://www.prb.org/pdf13/2013-population-data-sheet_eng.pdf
Pretty, J. (2012). Agriculture and food systems our current challenge. In C.Rosin, P.Stock, & H. Campbell (Eds.), Food systems failure: the global food crisis and thefuture of agriculture (pp. 37-52). Oxon: Earthscan.
Rajaonarison, H. (2015). The trilemma of agricultural development and food security insub-Saharan Africa. Ritsumeikan International Affairs, 13(1), 31-54.
Rajaonarison, H. M. (2014). Food and human security in Sub-SaharanAfrica. ProcediaEnvironmental Sciences, 20, 377-385.

194
Rajotte, T. & Tansey, G. (2009). The future control of food: a guide to internationalnegotiations and rules on intellectual property, biodiversity, and food security.Sterling, VA: Earthscan.
Rakotoarisoa, M., Iafrate, M., & Paschali, M. (2011). Why has Africa become a net foodimporter. Food and Agriculture Organization of the United Nations..
Ramasamy, S. (2011). World Food Security: The challenges of climate change andbioenergy. In R.Lal, M. V. K. Sivakumar, S. M. A. Faiz, A. H. M. MustafizurRahman, & K. R. R. Islam (Eds.). Climate Change and Food Security in SouthAsia (pp. 183-213). Houten, Netherlands: Springer.
Ranis, G. & Fei, J. C. (1961). A theory of economic development. The AmericanEconomic Review,51(4), 533-565.
Ravallion, M. & Datt, G. (1996). How important to India's poor is the sectoralcomposition of economic growth The World Bank Economic Review, 10(1), 1-25.
Reardon, T. (1997). Using evidence of household income diversification to informstudy of the rural nonfarm labor market in Africa. World Development, 25(5),735-747.
Regional Strategic Analysis and Knowledge Support System for Southern Africa (the)(2013). Regional Strategic Analysis and Knowlegde Support System. Retrieved 1-11-2014, fromhttp://www.reskakss.org/publications/7
Rosin, C. J., Campbell, H., & Stock, P. V. (2012). Food systems failure: The globalfood crisis and the future of agriculture. Oxon: Earthscan.
Rosin, C., Stock, P., & Campbell, H. (2013). Food systems failure: The global foodcrisis and the future of agriculture. Oxon: Earthscan.
Rostow, W. W. (1960). The stages of economic growth: a non-Communist manifesto.Cambridge [England]: University Press.
Sachs, J. (2005). The end of poverty: economic possibilities for our time. New York:Penguin Press.
Sachs, J. (2015). The age of sustainable development. New York: Columbia UniversityPress.

195
Sachs, J., Remans, R., Smukler, S., Winowiecki, L., Andelman, S. J., Cassman, K. G. etal. (2010). Monitoring the world's agriculture. Nature, 466(7306), 558-560.
Sahle, E. N. (2007). African states' NEPAD project: a global elite neoliberal settlement.In J. Mensah (Ed.), Neoliberalism and globalization in Africa: contestations fromthe embattled continent (2 ed., pp. 135-154). New York: Palgrave Macmillan.
Schanbacher, W. D. (2012). The politics of food: the global conflict between foodsecurity and food sovereignty. Santa Barbara, California: Praeger SecurityInternational.
Schmidhuber, J., Bruinsma, J., & Boedeker, G. (2009). Capital requirements foragriculture in developing countries to 2050. InFAO. How to feed the world 2050:expert meeting, proceedings of a technical meeting of experts, Rome, 24-26 June2009 (pp. 24-26). Rome: Food and Agriculture Organization of the UnitedNations.
Sen, A. (1981). Poverty and famine: an essay on entitlement and deprivation. Oxford;New York: Clarendon Press; Oxford University Press.
Seralini, G. E., Clair, E., Mesnage, R., Gress, S., Defarge, N., Malatesta, M. et al.(2012). RETRACTED: Long-term toxicity of a Roundup herbicide and aRoundup-tolerant genetically modified maize. Food and chemical toxicology,50(2012), 4221-4231.
Seralini, G. E., Clair, E., Mesnage, R., Gress, S., Defarge, N., Malatesta, M. et al.(2014). Republished study: long-term toxicity of a Roundup herbicide and aRoundup-tolerant genetically modified maize. Environmental Sciences Europe,26(1), 1-17.
Smith, D. (2014). Africa can feed itself in a generation, says author, if leaders take upcause. Retrieved 5-02-2015, fromhttp://www.theguardian.com/environment/2010/dec/02/africa-feed-itself-generation
StataCorp, L. P. (2011). Stata time series reference manual : release 12. CollegeStation, Tex.: StataCorp LP.
Steger, M. B. & Roy, R. K. (2010). Neoliberalism a very short introduction. Oxford;New York: Oxford University Press.

196
Stiglitz, J. E. (2012). The price of inequality:how today's divided society endangers ourfuture. New York: W.W. Norton & Co.
Syngenta. (2013). Syngenta to acquire African corn seed business. Retrieved 12-9-2014, fromhttp://www.syngenta.com/global/corporate/en/news-center/news-releases/Pages/130703.aspx
Syrquin, M. (2006). Structural transformation.In Clark, D.(Ed). The Elgar Companionto Development Studies (pp. 601-607). Cheltenham, UK: Edward ElgarPublishers.
Thies, C. G. & Porche, S. (2007). The political economy of agricultural protection.Journal of Politics, 69(1), 116-127.
Timmer, C. P. (2005). Food Security and Economic Growth: an Asian perspective.Asian-Pacific. Economic Literature, 19(1), 1-17.
Timmer, C. P. (2009). A world without agriculture: The structural transformation inhistorical perspective. Washington, D.C.:Aei Press.
Tsakok, I. & Gardner, B. (2007). Agriculture in economic development: primary engineof growth or chicken and egg American Journal of Agricultural Economics,89(5), 1145-1151.
U.S. Securities and Exchange Commission. (2012). Form 10-K Monsanto annual reportpursuant to section 13 or 15(d) of the securities exchange act of 1934 for thefiscal year ended Aug. 31, 2012. Retrieved 15-08-2014, fromhttp://www.monsanto.com/investors/documents/annual%20report/2012/2012-10k.pdf
UNDP. (2009). From conflict to peacebuilding: The role of natural resources and theenvironment. Nairobi: United Nations Environment Programme.
UNDP. (2012). Africa humandevelopment report 2012: towards a food secure future.New York: UNDP.
United Nations Conference on Trade and Development & United Nations IndustrialDevelopment Organization. (2011). Economic development in Africa report 2011fostering industrial development in Africa in the new global environment. UnitedNations Conference on Trade and Development [Electronic version]. Retrieved 1-07-2014, from:

197
http://search.ebscohost.com/login.aspx direct=true&scope=site&db=nlebk&db=nlabk&AN=387592
United Nations Conference on Trade and Development. (2009). World investmentreport 2009: Transnational corporations, agricultural production anddevelopment. New York: United Nations.
United Nations Conference on Trade and Development. (2013). Economic developmentin Africa: report 2013 - intra-African trade, unlocking private sector dynamism.Retrieved 08-06-2014, fromhttp://unctad.org/en/PublicationsLibrary/aldcafrica2013_en.pdf
United Nations Development Programme (UNDP). (1994). Human development report1994. New York: Oxford University Press for the UNDP.
United Nations Statistical Division. (2008). International Standard industrialclassification of all economic activities (ISIC). (4 ed.) New York: United Nations.
United Nations Statistics Division. (2014). National Accounts Main AggregatesDatabase. Retrieved 18-07-2014, fromhttp://unstats.un.org/unsd/snaama/dnltransfer.asp fID=3
United Nations System Standing Committee on Nutrition. (2015). Nutrition targets andindicators for the SDGs. Retrieved 20-04-2015, fromhttp://www.unscn.org/files/Publications/Post_2015_Nutrition_Targets_and_Indicators_final_March_2015_website_.pdf
United States Agency for International Development. (18-4-2013). More than $3 billionin Private Sector Investment for the New Alliance for Food Security and Nutrition- U.S. Agency for International Development. U.S.Agency for InternationalDevelopment. Retrieved 26-7-2013, fromhttp://www.usaid.gov/news-information/fact-sheets/more-3-billion-private-sector-investment-new-alliance-food-security-and
Usher, B. H. & Vermeulen, P. D. (2006). The impacts of coal and gold mining on theassociated water resources in South Africa. In Y.Xu & B. Usher (Eds.),Groundwater Pollution inAfrica (pp. 301-313). London; New York: Taylor &Francis.

198
Via Campesina. (2007). Declaration of Nyéléni February 2007. Retrieved 28-03-2014from, www.nyeleni.org
Vucevic, D. & Yaddow, W. (2012). Testing the data warehouse practicum: assuringdata content, data structures and quality. Bloomington, Indiana: Trafford OnDemand Pub.
Webber, C. M., Labaste, P., & World Bank. (2010). Building competitiveness in Africa'sagriculture: A guide to value chain concepts and applications. Washington, D.C.:World Bank.
White House (The). (18-5-2012). New Alliance for Food Security and Nutrition.Retrieved 6-07-2013, fromhttp://www.whitehouse.gov/blog/2012/05/18/new-alliance-food-security-and-nutrition
Williams, J. (2012). Competition and efficiency in international food supply chain:improving food security. London; New York: Routledge.
World Bank. (18-4-2013c). PovcalNet- an online poverty analysis tool. Retrieved 17-7-2013c, fromhttp://iresearch.worldbank.org/PovcalNet/index.htm
World Bank. (1982). World development report, 1982. New York; Oxford: Publishedfor the World Bank, Oxford University Press.
World Bank. (2007). World development report 2008 agriculture and development.Washington, D.C.: World Bank.
World Bank. (2011). Food Price Watch World Bank, Year 2, Issue 5, February 2011.Retrieved 16-10-2014, fromhttp://documents.worldbank.org/curated/en/2011/02/14964069/food-price-watch
World Bank. (2012a). Sub-Saharan Africa: regional data from the World DevelopmentIndicators 2012. World Bank [Electronic version]. Available:http://data.worldbank.org/data-catalog/world-development-indicators/wdi-2012
World Bank. (2012b). Africa Can Help Feed Africa Removing barriers to regionaltrade in food staples. Washington, D.C.: World Bank, Africa Region, PovertyReduction and Economic Management Division 1. Retrieved 12-03-2014, fromhttp://siteresources.worldbank.org/INTAFRICA/Resources/Africa-Can-Feed-Africa-Report.pdf

199
World Bank. (2013a). Implementing agriculture for development: World Bank Groupagriculture action plan (2013-2015). Washington, D.C.: World Bank Group.
World Bank. (2013b). Indicators, Data - Cereal yield (kg per hectare). Retrieved 25-05-2014, fromhttp://data.worldbank.org/indicator/AG.YLD.CREL.KG
World Bank. (2014a). Food Price Watch- World Bank, Year 5, Issue 17, May 2014.Retrieved 16-10-2014, fromhttp://www.worldbank.org/content/dam/Worldbank/document/Poverty%20documents/FPW_May%202014_final.pdf
World Bank. (2014b). Doing Business Index in Sub-Saharan Africa. Retrieved 05-03-2015, fromhttp://www.doingbusiness.org/rankings#
World Bank. (2015). Global Economic Monitor Commodities. Retrieved 06-02-2015from, http://data.worldbank.org/data-catalog/commodity-price-data
World Development Movement. (2010). The Great Hunger Lottery - How bankingspeculation causes food crises. Retrieved 16-05-2014, fromhttp://www.wdm.org.uk/food-speculation/great-hunger-lottery#sthash.Wla1cQjb.dpuf
World Development Movement. (2013). Golman Sachs made up to $400 million bettingon food prices in 2012.Retrieved 16-05-2014, fromhttp://www.wdm.org.uk/food-and-hunger/goldman-sachs-made-%C2%A3251-million-betting-food-prices-2012
Yescombe, E. R. (2007). Public-private partnerships: principles of policy and finance.Amsterdam: Elsevier.
Zhao, M. & Zhang, Y. (2009). Development and urbanization: a revisit of Chenery andSyrquins patterns of development. The Annals of Regional Science, 43, 907-924.
Zimmermann, R. (2009). Agricultural policies in Sub-Saharan Africa: understandingCAADP and APRM policy processes. Bonn: Deutsche Institut für
Entwicklungspolitik (DIE).

200
Appendix
Table 11 describes the variables used in Chapter 2 regarding land, crop yield, employment, population
and the Gini coefficient to measure inequality.
Table 11 - Description of the variables from the World Bank Development Indicators
Table 12 depicts the summary statistics for all the variable mentioned above.
Table 12 - Summary Statistics of WDI data

201
Table 13 describes that raw data before the treatments for orbit analysis.
Table 13 - Description of the raw data SSA
Correlation table for the variables analysed in chapter 4.

202
Table 14 - Correlation table of the intersectoral data by industry
AGRICULTURE MINING MANUFACTURING CONSTR TRANSPORT OTHERAGRICULTURE 1.000000 0.850370 0.929148 0.763699 0.961440 0.969432MINING 0.850370 1.000000 0.891973 0.783795 0.848629 0.846756MANUFACTURING 0.929148 0.891973 1.000000 0.801490 0.930290 0.946056CONSTR 0.763699 0.783795 0.801490 1.000000 0.845083 0.836423TRANSPORT 0.961440 0.848629 0.930290 0.845083 1.000000 0.985563OTHER 0.969432 0.846756 0.946056 0.836423 0.985563 1.000000
Table 15 - Correlation table of the aggregate demand data
CONS GOV GCF E MCONS 1.000000 0.640250 0.884038 0.848738 0.846332GOV 0.640250 1.000000 0.854430 0.608628 0.617655GCF 0.884038 0.854430 1.000000 0.809237 0.822343E 0.848738 0.608628 0.809237 1.000000 0.948927M 0.846332 0.617655 0.822343 0.948927 1.000000
Table 16 - Summary statistics of the orbit analysis output 9-year moving average

203
Table 17 - Summary statistics of the results of orbit analysis at a country level
Table 18 - Summary statistics of the results of orbit analysis for the aggregate demand

204
Figure 30 - Homogeneous panel of leading-following relations for 38 countries in SSA 1972-2012
205
**The New Political Economy of Agricultural Development and Food Security in sub-Saharan Africa**
**by RAJAONARISON Haja, Graduate School of International Relations, Ritsumeikan University**
**Last updated 20/10/2015
**correspondance: gr0079v@ ed.ritsumei.ac.jp
** users are recommended to use the do-file in stata. The present code works under STATA® 12. Some modules might be required
for some codes.
********************************
**Variable treatment in case of raw data**
** these treatment are part of the preliminary calibration, the data are already applied to the current data.
label variable country "Country"
label variable year "year"
label variable c "Household Consumption"
label variable g "Government Consumption"
label variable i "Gross Capital Formation"
label variable e "exports"
label variable m "Imports"
label variable dummy "Geographic category"
label variable dummy2 "Landlocked and coastal"
label variable dummy3 "G8NA Non-G8NA"
label variable dummy4 "Political freedom"
label variable dummy5 "Business Environment"
label variable country1 "Country"
drop country
***************************************
**encoding the variable country to get a variable that can be used in panel data setting**
encode country, gen(economy)
**set the data as a panel***
xtset economy year
*****************************
graph bar (mean) c g i e m, blabel(bar) ytitle(score) title(Mean of the moving average) subtitle(for 38 countries in sub-Saharan
Africa) legend(order(1 "Household Consumption" 2 "Government Final Consumption" 3 "GCF" 4 "exports" 5 "Imports"))
graph bar (mean) c g i e m if dummy==0, blabel(bar) ytitle(score) title(Mean of the moving average) subtitle(Western Africa)
legend(order(1 "Household Consumption" 2 "Government Final Consumption" 3 "GCF" 4 "exports" 5 "Imports"))
graph bar (mean) c g i e m if dummy==1, blabel(bar) ytitle(score) title(Mean of the moving average) subtitle(Southern Africa)
legend(order(1 "Household Consumption" 2 "Government Final Consumption" 3 "GCF" 4 "Exports" 5 "Imports"))
graph bar (mean) c g i e m if dummy==2, blabel(bar) ytitle(score) title(Mean of the moving average) subtitle(Eastern Africa)
legend(order(1 "Household Consumption" 2 "Government Final Consumption" 3 "GCF" 4 "exports" 5 "Imports"))

206
graph bar (mean) c g i e m if dummy==3, blabel(bar) ytitle(score) title(Mean of the moving average) subtitle(Middle Africa)
legend(order(1 "Household Consumption" 2 "Government Final Consumption" 3 "GCF" 4 "Exports" 5 "Imports"))
*****************************
graph bar (firstnm) c g i e m, blabel(bar) ytitle(score) title(Mean of the moving average) subtitle(for 38 countries in sub-Saharan
Africa) legend(order(1 "Household Consumption" 2 "Government Final Consumption" 3 "GCF" 4 "Exports" 5 "Imports"))
graph bar (firstnm) c g i e m if dummy==0, blabel(bar) ytitle(score) title(Mean of the moving average) subtitle(Western Africa)
legend(order(1 "Household Consumption" 2 "Government Final Consumption" 3 "GCF" 4 "Exports" 5 "Imports"))
graph bar (firstnm) c g i e m if dummy==1, blabel(bar) ytitle(score) title(Mean of the moving average) subtitle(Southern Africa)
legend(order(1 "Household Consumption" 2 "Government Final Consumption" 3 "GCF" 4 "Exports" 5 "Imports"))
graph bar (firstnm) c g i e m if dummy==2, blabel(bar) ytitle(score) title(Mean of the moving average) subtitle(Eastern Africa)
legend(order(1 "Household Consumption" 2 "Government Final Consumption" 3 "GCF" 4 "Exports" 5 "Imports"))
graph bar (firstnm) c g i e m if dummy==3, blabel(bar) ytitle(score) title(Mean of the moving average) subtitle(Middle Africa)
legend(order(1 "Household Consumption" 2 "Government Final Consumption" 3 "GCF" 4 "Exports" 5 "Imports"))
***************************
graph bar (lastnm) c g i e m, blabel(bar) ytitle(score) title(Mean of the moving average) subtitle(for 38 countries in sub-Saharan
Africa) legend(order(1 "Household Consumption" 2 "Government Final Consumption" 3 "GCF" 4 "Exports" 5 "Imports"))
graph bar (lastnm) c g i e m if dummy==0, blabel(bar) ytitle(score) title(Mean of the moving average) subtitle(for 38 countries in
sub-Saharan Africa) legend(order(1 "Household Consumption" 2 "Government Final Consumption" 3 "GCF" 4 "Exports" 5
"Imports"))
graph bar (lastnm) c g i e m if dummy==1, blabel(bar) ytitle(score) title(Mean of the moving average) subtitle(for 38 countries in
sub-Saharan Africa) legend(order(1 "Household Consumption" 2 "Government Final Consumption" 3 "GCF" 4 "Exports" 5
"Imports"))
graph bar (lastnm) c g i e m if dummy==2, blabel(bar) ytitle(score) title(Mean of the moving average) subtitle(for 38 countries in
sub-Saharan Africa) legend(order(1 "Household Consumption" 2 "Government Final Consumption" 3 "GCF" 4 "Exports" 5
"Imports"))
graph bar (lastnm) c g i e m if dummy==3, blabel(bar) ytitle(score) title(Mean of the moving average) subtitle(for 38 countries in
sub-Saharan Africa) legend(order(1 "Household Consumption" 2 "Government Final Consumption" 3 "GCF" 4 "Exports" 5
"Imports"))
*****************************
tab dummy, gen(region)
gen region1=1 if dummy==0
gen region2=1 if dummy==1
gen region3=1 if dummy==2
gen region4=1 if dummy==3
************************************
graph bar (firstnm) c g i e m, blabel(bar) ytitle(score of the ranking points) title (Kick-Starters) legend(order(1 "Household
Consumption" 2 "Government Final Consumption" 3 "GCF" 4 "Exports" 5 "Imports"))name(First, replace) nodraw

207
graph bar (lastnm) c g i e m, blabel(bar) ytitle(score of the ranking points)title (Last Performers) legend(order(1 "Household
Consumption" 2 "Government Final Consumption" 3 "GCF" 4 "Exports" 5 "Imports"))name(Last, replace) nodraw
grc1leg First Last, cols(2)
*************************************
**Dummy are: 0 for Western; 1 for southern; 2 for Eastern and 3 for Middle Africa
**Western Africa
graph box c g i e m if dummy==0 & dummy2==0, ytitle(Score of the ranking points)title(coastal countries) name(coastal, replace)
nodraw
graphbox c g i e m if dummy==0 & dummy2==1, title(landlocked countries) name(landlocked, replace) nodraw
grc1leg coastal landlocked, cols(2) title(Western Africa) note(Source:Author's calculation)
**Southern Africa
graph box c g i e m if dummy==1 & dummy2==0, ytitle(Score of the ranking points)title(coastal countries) name(coastal, replace)
nodraw
graph box c g i e m if dummy==1 & dummy2==1, title(landlocked countries) name(landlocked, replace) nodraw
grc1leg coastal landlocked, cols(2)title(Southern Africa) note(Source:Author's calculation)
** Eastern Africa
graph box c g i e m if dummy==2 & dummy2==0, ytitle(Score of the ranking points)title(coastal countries) name(coastal, replace)
nodraw
graph box c g i e m if dummy==2 & dummy2==1, title(landlocked countries) name(landlocked, replace) nodraw
grc1leg coastal landlocked, cols(2)title(Eastern Africa) note(Source:Author's calculation)
** Middle Africa
graph box c g i e m if dummy==3 & dummy2==0, ytitle(Score of the ranking points)title(coastal countries) name(coastal, replace)
nodraw
graph box c g i e m if dummy==3 & dummy2==1, title(landlocked countries) name(landlocked, replace) nodraw
grc1leg coastal landlocked, cols(2)title(Middle Africa) note(Source:Author's calculation)
*************************************
** Coastal=0 and Landlocked=1
graph box c g i e m if dummy==0 & dummy2==0, title(Western coastal) name(first, replace) nodraw
graph box c g i e m if dummy==0 & dummy2==1, title(Western landlocked) name(second, replace) nodraw
graph box c g i e m if dummy==1 & dummy2==0, title(Southern coastal) name(third, replace) nodraw
graph box c g i e m if dummy==1 & dummy2==1, title(Southern landlocked) name(fourth, replace) nodraw
graph box c g i e m if dummy==2 & dummy2==0, title(Eastern coastal) name(fifth, replace) nodraw
graph box c g i e m if dummy==2 & dummy2==1, title(Eastern landlocked) name(six, replace) nodraw
graph box c g i e m if dummy==3 & dummy2==0, title(Middle coastal) name(seven, replace) nodraw
graph box c g i e m if dummy==3 & dummy2==1, title(Middle landlocked) name(eight, replace) nodraw
grc1leg first second third fourth fifth six seven eight, cols(2) rows(4)note(Source:Author's calculation)
**************************************

208
**New alliance=0 Non-New Alliance/ Political freedom: free:0, partly-free:1; not-free:2
graph box c g i e m if dummy3==0 & dummy4==0, title(New Alliance free) name(first, replace) nodraw
graph box c g i e m if dummy3==0 & dummy4==1, title(New Alliance Partly-free) name(second, replace) nodraw
graph box c g i e m if dummy3==0 & dummy4==2, title(New Alliance not-free) name(third, replace) nodraw
graph box c g i e m if dummy3==1 & dummy4==0, title(Non New Alliance free) name(fourth, replace) nodraw
graph box c g i e m if dummy3==1 & dummy4==1, title(Non New Alliance partly-free) name(five, replace) nodraw
graph box c g i e m if dummy3==1 & dummy4==2, title(Non New Alliance not-free) name(six, replace) nodraw
grc1leg first second third fourth five six, cols(3) rows(2)note(Source:Author's calculation)
*************************************
** Ease of doing business in a New and Non-New Alliance country**
** top [1-10]: 1; [10-20]:2; [20-30]:3;[30-40]:4;[40-50]:5**
graph box c g i e m if dummy5==1, title(1st quintile) name(first, replace) nodraw
graph box c g i e m if dummy5==2, title(2nd quintile) name(second, replace) nodraw
graph box c g i e m if dummy5==3, title(3rd quintile) name(third, replace) nodraw
graph box c g i e m if dummy5==4, title(4th quintile) name(fourth, replace) nodraw
graphbox c g i e m if dummy5==5, title(5th quintile) name(five, replace) nodraw
grc1leg first second third fourth five, cols(3) rows(2)
************************************
**counting** How many countries was leading under categorie
tabulate year if N<0 & dummy2==0
tabulate year if N<0 & dummy2==1
tabulate year if N>0 & dummy2==0
tabulate year if N>0 & dummy2==1
tabulate year if c>g & c>i & c>e & c>m
tabulate year if g>c & g>i & g>e & g>m
tabulate year if i>c & i>g & i>e & i>m
tabulate year if e>c & e>g & e>i & e>m
tabulate year if m>c & m>g & m>i & m>e
**counting if they are in western Africa
tabulate year if c>g & c>i & c>e & c>m & dummy==0 & dummy2==0
tabulate year if g>c & g>i & g>e & g>m & dummy==0 & dummy2==0
tabulate year if i>c & i>g & i>e & i>m & dummy==0 & dummy2==0
tabulate year if e>c & e>g & e>i & e>m & dummy==0 & dummy2==0
tabulate year if m>c & m>g & m>i & m>e & dummy==0 & dummy2==0
*************************************************:::
**Applying some categorical variables related to the landlocked
by dummy, sort : summarize c g i e m
by dummy dummy2, sort : summarize c g i e m

209
by dummy3, sort : summarize c g i e m
by dummy dummy2 dummy3, sort : summarize c g i e m
by dummy dummy2 dummy3 dummy4, sort : summarize c g i e m
by dummy dummy2 dummy3 dummy4 dummy5, sort : summarize c g i e m
***********************************************************************
graph bar (mean) pCONS pGOV pGCF pX pM, blabel(bar) ytitle(percentage share of GDP) note(Source:Author's calculation)
legend(order(1 "Household Consumption" 2 "Government Final Consumption" 3 "Investment" 4 "Exports" 5 "Imports"))
regress lngdp lcons lngov lnGCF lX lM
***********************************************************************
** Analysis of Investments and trade**
#delimit;
graph bar i e m, over(dummy) bargap(-30)
legend( label(1 "Investment") label(2 "Exports") label (3 "Imports") )
ytitle("Score")
title("Average ranking points")
subtitle("by regions")
note("Source: Author's calculation")
blabel(bar, position(inside) format(%9.2f) color(white));
#delimit cr
#delimit;
graph bar i e m, over(dummy2) bargap(-30)
legend( label(1 "Investment") label(2 "Exports") label (3 "Imports") )
ytitle("Score")
title("Average ranking points")
subtitle("by regions")
note("Source: Author's calculation")
blabel(bar, position(inside) format(%9.2f) color(white));
#delimit cr
list country if dummy4==2 & year==2008
list country if dummy==0 & year==2008
list country if dummy2==0 & year==2008
list country if dummy2==1 & year==2008
list country if dummy2==3 & year==2008
list country if dummy==3 & year==2008
by dummy, sort: list country if year==2008
by dummy2, sort: list country if year==2008
by dummy3, sort: list country if year==2008
by dummy4, sort: list country if year==2008

210
by dummy5, sort: list country if year==2008
by dummy, sort: tab country if impulse1<0 & year==2008
by dummy, sort: tab country if impulse1<0 & year==2008
by dummy, sort: tab country if impulse1<0 & twithin(2008,2012)
by dummy, sort: tab country if impulse2<0 & twithin(2008,2012)
by dummy, sort: tab country if impulse2<0 & twithin(2000,2008)
xtline impulse1, recast(bar)
xtline impulse1 if twithin(2000,2008), recast(bar)
xtline impulse1 if twithin(2005,2012), recast(bar)
xtline impulse1 if twithin(2005,2012) & impulse1<0, recast(bar)
xtline impulse1 if twithin(2004,2013) & impulse1<0, recast(bar) byopts(note(source: Author's calculation))
xtline impulse1 if twithin(2005,2012) & impulse2<0, recast(bar) byopts(note(source: Author's calculation))
xtline impulse2 if twithin(2005,2012) & impulse2<0, recast(bar) byopts(note(source: Author's calculation))
rename impusle3 impulse3
xtline impulse3 if twithin(2005,2012) & impulse3<0, recast(bar) byopts(note(source: Author's calculation))
xtline impulse4 if twithin(2005,2012) & impulse4<0, recast(bar) byopts(note(source: Author's calculation))
xtline impulse5 if twithin(2005,2012) & impulse5<0, recast(bar) byopts(note(source: Author's calculation))
by dummy, sort: tab country if twithin(2005,2012) & impulse5<0
xtline impulse6 if twithin(2005,2012) & impulse6<0, recast(bar) byopts(note(source: Author's calculation))
clear
***********************************************************************
by country, sort: sum pAG pMIN pMAN pCONSTR pWHOLE pTRANS pOTHR if twithin(2005,2013)
by country, sort: sum pAG pMIN pMAN pCONSTR pWHOLE pTRANS pOTHR if twithin(1999,2008)
by country, sort: sum pAG pMIN pMAN pCONSTR pWHOLE pTRANS pOTHR if twithin(2007,2013)
by dummy, sort: list country if year==2008
twoway(scatter pMIN pAG)
twoway(scatter pMIN pAG) (lfit pMIN pAG)
twoway(scatter pMIN pAG, mlabel(economy)) (lfit pMIN pAG)
sort country
sort country year
twoway(scatter pMIN pAG, mlabel(economy)) (lfit pMIN pAG)
replace wbcode = "BEN" in 45
twoway(scatter pMIN pAG, mlabel(wbcode)) (lfit pMIN pAG)
twoway (scatter pAG pMIN, mlabel(wbcode) mlabsize(minuscule))
twoway (scatter pAG pMIN, mlabel(wbcode) mlabsize(vsmall))
twoway (scatter pAG pMIN, mlabel(wbcode) mlabsize(vsmall))
twoway (scatter pAG pMIN, mlabel(wbcode) mlabsize(vsmall)) (lfit pMIN pAG)
twoway (scatter pMIN pAG, mlabel(wbcode) mlabsize(vsmall)) (lfit pMIN pAG)

211
twoway (scatter pAG pMIN, mlabel(wbcode) mlabsize(vsmall)), by(dummy)
***********************************************************************
by dummy3, sort: tab country if impulse1>0 & impulse2>0 & impulse3>0 & impulse4>0 & impulse5>0 & impulse6>0 &
twithin(200,2008)
by dummy3, sort: tab country if impulse1>0 & impulse2>0 & impusle3>0 & impulse4>0 & impulse5>0 & impulse6>0 &
twithin(2008,2012)
tab country if impulse2<0 & twithin(2000,2008)
tab country if impulse2<0 & twithin(2008,2012)
*manufacturing leading over variables
by dummy3, sort: tab country if impulse2<0 & imp2> imp1 & imp2>imp3 & imp2>imp4 & imp2>imp5 & imp2>imp6
by dummy3, sort: tab country if impulse2<0 & impulse2< impulse1 & impulse2< impulse3 & impulse2< impulse4 & impulse2<
impulse5 & impulse2< impulse6
*agriculture leading over other variables
by dummy3, sort: tab country if impulse1<0 & imp1> imp2 & imp1> imp3 & imp1> imp4 & imp2>imp5 & imp2>imp6