the new york city mayor’s office of operations: jeffrey a
TRANSCRIPT


For more information about this report contact the New York City Mayor’s Office of Operations:
Jeffrey A. Kay, Director, Mayor’s Office of OperationsCarole Post, Director, Agency ServicesEmily Rubenstein, Senior Policy AdvisorJeff Roth, Policy AdvisorAmy Forgacs, Senior Policy Analyst
The Mayor’s Office of Operations253 Broadway, 10th FloorNew York, New York 10007
For an electronic version of this report, please visit:www.nyc.gov/operations
8 Printed on paper containing 30% post-consumer material.

NYC Feedback Citywide Customer Survey
Report of Survey Results
December 2008
Michael R. Bloomberg Edward Skyler Mayor, New York City Deputy Mayor for Operations Betsy Gotbaum Jeffrey A. Kay Public Advocate, New York City Director, Mayor’s Office of Operations

Acknowledgements The most important contributors to this survey effort have been the residents of New York City who took the time to answer the questions posed to them. More than 20,000 adults across the City, in every borough, every Community Board, and virtually every neighborhood gave voice to their own opinions.
The City of New York wishes to thank the following for their invaluable assistance:
Mary McCormick, President, Fund for the City of New York Barbara Cohn, Vice President, Fund for the City of New York Ester Fuchs, Professor of Public Affairs and Political Science, Columbia University Joseph Salvo, Director, Population Division, New York City Department of City Planning

Citywide Customer Survey Results
Page i
Contents Introduction ..................................................................................................................................1
I. Executive Summary ............................................................................................................................ 1 II. User Guide to the Survey Results .................................................................................................... 7 III. Survey Methodology...................................................................................................................... 11
Survey Results ............................................................................................................................15 Chapter 1: Overall Quality of Life and Government Services ....................................................... 15
Overall Quality of Life ...................................................................................................................... 16 Overall Quality of Government Services ....................................................................................... 20
Chapter 2: Customer Service and Access to Government .............................................................. 23 Customer Service............................................................................................................................... 24 Access to Government ...................................................................................................................... 26
Chapter 3: Public Safety....................................................................................................................... 29 Chapter 4: Health and Human Services ............................................................................................ 35
Health Services................................................................................................................................... 36 Human Services ................................................................................................................................. 40
Chapter 5: Public Education and After-School Programs............................................................... 47 Chapter 6: Community Conditions and Transportation................................................................. 51
Community Conditions.................................................................................................................... 52 Transportation ................................................................................................................................... 55
Chapter 7: Recreation and Culture..................................................................................................... 59 Chapter 8: Conclusion.......................................................................................................................... 65
Attachment 1: Questionnaire and Cover Letter....................................................................67
Attachment 2: Summary Survey Results for Each Community Board ............................77

Page ii
Appendices
The following appendices are provided separate from this report and are available online at www.nyc.gov/operations:
A. Survey and Reporting Methodology
B. Frequency of Responses to All Questions (with Don’t Knows and No Responses Included)
C. Frequency of Responses to All Questions (with Don’t Knows and No Responses Removed)
D. Summary of Responses to “Most Important Issues” Facing the City
E. Customer Service Ratings by Type of Service
F. Service Ratings by Users
G. Rating of Services by Preferred Language
H. Responses to Selected Survey Results by Race/Ethnicity
I. Responses to Selected Survey Results by Household Income
J. Responses to Selected Survey Results by Age
K. Responses to Selected Survey Results by Gender
L. Responses to Selected Survey Results by Length of Residency
M. Responses to Selected Survey Results by Primary Language
N. Responses to Selected Survey Results by Presence of Children in Household
O. Responses to Selected Survey Results by Living in Public Housing
P. Responses to Selected Survey Results by Borough
Q1. Responses to Selected Survey Results by Community Board (Manhattan)
Q2. Responses to Selected Survey Results by Community Board (Bronx)
Q3. Responses to Selected Survey Results by Community Board (Brooklyn)
Q4. Responses to Selected Survey Results by Community Board (Queens)
Q5. Responses to Selected Survey Results by Community Board (Staten Island)
R. Maps of Selected Survey Results by Community Board

Citywide Customer Survey Results
Page iii
Figures Figure INTRO-1: Customer Service Index Score and Rating....................................................................... 3
Figure INTRO-2: Neighborhood and Citywide Public Safety Index Scores and Ratings ............................. 4
Figure INTRO-3: Health and Human Services Index Scores and Ratings .................................................. 4
Figure INTRO-4: Public Education and Public School Users Index Scores and Ratings............................. 5
Figure INTRO-5: Community Conditions and Transportation Index Scores and Ratings ............................ 5
Figure INTRO-6: Community Amenities Index Score and Rating................................................................. 6
Figure INTRO-7: Profile of Survey Respondents........................................................................................ 13
Figure 1-A: Quality of Life Ratings .............................................................................................................. 16 Figure 1-B: Neighborhood as a Place to Live ............................................................................................. 16 Figure 1-C: Respondents’ Intent to Remain in New York City.................................................................... 17 Figure 1-D: Ratings of Neighborhood as Place to Live by Community Board............................................ 18 Figure 1-E: Important Issues Facing City Mentioned Most Frequently by Respondents ........................... 19 Figure 1-F: Ratings of Overall Quality of NYC Government Services ........................................................ 20 Figure 1-G: Ratings of the City’s Financial Health...................................................................................... 20 Figure 1-H: Ratings of Overall Quality of NYC Services by Community Board.......................................... 21 Figure 2-A: Customer Service Index and Ratings....................................................................................... 24 Figure 2-B: Type of Service Contacted by Respondents in the Last 12 Months ........................................ 25 Figure 2-C: Customer Service Ratings by Service Type ............................................................................ 25 Figure 2-D: Use of NYC.gov ....................................................................................................................... 26 Figure 2-E: Use of 3-1-1.............................................................................................................................. 26 Figure 2-F: Ratings of Provision of Services in the Respondent’s Preferred Language ............................ 27 Figure 2-G: Respondents’ Experience Making Complaints to 3-1-1 or City Agencies ............................... 27 Figure 2-H: Ratings of the City’s Business Services .................................................................................. 28 Figure 2-I: Respondents’ Interaction with Specific City Services................................................................ 28 Figure 3-A: Neighborhood Public Safety Index and Ratings ...................................................................... 30 Figure 3-B: Citywide Public Safety Index and Ratings ............................................................................... 31 Figure 3-C: Ratings of Personal Safety in the City ..................................................................................... 32 Figure 3-D: Neighborhood Public Safety Index Ratings by Community Board .......................................... 33 Figure 3-E: Percent of Respondent Households That Called 9-1-1 in Last 12 Months.............................. 34 Figure 3-F: Ratings of 9-1-1 Services ......................................................................................................... 34 Figure 3-G: Household Emergency Preparedness..................................................................................... 34 Figure 4-A: Health Services Clients Index and Ratings.............................................................................. 36 Figure 4-B: Use of Public Health Services.................................................................................................. 37 Figure 4-C: Ratings of Neighborhood Availability of Health Care Services................................................ 37 Figure 4-D: Health Services Clients Index Ratings by Community Board.................................................. 38 Figure 4-E: Ratings of Community Health Characteristics ......................................................................... 39 Figure 4-F: Social Support Services Index and Ratings ............................................................................. 41 Figure 4-G: Social Support Services Index Ratings by Community Board................................................. 42 Figure 4-H: Human Services Clients Index and Ratings ............................................................................ 43 Figure 4-I: Use of Human Services............................................................................................................. 44 Figure 4-J: Rating of Employment Training Programs................................................................................ 44 Figure 4-K: Use of Other Human Services ................................................................................................. 45 Figure 5-A: Public Education Index and Ratings ........................................................................................ 48

Page iv
Figure 5-B: Public School Users Index and Ratings................................................................................... 49 Figure 5-C: Household Members’ Attendance at Public Schools and Public After-School
Programs .............................................................................................................................................. 49 Figure 5-D: Public Education Index Ratings by Community Board ............................................................ 50 Figure 6-A: Cleaning and Maintenance Index and Ratings ........................................................................ 52 Figure 6-B: Cleaning and Maintenance Index Ratings by Community Board ............................................ 53 Figure 6-C: Mass Transit Index and Ratings .............................................................................................. 55 Figure 6-D: Streets and Sidewalks Index and Ratings ............................................................................... 56 Figure 6-E: Overall Ease of Travel Within the City ..................................................................................... 57 Figure 6-F: Streets and Sidewalks Index Ratings by Community Board.................................................... 58 Figure 7-A: Community Amenities Index and Ratings ................................................................................ 60 Figure 7-B: Use of Libraries and Parks....................................................................................................... 61 Figure 7-C: Ratings of Libraries and Parks by Users ................................................................................. 61 Figure 7-D: Community Amenities Index Ratings by Community Board .................................................... 63

Citywide Customer Survey Results
Executive Summary Page 1
Introduction I. Executive Summary
II. User Guide to the Survey Results
III. Survey Methodology
I. Executive Summary Survey Background The City of New York provides an expansive scope of services to its residents and businesses, and is committed to continuously improving service delivery by measuring agency performance. Two important tools the City uses to measure performance are the Mayor’s Management Report (MMR), a biannual public report card on City services, and the Citywide Performance Reporting tool (CPR), an interactive collection of performance indicators accessible online. These tools increase the transparency of government operations, provide accountability to customers, and equip City managers to improve service delivery.
While the MMR and CPR provide detailed data on all government services, they do not provide information about how the public views and experiences City services. The NYC Feedback Citywide Customer Survey (the Survey) provides the public’s perspective and is an additional tool for the City to measure its performance using data gathered directly from NYC residents.
In partnership with the Office of the Public Advocate, the Mayor’s Office designed the Survey to gauge public perceptions of the overall quality of life in the City and the quality of local government service delivery. The Survey included 34 questions, covering issues related to overall quality of life; customer service and access to government; public safety; health and human services; public education; community conditions, such as the cleanliness of streets and sidewalks; transportation, including mass transit; and recreation and culture.
The City views all residents as customers, whether directly (visiting a public library) or indirectly (walking down the sidewalk). In general, most survey questions addressed issues and experiences with which all City residents would be familiar. However, not all respondents had direct experience with all City services, therefore the Survey also included questions that asked only users of a particular service to evaluate their experience with that service. This allowed comparison of responses of the entire population to those of users of a particular service and also allowed an evaluation of those services which only a small portion of the population may have accessed.
While individual agencies have periodically administered public surveys to document specific aspects of their performance, the Survey is the first citywide survey of its scale – more than 130,000 households were randomly selected from all five boroughs and each of the 59 Community Boards, and completed surveys were received from 24,339 residents. Due to the scale and design of the Survey, the City is now able to provide an unparalleled level of detail about the differences in public perception across Community Boards.
At the end of the main report, these details are documented in a two-page summary of results for each Community Board. In addition, supplemental appendices are available online, providing breakdowns of all results by respondent characteristics, such as age, gender, race and ethnicity, and by every borough.

Page 2 Executive Summary
Summary of Survey Results
The Survey included several different types of questions. The most common question type was a straight-forward evaluative question in which respondents rated services on a scale of excellent to poor. Less common were the “use” questions, inquiring about the extent to which respondents used a particular service. Throughout the Survey, respondents were also asked to reflect on their impression of services provided in their neighborhood versus the City as a whole. There was also one open-ended question which asked respondents to provide up to three examples of the most important issues facing the City.
The ratings to most evaluative questions are reported as the percent of respondents who rated each service or condition as “excellent,” “good,” or “fair.” Responses to several groups of questions were combined into 12 “indices” in order to simplify comparisons and highlight important results from the Survey. An index score combines ratings from a group of survey questions which relate to a common area of services. Each index score represents the average percent of respondents reporting “excellent,” “good,” or “fair” for each of the questions summarized in the index. A given index may be comprised of as few as two or as many as seven questions. More information about the survey methodology can be found in the section III. Survey Methodology starting on page 11 and online (at www.nyc.gov/operations) in Appendix A: Survey and Reporting Methodology.
The scale of the Survey permits detailed analysis of responses, by location and by demographics. While the main report includes the highlights of this detailed analysis, there are two-page summary reports for each Community Board included at the end of the main report. Supplemental appendices are also available online (at www.nyc.gov/operations) which provide breakdowns of all results by respondent characteristics, such as age, gender, race and ethnicity, and by every borough.
The responses from the Survey provide both qualitative and quantitative data about public perceptions and areas of improvement for the City. The main findings are divided into seven key topic areas: • overall quality of life and government services • customer service and access to government • public safety • health and human services • public education and after-school programs • community conditions and transportation • recreation and culture
Overall quality of life and government services
The Survey included several evaluative questions about residents’ overall quality of life, their perceptions of the overall quality of services provided by the City and their intentions to stay in New York City.
Most Survey respondents (88%) rated the overall quality of life in New York City and their neighborhood as a place to live as “excellent,” “good,” or “fair.” A majority (59%) also reported that they intended to stay in New York City for at least the next five years.
When asked to name the most important issues facing New York City, the five most frequently mentioned issues were housing (including affordability and availability), education (including

Citywide Customer Survey Results
Executive Summary Page 3
quality, availability, and condition of schools), mass transit (including affordability, modernization and availability), crime (including drugs, gangs, and other concerns), and the cost of living.
Residents also gave high ratings to the overall quality of services provided by New York City government (85% rated overall quality of services as “excellent,” “good,” or “fair”), as well as to how the City works to promote economic growth (81%). Slightly lower ratings were given to how the City spends tax dollars (59%).
Customer service and access to government
The public’s first impression of City government is often shaped by their interactions with City employees. These employees provide the public with a wide variety of essential services, ranging from emergency response to providing public housing. The Survey asked respondents who had been in direct contact with the City to evaluate their “customer service” experience. The score for the Customer Service Index, summarizing respondents’ customer service ratings, was an 89.
Figure INTRO-1: Customer Service Index Score and Rating
22% 44% 23% 11%
0% 20% 40% 60% 80% 100%
Customer Service Index
Average percent of respondents
Excellent Good Fair Poor
More than a third (38%) of respondents had been in direct contact with a City office or agency either in person or over the phone in the 12 months prior to the survey. Most rated overall customer service (80%), employee’s courtesy (85%), employee’s willingness to help or understand (79%), timeliness of response (76%), and overall satisfaction with the response to their inquiry (70%) as “excellent,” “good,” or “fair.”
In addition to in-person contact, residents can access City services online and by telephone. Specifically, the City's official website, NYC.gov, is a central online access point to City services; and the 3-1-1 Customer Service Center provides the public with information and services via telephone. These information services portals are provided to enhance the customer service experience of New Yorkers, and are accessed by a large number of residents. Approximately two-thirds of those completing the Survey said they had called 3-1-1 at least once in the last 12 months, and the same proportion had visited the NYC.gov website. The City’s website NYC.gov and the 3-1-1 information telephone line were each rated as “excellent” or “good” by more than seven in 10 respondents who had used these services in the last 12 months.
Public safety
Public opinions about public safety tend to be a strong overall predictor of how well residents think their cities are managed. Concern about crime-related matters (including drugs, gangs, and other concerns) was listed by respondents as one of the top five important issues facing the City. The Survey included several questions about respondents’ perceptions of safety – both in their neighborhoods and citywide. These questions were combined into the Neighborhood Public Safety Index and the Citywide Public Safety Index (the average percent of respondents
89

Page 4 Executive Summary
reporting “excellent,” “good,” or “fair”). The Neighborhood Public Safety Index score was 88 and included ratings of police-community relations, crime control, emergency medical services, and fire protection services at the neighborhood level. The Citywide Public Safety Index score was 85. In general, survey results revealed that respondents rated services in their own neighborhood more positively than services citywide.
Figure INTRO-2: Neighborhood and Citywide Public Safety Index Scores and Ratings
11%
18%
41%
45%
33%
26%
15%
12%
0% 20% 40% 60% 80% 100%
Citywide Public Safety Index
Neighborhood Public Safety Index
Average percent of respondents
Excellent Good Fair Poor
Health and human services
The City provides a variety of services that foster community health, promote self-sufficiency, protect children, and support families. The Social Support Services Index score was 58, the lowest score for the 12 indices. This index included questions about services aimed at supporting low-income and at-risk populations: preventing homelessness, providing youth employment and public housing, protecting children at risk of abuse and neglect, and public assistance (such as Medicaid, food stamps, etc.). All survey respondents were invited to give their evaluations of these services, whether or not they accessed them.
By contrast, the Human Services Clients Index only included responses from respondents who used the following services: senior centers, other senior services, community centers, and Medicaid. This index received the highest score, 92, of all the indices.
The Health Services Clients Index included responses from respondents who had used the following City services: public hospitals, public health clinics, public mental health services, and providing public substance abuse services. While the score for this index, 83, was relatively high, only a small percentage of respondents indicated that they actually had used these services within the last 12 months, ranging from 2% for public substance abuse services to 41% for public hospital services. Eighty-eight percent of survey respondents considered the availability of health care services in their neighborhood to be “excellent,” “good,” or “fair.”
Figure INTRO-3: Health and Human Services Index Scores and Ratings
12%
19%
38%
45%
19%
33%
28%
35%
17%
8%
42%4%
0% 20% 40% 60% 80% 100%
Health Services Clients Index
Human Services Clients Index
Social Support Services Index
Average percent of respondents
Excellent Good Fair Poor
88
85
58
92
83

Citywide Customer Survey Results
Executive Summary Page 5
Public education and after-school programs Public education emerged as one of the top concerns of survey respondents. The Public Education Index score of 75 included ratings of public education for kindergarten through 12th grade as well as public after-school programs. While the score shows that 75% of respondents rated public education and public after-school programs as at least “fair,” only approximately a third of respondents felt, on average, that public education in New York City was “excellent” or “good.”
As seen with health and human services ratings, respondents actually using services gave more positive ratings. Respondents with children enrolled in a public school or public after-school program gave more positive ratings compared to all respondents. The Public School Users Index, summarizing responses of those with children in a K-12 public school in New York City or in a public after-school program, was 85. More than half of those who had a child enrolled in a public school rated schools as “excellent” or “good.”
Figure INTRO-4: Public Education and Public School Users Index Scores and Ratings
13%
6%
40%
30%
32%
39%
15%
25%
0% 20% 40% 60% 80% 100%
Public School Users Index
Public Education Index
Average percent of respondents
Excellent Good Fair Poor
Community conditions and transportation A wide array of services are referred to in community conditions and transportation, including street cleanliness, mass transit, ease of travel throughout the City, and stormwater control. These services were summarized with three indices: the Streets and Sidewalks Index, the Cleaning and Maintenance Index, and the Mass Transit Index. All three received relatively high index scores ranging from 79 to 86.
Figure INTRO-5: Community Conditions and Transportation Index Scores and Ratings
10%
13%
9%
42%
41%
36%
34%
29%
34%
14%
17%
21%
0% 20% 40% 60% 80% 100%
Mass Transit Index
Cleaning and Maintenance Index
Streets and Sidewalks Index
Average percent of respondents
Excellent Good Fair Poor
As noted above, mass transit was listed as one of survey respondents’ top five concerns; however respondents also gave high ratings to bus and subway services, as reflected in the relatively high Mass Transit Index score of 86. In addition, respondents gave higher ratings to services with which they were familiar – they tended to view bus services and subway services slightly more positively in their neighborhood than in the City overall.
75
85
79
83
86

Page 6 Executive Summary
Recreation and culture Open space, recreational areas, and cultural resources provide critical community amenities and help shape the community’s character. Community amenities, as described in this report, include parks, playgrounds, libraries, and cultural resources. Respondents provided favorable ratings of these amenities, as reflected by the Community Amenities Index score of 85. More than 75% of respondents reported having used a park, playground, or library at least once in the past year.
Figure INTRO-6: Community Amenities Index Score and Rating
16% 39% 30% 15%
0% 20% 40% 60% 80% 100%
Community Amenities Index
Average percent of respondents
Excellent Good Fair Poor
Differences in Respondent Ratings New York City, with more than 8 million residents in five boroughs, is so diverse that it is essential to evaluate service ratings for each borough and Community Board. The differences and similarities identified in this report provide critical information about how residents perceive City services.
Overall quality of life in the City was rated highest by respondents who lived in Manhattan, while respondents from Staten Island gave the highest ratings for their neighborhood as a place to live. Ratings of citywide and neighborhood services were rated highest by respondents from both Manhattan and Staten Island. Most services were rated lower by Bronx residents. Survey participants who lived in Manhattan Community Board #8 (the Upper East Side) gave the most positive ratings for their neighborhood as a place to live and for the overall quality of services provided by the City. In fact, across most services, respondents in Manhattan Community Board #8 gave the highest ratings. However, Queens respondents from Community Board #11 (Bayside) provided the highest ratings for recreation and culture and public education services. Respondents who lived in Bronx Community Board #3 (Morrisania) gave the lowest ratings to their neighborhood as a place to live. Respondents from Bronx Community Board #6 (East Tremont) gave the least positive ratings to the overall quality of life in the City compared to respondents in other Community Boards. In general, the most negative ratings were given by those residing in Bronx Community Boards #1 (Melrose) and #3 (Morrisania), and Brooklyn Community Board #16 (Ocean Hill/Brownsville). The survey results were also analyzed to see if respondents with differing demographic characteristics provided differing responses. A few trends emerged: • In general, Non-Hispanic respondents gave more positive ratings than did Hispanic
respondents. • Often, White respondents and Asian/Pacific Islander respondents gave somewhat more
positive ratings than did Black/African American respondents or respondents of other races.
• Overall, there was a correlation between annual household income and service evaluations; higher annual household income was often associated with more positive ratings.
More details on differences in survey results by respondent subgroups can be found in appendices H through Q (see the Table of Appendices following the Table of Contents for the complete list of appendices).
85

Citywide Customer Survey Results
User Guide to the Survey Results Page 7
II. User Guide to the Survey Results The results of the NYC Feedback Citywide Customer Survey are shown in this report using two basic types of charts or a map.
1. Use of Service Summaries
2. Map of Ratings by Community Board
3. Service Index Summaries
Each shows the percent of respondents who gave each possible response to the survey items, in concise graphic form.
Use of Service Summaries This type of chart summarizes results for survey items that ask whether the respondent has used a certain type of City service in the past year, and if so, how frequently. One possible response to these items is “Never in last 12 months,” among other responses concerning the frequency of use. There may be different frequency of use categories depending on the type of service being asked about.
The basic results for each item are the percent of respondents giving each of these answers. These percents are shown within segments of a color-coded bar next to the item name.
Example 1: Use of Services Chart
35%32% 33%Visited a website called
NYC.gov
Percent of respondents
Never in last 12 months 1 to 3 times More than 3 times
1
23
4 5 6
Title of Figure: Shows what service's use is being measured
Legend: Gives the possible responses for the survey item and the color codes for percent of respondents giving each response
Service name: Appears next to numeric results
Percent not using: The percent of respondents that did not use the service in the past 12 months
Percent using 1 to 3 times: The percent of respondents using the service between 1, 2, or 3 times in the last 12 months
Percent using more than 3 times: The percent of respondents using the service more than 3 times in the last 12 months
1
2
3
4
5
6
Key to Example Chart 1
Figure: Use of NYC.gov

Page 8 User Guide to the Survey Results
Community Board Maps For selected survey items, results are also shown in map form illustrating differences in responses across the 59 Community Boards into which New York City is divided. Additional information about each Community Board, including the city neighborhoods that lie within its boundaries and additional survey results, can be found in Attachment 2: Summary Survey Results for Each Community Board.
The data shown in these maps are the percent of respondents who rated a given survey item either “excellent,” “good,” or “fair.” Each map is color-coded to show three or four “ranges” of results. A “range” is a spread of numeric results: for instance, the first range might be “82% or less,” meaning that 82% or less of the respondents rated the item “excellent,” “good,” or “fair.”
The color of a Community Board on the map reflects into which range the results for that Board falls. The darker the shading, the higher the percent of respondents giving a positive rating to the survey item. The ranges were chosen so that approximately equal numbers of Community Boards fall into each range.

Citywide Customer Survey Results
User Guide to the Survey Results Page 9
1
2
”
4
3
65
1
2
3
4
5
6
Figure: Ratings of Neighborhood as Place to Live by Community Board
Title of Figure: The title indicates what survey item or Index Score is being mapped – in this case, ratings of “neighborhood as a place to live.”
Legend: The legend gives the “ranges” of survey results for this item and indicates what each color code represents. The darker the color, the higher the rating.
Community Board in first range: 82% or fewer respondents in this Community Board (Bronx #2 – Hunts Point, Longwood) rated the survey item as “excellent,” “good” or “fair.”
Community Board in second range: Between 83% and 90% of respondents in this Community Board (Manhattan #3 – Chinatown, Lower East Side) rated the survey item as “excellent,” “good” or “fair.”
Community Board in third range: Between 91% and 95% of respondents in this Community Board (Brooklyn #7 – Sunset Park, Red Hook) rated the survey item as “excellent,” “good” or “fair.”
Community Board in fourth range: 96% to 100% of respondents in this Community Board (Brooklyn #15 – Gravesend, Manhattan Beach) rated the survey item as “excellent,” “good” or “fair.”
Example 2: Community Board Maps

Page 10 User Guide to the Survey Results
Service Index Summaries This type of chart summarizes results for survey items that rate the quality of services (or the quality of life). Each of these items was rated by respondents as either “excellent,” “good,” “fair,” or “poor.” The basic results for each item are the percent of respondents giving each of these answers. These percents are shown within segments of a color-coded bar next to the item name. The darker the color, the higher the customer rating.
An “Index” is a combination of different survey items that, taken together, represent a respondents’ evaluation of one particular type of service (or one aspect of the quality of life in New York City). The example shown below is for the Citywide Public Safety Index.
The Index results are the average of the results in each of these categories across individual items that make up the Index: for instance, the average percent “excellent” across the five items in the Citywide Public Safety Services Index, becomes the percent “excellent” for that Index.
The Index Score is the sum of the “excellent,” “good,” and “fair” percents for the overall index.
Example 3: Service Index Chart
7%
8%
6%
15%
21%
11%
33%
35%
36%
52%
55%
41%
38%
35%
41%
27%
22%
33%
22%
21%
15%
3%
18%
6%
0% 20% 40% 60% 80% 100%
Police-Community relations in the City overal l
Emergency preparedness in the City overal l
Crime control in the City overal l
Emergency medical services in the Ci tyoverall
Fire protection services in the City overal l
Percent of respondents
Excel lent Good Fair Poor
**Note: For index, responses are th e average percent of respondents wh o reported “excellent,” “good,” “fair,” or “poor” on each of the other items shown in the chart.
Citywide Public Safety Index Score
85
City wide Public Safety Index**
1
23
4
5
6
7
8
9
Title of Figure: Shows what type of services are being evaluated.
Legend: Shows the color codes for percent of respondents evaluating items “excellent,” “good,” “fair,” and “poor.”
Index Name: Appears next to numeric results for the index. The numeric results display the average percent of respondents rating each item in the index as “excellent,” “good,” “fair” or “poor.”
Individual Item Names: Lists the survey items that make up the index. Each name appears next to the numeric results for that item.
Percent Excellent: The percent of respondents rating an item “Excellent”
Percent Good: The percent of respondents rating an item “Good”
Percent Fair: The percent of respondents rating an item “Fair”
Percent Poor: The percent of respondents rating an item “Poor”
Index Score: The sum of the average “percent excellent,” “percent good,” and “percent fair” for the overall Index.
1
2
3
4
5
6
7
8
9
Key to Example Chart 3
Figure: Citywide Public Safety Index and Ratings

Citywide Customer Survey Results
Survey Administration Page 11
III. Survey Methodology Overview of Survey Methodology • The Survey was mailed to 136,642 households
♦ 24,339 questionnaires were completed and returned
♦ 18% response rate
• Data were collected from June 13 through August 15, 2008
• Data were weighted to align the demographic profile of those who completed the survey with the demographic profile from the U.S. Census 2006 American Community Survey estimates for adults within the City’s Community Boards
Obtaining Survey Responses The City of New York contracted with the National Research Center (NRC), a nationally recognized leading research and evaluation firm focusing on the information requirements of the public sector. NRC’s team also included non-resident senior fellow Gregg Van Ryzin of Rutgers University, Harry Hatry of The Urban Institute, and Diamond Management & Technology Consultants.
A total of 136,642 randomly selected New York City households representing every Community Board were invited to participate in the Survey. Starting in June 2008, each selected household was contacted four times. First, a prenotification announcement informing household members that they had been selected to participate in the Survey was sent. This announcement contained a detachable postage-paid postcard that recipients could mail back to NRC to request to receive the Survey in a foreign language -- Spanish, Russian, Simplified Chinese, or Traditional Chinese.
Recipients received a second contact approximately one week after mailing the prenotification announcement. Each household was mailed a survey containing a cover letter signed by Mayor Bloomberg and Public Advocate Gotbaum. The letter invited Survey recipients to complete the paper survey and return it in an enclosed pre-paid envelope, or to complete the Survey online, with a unique ID to allow them access to the survey. The other side of the cover letter provided information about the survey in Spanish, Russian, Simplified Chinese, or Traditional Chinese, including the Web address where the survey could be completed and a toll-free number which recipients could call to request a copy of the survey in a foreign language.
The third contact consisted of a reminder letter and a second survey packet, which arrived one week after the first letter. The fourth and final contact was a reminder postcard sent one week after the second survey packet. Of the 135,171 households receiving a survey (1,471 of the surveys mailed could not be delivered because the housing unit was vacant), 24,339 completed the survey (22,193 by mail, 91%; and 2,146 via the Web, 9%), providing a response rate of 18%.
The margin of error (or confidence interval) quantifies the “sampling error” or precision of the estimates made from the survey results. The 95% confidence interval, or margin of error, for the citywide results from the Survey is generally no greater than plus or minus one percentage point around any given result reported for the entire set of respondents. Results for subgroups (such as respondents from individual boroughs, Community Boards, or demographic groups) have wider margins of error, up to plus or minus six percentage points. For example, the margin of error for borough results is generally plus or minus three percentage points and the margin of error for Community Board results is generally plus or minus six percentage points.

Page 12 Survey Administration
It should be noted that the reported margin of error is determined solely by the number of responses received, and does not account for any other potential sources of error or bias in the survey results. Great care was taken to use survey practices that reduce the impact of these other possible error sources. For example, possible “coverage error” due to the exclusion of any New York City households from the mailing list used for random sampling was reduced by using a mailing list based on the United States Postal Service address listing, which is quite accurate. In addition, non-response error, which may occur if those who did not respond to the Survey would have given different ratings than those who did respond, was mitigated by contacting selected households multiple times and by providing the survey in multiple languages. These other types of “errors” cannot be quantified and reported in the same way that the sampling error can be quantified by the 95% confidence level.
Survey Analysis The survey results were weighted to align the demographic profile of those who completed the survey with the demographic profile from the U.S. Census 2006 American Community Survey estimates for adults within the City’s Community Boards. The main variables used for weighting were age, gender, and race. In addition, results for each individual Community Board were weighted to reflect the Community Board’s proportion of the City’s overall population. The results are representative of the entire adult population of New York City. A full description of the survey methodology can be found online, in Appendix A: Survey and Reporting Methodology. A copy of the questionnaire is provided as Attachment 1 to this report.
This report focuses on overall results from the entire set of citywide survey respondents, unless otherwise noted. Supplemental appendices with breakdowns of results by respondent subgroups and by geographic location are provided in separate appendices. In addition, a two-page summary of results for each Community Board is included.
On many of the questions in the questionnaire, respondents could give an answer of “don’t know.” However, these responses have been removed from the analyses presented in this report, unless otherwise indicated. In other words, the majority of the tables and graphs in the body of the report display the responses from those who had an opinion about or provided a response to a specific item. The proportion of respondents giving a “don’t know” answer and the proportion choosing not to answer each question is shown in the full set of responses included online, in Appendix B: Frequency of Responses to All Questions (with Don’t Knows and No Responses Included).
Occasionally, the percents reported will not total to 100%; this is due to the customary practice of percentages being rounded to the nearest whole number.
An index score provides a combined result based on the responses to several different survey items which address a common subject. Twelve indices were created from the survey items. Each index score represents the average percent of respondents reporting “excellent,” “good,” or “fair” for each of the questions included in the index.
In creating the indices, items were grouped into categories based on the extent to which they were conceptually linked. Next, the statistical properties of the indices were tested. The indices were revised and retested as necessary. The final 12 indices exhibited statistical strength. More information on the statistical properties of the indices can be found online in Appendix A: Survey and Reporting Methodology. The items included in each of the 12 indices are described as they appear in the body of the report.

Citywide Customer Survey Results
Survey Administration Page 13
The table below displays a few characteristics of those responding to the Survey.
Figure INTRO-7: Profile of Survey Respondents
Demographic Question Percent of
respondents Demographic Question Percent of
respondents
About how many years have you lived in New York City? Less than 5 years 5 to 9 years 10 to 14 years 15 to 24 years 25 to 39 years 40 years or more
8% 9% 9%
18% 25% 32%
What is your age? 18-24 years old 25-34 years old 35-44 years old 45-54 years old 55-64 years old 65-74 years old 75 or older
6% 26% 17% 21% 13% 10% 7%
Does your household have any working computers with Internet access? No, no computers Yes, computers but no Internet access Yes, with high-speed Internet access Yes, with dial-up Internet access
18% 6%
69% 7%
How many children (under age 18) are there in your household? None (0) One (1) Two (2) Three or more (3+)
66% 17% 12% 5%
Are you living in New York City public housing, or are you receiving a rent subsidy, like Section 8, from the government? Yes, living in New York City public housing Yes, receiving a rent subsidy, like Section 8 No, not public housing or rent subsidy
7% 6%
87%
What is your gender? Male Female
46% 54%
Are you Hispanic or Latino/Latina? Yes No
23% 77%
Are you employed? Yes No
71% 29%
Which best describes your race? (Please check all that apply)* American Indian, Eskimo or Aleut Asian or Pacific Islander Black or African American White Other
1% 12% 23% 48% 18%
*Total may add to more than 100% as respondents could select more than one race.
About how much was the total 2007 income before taxes for your household as a whole? Less than $10,000 $10,000 - $34,999 $35,000 - $49,999 $50,000 - $99,999 $100,000 - $199,999 $200,000 or more
11% 24% 16% 29% 15% 5%

Page 14 Survey Administration
This page intentionally left blank.

Citywide Customer Survey Results
Chapter 1: Overall Quality of Life and Services in New York City Page 15
Survey Results
Chapter 1: Overall Quality of Life and Government Services The NYC Feedback Citywide Customer Survey (the Survey) included questions about residents’ overall quality of life and their perceptions of the overall quality of services provided by the City. While perception of the quality of overall service delivery may be influenced by a variety of factors, understanding whether this impression is positive or negative provides a context in which to understand the ratings given to specific services.
Information provided in this chapter includes:
• Figure 1-A: Quality of Life Ratings
• Figure 1-C: Respondents’ Intent to Remain in New York City
• Figure 1-D: Ratings of Neighborhood as Place to Live by Community Board
• Figure 1-E: Important Issues Facing City Mentioned Most Frequently by Respondents
• Figure 1-F: Ratings of Overall Quality of NYC Government Services
• Figure 1-G: Ratings of the City’s Financial Health
• Figure 1-H: Ratings of Overall Quality of NYC Services by Community Board
Supplemental appendices, which are available online (at www.nyc.gov/operations), provide breakdowns of all results by respondent characteristics, such as age, gender, race and ethnicity, and by every borough.

Page 16 Chapter 1: Overall Quality of Life and Services in New York City
Overall Quality of Life Two broad questions were posed at the beginning of the Survey – one asked respondents to rate their overall quality of life in the City and the other asked respondents how they would rate their neighborhood as a place to live.
The overall quality of life was rated as “excellent” by 6% of those completing the questionnaire, and as “good” by 45% (see Figure 1-A). Ratings of neighborhoods were somewhat more positive; 15% of those completing the questionnaire rated their neighborhood as an “excellent” place to live, while another 44% rated it as a “good” place to live. Both items were rated as at least “fair” by 88% of survey respondents.
Figure 1-A: Quality of Life Ratings
6%45%
37%
12%
Excellent Good Fair Poor
Figure 1-B: Neighborhood as a Place to Live
15%
44%
29%
12%
Excellent Good Fair Poor

Citywide Customer Survey Results
Chapter 1: Overall Quality of Life and Services in New York City Page 17
When asked whether they planned to continue living in New York City or move away in the next five years, a majority (59%) reported that they intended to stay in New York City (see Figure 1-C). Less than 20% said they planned to move somewhere else, while the remainder were unsure about relocation plans.
Figure 1-C: Respondents’ Intent to Remain in New York City
Move somewhere else, 18%
Don’t know, 24%
Stay in New York City, 59%
In the next 5 years, do you plan to stay in New York City or do you plan to move somewhere else?
Variation in intentions to stay in New York City or move away was examined by respondent characteristics. Observed differences included:
• Older respondents were more likely to say they were going to remain in New York City than were younger respondents.
• Survey participants who did not have children were more likely to say they were going to stay in New York City than those who had children.
• Those who rated the quality of life in New York City or their neighborhood as a place to live as “excellent,” “good,” or “fair” were more likely to report their intentions were to stay in New York City than were those who rated the quality of life in the City or their neighborhood as “poor.”

Page 18 Chapter 1: Overall Quality of Life and Services in New York City
The map below shows the percent of respondents within each Community Board who gave “excellent,” “good,” or “fair” ratings to their neighborhood as a place to live. The ratings ranged from 57% in Bronx Community Board #3 (Morrisania and Claremont) to 100% in Manhattan Community Board #8 (the Upper East Side).
In 16 of the 59 Community Boards, more than 95% of respondents rated their neighborhood as a place to live as at least fair; while in only 4 Community Boards did fewer than 60% of respondents rate their neighborhood as at least fair.
In general, respondents who lived in Staten Island gave the most positive ratings to their neighborhoods (96% of respondents), followed by Queens (92%), Manhattan (91%), Brooklyn (87%), and the Bronx (78%).
Figure 1-D: Ratings of Neighborhood as Place to Live by Community Board

Citywide Customer Survey Results
Chapter 1: Overall Quality of Life and Services in New York City Page 19
The Survey included one open-ended question asking respondents to write, in their own words, what they thought were the most important issues facing New York City. These results were categorized into several response topics. Housing issues (including affordability and availability) were mentioned by approximately 3 in 10 respondents. Issues related to education (including concerns about quality, availability, and condition of schools), mass transit (including affordability, modernization, availability), and crime (including drugs and gangs) were the next most popular responses, each referred to by approximately one in five respondents. Cost of living was the fifth most commonly provided response.
Figure 1-E: Important Issues Facing City Mentioned Most Frequently by Respondents
29%
22%
15%
21%
21%
0%
25%
50%
75%
100%
Housing Education Mass Transit Crime Cost of Living
Pe
rce
nt o
f re
spo
nd
en
ts

Page 20 Chapter 1: Overall Quality of Life and Services in New York City
Overall Quality of Government Services Municipal services are often the lens through which residents observe and evaluate City government. Efficient and quality service delivery lead to positive impressions of City government, while the opposite is also true. As previously noted, those who gave poor ratings to their neighborhood or to the City of New York, as a whole, reported being more likely to move elsewhere. The following describes residents’ evaluations of overall service delivery as well as how City government spends money and how well it fosters economic development.
Approximately two in five respondents rated the overall quality of New York City government services as “good,” with a small percent (4%) rating the overall quality of services as “excellent” (see Figure 1-F).
Figure 1-F: Ratings of Overall Quality of NYC Government Services
4% 38%
44%
15%
Excellent Good Fair Poor
When asked if they thought the City government spends tax dollars wisely, approximately one in five respondents thought the City does an “excellent” or “good” job, and approximately two in five thought the City does a “fair” job. Survey participants rated the job the City is doing to promote economic growth more positively than they rated expenditures of tax dollars. Nearly 1 in 10 respondents thought the City was doing an “excellent” job, and approximately 8 in 10 believed the City was doing at least a “fair” job.
Figure 1-G: Ratings of the City’s Financial Health
How Wisely NYC Government Spends Tax Funds
3%19%
37%
41%
How Well NYC Government Promotes Economic Growth
9%37%
34%
19%
Excellent Good Fair Poor

Citywide Customer Survey Results
Chapter 1: Overall Quality of Life and Services in New York City Page 21
The map below displays the percent of respondents within each Community Board who rated the overall quality of government services as “excellent,” “good,” or “fair.” Ratings ranged from 73% in the Bronx Community Board #1 (Mott Haven and Melrose) to 96% in Manhattan Community Board #5 (Midtown and Flatiron) and Manhattan Community Board #8 (the Upper East Side).
The ratings of overall quality of services by Community Board were fairly tightly clustered, with between 81% and 90% of respondents from 34 of the 59 Community Boards giving ratings of “excellent,” “good,” or “fair.” In 13 of the Community Boards, over 90% rated overall quality of government services as at least fair. In only two Community Boards did 75% or fewer respondents rate overall quality of services as at least fair.
In general, survey participants from the Bronx gave lower ratings than did participants from other boroughs.
Figure 1-H: Ratings of Overall Quality of NYC Services by Community Board

Page 22 Chapter 1: Overall Quality of Life and Services in New York City
This page intentionally left blank.

Citywide Customer Survey Results
Chapter 2: Customer Service and Access to Government Page 23
Chapter 2: Customer Service and Access to Government
A key component to providing quality government services and promoting economic growth is to provide excellent customer service to residents and businesses. City customers may interact with City agencies over the phone through 3-1-1, online at NYC.gov, and in-person at City walk-in centers.
Survey data examined in this chapter include:
• Figure 2-A: Customer Service Index and Ratings
• Figure 2-B: Type of Service Contacted by Respondents in the Last 12 Months
• Figure 2-C: Customer Service Ratings by Service Type
• Figure 2-D: Use of NYC.gov
• Figure 2-E: Use of 3-1-1
• Figure 2-F: Ratings of Provision of Services in the Respondent’s Preferred Language
• Figure 2-G: Respondents’ Experience Making Complaints to 3-1-1 or City Agencies
• Figure 2-H: Ratings of Interactions with Specific City Business Services
• Figure 2-I: Respondents’ Interaction with Specific City Business Services
Supplemental appendices, which are available online (at www.nyc.gov/operations), provide breakdowns of all results by respondent characteristics, such as age, gender, race and ethnicity, and by every borough.

Page 24 Chapter 2: Customer Service and Access to Government
Customer Service City employees constitute the City’s front line for customer service – they provide the public with a wide array of direct services ranging from cleaning City streets to responding to emergencies. A resident’s single experience with an individual employee can lead them to assess the City in either a positive or negative light.
The Survey’s Customer Service Index was designed to summarize respondents’ satisfaction with City customer service. This Index synthesizes ratings of several different related services; the score for each index represents the average percent of respondents reporting “excellent,” “good,” or “fair” for each of the questions captured by the index. The Customer Service Index was comprised of five questions which asked respondents to evaluate their interactions with City employees in the previous 12 months, and two questions related to the City website, NYC.gov, and 3-1-1, the City’s information telephone number. As seen in Figure 2-A below, the score on the Customer Service Index was 89.
Those who had contact with a City employee were also asked to rate their most recent interaction. As shown in Figure 2-A, employee’s courtesy was rated fairly high, with 58% of those who had contact with a City employee in the last 12 months rating courtesy as “excellent” or “good.” A majority (53%) also rated the employee’s willingness to help or understand as “excellent” or “good.” Timeliness of response was rated slightly lower. Seventy percent or more of respondents rated each aspect of their interaction as at least “fair.”
Figure 2-A: Customer Service Index and Ratings
15%
15%
18%
16%
20%
29%
20%
22%
30%
34%
35%
34%
38%
42%
55%
44%
26%
26%
26%
30%
27%
19%
22%
23%
30%
24%
21%
20%
15%
9%
11%
3%
0% 20% 40% 60% 80% 100%
Overall satisfaction with response
Timeliness of response
Employee’s willingness to help or understand
Overall customer service
Employee’s courtesy
3-1-1, New York City's information telephone number
NYC.gov, the City's website
Percent of respondents*
Excellent Good Fair Poor
*Note: Responses are only from those who reported being in contact with a City of New York government office or agency in the last 12 months.
**Note: For index, responses are the average percent of respondents who reported “excellent,” “good,” “fair,” or “poor” on each of the other items shown in the chart. The Index Score represents the sum of the “excellent,” “good” and “fair” responses.
Customer Service
Index Score 89
Customer Service Index**

Citywide Customer Survey Results
Chapter 2: Customer Service and Access to Government Page 25
A significant minority of respondents (38%) had been in contact with a City government office or agency either in-person or over the phone in the 12 months prior to the Survey. (The question did not specifically mention 3-1-1, so those who had only contacted 3-1-1 in the past 12 months probably did not answer this question affirmatively.)
Those who reported having interacted with a City government office or agency were then asked to indicate within what category of service their most recent contact fell. The most common types of services about which survey participants had contacted the City were housing (15%), transportation (13%), health and social services (11%), public safety (10%), and sanitation (10%) (see Figure 2-B).
Figure 2-B: Type of Service Contacted by Respondents in the Last 12 Months
About what type of service did you most recently make contact with a City office or agency?
Percent of respondents*
Housing 15%
Transportation 13%
Health and Social Services 11%
Public safety 10%
Sanitation 10%
Education 7%
Business licenses/permits 5%
Parks 5%
Cultural and Community Services 1%
Other 21%
Total 100% *Note: Responses are only from those who reported being in contact with any City of New York government office or agency in the last 12 months.
Customer service ratings were fairly similar across the different service types. Cultural and Community Services and Housing had the most favorable ratings for “overall customer service,” while Education and Public Safety had the least favorable ratings for “overall customer service” (see Figure 2-C).
Figure 2-C: Customer Service Ratings by Service Type
Ratings of Customer Service by Type of Service Contacted*
Service Type Timeliness of response
Employee’s courtesy
Employee’s willingness to help or
understand
Overall customer service
Overall satisfaction
with response
Housing 81% 90% 86% 87% 79% Transportation 81% 87% 81% 82% 74% Health and Social Services 76% 82% 79% 80% 76% Public safety 65% 81% 72% 73% 57% Sanitation 77% 88% 80% 82% 69% Education 79% 82% 80% 77% 72% Business licenses/permits 83% 82% 79% 82% 77% Parks 73% 89% 85% 82% 68% Cultural and Community Services 82% 91% 87% 90% 76% Other 72% 84% 76% 76% 64% *Percent of respondents reporting "excellent," "good," or "fair."

Page 26 Chapter 2: Customer Service and Access to Government
Access to Government The City offers a variety of ways in which residents and businesses can interact with local government. A popular means of contacting the City is through the 3-1-1 Customer Service Center, which provides information and services for all City agencies. Another common method of contacting the City is through NYC.gov, the City's official website, which provides online access to City services and information. In addition, the City’s 700 walk-in centers provide another easily accessible means to interact with local agencies, accounting for at least 9.2 million customer visits annually.
The City’s information services were used by a large portion of its residents. Approximately two-thirds of those completing the Survey said they had visited the NYC.gov website (see Figure 2-D), and the same proportion had called 3-1-1 at least once in the last 12 months (see Figure 2-E). A third of respondents were more frequent users of NYC.gov, having used the website more than three times in the previous 12 month period. NYC.gov and 3-1-1 were each rated as “excellent” or “good” by more than 7 in 10 respondents who had used these services at least once in the last 12 months (see Figure 2-A on page 24). All respondents, even those who had not used NYC.gov or 3-1-1 in the last 12 months, were asked to rate these services. Ratings were similar among all respondents compared to those who used the services, with users giving slightly more positive ratings (the ratings given by all respondents can be found in Appendix C: Frequency of Responses to All Questions).
Figure 2-D: Use of NYC.gov
35%32% 33%Visited a website calledNYC.gov in the last 12
months
Percent of respondents
Never 1 to 3 times More than 3 times
Figure 2-E: Use of 3-1-1
32% 68%Called 3-1-1
Percent of respondents
Never At least once
Differences in the use of customer information services and ratings of customer information services were analyzed by demographic characteristics. Observations included:
• Asian/Pacific Islander respondents used 3-1-1 at lower rates than did other races. Use of NYC.gov was highest among White respondents.
• Those with the highest annual household incomes ($200,000 or more) were least likely to have used 3-1-1. Those with annual household incomes below $35,000 were least likely to have visited the NYC.gov website.
• Older respondents were less likely than younger respondents to have visited the NYC.gov website or to have called 3-1-1.
Called 3-1-1 in the last 12 months

Citywide Customer Survey Results
Chapter 2: Customer Service and Access to Government Page 27
Survey participants were asked to rate the provision of services in the respondent’s preferred language; nearly half rated the City’s performance in this area as “excellent” and more than three-quarters deemed it as “excellent” or “good.” Those who spoke English as their preferred first language gave the highest ratings to this item (97% rated as “excellent,” “good,” or “fair”), followed by those who spoke Spanish (89%), Mandarin (85%), Russian (83%), and Cantonese (77%). Respondents who spoke languages other than these as their preferred language gave lower ratings. The survey was offered in English, Spanish, Russian, and Chinese, which may account for the higher ratings given by people who spoke these languages compared to those who spoke other languages.
Figure 2-F: Ratings of Provision of Services in the Respondent’s Preferred Language
30%
14%
9%
48%
Excellent Good Fair Poor
All those completing the Survey were asked whether they had made a complaint to 3-1-1 or to a City agency in the last 12 months. Approximately two in five respondents reported they had made a complaint (see Figure 2-G). Nearly half of those who had made a complaint reported that the complaint had been resolved, while the other half did not consider the complaint resolved.
Figure 2-G: Respondents’ Experience Making Complaints to 3-1-1 or City Agencies
No52%
Yes48%
No59%
Yes41%
*Responses from those who reported making a complaint to 3-1-1 or a City agency in the last 12 months.
Have you made a complaint to 3-1-1 or to a City agency in the last 12 months? Was your complaint resolved?*

Page 28 Chapter 2: Customer Service and Access to Government
Respondents were also asked to evaluate their experience with three specific interactions: contacting the City with a tax question, requesting consumer assistance, and paying a fine or ticket to the City. Interacting with the City about tax questions was rated as “excellent” or “good” by just more than half of respondents (see Figure 2-H), and consumer assistance was rated as “excellent” or “good” by 41% of respondents, while 35% had an “excellent” or “good” experience paying a fine or ticket to the City. For each of the three services, 69% or more of respondents rated them as at least “fair.”
Figure 2-H: Ratings of Interactions with Specific City Business Services
Contacting the City with a Tax Question
15%
36%
26%
22%
Receiving Consumer Assistance
10%
29%
30%
31%
Paying a Fine or Ticket to the City
8%
34%
27%
31%
Excellent Good Fair Poor
The proportion of respondents who had engaged with each business service in Figure 2-H is shown in Figure 2-I below. Just under half said they had paid a fine or ticket to the City in the last 12 months. Fifteen percent had contacted the City with a tax question, and 11% had received consumer assistance.
Figure 2-I: Respondents’ Interaction with Specific City Business Services
46%
15%
54%
89%
85%
11%
Paid a fine or ticket to theCity
Received consumerassistance
Contacted the City with atax question
Percent of respondents
Never in last 12 months At least once in last 12 months
Received consumer assistance

Citywide Customer Survey Results
Chapter 3: Public Safety Page 29
Chapter 3: Public Safety
The Public Safety chapter covers those government services devoted to reducing crime, maintaining a safe and secure public environment, and providing timely responses to emergency situations. Perceptions of public safety are a critical part of how residents perceive their quality of life in the City.
The following information about public safety from the Survey was included in this chapter:
• Figure 3-A: Neighborhood Public Safety Index and Ratings
• Figure 3-B: Citywide Public Safety Index and Ratings
• Figure 3-C: Ratings of Personal Safety in the City
• Figure 3-D: Neighborhood Public Safety Index Ratings by Community Board
• Figure 3-E: Percent of Respondent Households That Called 9-1-1 in Last 12 Months
• Figure 3-F: Ratings of 9-1-1 Services
• Figure 3-G: Household Emergency Preparedness
Supplemental appendices, which are available online (at www.nyc.gov/operations), provide breakdowns of all results by respondent characteristics, such as age, gender, race and ethnicity, and by every borough.

Page 30 Chapter 3: Public Safety
Public Safety The City employs more than 35,000 police officers who work to protect quality of life, deter crime, and quickly respond to emergency situations. New York City’s Fire Department responds to more than 250,000 fire- and nonfire-related emergencies and more than one million medical emergencies each year, and maintains more than 250 firehouses and ambulance stations.
Overall, respondents rated public safety-related services higher in their neighborhood than citywide. The Neighborhood Public Safety Index, which received a score of 88, was made up of four items: fire protection services, emergency medical services, crime control and police-community relations. Each of these items (displayed in Figure 3-A) was rated as “fair” or better by 80% or more of respondents. Virtually all respondents rated fire protection services and emergency medical services as at least “fair,” with three-quarters or more of respondents rating these as “excellent” or “good.” Crime control and police-community relations were each judged as “excellent” or “good” by nearly half (49%) of respondents.
Figure 3-A: Neighborhood Public Safety Index and Ratings
12%
10%
23%
29%
18%
37%
39%
51%
53%
45%
30%
33%
21%
16%
26%
20%
17%
12%
4%
2%
0% 20% 40% 60% 80% 100%
Police-Communityrelations in yourneighborhood
Crime control in yourneighborhood
Emergency medicalservices in yourneighborhood
Fire protectionservices in yourneighborhood
Percent of respondents
Excellent Good Fair Poor
**Note: For index, responses are the average percent of respondents who reported “excellent,” “good,” “fair,” or “poor” on each of the other items shown in the chart. The Index Score represents the sum of the “excellent,” “good” and “fair” responses.
Neighborhood Public Safety Index Score
88
Neighborhood Public Safety
Index**

Citywide Customer Survey Results
Chapter 3: Public Safety Page 31
The Citywide Public Safety Index received a score of 85 (see Figure 3-B), slightly lower than the score given to the Neighborhood Public Safety Index. The Citywide Index included all four questions asked in the Neighborhood Index, plus one more item – preparing the City for an emergency. Approximately four in five respondents regarded the City government as doing at least a “fair” job in preparing the City for an emergency.
Figure 3-B: Citywide Public Safety Index and Ratings
15%
21%
11%
33%
35%
36%
52%
55%
41%
38%
35%
41%
27%
22%
33%
22%
21%
15%
8%
7%
6%
3%
18%
6%
0% 20% 40% 60% 80% 100%
Police-Community relations in the City overall
Emergency preparedness in the City overall
Crime control in the City overall
Emergency medical services in the Cityoverall
Fire protection services in the City overall
Percent of respondents
Excellent Good Fair Poor
**Note: For index, responses are the average percent of respondents who reported “excellent,” “good,” “fair,” or “poor” on each of the other items shown in the chart. The Index Score represents the sum of the “excellent,” “good” and “fair” responses.
Citywide Public Safety Index Score
85
Citywide Public Safety Index**

Page 32 Chapter 3: Public Safety
The Survey also included questions about how respondents perceived their personal safety while walking alone at night, in local parks and playgrounds during the day, and when riding mass transit both during the day and at night. More than two-thirds of respondents reported they felt “very” or “somewhat safe” walking alone on a street at night. A large majority (86%) of respondents indicated they felt at least “somewhat safe” in a park or playground during the day. More than half of survey participants reported they felt “somewhat safe” riding a subway during the day, with an additional one-third of respondents reporting that they felt “very safe.” Nearly three-quarters of respondents (73%) said they felt at least “somewhat safe” riding a subway at night.
Figure 3-C: Ratings of Personal Safety in the City
Walking alone ona street at night
50%22%
9%
19%
In a park or playgroundduring the day
47%
11%
3%
39%
Riding a subwayduring the day
53%
11%
3%
33%
Riding a subwayat night
35%
20%
7%
38%
Very safe Somewhat safe Somewhat unsafe Very unsafe
Examination of ratings of public safety by respondent subgroups revealed the following patterns:
• In general, Non-Hispanic respondents reported greater feelings of personal safety than did Hispanic respondents.
• In general, White respondents and Asian/Pacific Islander respondents gave somewhat more positive ratings to the public safety items than did respondents of other races (with White respondents often giving slightly higher ratings than Asian/Pacific Islander respondents).
The following map shows the average Neighborhood Public Safety Index rating by Community Board. A score of 96 or higher was observed in six of the 59 Community Boards; these six Community Boards were: • Manhattan #1 (Tribeca, Battery Park City, and Financial District) • Manhattan #2 (West Village, Greenwich Village, and Soho) • Manhattan #6 (Stuyvesant Town, Gramercy, and Murray Hill) • Manhattan #8 (the Upper East Side) • Queens #6 (Rego Park and Forest Hills) • Queens #11 (Auburndale, Bayside, and Oakland Gardens)

Citywide Customer Survey Results
Chapter 3: Public Safety Page 33
Scores of 75 or lower were given by respondents in three Community Boards: • Bronx #1 (Mott Haven and Melrose) • Bronx #3 (Morrisania and Claremont) • Brooklyn #16 (Ocean Hill and Brownsville).
Forty of the 59 Community Boards received Neighborhood Public Safety Index scores between 83 and 95.
The average scores by borough were highest in Staten Island (92), Queens (91), and Manhattan (91), followed by Brooklyn (87) and the Bronx (83).
Figure 3-D: Neighborhood Public Safety Index Ratings by Community Board

Page 34 Chapter 3: Public Safety
The 9-1-1 system is an important component in the system of public safety services, allowing New Yorkers to get rapid assistance in emergency situations. Approximately a third of those completing the Survey reported that they or another household member had called 9-1-1 within the last 12 months (see Figure 3-E). Those who had done so were asked to rate the quality of the 9-1-1 services. Two-thirds rated 9-1-1 services as “excellent” or “good,” with 88% rating 9-1-1 services as at least “fair” (see Figure 3-F: Ratings of 9-1-1 Services).
Figure 3-E: Percent of Respondent Households That Called 9-1-1 in Last 12 Months
No, did NOT call 9-1-1, 68%
Yes, called 9-1-1, 32%
Please indicate if you or any member of your household have called 9-1-1 in the last 12 months.
Figure 3-F: Ratings of 9-1-1 Services
38%20%
12%
30%
Excellent Good Fair Poor
Note: Responses from those who reported they or a member of their household called 9-1-1 in the last 12 months.
The Survey also asked respondents how prepared they felt in the event of an emergency, such as a flood, hurricane, or snow event. More than half of survey respondents reported being “somewhat” or “very” prepared (see Figure 3-G).
Figure 3-G: Household Emergency Preparedness
Somewhat prepared,
50%
Unprepared, 42%
Very prepared,
7%
Thinking of you and your household, how prepared, if at all, do you feel you would be if there were an emergency such as a flood, hurricane or blizzard?

Citywide Customer Survey Results
Chapter 4: Health and Human Services Page 35
Chapter 4: Health and Human Services
The City provides many services that foster community health, promote self-sufficiency, protect children, and support families. Recipients of the Survey were asked to rate the City’s social services, including those related to public health and human services.
The data displayed in this chapter include:
• Figure 4-A: Health Services Clients Index and Ratings
• Figure 4-B: Use of Public Health Services
• Figure 4-C: Ratings of Neighborhood Availability of Health Care Services
• Figure 4-D: Health Services Clients Index Ratings by Community Board
• Figure 4-E: Ratings of Community Health Characteristics
• Figure 4-F: Social Support Services Index and Ratings
• Figure 4-G: Social Support Services Index Ratings by Community Board
• Figure 4-H: Human Services Clients Index and Ratings
• Figure 4-I: Use of Human Services
• Figure 4-J: Rating of Employment Training Programs
• Figure 4-K: Use of Other Human Services
Supplemental appendices, which are available online (at www.nyc.gov/operations), provide breakdowns of all results by respondent characteristics, such as age, gender, race and ethnicity, and by every borough.

Page 36 Chapter 4: Health and Human Services
Health Services To ensure that New Yorkers have adequate access to quality health care, the City runs or funds a number of facilities including 11 acute care hospitals, four skilled nursing facilities, six large diagnostic and treatment centers, and 100 community and school-based clinics.
Questions related to four types of public health services were included on the questionnaire. Respondents who had utilized one of the four services were asked to rate the quality of that service. Each service was considered at least “fair” by 78% or more of respondents who had used these services (see Figure 4-A). The score for the Health Services Clients Index, which summarizes the “excellent,” “good,” and “fair” ratings for these four items, was an 83 out of a possible 100.
Figure 4-A: Health Services Clients Index and Ratings
19%
17%
11%
12%
12%
29%
33%
36%
41%
38%
29%
29%
34%
32%
33%
22%
21%
19%
15%
17%
0% 20% 40% 60% 80% 100%
Public substance abuseservices
Public mental healthservices
Public hospital services
Public health clinicservices
Percent of respondents*
Excellent Good Fair Poor
*Note: Responses from those who reported they or a member of their household used that service in the last 12 months. **Note: For index, responses are the average percent of respondents who reported “excellent,” “good,” “fair,” or “poor” on each of the other items shown in the chart. The Index Score represents the sum of the “excellent,” “good” and “fair” responses.
Health Services Clients
Index Score 83
Health Services Clients Index**

Citywide Customer Survey Results
Chapter 4: Health and Human Services Page 37
Only a small percentage of respondents reported that they or a household member had used public mental health services or public substance abuse services within the last 12 months; 6% of participating households had used a public mental health service, and 2% had used a public substance abuse service (see Figure 4-B). Public health clinic and public hospital services were used more frequently; 25% of surveyed households had used public health clinic services, while 41% had used public hospital services.
Figure 4-B: Use of Public Health Services
41%
25%
98%
94%
59%
75%
2%
6%
Used public substanceabuse services
Used public mental healthservices
Used public hospitalservices
Used public health clinicservices
Percent of respondents
Never used in last 12 months At least once in last 12 months
The Survey also asked respondents to rate the availability of health care services in their neighborhood. A majority of those completing the questionnaire rated the availability of health care services in their neighborhood as “excellent” or “good” (see Figure 4-C), with 86% giving at least a “fair” rating.
Figure 4-C: Ratings of Neighborhood Availability of Health Care Services
43%
31%
14%
12%
Excellent Good Fair Poor

Page 38 Chapter 4: Health and Human Services
The map below shows the average Health Services Clients Index rating given by respondents within each Community Board in the City of New York. Scores ranged from 71 in Queens Community Board #5 (Maspeth, Glendale, and Middle Village) to 96 in Queens Community Board #11 (Auburndale, Bayside, and Oakland Gardens). In 42 of the 59 Community Boards, the scores received on the Health Services Clients Index were between 80 and 90.
In general, respondents who lived in Staten Island gave the most positive ratings to the Health Services Clients Index (a score of 87), followed by Manhattan and the Bronx (85 each), and then by Brooklyn and Queens (81 each).
Figure 4-D: Health Services Clients Index Ratings by Community Board

Citywide Customer Survey Results
Chapter 4: Health and Human Services Page 39
One way the City works to protect the health of residents is to conduct health and safety inspections to enforce the health code. Additionally, as part of PlaNYC, the City is working to reduce carbon emissions 30% citywide by the year 2030. The Survey captured respondents’ ratings of restaurant cleanliness and of air quality in the City. Restaurant cleanliness was deemed as at least “fair” by 84% of respondents. Approximately two-thirds of respondents considered air quality in New York City to be “fair” or better.
Figure 4-E: Ratings of Community Health Characteristics
Restaurant Cleanliness in the City Overall
3%33%
48%
16%
Air Quality in the City Overall
2%
20%
45%32%
Excellent Good Fair Poor
Some variation in ratings of air quality was seen by borough. Respondents from Queens gave more positive ratings, with 72% rating air quality as “excellent,” “good,” or “fair” than did those from other boroughs. Respondents living in Brooklyn gave the least positive ratings, with 62% rating air quality as “excellent,” “good,” or “fair.”

Page 40 Chapter 4: Health and Human Services
Human Services The City provides a variety of supports to promote the economic and social well-being of individuals, families, and neighborhoods in the five boroughs and to enhance individual and family efforts to achieve independence and self-sufficiency. New York City provides affordable housing to nearly 420,000 low- and moderate-income residents in 345 housing developments with 180,000 apartments in the five boroughs. The City assists nearly 90,000 families in receiving federal rent subsidies. While making available 15 City-run and 206 privately-run shelter facilities, consisting of 51 adult facilities and 170 family facilities, the City also works to prevent homelessness through community-based programs.
In addition to housing assistance, the City provides services to low-income residents, children, and older adults. Public assistance is offered at 19 Medicaid Community Offices and food stamps are offered at 30 offices. The City also offers summer employment placement and year round job training services to introduce youth and young adults to the job market and help them develop the skills to succeed. The City’s Workforce1 Career Centers, operated in coordination with the New York State Department of Labor and the City University of New York, offer a variety of workshops designed to prepare jobseekers for new careers. In addition, by investigating more than 50,000 reports of abuse or neglect each year and assisting foster parents and caregivers, the City helps ensure the protection of children.

Citywide Customer Survey Results
Chapter 4: Health and Human Services Page 41
16%
16%
16%
18%
28%
19%
34%
35%
37%
33%
37%
35%
48%
46%
44%
44%
28%
42%
2%
3%
3%
4%
8%
4%
0% 20% 40% 60% 80% 100%
Services addressing homelessness
Availability of youth employment programs
Public housing in the City overall
Services protecting children at risk of abuseand neglect
Public assistance (such as Medicaid, foodstamps, etc.)
Percent of respondents
Excellent Good Fair Poor
The Social Support Services Index, which summarizes the ratings of the five services displayed in Figure 4-F below, received a score of 58. More than half of respondents rated each of the five services as at least “fair.” The highest rated service in this Index was public assistance, including programs such as Medicaid and food stamps. These social support services, nonetheless, were among the lowest rated across the entire questionnaire.
It should be noted that a relatively large proportion of respondents felt they could not rate these services because they did not know enough about them. Approximately 40% of those completing the questionnaire answered “don’t know” to these questions. The proportion of all respondents providing a “don’t know” response to each question can be found in Appendix B: Frequency of Responses to All Questions (with Don’t Knows and No Responses Included).
Figure 4-F: Social Support Services Index and Ratings
**Note: For index, responses are the average percent of respondents who reported “excellent,” “good,” “fair,” or “poor” on each of the other items shown in the chart. The Index Score represents the sum of the “excellent,” “good” and “fair” responses.
Social Support Services Index
Score 58
Social Support Services Index**

Page 42 Chapter 4: Health and Human Services
The average Social Support Services Index ratings by Community Board are displayed in the map below. They ranged from a low of 46 for Brooklyn Community Board #8 (Prospect Heights and Crown Heights) to a high of 71 for Queens Community Board #7 (Flushing, Whitestone, and College Point). About half (29) of the 59 Community Boards received a Social Support Services Index score between 56 and 65.
Differences between boroughs in the average scores of the Social Support Services Index were not high, ranging from 61 for Queens and Staten Island, to 57 for Manhattan, and 56 for Brooklyn and the Bronx.
Figure 4-G: Social Support Services Index Ratings by Community Board

Citywide Customer Survey Results
Chapter 4: Health and Human Services Page 43
Those respondents who received human services support from the City, by using public senior center services, other public senior services, Medicaid services and/or public community center services, tended to rate these services most positively among all services on the Survey. The Human Services Clients Index, which summarizes these ratings, obtained a score of 92.
The services included in the Human Services Clients Index were rated as at least “fair” by 89% to 92% of clients (see Figure 4-H). The top rated services out of these four were Medicaid services (rated as “excellent” by nearly a quarter of respondents) and public senior center services (rated as “excellent” by 22% of those giving a rating).
Figure 4-H: Human Services Clients Index and Ratings
19%
43%
42%
47%
48%
45%
29%
25%
34%
21%
28%
11%
9%
8%
8%
8%
22%
17%
24%
12%
0% 20% 40% 60% 80% 100%
Other public seniorservices
Medicaid services
Public communitycenter
Public senior center
Percent of respondents*
Excellent Good Fair Poor
*Note: Responses from those who reported they or a member of their household used that service in the last 12 months. **Note: For index, responses are the average percent of respondents who reported “excellent,” “good,” “fair,” or “poor” on each of the other items shown in the chart. The Index Score represents the sum of the “excellent,” “good” and “fair” responses.
Human Services
Clients Index Score
92
Human Services Clients Index**

Page 44 Chapter 4: Health and Human Services
The proportion of respondents who had used each of the services rated in Figure 4-H on the previous page is displayed in Figure 4-I below.
Figure 4-I: Use of Human Services
19%
92%
77%
81%
91% 9%
8%
23%
Used other public seniorservices (e.g., respite care,
transportation, etc.)
Received Medicaid
Visited a public communitycenter
Used a public senior center
Percent of respondents
Never in last 12 months At least once in last 12 months
Not included in the Human Services Clients Index Score were ratings for employment training programs provided by the City. Eight percent of respondents reported that they had participated in an employment training program in the previous 12 months. Just over half of these respondents rated the trainings as “excellent” or “good” (see Figure 4-J), and 82% rated them as at least “fair.”
Figure 4-J: Rating of Employment Training Programs
38%
31%
18%
13%
Excellent Good Fair Poor
Used a public senior center
Receive Medicaid

Citywide Customer Survey Results
Chapter 4: Health and Human Services Page 45
Respondents were asked about their participation in several of the City’s other social service programs. Nine percent of surveyed households had used a City service for the mobility impaired in the last 12 months (see Figure 4-K), 12% had used a City youth program and 8% had used a City child daycare program.
Figure 4-K: Use of Other Human Services
92%
90%
88%
4%
5%
8%
4%
4%
4%
Used a City childdaycare program
Used City services forthe mobility impaired
Used a City youthprogram
Percent of respondents
Never in last 12 months 1 to 3 times More than 3 times
Differences among respondent subgroups in the use of and ratings of human services were examined. Findings of note included:
• Asian/Pacific Islander respondents, compared to the other races, tended to give the highest ratings to the social support services. Black/African American respondents tended to give the lowest ratings to the social support services.

Page 46 Chapter 4: Health and Human Services
This page intentionally left blank.

Citywide Customer Survey Results
Chapter 5: Public Education and After-School Programs Page 47
Chapter 5: Public Education and After-School Programs
A high quality public education is essential to the overall success of children and youth, and helps to create a strong workforce, improve public health, reduce poverty and crime rates, and create opportunities for higher education and career advancement. New York City has an extensive public education system to support its large population. Residents’ opinions about the public schools and after-school programs were sought through the Survey.
Survey data summarized in this chapter include:
• Figure 5-A: Public Education Index and Ratings
• Figure 5-B: Public School Users Index and Ratings
• Figure 5-C: Household Members’ Attendance at Public Schools and Public After-School Programs
• Figure 5-D: Public Education Index Ratings by Community Board
Supplemental appendices, which are available online (at www.nyc.gov/operations), provide breakdowns of all results by respondent characteristics, such as age, gender, race and ethnicity, and by every borough.

Page 48 Chapter 5: Public Education and After-School Programs
Public Education and After-School Programs Public education is provided to a large number of New York City residents. More than one million pre-kindergarten to grade 12 students attend more than 1,400 schools in the City. Employing approximately 79,000 teachers, the City works to prepare students to meet grade level standards in reading, math, and other basic skills. In addition, more than 2,800 community-based and City-funded organizations offer a mix of academic support, sports/recreational activities, and arts and cultural experiences, through after-school programming.
The Survey asked all respondents to rate the quality of public education and public after-school programs, regardless of whether or not they had a child in the public school system. The Public Education Index, which summarizes all respondents’ ratings of these services, was 75. This means that approximately three-quarters of all respondents rated public education and public after-school programs as at least “fair” (see Figure 5-A).
Figure 5-A: Public Education Index and Ratings
28%
32%
30%
38%
40%
39%
29%
22%
25%
5%
6%
6%
0% 20% 40% 60% 80% 100%
Public after-schoolprograms
Public education(kindergarten – 12th
grade)
Percent of respondents
Excellent Good Fair Poor
**Note: For index, responses are the average percent of respondents who reported “excellent,” “good,” “fair,” or “poor” on each of the other items shown in the chart. The Index Score represents the sum of the “excellent,” “good” and “fair” responses.
To assess ratings by the users of education services, a set of questions was asked only of parents or guardians whose children were enrolled in a public school or after-school program. These respondents gave more positive ratings of schools than did all respondents. This difference was reflected in the Public School Users Index score, which, at 85 (see Figure 5-B), was higher than the Public Education Index score of 75. Those respondents with children in the public school system also were asked to rate student safety. Just under half (48%) of respondents with children in the schools rated school safety as “excellent” or “good,” with approximately 80% of respondents rating student safety as at least “fair.”
Public Education
Index Score 75
Public Education Index**

Citywide Customer Survey Results
Chapter 5: Public Education and After-School Programs Page 49
Figure 5-B: Public School Users Index and Ratings
37%
42%
42%
40%
34%
32%
31%
32%
19%
13%
13%
15%13%
11%
14%
15%
0% 20% 40% 60% 80% 100%
Student safety at publicschools
New York City publicschools
Public after-schoolprograms
Percent of respondents*
Excellent Good Fair Poor
*Note: Responses from those who reported a member of their household had attended a public school or after-school program in the last 12 months. **Note: For index, responses are the average percent of respondents who reported “excellent,” “good,” “fair,” or “poor” on each of the other items shown in the chart. The Index Score represents the sum of the “excellent,” “good” and “fair” responses.
Thirty percent of surveyed residents reported having at least one child who attended a New York City public school within the last 12 months (see Figure 5-C). Approximately half as many (14%) said they had a child who had attended a New York City public after-school program.
Figure 5-C: Household Members’ Attendance at Public Schools and Public After-School Programs
14%
30%
86%
70%
Attended a New York Citypublic after-school
program
Attended a New York Citypublic school (K – 12)
Percent of respondents
Never in last 12 months At least once in last 12 months
Differences in ratings of public school education in New York City among various respondent subgroups were examined. Some of the differences observed included:
• Ratings of the quality of public education and after-school programming were similar among Hispanic and Non-Hispanic survey participants.
• Older respondents tended to give more positive ratings to public schools and after-school programs than did younger respondents.
• Public education and public after-school programs were given somewhat higher ratings by those whose preferred first language was not English compared to those whose preferred first language was English.
Public School Users Index
Score 85
Public School Users Index**

Page 50 Chapter 5: Public Education and After-School Programs
Average scores for the Public Education Index (the average ratings given by all respondents for public schools and public after-school programs) by Community Board are shown in the map below. These scores ranged from a low of 65 in Manhattan Community Board #10 (Central Harlem) to a high of 90 in Queens Community Board #11 (Bayside). Out of the 59 Community Boards, 25 had a score of 72 or less, while 13 had a score of 80 or higher.
Respondents living in Staten Island gave the most positive ratings to the public education items, with an average score of 84. The least positive ratings were observed in Manhattan and the Bronx, with average scores of 72. In the middle were Brooklyn with a score of 74 and Queens with a score of 78.
Figure 5-D: Public Education Index Ratings by Community Board

Citywide Customer Survey Results
Chapter 6: Community Conditions and Transportation Page 51
Chapter 6: Community Conditions and Transportation
The City provides a wide array of services to keep neighborhoods clean and well-maintained. The upkeep and enhancement of the transportation and water infrastructure critical to the City’s economic vitality and quality of life are the work of several City agencies. The Metropolitan Transportation Authority (MTA) provides mass transit services throughout the five boroughs.
The following chapter reflects New Yorkers’ experience of their streetscape as well as transportation systems, and includes the following information:
• Figure 6-A: Cleaning and Maintenance Index and Ratings
• Figure 6-B: Cleaning and Maintenance Index Ratings by Community Board
• Figure 6-C: Mass Transit Index and Ratings
• Figure 6-D: Streets and Sidewalks Index and Ratings
• Figure 6-E: Overall Ease of Travel Within the City
• Figure 6-F: Streets and Sidewalks Index Ratings by Community Board
Supplemental appendices, which are available online (at www.nyc.gov/operations), provide breakdowns of all results by respondent characteristics, such as age, gender, race and ethnicity, and by every borough.

Page 52 Chapter 6: Community Conditions and Transportation
Community Conditions The City provides numerous and diverse services to ensure the quality of the conditions of the urban landscape. To put the scale of these services in perspective, the City removes more than 11,000 tons of household and institutional waste on a daily basis; clears litter, snow, and ice from approximately 5,800 City street miles; and removes debris from vacant lots. The City also operates more than 13,000 miles of water mains and sewers, and manages 14 treatment plants capable of processing more than 1.3 billion gallons of wastewater a day to protect the environment of the City’s surrounding waterways.
Those who received the Survey were asked to rate a number of these neighborhood services and characteristics, such as waste pick-up services and the condition of street trees. Responses are summarized in the Cleaning and Maintenance Index (see Figure 6-A), which received a score of 83. Recycling and waste collection services were rated as ”excellent” or “good” by approximately two-thirds of respondents. About half considered the condition of neighborhood street trees and graffiti control as at least “good.” Cleanliness of the neighborhood, rat control, storm drainage, and sewer maintenance were deemed “excellent” or “good” by just under half of respondents. All services were rated as at least “fair” by 73% or more of respondents.
Figure 6-A: Cleaning and Maintenance Index and Ratings
11%
17%
18%
13%
34%
36%
38%
38%
44%
47%
49%
41%
26%
30%
33%
33%
31%
26%
25%
29%
27%
20%
21%
19%
13%
11%
8%
17%
8%
14%
13%
10%
0% 20% 40% 60% 80% 100%
Rat control in your neighborhood
Graffiti control in your neighborhood
Storm water drainage and sewer maintenance inyour neighborhood
Cleanliness of your neighborhood
Condition of street trees in your neighborhood
Recycling services in your neighborhood
Household garbage pick-up in yourneighborhood
Percent of respondents
Excellent Good Fair Poor
**Note: For index, responses are the average percent of respondents who reported “excellent,” “good,” “fair,” or “poor” on each of the other items shown in the chart. The Index Score represents the sum of the “excellent,” “good” and “fair” responses.
Cleaning and Maintenance
Index Score
83
Cleaning and Maintenance Index**

Citywide Customer Survey Results
Chapter 6: Community Conditions and Transportation Page 53
The Cleaning and Maintenance Index ratings given by respondents within each Community Board are displayed in the map below. The Index scores ranged from a 64 in Bronx Community Board #1 (Mott Haven and Melrose) to 93 in Manhattan Community Board #8 (Upper East Side), Manhattan #6 (Stuyvesant Town, Gramercy, and Murray Hill), and Queens #11 (Auburndale, Bayside, and Oakland Gardens). More than half (37) of the 59 Community Boards had Cleaning and Maintenance Index scores between 81 and 90.
While one of the Community Boards with a high score of 93 was located in Queens and the other two were in Manhattan, the borough with the highest average score overall was Staten Island, with a score of 89; this was followed by Queens (86), Manhattan (84), Brooklyn (82), and the Bronx (78).
Figure 6-B: Cleaning and Maintenance Index Ratings by Community Board

Page 54 Chapter 6: Community Conditions and Transportation
A few differences among respondent groups were noteworthy:
• In general, Hispanic survey participants gave somewhat lower ratings to the community conditions items than Non-Hispanic respondents.
• White respondents and Asian/Pacific Islander respondents gave somewhat higher ratings to the cleaning and maintenance items than did respondents of other races.
• Survey respondents who reported feeling safer in their neighborhoods gave higher ratings on the Cleaning and Maintenance Index than did those who reported feeling less safe in their neighborhood.

Citywide Customer Survey Results
Chapter 6: Community Conditions and Transportation Page 55
Transportation The ability to easily move people and goods throughout the City impacts not only the daily experience of residents, but it can also impact the City’s economic vitality. The City of New York is responsible for the condition of nearly 6,000 miles of streets and highways and 789 bridge structures, including six tunnels. To ensure pedestrian safety and smooth multi-modal transportation, the City installs and maintains traffic signals at more than 11,800 intersections. It also maintains more than 1.3 million signs, more than 300,000 streetlights, 69 million linear feet of street markings, and approximately 63,000 parking meters. The City promotes the overall ease of transportation by encouraging use of alternative modes of transportation, and recently piloted an automobile-free streets program in Manhattan to promote more sustainable forms of transportation.
The Survey included several questions to assess resident opinion about transportation infrastructure in New York City and the ease of travel within the City. The Mass Transit Index is comprised of ratings of bus and subway services in the neighborhood and in the City overall. Mass transit services were viewed relatively favorably and the Index received a score of 86 – the fourth highest rating among 12 indices.
Respondents tended to view bus and subway services in their neighborhood slightly more positively than in the City as a whole. Each of these neighborhood mass transit services was rated as “excellent” or “good” by slightly more than half of respondents each (see Figure 6-C). Bus services were considered “excellent” or “good” in the City overall by exactly half of respondents; just less than half regarded subway services in the City overall as “excellent” or “good.”
Figure 6-C: Mass Transit Index and Ratings
10%
41%
41%
42%
42%
42%
33%
36%
32%
37%
34%
15%
15%
14%
13%
14%
8%
11%
8%
12%
0% 20% 40% 60% 80% 100%
Subway services in yourneighborhood
Subway services in theCity overall
Bus services in yourneighborhood
Bus services in the Cityoverall
Percent of respondents
Excellent Good Fair Poor
**Note: For index, responses are the average percent of respondents who reported “excellent,” “good,” “fair,” or “poor” on each of the other items shown in the chart. The Index Score represents the sum of the “excellent,” “good” and “fair” responses.
Mass Transit Index Score
86 Mass Transit
Index**

Page 56 Chapter 6: Community Conditions and Transportation
The Streets and Sidewalks Index received a score of 79. The items encompassed by this Index (Figure 6-D) related to the maintenance and quality of the neighborhood streetscape. Each of the six items was rated as at least “fair” by two-thirds or more of survey participants. The most positive ratings within this service area were parking enforcement and pedestrian safety (each rated as “excellent” or “good” by a majority of respondents).
Figure 6-D: Streets and Sidewalks Index and Ratings
11%
13%
9%
28%
32%
36%
39%
41%
43%
36%
32%
36%
37%
34%
33%
29%
34%
34%
25%
21%
17%
15%
14%
21%
7%
7%
6%
9%
0% 20% 40% 60% 80% 100%
Control of street noise in your neighborhood
Maintenance of streets and roads in yourneighborhood
Maintenance of sidewalks in yourneighborhood
Removal of snow from city streets in yourneighborhood
Pedestrian safety (crossing intersections) inyour neighborhood
Parking enforcement in your neighborhood
Percent of respondents
Excellent Good Fair Poor
**Note: For index, responses are the average percent of respondents who reported “excellent,” “good,” “fair,” or “poor” on each of the other items shown in the chart. The Index Score represents the sum of the “excellent,” “good” and “fair” responses.
Streets and Sidewalks
Index Score
79
Streets and Sidewalks Index**

Citywide Customer Survey Results
Chapter 6: Community Conditions and Transportation Page 57
In addition to rating mass transit services and transportation infrastructure services, those completing the Survey evaluated the overall ease of travel within the City. Half of respondents considered the overall ease of travel “excellent” or “good” within the City.
Figure 6-E: Overall Ease of Travel Within the City
10%
40%
35%
14%
Excellent Good Fair Poor
Examination of ratings of transportation and street conditions by respondent subgroups revealed a few differences of note:
• In general, White respondents and Asian/Pacific Islander respondents gave somewhat higher ratings to the transportation and street conditions items than did respondents of other races.
• Higher ratings on the Streets and Sidewalks Index were given by those who reported feeling safer in their neighborhood than by those who reported feeling less safe in their neighborhood.

Page 58 Chapter 6: Community Conditions and Transportation
The map below reflects the average ratings of the Streets and Sidewalks Index for each Community Board. Among the 59 Community Boards, 13 had scores of 72 or lower on the Streets and Sidewalks Index. Most of these Boards were located in the Bronx or Brooklyn, with one located in Manhattan. The borough with the highest average score on this Index was Queens (82), followed by Manhattan (81), Staten Island (80), Brooklyn (77), and the Bronx (75).
The Streets and Sidewalks Index scores for the Community Boards ranged from 67 in Brooklyn Community Board #16 (Ocean Hill/Brownsville) to 89 in Queens Community Board #11 (Bayside). About half (29) of the 59 Community Boards had Index scores of 80 or more.
Figure 6-F: Streets and Sidewalks Index Ratings by Community Board

Citywide Customer Survey Results
Chapter 7: Recreation and Culture Page 59
Chapter 7: Recreation and Culture
Open space, recreational areas and cultural resources are critical amenities in neighborhoods that help shape the character of communities. The City of New York has world-renowned parks and cultural institutions, and a large number of facilities and programs that provide residents with opportunities to engage in a diversity of recreational and cultural experiences.
The Survey information provided in this chapter includes:
• Figure 7-A: Community Amenities Index and Ratings
• Figure 7-B: Use of Libraries and Parks
• Figure 7-C: Ratings of Libraries and Parks by User
• Figure 7-D: Community Amenities Index Ratings by Community Board
Supplemental appendices, which are available online (at www.nyc.gov/operations), provide breakdowns of all results by respondent characteristics, such as age, gender, race and ethnicity, and by every borough.

Page 60 Chapter 7: Recreation and Culture
Recreation and Culture The City’s municipal park system offers more than 28,800 acres including nearly 1,700 parks and more than 990 playgrounds and numerous other recreation facilities from athletic fields to zoos. The City strives to provide cultural opportunities to each neighborhood and works with 34 City-owned cultural institutions and more than 1,500 other not-for-profit organizations. The City’s 208 local library branches and four research library centers offer free and open access to their extensive hard copy and electronic resources.
Residents were asked about their perceived opportunities for culture and recreation, the amount of recreation they sought, and the quality of neighborhood parks and recreation services. The Community Amenities Index summarized these items and produced a score of 85.
Neighborhood parks and playgrounds were each evaluated as “excellent” or “good” by more than half of respondents. The availability of cultural activities in the neighborhood (as opposed to the City overall), received a rating of “excellent” or “good” by less than half (46%) of respondents. All items were rated as at least “fair” by approximately three-quarters of respondents.
Figure 7-A: Community Amenities Index and Ratings
16%
30%
40%
40%
46%
39%
29%
32%
31%
27%
30%
26%
14%
12%
10%
17%
14%
16%
18%
15%
0% 20% 40% 60% 80% 100%
Availability of cultural activities in yourneighborhood
Neighborhood playgrounds
Neighborhood parks
Public libraries in your neighborhood
Percent of respondents
Excellent Good Fair Poor
**Note: For index, responses are the average percent of respondents who reported “excellent,” “good,” “fair,” or “poor” on each of the other items shown in the chart. The Index Score represents the sum of the “excellent,” “good” and “fair” responses.
Residents were also asked to rate public libraries in the City overall; this rating was not included in the Community Amenities Index because the Index was comprised only of neighborhood items. However, respondents did hold more favorable perceptions of public libraries at the City level; 70% deemed public libraries “excellent” or “good” in the City overall, compared to 64% for libraries in the neighborhood (data for City overall can be found in Appendix C: Frequency of Responses to All Questions).
Community Amenities
Index Score 85
Community Amenities Index**

Citywide Customer Survey Results
Chapter 7: Recreation and Culture Page 61
The extent to which New Yorkers enjoy the City’s parks, recreation, and library facilities was also assessed through the Survey. More than 70% of households had used a public library at least once in the last 12 months; 40% had done so more than three times (see Figure 7-B). The City’s public parks and recreation facilities had been visited at least once by 80% of households, with more than half having visited a park or recreation facility more than three times in the previous 12 months.
Figure 7-B: Use of Libraries and Parks
33%
27%
40%
53%
27%
20%
Used the public libraries
Used one of the City'spublic parks or recreation
facilities
Percent of respondents
Never in last 12 months 1 to 3 times More than 3 times
Ratings of libraries and parks were examined by user status. The ratings of these facilities were similar but slightly more positive for those who had used these facilities within the previous year (see Figure 7-C) compared to all respondents (see Figure 7-A on the previous page).
Figure 7-C: Ratings of Libraries and Parks by Users
Neighborhood parks
11%
40%
29%
19%
Neighborhood playgrounds
13%
41%
31%
16%
Public libraries in the City overall
4%
51%24%
20%
Public libraries in your neighborhood
19%
26%
46%
9%
Excellent Good Fair Poor
*Note: Responses from those who reported using the facilities in the last 12 months.

Page 62 Chapter 7: Recreation and Culture
Differences in use of parks and recreation facilities and libraries were observed, and included the following:
• Higher annual household incomes were associated with higher use of parks and recreational facilities. However, use of libraries was similar among all income groups except the very highest ($200,000 or more annually), where use of libraries was somewhat lower.
• Younger respondents were somewhat more likely to have used a park and recreation facility or visited a library than were older respondents.
Some of the differences in recreation and culture ratings included:
• Non-Hispanic respondents gave somewhat higher ratings to recreation and culture items than did Hispanic respondents.
• In general, White respondents and Asian/Pacific Islander respondents gave somewhat higher ratings to the recreation and culture items than did respondents of other races.

Citywide Customer Survey Results
Chapter 7: Recreation and Culture Page 63
Exhibited in the map below are the average scores by Community Board for the Community Amenities Index. The scores ranged from 64 in Brooklyn Community Board #4 (Bushwick) to 97 in Manhattan Community Board #8 (the Upper East Side). Twelve of the 59 Boards had average scores of 91 or higher, while 17 had scores of 80 or less.
The boroughs of Manhattan and Staten Island had the most positive average ratings on the Community Amenities Index, with average scores of 91. Queens was next, with an average score of 85, followed by Brooklyn (83), and the Bronx (78).
Figure 7-D: Community Amenities Index Ratings by Community Board

Page 64 Chapter 7: Recreation and Culture
This page intentionally left blank.

Citywide Customer Survey Results
Chapter 8: Conclusion Page 65
Chapter 8: Conclusion The NYC Feedback Citywide Customer Survey represents a new tool for the City to measure how effectively it provides quality services – from the public’s perspective. With this new tool, City administrators will now have another dimension of data from which to learn. The Survey creates a baseline of public perceptions and a benchmark for performance management that may be tracked over time to observe trends.
The Survey results provide significant detail about differences among respondents, by location and by demographics. For even more detail, a two-page summary of results for each Community Board is included at the end of the main report. Supplemental appendices are also available online, providing breakdowns of all results by respondent characteristics, such as age, gender, race and ethnicity, and by every borough.
Analyzing results of the Survey is the first step in the City’s efforts to understand public perceptions about government performance. Following distribution of this report, the Mayor’s Office intends to engage City agencies to review how the Survey results can contribute to the continuous improvement of their service delivery, operations, and/or public outreach.
The City of New York is grateful to the public for taking the opportunity to provide us with their invaluable feedback. The information provided through this Survey effort will contribute to developing a more accountable, transparent and accessible City.

Page 66 Chapter 8: Conclusion
This page intentionally left blank.

Citywide Customer Survey Results
Attachment 1: Questionnaire and Cover Letter Page 67
Attachment 1: Questionnaire and Cover Letter
The following pages contain a copy of the questionnaire as well as the cover letter that accompanied it in the first mailing to survey recipients.

Page 68 Attachment 1: Questionnaire and Cover Letter
This page intentionally left blank.

Importante, ¡dé vuelta la página! Contraseña para Internet:
重要,請繼續下一頁!
網上答卷密碼:
重要,请继续下一页!
网上答卷密码:
Важно! Переверните страницу: пароль Интернета
June 2008
Dear New Yorker:
We want to hear from you! Your household was randomly selected to participate in the NYC Feedback Citywide Customer Survey. By completing the survey you have the chance to tell us what you think of City government’s service delivery and how you view the quality of life in New York. The survey is important, because we will use the information you provide to help us improve the performance of City government in your neighborhood and throughout the five boroughs.
To select the person to take this survey, choose the adult (anyone 18 years or older) who lives in your household who most recently had a birthday. That person’s year of birth does not matter, as long as he or she is at least 18 years old.
You also can complete the survey online. Just go to www.nyc.gov/nycfeedback and enter your unique password. Your password can be found in the upper lefthand corner of this page, above your address.
If you choose to complete the written survey, return the completed survey in the enclosed postage-paid envelope to the below address: National Research Center, Inc. 7 Times Square, Suite 4303 New York, NY 10036
Your responses will be completely confidential and no private information will be made available to the public or to the City. Responses will be reported in summary form only.
If you have any questions about this survey, please contact 3-1-1 or go to www.nyc.gov. We will use these survey results to review and improve the performance of City government, and we thank you for your valuable time. Sincerely, Michael R. Bloomberg Betsy Gotbaum Mayor Public Advocate
Office of the Mayor City Hall
New York, NY 10007
Office of the Public Advocate 1 Centre Street,
15th Floor New York, NY 10007

¡Deseamos conocer su opinión! La Ciudad de Nueva York le brinda una importante oportunidad para que nos cuente lo que piensa sobre la prestación de los servicios del gobierno de la Ciudad y cuál es su visión sobre la calidad de vida en Nueva York. Su hogar ha sido seleccionado al azar para participar en esta encuesta y su opinión es importante para nosotros. Si no pudiera completar la encuesta adjunta en inglés, quizá algún amigo o familiar pueda ayudarlo a completarla y luego enviarla en el sobre adjunto con franqueo pago. Si desea recibir una copia de la encuesta en español, llame al (1-800-815-7412). Allí tendrá que dejar un mensaje con su dirección y le enviaremos una versión en español de la encuesta. También puede realizar la encuesta en español por Internet. Visite www.nyc.gov/nycfeedback/spanish e ingrese su Contraseña única. La contraseña se encuentra en la parte superior de la página anterior. Todas sus respuestas serán totalmente confidenciales y no se pondrá información privada alguna a la disposición del público ni de la Ciudad. Las respuestas serán informadas únicamente en forma grupal. Gracias.
Мы хотим знать Ваше мнение! Администрация города Нью-Йорк предоставляет Вам возможность рассказать нам, что Вы думаете о работе служб городской администрации и уровне жизни в Нью-Йорке. Ваша семья была произвольно выбрана для участия в этом опросе, и мы дорожим Вашим мнением. Если Вы не можете заполнить данную анкету на английском языке, Вы можете попросить друга или члена семьи помочь Вам, а потом вернуть анкету в приложенном конверте (пересылка оплачена). Если Вы хотите получить копию анкеты на русском языке, позвоните 1-800-815-7579. Оставьте сообщение и Ваш адрес, и Вам будет выслана анкета на русском языке по почте. Вы также можете заполнить анкету на русском азыке в электронном формате на Интернете: наберите адрес www.nyc.gov/nycfeedback/russian и введите Ваш пароль (password). Ваш пароль (password) находится на верху предыдущей страницы. Все ответы абсолютно конфиденциальны и Ваша частная информация не будет предоставлена общественности или городской администрации. Результаты будут представлены только в обобщенной форме. Спасибо!
我们希望听到你的声音!
纽约市政府为你提供这一重要机会,告诉我们你对市府的服务执行情况评价如何,对纽约市的生活质量
有何观点。你户被随机抽样选中参与这次调查,你的意见对我们十分重要。
如果你无法用英语填写内附的问卷,你可以请朋友或家人帮助填写,填写完毕后使用内附邮资已付信封
寄回。如果你希望收到一份简体字中文问卷,请拨打 (1-888-452-3842), 听到提示后留下你的地址,
我们将会邮寄给你一份中文简体字问卷。你也可以上网填写中文简体字问卷,网址是
www.nyc.gov/nycfeedback/chinese ,在键入你专用的密码后填写。你的密码在前一页的顶端。
所有问卷答复均为完全保密,任何私人资讯都不会提供给公众或市政府。我们只以归纳总结的形式报告
调查结果。
谢谢你。
我們希望聽到你的聲音!
紐約市政府為你提供這一重要機會,告訴我們你對市府的服務執行情況評價如何,對紐約市的生活質量
有何觀點。你戶被隨機抽樣選中參與這次調查,你的意見對我們十分重要。
如果你無法用英語填寫內附的問卷,你可以請朋友或家人幫助填寫,填寫完畢後使用內附郵資已付信封
寄回。如果你希望收到一份繁體字中文問卷,請撥打(1-888-452-3842),聽到提示後留下你的地址,我
們將會郵寄給你一份中文繁體字問卷。你也可以上網填寫中文繁體字問卷,網址是
www.nyc.gov/nycfeedback/chinese ,在鍵入你專用的密碼後填寫。你的密碼在前一頁的頂端。
所有問卷答复均為完全保密,任何私人資訊都不會提供給公眾或市政府。我們只以歸納總結的形式報告
調查結果。
謝謝你。

Citywide Customer Survey Page 1
Citywide Customer Survey
Thank you for participating in this survey! As a reminder, this survey should be completed by the adult (18 years or older) in your household who most recently had a birthday. For each question, please circle the response that most closely matches your opinion, or check the box that indicates your answer. Return the completed survey in the enclosed postage-paid envelope or submit your responses online. Your responses are completely confidential and will be reported in summary form only.
Excellent Good Fair Poor Don’t know 1. How would you rate the quality of life in
New York City overall? ........................................................ 1 2 3 4 5 2. How would you rate your neighborhood as a
place to live?......................................................................... 1 2 3 4 5
3. Please rate how safe you feel in each of the following locations or situations: Very Somewhat Somewhat Very Don’t
safe safe unsafe unsafe know Walking alone on a street in your neighborhood at night......1 2 3 4 5 In a park or playground during the day .................................1 2 3 4 5 Riding a subway during the day............................................1 2 3 4 5 Riding a subway at night.......................................................1 2 3 4 5
Please think about your own neighborhood as you rate the items in the next question.
4. Please rate each of the following in your neighborhood.
Excellent Good Fair Poor Don’t know Cleanliness of your neighborhood ..............................................1 2 3 4 5 Control of street noise.................................................................1 2 3 4 5 Household garbage pick-up........................................................1 2 3 4 5 Recycling services ......................................................................1 2 3 4 5 Rat control ..................................................................................1 2 3 4 5 Graffiti control .............................................................................1 2 3 4 5 Pedestrian safety (crossing intersections) .................................1 2 3 4 5 Maintenance of streets and roads .............................................1 2 3 4 5 Maintenance of sidewalks...........................................................1 2 3 4 5 Removal of snow from city streets..............................................1 2 3 4 5 Parking enforcement...................................................................1 2 3 4 5 Condition of street trees..............................................................1 2 3 4 5 Storm water drainage and sewer maintenance ..........................1 2 3 4 5 Availability of health care services..............................................1 2 3 4 5 Availability of cultural activities
(such as concerts, plays, museums) ......................................1 2 3 4 5 Neighborhood parks ...................................................................1 2 3 4 5 Neighborhood playgrounds.........................................................1 2 3 4 5

Citywide Customer Survey Page 2
For the next question, please think about your neighborhood first AND THEN your experiences in New York City overall.
5. Please rate each of the following . . . .
in your neighborhood in the City overall
Excellent Good Fair Poor Don’t know Excellent Good Fair Poor Don’t know Fire protection services............ 1 2 3 4 5 1 2 3 4 5 Emergency medical services (e.g., ambulance, etc.) ........... 1 2 3 4 5 1 2 3 4 5
Police-Community relations ..... 1 2 3 4 5 1 2 3 4 5 Crime control ........................... 1 2 3 4 5 1 2 3 4 5 Bus services ............................ 1 2 3 4 5 1 2 3 4 5 Subway services...................... 1 2 3 4 5 1 2 3 4 5 Public libraries, including
bookmobiles, telephone reference services, or online services ........... 1 2 3 4 5 1 2 3 4 5
For the next question, please think about New York City overall (as opposed to just your neighborhood).
6. Please rate each of the following in New York City: Excellent Good Fair Poor Don’t know NYC.gov, the City website that provides information
about the City and its services.................................................1 2 3 4 5 3-1-1, New York City's information telephone number for
government information and non-emergency services............1 2 3 4 5 Public education (kindergarten – 12th grade) ............................1 2 3 4 5 Public after-school programs ......................................................1 2 3 4 5 Air quality ....................................................................................1 2 3 4 5 Restaurant cleanliness ...............................................................1 2 3 4 5 Overall ease of travel within the city ...........................................1 2 3 4 5 Public housing ............................................................................1 2 3 4 5 Public assistance (such as Medicaid,
food stamps, welfare, etc.) ......................................................1 2 3 4 5 Services addressing homelessness ...........................................1 2 3 4 5 Availability of youth employment programs ................................1 2 3 4 5 Services protecting children at risk of abuse and neglect...........1 2 3 4 5
7. Please rate how well you think New York City government does the following: Excellent Good Fair Poor Don’t know Promotes the economic growth of New York City ......................1 2 3 4 5 Prepares the city for an emergency............................................1 2 3 4 5 Spends tax dollars wisely ...........................................................1 2 3 4 5
Now, please consider all your experiences with City services over the last 12 months.
Excellent Good Fair Poor Don’t know 8. How would you rate the overall quality of
New York City government services? ................................ 1 2 3 4 5

Citywide Customer Survey Page 3
9. In the last 12 months, about how many times, if ever, have you or any member of your household
done any of the following? 1 to 3 More than Never times 3 times Used the public libraries (not including school or university libraries) including
bookmobiles, telephone reference services, or online services .............................. 1 2 3 Visited a website called NYC.gov, which provides information
about various City of New York government agencies ............................................ 1 2 3 Used one of the City of New York's public parks or recreation facilities,
including playgrounds and public swimming pools .................................................. 1 2 3 Used City services for the mobility impaired............................................................... 1 2 3 Used a City child daycare program............................................................................. 1 2 3 Used a City youth program ......................................................................................... 1 2 3
10. Please indicate whether or not you or any member of your household have done any of the following in the last 12 months. If you have, please rate the quality of the services you received most recently.
Done by you or any household member? Rate the services received Don’t Yes No Excellent Good Fair Poor know Called 3-1-1 ............................................................ 1 2 3 4 5
Called 9-1-1 ............................................................ 1 2 3 4 5
Attended a New York City Public School (kindergarten – 12th grade) ................................ 1 2 3 4 5
If you marked “yes” above, How would you rate student safety at public schools? .........................1 2 3 4 5
Attended a New York City Public School after-school program............................................ 1 2 3 4 5
Received consumer assistance (e.g., complained about fraud or unfair business practices, or received consumer protection services) ............................ 1 2 3 4 5
Visited a public community center .......................... 1 2 3 4 5
Participated in an employment training program .... 1 2 3 4 5
Used public hospital services ................................ 1 2 3 4 5
Used public health clinic services .......................... 1 2 3 4 5
Used public mental health services ....................... 1 2 3 4 5
Used public substance abuse services ................... 1 2 3 4 5
Used a public senior center .................................... 1 2 3 4 5
Used other public senior services (e.g., respite care, transportation, etc.) .................................... 1 2 3 4 5
Received Medicaid ................................................. 1 2 3 4 5
Paid a fine or ticket to the City ................................ 1 2 3 4 5
Contacted the City with a tax question ................... 1 2 3 4 5

Citywide Customer Survey Page 4
11. Have you made a complaint to 3-1-1 or to a city agency in the last 12 months? No Yes Was your complaint or issue resolved?
Yes No Don’t know
12. Have you had phone or in-person contact with any City of New York government office or agency in the last 12 months?
Yes No go to question #15
13. About what type of service did you most recently make contact with a City office or agency? Housing Parks Sanitation Public safety Education Other Transportation Health and Social Services Don’t know Business licenses/permits Cultural and Community services
14. How would you rate the response of the office or agency with which you most recently had contact?
Not applicable/ Excellent Good Fair Poor don’t know Timeliness of response...............................................................1 2 3 4 5 Employee’s courtesy...................................................................1 2 3 4 5 Employee’s willingness to help or understand............................1 2 3 4 5 Overall customer service ............................................................1 2 3 4 5 Overall satisfaction with response ..............................................1 2 3 4 5
15. What do you think are the most important issues facing New York City? Please name up to three issues.
1) __________________________________________________________________
2) __________________________________________________________________
3) __________________________________________________________________
Our last questions are about you and your household. This information is completely confidential, will be used to classify responses, and will be reported in group form only.
16. About how many years have you lived in New
York City? (Staten Island, Brooklyn, Queens, Bronx, Manhattan) (Record 0 if less than 12 months) ________ years
17. In the next 5 years, do you plan to stay in New
York City or do you plan to move somewhere else?
Stay in New York City Move somewhere else Don’t know
18. Does your household have any working computers with Internet access?
No, no computers Yes, computers but no internet access Yes, with high-speed Internet access Yes, with dial-up Internet access
19. Are you employed?
Yes No

Citywide Customer Survey Page 5
20. Thinking of you and your household, how prepared, if at all, do you feel you would be if there were an emergency such as a flood, hurricane or blizzard?
Very prepared Somewhat prepared Unprepared
21. Please check the one box that most closely
describes the type of house you live in. An apartment in an apartment building A one family detached house A one family attached house Other
22. Is your residence rented or owned?
Rented Owned
23. Are you living in New York City public
housing, or are you receiving a rent subsidy, like Section 8, from the government?
Yes, living in New York City public housing Yes, receiving a rent subsidy, like Section 8 No, not living in public housing or receiving a rent subsidy
24. About how much was the total 2007 income
before taxes for your household as a whole? Less than $10,000 $50,000 - $99,999 $10,000 - $34,999 $100,000 - $199,999 $35,000 - $49,999 $200,000 or more
25. Including yourself, how many adults (age 18
or older) are there in your household? One (1) Two (2) Three (3) Four or more (4+)
26. How many children (under age 18) are there in
your household? None (0) One (1) Two (2) Three or more (3+)
27. Is any member of your
household age 65 or older? Yes No
28. What is your age? 18-24 years old 55-64 years old 25-34 years old 65-74 years old 35-44 years old 75 or older 45-54 years old
29. What is the highest level of education you
have completed? 0-11 years, no diploma High school graduate Some college, no degree Associate Degree Bachelor’s Degree Graduate Degree (e.g., PhD, MS, MA, etc.)
30. Are you Hispanic or Latino/Latina?
Yes No
31. Which best describes your race?
(Please check all that apply) American Indian, Eskimo or Aleut Asian or Pacific Islander Black or African American White Other
32. What is your preferred first language?
Arabic Greek Russian Cantonese Hebrew Spanish Mandarin Hindi Tagalog English Italian Yiddish French Korean Other German Polish
33. How would you rate the way the City of New
York provides services in your language? Excellent Good Fair Poor Don’t know
34. What is your gender?
Male Female
Thank You! Please return the completed questionnaire in the postage paid envelope to: NYC Feedback Citywide Customer Survey c/o National Research Center, Inc. 7 Times Square, Suite 4303 New York, NY 10036

Citywide Customer Survey Page 6
This page intentionally left blank

Citywide Customer Survey Results
Attachment 2: Summary Survey Results for Each Community Board Page 77
Attachment 2: Summary Survey Results for Each Community Board
The following pages contain a 2 page summary of survey results for each Community Board, preceded by a User Guide explaining the information displayed.
In each summary report, information about that Community Board is displayed, including demographic information from the 2006 American Community Survey (conducted by the Census Bureau) and from the 2000 decennial Census for those Community Boards where the 2006 data were not available.
The charts in each Community Board report compare ratings given by respondents who lived within the Community Board boundaries to all NYC survey respondents (including those within the Community Board). In a few cases, comparisons are also made to responses given by all respondents living within the borough in which the Community Board is located.
For example, when looking at ratings for “neighborhood as a place to live” the reader can see how respondents in that Community Board rated their neighborhood, how all respondents from the borough rated their neighborhood and how survey respondents from the entire City rated their neighborhood.

City
wid
e C
usto
mer
Sur
vey
Res
ults
Su
rvey
Su
mm
ary
Ab
ou
t th
e C
om
mu
nit
y B
oar
d R
epo
rts
NY
C F
eed
bac
k:
Un
der
stan
din
g t
he
Co
mm
un
ity
Bo
ard
Res
ult
s
•In
Jun
e 20
08, t
he N
YC
Fee
dbac
k C
ityw
ide
Cus
tom
er S
urve
y w
as m
aile
d to
136
,642
ra
ndom
ly s
elec
ted
hous
ehol
ds w
ithin
the
59
com
mun
ity b
oard
s th
roug
hout
the
five
boro
ughs
of
New
Yor
k C
ity.
•R
espo
nden
ts c
ould
ret
urn
the
surv
ey b
y m
ail o
r co
mpl
ete
it on
the
Web
. A to
tal o
f 24,
339
surv
eys
wer
e re
turn
ed fo
r a
resp
onse
rat
e of
18%
.
•W
ithin
eac
h of
the
59 C
omm
unity
Boa
rds,
the
num
ber
of s
urve
ys r
etur
ned
rang
ed fr
om 2
53 to
64
5.
•A
full
desc
riptio
n of
the
surv
ey m
etho
dolo
gy a
nd
city
wid
e fin
ding
s ca
n be
foun
d at
w
ww
.nyc
.gov
/ope
ratio
ns o
r in
the
NY
C F
eedb
ack
City
wid
e C
usto
mer
Sur
vey:
Rep
ort o
f Sur
vey
Res
ults
.
•A
sum
mar
y of
sur
vey
resu
lts h
as b
een
crea
ted
for
each
of t
he 5
9 C
omm
unity
Boa
rds
in N
ew Y
ork
City
.
•E
ach
Com
mun
ity B
oard
Rep
ort i
nclu
des
a lis
t of
in
dex
scor
es.
•A
n in
dex
scor
e pr
ovid
es a
com
bine
d re
sult
base
d on
the
resp
onse
s to
sev
eral
diff
eren
t sur
vey
ques
tions
that
add
ress
a r
elat
ed s
ubje
ct.
•E
ach
inde
x sc
ore
repr
esen
ts th
e av
erag
e pe
rcen
t of
res
pond
ents
rep
ortin
g “e
xcel
lent
,”“g
ood,
”or
“f
air”
for
each
of t
he it
ems
incl
uded
in th
e in
dex.
•In
dex
ratin
gs g
iven
by
resp
onde
nts
livin
g in
the
Com
mun
ity B
oard
bou
ndar
ies
are
com
pare
d to
th
e ra
tings
giv
en b
y al
l res
pond
ents
city
wid
e.

City
wid
e C
usto
mer
Sur
vey
Res
ults
Soci
al S
uppo
rt S
ervi
ces
Inde
xP
ublic
ass
ista
nce
(suc
h as
Med
icai
d, fo
od, s
tam
ps,
etc.
)S
ervi
ces
prot
ectin
g ch
ildre
n at
risk
of a
buse
and
neg
lect
Publ
ic h
ousi
ng in
the
City
ove
rall
Ava
ilabi
lity
of y
outh
em
ploy
men
t pro
gram
sS
ervi
ces
addr
essi
ng h
omel
essn
ess
Educ
atio
n In
dex
Publ
ic e
duca
tion
(kin
derg
arte
n –
12th
gra
de)
Pub
lic a
fter-s
choo
l pro
gram
s
Cle
anin
g an
d M
aint
enan
ce In
dex
Hou
seho
ld g
arba
ge p
ick-
up in
you
r nei
ghbo
rhoo
dR
ecyc
ling
serv
ices
in y
our n
eigh
borh
ood
Con
ditio
n of
stre
et tr
ees
in y
our n
eigh
borh
ood
Cle
anlin
ess
in y
our n
eigh
borh
ood
Sto
rm w
ater
dra
inag
e an
d se
wer
mai
nten
ance
in y
our
neig
hbor
hood
Gra
ffiti
cont
rol i
n yo
ur n
eigh
borh
ood
Rat
con
trol i
n yo
ur n
eigh
borh
ood
Ind
ex S
tru
ctu
re
Stre
ets
and
Side
wal
ks In
dex
Park
ing
enfo
rcem
ent i
n yo
ur n
eigh
borh
ood
Ped
estri
an s
afet
y (c
ross
ing
inte
rsec
tions
) in
your
ne
ighb
orho
odR
emov
al o
f sno
w fr
om c
ity s
treet
s in
you
r ne
ighb
orho
odM
aint
enan
ce o
f sid
ewal
ks in
you
r nei
ghbo
rhoo
dM
aint
enan
ce o
f stre
ets
and
road
s in
you
r ne
ighb
orho
odC
ontro
l of s
treet
noi
se in
you
r nei
ghbo
rhoo
d
Mas
s Tr
ansi
t Ser
vice
s In
dex
Bus
ser
vice
s in
the
City
ove
rall
Bus
serv
ices
in y
our n
eigh
borh
ood
Sub
way
ser
vice
s in
the
City
ove
rall
Sub
way
ser
vice
s in
you
r nei
ghbo
rhoo
d
Nei
ghbo
rhoo
d Pu
blic
Saf
ety
Inde
xFi
re p
rote
ctio
n se
rvic
es in
you
r nei
ghbo
rhoo
dE
mer
genc
y m
edic
al s
ervi
ces
in y
our
neig
hbor
hood
Crim
e co
ntro
l in
your
nei
ghbo
rhoo
dPo
lice-
Com
mun
ity re
latio
ns in
you
r nei
ghbo
rhoo
d
Ther
e ar
e 12
diff
eren
t ind
ices
dis
cuss
ed in
the
repo
rt; e
ach
is c
ompr
ised
of v
ario
us q
uest
ions
that
wer
e as
ked
of th
e su
rvey
resp
onde
nts.
The
re a
re s
even
indi
ces
incl
uded
in th
e C
omm
unity
Boa
rd re
ports
. Th
ese
indi
ces
and
thei
r res
pect
ive
ques
tions
are
as
follo
ws:
NYC
Fee
dbac
k: U
nder
stan
ding
the
Com
mun
ity B
oard
Res
ults

City
wid
e C
usto
mer
Sur
vey
Res
ults
15%
13%
10%
44%
42%
47%
29%
32%32
%
12%
13%
10%
0%25
%50
%75
%10
0%
All N
ew Y
ork
City
Res
pond
ents
All B
rook
lyn
Res
pond
ents
All C
omm
unity
Boa
rd #
1 R
espo
nden
ts
Bac
kgro
un
d:
Bro
okl
yn C
om
mu
nit
y B
oar
d #
1S
urv
ey R
esp
on
ses:
Bro
okl
yn C
om
mu
nit
y B
oar
d #
1
Th
e N
eig
hb
orh
oo
ds
of
Bro
okl
ynC
om
mu
nit
y B
oar
d #
1
Sour
ce: N
YC P
lann
ing
Dep
artm
ent
Rat
ing
s o
f N
eig
hb
orh
oo
d a
s a
Pla
ce t
o L
ive
Rat
ing
s o
f O
vera
ll Q
ual
ity
of
Lif
e in
New
Yo
rk C
ity
Exc
elle
ntP
oor
Fair
Goo
d
Exc
elle
ntP
oor
Fair
Goo
d
Exc
elle
ntP
oor
Fair
Goo
d
Rat
ing
s o
f O
vera
ll Q
ual
ity
of
New
Yo
rk C
ity
Go
vern
men
t S
ervi
ces
45%
43%49
%
37%
40%38
%
12%
13%
5%5% 6%
9%
0%25
%50
%75
%10
0%
All N
ew Y
ork
City
Res
pond
ents
All B
rook
lyn
Res
pond
ents
All C
omm
unity
Boa
rd #
1 R
espo
nden
ts
38%
35%41
%
44%
46%42
%
15%
15%
13%
4%
4%
4%
0%25
%50
%75
%10
0%
All N
ew Y
ork
City
Res
pond
ents
All B
rook
lyn
Res
pond
ents
All C
omm
unity
Boa
rd #
1 R
espo
nden
ts
Gen
der
•M
ale:
48%
•F
emal
e: 5
2%A
ge •<
18 y
ears
old
: 27%
•18
-54
year
s ol
d: 5
2%•
55+
yea
rs o
ld: 2
1%
Rac
e/E
thn
icit
y•
Non
-His
pani
c W
hite
: 64%
•N
on-H
ispa
nic
Bla
ck: 2
%•
Non
-His
pani
c A
sian
: 5%
•H
ispa
nic:
27%
•O
ther
: 2%
Po
pu
lati
on
an
d H
ou
seh
old
s•
Tot
al P
opul
atio
n: 1
41,5
13•
Tot
al H
ouse
hold
s: 5
1,80
2
Med
ian
An
nu
al H
ou
seh
old
Inco
me
•$3
2,30
7(2
006
Infla
tion-
Adj
uste
d D
olla
rs)
•49
8 R
espo
nses
•16
.6%
Res
pons
e R
ate
•±4
.4%
Mar
gin
of E
rror
(95
% C
onfid
ence
Inte
rval
)
Sou
rce:
U.S
. Cen
sus
Bur
eau
-20
06 A
mer
ican
Com
mun
ity S
urve
y, P
opul
atio
n D
ivis
ion
-N
ew Y
ork
City
Dep
artm
ent o
f City
Pla
nnin
g
See
deta
il be
low
1 2
Dem
ogra
phic
pro
file
of th
e di
stric
t; da
ta ta
ken
from
NY
C
Dep
artm
ent o
f City
Pla
nnin
g 20
06 A
mer
ican
Com
mun
ity
Sur
vey
or th
e 20
00 U
.S.
Cen
sus
1A
map
sho
win
g th
e lo
catio
n of
the
dist
rict
with
in N
ew Y
ork
City
an
d th
e ne
ighb
orho
ods
with
in th
e di
stric
t
2T
he n
umbe
r of
res
pons
es r
ecei
ved
from
res
pond
ents
with
in th
at
Com
mun
ity B
oard
, as
wel
l as
the
resp
onse
rat
e an
d th
e m
argi
n of
er
ror.
(“M
argi
n of
err
or”
refe
rs to
the
band
of u
ncer
tain
ty a
roun
d re
sults
ba
sed
on th
e nu
mbe
r of
res
pons
es
rece
ived
.)
3T
hese
cha
rts
prov
ide
sele
cted
sur
vey
resu
lts fo
r re
spon
dent
s w
ho li
ved
with
in th
e C
omm
unity
Boa
rd
boun
darie
s, c
ompa
red
to r
espo
nses
gi
ven
by r
espo
nden
ts w
ho li
ved
with
in th
e bo
roug
h, c
ompa
red
to a
ll N
YC
sur
vey
resp
onde
nts.
4
3
4
NYC
Fee
dbac
k: U
nder
stan
ding
the
Com
mun
ity B
oard
Res
ults

City
wid
e C
usto
mer
Sur
vey
Res
ults
12%
26%
45%
18%
12%
31%
43%
15%
Nei
gh
bo
rho
od
P
ub
lic S
afet
y In
dex
14%
34%
42%
10%
15%
32%
43%
9%M
ass
Tra
nsi
t S
ervi
ces
Ind
ex
21%
34%
36%
9%
24%
35%
34%
7%S
tree
ts a
nd
S
idew
alks
In
dex
17%
29%
41%
13%
24%
32%
35%
9%C
lean
ing
an
d
Mai
nte
nan
ce
Ind
ex
25%
39%
30%
6%
27%
36%
30%
8%P
ub
licE
du
cati
on
In
dex
42%
35%
19%
4%
42%
35%
18%
5%S
oci
al S
up
po
rt
Ser
vice
s In
dex
Ind
ex
Sco
reP
oo
rF
air
Go
od
Exc
elle
nt
Sur
vey
resp
onde
nts
wer
e as
ked
to n
ame
wha
t th
ey t
hou
ght
we
re t
he
thre
e m
ost
imp
orta
nt is
sues
fac
ing
Ne
w Y
ork
City
. T
he
thre
e re
spo
nse
s m
ost
com
mo
nly
give
n by
Bro
okly
n
Co
mm
unity
Bo
ard
#1
res
pond
ents
are
list
ed
belo
w.
Top
5B
ott
om
5
Sur
vey
resp
onde
nts
ra
ted
24
se
rvic
es
in t
heir
neig
hbo
rhoo
d.
Th
e hi
ghe
st a
nd lo
wes
t ra
ted
se
rvic
es
are
di
spla
yed
belo
w.
NY
C
All
Com
mun
ity B
oard
#1
Res
pond
ents
All
New
Yor
k C
ity R
espo
nden
ts
Ind
ex R
atin
gs:
Bro
okl
yn C
om
mu
nit
y B
oar
d #
1 C
om
par
ed t
o R
atin
gs
Giv
en b
y A
ll R
esp
on
den
tsM
ost
Imp
ort
ant
Issu
es F
acin
g N
ew Y
ork
C
ity:
Bro
okl
yn C
om
mu
nit
y B
oar
d #
1
Rat
ing
s o
f N
eig
hb
orh
oo
d S
ervi
ces:
B
roo
klyn
Co
mm
un
ity
Bo
ard
#1
5858 7573 8376 7976 8685 8988
1.
Ho
usin
g
2.
Ma
ss T
ran
sit
3.
Edu
catio
n
1.F
ire
prot
ect
ion
serv
ice
s
2.E
me
rge
ncy
med
ical
se
rvic
es
3.H
ou
seho
ld g
arb
age
pic
k-up
4.N
eig
hbo
rho
od p
ark
s
5.P
ark
ing
enf
orc
eme
nt
1.
Co
ntro
l of s
tree
t noi
se
2.
Ra
t con
trol
3.
Gra
ffiti
cont
rol
4.
Cle
an
lines
s of
you
r n
eigh
borh
oo
d
5.
Ma
inte
nan
ce o
f str
eets
a
nd r
oad
s
Hig
hest
Rat
edLo
wes
t Rat
ed
5 Tab
le s
how
s se
lect
ed in
dex
scor
e re
sults
for
surv
ey
resp
onde
nts
who
live
d in
the
Com
mun
ity B
oard
bou
ndar
ies,
co
mpa
red
to a
ll N
YC
sur
vey
resp
onde
nts.
5S
how
s w
hat r
espo
nden
ts w
ho
lived
in th
e C
omm
unity
Boa
rd
felt
wer
e th
e th
ree
mos
t im
port
ant i
ssue
s fa
cing
the
City
, as
rep
orte
d in
an
open
-end
ed
ques
tion.
6E
ach
resp
onde
nt w
as g
iven
a to
tal o
f 24
neig
hbor
hood
ser
vice
s to
rat
e on
a s
cale
of “
exce
llent
,”“g
ood,
”“f
air”
or “
poor
.”T
his
sect
ion
of th
e C
omm
unity
Boa
rd r
epor
t sho
ws
how
res
pond
ents
w
ho li
ved
in th
e C
omm
unity
Boa
rd r
ated
nei
ghbo
rhoo
d se
rvic
es
–w
hich
five
ser
vice
s re
ceiv
ed th
e hi
ghes
t rat
ings
and
whi
ch fi
vese
rvic
es r
ecei
ved
the
low
est r
atin
gs
7
6 7
NYC
Fee
dbac
k: U
nder
stan
ding
the
Com
mun
ity B
oard
Res
ults

City
wid
e C
usto
mer
Sur
vey
Res
ults
15%
44%
34%
16%
29%
36%
41%
12%
22%
42%
7%2%
0%25
%50
%75
%10
0%
All N
ew Y
ork
City
Res
pond
ents
All B
ronx
Res
pond
ents
All C
omm
unity
Boa
rd #
1 R
espo
nden
ts
Bac
kgro
un
d:
Bro
nx
Co
mm
un
ity
Bo
ard
#1
Su
rvey
Res
po
nse
s: B
ron
x C
om
mu
nit
y B
oar
d #
1
Th
e N
eig
hb
orh
oo
ds
of
the
Bro
nx
Co
mm
un
ity
Bo
ard
#1
Sour
ce: N
YC P
lann
ing
Dep
artm
ent
Gen
der
•M
ale:
46%
•F
emal
e: 5
4%A
ge •<
18 y
ears
old
: 35%
•20
-64
year
s ol
d: 5
7%•
65+
yea
rs o
ld: 8
%
Rac
e/E
thn
icit
y•
Non
-His
pani
c W
hite
: 1%
•N
on-H
ispa
nic
Bla
ck: 2
6%•
Non
-His
pani
c A
sian
: 1%
•H
ispa
nic:
71%
•O
ther
: 1%
Po
pu
lati
on
an
d H
ou
seh
old
s•
Tot
al P
opul
atio
n: 8
2,15
9•
Tot
al H
ouse
hold
s: 2
6,90
9
Med
ian
An
nu
al H
ou
seh
old
Inco
me
•$1
8,52
0
Res
ult
sfr
om
NY
C F
eed
bac
k C
ityw
ide
Cu
sto
mer
Su
rvey
Bro
nx
Co
mm
un
ity
Bo
ard
#1
Rat
ing
s o
f N
eig
hb
orh
oo
d a
s a
Pla
ce t
o L
ive
Rat
ing
s o
f O
vera
ll Q
ual
ity
of
Lif
e in
New
Yo
rk C
ity
Exce
llent
Poor
Fair
Goo
d
Exce
llent
Poor
Fair
Goo
d
Exce
llent
Poor
Fair
Goo
d
Rat
ing
s o
f O
vera
ll Q
ual
ity
of
New
Yo
rk C
ity
Go
vern
men
t S
ervi
ces
45%
37%
26%
37%
42%
52%
12%
16%
19%
4%3% 6%
0%25
%50
%75
%10
0%
All N
ew Y
ork
City
Res
pond
ents
All B
ronx
Res
pond
ents
All C
omm
unity
Boa
rd #
1 R
espo
nden
ts
38%
32%
29%
44%
44%
41%
15%
19%
27%
5%3% 4%
0%25
%50
%75
%10
0%
All N
ew Y
ork
City
Res
pond
ents
All B
ronx
Res
pond
ents
All C
omm
unity
Boa
rd #
1 R
espo
nden
ts
•41
3 R
espo
nses
•11
.7%
Res
pons
e R
ate
•±4
.8%
Mar
gin
of E
rror
(95
% C
onfid
ence
Inte
rval
)
Sou
rce:
U.S
. Cen
sus
Bur
eau
-20
00 C
ensu
s, P
opul
atio
n D
ivis
ion
-N
ew Y
ork
City
Dep
artm
ent o
f City
Pla
nnin
g
See
deta
il be
low

City
wid
e C
usto
mer
Sur
vey
Res
ults
12%
26%
45%
18%
25%
33%
32%
10%
Nei
gh
bo
rho
od
P
ub
lic S
afet
y In
dex
14%
34%
42%
10%
17%
36%
38%
8%M
ass
Tra
nsi
t S
ervi
ces
Ind
ex
21%
34%
36%
9%
32%
39%
25%
4%S
tree
ts a
nd
S
idew
alks
In
dex
17%
29%
41%
13%
36%
35%
24%
5%C
lean
ing
an
d
Mai
nte
nan
ce
Ind
ex
25%
39%
30%
6%
30%
36%
30%
4%P
ub
licE
du
cati
on
In
dex
42%
35%
19%
4%
47%
30%
18%
5%S
oci
al S
up
po
rt
Ser
vice
s In
dex
Ind
ex
Sco
reP
oo
rF
air
Go
od
Exc
elle
nt
Sur
vey
resp
onde
nts
wer
e as
ked
to n
ame
wha
t the
y th
ough
t w
ere
the
thre
e m
ost i
mpo
rtan
t iss
ues
faci
ng N
ew Y
ork
City
. T
he th
ree
resp
onse
s m
ost c
omm
only
giv
en b
y B
ronx
C
omm
unity
Boa
rd #
1 re
spon
dent
s ar
e lis
ted
belo
w.
Hig
hest
Rat
edLo
wes
t Rat
ed
Sur
vey
resp
onde
nts
rate
d 24
ser
vice
s in
thei
r ne
ighb
orho
od.
The
hig
hest
and
low
est r
ated
ser
vice
s ar
e di
spla
yed
belo
w.
NYC
All
Com
mun
ity B
oard
#1
Res
pond
ents
All
New
Yor
k C
ity R
espo
nden
ts
Ind
ex R
atin
gs:
Bro
nx
Co
mm
un
ity
Bo
ard
#1
Co
mp
ared
to
Rat
ing
s G
iven
by
All
Res
po
nd
ents
Mo
st Im
po
rtan
t Is
sues
Fac
ing
New
Yo
rk
Cit
y: B
ron
x C
om
mu
nit
y B
oar
d #
1
Rat
ing
s o
f N
eig
hb
orh
oo
d S
ervi
ces:
B
ron
x C
om
mu
nit
y B
oar
d #
1
5853 7570 8364 7968 8683 8975
1.H
ousi
ng
2.C
rime
3.Jo
bs
1.F
ire p
rote
ctio
n se
rvic
es
2.E
mer
genc
y m
edic
al
serv
ices
3.P
ublic
libr
arie
s
4.C
ondi
tion
of s
tree
t tre
es
5.P
arki
ng e
nfor
cem
ent
1.R
at c
ontr
ol
2.C
ontr
ol o
f str
eet n
oise
3.C
lean
lines
s of
you
r ne
ighb
orho
od
4.A
vaila
bilit
y of
cul
tura
l ac
tiviti
es
5.C
rime
cont
rol

City
wid
e C
usto
mer
Sur
vey
Res
ults
15%
44%
34%
19%
29%
36%
46%
12%
22%
32%
7%2%
0%25
%50
%75
%10
0%
All N
ew Y
ork
City
Res
pond
ents
All B
ronx
Res
pond
ents
All C
omm
unity
Boa
rd #
2 R
espo
nden
ts
Bac
kgro
un
d:
Bro
nx
Co
mm
un
ity
Bo
ard
#2
Su
rvey
Res
po
nse
s: B
ron
x C
om
mu
nit
y B
oar
d #
2
Th
e N
eig
hb
orh
oo
ds
of
the
Bro
nx
Co
mm
un
ity
Bo
ard
#2
Sour
ce: N
YC P
lann
ing
Dep
artm
ent
Rac
e/E
thn
icit
y•
Non
-His
pani
c W
hite
: 1%
•N
on-H
ispa
nic
Bla
ck: 2
1%•
Non
-His
pani
c A
sian
: 0%
•H
ispa
nic:
76%
•O
ther
: 1%
Po
pu
lati
on
an
d H
ou
seh
old
s•
Tot
al P
opul
atio
n: 4
6,82
4•
Tot
al H
ouse
hold
s: 1
4,44
6
Med
ian
An
nu
al H
ou
seh
old
Inco
me
•$1
9,60
7
Res
ult
sfr
om
NY
C F
eed
bac
k C
ityw
ide
Cu
sto
mer
Su
rvey
Bro
nx
Co
mm
un
ity
Bo
ard
#2
Rat
ing
s o
f N
eig
hb
orh
oo
d a
s a
Pla
ce t
o L
ive
Rat
ing
s o
f O
vera
ll Q
ual
ity
of
Lif
e in
New
Yo
rk C
ity
Exce
llent
Poor
Fair
Goo
d
Exce
llent
Poor
Fair
Goo
d
Exce
llent
Poor
Fair
Goo
d
Rat
ing
s o
f O
vera
ll Q
ual
ity
of
New
Yo
rk C
ity
Go
vern
men
t S
ervi
ces
45%
37%
28%
37%
42%
47%
12%
16%
18%
7% 4% 6%
0%25
%50
%75
%10
0%
All N
ew Y
ork
City
Res
pond
ents
All B
ronx
Res
pond
ents
All C
omm
unity
Boa
rd #
2 R
espo
nden
ts
38%
32%
28%
44%
44%
41%
15%
19%
23%
8%
5% 4%
0%25
%50
%75
%10
0%
All N
ew Y
ork
City
Res
pond
ents
All B
ronx
Res
pond
ents
All C
omm
unity
Boa
rd #
2 R
espo
nden
ts
Gen
der
•M
ale:
47%
•F
emal
e: 5
3%A
ge •<
18 y
ears
old
: 35%
•20
-64
year
s ol
d: 5
8%•
65+
yea
rs o
ld: 7
%
•39
3 R
espo
nses
•9.
8% R
espo
nse
Rat
e•
±4.9
% M
argi
n of
Err
or (
95%
Con
fiden
ce In
terv
al)
Sou
rce:
U.S
. Cen
sus
Bur
eau
-20
00 C
ensu
s, P
opul
atio
n D
ivis
ion
-N
ew Y
ork
City
Dep
artm
ent o
f City
Pla
nnin
g
See
deta
il be
low

City
wid
e C
usto
mer
Sur
vey
Res
ults
12%
26%
45%
18%
24%
32%
33%
11%
Nei
gh
bo
rho
od
P
ub
lic S
afet
y In
dex
14%
34%
42%
10%
15%
36%
38%
11%
Mas
s T
ran
sit
Ser
vice
s In
dex
21%
34%
36%
9%
29%
37%
29%
6%S
tree
ts a
nd
S
idew
alks
In
dex
17%
29%
41%
13%
29%
34%
29%
8%C
lean
ing
an
d
Mai
nte
nan
ce
Ind
ex
25%
39%
30%
6%
27%
33%
33%
7%P
ub
licE
du
cati
on
In
dex
42%
35%
19%
4%
44%
30%
21%
4%S
oci
al S
up
po
rt
Ser
vice
s In
dex
Ind
ex
Sco
reP
oo
rF
air
Go
od
Exc
elle
nt
Sur
vey
resp
onde
nts
wer
e as
ked
to n
ame
wha
t the
y th
ough
t w
ere
the
thre
e m
ost i
mpo
rtan
t iss
ues
faci
ng N
ew Y
ork
City
. T
he th
ree
resp
onse
s m
ost c
omm
only
giv
en b
y B
ronx
C
omm
unity
Boa
rd #
2 re
spon
dent
s ar
e lis
ted
belo
w.
Hig
hest
Rat
edLo
wes
t Rat
ed
Sur
vey
resp
onde
nts
rate
d 24
ser
vice
s in
thei
r ne
ighb
orho
od.
The
hig
hest
and
low
est r
ated
ser
vice
s ar
e di
spla
yed
belo
w.
NYC
All
Com
mun
ity B
oard
#2
Res
pond
ents
All
New
Yor
k C
ity R
espo
nden
ts
Ind
ex R
atin
gs:
Bro
nx
Co
mm
un
ity
Bo
ard
#2
Co
mp
ared
to
Rat
ing
s G
iven
by
All
Res
po
nd
ents
Mo
st Im
po
rtan
t Is
sues
Fac
ing
New
Yo
rk
Cit
y: B
ron
x C
om
mu
nit
y B
oar
d #
2
Rat
ing
s o
f N
eig
hb
orh
oo
d S
ervi
ces:
B
ron
x C
om
mu
nit
y B
oar
d #
2
5856 7573 8371 7971 8685 8976
1.H
ousi
ng
2.E
duca
tion
3.C
rime
1.F
ire p
rote
ctio
n se
rvic
es
2.E
mer
genc
y m
edic
al
serv
ices
3.P
ublic
libr
arie
s
4.C
ondi
tion
of s
tree
t tre
es
5.H
ouse
hold
gar
bage
pick
-up
1.R
at c
ontr
ol
2.C
ontr
ol o
f str
eet n
oise
3.C
rime
cont
rol
4.A
vaila
bilit
y of
cul
tura
l ac
tiviti
es
5.C
lean
lines
s of
you
r ne
ighb
orho
od

City
wid
e C
usto
mer
Sur
vey
Res
ults
15%
44%
34%
17%
29%
36%
37%
12%
22%
43%
7%3%
0%25
%50
%75
%10
0%
All N
ew Y
ork
City
Res
pond
ents
All B
ronx
Res
pond
ents
All C
omm
unity
Boa
rd #
3 R
espo
nden
ts
Bac
kgro
un
d:
Bro
nx
Co
mm
un
ity
Bo
ard
#3
Su
rvey
Res
po
nse
s: B
ron
x C
om
mu
nit
y B
oar
d #
3
Th
e N
eig
hb
orh
oo
ds
of
the
Bro
nx
Co
mm
un
ity
Bo
ard
#3
Sour
ce: N
YC P
lann
ing
Dep
artm
ent
Rac
e/E
thn
icit
y•
Non
-His
pani
c W
hite
: 1%
•N
on-H
ispa
nic
Bla
ck: 4
4%•
Non
-His
pani
c A
sian
: 0%
•H
ispa
nic:
53%
•O
ther
: 2%
Po
pu
lati
on
an
d H
ou
seh
old
s•
Tot
al P
opul
atio
n: 6
8,57
4•
Tot
al H
ouse
hold
s: 2
2,41
1
Med
ian
An
nu
al H
ou
seh
old
Inco
me
•$1
8,73
4
Res
ult
sfr
om
NY
C F
eed
bac
k C
ityw
ide
Cu
sto
mer
Su
rvey
Bro
nx
Co
mm
un
ity
Bo
ard
#3
Rat
ing
s o
f N
eig
hb
orh
oo
d a
s a
Pla
ce t
o L
ive
Rat
ing
s o
f O
vera
ll Q
ual
ity
of
Lif
e in
New
Yo
rk C
ity
Exce
llent
Poor
Fair
Goo
d
Exce
llent
Poor
Fair
Goo
d
Exce
llent
Poor
Fair
Goo
d
Rat
ing
s o
f O
vera
ll Q
ual
ity
of
New
Yo
rk C
ity
Go
vern
men
t S
ervi
ces
45%
37%
23%
37%
42%
49%
12%
16%
22%
4%6% 6%
0%25
%50
%75
%10
0%
All N
ew Y
ork
City
Res
pond
ents
All B
ronx
Res
pond
ents
All C
omm
unity
Boa
rd #
3 R
espo
nden
ts
38%
32%
24%
44%
44%
46%
15%
19%
25%
5%5% 4%
0%25
%50
%75
%10
0%
All N
ew Y
ork
City
Res
pond
ents
All B
ronx
Res
pond
ents
All C
omm
unity
Boa
rd #
3 R
espo
nden
ts
Gen
der
•M
ale:
45%
•F
emal
e: 5
5%A
ge •<
18 y
ears
old
: 37%
•20
-64
year
s ol
d: 5
7%•
65+
yea
rs o
ld: 7
%
•40
2 R
espo
nses
•11
.7%
Res
pons
e R
ate
•±4
.9%
Mar
gin
of E
rror
(95
% C
onfid
ence
Inte
rval
)
Sou
rce:
U.S
. Cen
sus
Bur
eau
-20
00 C
ensu
s, P
opul
atio
n D
ivis
ion
-N
ew Y
ork
City
Dep
artm
ent o
f City
Pla
nnin
g
See
deta
il be
low

City
wid
e C
usto
mer
Sur
vey
Res
ults
12%
26%
45%
18%
26%
33%
31%
10%
Nei
gh
bo
rho
od
P
ub
lic S
afet
y In
dex
14%
34%
42%
10%
17%
41%
33%
9%M
ass
Tra
nsi
t S
ervi
ces
Ind
ex
21%
34%
36%
9%
32%
39%
23%
6%S
tree
ts a
nd
S
idew
alks
In
dex
17%
29%
41%
13%
31%
39%
24%
6%C
lean
ing
an
d
Mai
nte
nan
ce
Ind
ex
25%
39%
30%
6%
30%
37%
26%
7%P
ub
licE
du
cati
on
In
dex
42%
35%
19%
4%
45%
33%
17%
5%S
oci
al S
up
po
rt
Ser
vice
s In
dex
Ind
ex
Sco
reP
oo
rF
air
Go
od
Exc
elle
nt
Sur
vey
resp
onde
nts
wer
e as
ked
to n
ame
wha
t the
y th
ough
t w
ere
the
thre
e m
ost i
mpo
rtan
t iss
ues
faci
ng N
ew Y
ork
City
. T
he th
ree
resp
onse
s m
ost c
omm
only
giv
en b
y B
ronx
C
omm
unity
Boa
rd #
3 re
spon
dent
s ar
e lis
ted
belo
w.
Hig
hest
Rat
edLo
wes
t Rat
ed
Sur
vey
resp
onde
nts
rate
d 24
ser
vice
s in
thei
r ne
ighb
orho
od.
The
hig
hest
and
low
est r
ated
ser
vice
s ar
e di
spla
yed
belo
w.
NYC
All
Com
mun
ity B
oard
#3
Res
pond
ents
All
New
Yor
k C
ity R
espo
nden
ts
Ind
ex R
atin
gs:
Bro
nx
Co
mm
un
ity
Bo
ard
#3
Co
mp
ared
to
Rat
ing
s G
iven
by
All
Res
po
nd
ents
Mo
st Im
po
rtan
t Is
sues
Fac
ing
New
Yo
rk
Cit
y: B
ron
x C
om
mu
nit
y B
oar
d #
3
Rat
ing
s o
f N
eig
hb
orh
oo
d S
ervi
ces:
B
ron
x C
om
mu
nit
y B
oar
d #
3
5855 7577 8369 7968 8683 8974
1.H
ousi
ng
2.C
rime
3.Jo
bs
1.F
ire p
rote
ctio
n se
rvic
es
2.E
mer
genc
y m
edic
al
serv
ices
3.H
ouse
hold
gar
bage
pick
-up
4.B
us s
ervi
ces
5.C
ondi
tion
of s
tree
t tre
es
1.R
at c
ontr
ol
2.C
ontr
ol o
f str
eet n
oise
3.A
vaila
bilit
y of
cul
tura
l ac
tiviti
es
4.C
rime
cont
rol
5.P
olic
e-C
omm
unity
re
latio
ns

City
wid
e C
usto
mer
Sur
vey
Res
ults
15%
44%
34%
37%
29%
36%
29%
12%
22%
30%
7%5%
0%25
%50
%75
%10
0%
All N
ew Y
ork
City
Res
pond
ents
All B
ronx
Res
pond
ents
All C
omm
unity
Boa
rd #
4 R
espo
nden
ts
Bac
kgro
un
d:
Bro
nx
Co
mm
un
ity
Bo
ard
#4
Su
rvey
Res
po
nse
s: B
ron
x C
om
mu
nit
y B
oar
d #
4
Th
e N
eig
hb
orh
oo
ds
of
Bro
nx
Co
mm
un
ity
Bo
ard
#4
Sour
ce: N
YC P
lann
ing
Dep
artm
ent
Res
ult
sfr
om
NY
C F
eed
bac
k C
ityw
ide
Cu
sto
mer
Su
rvey
Bro
nx
Co
mm
un
ity
Bo
ard
#4
Rat
ing
s o
f N
eig
hb
orh
oo
d a
s a
Pla
ce t
o L
ive
Rat
ing
s o
f O
vera
ll Q
ual
ity
of
Lif
e in
New
Yo
rk C
ity
Exce
llent
Poor
Fair
Goo
d
Exce
llent
Poor
Fair
Goo
d
Exce
llent
Poor
Fair
Goo
d
Rat
ing
s o
f O
vera
ll Q
ual
ity
of
New
Yo
rk C
ity
Go
vern
men
t S
ervi
ces
45%
37%45
%
37%
42%34
%
12%
16%
15%
4%6% 6%
0%25
%50
%75
%10
0%
All N
ew Y
ork
City
Res
pond
ents
All B
ronx
Res
pond
ents
All C
omm
unity
Boa
rd #
4 R
espo
nden
ts
38%
32%39
%
44%
44%39
%
15%
19%
17%
5%6% 4%
0%25
%50
%75
%10
0%
All N
ew Y
ork
City
Res
pond
ents
All B
ronx
Res
pond
ents
All C
omm
unity
Boa
rd #
4 R
espo
nden
ts
Gen
der
•M
ale:
47%
•F
emal
e: 5
3%A
ge •<
18 y
ears
old
: 32%
•18
-54
year
s ol
d: 5
3%•
55+
yea
rs o
ld: 1
5%
Rac
e/E
thn
icit
y•
Non
-His
pani
c W
hite
: 1%
•N
on-H
ispa
nic
Bla
ck: 3
4%•
Non
-His
pani
c A
sian
: 2%
•H
ispa
nic:
61%
•O
ther
: 2%
Po
pu
lati
on
an
d H
ou
seh
old
s•
Tot
al P
opul
atio
n: 1
32,8
38•
Tot
al H
ouse
hold
s: 4
6,03
6
Med
ian
An
nu
al H
ou
seh
old
Inco
me
•$2
4,33
4(2
006
Infla
tion-
Adj
uste
d D
olla
rs)
•35
6 R
espo
nses
•9.
3% R
espo
nse
Rat
e•
±5.2
% M
argi
n of
Err
or (
95%
Con
fiden
ce In
terv
al)
See
deta
il be
low
Sou
rce:
U.S
. Cen
sus
Bur
eau
-20
06 A
mer
ican
Com
mun
ity S
urve
y, P
opul
atio
n D
ivis
ion
-N
ew Y
ork
City
Dep
artm
ent o
f City
Pla
nnin
g

City
wid
e C
usto
mer
Sur
vey
Res
ults
12%
26%
45%
18%
18%
29%
40%
13%
Nei
gh
bo
rho
od
P
ub
lic S
afet
y In
dex
14%
34%
42%
10%
13%
34%
43%
10%
Mas
s T
ran
sit
Ser
vice
s In
dex
21%
34%
36%
9%
30%
33%
31%
6%S
tree
ts a
nd
S
idew
alks
In
dex
17%
29%
41%
13%
28%
33%
33%
6%C
lean
ing
an
d
Mai
nte
nan
ce
Ind
ex
25%
39%
30%
6%
24%
34%
37%
5%P
ub
licE
du
cati
on
In
dex
42%
35%
19%
4%
41%
30%
25%
4%S
oci
al S
up
po
rt
Ser
vice
s In
dex
Ind
ex
Sco
reP
oo
rF
air
Go
od
Exc
elle
nt
Sur
vey
resp
onde
nts
wer
e as
ked
to n
ame
wha
t the
y th
ough
t w
ere
the
thre
e m
ost i
mpo
rtan
t iss
ues
faci
ng N
ew Y
ork
City
. T
he th
ree
resp
onse
s m
ost c
omm
only
giv
en b
y B
ronx
C
omm
unity
Boa
rd #
4 re
spon
dent
s ar
e lis
ted
belo
w.
Hig
hest
Rat
edLo
wes
t Rat
ed
Sur
vey
resp
onde
nts
rate
d 24
ser
vice
s in
thei
r ne
ighb
orho
od.
The
hig
hest
and
low
est r
ated
ser
vice
s ar
e di
spla
yed
belo
w.
NYC
All
Com
mun
ity B
oard
#4
Res
pond
ents
All
New
Yor
k C
ity R
espo
nden
ts
Ind
ex R
atin
gs:
Bro
nx
Co
mm
un
ity
Bo
ard
#4
Co
mp
ared
to
Rat
ing
s G
iven
by
All
Res
po
nd
ents
Mo
st Im
po
rtan
t Is
sues
Fac
ing
New
Yo
rk
Cit
y: B
ron
x C
om
mu
nit
y B
oar
d #
4
Rat
ing
s o
f N
eig
hb
orh
oo
d S
ervi
ces:
B
ron
x C
om
mu
nit
y B
oar
d #
4
5859 7576 8372 7970 8687 8982
1.H
ousi
ng
2.M
ass
Tra
nsit
3.E
duca
tion
1.F
ire p
rote
ctio
n se
rvic
es
2.E
mer
genc
y m
edic
al
serv
ices
3.C
ondi
tion
of s
tree
t tre
es
4.S
ubw
ay s
ervi
ces
5.N
eigh
borh
ood
park
s
1.C
ontr
ol o
f str
eet n
oise
2.R
at c
ontr
ol
3.A
vaila
bilit
y of
cul
tura
l ac
tiviti
es
4.G
raffi
ti co
ntro
l
5.C
lean
lines
s of
you
r ne
ighb
orho
od

City
wid
e C
usto
mer
Sur
vey
Res
ults
15%
44%
34%
20%
29%
36%
36%
12%
22%
42%
7%
1%
0%25
%50
%75
%10
0%
All N
ew Y
ork
City
Res
pond
ents
All B
ronx
Res
pond
ents
All C
omm
unity
Boa
rd #
5 R
espo
nden
ts
Bac
kgro
un
d:
Bro
nx
Co
mm
un
ity
Bo
ard
#5
Su
rvey
Res
po
nse
s: B
ron
x C
om
mu
nit
y B
oar
d #
5
Th
e N
eig
hb
orh
oo
ds
of
Bro
nx
Co
mm
un
ity
Bo
ard
#5
Sour
ce: N
YC P
lann
ing
Dep
artm
ent
Res
ult
sfr
om
NY
C F
eed
bac
k C
ityw
ide
Cu
sto
mer
Su
rvey
Bro
nx
Co
mm
un
ity
Bo
ard
#5
Rat
ing
s o
f N
eig
hb
orh
oo
d a
s a
Pla
ce t
o L
ive
Rat
ing
s o
f O
vera
ll Q
ual
ity
of
Lif
e in
New
Yo
rk C
ity
Exce
llent
Poor
Fair
Goo
d
Exce
llent
Poor
Fair
Goo
d
Exce
llent
Poor
Fair
Goo
d
Rat
ing
s o
f O
vera
ll Q
ual
ity
of
New
Yo
rk C
ity
Go
vern
men
t S
ervi
ces
45%
37%
31%
37%
42%
47%
12%
16%
19%
4%4% 6%
0%25
%50
%75
%10
0%
All N
ew Y
ork
City
Res
pond
ents
All B
ronx
Res
pond
ents
All C
omm
unity
Boa
rd #
5 R
espo
nden
ts
38%
32%
31%
44%
44%
43%
15%
19%
21%
5%4% 4%
0%25
%50
%75
%10
0%
All N
ew Y
ork
City
Res
pond
ents
All B
ronx
Res
pond
ents
All C
omm
unity
Boa
rd #
5 R
espo
nden
ts
Gen
der
•M
ale:
48%
•F
emal
e: 5
2%A
ge •<
18 y
ears
old
: 34%
•18
-54
year
s ol
d: 5
5%•
55+
yea
rs o
ld: 1
2%
Rac
e/E
thn
icit
y•
Non
-His
pani
c W
hite
: 1%
•N
on-H
ispa
nic
Bla
ck: 2
9%•
Non
-His
pani
c A
sian
: 2%
•H
ispa
nic:
67%
•O
ther
: 2%
Po
pu
lati
on
an
d H
ou
seh
old
s•
Tot
al P
opul
atio
n: 1
33,8
58•
Tot
al H
ouse
hold
s: 4
2,59
2
Med
ian
An
nu
al H
ou
seh
old
Inco
me
•$2
0,36
7(2
006
Infla
tion-
Adj
uste
d D
olla
rs)
•38
0 R
espo
nses
•10
.4%
Res
pons
e R
ate
•±5
.0%
Mar
gin
of E
rror
(95
% C
onfid
ence
Inte
rval
)
See
deta
il be
low
Sou
rce:
U.S
. Cen
sus
Bur
eau
-20
06 A
mer
ican
Com
mun
ity S
urve
y, P
opul
atio
n D
ivis
ion
-N
ew Y
ork
City
Dep
artm
ent o
f City
Pla
nnin
g

City
wid
e C
usto
mer
Sur
vey
Res
ults
12%
26%
45%
18%
24%
33%
34%
9%N
eig
hb
orh
oo
d
Pu
blic
Saf
ety
Ind
ex
14%
34%
42%
10%
18%
35%
38%
10%
Mas
s T
ran
sit
Ser
vice
s In
dex
21%
34%
36%
9%
30%
41%
24%
5%S
tree
ts a
nd
S
idew
alks
In
dex
17%
29%
41%
13%
30%
37%
28%
5%C
lean
ing
an
d
Mai
nte
nan
ce
Ind
ex
25%
39%
30%
6%
27%
37%
30%
5%P
ub
licE
du
cati
on
In
dex
42%
35%
19%
4%
46%
32%
18%
4%S
oci
al S
up
po
rt
Ser
vice
s In
dex
Ind
ex
Sco
reP
oo
rF
air
Go
od
Exc
elle
nt
Sur
vey
resp
onde
nts
wer
e as
ked
to n
ame
wha
t the
y th
ough
t w
ere
the
thre
e m
ost i
mpo
rtan
t iss
ues
faci
ng N
ew Y
ork
City
. T
he th
ree
resp
onse
s m
ost c
omm
only
giv
en b
y B
ronx
C
omm
unity
Boa
rd #
5 re
spon
dent
s ar
e lis
ted
belo
w.
Hig
hest
Rat
edLo
wes
t Rat
ed
Sur
vey
resp
onde
nts
rate
d 24
ser
vice
s in
thei
r ne
ighb
orho
od.
The
hig
hest
and
low
est r
ated
ser
vice
s ar
e di
spla
yed
belo
w.
NYC
All
Com
mun
ity B
oard
#5
Res
pond
ents
All
New
Yor
k C
ity R
espo
nden
ts
Ind
ex R
atin
gs:
Bro
nx
Co
mm
un
ity
Bo
ard
#5
Co
mp
ared
to
Rat
ing
s G
iven
by
All
Res
po
nd
ents
Mo
st Im
po
rtan
t Is
sues
Fac
ing
New
Yo
rk
Cit
y: B
ron
x C
om
mu
nit
y B
oar
d #
5
Rat
ing
s o
f N
eig
hb
orh
oo
d S
ervi
ces:
B
ron
x C
om
mu
nit
y B
oar
d #
5
5854 7573 8370 7970 8682 8976
1.H
ousi
ng
2.C
rime
3.Jo
bs
1.F
ire p
rote
ctio
n se
rvic
es
2.E
mer
genc
y m
edic
al
serv
ices
3.P
ublic
libr
arie
s
4.H
ouse
hold
gar
bage
pic
k-up
5.B
us s
ervi
ces
1.R
at c
ontr
ol
2.A
vaila
bilit
y of
cul
tura
l ac
tiviti
es
3.C
ontr
ol o
f str
eet n
oise
4.C
lean
lines
s of
you
r ne
ighb
orho
od
5.C
rime
cont
rol

City
wid
e C
usto
mer
Sur
vey
Res
ults
15%
44%
34%
16%
29%
36%
43%
12%
22%
39%
7%2%
0%25
%50
%75
%10
0%
All N
ew Y
ork
City
Res
pond
ents
All B
ronx
Res
pond
ents
All C
omm
unity
Boa
rd #
6 R
espo
nden
ts
Bac
kgro
un
d:
Bro
nx
Co
mm
un
ity
Bo
ard
#6
Su
rvey
Res
po
nse
s: B
ron
x C
om
mu
nit
y B
oar
d #
6
Th
e N
eig
hb
orh
oo
ds
of
the
Bro
nx
Co
mm
un
ity
Bo
ard
#6
Sour
ce: N
YC P
lann
ing
Dep
artm
ent
Rac
e/E
thn
icit
y•
Non
-His
pani
c W
hite
: 9%
•N
on-H
ispa
nic
Bla
ck: 2
6%•
Non
-His
pani
c A
sian
: 1%
•H
ispa
nic:
61%
•O
ther
: 2%
Po
pu
lati
on
an
d H
ou
seh
old
s•
Tot
al P
opul
atio
n: 7
5,68
8•
Tot
al H
ouse
hold
s: 2
4,61
8
Med
ian
An
nu
al H
ou
seh
old
Inco
me
•$1
9,30
0
Res
ult
sfr
om
NY
C F
eed
bac
k C
ityw
ide
Cu
sto
mer
Su
rvey
Bro
nx
Co
mm
un
ity
Bo
ard
#6
Rat
ing
s o
f N
eig
hb
orh
oo
d a
s a
Pla
ce t
o L
ive
Rat
ing
s o
f O
vera
ll Q
ual
ity
of
Lif
e in
New
Yo
rk C
ity
Exce
llent
Poor
Fair
Goo
d
Exce
llent
Poor
Fair
Goo
d
Exce
llent
Poor
Fair
Goo
d
Rat
ing
s o
f O
vera
ll Q
ual
ity
of
New
Yo
rk C
ity
Go
vern
men
t S
ervi
ces
45%
37%
33%
37%
42%
41%
12%
16%
23%
4%3% 6%
0%25
%50
%75
%10
0%
All N
ew Y
ork
City
Res
pond
ents
All B
ronx
Res
pond
ents
All C
omm
unity
Boa
rd #
6 R
espo
nden
ts
38%
32%
31%
44%
44%
45%
15%
19%
21%
5%2% 4%
0%25
%50
%75
%10
0%
All N
ew Y
ork
City
Res
pond
ents
All B
ronx
Res
pond
ents
All C
omm
unity
Boa
rd #
6 R
espo
nden
ts
Gen
der
•M
ale:
46%
•F
emal
e: 5
4%A
ge •<
18 y
ears
old
: 34%
•20
-64
year
s ol
d: 5
8%•
65+
yea
rs o
ld: 8
%
•36
8 R
espo
nses
•8.
8% R
espo
nse
Rat
e•
±5.1
% M
argi
n of
Err
or (
95%
Con
fiden
ce In
terv
al)
Sou
rce:
U.S
. Cen
sus
Bur
eau
-20
00 C
ensu
s, P
opul
atio
n D
ivis
ion
-N
ew Y
ork
City
Dep
artm
ent o
f City
Pla
nnin
g
See
deta
il be
low

City
wid
e C
usto
mer
Sur
vey
Res
ults
12%
26%
45%
18%
23%
33%
31%
13%
Nei
gh
bo
rho
od
P
ub
lic S
afet
y In
dex
14%
34%
42%
10%
16%
38%
36%
10%
Mas
s T
ran
sit
Ser
vice
s In
dex
21%
34%
36%
9%
29%
36%
29%
7%S
tree
ts a
nd
S
idew
alks
In
dex
17%
29%
41%
13%
30%
32%
28%
9%C
lean
ing
an
d
Mai
nte
nan
ce
Ind
ex
25%
39%
30%
6%
29%
32%
32%
7%P
ub
licE
du
cati
on
In
dex
42%
35%
19%
4%
48%
30%
18%
5%S
oci
al S
up
po
rt
Ser
vice
s In
dex
Ind
ex
Sco
reP
oo
rF
air
Go
od
Exc
elle
nt
Sur
vey
resp
onde
nts
wer
e as
ked
to n
ame
wha
t the
y th
ough
t w
ere
the
thre
e m
ost i
mpo
rtan
t iss
ues
faci
ng N
ew Y
ork
City
. T
he th
ree
resp
onse
s m
ost c
omm
only
giv
en b
y B
ronx
C
omm
unity
Boa
rd #
6 re
spon
dent
s ar
e lis
ted
belo
w.
Hig
hest
Rat
edLo
wes
t Rat
ed
Sur
vey
resp
onde
nts
rate
d 24
ser
vice
s in
thei
r ne
ighb
orho
od.
The
hig
hest
and
low
est r
ated
ser
vice
s ar
e di
spla
yed
belo
w.
NYC
All
Com
mun
ity B
oard
#6
Res
pond
ents
All
New
Yor
k C
ity R
espo
nden
ts
Ind
ex R
atin
gs:
Bro
nx
Co
mm
un
ity
Bo
ard
#6
Co
mp
ared
to
Rat
ing
s G
iven
by
All
Res
po
nd
ents
Mo
st Im
po
rtan
t Is
sues
Fac
ing
New
Yo
rk
Cit
y: B
ron
x C
om
mu
nit
y B
oar
d #
6
Rat
ing
s o
f N
eig
hb
orh
oo
d S
ervi
ces:
B
ron
x C
om
mu
nit
y B
oar
d #
6
5852 7571 8370 7971 8684 8977
1.H
ousi
ng
2.Jo
bs
3.C
rime
1.F
ire p
rote
ctio
n se
rvic
es
2.E
mer
genc
y m
edic
al
serv
ices
3.P
ublic
libr
arie
s
4.B
us s
ervi
ces
5.H
ouse
hold
gar
bage
pick
-up
1.R
at c
ontr
ol
2.C
ontr
ol o
f str
eet n
oise
3.A
vaila
bilit
y of
cul
tura
l ac
tiviti
es
4.P
olic
e-C
omm
unity
re
latio
ns
5.C
rime
cont
rol

City
wid
e C
usto
mer
Sur
vey
Res
ults
15%
44%
34%
23%
29%
36%
51%
12%
22%
24%
7%
2%
0%25
%50
%75
%10
0%
All N
ew Y
ork
City
Res
pond
ents
All B
ronx
Res
pond
ents
All C
omm
unity
Boa
rd #
7 R
espo
nden
ts
Bac
kgro
un
d:
Bro
nx
Co
mm
un
ity
Bo
ard
#7
Su
rvey
Res
po
nse
s: B
ron
x C
om
mu
nit
y B
oar
d #
7
Th
e N
eig
hb
orh
oo
ds
of
Bro
nx
Co
mm
un
ity
Bo
ard
#7
Sour
ce: N
YC P
lann
ing
Dep
artm
ent
Res
ult
sfr
om
NY
C F
eed
bac
k C
ityw
ide
Cu
sto
mer
Su
rvey
Bro
nx
Co
mm
un
ity
Bo
ard
#7
Rat
ing
s o
f N
eig
hb
orh
oo
d a
s a
Pla
ce t
o L
ive
Rat
ing
s o
f O
vera
ll Q
ual
ity
of
Lif
e in
New
Yo
rk C
ity
Exce
llent
Poor
Fair
Goo
d
Exce
llent
Poor
Fair
Goo
d
Exce
llent
Poor
Fair
Goo
d
Rat
ing
s o
f O
vera
ll Q
ual
ity
of
New
Yo
rk C
ity
Go
vern
men
t S
ervi
ces
45%
37%
35%
37%
42%
44%
12%
16%
18%
4%3% 6%
0%25
%50
%75
%10
0%
All N
ew Y
ork
City
Res
pond
ents
All B
ronx
Res
pond
ents
All C
omm
unity
Boa
rd #
7 R
espo
nden
ts
38%
32%
28%
44%
44%
48%
15%
19%
19%
5%5% 4%
0%25
%50
%75
%10
0%
All N
ew Y
ork
City
Res
pond
ents
All B
ronx
Res
pond
ents
All C
omm
unity
Boa
rd #
7 R
espo
nden
ts
Gen
der
•M
ale:
48%
•F
emal
e: 5
2%A
ge •<
18 y
ears
old
: 29%
•18
-54
year
s ol
d: 5
4%•
55+
yea
rs o
ld: 1
7%
Rac
e/E
thn
icit
y•
Non
-His
pani
c W
hite
: 7%
•N
on-H
ispa
nic
Bla
ck: 2
0%•
Non
-His
pani
c A
sian
: 6%
•H
ispa
nic:
62%
•O
ther
: 4%
Po
pu
lati
on
an
d H
ou
seh
old
s•
Tot
al P
opul
atio
n: 1
24,9
68•
Tot
al H
ouse
hold
s: 4
5,22
5
Med
ian
An
nu
al H
ou
seh
old
Inco
me
•$2
8,26
7(2
006
Infla
tion-
Adj
uste
d D
olla
rs)
•39
7 R
espo
nses
•12
.3%
Res
pons
e R
ate
•±4
.9%
Mar
gin
of E
rror
(95
% C
onfid
ence
Inte
rval
)
See
deta
il be
low
Sou
rce:
U.S
. Cen
sus
Bur
eau
-20
06 A
mer
ican
Com
mun
ity S
urve
y, P
opul
atio
n D
ivis
ion
-N
ew Y
ork
City
Dep
artm
ent o
f City
Pla
nnin
g

City
wid
e C
usto
mer
Sur
vey
Res
ults
12%
26%
45%
18%
17%
31%
38%
13%
Nei
gh
bo
rho
od
P
ub
lic S
afet
y In
dex
14%
34%
42%
10%
13%
35%
42%
10%
Mas
s T
ran
sit
Ser
vice
s In
dex
21%
34%
36%
9%
28%
39%
28%
5%S
tree
ts a
nd
S
idew
alks
In
dex
17%
29%
41%
13%
25%
36%
33%
6%C
lean
ing
an
d
Mai
nte
nan
ce
Ind
ex
25%
39%
30%
6%
24%
43%
28%
4%P
ub
licE
du
cati
on
In
dex
42%
35%
19%
4%
44%
33%
19%
4%S
oci
al S
up
po
rt
Ser
vice
s In
dex
Ind
ex
Sco
reP
oo
rF
air
Go
od
Exc
elle
nt
Sur
vey
resp
onde
nts
wer
e as
ked
to n
ame
wha
t the
y th
ough
t w
ere
the
thre
e m
ost i
mpo
rtan
t iss
ues
faci
ng N
ew Y
ork
City
. T
he th
ree
resp
onse
s m
ost c
omm
only
giv
en b
y B
ronx
C
omm
unity
Boa
rd #
7 re
spon
dent
s ar
e lis
ted
belo
w.
Hig
hest
Rat
edLo
wes
t Rat
ed
Sur
vey
resp
onde
nts
rate
d 24
ser
vice
s in
thei
r ne
ighb
orho
od.
The
hig
hest
and
low
est r
ated
ser
vice
s ar
e di
spla
yed
belo
w.
NYC
All
Com
mun
ity B
oard
#7
Res
pond
ents
All
New
Yor
k C
ity R
espo
nden
ts
Ind
ex R
atin
gs:
Bro
nx
Co
mm
un
ity
Bo
ard
#7
Co
mp
ared
to
Rat
ing
s G
iven
by
All
Res
po
nd
ents
Mo
st Im
po
rtan
t Is
sues
Fac
ing
New
Yo
rk
Cit
y: B
ron
x C
om
mu
nit
y B
oar
d #
7
Rat
ing
s o
f N
eig
hb
orh
oo
d S
ervi
ces:
B
ron
x C
om
mu
nit
y B
oar
d #
7
5856 7576 8375 7972 8687 8983
1.H
ousi
ng
2.E
duca
tion
3.C
rime
1.F
ire p
rote
ctio
n se
rvic
es
2.E
mer
genc
y m
edic
al
serv
ices
3.P
ublic
libr
arie
s
4.H
ouse
hold
gar
bage
pic
k-up
5.S
ubw
ay s
ervi
ces
1.R
at c
ontr
ol
2.C
ontr
ol o
f str
eet n
oise
3.A
vaila
bilit
y of
cul
tura
l ac
tiviti
es
4.G
raffi
ti co
ntro
l
5.R
emov
al o
f sno
w fr
om
city
str
eets

City
wid
e C
usto
mer
Sur
vey
Res
ults
15%26
%
44%
34%
47%
29%
36%
20%
12%
22%
7%
7%
0%25
%50
%75
%10
0%
All N
ew Y
ork
City
Res
pond
ents
All B
ronx
Res
pond
ents
All C
omm
unity
Boa
rd #
8 R
espo
nden
ts
Bac
kgro
un
d:
Bro
nx
Co
mm
un
ity
Bo
ard
#8
Su
rvey
Res
po
nse
s: B
ron
x C
om
mu
nit
y B
oar
d #
8
Th
e N
eig
hb
orh
oo
ds
of
Bro
nx
Co
mm
un
ity
Bo
ard
#8
Sour
ce: N
YC P
lann
ing
Dep
artm
ent
Res
ult
sfr
om
NY
C F
eed
bac
k C
ityw
ide
Cu
sto
mer
Su
rvey
Bro
nx
Co
mm
un
ity
Bo
ard
#8
Rat
ing
s o
f N
eig
hb
orh
oo
d a
s a
Pla
ce t
o L
ive
Rat
ing
s o
f O
vera
ll Q
ual
ity
of
Lif
e in
New
Yo
rk C
ity
Exce
llent
Poor
Fair
Goo
d
Exce
llent
Poor
Fair
Goo
d
Exce
llent
Poor
Fair
Goo
d
Rat
ing
s o
f O
vera
ll Q
ual
ity
of
New
Yo
rk C
ity
Go
vern
men
t S
ervi
ces
45%
37%
54%
37%
42%
31%
12%
16%
7% 4% 6%
9%
0%25
%50
%75
%10
0%
All N
ew Y
ork
City
Res
pond
ents
All B
ronx
Res
pond
ents
All C
omm
unity
Boa
rd #
8 R
espo
nden
ts
9%
38%
32%
45%
44%
44%
36%
15%
19%10
%
5% 4%
0%25
%50
%75
%10
0%
All N
ew Y
ork
City
Res
pond
ents
All B
ronx
Res
pond
ents
All C
omm
unity
Boa
rd #
8 R
espo
nden
ts
Gen
der
•M
ale:
44%
•F
emal
e: 5
6%A
ge •<
18 y
ears
old
: 23%
•18
-54
year
s ol
d: 4
9%•
55+
yea
rs o
ld: 2
8%
Rac
e/E
thn
icit
y•
Non
-His
pani
c W
hite
: 40%
•N
on-H
ispa
nic
Bla
ck: 1
4%•
Non
-His
pani
c A
sian
: 5%
•H
ispa
nic:
39%
•O
ther
: 2%
Po
pu
lati
on
an
d H
ou
seh
old
s•
Tot
al P
opul
atio
n: 1
11,1
99•
Tot
al H
ouse
hold
s: 4
3,00
6
Med
ian
An
nu
al H
ou
seh
old
Inco
me
•$4
9,16
7(2
006
Infla
tion-
Adj
uste
d D
olla
rs)
•34
3 R
espo
nses
•19
.5%
Res
pons
e R
ate
•±5
.3%
Mar
gin
of E
rror
(95
% C
onfid
ence
Inte
rval
)
Sou
rce:
U.S
. Cen
sus
Bur
eau
-20
06 A
mer
ican
Com
mun
ity S
urve
y, P
opul
atio
n D
ivis
ion
-N
ew Y
ork
City
Dep
artm
ent o
f City
Pla
nnin
g
See
deta
il be
low

City
wid
e C
usto
mer
Sur
vey
Res
ults
12%
26%
45%
18%
7%19
%51
%22
%N
eig
hb
orh
oo
d
Pu
blic
Saf
ety
Ind
ex
14%
34%
42%
10%
9%31
%49
%11
%M
ass
Tra
nsi
t S
ervi
ces
Ind
ex
21%
34%
36%
9%
17%
27%
44%
11%
Str
eets
an
d
Sid
ewal
ks
Ind
ex
17%
29%
41%
13%
11%
25%
44%
20%
Cle
anin
g a
nd
M
ain
ten
ance
In
dex
25%
39%
30%
6%
27%
40%
30%
4%P
ub
licE
du
cati
on
In
dex
42%
35%
19%
4%
39%
35%
23%
2%S
oci
al S
up
po
rt
Ser
vice
s In
dex
Ind
ex
Sco
reP
oo
rF
air
Go
od
Exc
elle
nt
Sur
vey
resp
onde
nts
wer
e as
ked
to n
ame
wha
t the
y th
ough
t w
ere
the
thre
e m
ost i
mpo
rtan
t iss
ues
faci
ng N
ew Y
ork
City
. T
he th
ree
resp
onse
s m
ost c
omm
only
giv
en b
y B
ronx
C
omm
unity
Boa
rd #
8 re
spon
dent
s ar
e lis
ted
belo
w.
Hig
hest
Rat
edLo
wes
t Rat
ed
Sur
vey
resp
onde
nts
rate
d 24
ser
vice
s in
thei
r ne
ighb
orho
od.
The
hig
hest
and
low
est r
ated
ser
vice
s ar
e di
spla
yed
belo
w.
NYC
All
Com
mun
ity B
oard
#8
Res
pond
ents
All
New
Yor
k C
ity R
espo
nden
ts
Ind
ex R
atin
gs:
Bro
nx
Co
mm
un
ity
Bo
ard
#8
Co
mp
ared
to
Rat
ing
s G
iven
by
All
Res
po
nd
ents
Mo
st Im
po
rtan
t Is
sues
Fac
ing
New
Yo
rk
Cit
y: B
ron
x C
om
mu
nit
y B
oar
d #
8
Rat
ing
s o
f N
eig
hb
orh
oo
d S
ervi
ces:
B
ron
x C
om
mu
nit
y B
oar
d #
8
5861 7573 8389 7983 8691 8993
1.H
ousi
ng
2.E
duca
tion
3.M
ass
Tra
nsit
1.E
mer
genc
y m
edic
al
serv
ices
2.H
ouse
hold
gar
bage
pic
k-up
3.F
ire p
rote
ctio
n se
rvic
es
4.N
eigh
borh
ood
play
grou
nds
5.P
ublic
libr
arie
s
1.A
vaila
bilit
y of
cul
tura
l ac
tiviti
es
2.C
ontr
ol o
f str
eet n
oise
3.M
aint
enan
ce o
f str
eets
an
d ro
ads
4.R
at c
ontr
ol
5.G
raffi
ti co
ntro
l

City
wid
e C
usto
mer
Sur
vey
Res
ults
15%
44%
34%
36%
29%
36%
37%
12%
22%
21%
7%5%
0%25
%50
%75
%10
0%
All N
ew Y
ork
City
Res
pond
ents
All B
ronx
Res
pond
ents
All C
omm
unity
Boa
rd #
9 R
espo
nden
ts
Bac
kgro
un
d:
Bro
nx
Co
mm
un
ity
Bo
ard
#9
Su
rvey
Res
po
nse
s: B
ron
x C
om
mu
nit
y B
oar
d #
9
Th
e N
eig
hb
orh
oo
ds
of
Bro
nx
Co
mm
un
ity
Bo
ard
#9
Sour
ce: N
YC P
lann
ing
Dep
artm
ent
Res
ult
sfr
om
NY
C F
eed
bac
k C
ityw
ide
Cu
sto
mer
Su
rvey
Bro
nx
Co
mm
un
ity
Bo
ard
#9
Rat
ing
s o
f N
eig
hb
orh
oo
d a
s a
Pla
ce t
o L
ive
Rat
ing
s o
f O
vera
ll Q
ual
ity
of
Lif
e in
New
Yo
rk C
ity
Exce
llent
Poor
Fair
Goo
d
Exce
llent
Poor
Fair
Goo
d
Exce
llent
Poor
Fair
Goo
d
Rat
ing
s o
f O
vera
ll Q
ual
ity
of
New
Yo
rk C
ity
Go
vern
men
t S
ervi
ces
45%
37%
34%
37%
42%
40%
12%
16%
22%
4%5% 6%
0%25
%50
%75
%10
0%
All N
ew Y
ork
City
Res
pond
ents
All B
ronx
Res
pond
ents
All C
omm
unity
Boa
rd #
9 R
espo
nden
ts
38%
32%
28%
44%
44%
48%
15%
19%
20%
5%4%
4%
0%25
%50
%75
%10
0%
All N
ew Y
ork
City
Res
pond
ents
All B
ronx
Res
pond
ents
All C
omm
unity
Boa
rd #
9 R
espo
nden
ts
Gen
der
•M
ale:
47%
•F
emal
e: 5
3%A
ge •<
18 y
ears
old
: 28%
•18
-54
year
s ol
d: 5
2%•
55+
yea
rs o
ld: 2
0%
Rac
e/E
thn
icit
y•
Non
-His
pani
c W
hite
: 3%
•N
on-H
ispa
nic
Bla
ck: 3
2%•
Non
-His
pani
c A
sian
: 6%
•H
ispa
nic:
57%
•O
ther
: 3%
Po
pu
lati
on
an
d H
ou
seh
old
s•
Tot
al P
opul
atio
n: 1
80,3
96•
Tot
al H
ouse
hold
s: 6
5,24
5
Med
ian
An
nu
al H
ou
seh
old
Inco
me
•$3
4,63
0(2
006
Infla
tion-
Adj
uste
d D
olla
rs)
•35
9 R
espo
nses
•13
.3%
Res
pons
e R
ate
•±5
.2%
Mar
gin
of E
rror
(95
% C
onfid
ence
Inte
rval
)
Sou
rce:
U.S
. Cen
sus
Bur
eau
-20
06 A
mer
ican
Com
mun
ity S
urve
y, P
opul
atio
n D
ivis
ion
-N
ew Y
ork
City
Dep
artm
ent o
f City
Pla
nnin
g
See
deta
il be
low

City
wid
e C
usto
mer
Sur
vey
Res
ults
12%
26%
45%
18%
16%
32%
39%
14%
Nei
gh
bo
rho
od
P
ub
lic S
afet
y In
dex
14%
34%
42%
10%
15%
38%
38%
9%M
ass
Tra
nsi
t S
ervi
ces
Ind
ex
21%
34%
36%
9%
22%
35%
33%
10%
Str
eets
an
d
Sid
ewal
ks
Ind
ex
17%
29%
41%
13%
21%
27%
40%
12%
Cle
anin
g a
nd
M
ain
ten
ance
In
dex
25%
39%
30%
6%
28%
36%
28%
7%P
ub
licE
du
cati
on
In
dex
42%
35%
19%
4%
41%
39%
17%
2%S
oci
al S
up
po
rt
Ser
vice
s In
dex
Ind
ex
Sco
reP
oo
rF
air
Go
od
Exc
elle
nt
Sur
vey
resp
onde
nts
wer
e as
ked
to n
ame
wha
t the
y th
ough
t w
ere
the
thre
e m
ost i
mpo
rtan
t iss
ues
faci
ng N
ew Y
ork
City
. T
he th
ree
resp
onse
s m
ost c
omm
only
giv
en b
y B
ronx
C
omm
unity
Boa
rd #
9 re
spon
dent
s ar
e lis
ted
belo
w.
Hig
hest
Rat
edLo
wes
t Rat
ed
Sur
vey
resp
onde
nts
rate
d 24
ser
vice
s in
thei
r ne
ighb
orho
od.
The
hig
hest
and
low
est r
ated
ser
vice
s ar
e di
spla
yed
belo
w.
NYC
All
Com
mun
ity B
oard
#9
Res
pond
ents
All
New
Yor
k C
ity R
espo
nden
ts
Ind
ex R
atin
gs:
Bro
nx
Co
mm
un
ity
Bo
ard
#9
Co
mp
ared
to
Rat
ing
s G
iven
by
All
Res
po
nd
ents
Mo
st Im
po
rtan
t Is
sues
Fac
ing
New
Yo
rk
Cit
y: B
ron
x C
om
mu
nit
y B
oar
d #
9
Rat
ing
s o
f N
eig
hb
orh
oo
d S
ervi
ces:
B
ron
x C
om
mu
nit
y B
oar
d #
9
5859 7572 8379 7978 8685 8984
1.H
ousi
ng
2.Jo
bs
3.C
rime
1.F
ire p
rote
ctio
n se
rvic
es
2.E
mer
genc
y m
edic
al
serv
ices
3.C
ondi
tion
of s
tree
t tre
es
4.P
ublic
libr
arie
s
5.H
ouse
hold
gar
bage
pic
k-up
1.A
vaila
bilit
y of
cul
tura
l ac
tiviti
es
2.C
ontr
ol o
f str
eet n
oise
3.R
at c
ontr
ol
4.P
olic
e-C
omm
unity
re
latio
ns
5.S
torm
wat
er d
rain
age
and
sew
er m
aint
enan
ce

City
wid
e C
usto
mer
Sur
vey
Res
ults
15%
18%
44%
34%
59%
29%
36%
22% 12
%
22%
7%
2%
0%25
%50
%75
%10
0%
All N
ew Y
ork
City
Res
pond
ents
All B
ronx
Res
pond
ents
All C
omm
unity
Boa
rd #
10 R
espo
nden
ts
Bac
kgro
un
d:
Bro
nx
Co
mm
un
ity
Bo
ard
#10
Su
rvey
Res
po
nse
s: B
ron
x C
om
mu
nit
y B
oar
d #
10
Th
e N
eig
hb
orh
oo
ds
of
Bro
nx
Co
mm
un
ity
Bo
ard
#10
Sour
ce: N
YC P
lann
ing
Dep
artm
ent
Res
ult
sfr
om
NY
C F
eed
bac
k C
ityw
ide
Cu
sto
mer
Su
rvey
Bro
nx
Co
mm
un
ity
Bo
ard
#10
Rat
ing
s o
f N
eig
hb
orh
oo
d a
s a
Pla
ce t
o L
ive
Rat
ing
s o
f O
vera
ll Q
ual
ity
of
Lif
e in
New
Yo
rk C
ity
Exce
llent
Poor
Fair
Goo
d
Exce
llent
Poor
Fair
Goo
d
Exce
llent
Poor
Fair
Goo
d
Rat
ing
s o
f O
vera
ll Q
ual
ity
of
New
Yo
rk C
ity
Go
vern
men
t S
ervi
ces
45%
37%41
%
37%
42%46
%
12%
16%
4%6% 6%
7%
0%25
%50
%75
%10
0%
All N
ew Y
ork
City
Res
pond
ents
All B
ronx
Res
pond
ents
All C
omm
unity
Boa
rd #
10 R
espo
nden
ts
38%
32%
29%
44%
44%
51%
15%
19%
18%
5%2% 4%
0%25
%50
%75
%10
0%
All N
ew Y
ork
City
Res
pond
ents
All B
ronx
Res
pond
ents
All C
omm
unity
Boa
rd #
10 R
espo
nden
ts
Gen
der
•M
ale:
43%
•F
emal
e: 5
7%A
ge •<
18 y
ears
old
: 19%
•18
-54
year
s ol
d: 4
9%•
55+
yea
rs o
ld: 3
2%
Rac
e/E
thn
icit
y•
Non
-His
pani
c W
hite
: 47%
•N
on-H
ispa
nic
Bla
ck: 2
3%•
Non
-His
pani
c A
sian
: 3%
•H
ispa
nic:
25%
•O
ther
: 2%
Po
pu
lati
on
an
d H
ou
seh
old
s•
Tot
al P
opul
atio
n: 1
14,0
81•
Tot
al H
ouse
hold
s: 4
3,53
3
Med
ian
An
nu
al H
ou
seh
old
Inco
me
•$5
1,77
8(2
006
Infla
tion-
Adj
uste
d D
olla
rs)
•32
9 R
espo
nses
•20
.2%
Res
pons
e R
ate
•±5
.4%
Mar
gin
of E
rror
(95
% C
onfid
ence
Inte
rval
)
See
deta
il be
low
Sou
rce:
U.S
. Cen
sus
Bur
eau
-20
06 A
mer
ican
Com
mun
ity S
urve
y, P
opul
atio
n D
ivis
ion
-N
ew Y
ork
City
Dep
artm
ent o
f City
Pla
nnin
g

City
wid
e C
usto
mer
Sur
vey
Res
ults
12%
26%
45%
18%
6%26
%47
%21
%N
eig
hb
orh
oo
d
Pu
blic
Saf
ety
Ind
ex
14%
34%
42%
10%
11%
37%
42%
10%
Mas
s T
ran
sit
Ser
vice
s In
dex
21%
34%
36%
9%
14%
31%
43%
11%
Str
eets
an
d
Sid
ewal
ks
Ind
ex
17%
29%
41%
13%
10%
24%
46%
21%
Cle
anin
g a
nd
M
ain
ten
ance
In
dex
25%
39%
30%
6%
28%
44%
24%
4%P
ub
licE
du
cati
on
In
dex
42%
35%
19%
4%
47%
32%
19%
2%S
oci
al S
up
po
rt
Ser
vice
s In
dex
Ind
ex
Sco
reP
oo
rF
air
Go
od
Exc
elle
nt
Sur
vey
resp
onde
nts
wer
e as
ked
to n
ame
wha
t the
y th
ough
t w
ere
the
thre
e m
ost i
mpo
rtan
t iss
ues
faci
ng N
ew Y
ork
City
. T
he th
ree
resp
onse
s m
ost c
omm
only
giv
en b
y B
ronx
C
omm
unity
Boa
rd #
10 r
espo
nden
ts a
re li
sted
bel
ow.
Hig
hest
Rat
edLo
wes
t Rat
ed
Sur
vey
resp
onde
nts
rate
d 24
ser
vice
s in
thei
r ne
ighb
orho
od.
The
hig
hest
and
low
est r
ated
ser
vice
s ar
e di
spla
yed
belo
w.
NYC
All
Com
mun
ity B
oard
#10
Res
pond
ents
All
New
Yor
k C
ity R
espo
nden
ts
Ind
ex R
atin
gs:
Bro
nx
Co
mm
un
ity
Bo
ard
#10
C
om
par
ed t
o R
atin
gs
Giv
en b
y A
ll R
esp
on
den
tsM
ost
Imp
ort
ant
Issu
es F
acin
g N
ew Y
ork
C
ity:
Bro
nx
Co
mm
un
ity
Bo
ard
#10
Rat
ing
s o
f N
eig
hb
orh
oo
d S
ervi
ces:
B
ron
x C
om
mu
nit
y B
oar
d #
10
5853 7572 8390 7986 8689 8994
1.C
rime
2.H
ousi
ng
3.E
duca
tion
1.F
ire p
rote
ctio
n se
rvic
es
2.E
mer
genc
y m
edic
al
serv
ices
3.H
ouse
hold
gar
bage
pic
k-up
4.C
lean
lines
s of
you
r ne
ighb
orho
od
5.R
ecyc
ling
serv
ices
1.A
vaila
bilit
y of
cul
tura
l ac
tiviti
es
2.S
torm
wat
er d
rain
age
and
sew
er m
aint
enan
ce
3.M
aint
enan
ce o
f str
eets
an
d ro
ads
4.G
raffi
ti co
ntro
l
5.P
edes
tria
n sa
fety
(c
ross
ing
inte
rsec
tions
)

City
wid
e C
usto
mer
Sur
vey
Res
ults
15%
44%
34%48
%
29%
36%
37%
12%
22%
7%7%8%
0%25
%50
%75
%10
0%
All N
ew Y
ork
City
Res
pond
ents
All B
ronx
Res
pond
ents
All C
omm
unity
Boa
rd #
11 R
espo
nden
ts
Bac
kgro
un
d:
Bro
nx
Co
mm
un
ity
Bo
ard
#11
Su
rvey
Res
po
nse
s: B
ron
x C
om
mu
nit
y B
oar
d #
11
Th
e N
eig
hb
orh
oo
ds
of
Bro
nx
Co
mm
un
ity
Bo
ard
#11
Sour
ce: N
YC P
lann
ing
Dep
artm
ent
Res
ult
sfr
om
NY
C F
eed
bac
k C
ityw
ide
Cu
sto
mer
Su
rvey
Bro
nx
Co
mm
un
ity
Bo
ard
#11
Rat
ing
s o
f N
eig
hb
orh
oo
d a
s a
Pla
ce t
o L
ive
Rat
ing
s o
f O
vera
ll Q
ual
ity
of
Lif
e in
New
Yo
rk C
ity
Exce
llent
Poor
Fair
Goo
d
Exce
llent
Poor
Fair
Goo
d
Exce
llent
Poor
Fair
Goo
d
Rat
ing
s o
f O
vera
ll Q
ual
ity
of
New
Yo
rk C
ity
Go
vern
men
t S
ervi
ces
45%
37%45
%
37%
42%37
%
12%
16%
14%
4%
4% 6%
0%25
%50
%75
%10
0%
All N
ew Y
ork
City
Res
pond
ents
All B
ronx
Res
pond
ents
All C
omm
unity
Boa
rd #
11 R
espo
nden
ts
38%
32%
35%
44%
44%
43%
15%
19%
18%
5%4%
4%
0%25
%50
%75
%10
0%
All N
ew Y
ork
City
Res
pond
ents
All B
ronx
Res
pond
ents
All C
omm
unity
Boa
rd #
11 R
espo
nden
ts
Gen
der
•M
ale:
46%
•F
emal
e: 5
4%A
ge •<
18 y
ears
old
: 27%
•18
-54
year
s ol
d: 4
8%•
55+
yea
rs o
ld: 2
5%
Rac
e/E
thn
icit
y•
Non
-His
pani
c W
hite
: 33%
•N
on-H
ispa
nic
Bla
ck: 1
8%•
Non
-His
pani
c A
sian
: 6%
•H
ispa
nic:
41%
•O
ther
: 1%
Po
pu
lati
on
an
d H
ou
seh
old
s•
Tot
al P
opul
atio
n: 1
21,4
65•
Tot
al H
ouse
hold
s: 4
3,63
3
Med
ian
An
nu
al H
ou
seh
old
Inco
me
•$4
2,10
7(2
006
Infla
tion-
Adj
uste
d D
olla
rs)
•33
2 R
espo
nses
•16
.1%
Res
pons
e R
ate
•±5
.4%
Mar
gin
of E
rror
(95
% C
onfid
ence
Inte
rval
)
See
deta
il be
low
Sou
rce:
U.S
. Cen
sus
Bur
eau
-20
06 A
mer
ican
Com
mun
ity S
urve
y, P
opul
atio
n D
ivis
ion
-N
ew Y
ork
City
Dep
artm
ent o
f City
Pla
nnin
g

City
wid
e C
usto
mer
Sur
vey
Res
ults
12%
26%
45%
18%
10%
24%
48%
18%
Nei
gh
bo
rho
od
P
ub
lic S
afet
y In
dex
14%
34%
42%
10%
11%
34%
46%
9%M
ass
Tra
nsi
t S
ervi
ces
Ind
ex
21%
34%
36%
9%
19%
32%
40%
8%S
tree
ts a
nd
S
idew
alks
In
dex
17%
29%
41%
13%
15%
30%
41%
14%
Cle
anin
g a
nd
M
ain
ten
ance
In
dex
25%
39%
30%
6%
29%
35%
31%
5%P
ub
licE
du
cati
on
In
dex
42%
35%
19%
4%
42%
34%
20%
5%S
oci
al S
up
po
rt
Ser
vice
s In
dex
Ind
ex
Sco
reP
oo
rF
air
Go
od
Exc
elle
nt
Sur
vey
resp
onde
nts
wer
e as
ked
to n
ame
wha
t the
y th
ough
t w
ere
the
thre
e m
ost i
mpo
rtan
t iss
ues
faci
ng N
ew Y
ork
City
. T
he th
ree
resp
onse
s m
ost c
omm
only
giv
en b
y B
ronx
C
omm
unity
Boa
rd #
11 r
espo
nden
ts a
re li
sted
bel
ow.
Hig
hest
Rat
edLo
wes
t Rat
ed
Sur
vey
resp
onde
nts
rate
d 24
ser
vice
s in
thei
r ne
ighb
orho
od.
The
hig
hest
and
low
est r
ated
ser
vice
s ar
e di
spla
yed
belo
w.
NYC
All
Com
mun
ity B
oard
#11
Res
pond
ents
All
New
Yor
k C
ity R
espo
nden
ts
Ind
ex R
atin
gs:
Bro
nx
Co
mm
un
ity
Bo
ard
#11
C
om
par
ed t
o R
atin
gs
Giv
en b
y A
ll R
esp
on
den
tsM
ost
Imp
ort
ant
Issu
es F
acin
g N
ew Y
ork
C
ity:
Bro
nx
Co
mm
un
ity
Bo
ard
#11
Rat
ing
s o
f N
eig
hb
orh
oo
d S
ervi
ces:
B
ron
x C
om
mu
nit
y B
oar
d #
11
5858 7571 8385 7981 8689 8990
1.C
rime
2.H
ousi
ng
3.E
duca
tion
1.F
ire p
rote
ctio
n se
rvic
es
2.E
mer
genc
y m
edic
al
serv
ices
3.H
ouse
hold
gar
bage
pic
k-up
4.P
ublic
libr
arie
s
5.N
eigh
borh
ood
park
s
1.A
vaila
bilit
y of
cul
tura
l ac
tiviti
es
2.R
emov
al o
f sno
w fr
om
city
str
eets
3.M
aint
enan
ce o
f str
eets
an
d ro
ads
4.C
ontr
ol o
f str
eet n
oise
5.G
raffi
ti co
ntro
l

City
wid
e C
usto
mer
Sur
vey
Res
ults
15%
44%
34%
37%
29%
36%42
%
12%
22%13
%
7%8%
0%25
%50
%75
%10
0%
All N
ew Y
ork
City
Res
pond
ents
All B
ronx
Res
pond
ents
All C
omm
unity
Boa
rd #
12 R
espo
nden
ts
Bac
kgro
un
d:
Bro
nx
Co
mm
un
ity
Bo
ard
#12
Su
rvey
Res
po
nse
s: B
ron
x C
om
mu
nit
y B
oar
d #
12
Th
e N
eig
hb
orh
oo
ds
of
Bro
nx
Co
mm
un
ity
Bo
ard
#12
Sour
ce: N
YC P
lann
ing
Dep
artm
ent
Res
ult
sfr
om
NY
C F
eed
bac
k C
ityw
ide
Cu
sto
mer
Su
rvey
Bro
nx
Co
mm
un
ity
Bo
ard
#12
Rat
ing
s o
f N
eig
hb
orh
oo
d a
s a
Pla
ce t
o L
ive
Rat
ing
s o
f O
vera
ll Q
ual
ity
of
Lif
e in
New
Yo
rk C
ity
Exce
llent
Poor
Fair
Goo
d
Exce
llent
Poor
Fair
Goo
d
Exce
llent
Poor
Fair
Goo
d
Rat
ing
s o
f O
vera
ll Q
ual
ity
of
New
Yo
rk C
ity
Go
vern
men
t S
ervi
ces
45%
37%
38%
37%
42%
43%
12%
16%
17%
4%
2% 6%
0%25
%50
%75
%10
0%
All N
ew Y
ork
City
Res
pond
ents
All B
ronx
Res
pond
ents
All C
omm
unity
Boa
rd #
12 R
espo
nden
ts
38%
32%
35%
44%
44%44
%
15%
19%
16%
5%5% 4%
0%25
%50
%75
%10
0%
All N
ew Y
ork
City
Res
pond
ents
All B
ronx
Res
pond
ents
All C
omm
unity
Boa
rd #
12 R
espo
nden
ts
Gen
der
•M
ale:
46%
•F
emal
e: 5
4%A
ge •<
18 y
ears
old
: 29%
•18
-54
year
s ol
d: 5
2%•
55+
yea
rs o
ld: 1
8%
Rac
e/E
thn
icit
y•
Non
-His
pani
c W
hite
: 8%
•N
on-H
ispa
nic
Bla
ck: 6
8%•
Non
-His
pani
c A
sian
: 2%
•H
ispa
nic:
19%
•O
ther
: 3%
Po
pu
lati
on
an
d H
ou
seh
old
s•
Tot
al P
opul
atio
n: 1
47,8
18•
Tot
al H
ouse
hold
s: 4
7,05
8
Med
ian
An
nu
al H
ou
seh
old
Inco
me
•$4
5,62
1(2
006
Infla
tion-
Adj
uste
d D
olla
rs)
•27
7 R
espo
nses
•11
.4%
Res
pons
e R
ate
•±5
.9%
Mar
gin
of E
rror
(95
% C
onfid
ence
Inte
rval
)
See
deta
il be
low
Sou
rce:
U.S
. Cen
sus
Bur
eau
-20
06 A
mer
ican
Com
mun
ity S
urve
y, P
opul
atio
n D
ivis
ion
-N
ew Y
ork
City
Dep
artm
ent o
f City
Pla
nnin
g

City
wid
e C
usto
mer
Sur
vey
Res
ults
12%
26%
45%
18%
17%
29%
39%
15%
Nei
gh
bo
rho
od
P
ub
lic S
afet
y In
dex
14%
34%
42%
10%
10%
41%
40%
9%M
ass
Tra
nsi
t S
ervi
ces
Ind
ex
21%
34%
36%
9%
27%
34%
32%
8%S
tree
ts a
nd
S
idew
alks
In
dex
17%
29%
41%
13%
18%
28%
39%
15%
Cle
anin
g a
nd
M
ain
ten
ance
In
dex
25%
39%
30%
6%
33%
37%
24%
5%P
ub
lic
Ed
uca
tio
n
Ind
ex
42%
35%
19%
4%
46%
35%
15%
3%S
oci
al S
up
po
rt
Ser
vice
s In
dex
Ind
ex
Sco
reP
oo
rF
air
Go
od
Exc
elle
nt
Sur
vey
resp
onde
nts
wer
e as
ked
to n
ame
wha
t the
y th
ough
t w
ere
the
thre
e m
ost i
mpo
rtan
t iss
ues
faci
ng N
ew Y
ork
City
. T
he th
ree
resp
onse
s m
ost c
omm
only
giv
en b
y B
ronx
C
omm
unity
Boa
rd #
12 r
espo
nden
ts a
re li
sted
bel
ow.
Hig
hest
Rat
edLo
wes
t Rat
ed
Sur
vey
resp
onde
nts
rate
d 24
ser
vice
s in
thei
r ne
ighb
orho
od.
The
hig
hest
and
low
est r
ated
ser
vice
s ar
e di
spla
yed
belo
w.
NYC
All
Com
mun
ity B
oard
#12
Res
pond
ents
All
New
Yor
k C
ity R
espo
nden
ts
Ind
ex R
atin
gs:
Bro
nx
Co
mm
un
ity
Bo
ard
#12
C
om
par
ed t
o R
atin
gs
Giv
en b
y A
ll R
esp
on
den
tsM
ost
Imp
ort
ant
Issu
es F
acin
g N
ew Y
ork
C
ity:
Bro
nx
Co
mm
un
ity
Bo
ard
#12
Rat
ing
s o
f N
eig
hb
orh
oo
d S
ervi
ces:
B
ron
x C
om
mu
nit
y B
oar
d #
12
5854 7567 8382 7973 8690 8983
1.C
rime
2.H
ousi
ng
3.Jo
bs
1.F
ire p
rote
ctio
n se
rvic
es
2.E
mer
genc
y m
edic
al
serv
ices
3.H
ouse
hold
gar
bage
pic
k-up
4.S
ubw
ay s
ervi
ces
5.B
us s
ervi
ces
1.A
vaila
bilit
y of
cul
tura
l ac
tiviti
es
2.M
aint
enan
ce o
f str
eets
an
d ro
ads
3.R
emov
al o
f sno
w fr
om
city
str
eets
4.C
ontr
ol o
f str
eet n
oise
5.R
at c
ontr
ol

City
wid
e C
usto
mer
Sur
vey
Res
ults
15%
13%
10%
44%
42%
47%
29%
32%32
%
12%
13%
10%
0%25
%50
%75
%10
0%
All N
ew Y
ork
City
Res
pond
ents
All B
rook
lyn
Res
pond
ents
All C
omm
unity
Boa
rd #
1 R
espo
nden
ts
Bac
kgro
un
d:
Bro
okl
yn C
om
mu
nit
y B
oar
d #
1S
urv
ey R
esp
on
ses:
Bro
okl
yn C
om
mu
nit
y B
oar
d #
1
Th
e N
eig
hb
orh
oo
ds
of
Bro
okl
ynC
om
mu
nit
y B
oar
d #
1
Sour
ce: N
YC P
lann
ing
Dep
artm
ent
Res
ult
sfr
om
NY
C F
eed
bac
k C
ityw
ide
Cu
sto
mer
Su
rvey
Bro
okl
yn C
om
mu
nit
y B
oar
d #
1
Rat
ing
s o
f N
eig
hb
orh
oo
d a
s a
Pla
ce t
o L
ive
Rat
ing
s o
f O
vera
ll Q
ual
ity
of
Lif
e in
New
Yo
rk C
ity
Exce
llent
Poor
Fair
Goo
d
Exce
llent
Poor
Fair
Goo
d
Exce
llent
Poor
Fair
Goo
d
Rat
ing
s o
f O
vera
ll Q
ual
ity
of
New
Yo
rk C
ity
Go
vern
men
t S
ervi
ces
45%
43%49
%
37%
40%38
%
12%
13%
5%5% 6%
9%
0%25
%50
%75
%10
0%
All N
ew Y
ork
City
Res
pond
ents
All B
rook
lyn
Res
pond
ents
All C
omm
unity
Boa
rd #
1 R
espo
nden
ts
38%
35%41
%
44%
46%42
%
15%
15%
13%
4%
4%
4%
0%25
%50
%75
%10
0%
All N
ew Y
ork
City
Res
pond
ents
All B
rook
lyn
Res
pond
ents
All C
omm
unity
Boa
rd #
1 R
espo
nden
ts
Gen
der
•M
ale:
48%
•F
emal
e: 5
2%A
ge •<
18 y
ears
old
: 27%
•18
-54
year
s ol
d: 5
2%•
55+
yea
rs o
ld: 2
1%
Rac
e/E
thn
icit
y•
Non
-His
pani
c W
hite
: 64%
•N
on-H
ispa
nic
Bla
ck: 2
%•
Non
-His
pani
c A
sian
: 5%
•H
ispa
nic:
27%
•O
ther
: 2%
Po
pu
lati
on
an
d H
ou
seh
old
s•
Tot
al P
opul
atio
n: 1
41,5
13•
Tot
al H
ouse
hold
s: 5
1,80
2
Med
ian
An
nu
al H
ou
seh
old
Inco
me
•$3
2,30
7(2
006
Infla
tion-
Adj
uste
d D
olla
rs)
•49
8 R
espo
nses
•16
.6%
Res
pons
e R
ate
•±4
.4%
Mar
gin
of E
rror
(95
% C
onfid
ence
Inte
rval
)
Sou
rce:
U.S
. Cen
sus
Bur
eau
-20
06 A
mer
ican
Com
mun
ity S
urve
y, P
opul
atio
n D
ivis
ion
-N
ew Y
ork
City
Dep
artm
ent o
f City
Pla
nnin
g
See
deta
il be
low

City
wid
e C
usto
mer
Sur
vey
Res
ults
12%
26%
45%
18%
12%
31%
43%
15%
Nei
gh
bo
rho
od
P
ub
lic S
afet
y In
dex
14%
34%
42%
10%
15%
32%
43%
9%M
ass
Tra
nsi
t S
ervi
ces
Ind
ex
21%
34%
36%
9%
24%
35%
34%
7%S
tree
ts a
nd
S
idew
alks
In
dex
17%
29%
41%
13%
24%
32%
35%
9%C
lean
ing
an
d
Mai
nte
nan
ce
Ind
ex
25%
39%
30%
6%
27%
36%
30%
8%P
ub
licE
du
cati
on
In
dex
42%
35%
19%
4%
42%
35%
18%
5%S
oci
al S
up
po
rt
Ser
vice
s In
dex
Ind
ex
Sco
reP
oo
rF
air
Go
od
Exc
elle
nt
Sur
vey
resp
onde
nts
wer
e as
ked
to n
ame
wha
t the
y th
ough
t w
ere
the
thre
e m
ost i
mpo
rtan
t iss
ues
faci
ng N
ew Y
ork
City
. T
he th
ree
resp
onse
s m
ost c
omm
only
giv
en b
y B
rook
lyn
Com
mun
ity B
oard
#1
resp
onde
nts
are
liste
d be
low
.
Hig
hest
Rat
edLo
wes
t Rat
ed
Sur
vey
resp
onde
nts
rate
d 24
ser
vice
s in
thei
r ne
ighb
orho
od.
The
hig
hest
and
low
est r
ated
ser
vice
s ar
e di
spla
yed
belo
w.
NYC
All
Com
mun
ity B
oard
#1
Res
pond
ents
All
New
Yor
k C
ity R
espo
nden
ts
Ind
ex R
atin
gs:
Bro
okl
yn C
om
mu
nit
y B
oar
d #
1 C
om
par
ed t
o R
atin
gs
Giv
en b
y A
ll R
esp
on
den
tsM
ost
Imp
ort
ant
Issu
es F
acin
g N
ew Y
ork
C
ity:
Bro
okl
yn C
om
mu
nit
y B
oar
d #
1
Rat
ing
s o
f N
eig
hb
orh
oo
d S
ervi
ces:
B
roo
klyn
Co
mm
un
ity
Bo
ard
#1
5858 7573 8376 7976 8685 8988
1.H
ousi
ng
2.M
ass
Tra
nsit
3.E
duca
tion
1.F
ire p
rote
ctio
n se
rvic
es
2.E
mer
genc
y m
edic
al
serv
ices
3.H
ouse
hold
gar
bage
pic
k-up
4.N
eigh
borh
ood
park
s
5.P
arki
ng e
nfor
cem
ent
1.C
ontr
ol o
f str
eet n
oise
2.R
at c
ontr
ol
3.G
raffi
ti co
ntro
l
4.C
lean
lines
s of
you
r ne
ighb
orho
od
5.M
aint
enan
ce o
f str
eets
an
d ro
ads

City
wid
e C
usto
mer
Sur
vey
Res
ults
15%
13%
35%
44%
42%
46%
29%
32%
14% 12
%
13%4
%
0%25
%50
%75
%10
0%
All N
ew Y
ork
City
Res
pond
ents
All B
rook
lyn
Res
pond
ents
All C
omm
unity
Boa
rd #
2 R
espo
nden
ts
Bac
kgro
un
d:
Bro
okl
yn C
om
mu
nit
y B
oar
d #
2S
urv
ey R
esp
on
ses:
Bro
okl
yn C
om
mu
nit
y B
oar
d #
2
Th
e N
eig
hb
orh
oo
ds
of
Bro
okl
yn
Co
mm
un
ity
Bo
ard
#2
Sour
ce: N
YC P
lann
ing
Dep
artm
ent
Res
ult
sfr
om
NY
C F
eed
bac
k C
ityw
ide
Cu
sto
mer
Su
rvey
Bro
okl
yn C
om
mu
nit
y B
oar
d #
2
Rat
ing
s o
f N
eig
hb
orh
oo
d a
s a
Pla
ce t
o L
ive
Rat
ing
s o
f O
vera
ll Q
ual
ity
of
Lif
e in
New
Yo
rk C
ity
Exce
llent
Poor
Fair
Goo
d
Exce
llent
Poor
Fair
Goo
d
Exce
llent
Poor
Fair
Goo
d
Rat
ing
s o
f O
vera
ll Q
ual
ity
of
New
Yo
rk C
ity
Go
vern
men
t S
ervi
ces
45%
43%
61%
37%
40%
27%
12%
13%
5%8% 6%
5%
0%25
%50
%75
%10
0%
All N
ew Y
ork
City
Res
pond
ents
All B
rook
lyn
Res
pond
ents
All C
omm
unity
Boa
rd #
2 R
espo
nden
ts
38%
35%46
%
44%
46%
41%
15%
15%8%
4%
4%
4%
0%25
%50
%75
%10
0%
All N
ew Y
ork
City
Res
pond
ents
All B
rook
lyn
Res
pond
ents
All C
omm
unity
Boa
rd #
2 R
espo
nden
ts
Gen
der
•M
ale:
48%
•F
emal
e: 5
2%A
ge •<
18 y
ears
old
: 19%
•18
-54
year
s ol
d: 6
1%•
55+
yea
rs o
ld: 2
0%
Rac
e/E
thn
icit
y•
Non
-His
pani
c W
hite
: 39%
•N
on-H
ispa
nic
Bla
ck: 2
8%•
Non
-His
pani
c A
sian
: 7%
•H
ispa
nic:
21%
•O
ther
: 4%
Po
pu
lati
on
an
d H
ou
seh
old
s•
Tot
al P
opul
atio
n: 1
11,7
96•
Tot
al H
ouse
hold
s: 4
8,25
0
Med
ian
An
nu
al H
ou
seh
old
Inco
me
•$5
4,95
3(2
006
Infla
tion-
Adj
uste
d D
olla
rs)
•46
8 R
espo
nses
•23
.4%
Res
pons
e R
ate
•±4
.5%
Mar
gin
of E
rror
(95
% C
onfid
ence
Inte
rval
)
See
deta
il be
low
Sou
rce:
U.S
. Cen
sus
Bur
eau
-20
06 A
mer
ican
Com
mun
ity S
urve
y, P
opul
atio
n D
ivis
ion
-N
ew Y
ork
City
Dep
artm
ent o
f City
Pla
nnin
g

City
wid
e C
usto
mer
Sur
vey
Res
ults
12%
26%
45%
18%
11%
23%
45%
21%
Nei
gh
bo
rho
od
P
ub
lic S
afet
y In
dex
14%
34%
42%
10%
11%
34%
43%
12%
Mas
s T
ran
sit
Ser
vice
s In
dex
21%
34%
36%
9%
15%
33%
38%
14%
Str
eets
an
d
Sid
ewal
ks
Ind
ex
17%
29%
41%
13%
11%
24%
48%
17%
Cle
anin
g a
nd
M
ain
ten
ance
In
dex
25%
39%
30%
6%
35%
44%
18%
3%P
ub
licE
du
cati
on
In
dex
42%
35%
19%
4%
49%
36%
13%
1%S
oci
al S
up
po
rt
Ser
vice
s In
dex
Ind
ex
Sco
reP
oo
rF
air
Go
od
Exc
elle
nt
Sur
vey
resp
onde
nts
wer
e as
ked
to n
ame
wha
t the
y th
ough
t w
ere
the
thre
e m
ost i
mpo
rtan
t iss
ues
faci
ng N
ew Y
ork
City
. T
he th
ree
resp
onse
s m
ost c
omm
only
giv
en b
y B
rook
lyn
Com
mun
ity B
oard
#2
resp
onde
nts
are
liste
d be
low
.
Hig
hest
Rat
edLo
wes
t Rat
ed
Sur
vey
resp
onde
nts
rate
d 24
ser
vice
s in
thei
r ne
ighb
orho
od.
The
hig
hest
and
low
est r
ated
ser
vice
s ar
e di
spla
yed
belo
w.
NYC
All
Com
mun
ity B
oard
#2
Res
pond
ents
All
New
Yor
k C
ity R
espo
nden
ts
Ind
ex R
atin
gs:
Bro
okl
yn C
om
mu
nit
y B
oar
d #
2 C
om
par
ed t
o R
atin
gs
Giv
en b
y A
ll R
esp
on
den
tsM
ost
Imp
ort
ant
Issu
es F
acin
g N
ew Y
ork
C
ity:
Bro
okl
yn C
om
mu
nit
y B
oar
d #
2
Rat
ing
s o
f N
eig
hb
orh
oo
d S
ervi
ces:
B
roo
klyn
Co
mm
un
ity
Bo
ard
#2
5851 7565 8389 7985 8689 8989
1.H
ousi
ng
2.E
duca
tion
3.M
ass
Tra
nsit
1.F
ire p
rote
ctio
n se
rvic
es
2.N
eigh
borh
ood
play
grou
nds
3.H
ouse
hold
gar
bage
pic
k-up
4.E
mer
genc
y m
edic
al
serv
ices
5.G
raffi
ti co
ntro
l
1.C
ontr
ol o
f str
eet n
oise
2.R
at c
ontr
ol
3.M
aint
enan
ce o
f str
eets
an
d ro
ads
4.M
aint
enan
ce o
f si
dew
alks
5.P
olic
e-C
omm
unity
re
latio
ns

City
wid
e C
usto
mer
Sur
vey
Res
ults
15%
13%
44%
42%
30%
29%
32%
48%
12%
13%
20%
3%
0%25
%50
%75
%10
0%
All N
ew Y
ork
City
Res
pond
ents
All B
rook
lyn
Res
pond
ents
All C
omm
unity
Boa
rd #
3 R
espo
nden
ts
Bac
kgro
un
d:
Bro
okl
yn C
om
mu
nit
y B
oar
d #
3S
urv
ey R
esp
on
ses:
Bro
okl
yn C
om
mu
nit
y B
oar
d #
3
Th
e N
eig
hb
orh
oo
ds
of
Bro
okl
yn
Co
mm
un
ity
Bo
ard
#3
Sour
ce: N
YC P
lann
ing
Dep
artm
ent
Res
ult
sfr
om
NY
C F
eed
bac
k C
ityw
ide
Cu
sto
mer
Su
rvey
Bro
okl
yn C
om
mu
nit
y B
oar
d #
3
Rat
ing
s o
f N
eig
hb
orh
oo
d a
s a
Pla
ce t
o L
ive
Rat
ing
s o
f O
vera
ll Q
ual
ity
of
Lif
e in
New
Yo
rk C
ity
Exce
llent
Poor
Fair
Goo
d
Exce
llent
Poor
Fair
Goo
d
Exce
llent
Poor
Fair
Goo
d
Rat
ing
s o
f O
vera
ll Q
ual
ity
of
New
Yo
rk C
ity
Go
vern
men
t S
ervi
ces
45%
43%
36%
37%
40%
44%
12%
13%
16%
5%4% 6%
0%25
%50
%75
%10
0%
All N
ew Y
ork
City
Res
pond
ents
All B
rook
lyn
Res
pond
ents
All C
omm
unity
Boa
rd #
3 R
espo
nden
ts
38%
35%
33%
44%
46%
45%
15%
15%
18%
4%
4%
4%
0%25
%50
%75
%10
0%
All N
ew Y
ork
City
Res
pond
ents
All B
rook
lyn
Res
pond
ents
All C
omm
unity
Boa
rd #
3 R
espo
nden
ts
Gen
der
•M
ale:
45%
•F
emal
e: 5
5%A
ge •<
18 y
ears
old
: 33%
•18
-54
year
s ol
d: 5
1%•
55+
yea
rs o
ld: 1
6%
Rac
e/E
thn
icit
y•
Non
-His
pani
c W
hite
: 10%
•N
on-H
ispa
nic
Bla
ck: 6
7%•
Non
-His
pani
c A
sian
: 2%
•H
ispa
nic:
19%
•O
ther
: 2%
Po
pu
lati
on
an
d H
ou
seh
old
s•
Tot
al P
opul
atio
n: 1
32,0
87•
Tot
al H
ouse
hold
s: 4
2,37
6
Med
ian
An
nu
al H
ou
seh
old
Inco
me
•$2
7,59
8(2
006
Infla
tion-
Adj
uste
d D
olla
rs)
•49
6 R
espo
nses
•14
.4%
Res
pons
e R
ate
•±4
.4%
Mar
gin
of E
rror
(95
% C
onfid
ence
Inte
rval
)
Sou
rce:
U.S
. Cen
sus
Bur
eau
-20
06 A
mer
ican
Com
mun
ity S
urve
y, P
opul
atio
n D
ivis
ion
-N
ew Y
ork
City
Dep
artm
ent o
f City
Pla
nnin
g
See
deta
il be
low

City
wid
e C
usto
mer
Sur
vey
Res
ults
12%
26%
45%
18%
23%
34%
34%
9%N
eig
hb
orh
oo
d
Pu
blic
Saf
ety
Ind
ex
14%
34%
42%
10%
14%
36%
41%
9%M
ass
Tra
nsi
t S
ervi
ces
Ind
ex
21%
34%
36%
9%
29%
38%
28%
5%S
tree
ts a
nd
S
idew
alks
In
dex
17%
29%
41%
13%
21%
36%
34%
9%C
lean
ing
an
d
Mai
nte
nan
ce
Ind
ex
25%
39%
30%
6%
29%
36%
29%
5%P
ub
licE
du
cati
on
In
dex
42%
35%
19%
4%
50%
33%
14%
3%S
oci
al S
up
po
rt
Ser
vice
s In
dex
Ind
ex
Sco
reP
oo
rF
air
Go
od
Exc
elle
nt
Sur
vey
resp
onde
nts
wer
e as
ked
to n
ame
wha
t the
y th
ough
t w
ere
the
thre
e m
ost i
mpo
rtan
t iss
ues
faci
ng N
ew Y
ork
City
. T
he th
ree
resp
onse
s m
ost c
omm
only
giv
en b
y B
rook
lyn
Com
mun
ity B
oard
#3
resp
onde
nts
are
liste
d be
low
.
Hig
hest
Rat
edLo
wes
t Rat
ed
Sur
vey
resp
onde
nts
rate
d 24
ser
vice
s in
thei
r ne
ighb
orho
od.
The
hig
hest
and
low
est r
ated
ser
vice
s ar
e di
spla
yed
belo
w.
NYC
All
Com
mun
ity B
oard
#3
Res
pond
ents
All
New
Yor
k C
ity R
espo
nden
ts
Ind
ex R
atin
gs:
Bro
okl
yn C
om
mu
nit
y B
oar
d #
3 C
om
par
ed t
o R
atin
gs
Giv
en b
y A
ll R
esp
on
den
tsM
ost
Imp
ort
ant
Issu
es F
acin
g N
ew Y
ork
C
ity:
Bro
okl
yn C
om
mu
nit
y B
oar
d #
3
Rat
ing
s o
f N
eig
hb
orh
oo
d S
ervi
ces:
B
roo
klyn
Co
mm
un
ity
Bo
ard
#3
5850 7571 8379 7971 8686 8977
1.H
ousi
ng
2.Jo
bs
3.E
duca
tion
1.F
ire p
rote
ctio
n se
rvic
es
2.H
ouse
hold
gar
bage
pic
k-up
3.C
ondi
tion
of s
tree
t tre
es
4.E
mer
genc
y m
edic
al
serv
ices
5.R
ecyc
ling
serv
ices
1.M
aint
enan
ce o
f str
eets
an
d ro
ads
2.C
ontr
ol o
f str
eet n
oise
3.R
at c
ontr
ol
4.P
olic
e-C
omm
unity
re
latio
ns
5.A
vaila
bilit
y of
cul
tura
l ac
tiviti
es

City
wid
e C
usto
mer
Sur
vey
Res
ults
15%
13%
44%
42%
25%
29%
32%
46%
12%
13%
27%
2%
0%25
%50
%75
%10
0%
All N
ew Y
ork
City
Res
pond
ents
All B
rook
lyn
Res
pond
ents
All C
omm
unity
Boa
rd #
4 R
espo
nden
ts
Bac
kgro
un
d:
Bro
okl
yn C
om
mu
nit
y B
oar
d #
4S
urv
ey R
esp
on
ses:
Bro
okl
yn C
om
mu
nit
y B
oar
d #
4
Th
e N
eig
hb
orh
oo
ds
of
Bro
okl
ynC
om
mu
nit
y B
oar
d #
4
Sour
ce: N
YC P
lann
ing
Dep
artm
ent
Res
ult
sfr
om
NY
C F
eed
bac
k C
ityw
ide
Cu
sto
mer
Su
rvey
Bro
okl
yn C
om
mu
nit
y B
oar
d #
4
Rat
ing
s o
f N
eig
hb
orh
oo
d a
s a
Pla
ce t
o L
ive
Rat
ing
s o
f O
vera
ll Q
ual
ity
of
Lif
e in
New
Yo
rk C
ity
Exce
llent
Poor
Fair
Goo
d
Exce
llent
Poor
Fair
Goo
d
Exce
llent
Poor
Fair
Goo
d
Rat
ing
s o
f O
vera
ll Q
ual
ity
of
New
Yo
rk C
ity
Go
vern
men
t S
ervi
ces
45%
43%
32%
37%
40%
43%
12%
13%
20%
5%5% 6%
0%25
%50
%75
%10
0%
All N
ew Y
ork
City
Res
pond
ents
All B
rook
lyn
Res
pond
ents
All C
omm
unity
Boa
rd #
4 R
espo
nden
ts
38%
35%
27%
44%
46%
49%
15%
15%
20%
4%
3% 4%
0%25
%50
%75
%10
0%
All N
ew Y
ork
City
Res
pond
ents
All B
rook
lyn
Res
pond
ents
All C
omm
unity
Boa
rd #
4 R
espo
nden
ts
Gen
der
•M
ale:
48%
•F
emal
e: 5
2%A
ge •<
18 y
ears
old
: 30%
•18
-54
year
s ol
d: 5
3%•
55+
yea
rs o
ld: 1
7%
Rac
e/E
thn
icit
y•
Non
-His
pani
c W
hite
: 4%
•N
on-H
ispa
nic
Bla
ck: 2
1%•
Non
-His
pani
c A
sian
: 3%
•H
ispa
nic:
70%
•O
ther
: 2%
Po
pu
lati
on
an
d H
ou
seh
old
s•
Tot
al P
opul
atio
n: 1
23,8
71•
Tot
al H
ouse
hold
s: 3
8,66
0
Med
ian
An
nu
al H
ou
seh
old
Inco
me
•$2
7,85
2(2
006
Infla
tion-
Adj
uste
d D
olla
rs)
•40
5 R
espo
nses
•12
.4%
Res
pons
e R
ate
•±4
.9%
Mar
gin
of E
rror
(95
% C
onfid
ence
Inte
rval
)
See
deta
il be
low
Sou
rce:
U.S
. Cen
sus
Bur
eau
-20
06 A
mer
ican
Com
mun
ity S
urve
y, P
opul
atio
n D
ivis
ion
-N
ew Y
ork
City
Dep
artm
ent o
f City
Pla
nnin
g

City
wid
e C
usto
mer
Sur
vey
Res
ults
12%
26%
45%
18%
21%
35%
33%
11%
Nei
gh
bo
rho
od
P
ub
lic S
afet
y In
dex
14%
34%
42%
10%
13%
34%
43%
10%
Mas
s T
ran
sit
Ser
vice
s In
dex
21%
34%
36%
9%
30%
38%
28%
4%S
tree
ts a
nd
S
idew
alks
In
dex
17%
29%
41%
13%
30%
32%
31%
7%C
lean
ing
an
d
Mai
nte
nan
ce
Ind
ex
25%
39%
30%
6%
24%
46%
26%
4%P
ub
licE
du
cati
on
In
dex
42%
35%
19%
4%
44%
33%
20%
3%S
oci
al S
up
po
rt
Ser
vice
s In
dex
Ind
ex
Sco
reP
oo
rF
air
Go
od
Exc
elle
nt
Sur
vey
resp
onde
nts
wer
e as
ked
to n
ame
wha
t the
y th
ough
t w
ere
the
thre
e m
ost i
mpo
rtan
t iss
ues
faci
ng N
ew Y
ork
City
. T
he th
ree
resp
onse
s m
ost c
omm
only
giv
en b
y B
rook
lyn
Com
mun
ity B
oard
#4
resp
onde
nts
are
liste
d be
low
.
Hig
hest
Rat
edLo
wes
t Rat
ed
Sur
vey
resp
onde
nts
rate
d 24
ser
vice
s in
thei
r ne
ighb
orho
od.
The
hig
hest
and
low
est r
ated
ser
vice
s ar
e di
spla
yed
belo
w.
NYC
All
Com
mun
ity B
oard
#4
Res
pond
ents
All
New
Yor
k C
ity R
espo
nden
ts
Ind
ex R
atin
gs:
Bro
okl
yn C
om
mu
nit
y B
oar
d #
4 C
om
par
ed t
o R
atin
gs
Giv
en b
y A
ll R
esp
on
den
tsM
ost
Imp
ort
ant
Issu
es F
acin
g N
ew Y
ork
C
ity:
Bro
okl
yn C
om
mu
nit
y B
oar
d #
4
Rat
ing
s o
f N
eig
hb
orh
oo
d S
ervi
ces:
B
roo
klyn
Co
mm
un
ity
Bo
ard
#4
5856 7576 8370 7970 8687 8979
1.H
ousi
ng
2.C
rime
3.Jo
bs
1.F
ire p
rote
ctio
n se
rvic
es
2.E
mer
genc
y m
edic
al
serv
ices
3.H
ouse
hold
gar
bage
pic
k-up
4.R
ecyc
ling
serv
ices
5.S
ubw
ay s
ervi
ces
1.A
vaila
bilit
y of
cul
tura
l ac
tiviti
es
2.R
at c
ontr
ol
3.C
ontr
ol o
f str
eet n
oise
4.G
raffi
ti co
ntro
l
5.M
aint
enan
ce o
f str
eets
an
d ro
ads

City
wid
e C
usto
mer
Sur
vey
Res
ults
15%
13%
44%
42%
25%
29%
32%
44%
12%
13%
29%
3%
0%25
%50
%75
%10
0%
All N
ew Y
ork
City
Res
pond
ents
All B
rook
lyn
Res
pond
ents
All C
omm
unity
Boa
rd #
5 R
espo
nden
ts
Bac
kgro
un
d:
Bro
okl
yn C
om
mu
nit
y B
oar
d #
5S
urv
ey R
esp
on
ses:
Bro
okl
yn C
om
mu
nit
y B
oar
d #
5
Th
e N
eig
hb
orh
oo
ds
of
Bro
okl
yn
Co
mm
un
ity
Bo
ard
#5
Sour
ce: N
YC P
lann
ing
Dep
artm
ent
Res
ult
sfr
om
NY
C F
eed
bac
k C
ityw
ide
Cu
sto
mer
Su
rvey
Bro
okl
yn C
om
mu
nit
y B
oar
d #
5
Rat
ing
s o
f N
eig
hb
orh
oo
d a
s a
Pla
ce t
o L
ive
Rat
ing
s o
f O
vera
ll Q
ual
ity
of
Lif
e in
New
Yo
rk C
ity
Exce
llent
Poor
Fair
Goo
d
Exce
llent
Poor
Fair
Goo
d
Exce
llent
Poor
Fair
Goo
d
Rat
ing
s o
f O
vera
ll Q
ual
ity
of
New
Yo
rk C
ity
Go
vern
men
t S
ervi
ces
45%
43%
28%
37%
40%
48%
12%
13%
22%
5%3% 6%
0%25
%50
%75
%10
0%
All N
ew Y
ork
City
Res
pond
ents
All B
rook
lyn
Res
pond
ents
All C
omm
unity
Boa
rd #
5 R
espo
nden
ts
38%
35%
27%
44%
46%
51%
15%
15%
21%
2% 4%
4%
0%25
%50
%75
%10
0%
All N
ew Y
ork
City
Res
pond
ents
All B
rook
lyn
Res
pond
ents
All C
omm
unity
Boa
rd #
5 R
espo
nden
ts
Gen
der
•M
ale:
44%
•F
emal
e: 5
6%A
ge •<
18 y
ears
old
: 32%
•18
-54
year
s ol
d: 5
2%•
55+
yea
rs o
ld: 1
6%
Rac
e/E
thn
icit
y•
Non
-His
pani
c W
hite
: 5%
•N
on-H
ispa
nic
Bla
ck: 4
6%•
Non
-His
pani
c A
sian
: 6%
•H
ispa
nic:
39%
•O
ther
: 5%
Po
pu
lati
on
an
d H
ou
seh
old
s•
Tot
al P
opul
atio
n: 1
61,0
64•
Tot
al H
ouse
hold
s: 4
9,80
0
Med
ian
An
nu
al H
ou
seh
old
Inco
me
•$2
8,06
7(2
006
Infla
tion-
Adj
uste
d D
olla
rs)
•48
5 R
espo
nses
•12
.5%
Res
pons
e R
ate
•±4
.4%
Mar
gin
of E
rror
(95
% C
onfid
ence
Inte
rval
)
See
deta
il be
low
Sou
rce:
U.S
. Cen
sus
Bur
eau
-20
06 A
mer
ican
Com
mun
ity S
urve
y, P
opul
atio
n D
ivis
ion
-N
ew Y
ork
City
Dep
artm
ent o
f City
Pla
nnin
g

City
wid
e C
usto
mer
Sur
vey
Res
ults
12%
26%
45%
18%
21%
33%
35%
11%
Nei
gh
bo
rho
od
P
ub
lic S
afet
y In
dex
14%
34%
42%
10%
18%
38%
39%
6%M
ass
Tra
nsi
t S
ervi
ces
Ind
ex
21%
34%
36%
9%
31%
34%
27%
7%S
tree
ts a
nd
S
idew
alks
In
dex
17%
29%
41%
13%
26%
31%
34%
10%
Cle
anin
g a
nd
M
ain
ten
ance
In
dex
25%
39%
30%
6%
27%
40%
29%
3%P
ub
licE
du
cati
on
In
dex
42%
35%
19%
4%
48%
34%
15%
3%S
oci
al S
up
po
rt
Ser
vice
s In
dex
Ind
ex
Sco
reP
oo
rF
air
Go
od
Exc
elle
nt
Sur
vey
resp
onde
nts
wer
e as
ked
to n
ame
wha
t the
y th
ough
t w
ere
the
thre
e m
ost i
mpo
rtan
t iss
ues
faci
ng N
ew Y
ork
City
. T
he th
ree
resp
onse
s m
ost c
omm
only
giv
en b
y B
rook
lyn
Com
mun
ity B
oard
#5
resp
onde
nts
are
liste
d be
low
.
Hig
hest
Rat
edLo
wes
t Rat
ed
Sur
vey
resp
onde
nts
rate
d 24
ser
vice
s in
thei
r ne
ighb
orho
od.
The
hig
hest
and
low
est r
ated
ser
vice
s ar
e di
spla
yed
belo
w.
NYC
All
Com
mun
ity B
oard
#5
Res
pond
ents
All
New
Yor
k C
ity R
espo
nden
ts
Ind
ex R
atin
gs:
Bro
okl
yn C
om
mu
nit
y B
oar
d #
5 C
om
par
ed t
o R
atin
gs
Giv
en b
y A
ll R
esp
on
den
tsM
ost
Imp
ort
ant
Issu
es F
acin
g N
ew Y
ork
C
ity:
Bro
okl
yn C
om
mu
nit
y B
oar
d #
5
Rat
ing
s o
f N
eig
hb
orh
oo
d S
ervi
ces:
B
roo
klyn
Co
mm
un
ity
Bo
ard
#5
5852 7573 8374 7969 8682 8979
1.C
rime
2.H
ousi
ng
3.E
duca
tion
1.F
ire p
rote
ctio
n se
rvic
es
2.E
mer
genc
y m
edic
al
serv
ices
3.H
ouse
hold
gar
bage
pic
k-up
4.R
ecyc
ling
serv
ices
5.C
ondi
tion
of s
tree
t tre
es
1.A
vaila
bilit
y of
cul
tura
l ac
tiviti
es
2.C
ontr
ol o
f str
eet n
oise
3.M
aint
enan
ce o
f str
eets
an
d ro
ads
4.R
at c
ontr
ol
5.G
raffi
ti co
ntro
l

City
wid
e C
usto
mer
Sur
vey
Res
ults
15%
13%
49%
44%
42%
37% 29
%
32%
11% 12%
13%3
%
0%25
%50
%75
%10
0%
All N
ew Y
ork
City
Res
pond
ents
All B
rook
lyn
Res
pond
ents
All C
omm
unity
Boa
rd #
6 R
espo
nden
ts
Bac
kgro
un
d:
Bro
okl
yn C
om
mu
nit
y B
oar
d #
6S
urv
ey R
esp
on
ses:
Bro
okl
yn C
om
mu
nit
y B
oar
d #
6
Th
e N
eig
hb
orh
oo
ds
of
Bro
okl
yn
Co
mm
un
ity
Bo
ard
#6
Sour
ce: N
YC P
lann
ing
Dep
artm
ent
Res
ult
sfr
om
NY
C F
eed
bac
k C
ityw
ide
Cu
sto
mer
Su
rvey
Bro
okl
yn C
om
mu
nit
y B
oar
d #
6
Rat
ing
s o
f N
eig
hb
orh
oo
d a
s a
Pla
ce t
o L
ive
Rat
ing
s o
f O
vera
ll Q
ual
ity
of
Lif
e in
New
Yo
rk C
ity
Exce
llent
Poor
Fair
Goo
d
Exce
llent
Poor
Fair
Goo
d
Exce
llent
Poor
Fair
Goo
d
Rat
ing
s o
f O
vera
ll Q
ual
ity
of
New
Yo
rk C
ity
Go
vern
men
t S
ervi
ces
9%
45%
43%
56%
37%
40%
28%
12%
13%
5% 6%
7%
0%25
%50
%75
%10
0%
All N
ew Y
ork
City
Res
pond
ents
All B
rook
lyn
Res
pond
ents
All C
omm
unity
Boa
rd #
6 R
espo
nden
ts
38%
35%48
%
44%
46%
40%
15%
15%9%
4%3% 4%
0%25
%50
%75
%10
0%
All N
ew Y
ork
City
Res
pond
ents
All B
rook
lyn
Res
pond
ents
All C
omm
unity
Boa
rd #
6 R
espo
nden
ts
Gen
der
•M
ale:
47%
•F
emal
e: 5
3%A
ge •<
18 y
ears
old
: 21%
•18
-54
year
s ol
d: 6
0%•
55+
yea
rs o
ld: 1
9%
Rac
e/E
thn
icit
y•
Non
-His
pani
c W
hite
: 61%
•N
on-H
ispa
nic
Bla
ck: 8
%•
Non
-His
pani
c A
sian
: 7%
•H
ispa
nic:
22%
•O
ther
: 3%
Po
pu
lati
on
an
d H
ou
seh
old
s•
Tot
al P
opul
atio
n: 1
10,0
32•
Tot
al H
ouse
hold
s: 4
6,28
6
Med
ian
An
nu
al H
ou
seh
old
Inco
me
•$7
4,20
5(2
006
Infla
tion-
Adj
uste
d D
olla
rs)
•41
0 R
espo
nses
•27
.3%
Res
pons
e R
ate
•±4
.8%
Mar
gin
of E
rror
(95
% C
onfid
ence
Inte
rval
)
See
deta
il be
low
Sou
rce:
U.S
. Cen
sus
Bur
eau
-20
06 A
mer
ican
Com
mun
ity S
urve
y, P
opul
atio
n D
ivis
ion
-N
ew Y
ork
City
Dep
artm
ent o
f City
Pla
nnin
g

City
wid
e C
usto
mer
Sur
vey
Res
ults
12%
26%
45%
18%
7%21
%52
%20
%N
eig
hb
orh
oo
d
Pu
blic
Saf
ety
Ind
ex
14%
34%
42%
10%
13%
37%
42%
9%M
ass
Tra
nsi
t S
ervi
ces
Ind
ex
21%
34%
36%
9%
15%
31%
45%
10%
Str
eets
an
d
Sid
ewal
ks
Ind
ex
17%
29%
41%
13%
12%
26%
49%
14%
Cle
anin
g a
nd
M
ain
ten
ance
In
dex
25%
39%
30%
6%
29%
44%
24%
4%P
ub
licE
du
cati
on
In
dex
42%
35%
19%
4%
44%
39%
15%
2%S
oci
al S
up
po
rt
Ser
vice
s In
dex
Ind
ex
Sco
reP
oo
rF
air
Go
od
Exc
elle
nt
Sur
vey
resp
onde
nts
wer
e as
ked
to n
ame
wha
t the
y th
ough
t w
ere
the
thre
e m
ost i
mpo
rtan
t iss
ues
faci
ng N
ew Y
ork
City
. T
he th
ree
resp
onse
s m
ost c
omm
only
giv
en b
y B
rook
lyn
Com
mun
ity B
oard
#6
resp
onde
nts
are
liste
d be
low
.
Hig
hest
Rat
edLo
wes
t Rat
ed
Sur
vey
resp
onde
nts
rate
d 24
ser
vice
s in
thei
r ne
ighb
orho
od.
The
hig
hest
and
low
est r
ated
ser
vice
s ar
e di
spla
yed
belo
w.
NYC
All
Com
mun
ity B
oard
#6
Res
pond
ents
All
New
Yor
k C
ity R
espo
nden
ts
Ind
ex R
atin
gs:
Bro
okl
yn C
om
mu
nit
y B
oar
d #
6 C
om
par
ed t
o R
atin
gs
Giv
en b
y A
ll R
esp
on
den
tsM
ost
Imp
ort
ant
Issu
es F
acin
g N
ew Y
ork
C
ity:
Bro
okl
yn C
om
mu
nit
y B
oar
d #
6
Rat
ing
s o
f N
eig
hb
orh
oo
d S
ervi
ces:
B
roo
klyn
Co
mm
un
ity
Bo
ard
#6
5856 7571 8388 7985 8687 8993
1.E
duca
tion
2.H
ousi
ng
3.M
ass
Tra
nsit
1.E
mer
genc
y m
edic
al
serv
ices
2.F
ire p
rote
ctio
n se
rvic
es
3.N
eigh
borh
ood
park
s
4.N
eigh
borh
ood
play
grou
nds
5.P
ublic
libr
arie
s
1.C
ontr
ol o
f str
eet n
oise
2.S
torm
wat
er d
rain
age
and
sew
er m
aint
enan
ce
3.M
aint
enan
ce o
f si
dew
alks
4.M
aint
enan
ce o
f str
eets
an
d ro
ads
5.R
at c
ontr
ol

City
wid
e C
usto
mer
Sur
vey
Res
ults
15%
13%
16%
44%
42%49
%
29%
32%29
%
12%
13%6%
0%25
%50
%75
%10
0%
All N
ew Y
ork
City
Res
pond
ents
All B
rook
lyn
Res
pond
ents
All C
omm
unity
Boa
rd #
7 R
espo
nden
ts
Bac
kgro
un
d:
Bro
okl
yn C
om
mu
nit
y B
oar
d #
7S
urv
ey R
esp
on
ses:
Bro
okl
yn C
om
mu
nit
y B
oar
d #
7
Th
e N
eig
hb
orh
oo
ds
of
Bro
okl
yn
Co
mm
un
ity
Bo
ard
#7
Sour
ce: N
YC P
lann
ing
Dep
artm
ent
Res
ult
sfr
om
NY
C F
eed
bac
k C
ityw
ide
Cu
sto
mer
Su
rvey
Bro
okl
yn C
om
mu
nit
y B
oar
d #
7
Rat
ing
s o
f N
eig
hb
orh
oo
d a
s a
Pla
ce t
o L
ive
Rat
ing
s o
f O
vera
ll Q
ual
ity
of
Lif
e in
New
Yo
rk C
ity
Exce
llent
Poor
Fair
Goo
d
Exce
llent
Poor
Fair
Goo
d
Exce
llent
Poor
Fair
Goo
d
Rat
ing
s o
f O
vera
ll Q
ual
ity
of
New
Yo
rk C
ity
Go
vern
men
t S
ervi
ces
45%
43%53
%
37%
40%34
%
12%
13%
10%
5%3% 6%
0%25
%50
%75
%10
0%
All N
ew Y
ork
City
Res
pond
ents
All B
rook
lyn
Res
pond
ents
All C
omm
unity
Boa
rd #
7 R
espo
nden
ts
38%
35%
38%
44%
46%
44%
15%
15%
14%
4%
4%
4%
0%25
%50
%75
%10
0%
All N
ew Y
ork
City
Res
pond
ents
All B
rook
lyn
Res
pond
ents
All C
omm
unity
Boa
rd #
7 R
espo
nden
ts
Gen
der
•M
ale:
52%
•F
emal
e: 4
8%A
ge •<
18 y
ears
old
: 24%
•18
-54
year
s ol
d: 6
0%•
55+
yea
rs o
ld: 1
6%
Rac
e/E
thn
icit
y•
Non
-His
pani
c W
hite
: 23%
•N
on-H
ispa
nic
Bla
ck: 3
%•
Non
-His
pani
c A
sian
: 25%
•H
ispa
nic:
48%
•O
ther
: 1%
Po
pu
lati
on
an
d H
ou
seh
old
s•
Tot
al P
opul
atio
n: 1
53,0
66•
Tot
al H
ouse
hold
s: 4
6,10
4
Med
ian
An
nu
al H
ou
seh
old
Inco
me
•$4
6,86
7(2
006
Infla
tion-
Adj
uste
d D
olla
rs)
•41
5 R
espo
nses
•20
.8%
Res
pons
e R
ate
•±4
.8%
Mar
gin
of E
rror
(95
% C
onfid
ence
Inte
rval
)
Sou
rce:
U.S
. Cen
sus
Bur
eau
-20
06 A
mer
ican
Com
mun
ity S
urve
y, P
opul
atio
n D
ivis
ion
-N
ew Y
ork
City
Dep
artm
ent o
f City
Pla
nnin
g
See
deta
il be
low

City
wid
e C
usto
mer
Sur
vey
Res
ults
12%
26%
45%
18%
9%28
%47
%16
%N
eig
hb
orh
oo
d
Pu
blic
Saf
ety
Ind
ex
14%
34%
42%
10%
16%
36%
38%
9%M
ass
Tra
nsi
t S
ervi
ces
Ind
ex
21%
34%
36%
9%
20%
33%
40%
8%S
tree
ts a
nd
S
idew
alks
In
dex
17%
29%
41%
13%
15%
29%
44%
12%
Cle
anin
g a
nd
M
ain
ten
ance
In
dex
25%
39%
30%
6%
18%
45%
30%
6%P
ub
licE
du
cati
on
In
dex
42%
35%
19%
4%
41%
37%
18%
4%S
oci
al S
up
po
rt
Ser
vice
s In
dex
Ind
ex
Sco
reP
oo
rF
air
Go
od
Exc
elle
nt
Sur
vey
resp
onde
nts
wer
e as
ked
to n
ame
wha
t the
y th
ough
t w
ere
the
thre
e m
ost i
mpo
rtan
t iss
ues
faci
ng N
ew Y
ork
City
. T
he th
ree
resp
onse
s m
ost c
omm
only
giv
en b
y B
rook
lyn
Com
mun
ity B
oard
#7
resp
onde
nts
are
liste
d be
low
.
Hig
hest
Rat
edLo
wes
t Rat
ed
Sur
vey
resp
onde
nts
rate
d 24
ser
vice
s in
thei
r ne
ighb
orho
od.
The
hig
hest
and
low
est r
ated
ser
vice
s ar
e di
spla
yed
belo
w.
NYC
All
Com
mun
ity B
oard
#7
Res
pond
ents
All
New
Yor
k C
ity R
espo
nden
ts
Ind
ex R
atin
gs:
Bro
okl
yn C
om
mu
nit
y B
oar
d #
7 C
om
par
ed t
o R
atin
gs
Giv
en b
y A
ll R
esp
on
den
tsM
ost
Imp
ort
ant
Issu
es F
acin
g N
ew Y
ork
C
ity:
Bro
okl
yn C
om
mu
nit
y B
oar
d #
7
Rat
ing
s o
f N
eig
hb
orh
oo
d S
ervi
ces:
B
roo
klyn
Co
mm
un
ity
Bo
ard
#7
5859 7582 8385 7980 8684 8991
1.H
ousi
ng
2.E
duca
tion
3.M
ass
Tra
nsit
1.F
ire p
rote
ctio
n se
rvic
es
2.E
mer
genc
y m
edic
al
serv
ices
3.H
ouse
hold
gar
bage
pic
k-up
4.R
ecyc
ling
serv
ices
5.A
vaila
bilit
y of
hea
lth c
are
serv
ices
1.C
ontr
ol o
f str
eet n
oise
2.A
vaila
bilit
y of
cul
tura
l ac
tiviti
es
3.M
aint
enan
ce o
f str
eets
an
d ro
ads
4.R
at c
ontr
ol
5.G
raffi
ti co
ntro
l

City
wid
e C
usto
mer
Sur
vey
Res
ults
15%
13%
12%
44%
42%
40%
29%
32%
30%
12%
13%
18%
0%25
%50
%75
%10
0%
All N
ew Y
ork
City
Res
pond
ents
All B
rook
lyn
Res
pond
ents
All C
omm
unity
Boa
rd #
8 R
espo
nden
ts
Bac
kgro
un
d:
Bro
okl
yn C
om
mu
nit
y B
oar
d #
8S
urv
ey R
esp
on
ses:
Bro
okl
yn C
om
mu
nit
y B
oar
d #
8
Th
e N
eig
hb
orh
oo
ds
of
Bro
okl
yn
Co
mm
un
ity
Bo
ard
#8
Sour
ce: N
YC P
lann
ing
Dep
artm
ent
Res
ult
sfr
om
NY
C F
eed
bac
k C
ityw
ide
Cu
sto
mer
Su
rvey
Bro
okl
yn C
om
mu
nit
y B
oar
d #
8
Rat
ing
s o
f N
eig
hb
orh
oo
d a
s a
Pla
ce t
o L
ive
Rat
ing
s o
f O
vera
ll Q
ual
ity
of
Lif
e in
New
Yo
rk C
ity
Exce
llent
Poor
Fair
Goo
d
Exce
llent
Poor
Fair
Goo
d
Exce
llent
Poor
Fair
Goo
d
Rat
ing
s o
f O
vera
ll Q
ual
ity
of
New
Yo
rk C
ity
Go
vern
men
t S
ervi
ces
9%
45%
43%
38%
37%
40%
43%
12%
13%
11%
5% 6%
0%25
%50
%75
%10
0%
All N
ew Y
ork
City
Res
pond
ents
All B
rook
lyn
Res
pond
ents
All C
omm
unity
Boa
rd #
8 R
espo
nden
ts
38%
35%
31%
44%
46%
50%
15%
15%
13%
4%5% 4%
0%25
%50
%75
%10
0%
All N
ew Y
ork
City
Res
pond
ents
All B
rook
lyn
Res
pond
ents
All C
omm
unity
Boa
rd #
8 R
espo
nden
ts
Gen
der
•M
ale:
46%
•F
emal
e: 5
4%A
ge •<
18 y
ears
old
: 25%
•18
-54
year
s ol
d: 5
6%•
55+
yea
rs o
ld: 1
8%
Rac
e/E
thn
icit
y•
Non
-His
pani
c W
hite
: 13%
•N
on-H
ispa
nic
Bla
ck: 7
4%•
Non
-His
pani
c A
sian
: 2%
•H
ispa
nic:
10%
•O
ther
: 2%
Po
pu
lati
on
an
d H
ou
seh
old
s•
Tot
al P
opul
atio
n:12
7,01
3•
Tot
al H
ouse
hold
s: 4
8,22
6
Med
ian
An
nu
al H
ou
seh
old
Inco
me
•$3
8,52
4(2
006
Infla
tion-
Adj
uste
d D
olla
rs)
•39
6 R
espo
nses
•16
.8%
Res
pons
e R
ate
•±4
.9%
Mar
gin
of E
rror
(95
% C
onfid
ence
Inte
rval
)
See
deta
il be
low
Sou
rce:
U.S
. Cen
sus
Bur
eau
-20
06 A
mer
ican
Com
mun
ity S
urve
y, P
opul
atio
n D
ivis
ion
-N
ew Y
ork
City
Dep
artm
ent o
f City
Pla
nnin
g

City
wid
e C
usto
mer
Sur
vey
Res
ults
12%
26%
45%
18%
17%
30%
40%
13%
Nei
gh
bo
rho
od
P
ub
lic S
afet
y In
dex
14%
34%
42%
10%
11%
32%
42%
15%
Mas
s T
ran
sit
Ser
vice
s In
dex
21%
34%
36%
9%
23%
32%
35%
10%
Str
eets
an
d
Sid
ewal
ks
Ind
ex
17%
29%
41%
13%
19%
32%
37%
11%
Cle
anin
g a
nd
M
ain
ten
ance
In
dex
25%
39%
30%
6%
34%
40%
21%
6%P
ub
licE
du
cati
on
In
dex
42%
35%
19%
4%
54%
29%
13%
3%S
oci
al S
up
po
rt
Ser
vice
s In
dex
Ind
ex
Sco
reP
oo
rF
air
Go
od
Exc
elle
nt
Sur
vey
resp
onde
nts
wer
e as
ked
to n
ame
wha
t the
y th
ough
t w
ere
the
thre
e m
ost i
mpo
rtan
t iss
ues
faci
ng N
ew Y
ork
City
. T
he th
ree
resp
onse
s m
ost c
omm
only
giv
en b
y B
rook
lyn
Com
mun
ity B
oard
#8
resp
onde
nts
are
liste
d be
low
.
Hig
hest
Rat
edLo
wes
t Rat
ed
Sur
vey
resp
onde
nts
rate
d 24
ser
vice
s in
thei
r ne
ighb
orho
od.
The
hig
hest
and
low
est r
ated
ser
vice
s ar
e di
spla
yed
belo
w.
NYC
All
Com
mun
ity B
oard
#8
Res
pond
ents
All
New
Yor
k C
ity R
espo
nden
ts
Ind
ex R
atin
gs:
Bro
okl
yn C
om
mu
nit
y B
oar
d #
8 C
om
par
ed t
o R
atin
gs
Giv
en b
y A
ll R
esp
on
den
tsM
ost
Imp
ort
ant
Issu
es F
acin
g N
ew Y
ork
C
ity:
Bro
okl
yn C
om
mu
nit
y B
oar
d #
8
Rat
ing
s o
f N
eig
hb
orh
oo
d S
ervi
ces:
B
roo
klyn
Co
mm
un
ity
Bo
ard
#8
5846 7566 8381 7977 8689 8983
1.H
ousi
ng
2.E
duca
tion
3.Jo
bs
1.F
ire p
rote
ctio
n se
rvic
es
2.E
mer
genc
y m
edic
al
serv
ices
3.P
ublic
libr
arie
s
4.H
ouse
hold
gar
bage
pic
k-up
5.P
arki
ng e
nfor
cem
ent
1.C
ontr
ol o
f str
eet n
oise
2.R
at c
ontr
ol
3.C
rime
cont
rol
4.M
aint
enan
ce o
f str
eets
an
d ro
ads
5.M
aint
enan
ce o
f si
dew
alks

City
wid
e C
usto
mer
Sur
vey
Res
ults
15%
13%
44%
42%
37%
29%
32%
41%
12%
13%
15%
6%
0%25
%50
%75
%10
0%
All N
ew Y
ork
City
Res
pond
ents
All B
rook
lyn
Res
pond
ents
All C
omm
unity
Boa
rd #
9 R
espo
nden
ts
Bac
kgro
un
d:
Bro
okl
yn C
om
mu
nit
y B
oar
d #
9S
urv
ey R
esp
on
ses:
Bro
okl
yn C
om
mu
nit
y B
oar
d #
9
Th
e N
eig
hb
orh
oo
ds
of
Bro
okl
yn
Co
mm
un
ity
Bo
ard
#9
Sour
ce: N
YC P
lann
ing
Dep
artm
ent
Res
ult
sfr
om
NY
C F
eed
bac
k C
ityw
ide
Cu
sto
mer
Su
rvey
Bro
okl
yn C
om
mu
nit
y B
oar
d #
9
Rat
ing
s o
f N
eig
hb
orh
oo
d a
s a
Pla
ce t
o L
ive
Rat
ing
s o
f O
vera
ll Q
ual
ity
of
Lif
e in
New
Yo
rk C
ity
Exce
llent
Poor
Fair
Goo
d
Exce
llent
Poor
Fair
Goo
d
Exce
llent
Poor
Fair
Goo
d
Rat
ing
s o
f O
vera
ll Q
ual
ity
of
New
Yo
rk C
ity
Go
vern
men
t S
ervi
ces
45%
43%
39%
37%
40%
39%
12%
13%
17%
5%4% 6%
0%25
%50
%75
%10
0%
All N
ew Y
ork
City
Res
pond
ents
All B
rook
lyn
Res
pond
ents
All C
omm
unity
Boa
rd #
9 R
espo
nden
ts
38%
35%
34%
44%
46%
47%
15%
15%
16%
4%
3% 4%
0%25
%50
%75
%10
0%
All N
ew Y
ork
City
Res
pond
ents
All B
rook
lyn
Res
pond
ents
All C
omm
unity
Boa
rd #
9 R
espo
nden
ts
Gen
der
•M
ale:
44%
•F
emal
e: 5
6%A
ge •<
18 y
ears
old
: 25%
•18
-54
year
s ol
d: 5
5%•
55+
yea
rs o
ld: 2
0%
Rac
e/E
thn
icit
y•
Non
-His
pani
c W
hite
: 14%
•N
on-H
ispa
nic
Bla
ck: 7
5%•
Non
-His
pani
c A
sian
: 1%
•H
ispa
nic:
8%
•O
ther
: 2%
Po
pu
lati
on
an
d H
ou
seh
old
s•
Tot
al P
opul
atio
n: 1
10,3
33•
Tot
al H
ouse
hold
s: 3
9,79
4
Med
ian
An
nu
al H
ou
seh
old
Inco
me
•$3
4,15
1(2
006
Infla
tion-
Adj
uste
d D
olla
rs)
•35
6 R
espo
nses
•13
.0%
Res
pons
e R
ate
•±5
.2%
Mar
gin
of E
rror
(95
% C
onfid
ence
Inte
rval
)
See
deta
il be
low
Sou
rce:
U.S
. Cen
sus
Bur
eau
-20
06 A
mer
ican
Com
mun
ity S
urve
y, P
opul
atio
n D
ivis
ion
-N
ew Y
ork
City
Dep
artm
ent o
f City
Pla
nnin
g

City
wid
e C
usto
mer
Sur
vey
Res
ults
12%
26%
45%
18%
19%
30%
38%
12%
Nei
gh
bo
rho
od
P
ub
lic S
afet
y In
dex
14%
34%
42%
10%
14%
33%
43%
10%
Mas
s T
ran
sit
Ser
vice
s In
dex
21%
34%
36%
9%
24%
35%
33%
8%S
tree
ts a
nd
S
idew
alks
In
dex
17%
29%
41%
13%
21%
33%
36%
10%
Cle
anin
g a
nd
M
ain
ten
ance
In
dex
25%
39%
30%
6%
32%
44%
22%
3%P
ub
licE
du
cati
on
In
dex
42%
35%
19%
4%
49%
33%
16%
2%S
oci
al S
up
po
rt
Ser
vice
s In
dex
Ind
ex
Sco
reP
oo
rF
air
Go
od
Exc
elle
nt
Sur
vey
resp
onde
nts
wer
e as
ked
to n
ame
wha
t the
y th
ough
t w
ere
the
thre
e m
ost i
mpo
rtan
t iss
ues
faci
ng N
ew Y
ork
City
. T
he th
ree
resp
onse
s m
ost c
omm
only
giv
en b
y B
rook
lyn
Com
mun
ity B
oard
#9
resp
onde
nts
are
liste
d be
low
.
Hig
hest
Rat
edLo
wes
t Rat
ed
Sur
vey
resp
onde
nts
rate
d 24
ser
vice
s in
thei
r ne
ighb
orho
od.
The
hig
hest
and
low
est r
ated
ser
vice
s ar
e di
spla
yed
belo
w.
NYC
All
Com
mun
ity B
oard
#9
Res
pond
ents
All
New
Yor
k C
ity R
espo
nden
ts
Ind
ex R
atin
gs:
Bro
okl
yn C
om
mu
nit
y B
oar
d #
9 C
om
par
ed t
o R
atin
gs
Giv
en b
y A
ll R
esp
on
den
tsM
ost
Imp
ort
ant
Issu
es F
acin
g N
ew Y
ork
C
ity:
Bro
okl
yn C
om
mu
nit
y B
oar
d #
9
Rat
ing
s o
f N
eig
hb
orh
oo
d S
ervi
ces:
B
roo
klyn
Co
mm
un
ity
Bo
ard
#9
5851 7568 8379 7976 8686 8981
1.H
ousi
ng
2.C
rime
3.Jo
bs
1.F
ire p
rote
ctio
n se
rvic
es
2.E
mer
genc
y m
edic
al
serv
ices
3.P
ublic
libr
arie
s
4.H
ouse
hold
gar
bage
pic
k-up
5.A
vaila
bilit
y of
hea
lth c
are
serv
ices
1.R
at c
ontr
ol
2.C
ontr
ol o
f str
eet n
oise
3.P
olic
e-C
omm
unity
re
latio
ns
4.C
rime
cont
rol
5.S
torm
wat
er d
rain
age
and
sew
er m
aint
enan
ce

City
wid
e C
usto
mer
Sur
vey
Res
ults
15%
13%24
%
44%
42%
57%
29%
32%
15% 12
%
13%4
%
0%25
%50
%75
%10
0%
All N
ew Y
ork
City
Res
pond
ents
All B
rook
lyn
Res
pond
ents
All C
omm
unity
Boa
rd #
10 R
espo
nden
ts
Bac
kgro
un
d:
Bro
okl
yn C
om
mu
nit
y B
oar
d #
10S
urv
ey R
esp
on
ses:
Bro
okl
yn C
om
mu
nit
y B
oar
d #
10
Th
e N
eig
hb
orh
oo
ds
of
Bro
okl
yn
Co
mm
un
ity
Bo
ard
#10
Sour
ce: N
YC P
lann
ing
Dep
artm
ent
Res
ult
sfr
om
NY
C F
eed
bac
k C
ityw
ide
Cu
sto
mer
Su
rvey
Bro
okl
yn C
om
mu
nit
y B
oar
d #
10
Rat
ing
s o
f N
eig
hb
orh
oo
d a
s a
Pla
ce t
o L
ive
Rat
ing
s o
f O
vera
ll Q
ual
ity
of
Lif
e in
New
Yo
rk C
ity
Exce
llent
Poor
Fair
Goo
d
Exce
llent
Poor
Fair
Goo
d
Exce
llent
Poor
Fair
Goo
d
Rat
ing
s o
f O
vera
ll Q
ual
ity
of
New
Yo
rk C
ity
Go
vern
men
t S
ervi
ces
45%
43%50
%
37%
40%33
%
12%
13%
11%
5%5% 6%
0%25
%50
%75
%10
0%
All N
ew Y
ork
City
Res
pond
ents
All B
rook
lyn
Res
pond
ents
All C
omm
unity
Boa
rd #
10 R
espo
nden
ts
38%
35%
38%
44%
46%
43%
15%
15%
14%
4%5% 4%
0%25
%50
%75
%10
0%
All N
ew Y
ork
City
Res
pond
ents
All B
rook
lyn
Res
pond
ents
All C
omm
unity
Boa
rd #
10 R
espo
nden
ts
Gen
der
•M
ale:
50%
•F
emal
e: 5
0%A
ge •<
18 y
ears
old
: 19%
•18
-54
year
s ol
d: 5
5%•
55+
yea
rs o
ld: 2
6%
Rac
e/E
thn
icit
y•
Non
-His
pani
c W
hite
: 65%
•N
on-H
ispa
nic
Bla
ck: 2
%•
Non
-His
pani
c A
sian
: 17%
•H
ispa
nic:
16%
•O
ther
: 1%
Po
pu
lati
on
an
d H
ou
seh
old
s•
Tot
al P
opul
atio
n: 1
23,4
47•
Tot
al H
ouse
hold
s: 4
6,83
8
Med
ian
An
nu
al H
ou
seh
old
Inco
me
•$5
5,09
3(2
006
Infla
tion-
Adj
uste
d D
olla
rs)
•36
5 R
espo
nses
•22
.3%
Res
pons
e R
ate
•±5
.1%
Mar
gin
of E
rror
(95
% C
onfid
ence
Inte
rval
)
See
deta
il be
low
Sou
rce:
U.S
. Cen
sus
Bur
eau
-20
06 A
mer
ican
Com
mun
ity S
urve
y, P
opul
atio
n D
ivis
ion
-N
ew Y
ork
City
Dep
artm
ent o
f City
Pla
nnin
g

City
wid
e C
usto
mer
Sur
vey
Res
ults
12%
26%
45%
18%
6%26
%47
%21
%N
eig
hb
orh
oo
d
Pu
blic
Saf
ety
Ind
ex
14%
34%
42%
10%
11%
37%
42%
10%
Mas
s T
ran
sit
Ser
vice
s In
dex
21%
34%
36%
9%
14%
31%
43%
11%
Str
eets
an
d
Sid
ewal
ks
Ind
ex
17%
29%
41%
13%
10%
24%
46%
21%
Cle
anin
g a
nd
M
ain
ten
ance
In
dex
25%
39%
30%
6%
28%
44%
24%
4%P
ub
licE
du
cati
on
In
dex
42%
35%
19%
4%
47%
32%
19%
2%S
oci
al S
up
po
rt
Ser
vice
s In
dex
Ind
ex
Sco
reP
oo
rF
air
Go
od
Exc
elle
nt
Sur
vey
resp
onde
nts
wer
e as
ked
to n
ame
wha
t the
y th
ough
t w
ere
the
thre
e m
ost i
mpo
rtan
t iss
ues
faci
ng N
ew Y
ork
City
. T
he th
ree
resp
onse
s m
ost c
omm
only
giv
en b
y B
ronx
C
omm
unity
Boa
rd #
10 r
espo
nden
ts a
re li
sted
bel
ow.
Hig
hest
Rat
edLo
wes
t Rat
ed
Sur
vey
resp
onde
nts
rate
d 24
ser
vice
s in
thei
r ne
ighb
orho
od.
The
hig
hest
and
low
est r
ated
ser
vice
s ar
e di
spla
yed
belo
w.
NYC
All
Com
mun
ity B
oard
#10
Res
pond
ents
All
New
Yor
k C
ity R
espo
nden
ts
Ind
ex R
atin
gs:
Bro
nx
Co
mm
un
ity
Bo
ard
#10
C
om
par
ed t
o R
atin
gs
Giv
en b
y A
ll R
esp
on
den
tsM
ost
Imp
ort
ant
Issu
es F
acin
g N
ew Y
ork
C
ity:
Bro
nx
Co
mm
un
ity
Bo
ard
#10
Rat
ing
s o
f N
eig
hb
orh
oo
d S
ervi
ces:
B
ron
x C
om
mu
nit
y B
oar
d #
10
5853 7572 8390 7986 8689 8994
1.C
rime
2.H
ousi
ng
3.E
duca
tion
1.F
ire p
rote
ctio
n se
rvic
es
2.E
mer
genc
y m
edic
al
serv
ices
3.H
ouse
hold
gar
bage
pic
k-up
4.C
lean
lines
s of
you
r ne
ighb
orho
od
5.R
ecyc
ling
serv
ices
1.A
vaila
bilit
y of
cul
tura
l ac
tiviti
es
2.S
torm
wat
er d
rain
age
and
sew
er m
aint
enan
ce
3.M
aint
enan
ce o
f str
eets
an
d ro
ads
4.G
raffi
ti co
ntro
l
5.P
edes
tria
n sa
fety
(c
ross
ing
inte
rsec
tions
)

City
wid
e C
usto
mer
Sur
vey
Res
ults
15%
13%
10%
44%
42%
52%
29%
32%32
%
12%
13%6%
0%25
%50
%75
%10
0%
All N
ew Y
ork
City
Res
pond
ents
All B
rook
lyn
Res
pond
ents
All C
omm
unity
Boa
rd #
11 R
espo
nden
ts
Bac
kgro
un
d:
Bro
okl
yn C
om
mu
nit
y B
oar
d #
11S
urv
ey R
esp
on
ses:
Bro
okl
yn C
om
mu
nit
y B
oar
d #
11
Th
e N
eig
hb
orh
oo
ds
of
Bro
okl
yn
Co
mm
un
ity
Bo
ard
#11 So
urce
: NYC
Pla
nnin
g D
epar
tmen
t
Res
ult
sfr
om
NY
C F
eed
bac
k C
ityw
ide
Cu
sto
mer
Su
rvey
Bro
okl
yn C
om
mu
nit
y B
oar
d #
11
Rat
ing
s o
f N
eig
hb
orh
oo
d a
s a
Pla
ce t
o L
ive
Rat
ing
s o
f O
vera
ll Q
ual
ity
of
Lif
e in
New
Yo
rk C
ity
Exce
llent
Poor
Fair
Goo
d
Exce
llent
Poor
Fair
Goo
d
Exce
llent
Poor
Fair
Goo
d
Rat
ing
s o
f O
vera
ll Q
ual
ity
of
New
Yo
rk C
ity
Go
vern
men
t S
ervi
ces
45%
43%
39%
37%
40%
47%
12%
13%
10%
6%4% 5%
0%25
%50
%75
%10
0%
All N
ew Y
ork
City
Res
pond
ents
All B
rook
lyn
Res
pond
ents
All C
omm
unity
Boa
rd #
11 R
espo
nden
ts
38%
35%
36%
44%
46%
44%
15%
15%
14%
4%5% 4%
0%25
%50
%75
%10
0%
All N
ew Y
ork
City
Res
pond
ents
All B
rook
lyn
Res
pond
ents
All C
omm
unity
Boa
rd #
11 R
espo
nden
ts
Gen
der
•M
ale:
48%
•F
emal
e: 5
2%A
ge •<
18 y
ears
old
: 21%
•18
-54
year
s ol
d: 5
0%•
55+
yea
rs o
ld: 2
9%
Rac
e/E
thn
icit
y•
Non
-His
pani
c W
hite
: 59%
•N
on-H
ispa
nic
Bla
ck: 0
%•
Non
-His
pani
c A
sian
: 30%
•H
ispa
nic:
10%
•O
ther
: 1%
Po
pu
lati
on
an
d H
ou
seh
old
s•
Tot
al P
opul
atio
n: 1
74,5
93•
Tot
al H
ouse
hold
s: 6
1,21
0
Med
ian
An
nu
al H
ou
seh
old
Inco
me
•$3
8,71
4(2
006
Infla
tion-
Adj
uste
d D
olla
rs)
•37
6 R
espo
nses
•21
.8%
Res
pons
e R
ate
•±5
.1%
Mar
gin
of E
rror
(95
% C
onfid
ence
Inte
rval
)
Sou
rce:
U.S
. Cen
sus
Bur
eau
-20
06 A
mer
ican
Com
mun
ity S
urve
y, P
opul
atio
n D
ivis
ion
-N
ew Y
ork
City
Dep
artm
ent o
f City
Pla
nnin
g
See
deta
il be
low

City
wid
e C
usto
mer
Sur
vey
Res
ults
12%
26%
45%
18%
7%26
%49
%18
%N
eig
hb
orh
oo
d
Pu
blic
Saf
ety
Ind
ex
14%
34%
42%
10%
14%
35%
44%
7%M
ass
Tra
nsi
t S
ervi
ces
Ind
ex
21%
34%
36%
9%
18%
35%
39%
8%S
tree
ts a
nd
S
idew
alks
In
dex
17%
29%
41%
13%
14%
29%
47%
11%
Cle
anin
g a
nd
M
ain
ten
ance
In
dex
25%
39%
30%
6%
17%
39%
38%
5%P
ub
licE
du
cati
on
In
dex
42%
35%
19%
4%
34%
33%
29%
4%S
oci
al S
up
po
rt
Ser
vice
s In
dex
Ind
ex
Sco
reP
oo
rF
air
Go
od
Exc
elle
nt
Sur
vey
resp
onde
nts
wer
e as
ked
to n
ame
wha
t the
y th
ough
t w
ere
the
thre
e m
ost i
mpo
rtan
t iss
ues
faci
ng N
ew Y
ork
City
. T
he th
ree
resp
onse
s m
ost c
omm
only
giv
en b
y B
rook
lyn
Com
mun
ity B
oard
#11
res
pond
ents
are
list
ed b
elow
.
Hig
hest
Rat
edLo
wes
t Rat
ed
Sur
vey
resp
onde
nts
rate
d 24
ser
vice
s in
thei
r ne
ighb
orho
od.
The
hig
hest
and
low
est r
ated
ser
vice
s ar
e di
spla
yed
belo
w.
NYC
All
Com
mun
ity B
oard
#11
Res
pond
ents
All
New
Yor
k C
ity R
espo
nden
ts
Ind
ex R
atin
gs:
Bro
okl
yn C
om
mu
nit
y B
oar
d #
11
Co
mp
ared
to
Rat
ing
s G
iven
by
All
Res
po
nd
ents
Mo
st Im
po
rtan
t Is
sues
Fac
ing
New
Yo
rk
Cit
y: B
roo
klyn
Co
mm
un
ity
Bo
ard
#11
Rat
ing
s o
f N
eig
hb
orh
oo
d S
ervi
ces:
B
roo
klyn
Co
mm
un
ity
Bo
ard
#11
5866 7583 8386 7982 8686 8993
1.C
rime
2.E
duca
tion
3.M
ass
Tra
nsit
1.F
ire p
rote
ctio
n se
rvic
es
2.E
mer
genc
y m
edic
al
serv
ices
3.P
ublic
libr
arie
s
4.H
ouse
hold
gar
bage
pic
k-up
5.R
ecyc
ling
serv
ices
1.A
vaila
bilit
y of
cul
tura
l ac
tiviti
es
2.C
ontr
ol o
f str
eet n
oise
3.M
aint
enan
ce o
f str
eets
an
d ro
ads
4.S
torm
wat
er d
rain
age
and
sew
er m
aint
enan
ce
5.G
raffi
ti co
ntro
l

City
wid
e C
usto
mer
Sur
vey
Res
ults
15%
13%
15%
44%
42%51
%
29%
32%25
%
12%
13%8%
0%25
%50
%75
%10
0%
All N
ew Y
ork
City
Res
pond
ents
All B
rook
lyn
Res
pond
ents
All C
omm
unity
Boa
rd #
12 R
espo
nden
ts
Bac
kgro
un
d:
Bro
okl
yn C
om
mu
nit
y B
oar
d #
12S
urv
ey R
esp
on
ses:
Bro
okl
yn C
om
mu
nit
y B
oar
d #
12
Th
e N
eig
hb
orh
oo
ds
of
Bro
okl
yn
Co
mm
un
ity
Bo
ard
#12
Sour
ce: N
YC P
lann
ing
Dep
artm
ent
Res
ult
sfr
om
NY
C F
eed
bac
k C
ityw
ide
Cu
sto
mer
Su
rvey
Bro
okl
yn C
om
mu
nit
y B
oar
d #
12
Rat
ing
s o
f N
eig
hb
orh
oo
d a
s a
Pla
ce t
o L
ive
Rat
ing
s o
f O
vera
ll Q
ual
ity
of
Lif
e in
New
Yo
rk C
ity
Exce
llent
Poor
Fair
Goo
d
Exce
llent
Poor
Fair
Goo
d
Exce
llent
Poor
Fair
Goo
d
Rat
ing
s o
f O
vera
ll Q
ual
ity
of
New
Yo
rk C
ity
Go
vern
men
t S
ervi
ces
45%
43%50
%
37%
40%35
%
12%
13%
5%7% 6%
9%
0%25
%50
%75
%10
0%
All N
ew Y
ork
City
Res
pond
ents
All B
rook
lyn
Res
pond
ents
All C
omm
unity
Boa
rd #
12 R
espo
nden
ts
38%
35%40
%
44%
46%41
%
15%
15%
11%
4%8% 4%
0%25
%50
%75
%10
0%
All N
ew Y
ork
City
Res
pond
ents
All B
rook
lyn
Res
pond
ents
All C
omm
unity
Boa
rd #
12 R
espo
nden
ts
Gen
der
•M
ale:
51%
•F
emal
e: 4
9%A
ge •<
18 y
ears
old
: 37%
•18
-54
year
s ol
d: 4
3%•
55+
yea
rs o
ld: 2
0%
Rac
e/E
thn
icit
y•
Non
-His
pani
c W
hite
: 71%
•N
on-H
ispa
nic
Bla
ck: 3
%•
Non
-His
pani
c A
sian
: 13%
•H
ispa
nic:
11%
•O
ther
: 2%
Po
pu
lati
on
an
d H
ou
seh
old
s•
Tot
al P
opul
atio
n: 1
55,5
09•
Tot
al H
ouse
hold
s: 4
5,04
2
Med
ian
An
nu
al H
ou
seh
old
Inco
me
•$4
0,04
0(2
006
Infla
tion-
Adj
uste
d D
olla
rs)
•37
2 R
espo
nses
•14
.9%
Res
pons
e R
ate
•±5
.1%
Mar
gin
of E
rror
(95
% C
onfid
ence
Inte
rval
)
Sou
rce:
U.S
. Cen
sus
Bur
eau
-20
06 A
mer
ican
Com
mun
ity S
urve
y, P
opul
atio
n D
ivis
ion
-N
ew Y
ork
City
Dep
artm
ent o
f City
Pla
nnin
g
See
deta
il be
low

City
wid
e C
usto
mer
Sur
vey
Res
ults
12%
26%
45%
18%
7%23
%48
%22
%N
eig
hb
orh
oo
d
Pu
blic
Saf
ety
Ind
ex
14%
34%
42%
10%
12%
32%
44%
12%
Mas
s T
ran
sit
Ser
vice
s In
dex
21%
34%
36%
9%
22%
34%
36%
8%S
tree
ts a
nd
S
idew
alks
In
dex
17%
29%
41%
13%
16%
31%
42%
12%
Cle
anin
g a
nd
M
ain
ten
ance
In
dex
25%
39%
30%
6%
24%
34%
32%
10%
Pu
blic
Ed
uca
tio
n
Ind
ex
42%
35%
19%
4%
30%
31%
29%
11%
So
cial
Su
pp
ort
S
ervi
ces
Ind
ex
Ind
ex
Sco
reP
oo
rF
air
Go
od
Exc
elle
nt
Sur
vey
resp
onde
nts
wer
e as
ked
to n
ame
wha
t the
y th
ough
t w
ere
the
thre
e m
ost i
mpo
rtan
t iss
ues
faci
ng N
ew Y
ork
City
. T
he th
ree
resp
onse
s m
ost c
omm
only
giv
en b
y B
rook
lyn
Com
mun
ity B
oard
#12
res
pond
ents
are
list
ed b
elow
.
Hig
hest
Rat
edLo
wes
t Rat
ed
Sur
vey
resp
onde
nts
rate
d 24
ser
vice
s in
thei
r ne
ighb
orho
od.
The
hig
hest
and
low
est r
ated
ser
vice
s ar
e di
spla
yed
belo
w.
NYC
All
Com
mun
ity B
oard
#12
Res
pond
ents
All
New
Yor
k C
ity R
espo
nden
ts
Ind
ex R
atin
gs:
Bro
okl
yn C
om
mu
nit
y B
oar
d #
12
Co
mp
ared
to
Rat
ing
s G
iven
by
All
Res
po
nd
ents
Mo
st Im
po
rtan
t Is
sues
Fac
ing
New
Yo
rk
Cit
y: B
roo
klyn
Co
mm
un
ity
Bo
ard
#12
Rat
ing
s o
f N
eig
hb
orh
oo
d S
ervi
ces:
B
roo
klyn
Co
mm
un
ity
Bo
ard
#12
5870 7576 8384 7978 8688 8993
1.H
ousi
ng
2.E
duca
tion
3.C
ost o
f liv
ing
1.F
ire p
rote
ctio
n se
rvic
es
2.E
mer
genc
y m
edic
al
serv
ices
3.H
ouse
hold
gar
bage
pic
k-up
4.P
ublic
libr
arie
s
5.S
ubw
ay s
ervi
ces
1.C
ontr
ol o
f str
eet n
oise
2.A
vaila
bilit
y of
cul
tura
l ac
tiviti
es
3.M
aint
enan
ce o
f str
eets
an
d ro
ads
4.C
lean
lines
s of
you
r ne
ighb
orho
od
5.M
aint
enan
ce o
f si
dew
alks

City
wid
e C
usto
mer
Sur
vey
Res
ults
15%
13%
10%
44%
42%
45%
29%
32%
31%
12%
13%
15%
0%25
%50
%75
%10
0%
All N
ew Y
ork
City
Res
pond
ents
All B
rook
lyn
Res
pond
ents
All C
omm
unity
Boa
rd #
13 R
espo
nden
ts
Bac
kgro
un
d:
Bro
okl
yn C
om
mu
nit
y B
oar
d #
13S
urv
ey R
esp
on
ses:
Bro
okl
yn C
om
mu
nit
y B
oar
d #
13
Th
e N
eig
hb
orh
oo
ds
of
Bro
okl
ynC
om
mu
nit
y B
oar
d #
13
Sour
ce: N
YC P
lann
ing
Dep
artm
ent
Res
ult
sfr
om
NY
C F
eed
bac
k C
ityw
ide
Cu
sto
mer
Su
rvey
Bro
okl
yn C
om
mu
nit
y B
oar
d #
13
Rat
ing
s o
f N
eig
hb
orh
oo
d a
s a
Pla
ce t
o L
ive
Rat
ing
s o
f O
vera
ll Q
ual
ity
of
Lif
e in
New
Yo
rk C
ity
Exce
llent
Poor
Fair
Goo
d
Exce
llent
Poor
Fair
Goo
d
Exce
llent
Poor
Fair
Goo
d
Rat
ing
s o
f O
vera
ll Q
ual
ity
of
New
Yo
rk C
ity
Go
vern
men
t S
ervi
ces
45%
43%
47%
37%
40%38
%
12%
13%
5%4% 6%
10
%
0%25
%50
%75
%10
0%
All N
ew Y
ork
City
Res
pond
ents
All B
rook
lyn
Res
pond
ents
All C
omm
unity
Boa
rd #
13 R
espo
nden
ts
38%
35%39
%
44%
46%41
%
15%
15%
14%
4%6% 4%
0%25
%50
%75
%10
0%
All N
ew Y
ork
City
Res
pond
ents
All B
rook
lyn
Res
pond
ents
All C
omm
unity
Boa
rd #
13 R
espo
nden
ts
Gen
der
•M
ale:
46%
•F
emal
e: 5
4%A
ge •<
18 y
ears
old
: 17%
•18
-54
year
s ol
d: 4
3%•
55+
yea
rs o
ld: 3
9%
Rac
e/E
thn
icit
y•
Non
-His
pani
c W
hite
: 63%
•N
on-H
ispa
nic
Bla
ck: 1
2%•
Non
-His
pani
c A
sian
: 10%
•H
ispa
nic:
15%
•O
ther
: 0%
Po
pu
lati
on
an
d H
ou
seh
old
s•
Tot
al P
opul
atio
n: 1
03,6
87•
Tot
al H
ouse
hold
s: 4
3,21
5
Med
ian
An
nu
al H
ou
seh
old
Inco
me
•$2
7,98
3(2
006
Infla
tion-
Adj
uste
d D
olla
rs)
•43
2 R
espo
nses
•16
.4%
Res
pons
e R
ate
•±4
.7%
Mar
gin
of E
rror
(95
% C
onfid
ence
Inte
rval
)
Sou
rce:
U.S
. Cen
sus
Bur
eau
-20
06 A
mer
ican
Com
mun
ity S
urve
y, P
opul
atio
n D
ivis
ion
-N
ew Y
ork
City
Dep
artm
ent o
f City
Pla
nnin
g
See
deta
il be
low

City
wid
e C
usto
mer
Sur
vey
Res
ults
12%
26%
45%
18%
10%
26%
49%
14%
Nei
gh
bo
rho
od
P
ub
lic S
afet
y In
dex
14%
34%
42%
10%
11%
33%
47%
8%M
ass
Tra
nsi
t S
ervi
ces
Ind
ex
21%
34%
36%
9%
21%
36%
37%
6%S
tree
ts a
nd
S
idew
alks
In
dex
17%
29%
41%
13%
19%
31%
40%
9%C
lean
ing
an
d
Mai
nte
nan
ce
Ind
ex
25%
39%
30%
6%
18%
44%
31%
6%P
ub
licE
du
cati
on
In
dex
42%
35%
19%
4%
32%
34%
27%
6%S
oci
al S
up
po
rt
Ser
vice
s In
dex
Ind
ex
Sco
reP
oo
rF
air
Go
od
Exc
elle
nt
Sur
vey
resp
onde
nts
wer
e as
ked
to n
ame
wha
t the
y th
ough
t w
ere
the
thre
e m
ost i
mpo
rtan
t iss
ues
faci
ng N
ew Y
ork
City
. T
he th
ree
resp
onse
s m
ost c
omm
only
giv
en b
y B
rook
lyn
Com
mun
ity B
oard
#13
res
pond
ents
are
list
ed b
elow
.
Hig
hest
Rat
edLo
wes
t Rat
ed
Sur
vey
resp
onde
nts
rate
d 24
ser
vice
s in
thei
r ne
ighb
orho
od.
The
hig
hest
and
low
est r
ated
ser
vice
s ar
e di
spla
yed
belo
w.
NYC
All
Com
mun
ity B
oard
#13
Res
pond
ents
All
New
Yor
k C
ity R
espo
nden
ts
Ind
ex R
atin
gs:
Bro
okl
yn C
om
mu
nit
y B
oar
d #
13
Co
mp
ared
to
Rat
ing
s G
iven
by
All
Res
po
nd
ents
Mo
st Im
po
rtan
t Is
sues
Fac
ing
New
Yo
rk
Cit
y: B
roo
klyn
Co
mm
un
ity
Bo
ard
#13
Rat
ing
s o
f N
eig
hb
orh
oo
d S
ervi
ces:
B
roo
klyn
Co
mm
un
ity
Bo
ard
#13
5868 7582 8381 7979 8689 8990
1.C
rime
2.M
ass
Tra
nsit
3.H
ousi
ng
1.F
ire p
rote
ctio
n se
rvic
es
2.E
mer
genc
y m
edic
al
serv
ices
3.P
ublic
libr
arie
s
4.S
ubw
ay s
ervi
ces
5.H
ouse
hold
gar
bage
pic
k-up
1.C
ontr
ol o
f str
eet n
oise
2.R
at c
ontr
ol
3.S
torm
wat
er d
rain
age
and
sew
er m
aint
enan
ce
4.M
aint
enan
ce o
f str
eets
an
d ro
ads
5.M
aint
enan
ce o
f si
dew
alks

City
wid
e C
usto
mer
Sur
vey
Res
ults
45%
43%
47%
37%
40%
36%
12%
13%
13%
5%5% 6%
0%25
%50
%75
%10
0%
All N
ew Y
ork
City
Res
pond
ents
All B
rook
lyn
Res
pond
ents
All C
omm
unity
Boa
rd #
14 R
espo
nden
ts
15%
13%
44%
42%
47%
29%
32%
34%
12%
13%
12%
7%
0%25
%50
%75
%10
0%
All N
ew Y
ork
City
Res
pond
ents
All B
rook
lyn
Res
pond
ents
All C
omm
unity
Boa
rd #
14 R
espo
nden
ts
Bac
kgro
un
d:
Bro
okl
yn C
om
mu
nit
y B
oar
d #
14S
urv
ey R
esp
on
ses:
Bro
okl
yn C
om
mu
nit
y B
oar
d #
14
Th
e N
eig
hb
orh
oo
ds
of
Bro
okl
ynC
om
mu
nit
y B
oar
d #
14
Sour
ce: N
YC P
lann
ing
Dep
artm
ent
Res
ult
sfr
om
NY
C F
eed
bac
k C
ityw
ide
Cu
sto
mer
Su
rvey
Bro
okl
yn C
om
mu
nit
y B
oar
d #
14
Rat
ing
s o
f N
eig
hb
orh
oo
d a
s a
Pla
ce t
o L
ive
Rat
ing
s o
f O
vera
ll Q
ual
ity
of
Lif
e in
New
Yo
rk C
ity
Exce
llent
Poor
Fair
Goo
d
Exce
llent
Poor
Fair
Goo
d
Exce
llent
Poor
Fair
Goo
d
Rat
ing
s o
f O
vera
ll Q
ual
ity
of
New
Yo
rk C
ity
Go
vern
men
t S
ervi
ces
38%
35%
36%
44%
46%
45%
15%
15%
15%
4%
4%
4%
0%25
%50
%75
%10
0%
All N
ew Y
ork
City
Res
pond
ents
All B
rook
lyn
Res
pond
ents
All C
omm
unity
Boa
rd #
14 R
espo
nden
ts
Gen
der
•M
ale:
47%
•F
emal
e: 5
3%A
ge •<
18 y
ears
old
: 27%
•18
-54
year
s ol
d: 5
1%•
55+
yea
rs o
ld: 2
2%
Rac
e/E
thn
icit
y•
Non
-His
pani
c W
hite
: 41%
•N
on-H
ispa
nic
Bla
ck: 3
8%•
Non
-His
pani
c A
sian
: 8%
•H
ispa
nic:
11%
•O
ther
: 2%
Po
pu
lati
on
an
d H
ou
seh
old
s•
Tot
al P
opul
atio
n: 1
63,0
99•
Tot
al H
ouse
hold
s: 5
6,81
9
Med
ian
An
nu
al H
ou
seh
old
Inco
me
•$4
0,12
0(2
006
Infla
tion-
Adj
uste
d D
olla
rs)
•33
7 R
espo
nses
•15
.0%
Res
pons
e R
ate
•±5
.3%
Mar
gin
of E
rror
(95
% C
onfid
ence
Inte
rval
)
See
deta
il be
low
Sou
rce:
U.S
. Cen
sus
Bur
eau
-20
06 A
mer
ican
Com
mun
ity S
urve
y, P
opul
atio
n D
ivis
ion
-N
ew Y
ork
City
Dep
artm
ent o
f City
Pla
nnin
g

City
wid
e C
usto
mer
Sur
vey
Res
ults
12%
26%
45%
18%
11%
28%
43%
18%
Nei
gh
bo
rho
od
P
ub
lic S
afet
y In
dex
14%
34%
42%
10%
9%33
%45
%12
%M
ass
Tra
nsi
t S
ervi
ces
Ind
ex
21%
34%
36%
9%
24%
36%
34%
6%S
tree
ts a
nd
S
idew
alks
In
dex
17%
29%
41%
13%
19%
34%
37%
11%
Cle
anin
g a
nd
M
ain
ten
ance
In
dex
25%
39%
30%
6%
23%
40%
31%
6%P
ub
licE
du
cati
on
In
dex
42%
35%
19%
4%
43%
32%
20%
5%S
oci
al S
up
po
rt
Ser
vice
s In
dex
Ind
ex
Sco
reP
oo
rF
air
Go
od
Exc
elle
nt
Sur
vey
resp
onde
nts
wer
e as
ked
to n
ame
wha
t the
y th
ough
t w
ere
the
thre
e m
ost i
mpo
rtan
t iss
ues
faci
ng N
ew Y
ork
City
. T
he th
ree
resp
onse
s m
ost c
omm
only
giv
en b
y B
rook
lyn
Com
mun
ity B
oard
#14
res
pond
ents
are
list
ed b
elow
.
Hig
hest
Rat
edLo
wes
t Rat
ed
Sur
vey
resp
onde
nts
rate
d 24
ser
vice
s in
thei
r ne
ighb
orho
od.
The
hig
hest
and
low
est r
ated
ser
vice
s ar
e di
spla
yed
belo
w.
NYC
All
Com
mun
ity B
oard
#14
Res
pond
ents
All
New
Yor
k C
ity R
espo
nden
ts
Ind
ex R
atin
gs:
Bro
okl
yn C
om
mu
nit
y B
oar
d #
14
Co
mp
ared
to
Rat
ing
s G
iven
by
All
Res
po
nd
ents
Mo
st Im
po
rtan
t Is
sues
Fac
ing
New
Yo
rk
Cit
y: B
roo
klyn
Co
mm
un
ity
Bo
ard
#14
Rat
ing
s o
f N
eig
hb
orh
oo
d S
ervi
ces:
B
roo
klyn
Co
mm
un
ity
Bo
ard
#14
5857 7577 8381 7976 8691 8989
1.H
ousi
ng
2.E
duca
tion
3.C
rime
1.F
ire p
rote
ctio
n se
rvic
es
2.E
mer
genc
y m
edic
al
serv
ices
3.S
ubw
ay s
ervi
ces
4.R
ecyc
ling
serv
ices
5.P
ublic
libr
arie
s
1.C
ontr
ol o
f str
eet n
oise
2.A
vaila
bilit
y of
cul
tura
l ac
tiviti
es
3.R
at c
ontr
ol
4.M
aint
enan
ce o
f str
eets
an
d ro
ads
5.G
raffi
ti co
ntro
l

City
wid
e C
usto
mer
Sur
vey
Res
ults
15%
13%
12%
44%
42%54
%
29%
32%
29%
12%
13%4%
0%25
%50
%75
%10
0%
All N
ew Y
ork
City
Res
pond
ents
All B
rook
lyn
Res
pond
ents
All C
omm
unity
Boa
rd #
15 R
espo
nden
ts
Bac
kgro
un
d:
Bro
okl
yn C
om
mu
nit
y B
oar
d #
15S
urv
ey R
esp
on
ses:
Bro
okl
yn C
om
mu
nit
y B
oar
d #
15
Th
e N
eig
hb
orh
oo
ds
of
Bro
okl
yn
C
om
mu
nit
y B
oar
d #
15
Sour
ce: N
YC P
lann
ing
Dep
artm
ent
Res
ult
sfr
om
NY
C F
eed
bac
k C
ityw
ide
Cu
sto
mer
Su
rvey
Bro
okl
yn C
om
mu
nit
y B
oar
d #
15
Rat
ing
s o
f N
eig
hb
orh
oo
d a
s a
Pla
ce t
o L
ive
Rat
ing
s o
f O
vera
ll Q
ual
ity
of
Lif
e in
New
Yo
rk C
ity
Exce
llent
Poor
Fair
Goo
d
Exce
llent
Poor
Fair
Goo
d
Exce
llent
Poor
Fair
Goo
d
Rat
ing
s o
f O
vera
ll Q
ual
ity
of
New
Yo
rk C
ity
Go
vern
men
t S
ervi
ces
45%
43%
48%
37%
40%
40%
12%
13%
5%2% 6%
11
%
0%25
%50
%75
%10
0%
All N
ew Y
ork
City
Res
pond
ents
All B
rook
lyn
Res
pond
ents
All C
omm
unity
Boa
rd #
15 R
espo
nden
ts
38%
35%
34%
44%
46%
48%
15%
15%
13%
4%
4%
4%
0%25
%50
%75
%10
0%
All N
ew Y
ork
City
Res
pond
ents
All B
rook
lyn
Res
pond
ents
All C
omm
unity
Boa
rd #
15 R
espo
nden
ts
Gen
der
•M
ale:
48%
•F
emal
e: 5
2%A
ge •<
18 y
ears
old
: 20%
•
18-5
4 ye
ars
old:
47%
•55
+ y
ears
old
: 33%
Rac
e/E
thn
icit
y•
Non
-His
pani
c W
hite
: 76%
•N
on-H
ispa
nic
Bla
ck: 4
%•
Non
-His
pani
c A
sian
: 12%
•H
ispa
nic:
7%
•O
ther
: 1%
Po
pu
lati
on
an
d H
ou
seh
old
s•
Tot
al P
opul
atio
n: 1
48,7
84•
Tot
al H
ouse
hold
s: 5
6,28
2
Med
ian
An
nu
al H
ou
seh
old
Inco
me
•$4
2,40
9(2
006
Infla
tion-
Adj
uste
d D
olla
rs)
•36
1 R
espo
nses
•24
.1%
Res
pons
e R
ate
•±5
.2%
Mar
gin
of E
rror
(95
% C
onfid
ence
Inte
rval
)
Sou
rce:
U.S
. Cen
sus
Bur
eau
-20
06 A
mer
ican
Com
mun
ity S
urve
y, P
opul
atio
n D
ivis
ion
-N
ew Y
ork
City
Dep
artm
ent o
f City
Pla
nnin
g
See
deta
il be
low

City
wid
e C
usto
mer
Sur
vey
Res
ults
12%
26%
45%
18%
8%24
%49
%19
%N
eig
hb
orh
oo
d
Pu
blic
Saf
ety
Ind
ex
14%
34%
42%
10%
11%
35%
46%
7%M
ass
Tra
nsi
t S
ervi
ces
Ind
ex
21%
34%
36%
9%
19%
34%
41%
6%S
tree
ts a
nd
S
idew
alks
In
dex
17%
29%
41%
13%
14%
30%
46%
11%
Cle
anin
g a
nd
M
ain
ten
ance
In
dex
25%
39%
30%
6%
20%
40%
34%
6%P
ub
licE
du
cati
on
In
dex
42%
35%
19%
4%
34%
39%
24%
4%S
oci
al S
up
po
rt
Ser
vice
s In
dex
Ind
ex
Sco
reP
oo
rF
air
Go
od
Exc
elle
nt
Sur
vey
resp
onde
nts
wer
e as
ked
to n
ame
wha
t the
y th
ough
t w
ere
the
thre
e m
ost i
mpo
rtan
t iss
ues
faci
ng N
ew Y
ork
City
. T
he th
ree
resp
onse
s m
ost c
omm
only
giv
en b
y B
rook
lyn
Com
mun
ity B
oard
#15
res
pond
ents
are
list
ed b
elow
.
Hig
hest
Rat
edLo
wes
t Rat
ed
Sur
vey
resp
onde
nts
rate
d 24
ser
vice
s in
thei
r ne
ighb
orho
od.
The
hig
hest
and
low
est r
ated
ser
vice
s ar
e di
spla
yed
belo
w.
NYC
All
Com
mun
ity B
oard
#15
Res
pond
ents
All
New
Yor
k C
ity R
espo
nden
ts
Ind
ex R
atin
gs:
Bro
okl
yn C
om
mu
nit
y B
oar
d #
15
Co
mp
ared
to
Rat
ing
s G
iven
by
All
Res
po
nd
ents
Mo
st Im
po
rtan
t Is
sues
Fac
ing
New
Yo
rk
Cit
y: B
roo
klyn
Co
mm
un
ity
Bo
ard
#15
Rat
ing
s o
f N
eig
hb
orh
oo
d S
ervi
ces:
B
roo
klyn
Co
mm
un
ity
Bo
ard
#15
5866 7580 8386 7981 8689 8992
1.C
rime
2.M
ass
Tra
nsit
3.E
duca
tion
1.F
ire p
rote
ctio
n se
rvic
es
2.E
mer
genc
y m
edic
al
serv
ices
3.R
ecyc
ling
serv
ices
4.H
ouse
hold
gar
bage
pic
k-up
5.C
rime
cont
rol
1.C
ontr
ol o
f str
eet n
oise
2.A
vaila
bilit
y of
cul
tura
l ac
tiviti
es
3.M
aint
enan
ce o
f str
eets
an
d ro
ads
4.G
raffi
ti co
ntro
l
5.C
lean
lines
s of
you
r ne
ighb
orho
od

City
wid
e C
usto
mer
Sur
vey
Res
ults
15%
13%
44%
42%
19%
29%
32%
37%
12%
13%
41%
2%
0%25
%50
%75
%10
0%
All N
ew Y
ork
City
Res
pond
ents
All B
rook
lyn
Res
pond
ents
All C
omm
unity
Boa
rd #
16 R
espo
nden
ts
Bac
kgro
un
d:
Bro
okl
yn C
om
mu
nit
y B
oar
d #
16S
urv
ey R
esp
on
ses:
Bro
okl
yn C
om
mu
nit
y B
oar
d #
16
Th
e N
eig
hb
orh
oo
ds
of
Bro
okl
yn
Co
mm
un
ity
Bo
ard
#16
Sour
ce: N
YC P
lann
ing
Dep
artm
ent
Res
ult
sfr
om
NY
C F
eed
bac
k C
ityw
ide
Cu
sto
mer
Su
rvey
Bro
okl
yn C
om
mu
nit
y B
oar
d #
16
Rat
ing
s o
f N
eig
hb
orh
oo
d a
s a
Pla
ce t
o L
ive
Rat
ing
s o
f O
vera
ll Q
ual
ity
of
Lif
e in
New
Yo
rk C
ity
Exce
llent
Poor
Fair
Goo
d
Exce
llent
Poor
Fair
Goo
d
Exce
llent
Poor
Fair
Goo
d
Rat
ing
s o
f O
vera
ll Q
ual
ity
of
New
Yo
rk C
ity
Go
vern
men
t S
ervi
ces
45%
43%
31%
37%
40%
46%
12%
13%
20%
5%3% 6%
0%25
%50
%75
%10
0%
All N
ew Y
ork
City
Res
pond
ents
All B
rook
lyn
Res
pond
ents
All C
omm
unity
Boa
rd #
16 R
espo
nden
ts
38%
35%
23%
44%
46%
54%
15%
15%
20%
4%4% 4%
0%25
%50
%75
%10
0%
All N
ew Y
ork
City
Res
pond
ents
All B
rook
lyn
Res
pond
ents
All C
omm
unity
Boa
rd #
16 R
espo
nden
ts
Gen
der
•M
ale:
44%
•F
emal
e: 5
6%A
ge •<
18 y
ears
old
: 34%
•18
-54
year
s ol
d: 4
9%•
55+
yea
rs o
ld: 1
8%
Rac
e/E
thn
icit
y•
Non
-His
pani
c W
hite
: 1%
•N
on-H
ispa
nic
Bla
ck: 7
7%•
Non
-His
pani
c A
sian
: 0%
•H
ispa
nic:
20%
•O
ther
: 1%
Po
pu
lati
on
an
d H
ou
seh
old
s•
Tot
al P
opul
atio
n: 1
16,9
36•
Tot
al H
ouse
hold
s: 3
9,52
0
Med
ian
An
nu
al H
ou
seh
old
Inco
me
•$2
2,97
5(2
006
Infla
tion-
Adj
uste
d D
olla
rs)
•45
6 R
espo
nses
•13
.6%
Res
pons
e R
ate
•±4
.6%
Mar
gin
of E
rror
(95
% C
onfid
ence
Inte
rval
)
Sou
rce:
U.S
. Cen
sus
Bur
eau
-20
06 A
mer
ican
Com
mun
ity S
urve
y, P
opul
atio
n D
ivis
ion
-N
ew Y
ork
City
Dep
artm
ent o
f City
Pla
nnin
g
See
deta
il be
low

City
wid
e C
usto
mer
Sur
vey
Res
ults
12%
26%
45%
18%
27%
33%
30%
10%
Nei
gh
bo
rho
od
P
ub
lic S
afet
y In
dex
14%
34%
42%
10%
17%
43%
34%
7%M
ass
Tra
nsi
t S
ervi
ces
Ind
ex
21%
34%
36%
9%
33%
39%
22%
5%S
tree
ts a
nd
S
idew
alks
In
dex
17%
29%
41%
13%
29%
37%
25%
9%C
lean
ing
an
d
Mai
nte
nan
ce
Ind
ex
25%
39%
30%
6%
34%
39%
21%
6%P
ub
licE
du
cati
on
In
dex
42%
35%
19%
4%
48%
34%
15%
4%S
oci
al S
up
po
rt
Ser
vice
s In
dex
Ind
ex
Sco
reP
oo
rF
air
Go
od
Exc
elle
nt
Sur
vey
resp
onde
nts
wer
e as
ked
to n
ame
wha
t the
y th
ough
t w
ere
the
thre
e m
ost i
mpo
rtan
t iss
ues
faci
ng N
ew Y
ork
City
. T
he th
ree
resp
onse
s m
ost c
omm
only
giv
en b
y B
rook
lyn
Com
mun
ity B
oard
#16
res
pond
ents
are
list
ed b
elow
.
Hig
hest
Rat
edLo
wes
t Rat
ed
Sur
vey
resp
onde
nts
rate
d 24
ser
vice
s in
thei
r ne
ighb
orho
od.
The
hig
hest
and
low
est r
ated
ser
vice
s ar
e di
spla
yed
belo
w.
NYC
All
Com
mun
ity B
oard
#16
Res
pond
ents
All
New
Yor
k C
ity R
espo
nden
ts
Ind
ex R
atin
gs:
Bro
okl
yn C
om
mu
nit
y B
oar
d #
16
Co
mp
ared
to
Rat
ing
s G
iven
by
All
Res
po
nd
ents
Mo
st Im
po
rtan
t Is
sues
Fac
ing
New
Yo
rk
Cit
y: B
roo
klyn
Co
mm
un
ity
Bo
ard
#16
Rat
ing
s o
f N
eig
hb
orh
oo
d S
ervi
ces:
B
roo
klyn
Co
mm
un
ity
Bo
ard
#16
5852 7566 8371 7967 8683 8973
1.H
ousi
ng
2.C
rime
3.Jo
bs
1.F
ire p
rote
ctio
n se
rvic
es
2.E
mer
genc
y m
edic
al
serv
ices
3.H
ouse
hold
gar
bage
pic
k-up
4.P
arki
ng e
nfor
cem
ent
5.C
ondi
tion
of s
tree
t tre
es
1.C
ontr
ol o
f str
eet n
oise
2.A
vaila
bilit
y of
cul
tura
l ac
tiviti
es
3.R
at c
ontr
ol
4.C
lean
lines
s of
you
r ne
ighb
orho
od
5.C
rime
cont
rol

City
wid
e C
usto
mer
Sur
vey
Res
ults
15%
13%
44%
42%
27%
29%
32%
45%
12%
13%
21%
7%
0%25
%50
%75
%10
0%
All N
ew Y
ork
City
Res
pond
ents
All B
rook
lyn
Res
pond
ents
All C
omm
unity
Boa
rd #
17 R
espo
nden
ts
Bac
kgro
un
d:
Bro
okl
yn C
om
mu
nit
y B
oar
d #
17S
urv
ey R
esp
on
ses:
Bro
okl
yn C
om
mu
nit
y B
oar
d #
17
Th
e N
eig
hb
orh
oo
ds
of
Bro
okl
yn
Co
mm
un
ity
Bo
ard
#17
Sour
ce: N
YC P
lann
ing
Dep
artm
ent
Res
ult
sfr
om
NY
C F
eed
bac
k C
ityw
ide
Cu
sto
mer
Su
rvey
Bro
okl
yn C
om
mu
nit
y B
oar
d #
17
Rat
ing
s o
f N
eig
hb
orh
oo
d a
s a
Pla
ce t
o L
ive
Rat
ing
s o
f O
vera
ll Q
ual
ity
of
Lif
e in
New
Yo
rk C
ity
Exce
llent
Poor
Fair
Goo
d
Exce
llent
Poor
Fair
Goo
d
Exce
llent
Poor
Fair
Goo
d
Rat
ing
s o
f O
vera
ll Q
ual
ity
of
New
Yo
rk C
ity
Go
vern
men
t S
ervi
ces
45%
43%
31%
37%
40%
50%
12%
13%
15%
4% 5% 6%
0%25
%50
%75
%10
0%
All N
ew Y
ork
City
Res
pond
ents
All B
rook
lyn
Res
pond
ents
All C
omm
unity
Boa
rd #
17 R
espo
nden
ts
38%
35%
26%
44%
46%
54%
15%
15%
17%
4%4% 4%
0%25
%50
%75
%10
0%
All N
ew Y
ork
City
Res
pond
ents
All B
rook
lyn
Res
pond
ents
All C
omm
unity
Boa
rd #
17 R
espo
nden
ts
Gen
der
•M
ale:
43%
•F
emal
e: 5
7%A
ge •<
18 y
ears
old
: 26%
•18
-54
year
s ol
d: 5
1%•
55+
yea
rs o
ld: 2
3%
Rac
e/E
thn
icit
y•
Non
-His
pani
c W
hite
: 1%
•N
on-H
ispa
nic
Bla
ck: 9
0%•
Non
-His
pani
c A
sian
: 0%
•H
ispa
nic:
6%
•O
ther
: 3%
Po
pu
lati
on
an
d H
ou
seh
old
s•
Tot
al P
opul
atio
n: 1
47,3
90•
Tot
al H
ouse
hold
s: 4
7,89
5
Med
ian
An
nu
al H
ou
seh
old
Inco
me
•$4
1,50
3(2
006
Infla
tion-
Adj
uste
d D
olla
rs)
•26
4 R
espo
nses
•10
.5%
Res
pons
e R
ate
•±6
.0%
Mar
gin
of E
rror
(95
% C
onfid
ence
Inte
rval
)
Sou
rce:
U.S
. Cen
sus
Bur
eau
-20
06 A
mer
ican
Com
mun
ity S
urve
y, P
opul
atio
n D
ivis
ion
-N
ew Y
ork
City
Dep
artm
ent o
f City
Pla
nnin
g
See
deta
il be
low

City
wid
e C
usto
mer
Sur
vey
Res
ults
12%
26%
45%
18%
17%
38%
34%
10%
Nei
gh
bo
rho
od
P
ub
lic S
afet
y In
dex
14%
34%
42%
10%
21%
40%
31%
8%M
ass
Tra
nsi
t S
ervi
ces
Ind
ex
21%
34%
36%
9%
26%
39%
28%
7%S
tree
ts a
nd
S
idew
alks
In
dex
17%
29%
41%
13%
19%
40%
33%
8%C
lean
ing
an
d
Mai
nte
nan
ce
Ind
ex
25%
39%
30%
6%
23%
48%
24%
5%P
ub
licE
du
cati
on
In
dex
42%
35%
19%
4%
51%
34%
11%
3%S
oci
al S
up
po
rt
Ser
vice
s In
dex
Ind
ex
Sco
reP
oo
rF
air
Go
od
Exc
elle
nt
Sur
vey
resp
onde
nts
wer
e as
ked
to n
ame
wha
t the
y th
ough
t w
ere
the
thre
e m
ost i
mpo
rtan
t iss
ues
faci
ng N
ew Y
ork
City
. T
he th
ree
resp
onse
s m
ost c
omm
only
giv
en b
y B
rook
lyn
Com
mun
ity B
oard
#17
res
pond
ents
are
list
ed b
elow
.
Hig
hest
Rat
edLo
wes
t Rat
ed
Sur
vey
resp
onde
nts
rate
d 24
ser
vice
s in
thei
r ne
ighb
orho
od.
The
hig
hest
and
low
est r
ated
ser
vice
s ar
e di
spla
yed
belo
w.
NYC
All
Com
mun
ity B
oard
#17
Res
pond
ents
All
New
Yor
k C
ity R
espo
nden
ts
Ind
ex R
atin
gs:
Bro
okl
yn C
om
mu
nit
y B
oar
d #
17
Co
mp
ared
to
Rat
ing
s G
iven
by
All
Res
po
nd
ents
Mo
st Im
po
rtan
t Is
sues
Fac
ing
New
Yo
rk
Cit
y: B
roo
klyn
Co
mm
un
ity
Bo
ard
#17
Rat
ing
s o
f N
eig
hb
orh
oo
d S
ervi
ces:
B
roo
klyn
Co
mm
un
ity
Bo
ard
#17
5849 7577 8381 7974 8679 8983
1.H
ousi
ng
2.Jo
bs
3.C
rime
1.F
ire p
rote
ctio
n se
rvic
es
2.E
mer
genc
y m
edic
al
serv
ices
3.H
ouse
hold
gar
bage
pic
k-up
4.R
ecyc
ling
serv
ices
5.P
arki
ng e
nfor
cem
ent
1.C
ontr
ol o
f str
eet n
oise
2.R
at c
ontr
ol
3.A
vaila
bilit
y of
cul
tura
l ac
tiviti
es
4.C
rime
cont
rol
5.R
emov
al o
f sno
w fr
om
city
str
eets

City
wid
e C
usto
mer
Sur
vey
Res
ults
15%
13%
11%
44%
42%52%
29%
32%31
%
12%
13%6%
0%25
%50
%75
%10
0%
All N
ew Y
ork
City
Res
pond
ents
All B
rook
lyn
Res
pond
ents
All C
omm
unity
Boa
rd #
18 R
espo
nden
ts
Bac
kgro
un
d:
Bro
okl
yn C
om
mu
nit
y B
oar
d #
18S
urv
ey R
esp
on
ses:
Bro
okl
yn C
om
mu
nit
y B
oar
d #
18
Th
e N
eig
hb
orh
oo
ds
of
Bro
okl
yn
Co
mm
un
ity
Bo
ard
#18
Sour
ce: N
YC P
lann
ing
Dep
artm
ent
Res
ult
sfr
om
NY
C F
eed
bac
k C
ityw
ide
Cu
sto
mer
Su
rvey
Bro
okl
yn C
om
mu
nit
y B
oar
d #
18
Rat
ing
s o
f N
eig
hb
orh
oo
d a
s a
Pla
ce t
o L
ive
Rat
ing
s o
f O
vera
ll Q
ual
ity
of
Lif
e in
New
Yo
rk C
ity
Exce
llent
Poor
Fair
Goo
d
Exce
llent
Poor
Fair
Goo
d
Exce
llent
Poor
Fair
Goo
d
Rat
ing
s o
f O
vera
ll Q
ual
ity
of
New
Yo
rk C
ity
Go
vern
men
t S
ervi
ces
45%
43%
38%
37%
40%
44%
12%
13%
14%
5%4% 6%
0%25
%50
%75
%10
0%
All N
ew Y
ork
City
Res
pond
ents
All B
rook
lyn
Res
pond
ents
All C
omm
unity
Boa
rd #
18 R
espo
nden
ts
38%
35%
34%
44%
46%
45%
15%
15%
19%
4%2% 4%
0%25
%50
%75
%10
0%
All N
ew Y
ork
City
Res
pond
ents
All B
rook
lyn
Res
pond
ents
All C
omm
unity
Boa
rd #
18 R
espo
nden
ts
Gen
der
•M
ale:
48%
•F
emal
e: 5
2%A
ge •<
18 y
ears
old
: 26%
•18
-54
year
s ol
d: 5
1%•
55+
yea
rs o
ld: 2
3%
Rac
e/E
thn
icit
y•
Non
-His
pani
c W
hite
: 31%
•N
on-H
ispa
nic
Bla
ck: 5
9%•
Non
-His
pani
c A
sian
: 3%
•H
ispa
nic:
6%
•O
ther
: 1%
Po
pu
lati
on
an
d H
ou
seh
old
s•
Tot
al P
opul
atio
n: 2
04,6
00•
Tot
al H
ouse
hold
s: 6
4,06
7
Med
ian
An
nu
al H
ou
seh
old
Inco
me
•$5
9,11
6(2
006
Infla
tion-
Adj
uste
d D
olla
rs)
•32
2 R
espo
nses
•17
.4%
Res
pons
e R
ate
•±5
.5%
Mar
gin
of E
rror
(95
% C
onfid
ence
Inte
rval
)
See
deta
il be
low
Sou
rce:
U.S
. Cen
sus
Bur
eau
-20
06 A
mer
ican
Com
mun
ity S
urve
y, P
opul
atio
n D
ivis
ion
-N
ew Y
ork
City
Dep
artm
ent o
f City
Pla
nnin
g

City
wid
e C
usto
mer
Sur
vey
Res
ults
12%
26%
45%
18%
10%
30%
46%
13%
Nei
gh
bo
rho
od
P
ub
lic S
afet
y In
dex
14%
34%
42%
10%
18%
35%
40%
7%M
ass
Tra
nsi
t S
ervi
ces
Ind
ex
21%
34%
36%
9%
19%
37%
37%
7%S
tree
ts a
nd
S
idew
alks
In
dex
17%
29%
41%
13%
15%
31%
42%
13%
Cle
anin
g a
nd
M
ain
ten
ance
In
dex
25%
39%
30%
6%
31%
32%
33%
4%P
ub
lic
Ed
uca
tio
n
Ind
ex
42%
35%
19%
4%
47%
35%
15%
2%S
oci
al S
up
po
rt
Ser
vice
s In
dex
Ind
ex
Sco
reP
oo
rF
air
Go
od
Exc
elle
nt
Sur
vey
resp
onde
nts
wer
e as
ked
to n
ame
wha
t the
y th
ough
t w
ere
the
thre
e m
ost i
mpo
rtan
t iss
ues
faci
ng N
ew Y
ork
City
. T
he th
ree
resp
onse
s m
ost c
omm
only
giv
en b
y B
rook
lyn
Com
mun
ity B
oard
#18
res
pond
ents
are
list
ed b
elow
.
Hig
hest
Rat
edLo
wes
t Rat
ed
Sur
vey
resp
onde
nts
rate
d 24
ser
vice
s in
thei
r ne
ighb
orho
od.
The
hig
hest
and
low
est r
ated
ser
vice
s ar
e di
spla
yed
belo
w.
NYC
All
Com
mun
ity B
oard
#18
Res
pond
ents
All
New
Yor
k C
ity R
espo
nden
ts
Ind
ex R
atin
gs:
Bro
okl
yn C
om
mu
nit
y B
oar
d #
18
Co
mp
ared
to
Rat
ing
s G
iven
by
All
Res
po
nd
ents
Mo
st Im
po
rtan
t Is
sues
Fac
ing
New
Yo
rk
Cit
y: B
roo
klyn
Co
mm
un
ity
Bo
ard
#18
Rat
ing
s o
f N
eig
hb
orh
oo
d S
ervi
ces:
B
roo
klyn
Co
mm
un
ity
Bo
ard
#18
5853 7569 8385 7981 8682 8990
1.C
rime
2.H
ousi
ng
3.Jo
bs
1.F
ire p
rote
ctio
n se
rvic
es
2.E
mer
genc
y m
edic
al
serv
ices
3.H
ouse
hold
gar
bage
pic
k-up
4.R
ecyc
ling
serv
ices
5.C
lean
lines
s of
you
r ne
ighb
orho
od
1.M
aint
enan
ce o
f str
eets
an
d ro
ads
2.A
vaila
bilit
y of
cul
tura
l ac
tiviti
es
3.R
at c
ontr
ol
4.S
torm
wat
er d
rain
age
and
sew
er m
aint
enan
ce
5.R
emov
al o
f sno
w fr
om
city
str
eets

City
wid
e C
usto
mer
Sur
vey
Res
ults
15%24
%38%
44%
45%
42%
29%23
%14% 12
%9%5%
0%25
%50
%75
%10
0%
All N
ew Y
ork
City
Res
pond
ents
All M
anha
ttan
Res
pond
ents
All C
omm
unity
Boa
rd #
1 R
espo
nden
ts
Bac
kgro
un
d:
Man
hat
tan
Co
mm
un
ity
Bo
ard
#1
Su
rvey
Res
po
nse
s: M
anh
atta
n C
om
mu
nit
y B
oar
d #
1
Th
e N
eig
hb
orh
oo
ds
of
Man
hat
tan
C
om
mu
nit
y B
oar
d #
1
Sour
ce: N
YC P
lann
ing
Dep
artm
ent
Rac
e/E
thn
icit
y•
Non
-His
pani
c W
hite
: 67%
•N
on-H
ispa
nic
Bla
ck: 7
%•
Non
-His
pani
c A
sian
: 14%
•H
ispa
nic:
8%
•O
ther
: 4%
Po
pu
lati
on
an
d H
ou
seh
old
s•
Tot
al P
opul
atio
n: 3
4,42
0•
Tot
al H
ouse
hold
s: 1
5,83
0
Med
ian
An
nu
al H
ou
seh
old
Inco
me
•$7
9,47
9
Res
ult
sfr
om
NY
C F
eed
bac
k C
ityw
ide
Cu
sto
mer
Su
rvey
Man
hat
tan
Co
mm
un
ity
Bo
ard
#1 R
atin
gs
of
Nei
gh
bo
rho
od
as
a P
lace
to
Liv
e
Rat
ing
s o
f O
vera
ll Q
ual
ity
of
Lif
e in
New
Yo
rk C
ity
Exce
llent
Poor
Fair
Goo
d
Exce
llent
Poor
Fair
Goo
d
Exce
llent
Poor
Fair
Goo
d
Rat
ing
s o
f O
vera
ll Q
ual
ity
of
New
Yo
rk C
ity
Go
vern
men
t S
ervi
ces
11%18
%
45%
54%55
%
37%
28%23
%
12%
6%
7%4%
0%25
%50
%75
%10
0%
All N
ew Y
ork
City
Res
pond
ents
All M
anha
ttan
Res
pond
ents
All C
omm
unity
Boa
rd #
1 R
espo
nden
ts
38%46
%52%
44%38
%38%
15%
10%
5%6% 4%
5%
0%25
%50
%75
%10
0%
All N
ew Y
ork
City
Res
pond
ents
All M
anha
ttan
Res
pond
ents
All C
omm
unity
Boa
rd #
1 R
espo
nden
ts
Gen
der
•M
ale:
53%
•F
emal
e: 4
7%A
ge •<
18 y
ears
old
: 9%
•20
-64
year
s ol
d: 8
3%•
65+
yea
rs o
ld: 7
%
•32
1 R
espo
nses
•18
.2%
Res
pons
e R
ate
•±5
.5%
Mar
gin
of E
rror
(95
% C
onfid
ence
Inte
rval
)
Sou
rce:
U.S
. Cen
sus
Bur
eau
-20
00 C
ensu
s, P
opul
atio
n D
ivis
ion
-N
ew Y
ork
City
Dep
artm
ent o
f City
Pla
nnin
g
See
deta
il be
low

City
wid
e C
usto
mer
Sur
vey
Res
ults
12%
26%
45%
18%
2%12
%50
%36
%N
eig
hb
orh
oo
d
Pu
blic
Saf
ety
Ind
ex
14%
34%
42%
10%
9%28
%44
%19
%M
ass
Tra
nsi
t S
ervi
ces
Ind
ex
21%
34%
36%
9%
18%
26%
38%
18%
Str
eets
an
d
Sid
ewal
ks
Ind
ex
17%
29%
41%
13%
12%
23%
41%
24%
Cle
anin
g a
nd
M
ain
ten
ance
In
dex
25%
39%
30%
6%
30%
33%
35%
2%P
ub
licE
du
cati
on
In
dex
42%
35%
19%
4%
34%
42%
21%
3%S
oci
al S
up
po
rt
Ser
vice
s In
dex
Ind
ex
Sco
reP
oo
rF
air
Go
od
Exc
elle
nt
Sur
vey
resp
onde
nts
wer
e as
ked
to n
ame
wha
t the
y th
ough
t w
ere
the
thre
e m
ost i
mpo
rtan
t iss
ues
faci
ng N
ew Y
ork
City
. T
he th
ree
resp
onse
s m
ost c
omm
only
giv
en b
y M
anha
ttan
Com
mun
ity B
oard
#1
resp
onde
nts
are
liste
d be
low
.
Hig
hest
Rat
edLo
wes
t Rat
ed
Sur
vey
resp
onde
nts
rate
d 24
ser
vice
s in
thei
r ne
ighb
orho
od.
The
hig
hest
and
low
est r
ated
ser
vice
s ar
e di
spla
yed
belo
w.
NYC
All
Com
mun
ity B
oard
#1
Res
pond
ents
All
New
Yor
k C
ity R
espo
nden
ts
Ind
ex R
atin
gs:
Man
hat
tan
Co
mm
un
ity
Bo
ard
#1
Co
mp
ared
to
Rat
ing
s G
iven
by
All
Res
po
nd
ents
Mo
st Im
po
rtan
t Is
sues
Fac
ing
New
Yo
rk
Cit
y: M
anh
atta
n C
om
mu
nit
y B
oar
d #
1
Rat
ing
s o
f N
eig
hb
orh
oo
d S
ervi
ces:
M
anh
atta
n C
om
mu
nit
y B
oar
d #
1
5866 7570 8388 7982 8691 8998
1.M
ass
Tra
nsit
2.H
ousi
ng
3.E
duca
tion
1.F
ire p
rote
ctio
n se
rvic
es
2.R
emov
al o
f sno
w fr
om
city
str
eets
3.E
mer
genc
y m
edic
al
serv
ices
4.C
rime
cont
rol
5.P
olic
e-C
omm
unity
re
latio
ns
1.C
ontr
ol o
f str
eet n
oise
2.M
aint
enan
ce o
f str
eets
an
d ro
ads
3.R
at c
ontr
ol
4.P
ublic
libr
arie
s
5.P
arki
ng e
nfor
cem
ent

City
wid
e C
usto
mer
Sur
vey
Res
ults
15%24
%37%
44%
45%
50%
29%23
%
11%
12%9%
2%
0%25
%50
%75
%10
0%
All N
ew Y
ork
City
Res
pond
ents
All M
anha
ttan
Res
pond
ents
All C
omm
unity
Boa
rd #
2 R
espo
nden
ts
Bac
kgro
un
d:
Man
hat
tan
Co
mm
un
ity
Bo
ard
#2
Su
rvey
Res
po
nse
s: M
anh
atta
n C
om
mu
nit
y B
oar
d #
2
Th
e N
eig
hb
orh
oo
ds
of
Man
hat
tan
C
om
mu
nit
y B
oar
d #
2
Sour
ce: N
YC P
lann
ing
Dep
artm
ent
Rac
e/E
thn
icit
y•
Non
-His
pani
c W
hite
: 75%
•N
on-H
ispa
nic
Bla
ck: 2
%•
Non
-His
pani
c A
sian
: 15%
•H
ispa
nic:
6%
•O
ther
: 2%
Po
pu
lati
on
an
d H
ou
seh
old
s•
Tot
al P
opul
atio
n: 9
3,11
9•
Tot
al H
ouse
hold
s: 5
2,74
8
Med
ian
An
nu
al H
ou
seh
old
Inco
me
•$6
5,46
5
Res
ult
sfr
om
NY
C F
eed
bac
k C
ityw
ide
Cu
sto
mer
Su
rvey
Man
hat
tan
Co
mm
un
ity
Bo
ard
#2 R
atin
gs
of
Nei
gh
bo
rho
od
as
a P
lace
to
Liv
e
Rat
ing
s o
f O
vera
ll Q
ual
ity
of
Lif
e in
New
Yo
rk C
ity
Exce
llent
Poor
Fair
Goo
d
Exce
llent
Poor
Fair
Goo
d
Exce
llent
Poor
Fair
Goo
d
Rat
ing
s o
f O
vera
ll Q
ual
ity
of
New
Yo
rk C
ity
Go
vern
men
t S
ervi
ces
11%
14%
45%
54%60
%
37%
28%23
%
12%
6%
4%
7%
0%25
%50
%75
%10
0%
All N
ew Y
ork
City
Res
pond
ents
All M
anha
ttan
Res
pond
ents
All C
omm
unity
Boa
rd #
2 R
espo
nden
ts
38%46
%
48%
44%38
%40%
15%
10%
6% 5% 4%
6%
0%25
%50
%75
%10
0%
All N
ew Y
ork
City
Res
pond
ents
All M
anha
ttan
Res
pond
ents
All C
omm
unity
Boa
rd #
2 R
espo
nden
ts
Sou
rce:
U.S
. Cen
sus
Bur
eau
-20
00 C
ensu
s, P
opul
atio
n D
ivis
ion
-N
ew Y
ork
City
Dep
artm
ent o
f City
Pla
nnin
g
Gen
der
•M
ale:
50%
•F
emal
e: 5
0%A
ge •<
18 y
ears
old
: 8%
•20
-64
year
s ol
d:80
%•
65+
yea
rs o
ld: 1
2%
•34
1Res
pons
es•
22.7
% R
espo
nse
Rat
e•
±5.3
% M
argi
n of
Err
or (
95%
Con
fiden
ce In
terv
al)
See
deta
il be
low

City
wid
e C
usto
mer
Sur
vey
Res
ults
12%
26%
45%
18%
4%20
%51
%25
%N
eig
hb
orh
oo
d
Pu
blic
Saf
ety
Ind
ex
14%
34%
42%
10%
8%24
%50
%18
%M
ass
Tra
nsi
t S
ervi
ces
Ind
ex
21%
34%
36%
9%
18%
28%
42%
12%
Str
eets
an
d
Sid
ewal
ks
Ind
ex
17%
29%
41%
13%
14%
28%
44%
14%
Cle
anin
g a
nd
M
ain
ten
ance
In
dex
25%
39%
30%
6%
28%
43%
28%
2%P
ub
licE
du
cati
on
In
dex
42%
35%
19%
4%
46%
36%
16%
2%S
oci
al S
up
po
rt
Ser
vice
s In
dex
Ind
ex
Sco
reP
oo
rF
air
Go
od
Exc
elle
nt
Sur
vey
resp
onde
nts
wer
e as
ked
to n
ame
wha
t the
y th
ough
t w
ere
the
thre
e m
ost i
mpo
rtan
t iss
ues
faci
ng N
ew Y
ork
City
. T
he th
ree
resp
onse
s m
ost c
omm
only
giv
en b
y M
anha
ttan
Com
mun
ity B
oard
#2
resp
onde
nts
are
liste
d be
low
.
Hig
hest
Rat
edLo
wes
t Rat
ed
Sur
vey
resp
onde
nts
rate
d 24
ser
vice
s in
thei
r ne
ighb
orho
od.
The
hig
hest
and
low
est r
ated
ser
vice
s ar
e di
spla
yed
belo
w.
NYC
All
Com
mun
ity B
oard
#2
Res
pond
ents
All
New
Yor
k C
ity R
espo
nden
ts
Ind
ex R
atin
gs:
Man
hat
tan
Co
mm
un
ity
Bo
ard
#2
Co
mp
ared
to
Rat
ing
s G
iven
by
All
Res
po
nd
ents
Mo
st Im
po
rtan
t Is
sues
Fac
ing
New
Yo
rk
Cit
y: M
anh
atta
n C
om
mu
nit
y B
oar
d #
2
Rat
ing
s o
f N
eig
hb
orh
oo
d S
ervi
ces:
M
anh
atta
n C
om
mu
nit
y B
oar
d #
2
5854 7572 8386 7982 8692 8996
1.H
ousi
ng
2.E
duca
tion
3.M
ass
Tra
nsit
1.F
ire p
rote
ctio
n se
rvic
es
2.E
mer
genc
y m
edic
al
serv
ices
3.A
vaila
bilit
y of
cul
tura
l ac
tiviti
es
4.C
rime
cont
rol
5.S
ubw
ay s
ervi
ces
1.C
ontr
ol o
f str
eet n
oise
2.R
at c
ontr
ol
3.M
aint
enan
ce o
f str
eets
an
d ro
ads
4.R
ecyc
ling
serv
ices
5.S
torm
wat
er d
rain
age
and
sew
er m
aint
enan
ce

City
wid
e C
usto
mer
Sur
vey
Res
ults
15%24
%
10%
44%
45%
52%
29%23
%
28%
12%9%10%
0%25
%50
%75
%10
0%
All N
ew Y
ork
City
Res
pond
ents
All M
anha
ttan
Res
pond
ents
All C
omm
unity
Boa
rd #
3 R
espo
nden
ts
Bac
kgro
un
d:
Man
hat
tan
Co
mm
un
ity
Bo
ard
#3
Su
rvey
Res
po
nse
s: M
anh
atta
n C
om
mu
nit
y B
oar
d #
3
Th
e N
eig
hb
orh
oo
ds
of
Man
hat
tan
C
om
mu
nit
y B
oar
d #
3
Sour
ce: N
YC P
lann
ing
Dep
artm
ent
Res
ult
sfr
om
NY
C F
eed
bac
k C
ityw
ide
Cu
sto
mer
Su
rvey
Man
hat
tan
Co
mm
un
ity
Bo
ard
#3 R
atin
gs
of
Nei
gh
bo
rho
od
as
a P
lace
to
Liv
e
Rat
ing
s o
f O
vera
ll Q
ual
ity
of
Lif
e in
New
Yo
rk C
ity
Exce
llent
Poor
Fair
Goo
d
Exce
llent
Poor
Fair
Goo
d
Exce
llent
Poor
Fair
Goo
d
Rat
ing
s o
f O
vera
ll Q
ual
ity
of
New
Yo
rk C
ity
Go
vern
men
t S
ervi
ces
11%
45%
54%
52%
37%
28%
34%
7% 6%12
%7%7%
0%25
%50
%75
%10
0%
All N
ew Y
ork
City
Res
pond
ents
All M
anha
ttan
Res
pond
ents
All C
omm
unity
Boa
rd #
3 R
espo
nden
ts
38%46
%
44%
44%38
%
44%
15%
5%4% 4%
10%
9%
0%25
%50
%75
%10
0%
All N
ew Y
ork
City
Res
pond
ents
All M
anha
ttan
Res
pond
ents
All C
omm
unity
Boa
rd #
3 R
espo
nden
ts
Gen
der
•M
ale:
50%
•F
emal
e: 5
0%A
ge •<
18 y
ears
old
: 15%
•18
-54
year
s ol
d: 6
2%•
55+
yea
rs o
ld: 2
3%
Rac
e/E
thn
icit
y•
Non
-His
pani
c W
hite
: 32%
•N
on-H
ispa
nic
Bla
ck: 1
0%•
Non
-His
pani
c A
sian
: 35%
•H
ispa
nic:
21%
•O
ther
: 2%
Po
pu
lati
on
an
d H
ou
seh
old
s•
Tot
al P
opul
atio
n: 1
78,6
69•
Tot
al H
ouse
hold
s: 7
3,89
3
Med
ian
An
nu
al H
ou
seh
old
Inco
me
•$3
6,89
9(2
006
Infla
tion-
Adj
uste
d D
olla
rs)
•39
0 R
espo
nses
•17
.1%
Res
pons
e R
ate
•±5
.0%
Mar
gin
of E
rror
(95
% C
onfid
ence
Inte
rval
)
See
deta
il be
low
Sou
rce:
U.S
. Cen
sus
Bur
eau
-20
06 A
mer
ican
Com
mun
ity S
urve
y, P
opul
atio
n D
ivis
ion
-N
ew Y
ork
City
Dep
artm
ent o
f City
Pla
nnin
g

City
wid
e C
usto
mer
Sur
vey
Res
ults
12%
26%
45%
18%
10%
26%
49%
16%
Nei
gh
bo
rho
od
P
ub
lic S
afet
y In
dex
14%
34%
42%
10%
12%
34%
44%
10%
Mas
s T
ran
sit
Ser
vice
s In
dex
21%
34%
36%
9%
20%
37%
37%
6%S
tree
ts a
nd
S
idew
alks
In
dex
17%
29%
41%
13%
22%
36%
36%
6%C
lean
ing
an
d
Mai
nte
nan
ce
Ind
ex
25%
39%
30%
6%
21%
43%
27%
9%P
ub
licE
du
cati
on
In
dex
42%
35%
19%
4%
35%
39%
23%
3%S
oci
al S
up
po
rt
Ser
vice
s In
dex
Ind
ex
Sco
reP
oo
rF
air
Go
od
Exc
elle
nt
Sur
vey
resp
onde
nts
wer
e as
ked
to n
ame
wha
t the
y th
ough
t w
ere
the
thre
e m
ost i
mpo
rtan
t iss
ues
faci
ng N
ew Y
ork
City
. T
he th
ree
resp
onse
s m
ost c
omm
only
giv
en b
y M
anha
ttan
Com
mun
ity B
oard
#3
resp
onde
nts
are
liste
d be
low
.
Hig
hest
Rat
edLo
wes
t Rat
ed
Sur
vey
resp
onde
nts
rate
d 24
ser
vice
s in
thei
r ne
ighb
orho
od.
The
hig
hest
and
low
est r
ated
ser
vice
s ar
e di
spla
yed
belo
w.
NYC
All
Com
mun
ity B
oard
#3
Res
pond
ents
All
New
Yor
k C
ity R
espo
nden
ts
Ind
ex R
atin
gs:
Man
hat
tan
Co
mm
un
ity
Bo
ard
#3
Co
mp
ared
to
Rat
ing
s G
iven
by
All
Res
po
nd
ents
Mo
st Im
po
rtan
t Is
sues
Fac
ing
New
Yo
rk
Cit
y: M
anh
atta
n C
om
mu
nit
y B
oar
d #
3
Rat
ing
s o
f N
eig
hb
orh
oo
d S
ervi
ces:
M
anh
atta
n C
om
mu
nit
y B
oar
d #
3
5865 7579 8378 7980 8688 8990
1.H
ousi
ng
2.E
duca
tion
3.M
ass
Tra
nsit
1.F
ire p
rote
ctio
n se
rvic
es
2.E
mer
genc
y m
edic
al
serv
ices
3.P
ublic
libr
arie
s
4.N
eigh
borh
ood
play
grou
nds
5.C
ondi
tion
of s
tree
t tre
es
1.C
ontr
ol o
f str
eet n
oise
2.R
at c
ontr
ol
3.C
lean
lines
s of
you
r ne
ighb
orho
od
4.G
raffi
ti co
ntro
l
5.M
aint
enan
ce o
f str
eets
an
d ro
ads

City
wid
e C
usto
mer
Sur
vey
Res
ults
15%24
%
21%
44%
45%
56%
29%23
%18%
12%9%6%
0%25
%50
%75
%10
0%
All N
ew Y
ork
City
Res
pond
ents
All M
anha
ttan
Res
pond
ents
All C
omm
unity
Boa
rd #
4 R
espo
nden
ts
Bac
kgro
un
d:
Man
hat
tan
Co
mm
un
ity
Bo
ard
#4
Su
rvey
Res
po
nse
s: M
anh
atta
n C
om
mu
nit
y B
oar
d #
4
Th
e N
eig
hb
orh
oo
ds
of
Man
hat
tan
C
om
mu
nit
y B
oar
d #
4
Sour
ce: N
YC P
lann
ing
Dep
artm
ent
Rac
e/E
thn
icit
y•
Non
-His
pani
c W
hite
: 60%
•N
on-H
ispa
nic
Bla
ck: 7
%•
Non
-His
pani
c A
sian
: 8%
•H
ispa
nic:
21%
•O
ther
: 3%
Po
pu
lati
on
an
d H
ou
seh
old
s•
Tot
al P
opul
atio
n: 8
7,47
9•
Tot
al H
ouse
hold
s: 5
1,42
5
Med
ian
An
nu
al H
ou
seh
old
Inco
me
•$6
2,51
4
Res
ult
sfr
om
NY
C F
eed
bac
k C
ityw
ide
Cu
sto
mer
Su
rvey
Man
hat
tan
Co
mm
un
ity
Bo
ard
#4 R
atin
gs
of
Nei
gh
bo
rho
od
as
a P
lace
to
Liv
e
Rat
ing
s o
f O
vera
ll Q
ual
ity
of
Lif
e in
New
Yo
rk C
ity
Exce
llent
Poor
Fair
Goo
d
Exce
llent
Poor
Fair
Goo
d
Exce
llent
Poor
Fair
Goo
d
Rat
ing
s o
f O
vera
ll Q
ual
ity
of
New
Yo
rk C
ity
Go
vern
men
t S
ervi
ces
11%
11%
45%
54%
58%
37%
28%26%
12%
6%
7%5%
0%25
%50
%75
%10
0%
All N
ew Y
ork
City
Res
pond
ents
All M
anha
ttan
Res
pond
ents
All C
omm
unity
Boa
rd #
4 R
espo
nden
ts
38%46
%
47%
44%38
%
41%
15%
10%
5%4% 4%
8%
0%25
%50
%75
%10
0%
All N
ew Y
ork
City
Res
pond
ents
All M
anha
ttan
Res
pond
ents
All C
omm
unity
Boa
rd #
4 R
espo
nden
ts
Gen
der
•M
ale:
53%
•F
emal
e: 4
7%A
ge •<
18 y
ears
old
: 9%
•20
-64
year
s ol
d: 7
9%•
65+
yea
rs o
ld: 1
2%
Sou
rce:
U.S
. Cen
sus
Bur
eau
-20
00 C
ensu
s, P
opul
atio
n D
ivis
ion
-N
ew Y
ork
City
Dep
artm
ent o
f City
Pla
nnin
g
•32
9 R
espo
nses
•21
.9%
Res
pons
e R
ate
•±5
.4%
Mar
gin
of E
rror
(95
% C
onfid
ence
Inte
rval
)
See
deta
il be
low

City
wid
e C
usto
mer
Sur
vey
Res
ults
12%
26%
45%
18%
5%19
%52
%24
%N
eig
hb
orh
oo
d
Pu
blic
Saf
ety
Ind
ex
14%
34%
42%
10%
11%
30%
45%
14%
Mas
s T
ran
sit
Ser
vice
s In
dex
21%
34%
36%
9%
19%
30%
42%
9%S
tree
ts a
nd
S
idew
alks
In
dex
17%
29%
41%
13%
11%
30%
48%
11%
Cle
anin
g a
nd
M
ain
ten
ance
In
dex
25%
39%
30%
6%
31%
42%
24%
3%P
ub
licE
du
cati
on
In
dex
42%
35%
19%
4%
44%
33%
20%
3%S
oci
al S
up
po
rt
Ser
vice
s In
dex
Ind
ex
Sco
reP
oo
rF
air
Go
od
Exc
elle
nt
Sur
vey
resp
onde
nts
wer
e as
ked
to n
ame
wha
t the
y th
ough
t w
ere
the
thre
e m
ost i
mpo
rtan
t iss
ues
faci
ng N
ew Y
ork
City
. T
he th
ree
resp
onse
s m
ost c
omm
only
giv
en b
y M
anha
ttan
Com
mun
ity B
oard
#4
resp
onde
nts
are
liste
d be
low
.
Hig
hest
Rat
edLo
wes
t Rat
ed
Sur
vey
resp
onde
nts
rate
d 24
ser
vice
s in
thei
r ne
ighb
orho
od.
The
hig
hest
and
low
est r
ated
ser
vice
s ar
e di
spla
yed
belo
w.
NYC
All
Com
mun
ity B
oard
#4
Res
pond
ents
All
New
Yor
k C
ity R
espo
nden
ts
Ind
ex R
atin
gs:
Man
hat
tan
Co
mm
un
ity
Bo
ard
#4
Co
mp
ared
to
Rat
ing
s G
iven
by
All
Res
po
nd
ents
Mo
st Im
po
rtan
t Is
sues
Fac
ing
New
Yo
rk
Cit
y: M
anh
atta
n C
om
mu
nit
y B
oar
d #
4
Rat
ing
s o
f N
eig
hb
orh
oo
d S
ervi
ces:
M
anh
atta
n C
om
mu
nit
y B
oar
d #
4
5856 7569 8389 7981 8689 8995
1.H
ousi
ng
2.M
ass
Tra
nsit
3.T
raffi
c C
onge
stio
n
1.F
ire p
rote
ctio
n se
rvic
es
2.E
mer
genc
y m
edic
al
serv
ices
3.R
emov
al o
f sno
w fr
om
city
str
eets
4.A
vaila
bilit
y of
cul
tura
l ac
tiviti
es
5.C
ondi
tion
of s
tree
t tre
es
1.C
ontr
ol o
f str
eet n
oise
2.R
at c
ontr
ol
3.P
edes
tria
n sa
fety
(c
ross
ing
inte
rsec
tions
)
4.M
aint
enan
ce o
f str
eets
an
d ro
ads
5.R
ecyc
ling
serv
ices

City
wid
e C
usto
mer
Sur
vey
Res
ults
15%24
%
21%
44%
45%55%
29%23
%18%
12%9%6%
0%25
%50
%75
%10
0%
All N
ew Y
ork
City
Res
pond
ents
All M
anha
ttan
Res
pond
ents
All C
omm
unity
Boa
rd #
5 R
espo
nden
ts
Bac
kgro
un
d:
Man
hat
tan
Co
mm
un
ity
Bo
ard
#5
Su
rvey
Res
po
nse
s: M
anh
atta
n C
om
mu
nit
y B
oar
d #
5
Th
e N
eig
hb
orh
oo
ds
of
Man
hat
tan
C
om
mu
nit
y B
oar
d #
5
Sour
ce: N
YC P
lann
ing
Dep
artm
ent
Rac
e/E
thn
icit
y•
Non
-His
pani
c W
hite
: 72%
•N
on-H
ispa
nic
Bla
ck: 4
%•
Non
-His
pani
c A
sian
: 14%
•H
ispa
nic:
7%
•O
ther
: 3%
Po
pu
lati
on
an
d H
ou
seh
old
s•
Tot
al P
opul
atio
n: 4
4,02
8•
Tot
al H
ouse
hold
s: 2
5,80
5
Med
ian
An
nu
al H
ou
seh
old
Inco
me
•$1
22,1
73
Res
ult
sfr
om
NY
C F
eed
bac
k C
ityw
ide
Cu
sto
mer
Su
rvey
Man
hat
tan
Co
mm
un
ity
Bo
ard
#5 R
atin
gs
of
Nei
gh
bo
rho
od
as
a P
lace
to
Liv
e
Rat
ing
s o
f O
vera
ll Q
ual
ity
of
Lif
e in
New
Yo
rk C
ity
Exce
llent
Poor
Fair
Goo
d
Exce
llent
Poor
Fair
Goo
d
Exce
llent
Poor
Fair
Goo
d
Rat
ing
s o
f O
vera
ll Q
ual
ity
of
New
Yo
rk C
ity
Go
vern
men
t S
ervi
ces
11%
12%
45%
54%65
%
37%
28%18
% 12%
6%
7%5%
0%25
%50
%75
%10
0%
All N
ew Y
ork
City
Res
pond
ents
All M
anha
ttan
Res
pond
ents
All C
omm
unity
Boa
rd #
5 R
espo
nden
ts
38%46
%51%
44%38
%38%
15%
10%
5%6% 4%
4%
0%25
%50
%75
%10
0%
All N
ew Y
ork
City
Res
pond
ents
All M
anha
ttan
Res
pond
ents
All C
omm
unity
Boa
rd #
5 R
espo
nden
ts
Gen
der
•M
ale:
49%
•F
emal
e: 5
1%A
ge •<
18 y
ears
old
: 6%
•20
-64
year
s ol
d: 8
3%•
65+
yea
rs o
ld: 1
0%
Sou
rce:
U.S
. Cen
sus
Bur
eau
-20
00 C
ensu
s, P
opul
atio
n D
ivis
ion
-N
ew Y
ork
City
Dep
artm
ent o
f City
Pla
nnin
g
•30
4 R
espo
nses
•18
.6%
Res
pons
e R
ate
•±5
.6%
Mar
gin
of E
rror
(95
% C
onfid
ence
Inte
rval
)
See
deta
il be
low

City
wid
e C
usto
mer
Sur
vey
Res
ults
12%
26%
45%
18%
5%17
%54
%24
%N
eig
hb
orh
oo
d
Pu
blic
Saf
ety
Ind
ex
14%
34%
42%
10%
6%24
%50
%19
%M
ass
Tra
nsi
t S
ervi
ces
Ind
ex
21%
34%
36%
9%
19%
27%
40%
14%
Str
eets
an
d
Sid
ewal
ks
Ind
ex
17%
29%
41%
13%
14%
26%
45%
15%
Cle
anin
g a
nd
M
ain
ten
ance
In
dex
25%
39%
30%
6%
27%
51%
17%
5%P
ub
licE
du
cati
on
In
dex
42%
35%
19%
4%
43%
37%
17%
3%S
oci
al S
up
po
rt
Ser
vice
s In
dex
Ind
ex
Sco
reP
oo
rF
air
Go
od
Exc
elle
nt
Sur
vey
resp
onde
nts
wer
e as
ked
to n
ame
wha
t the
y th
ough
t w
ere
the
thre
e m
ost i
mpo
rtan
t iss
ues
faci
ng N
ew Y
ork
City
. T
he th
ree
resp
onse
s m
ost c
omm
only
giv
en b
y M
anha
ttan
Com
mun
ity B
oard
#5
resp
onde
nts
are
liste
d be
low
.
Hig
hest
Rat
edLo
wes
tRat
ed
Sur
vey
resp
onde
nts
rate
d 24
ser
vice
s in
thei
r ne
ighb
orho
od.
The
hig
hest
and
low
est r
ated
ser
vice
s ar
e di
spla
yed
belo
w.
NYC
All
Com
mun
ity B
oard
#5
Res
pond
ents
All
New
Yor
k C
ity R
espo
nden
ts
Ind
ex R
atin
gs:
Man
hat
tan
Co
mm
un
ity
Bo
ard
#5
Co
mp
ared
to
Rat
ing
s G
iven
by
All
Res
po
nd
ents
Mo
st Im
po
rtan
t Is
sues
Fac
ing
New
Yo
rk
Cit
y: M
anh
atta
n C
om
mu
nit
y B
oar
d #
5
Rat
ing
s o
f N
eig
hb
orh
oo
d S
ervi
ces:
M
anh
atta
n C
om
mu
nit
y B
oar
d #
5
5857 7573 8386 7981 8694 8995
1.H
ousi
ng
2.M
ass
Tra
nsit
3.E
duca
tion
1.F
ire p
rote
ctio
n se
rvic
es
2.E
mer
genc
y m
edic
al
serv
ices
3.S
ubw
ay s
ervi
ces
4.G
raffi
ti co
ntro
l
5.B
us s
ervi
ces
1.C
ontr
ol o
f str
eet n
oise
2.C
lean
lines
s of
you
r ne
ighb
orho
od
3.S
torm
wat
er d
rain
age
and
sew
er m
aint
enan
ce
4.M
aint
enan
ce o
f str
eets
an
d ro
ads
5.R
at c
ontr
ol

City
wid
e C
usto
mer
Sur
vey
Res
ults
15%24
%33%
44%
45%
52%
29%23
%
13% 12
%9%
3%
0%25
%50
%75
%10
0%
All N
ew Y
ork
City
Res
pond
ents
All M
anha
ttan
Res
pond
ents
All C
omm
unity
Boa
rd #
6 R
espo
nden
ts
Bac
kgro
un
d:
Man
hat
tan
Co
mm
un
ity
Bo
ard
#6
Su
rvey
Res
po
nse
s: M
anh
atta
n C
om
mu
nit
y B
oar
d #
6
Th
e N
eig
hb
orh
oo
ds
of
Man
hat
tan
C
om
mu
nit
y B
oar
d #
6
Sour
ce: N
YC P
lann
ing
Dep
artm
ent
Res
ult
sfr
om
NY
C F
eed
bac
k C
ityw
ide
Cu
sto
mer
Su
rvey
Man
hat
tan
Co
mm
un
ity
Bo
ard
#6 R
atin
gs
of
Nei
gh
bo
rho
od
as
a P
lace
to
Liv
e
Rat
ing
s o
f O
vera
ll Q
ual
ity
of
Lif
e in
New
Yo
rk C
ity
Exce
llent
Poor
Fair
Goo
d
Exce
llent
Poor
Fair
Goo
d
Exce
llent
Poor
Fair
Goo
d
Rat
ing
s o
f O
vera
ll Q
ual
ity
of
New
Yo
rk C
ity
Go
vern
men
t S
ervi
ces
11%
15%
45%
54%58
%
37%
28%23
%
12%
6%
7%4%
0%25
%50
%75
%10
0%
All N
ew Y
ork
City
Res
pond
ents
All M
anha
ttan
Res
pond
ents
All C
omm
unity
Boa
rd #
6 R
espo
nden
ts
38%46
%52%
44%38
%35%
15%
10%
5%6% 4%
7%
0%25
%50
%75
%10
0%
All N
ew Y
ork
City
Res
pond
ents
All M
anha
ttan
Res
pond
ents
All C
omm
unity
Boa
rd #
6 R
espo
nden
ts
Gen
der
•M
ale:
46%
•F
emal
e: 5
4%A
ge •<
18 y
ears
old
: 9%
•18
-54
year
s ol
d: 6
4%•
55+
yea
rs o
ld: 2
8%
Rac
e/E
thn
icit
y•
Non
-His
pani
c W
hite
: 77%
•N
on-H
ispa
nic
Bla
ck: 2
%•
Non
-His
pani
c A
sian
: 13%
•H
ispa
nic:
6%
•O
ther
: 2%
Po
pu
lati
on
an
d H
ou
seh
old
s•
Tot
al P
opul
atio
n: 1
38,9
71•
Tot
al H
ouse
hold
s: 7
9,27
8
Med
ian
An
nu
al H
ou
seh
old
Inco
me
•$8
9,71
4(2
006
Infla
tion-
Adj
uste
d D
olla
rs)
•32
8 R
espo
nses
•21
.1%
Res
pons
e R
ate
•±5
.4%
Mar
gin
of E
rror
(95
% C
onfid
ence
Inte
rval
)
See
deta
il be
low
Sou
rce:
U.S
. Cen
sus
Bur
eau
-20
06 A
mer
ican
Com
mun
ity S
urve
y, P
opul
atio
n D
ivis
ion
-N
ew Y
ork
City
Dep
artm
ent o
f City
Pla
nnin
g

City
wid
e C
usto
mer
Sur
vey
Res
ults
12%
26%
45%
18%
3%10
%54
%33
%N
eig
hb
orh
oo
d
Pu
blic
Saf
ety
Ind
ex
14%
34%
42%
10%
9%25
%51
%15
%M
ass
Tra
nsi
t S
ervi
ces
Ind
ex
21%
34%
36%
9%
14%
26%
46%
14%
Str
eets
an
d
Sid
ewal
ks
Ind
ex
17%
29%
41%
13%
7%22
%52
%19
%C
lean
ing
an
d
Mai
nte
nan
ce
Ind
ex
25%
39%
30%
6%
27%
38%
31%
4%P
ub
licE
du
cati
on
In
dex
42%
35%
19%
4%
43%
39%
16%
2%S
oci
al S
up
po
rt
Ser
vice
s In
dex
Ind
ex
Sco
reP
oo
rF
air
Go
od
Exc
elle
nt
Sur
vey
resp
onde
nts
wer
e as
ked
to n
ame
wha
t the
y th
ough
t w
ere
the
thre
e m
ost i
mpo
rtan
t iss
ues
faci
ng N
ew Y
ork
City
. T
he th
ree
resp
onse
s m
ost c
omm
only
giv
en b
y M
anha
ttan
Com
mun
ity B
oard
#6
resp
onde
nts
are
liste
d be
low
.
Hig
hest
Rat
edLo
wes
t Rat
ed
Sur
vey
resp
onde
nts
rate
d 24
ser
vice
s in
thei
r ne
ighb
orho
od.
The
hig
hest
and
low
est r
ated
ser
vice
s ar
e di
spla
yed
belo
w.
NYC
All
Com
mun
ity B
oard
#6
Res
pond
ents
All
New
Yor
k C
ity R
espo
nden
ts
Ind
ex R
atin
gs:
Man
hat
tan
Co
mm
un
ity
Bo
ard
#6
Co
mp
ared
to
Rat
ing
s G
iven
by
All
Res
po
nd
ents
Mo
st Im
po
rtan
t Is
sues
Fac
ing
New
Yo
rk
Cit
y: M
anh
atta
n C
om
mu
nit
y B
oar
d #
6
Rat
ing
s o
f N
eig
hb
orh
oo
d S
ervi
ces:
M
anh
atta
n C
om
mu
nit
y B
oar
d #
6
5857 7573 8393 7986 8691 8997
1.H
ousi
ng
2.M
ass
Tra
nsit
3.T
raffi
c C
onge
stio
n
1.F
ire p
rote
ctio
n se
rvic
es
2.E
mer
genc
y m
edic
al
serv
ices
3.R
emov
al o
f sno
w fr
om
city
str
eets
4.C
rime
cont
rol
5.P
ublic
libr
arie
s
1.C
ontr
ol o
f str
eet n
oise
2.P
edes
tria
n sa
fety
(c
ross
ing
inte
rsec
tions
)
3.R
at c
ontr
ol
4.M
aint
enan
ce o
f str
eets
an
d ro
ads
5.S
torm
wat
er d
rain
age
and
sew
er m
aint
enan
ce

City
wid
e C
usto
mer
Sur
vey
Res
ults
15%24
%
46%
44%
45%
42% 29
%23%
11%
12%9%
2%
0%25
%50
%75
%10
0%
All N
ew Y
ork
City
Res
pond
ents
All M
anha
ttan
Res
pond
ents
All C
omm
unity
Boa
rd #
7 R
espo
nden
ts
Bac
kgro
un
d:
Man
hat
tan
Co
mm
un
ity
Bo
ard
#7
Su
rvey
Res
po
nse
s: M
anh
atta
n C
om
mu
nit
y B
oar
d #
7
Th
e N
eig
hb
orh
oo
ds
of
Man
hat
tan
C
om
mu
nit
y B
oar
d #
7
Sour
ce: N
YC P
lann
ing
Dep
artm
ent
Res
ult
sfr
om
NY
C F
eed
bac
k C
ityw
ide
Cu
sto
mer
Su
rvey
Man
hat
tan
Co
mm
un
ity
Bo
ard
#7 R
atin
gs
of
Nei
gh
bo
rho
od
as
a P
lace
to
Liv
e
Rat
ing
s o
f O
vera
ll Q
ual
ity
of
Lif
e in
New
Yo
rk C
ity
Exce
llent
Poor
Fair
Goo
d
Exce
llent
Poor
Fair
Goo
d
Exce
llent
Poor
Fair
Goo
d
Rat
ing
s o
f O
vera
ll Q
ual
ity
of
New
Yo
rk C
ity
Go
vern
men
t S
ervi
ces
11%19
%
45%
54%
56%
37%
28%23
% 12%
6%
7%
2%
0%25
%50
%75
%10
0%
All N
ew Y
ork
City
Res
pond
ents
All M
anha
ttan
Res
pond
ents
All C
omm
unity
Boa
rd #
7 R
espo
nden
ts
38%46
%50%
44%38
%34%
15%
10%
5%8% 4%
8%
0%25
%50
%75
%10
0%
All N
ew Y
ork
City
Res
pond
ents
All M
anha
ttan
Res
pond
ents
All C
omm
unity
Boa
rd #
7 R
espo
nden
ts
Gen
der
•M
ale:
47%
•F
emal
e: 5
3%A
ge •<
18 y
ears
old
: 18%
•18
-54
year
s ol
d: 5
7%•
55+
yea
rs o
ld: 2
5%
Rac
e/E
thn
icit
y•
Non
-His
pani
c W
hite
: 73%
•N
on-H
ispa
nic
Bla
ck: 7
%•
Non
-His
pani
c A
sian
: 8%
•H
ispa
nic:
11%
•O
ther
: 2%
Po
pu
lati
on
an
d H
ou
seh
old
s•
Tot
al P
opul
atio
n: 2
16,8
12•
Tot
al H
ouse
hold
s: 1
07,9
16
Med
ian
An
nu
al H
ou
seh
old
Inco
me
•$9
0,63
3(2
006
Infla
tion-
Adj
uste
d D
olla
rs)
•36
1 R
espo
nses
•22
.5%
Res
pons
e R
ate
•±5
.2%
Mar
gin
of E
rror
(95
% C
onfid
ence
Inte
rval
)
See
deta
il be
low
Sou
rce:
U.S
. Cen
sus
Bur
eau
-20
06 A
mer
ican
Com
mun
ity S
urve
y, P
opul
atio
n D
ivis
ion
-N
ew Y
ork
City
Dep
artm
ent o
f City
Pla
nnin
g

City
wid
e C
usto
mer
Sur
vey
Res
ults
12%
26%
45%
18%
5%14
%50
%32
%N
eig
hb
orh
oo
d
Pu
blic
Saf
ety
Ind
ex
14%
34%
42%
10%
12%
29%
44%
15%
Mas
s T
ran
sit
Ser
vice
s In
dex
21%
34%
36%
9%
13%
27%
45%
16%
Str
eets
an
d
Sid
ewal
ks
Ind
ex
17%
29%
41%
13%
10%
23%
50%
18%
Cle
anin
g a
nd
M
ain
ten
ance
In
dex
25%
39%
30%
6%
33%
39%
23%
5%P
ub
licE
du
cati
on
In
dex
42%
35%
19%
4%
45%
32%
19%
4%S
oci
al S
up
po
rt
Ser
vice
s In
dex
Ind
ex
Sco
reP
oo
rF
air
Go
od
Exc
elle
nt
Sur
vey
resp
onde
nts
wer
e as
ked
to n
ame
wha
t the
y th
ough
t w
ere
the
thre
e m
ost i
mpo
rtan
t iss
ues
faci
ng N
ew Y
ork
City
. T
he th
ree
resp
onse
s m
ost c
omm
only
giv
en b
y M
anha
ttan
Com
mun
ity B
oard
#7
resp
onde
nts
are
liste
d be
low
.
Hig
hest
Rat
edLo
wes
t Rat
ed
Sur
vey
resp
onde
nts
rate
d 24
ser
vice
s in
thei
r ne
ighb
orho
od.
The
hig
hest
and
low
est r
ated
ser
vice
s ar
e di
spla
yed
belo
w.
NYC
All
Com
mun
ity B
oard
#7
Res
pond
ents
All
New
Yor
k C
ity R
espo
nden
ts
Ind
ex R
atin
gs:
Man
hat
tan
Co
mm
un
ity
Bo
ard
#7
Co
mp
ared
to
Rat
ing
s G
iven
by
All
Res
po
nd
ents
Mo
st Im
po
rtan
t Is
sues
Fac
ing
New
Yo
rk
Cit
y: M
anh
atta
n C
om
mu
nit
y B
oar
d #
7
Rat
ing
s o
f N
eig
hb
orh
oo
d S
ervi
ces:
M
anh
atta
n C
om
mu
nit
y B
oar
d #
7
5855 7567 8390 7987 8688 8995
1.H
ousi
ng
2.M
ass
Tra
nsit
3.E
duca
tion
1.F
ire p
rote
ctio
n se
rvic
es
2.N
eigh
borh
ood
park
s
3.E
mer
genc
y m
edic
al
serv
ices
4.N
eigh
borh
ood
play
grou
nds
5.A
vaila
bilit
y of
cul
tura
l ac
tiviti
es
1.C
ontr
ol o
f str
eet n
oise
2.R
at c
ontr
ol
3.M
aint
enan
ce o
f str
eets
an
d ro
ads
4.S
torm
wat
er d
rain
age
and
sew
er m
aint
enan
ce
5.R
ecyc
ling
serv
ices

City
wid
e C
usto
mer
Sur
vey
Res
ults
15%24
%38%
44%
45%
54% 29
%23%
12%8% 9%
0%25
%50
%75
%10
0%
All N
ew Y
ork
City
Res
pond
ents
All M
anha
ttan
Res
pond
ents
All C
omm
unity
Boa
rd #
8 R
espo
nden
ts
Bac
kgro
un
d:
Man
hat
tan
Co
mm
un
ity
Bo
ard
#8
Su
rvey
Res
po
nse
s: M
anh
atta
n C
om
mu
nit
y B
oar
d #
8
Sou
rce:
U.S
. Cen
sus
Bur
eau
-20
06 A
mer
ican
Com
mun
ity S
urve
y, P
opul
atio
n D
ivis
ion
-N
ew Y
ork
City
Dep
artm
ent o
f City
Pla
nnin
g
Th
e N
eig
hb
orh
oo
ds
of
Man
hat
tan
C
om
mu
nit
y B
oar
d #
8
Sour
ce: N
YC P
lann
ing
Dep
artm
ent
Res
ult
sfr
om
NY
C F
eed
bac
k C
ityw
ide
Cu
sto
mer
Su
rvey
Man
hat
tan
Co
mm
un
ity
Bo
ard
#8 R
atin
gs
of
Nei
gh
bo
rho
od
as
a P
lace
to
Liv
e
Rat
ing
s o
f O
vera
ll Q
ual
ity
of
Lif
e in
New
Yo
rk C
ity
Exce
llent
Poor
Fair
Goo
d
Exce
llent
Poor
Fair
Goo
d
Exce
llent
Poor
Fair
Goo
d
Rat
ing
s o
f O
vera
ll Q
ual
ity
of
New
Yo
rk C
ity
Go
vern
men
t S
ervi
ces
11%
15%
45%
54%62
%
37%
28%19
% 12%
6%
7%
3%
0%25
%50
%75
%10
0%
All N
ew Y
ork
City
Res
pond
ents
All M
anha
ttan
Res
pond
ents
All C
omm
unity
Boa
rd #
8 R
espo
nden
ts
38%46
%59%
44%38
%
31%
15%
6% 5% 4%
10%4%
0%25
%50
%75
%10
0%
All N
ew Y
ork
City
Res
pond
ents
All M
anha
ttan
Res
pond
ents
All C
omm
unity
Boa
rd #
8 R
espo
nden
ts
•33
6 R
espo
nses
•22
.9%
Res
pons
e R
ate
•±5
.3%
Mar
gin
of E
rror
(95
% C
onfid
ence
Inte
rval
)
Gen
der
•M
ale:
46%
•F
emal
e: 5
4%A
ge •<
18 y
ears
old
: 16%
•18
-54
year
s ol
d: 5
7%•
55+
yea
rs o
ld: 2
8%
Rac
e/E
thn
icit
y•
Non
-His
pani
c W
hite
: 81%
•N
on-H
ispa
nic
Bla
ck: 4
%•
Non
-His
pani
c A
sian
: 7%
•H
ispa
nic:
6%
•O
ther
: 1%
Po
pu
lati
on
an
d H
ou
seh
old
s•
Tot
al P
opul
atio
n: 2
14,4
59•
Tot
al H
ouse
hold
s: 1
14,5
35
Med
ian
An
nu
al H
ou
seh
old
Inco
me
•$9
6,24
2(2
006
Infla
tion-
Adj
uste
d D
olla
rs)
See
deta
il be
low

City
wid
e C
usto
mer
Sur
vey
Res
ults
12%
26%
45%
18%
2%9%
53%
36%
Nei
gh
bo
rho
od
P
ub
lic S
afet
y In
dex
14%
34%
42%
10%
12%
27%
47%
15%
Mas
s T
ran
sit
Ser
vice
s In
dex
21%
34%
36%
9%
12%
28%
45%
15%
Str
eets
an
d
Sid
ewal
ks
Ind
ex
17%
29%
41%
13%
7%21
%51
%21
%C
lean
ing
an
d
Mai
nte
nan
ce
Ind
ex
25%
39%
30%
6%
33%
44%
21%
2%P
ub
licE
du
cati
on
In
dex
42%
35%
19%
4%
46%
34%
17%
3%S
oci
al S
up
po
rt
Ser
vice
s In
dex
Ind
ex
Sco
reP
oo
rF
air
Go
od
Exc
elle
nt
Sur
vey
resp
onde
nts
wer
e as
ked
to n
ame
wha
t the
y th
ough
t w
ere
the
thre
e m
ost i
mpo
rtan
t iss
ues
faci
ng N
ew Y
ork
City
. T
he th
ree
resp
onse
s m
ost c
omm
only
giv
en b
y M
anha
ttan
Com
mun
ity B
oard
#8
resp
onde
nts
are
liste
d be
low
.
Hig
hest
Rat
edLo
wes
t Rat
ed
Sur
vey
resp
onde
nts
rate
d 24
ser
vice
s in
thei
r ne
ighb
orho
od.
The
hig
hest
and
low
est r
ated
ser
vice
s ar
e di
spla
yed
belo
w.
NYC
All
Com
mun
ity B
oard
#8
Res
pond
ents
All
New
Yor
k C
ity R
espo
nden
ts
Ind
ex R
atin
gs:
Man
hat
tan
Co
mm
un
ity
Bo
ard
#8
Co
mp
ared
to
Rat
ing
s G
iven
by
All
Res
po
nd
ents
Mo
st Im
po
rtan
t Is
sues
Fac
ing
New
Yo
rk
Cit
y: M
anh
atta
n C
om
mu
nit
y B
oar
d #
8
Rat
ing
s o
f N
eig
hb
orh
oo
d S
ervi
ces:
M
anh
atta
n C
om
mu
nit
y B
oar
d #
8
5854 7567 8393 7988 8688 8998
1.M
ass
Tra
nsit
2.H
ousi
ng
3.E
duca
tion
1.F
ire p
rote
ctio
n se
rvic
es
2.E
mer
genc
y m
edic
al
serv
ices
3.N
eigh
borh
ood
park
s
4.N
eigh
borh
ood
play
grou
nds
5.H
ouse
hold
gar
bage
pic
k-up
1.C
ontr
ol o
f str
eet n
oise
2.R
at c
ontr
ol
3.S
ubw
ay s
ervi
ces
4.M
aint
enan
ce o
f str
eets
an
d ro
ads
5.M
aint
enan
ce o
f si
dew
alks

City
wid
e C
usto
mer
Sur
vey
Res
ults
15%24
%
11%
44%
45%
36%
29%23
%
38%
12%
16% 9%
0%25
%50
%75
%10
0%
All N
ew Y
ork
City
Res
pond
ents
All M
anha
ttan
Res
pond
ents
All C
omm
unity
Boa
rd #
9 R
espo
nden
ts
Bac
kgro
un
d:
Man
hat
tan
Co
mm
un
ity
Bo
ard
#9
Su
rvey
Res
po
nse
s: M
anh
atta
n C
om
mu
nit
y B
oar
d #
9
Th
e N
eig
hb
orh
oo
ds
of
Man
hat
tan
C
om
mu
nit
y B
oar
d #
9
Sour
ce: N
YC P
lann
ing
Dep
artm
ent
Res
ult
sfr
om
NY
C F
eed
bac
k C
ityw
ide
Cu
sto
mer
Su
rvey
Man
hat
tan
Co
mm
un
ity
Bo
ard
#9 R
atin
gs
of
Nei
gh
bo
rho
od
as
a P
lace
to
Liv
e
Rat
ing
s o
f O
vera
ll Q
ual
ity
of
Lif
e in
New
Yo
rk C
ity
Exce
llent
Poor
Fair
Goo
d
Exce
llent
Poor
Fair
Goo
d
Exce
llent
Poor
Fair
Goo
d
Rat
ing
s o
f O
vera
ll Q
ual
ity
of
New
Yo
rk C
ity
Go
vern
men
t S
ervi
ces
11%
45%
54%
49%
37%
28%
35%
12%
10%
7% 6%
7%
0%25
%50
%75
%10
0%
All N
ew Y
ork
City
Res
pond
ents
All M
anha
ttan
Res
pond
ents
All C
omm
unity
Boa
rd #
9 R
espo
nden
ts
38%46
%
44%
44%38
%
39%
15%
13%
5%4% 4%
10%
0%25
%50
%75
%10
0%
All N
ew Y
ork
City
Res
pond
ents
All M
anha
ttan
Res
pond
ents
All C
omm
unity
Boa
rd #
9 R
espo
nden
ts
Rac
e/E
thn
icit
y•
Non
-His
pani
c W
hite
: 27%
•N
on-H
ispa
nic
Bla
ck: 2
3%•
Non
-His
pani
c A
sian
: 6%
•H
ispa
nic:
42%
•O
ther
: 2%
Po
pu
lati
on
an
d H
ou
seh
old
s•
Tot
al P
opul
atio
n: 1
22,7
36•
Tot
al H
ouse
hold
s: 4
6,25
3
Med
ian
An
nu
al H
ou
seh
old
Inco
me
•$2
8,76
2(2
006
Infla
tion-
Adj
uste
d D
olla
rs)
Gen
der
•M
ale:
48%
•F
emal
e: 5
2%A
ge •<
18 y
ears
old
: 17%
•18
-54
year
s ol
d: 6
2%•
55+
yea
rs o
ld: 2
1%
•52
8 R
espo
nses
•17
.6%
Res
pons
e R
ate
•±4
.3%
Mar
gin
of E
rror
(95
% C
onfid
ence
Inte
rval
)
See
deta
il be
low
Sou
rce:
U.S
. Cen
sus
Bur
eau
-20
06 A
mer
ican
Com
mun
ity S
urve
y, P
opul
atio
n D
ivis
ion
-N
ew Y
ork
City
Dep
artm
ent o
f City
Pla
nnin
g

City
wid
e C
usto
mer
Sur
vey
Res
ults
12%
26%
45%
18%
14%
31%
41%
13%
Nei
gh
bo
rho
od
P
ub
lic S
afet
y In
dex
14%
34%
42%
10%
13%
31%
43%
14%
Mas
s T
ran
sit
Ser
vice
s In
dex
21%
34%
36%
9%
22%
31%
39%
8%S
tree
ts a
nd
S
idew
alks
In
dex
17%
29%
41%
13%
22%
32%
37%
9%C
lean
ing
an
d
Mai
nte
nan
ce
Ind
ex
25%
39%
30%
6%
31%
37%
25%
7%P
ub
licE
du
cati
on
In
dex
42%
35%
19%
4%
42%
34%
20%
3%S
oci
al S
up
po
rt
Ser
vice
s In
dex
Ind
ex
Sco
reP
oo
rF
air
Go
od
Exc
elle
nt
Sur
vey
resp
onde
nts
wer
e as
ked
to n
ame
wha
t the
y th
ough
t w
ere
the
thre
e m
ost i
mpo
rtan
t iss
ues
faci
ng N
ew Y
ork
City
. T
he th
ree
resp
onse
s m
ost c
omm
only
giv
en b
y M
anha
ttan
Com
mun
ity B
oard
#9
resp
onde
nts
are
liste
d be
low
.
Hig
hest
Rat
edLo
wes
t Rat
ed
Sur
vey
resp
onde
nts
rate
d 24
ser
vice
s in
thei
r ne
ighb
orho
od.
The
hig
hest
and
low
est r
ated
ser
vice
s ar
e di
spla
yed
belo
w.
NYC
All
Com
mun
ity B
oard
#9
Res
pond
ents
All
New
Yor
k C
ity R
espo
nden
ts
Ind
ex R
atin
gs:
Man
hat
tan
Co
mm
un
ity
Bo
ard
#9
Co
mp
ared
to
Rat
ing
s G
iven
by
All
Res
po
nd
ents
Mo
st Im
po
rtan
t Is
sues
Fac
ing
New
Yo
rk
Cit
y: M
anh
atta
n C
om
mu
nit
y B
oar
d #
9
Rat
ing
s o
f N
eig
hb
orh
oo
d S
ervi
ces:
M
anh
atta
n C
om
mu
nit
y B
oar
d #
9
5858 7569 8378 7978 8687 8986
1.H
ousi
ng
2.M
ass
Tra
nsit
3.E
duca
tion
1.F
ire p
rote
ctio
n se
rvic
es
2.E
mer
genc
y m
edic
al
serv
ices
3.N
eigh
borh
ood
park
s
4.S
ubw
ay s
ervi
ces
5.P
edes
tria
n sa
fety
(c
ross
ing
inte
rsec
tions
)
1.C
ontr
ol o
f str
eet n
oise
2.R
at c
ontr
ol
3.C
lean
lines
s of
you
r ne
ighb
orho
od
4.P
olic
e-C
omm
unity
re
latio
ns
5.A
vaila
bilit
y of
cul
tura
l ac
tiviti
es

City
wid
e C
usto
mer
Sur
vey
Res
ults
15%24
%
44%
45%
33%
29%23
%
48%
12%
16%
4%
9%
0%25
%50
%75
%10
0%
All N
ew Y
ork
City
Res
pond
ents
All M
anha
ttan
Res
pond
ents
All C
omm
unity
Boa
rd #
10 R
espo
nden
ts
Bac
kgro
un
d:
Man
hat
tan
Co
mm
un
ity
Bo
ard
#10
Su
rvey
Res
po
nse
s: M
anh
atta
n C
om
mu
nit
y B
oar
d #
10
Th
e N
eig
hb
orh
oo
ds
of
Man
hat
tan
C
om
mu
nit
y B
oar
d #
10 Sour
ce: N
YC P
lann
ing
Dep
artm
ent
Res
ult
sfr
om
NY
C F
eed
bac
k C
ityw
ide
Cu
sto
mer
Su
rvey
Man
hat
tan
Co
mm
un
ity
Bo
ard
#10 R
atin
gs
of
Nei
gh
bo
rho
od
as
a P
lace
to
Liv
e
Rat
ing
s o
f O
vera
ll Q
ual
ity
of
Lif
e in
New
Yo
rk C
ity
Exce
llent
Poor
Fair
Goo
d
Exce
llent
Poor
Fair
Goo
d
Exce
llent
Poor
Fair
Goo
d
Rat
ing
s o
f O
vera
ll Q
ual
ity
of
New
Yo
rk C
ity
Go
vern
men
t S
ervi
ces
11%
45%
54%
41%
37%
28%
38%
12%
15%
6% 6%
7%
0%25
%50
%75
%10
0%
All N
ew Y
ork
City
Res
pond
ents
All M
anha
ttan
Res
pond
ents
All C
omm
unity
Boa
rd #
10 R
espo
nden
ts
38%46
%
34%
44%38
%
44%
15%
19%
5%3% 4%
10%
0%25
%50
%75
%10
0%
All N
ew Y
ork
City
Res
pond
ents
All M
anha
ttan
Res
pond
ents
All C
omm
unity
Boa
rd #
10 R
espo
nden
ts
Gen
der
•M
ale:
45%
•F
emal
e: 5
5%A
ge •<
18 y
ears
old
: 26%
•18
-54
year
s ol
d: 5
6%•
55+
yea
rs o
ld: 1
8%
Rac
e/E
thn
icit
y•
Non
-His
pani
c W
hite
: 7%
•N
on-H
ispa
nic
Bla
ck: 6
9%•
Non
-His
pani
c A
sian
: 2%
•H
ispa
nic:
18%
•O
ther
: 3%
Po
pu
lati
on
an
d H
ou
seh
old
s•
Tot
al P
opul
atio
n: 1
18,1
43•
Tot
al H
ouse
hold
s: 4
8,59
3
Med
ian
An
nu
al H
ou
seh
old
Inco
me
•$2
7,00
7(2
006
Infla
tion-
Adj
uste
d D
olla
rs)
•51
0 R
espo
nses
•17
.0%
Res
pons
e R
ate
•±4
.3%
Mar
gin
of E
rror
(95
% C
onfid
ence
Inte
rval
)
See
deta
il be
low
Sou
rce:
U.S
. Cen
sus
Bur
eau
-20
06 A
mer
ican
Com
mun
ity S
urve
y, P
opul
atio
n D
ivis
ion
-N
ew Y
ork
City
Dep
artm
ent o
f City
Pla
nnin
g

City
wid
e C
usto
mer
Sur
vey
Res
ults
12%
26%
45%
18%
20%
35%
34%
10%
Nei
gh
bo
rho
od
P
ub
lic S
afet
y In
dex
14%
34%
42%
10%
17%
38%
34%
10%
Mas
s T
ran
sit
Ser
vice
s In
dex
21%
34%
36%
9%
29%
37%
28%
7%S
tree
ts a
nd
S
idew
alks
In
dex
17%
29%
41%
13%
25%
34%
32%
8%C
lean
ing
an
d
Mai
nte
nan
ce
Ind
ex
25%
39%
30%
6%
35%
40%
20%
4%P
ub
licE
du
cati
on
In
dex
42%
35%
19%
4%
51%
34%
12%
3%S
oci
al S
up
po
rt
Ser
vice
s In
dex
Ind
ex
Sco
reP
oo
rF
air
Go
od
Exc
elle
nt
Sur
vey
resp
onde
nts
wer
e as
ked
to n
ame
wha
t the
y th
ough
t w
ere
the
thre
e m
ost i
mpo
rtan
t iss
ues
faci
ng N
ew Y
ork
City
. T
he th
ree
resp
onse
s m
ost c
omm
only
giv
en b
y M
anha
ttan
Com
mun
ity B
oard
#10
res
pond
ents
are
list
ed b
elow
.
Hig
hest
Rat
edLo
wes
t Rat
ed
Sur
vey
resp
onde
nts
rate
d 24
ser
vice
s in
thei
r ne
ighb
orho
od.
The
hig
hest
and
low
est r
ated
ser
vice
s ar
e di
spla
yed
belo
w.
NYC
All
Com
mun
ity B
oard
#10
Res
pond
ents
All
New
Yor
k C
ity R
espo
nden
ts
Ind
ex R
atin
gs:
Man
hat
tan
Co
mm
un
ity
Bo
ard
#10
C
om
par
ed t
o R
atin
gs
Giv
en b
y A
ll R
esp
on
den
tsM
ost
Imp
ort
ant
Issu
es F
acin
g N
ew Y
ork
C
ity:
Man
hat
tan
Co
mm
un
ity
Bo
ard
#10
Rat
ing
s o
f N
eig
hb
orh
oo
d S
ervi
ces:
M
anh
atta
n C
om
mu
nit
y B
oar
d #
10
5849 7565 8375 7971 8683 8980
1.H
ousi
ng
2.C
rime
3.E
duca
tion
1.F
ire p
rote
ctio
n se
rvic
es
2.E
mer
genc
y m
edic
al
serv
ices
3.N
eigh
borh
ood
park
s
4.N
eigh
borh
ood
play
grou
nds
5.C
ondi
tion
of s
tree
t tre
es
1.C
ontr
ol o
f str
eet n
oise
2.R
at c
ontr
ol
3.P
olic
e-C
omm
unity
re
latio
ns
4.C
lean
lines
s of
you
r ne
ighb
orho
od
5.M
aint
enan
ce o
f str
eets
an
d ro
ads

City
wid
e C
usto
mer
Sur
vey
Res
ults
15%24
%
44%
45%
35%
29%23
%
41%
12%
20%
4%
9%
0%25
%50
%75
%10
0%
All N
ew Y
ork
City
Res
pond
ents
All M
anha
ttan
Res
pond
ents
All C
omm
unity
Boa
rd #
11 R
espo
nden
ts
Bac
kgro
un
d:
Man
hat
tan
Co
mm
un
ity
Bo
ard
#11
Su
rvey
Res
po
nse
s: M
anh
atta
n C
om
mu
nit
y B
oar
d #
11
Th
e N
eig
hb
orh
oo
ds
of
Man
hat
tan
C
om
mu
nit
y B
oar
d #
11 Sour
ce: N
YC P
lann
ing
Dep
artm
ent
Res
ult
sfr
om
NY
C F
eed
bac
k C
ityw
ide
Cu
sto
mer
Su
rvey
Man
hat
tan
Co
mm
un
ity
Bo
ard
#11 R
atin
gs
of
Nei
gh
bo
rho
od
as
a P
lace
to
Liv
e
Rat
ing
s o
f O
vera
ll Q
ual
ity
of
Lif
e in
New
Yo
rk C
ity
Exce
llent
Poor
Fair
Goo
d
Exce
llent
Poor
Fair
Goo
d
Exce
llent
Poor
Fair
Goo
d
Rat
ing
s o
f O
vera
ll Q
ual
ity
of
New
Yo
rk C
ity
Go
vern
men
t S
ervi
ces
11%
45%
54%
47%
37%
28%
37%
12%
12%
4% 6%
7%
0%25
%50
%75
%10
0%
All N
ew Y
ork
City
Res
pond
ents
All M
anha
ttan
Res
pond
ents
All C
omm
unity
Boa
rd #
11 R
espo
nden
ts
38%46
%
32%
44%38
%
48%
15%
10%
17%
5%3% 4%
0%25
%50
%75
%10
0%
All N
ew Y
ork
City
Res
pond
ents
All M
anha
ttan
Res
pond
ents
All C
omm
unity
Boa
rd #
11 R
espo
nden
ts
Gen
der
•M
ale:
47%
•F
emal
e: 5
3%A
ge •<
18 y
ears
old
: 28%
•18
-54
year
s ol
d: 5
3%•
55+
yea
rs o
ld: 1
9%
Rac
e/E
thn
icit
y•
Non
-His
pani
c W
hite
: 11%
•N
on-H
ispa
nic
Bla
ck: 3
1%•
Non
-His
pani
c A
sian
: 4%
•H
ispa
nic:
52%
•O
ther
: 2%
Po
pu
lati
on
an
d H
ou
seh
old
s•
Tot
al P
opul
atio
n: 1
34,2
87•
Tot
al H
ouse
hold
s: 4
5,68
2
Med
ian
An
nu
al H
ou
seh
old
Inco
me
•$2
7,01
2(2
006
Infla
tion-
Adj
uste
d D
olla
rs)
•51
3 R
espo
nses
•17
.1%
Res
pons
e R
ate
•±4
.3%
Mar
gin
of E
rror
(95
% C
onfid
ence
Inte
rval
)
See
deta
il be
low
Sou
rce:
U.S
. Cen
sus
Bur
eau
-20
06 A
mer
ican
Com
mun
ity S
urve
y, P
opul
atio
n D
ivis
ion
-N
ew Y
ork
City
Dep
artm
ent o
f City
Pla
nnin
g

City
wid
e C
usto
mer
Sur
vey
Res
ults
12%
26%
45%
18%
17%
28%
40%
14%
Nei
gh
bo
rho
od
P
ub
lic S
afet
y In
dex
14%
34%
42%
10%
14%
32%
42%
12%
Mas
s T
ran
sit
Ser
vice
s In
dex
21%
34%
36%
9%
25%
34%
35%
7%S
tree
ts a
nd
S
idew
alks
In
dex
17%
29%
41%
13%
25%
32%
35%
7%C
lean
ing
an
d
Mai
nte
nan
ce
Ind
ex
25%
39%
30%
6%
26%
39%
31%
5%P
ub
licE
du
cati
on
In
dex
42%
35%
19%
4%
43%
31%
22%
3%S
oci
al S
up
po
rt
Ser
vice
s In
dex
Ind
ex
Sco
reP
oo
rF
air
Go
od
Exc
elle
nt
Sur
vey
resp
onde
nts
wer
e as
ked
to n
ame
wha
t the
y th
ough
t w
ere
the
thre
e m
ost i
mpo
rtan
t iss
ues
faci
ng N
ew Y
ork
City
. T
he th
ree
resp
onse
s m
ost c
omm
only
giv
en b
y M
anha
ttan
Com
mun
ity B
oard
#11
res
pond
ents
are
list
ed b
elow
.
Hig
hest
Rat
edLo
wes
t Rat
ed
Sur
vey
resp
onde
nts
rate
d 24
ser
vice
s in
thei
r ne
ighb
orho
od.
The
hig
hest
and
low
est r
ated
ser
vice
s ar
e di
spla
yed
belo
w.
NYC
All
Com
mun
ity B
oard
#11
Res
pond
ents
All
New
Yor
k C
ity R
espo
nden
ts
Ind
ex R
atin
gs:
Man
hat
tan
Co
mm
un
ity
Bo
ard
#11
C
om
par
ed t
o R
atin
gs
Giv
en b
y A
ll R
esp
on
den
tsM
ost
Imp
ort
ant
Issu
es F
acin
g N
ew Y
ork
C
ity:
Man
hat
tan
Co
mm
un
ity
Bo
ard
#11
Rat
ing
s o
f N
eig
hb
orh
oo
d S
ervi
ces:
M
anh
atta
n C
om
mu
nit
y B
oar
d #
11
5857 7574 8375 7975 8686 8983
1.H
ousi
ng
2.C
rime
3.M
ass
Tra
nsit
1.F
ire p
rote
ctio
n se
rvic
es
2.E
mer
genc
y m
edic
al
serv
ices
3.C
ondi
tion
of s
tree
t tre
es
4.P
arki
ng e
nfor
cem
ent
5.S
ubw
ay s
ervi
ces
1.C
ontr
ol o
f str
eet n
oise
2.R
at c
ontr
ol
3.C
lean
lines
s of
you
r ne
ighb
orho
od
4.P
olic
e-C
omm
unity
re
latio
ns
5.M
aint
enan
ce o
f str
eets
an
d ro
ads

City
wid
e C
usto
mer
Sur
vey
Res
ults
15%24
%
9%
44%
45%
35%
29%23
%
33%
12%
23% 9%
0%25
%50
%75
%10
0%
All N
ew Y
ork
City
Res
pond
ents
All M
anha
ttan
Res
pond
ents
All C
omm
unity
Boa
rd #
12 R
espo
nden
ts
Bac
kgro
un
d:
Man
hat
tan
Co
mm
un
ity
Bo
ard
#12
Su
rvey
Res
po
nse
s: M
anh
atta
n C
om
mu
nit
y B
oar
d #
12
Th
e N
eig
hb
orh
oo
ds
of
Man
hat
tan
C
om
mu
nit
y B
oar
d #
12 Sour
ce: N
YC P
lann
ing
Dep
artm
ent
Res
ult
sfr
om
NY
C F
eed
bac
k C
ityw
ide
Cu
sto
mer
Su
rvey
Man
hat
tan
Co
mm
un
ity
Bo
ard
#12 R
atin
gs
of
Nei
gh
bo
rho
od
as
a P
lace
to
Liv
e
Rat
ing
s o
f O
vera
ll Q
ual
ity
of
Lif
e in
New
Yo
rk C
ity
Exce
llent
Poor
Fair
Goo
d
Exce
llent
Poor
Fair
Goo
d
Exce
llent
Poor
Fair
Goo
d
Rat
ing
s o
f O
vera
ll Q
ual
ity
of
New
Yo
rk C
ity
Go
vern
men
t S
ervi
ces
11%
45%
54%
46%
37%
28%
35%
12%
16%
4% 6%
7%
0%25
%50
%75
%10
0%
All N
ew Y
ork
City
Res
pond
ents
All M
anha
ttan
Res
pond
ents
All C
omm
unity
Boa
rd #
12 R
espo
nden
ts
24%
38%
45%
46%
44%
23%
38%
15%
10%
5% 4%
8%
0%25
%50
%75
%10
0%
All N
ew Y
ork
City
Res
pond
ents
All M
anha
ttan
Res
pond
ents
All C
omm
unity
Boa
rd #
12 R
espo
nden
ts
Gen
der
•M
ale:
48%
•F
emal
e: 5
2%A
ge •<
18 y
ears
old
: 22%
•18
-54
year
s ol
d: 5
5%•
55+
yea
rs o
ld: 2
3%
Rac
e/E
thn
icit
y•
Non
-His
pani
c W
hite
: 14%
•N
on-H
ispa
nic
Bla
ck: 9
%•
Non
-His
pani
c A
sian
: 1%
•H
ispa
nic:
74%
•O
ther
: 2%
Po
pu
lati
on
an
d H
ou
seh
old
s•
Tot
al P
opul
atio
n: 2
08,8
67•
Tot
al H
ouse
hold
s: 7
0,15
3
Med
ian
An
nu
al H
ou
seh
old
Inco
me
•$3
2,48
7(2
006
Infla
tion-
Adj
uste
d D
olla
rs)
•35
1 R
espo
nses
•14
.4%
Res
pons
e R
ate
•±5
.2%
Mar
gin
of E
rror
(95
% C
onfid
ence
Inte
rval
)
See
deta
il be
low
Sou
rce:
U.S
. Cen
sus
Bur
eau
-20
06 A
mer
ican
Com
mun
ity S
urve
y, P
opul
atio
n D
ivis
ion
-N
ew Y
ork
City
Dep
artm
ent o
f City
Pla
nnin
g

City
wid
e C
usto
mer
Sur
vey
Res
ults
12%
26%
45%
18%
16%
28%
38%
18%
Nei
gh
bo
rho
od
P
ub
lic S
afet
y In
dex
14%
34%
42%
10%
16%
34%
35%
15%
Mas
s T
ran
sit
Ser
vice
s In
dex
21%
34%
36%
9%
29%
32%
29%
10%
Str
eets
an
d
Sid
ewal
ks
Ind
ex
17%
29%
41%
13%
25%
32%
33%
11%
Cle
anin
g a
nd
M
ain
ten
ance
In
dex
25%
39%
30%
6%
24%
34%
31%
10%
Pu
blic
Ed
uca
tio
n
Ind
ex
42%
35%
19%
4%
42%
34%
17%
7%S
oci
al S
up
po
rt
Ser
vice
s In
dex
Ind
ex
Sco
reP
oo
rF
air
Go
od
Exc
elle
nt
Sur
vey
resp
onde
nts
wer
e as
ked
to n
ame
wha
t the
y th
ough
t w
ere
the
thre
e m
ost i
mpo
rtan
t iss
ues
faci
ng N
ew Y
ork
City
. T
he th
ree
resp
onse
s m
ost c
omm
only
giv
en b
y M
anha
ttan
Com
mun
ity B
oard
#12
res
pond
ents
are
list
ed b
elow
.
Hig
hest
Rat
edLo
wes
t Rat
ed
Sur
vey
resp
onde
nts
rate
d 24
ser
vice
s in
thei
r ne
ighb
orho
od.
The
hig
hest
and
low
est r
ated
ser
vice
s ar
e di
spla
yed
belo
w.
NYC
All
Com
mun
ity B
oard
#12
Res
pond
ents
All
New
Yor
k C
ity R
espo
nden
ts
Ind
ex R
atin
gs:
Man
hat
tan
Co
mm
un
ity
Bo
ard
#12
C
om
par
ed t
o R
atin
gs
Giv
en b
y A
ll R
esp
on
den
tsM
ost
Imp
ort
ant
Issu
es F
acin
g N
ew Y
ork
C
ity:
Man
hat
tan
Co
mm
un
ity
Bo
ard
#12
Rat
ing
s o
f N
eig
hb
orh
oo
d S
ervi
ces:
M
anh
atta
n C
om
mu
nit
y B
oar
d #
12
5858 7576 8375 7971 8684 8984
1.H
ousi
ng
2.M
ass
Tra
nsit
3.C
rime
1.F
ire p
rote
ctio
n se
rvic
es
2.E
mer
genc
y m
edic
al
serv
ices
3.N
eigh
borh
ood
park
s
4.C
ondi
tion
of s
tree
t tre
es
5.N
eigh
borh
ood
play
grou
nds
1.C
ontr
ol o
f str
eet n
oise
2.R
at c
ontr
ol
3.G
raffi
ti co
ntro
l
4.C
lean
lines
s of
you
r ne
ighb
orho
od
5.P
olic
e-C
omm
unity
re
latio
ns

City
wid
e C
usto
mer
Sur
vey
Res
ults
15%
13%
16%
44%
50%55
%
29%28
%24%
12%8%
5%
0%25
%50
%75
%10
0%
All N
ew Y
ork
City
Res
pond
ents
All Q
ueen
s R
espo
nden
ts
All C
omm
unity
Boa
rd #
1 R
espo
nden
ts
Bac
kgro
un
d:
Qu
een
s C
om
mu
nit
y B
oar
d #
1S
urv
ey R
esp
on
ses:
Qu
een
s C
om
mu
nit
y B
oar
d #
1
Th
e N
eig
hb
orh
oo
ds
of
Qu
een
s C
om
mu
nit
y B
oar
d #
1
Sour
ce: N
YC P
lann
ing
Dep
artm
ent
Res
ult
sfr
om
NY
C F
eed
bac
k C
ityw
ide
Cu
sto
mer
Su
rvey
Qu
een
s C
om
mu
nit
y B
oar
d #
1
Rat
ing
s o
f N
eig
hb
orh
oo
d a
s a
Pla
ce t
o L
ive
Rat
ing
s o
f O
vera
ll Q
ual
ity
of
Lif
e in
New
Yo
rk C
ity
Exce
llent
Poor
Fair
Goo
d
Exce
llent
Poor
Fair
Goo
d
Exce
llent
Poor
Fair
Goo
d
Rat
ing
s o
f O
vera
ll Q
ual
ity
of
New
Yo
rk C
ity
Go
vern
men
t S
ervi
ces
45%
47%
50%
37%
39%37
%
12%
11%8%
4%4% 6%
0%25
%50
%75
%10
0%
All N
ew Y
ork
City
Res
pond
ents
All Q
ueen
s R
espo
nden
ts
All C
omm
unity
Boa
rd #
1 R
espo
nden
ts
38%
38%
37%
44%
44%
47%
15%
14%
12%
4%4% 4%
0%25
%50
%75
%10
0%
All N
ew Y
ork
City
Res
pond
ents
All Q
ueen
s R
espo
nden
ts
All C
omm
unity
Boa
rd #
1 R
espo
nden
ts
Gen
der
•M
ale:
48%
•F
emal
e: 5
2%A
ge •<
18 y
ears
old
: 19%
•18
-54
year
s ol
d: 6
0%•
55+
yea
rs o
ld: 2
1%
Rac
e/E
thn
icit
y•
Non
-His
pani
c W
hite
: 46%
•N
on-H
ispa
nic
Bla
ck: 7
%•
Non
-His
pani
c A
sian
: 13%
•H
ispa
nic:
31%
•O
ther
: 3%
Po
pu
lati
on
an
d H
ou
seh
old
s•
Tot
al P
opul
atio
n: 1
90,2
47•
Tot
al H
ouse
hold
s: 7
7,06
0
Med
ian
An
nu
al H
ou
seh
old
Inco
me
•$4
2,11
3(2
006
Infla
tion-
Adj
uste
d D
olla
rs)
•64
5 R
espo
nses
•21
.5%
Res
pons
e R
ate
•±3
.9%
Mar
gin
of E
rror
(95
% C
onfid
ence
Inte
rval
)
See
deta
il be
low
Sou
rce:
U.S
. Cen
sus
Bur
eau
-20
06 A
mer
ican
Com
mun
ity S
urve
y, P
opul
atio
n D
ivis
ion
-N
ew Y
ork
City
Dep
artm
ent o
f City
Pla
nnin
g

City
wid
e C
usto
mer
Sur
vey
Res
ults
12%
26%
45%
18%
8%24
%51
%17
%N
eig
hb
orh
oo
d
Pu
blic
Saf
ety
Ind
ex
14%
34%
42%
10%
14%
35%
43%
8%M
ass
Tra
nsi
t S
ervi
ces
Ind
ex
21%
34%
36%
9%
16%
34%
41%
9%S
tree
ts a
nd
S
idew
alks
In
dex
17%
29%
41%
13%
14%
30%
44%
12%
Cle
anin
g a
nd
M
ain
ten
ance
In
dex
25%
39%
30%
6%
24%
38%
30%
7%P
ub
licE
du
cati
on
In
dex
42%
35%
19%
4%
35%
39%
21%
5%S
oci
al S
up
po
rt
Ser
vice
s In
dex
Ind
ex
Sco
reP
oo
rF
air
Go
od
Exc
elle
nt
Sur
vey
resp
onde
nts
wer
e as
ked
to n
ame
wha
t the
y th
ough
t w
ere
the
thre
e m
ost i
mpo
rtan
t iss
ues
faci
ng N
ew Y
ork
City
. T
he th
ree
resp
onse
s m
ost c
omm
only
giv
en b
y Q
ueen
s C
omm
unity
Boa
rd #
1 re
spon
dent
s ar
e lis
ted
belo
w.
Hig
hest
Rat
edLo
wes
t Rat
ed
Sur
vey
resp
onde
nts
rate
d 24
ser
vice
s in
thei
r ne
ighb
orho
od.
The
hig
hest
and
low
est r
ated
ser
vice
s ar
e di
spla
yed
belo
w.
NYC
All
Com
mun
ity B
oard
#1
Res
pond
ents
All
New
Yor
k C
ity R
espo
nden
ts
Ind
ex R
atin
gs:
Qu
een
s C
om
mu
nit
y B
oar
d #
1 C
om
par
ed t
o R
atin
gs
Giv
en b
y A
ll R
esp
on
den
tsM
ost
Imp
ort
ant
Issu
es F
acin
g N
ew Y
ork
C
ity:
Qu
een
s C
om
mu
nit
y B
oar
d #
1
Rat
ing
s o
f N
eig
hb
orh
oo
d S
ervi
ces:
Q
uee
ns
Co
mm
un
ity
Bo
ard
#1
5865 7576 8386 7984 8686 8992
1.H
ousi
ng
2.M
ass
Tra
nsit
3.E
duca
tion
1.F
ire p
rote
ctio
n se
rvic
es
2.E
mer
genc
y m
edic
al
serv
ices
3.H
ouse
hold
gar
bage
pic
k-up
4.R
ecyc
ling
serv
ices
5.P
edes
tria
n sa
fety
(c
ross
ing
inte
rsec
tions
)
1.C
ontr
ol o
f str
eet n
oise
2.G
raffi
ti co
ntro
l
3.A
vaila
bilit
y of
cul
tura
l ac
tiviti
es
4.S
torm
wat
er d
rain
age
and
sew
er m
aint
enan
ce
5.R
at c
ontr
ol

City
wid
e C
usto
mer
Sur
vey
Res
ults
15%
13%
10%
44%
50%
53%
29%28
%
29%
12%8%8%
0%25
%50
%75
%10
0%
All N
ew Y
ork
City
Res
pond
ents
All Q
ueen
s R
espo
nden
ts
All C
omm
unity
Boa
rd #
2 R
espo
nden
ts
Bac
kgro
un
d:
Qu
een
s C
om
mu
nit
y B
oar
d #
2S
urv
ey R
esp
on
ses:
Qu
een
s C
om
mu
nit
y B
oar
d #
2
Th
e N
eig
hb
orh
oo
ds
of
Qu
een
s C
om
mu
nit
y B
oar
d #
2
Sour
ce: N
YC P
lann
ing
Dep
artm
ent
Res
ult
sfr
om
NY
C F
eed
bac
k C
ityw
ide
Cu
sto
mer
Su
rvey
Qu
een
s C
om
mu
nit
y B
oar
d #
2
Rat
ing
s o
f N
eig
hb
orh
oo
d a
s a
Pla
ce t
o L
ive
Rat
ing
s o
f O
vera
ll Q
ual
ity
of
Lif
e in
New
Yo
rk C
ity
Exce
llent
Poor
Fair
Goo
d
Exce
llent
Poor
Fair
Goo
d
Exce
llent
Poor
Fair
Goo
d
Rat
ing
s o
f O
vera
ll Q
ual
ity
of
New
Yo
rk C
ity
Go
vern
men
t S
ervi
ces
45%
47%
46%
37%
39%
32%
12%
11%
16%
4%5% 6%
0%25
%50
%75
%10
0%
All N
ew Y
ork
City
Res
pond
ents
All Q
ueen
s R
espo
nden
ts
All C
omm
unity
Boa
rd #
2 R
espo
nden
ts
38%
38%
32%
44%
44%
50%
15%
14%
16%
4%2% 4%
0%25
%50
%75
%10
0%
All N
ew Y
ork
City
Res
pond
ents
All Q
ueen
s R
espo
nden
ts
All C
omm
unity
Boa
rd #
2 R
espo
nden
ts
Gen
der
•M
ale:
50%
•F
emal
e: 5
0%A
ge •<
18 y
ears
old
: 18%
•18
-54
year
s ol
d: 6
0%•
55+
yea
rs o
ld: 2
2%
Rac
e/E
thn
icit
y•
Non
-His
pani
c W
hite
: 29%
•N
on-H
ispa
nic
Bla
ck: 2
%•
Non
-His
pani
c A
sian
: 33%
•H
ispa
nic:
35%
•O
ther
: 1%
Po
pu
lati
on
an
d H
ou
seh
old
s•
Tot
al P
opul
atio
n: 1
28,6
73•
Tot
al H
ouse
hold
s: 4
9,13
3
Med
ian
An
nu
al H
ou
seh
old
Inco
me
•$4
4,70
4(2
006
Infla
tion-
Adj
uste
d D
olla
rs)
•33
6 R
espo
nses
•20
.7%
Res
pons
e R
ate
•±5
.3%
Mar
gin
of E
rror
(95
% C
onfid
ence
Inte
rval
)
See
deta
il be
low
Sou
rce:
U.S
. Cen
sus
Bur
eau
-20
06 A
mer
ican
Com
mun
ity S
urve
y, P
opul
atio
n D
ivis
ion
-N
ew Y
ork
City
Dep
artm
ent o
f City
Pla
nnin
g

City
wid
e C
usto
mer
Sur
vey
Res
ults
12%
26%
45%
18%
7%26
%52
%14
%N
eig
hb
orh
oo
d
Pu
blic
Saf
ety
Ind
ex
14%
34%
42%
10%
18%
36%
40%
7%M
ass
Tra
nsi
t S
ervi
ces
Ind
ex
21%
34%
36%
9%
19%
36%
36%
8%S
tree
ts a
nd
S
idew
alks
In
dex
17%
29%
41%
13%
16%
31%
42%
12%
Cle
anin
g a
nd
M
ain
ten
ance
In
dex
25%
39%
30%
6%
35%
33%
28%
5%P
ub
licE
du
cati
on
In
dex
42%
35%
19%
4%
44%
39%
15%
3%S
oci
al S
up
po
rt
Ser
vice
s In
dex
Ind
ex
Sco
reP
oo
rF
air
Go
od
Exc
elle
nt
Sur
vey
resp
onde
nts
wer
e as
ked
to n
ame
wha
t the
y th
ough
t w
ere
the
thre
e m
ost i
mpo
rtan
t iss
ues
faci
ng N
ew Y
ork
City
. T
he th
ree
resp
onse
s m
ost c
omm
only
giv
en b
y Q
ueen
s C
omm
unity
Boa
rd #
2 re
spon
dent
s ar
e lis
ted
belo
w.
Hig
hest
Rat
edLo
wes
t Rat
ed
Sur
vey
resp
onde
nts
rate
d 24
ser
vice
s in
thei
r ne
ighb
orho
od.
The
hig
hest
and
low
est r
ated
ser
vice
s ar
e di
spla
yed
belo
w.
NYC
All
Com
mun
ity B
oard
#2
Res
pond
ents
All
New
Yor
k C
ity R
espo
nden
ts
Ind
ex R
atin
gs:
Qu
een
s C
om
mu
nit
y B
oar
d #
2 C
om
par
ed t
o R
atin
gs
Giv
en b
y A
ll R
esp
on
den
tsM
ost
Imp
ort
ant
Issu
es F
acin
g N
ew Y
ork
C
ity:
Qu
een
s C
om
mu
nit
y B
oar
d #
2
Rat
ing
s o
f N
eig
hb
orh
oo
d S
ervi
ces:
Q
uee
ns
Co
mm
un
ity
Bo
ard
#2
5856 7565 8384 7981 8682 8993
1.H
ousi
ng
2.M
ass
Tra
nsit
3.C
rime
1.H
ousi
ng Is
sues
2.M
ass
Tra
nsit
Issu
es
3.C
rime
1.F
ire p
rote
ctio
n se
rvic
es
2.E
mer
genc
y m
edic
al
serv
ices
3.H
ouse
hold
gar
bage
pic
k-up
4.P
ublic
libr
arie
s
5.R
ecyc
ling
serv
ices
1.A
vaila
bilit
y of
cul
tura
l ac
tiviti
es
2.C
ontr
ol o
f str
eet n
oise
3.R
at c
ontr
ol
4.G
raffi
ti co
ntro
l
5.M
aint
enan
ce o
f str
eets
an
d ro
ads

City
wid
e C
usto
mer
Sur
vey
Res
ults
15%
13%
10%
44%
50%
48%
29%28
%
32%
12%8%11%
0%25
%50
%75
%10
0%
All N
ew Y
ork
City
Res
pond
ents
All Q
ueen
s R
espo
nden
ts
All C
omm
unity
Boa
rd #
3 R
espo
nden
ts
Bac
kgro
un
d:
Qu
een
s C
om
mu
nit
y B
oar
d #
3S
urv
ey R
esp
on
ses:
Qu
een
s C
om
mu
nit
y B
oar
d #
3
Th
e N
eig
hb
orh
oo
ds
of
Qu
een
s C
om
mu
nit
y B
oar
d #
3
Sour
ce: N
YC P
lann
ing
Dep
artm
ent
Res
ult
sfr
om
NY
C F
eed
bac
k C
ityw
ide
Cu
sto
mer
Su
rvey
Qu
een
s C
om
mu
nit
y B
oar
d #
3
Rat
ing
s o
f N
eig
hb
orh
oo
d a
s a
Pla
ce t
o L
ive
Rat
ing
s o
f O
vera
ll Q
ual
ity
of
Lif
e in
New
Yo
rk C
ity
Exce
llent
Poor
Fair
Goo
d
Exce
llent
Poor
Fair
Goo
d
Exce
llent
Poor
Fair
Goo
d
Rat
ing
s o
f O
vera
ll Q
ual
ity
of
New
Yo
rk C
ity
Go
vern
men
t S
ervi
ces
45%
47%
45%
37%
39%
38%
12%
11%
11%
4%5% 6%
0%25
%50
%75
%10
0%
All N
ew Y
ork
City
Res
pond
ents
All Q
ueen
s R
espo
nden
ts
All C
omm
unity
Boa
rd #
3 R
espo
nden
ts
38%
38%
40%
44%
44%
44%
15%
14%
12%
4%3% 4%
0%25
%50
%75
%10
0%
All N
ew Y
ork
City
Res
pond
ents
All Q
ueen
s R
espo
nden
ts
All C
omm
unity
Boa
rd #
3 R
espo
nden
ts
Gen
der
•M
ale:
50%
•F
emal
e: 5
0%A
ge •<
18 y
ears
old
: 23%
•18
-54
year
s ol
d: 5
7%•
55+
yea
rs o
ld: 2
0%
Rac
e/E
thn
icit
y•
Non
-His
pani
c W
hite
: 14%
•N
on-H
ispa
nic
Bla
ck: 8
%•
Non
-His
pani
c A
sian
: 16%
•H
ispa
nic:
61%
•O
ther
: 1%
Po
pu
lati
on
an
d H
ou
seh
old
s•
Tot
al P
opul
atio
n: 1
76,3
87•
Tot
al H
ouse
hold
s: 5
3,54
9
Med
ian
An
nu
al H
ou
seh
old
Inco
me
•$4
7,79
9(2
006
Infla
tion-
Adj
uste
d D
olla
rs)
•34
5 R
espo
nses
•16
.4%
Res
pons
e R
ate
•±5
.3%
Mar
gin
of E
rror
(95
% C
onfid
ence
Inte
rval
)
See
deta
il be
low
Sou
rce:
U.S
. Cen
sus
Bur
eau
-20
06 A
mer
ican
Com
mun
ity S
urve
y, P
opul
atio
n D
ivis
ion
-N
ew Y
ork
City
Dep
artm
ent o
f City
Pla
nnin
g

City
wid
e C
usto
mer
Sur
vey
Res
ults
12%
26%
45%
18%
12%
27%
45%
16%
Nei
gh
bo
rho
od
P
ub
lic S
afet
y In
dex
14%
34%
42%
10%
19%
29%
41%
11%
Mas
s T
ran
sit
Ser
vice
s In
dex
21%
34%
36%
9%
20%
36%
35%
9%S
tree
ts a
nd
S
idew
alks
In
dex
17%
29%
41%
13%
17%
27%
43%
13%
Cle
anin
g a
nd
M
ain
ten
ance
In
dex
25%
39%
30%
6%
31%
33%
30%
7%P
ub
licE
du
cati
on
In
dex
42%
35%
19%
4%
37%
34%
22%
7%S
oci
al S
up
po
rt
Ser
vice
s In
dex
Ind
ex
Sco
reP
oo
rF
air
Go
od
Exc
elle
nt
Sur
vey
resp
onde
nts
wer
e as
ked
to n
ame
wha
t the
y th
ough
t w
ere
the
thre
e m
ost i
mpo
rtan
t iss
ues
faci
ng N
ew Y
ork
City
. T
he th
ree
resp
onse
s m
ost c
omm
only
giv
en b
y Q
ueen
s
Com
mun
ity B
oard
#3
resp
onde
nts
are
liste
d be
low
.
Hig
hest
Rat
edLo
wes
t Rat
ed
Sur
vey
resp
onde
nts
rate
d 24
ser
vice
s in
thei
r ne
ighb
orho
od.
The
hig
hest
and
low
est r
ated
ser
vice
s ar
e di
spla
yed
belo
w.
NYC
All
Com
mun
ity B
oard
#3
Res
pond
ents
All
New
Yor
k C
ity R
espo
nden
ts
Ind
ex R
atin
gs:
Qu
een
s C
om
mu
nit
y B
oar
d #
3 C
om
par
ed t
o R
atin
gs
Giv
en b
y A
ll R
esp
on
den
tsM
ost
Imp
ort
ant
Issu
es F
acin
g N
ew Y
ork
C
ity:
Qu
een
s C
om
mu
nit
y B
oar
d #
3
Rat
ing
s o
f N
eig
hb
orh
oo
d S
ervi
ces:
Q
uee
ns
Co
mm
un
ity
Bo
ard
#3
5863 7569 8383 7980 8681 8988
1.H
ousi
ng
2.E
duca
tion
3.M
ass
Tra
nsit
1.E
mer
genc
y m
edic
al
serv
ices
2.F
ire p
rote
ctio
n se
rvic
es
3.P
ublic
libr
arie
s
4.H
ouse
hold
gar
bage
pic
k-up
5.R
ecyc
ling
serv
ices
1.C
ontr
ol o
f str
eet n
oise
2.A
vaila
bilit
y of
cul
tura
l ac
tiviti
es
3.N
eigh
borh
ood
play
grou
nds
4.N
eigh
borh
ood
park
s
5.G
raffi
ti co
ntro
l

City
wid
e C
usto
mer
Sur
vey
Res
ults
15%
13%
44%
50%
43%
29%28
%
35%
12%
16%
6%
8%
0%25
%50
%75
%10
0%
All N
ew Y
ork
City
Res
pond
ents
All Q
ueen
s R
espo
nden
ts
All C
omm
unity
Boa
rd #
4 R
espo
nden
ts
Bac
kgro
un
d:
Qu
een
s C
om
mu
nit
y B
oar
d #
4S
urv
ey R
esp
on
ses:
Qu
een
s C
om
mu
nit
y B
oar
d #
4
Th
e N
eig
hb
orh
oo
ds
of
Qu
een
s C
om
mu
nit
y B
oar
d #
4
Sour
ce: N
YC P
lann
ing
Dep
artm
ent
Res
ult
sfr
om
NY
C F
eed
bac
k C
ityw
ide
Cu
sto
mer
Su
rvey
Qu
een
s C
om
mu
nit
y B
oar
d #
4
Rat
ing
s o
f N
eig
hb
orh
oo
d a
s a
Pla
ce t
o L
ive
Rat
ing
s o
f O
vera
ll Q
ual
ity
of
Lif
e in
New
Yo
rk C
ity
Exce
llent
Poor
Fair
Goo
d
Exce
llent
Poor
Fair
Goo
d
Exce
llent
Poor
Fair
Goo
d
Rat
ing
s o
f O
vera
ll Q
ual
ity
of
New
Yo
rk C
ity
Go
vern
men
t S
ervi
ces
45%
47%
49%
37%
39%40
%
12%
11%
4%4% 6%
6%
0%25
%50
%75
%10
0%
All N
ew Y
ork
City
Res
pond
ents
All Q
ueen
s R
espo
nden
ts
All C
omm
unity
Boa
rd #
4 R
espo
nden
ts
38%
38%
39%
44%
44%47
%
15%
14%9%
4%5% 4%
0%25
%50
%75
%10
0%
All N
ew Y
ork
City
Res
pond
ents
All Q
ueen
s R
espo
nden
ts
All C
omm
unity
Boa
rd #
4 R
espo
nden
ts
Gen
der
•M
ale:
50%
•F
emal
e: 5
0%A
ge •<
18 y
ears
old
: 22%
•18
-54
year
s ol
d: 5
8%•
55+
yea
rs o
ld: 2
0%
Rac
e/E
thn
icit
y•
Non
-His
pani
c W
hite
: 9%
•N
on-H
ispa
nic
Bla
ck: 6
%•
Non
-His
pani
c A
sian
: 32%
•H
ispa
nic:
52%
•O
ther
: 1%
Po
pu
lati
on
an
d H
ou
seh
old
s•
Tot
al P
opul
atio
n: 1
38,5
93•
Tot
al H
ouse
hold
s: 4
4,72
8
Med
ian
An
nu
al H
ou
seh
old
Inco
me
•$4
1,42
3(2
006
Infla
tion-
Adj
uste
d D
olla
rs)
•31
3 R
espo
nses
•13
.4%
Res
pons
e R
ate
•±5
.5%
Mar
gin
of E
rror
(95
% C
onfid
ence
Inte
rval
)
See
deta
il be
low
Sou
rce:
U.S
. Cen
sus
Bur
eau
-20
06 A
mer
ican
Com
mun
ity S
urve
y, P
opul
atio
n D
ivis
ion
-N
ew Y
ork
City
Dep
artm
ent o
f City
Pla
nnin
g

City
wid
e C
usto
mer
Sur
vey
Res
ults
12%
26%
45%
18%
10%
26%
47%
16%
Nei
gh
bo
rho
od
P
ub
lic S
afet
y In
dex
14%
34%
42%
10%
14%
35%
41%
10%
Mas
s T
ran
sit
Ser
vice
s In
dex
21%
34%
36%
9%
20%
35%
37%
8%S
tree
ts a
nd
S
idew
alks
In
dex
17%
29%
41%
13%
17%
30%
43%
10%
Cle
anin
g a
nd
M
ain
ten
ance
In
dex
25%
39%
30%
6%
15%
37%
34%
14%
Pu
blic
Ed
uca
tio
n
Ind
ex
42%
35%
19%
4%
31%
35%
29%
5%S
oci
al S
up
po
rt
Ser
vice
s In
dex
Ind
ex
Sco
reP
oo
rF
air
Go
od
Exc
elle
nt
Sur
vey
resp
onde
nts
wer
e as
ked
to n
ame
wha
t the
y th
ough
t w
ere
the
thre
e m
ost i
mpo
rtan
t iss
ues
faci
ng N
ew Y
ork
City
. T
he th
ree
resp
onse
s m
ost c
omm
only
giv
en b
y Q
ueen
s C
omm
unity
Boa
rd #
4 re
spon
dent
s ar
e lis
ted
belo
w.
Hig
hest
Rat
edLo
wes
t Rat
ed
Sur
vey
resp
onde
nts
rate
d 24
ser
vice
s in
thei
r ne
ighb
orho
od.
The
hig
hest
and
low
est r
ated
ser
vice
s ar
e di
spla
yed
belo
w.
NYC
All
Com
mun
ity B
oard
#4
Res
pond
ents
All
New
Yor
k C
ity R
espo
nden
ts
Ind
ex R
atin
gs:
Qu
een
s C
om
mu
nit
y B
oar
d #
4 C
om
par
ed t
o R
atin
gs
Giv
en b
y A
ll R
esp
on
den
tsM
ost
Imp
ort
ant
Issu
es F
acin
g N
ew Y
ork
C
ity:
Qu
een
s C
om
mu
nit
y B
oar
d #
4
Rat
ing
s o
f N
eig
hb
orh
oo
d S
ervi
ces:
Q
uee
ns
Co
mm
un
ity
Bo
ard
#4
5869 7585 8383 7980 8686 8990
1.H
ousi
ng
2.Jo
bs
3.E
duca
tion
1.F
ire p
rote
ctio
n se
rvic
es
2.E
mer
genc
y m
edic
al
serv
ices
3.P
ublic
libr
arie
s
4.R
ecyc
ling
serv
ices
5.H
ouse
hold
gar
bage
pic
k-up
1.C
ontr
ol o
f str
eet n
oise
2.A
vaila
bilit
y of
cul
tura
l ac
tiviti
es
3.R
at c
ontr
ol
4.C
lean
lines
s of
you
r ne
ighb
orho
od
5.G
raffi
ti co
ntro
l

City
wid
e C
usto
mer
Sur
vey
Res
ults
15%
13%
9%
44%
50%
58%
29%28
%30%
12%8%
4%
0%25
%50
%75
%10
0%
All N
ew Y
ork
City
Res
pond
ents
All Q
ueen
s R
espo
nden
ts
All C
omm
unity
Boa
rd #
5 R
espo
nden
ts
Bac
kgro
un
d:
Qu
een
s C
om
mu
nit
y B
oar
d #
5S
urv
ey R
esp
on
ses:
Qu
een
s C
om
mu
nit
y B
oar
d #
5
Th
e N
eig
hb
orh
oo
ds
of
Qu
een
s C
om
mu
nit
y B
oar
d #
5
Sour
ce: N
YC P
lann
ing
Dep
artm
ent
Res
ult
sfr
om
NY
C F
eed
bac
k C
ityw
ide
Cu
sto
mer
Su
rvey
Qu
een
s C
om
mu
nit
y B
oar
d #
5
Rat
ing
s o
f N
eig
hb
orh
oo
d a
s a
Pla
ce t
o L
ive
Rat
ing
s o
f O
vera
ll Q
ual
ity
of
Lif
e in
New
Yo
rk C
ity
Exce
llent
Poor
Fair
Goo
d
Exce
llent
Poor
Fair
Goo
d
Exce
llent
Poor
Fair
Goo
d
Rat
ing
s o
f O
vera
ll Q
ual
ity
of
New
Yo
rk C
ity
Go
vern
men
t S
ervi
ces
45%
47%
42%
37%
39%
43%
12%
11%
13%
4%1% 6%
0%25
%50
%75
%10
0%
All N
ew Y
ork
City
Res
pond
ents
All Q
ueen
s R
espo
nden
ts
All C
omm
unity
Boa
rd #
5 R
espo
nden
ts
38%
38%
38%
44%
44%
45%
15%
14%
14%
4%3% 4%
0%25
%50
%75
%10
0%
All N
ew Y
ork
City
Res
pond
ents
All Q
ueen
s R
espo
nden
ts
All C
omm
unity
Boa
rd #
5 R
espo
nden
ts
Gen
der
•M
ale:
49%
•F
emal
e: 5
1%A
ge •<
18 y
ears
old
: 23%
•18
-54
year
s ol
d: 5
4%•
55+
yea
rs o
ld: 2
3%
Rac
e/E
thn
icit
y•
Non
-His
pani
c W
hite
: 59%
•N
on-H
ispa
nic
Bla
ck: 1
%•
Non
-His
pani
c A
sian
: 6%
•H
ispa
nic:
32%
•O
ther
: 1%
Po
pu
lati
on
an
d H
ou
seh
old
s•
Tot
al P
opul
atio
n: 1
79,7
68•
Tot
al H
ouse
hold
s: 6
2,69
0
Med
ian
An
nu
al H
ou
seh
old
Inco
me
•$5
0,47
7(2
006
Infla
tion-
Adj
uste
d D
olla
rs)
•33
8 R
espo
nses
•20
.2%
Res
pons
e R
ate
•±5
.3%
Mar
gin
of E
rror
(95
% C
onfid
ence
Inte
rval
)
See
deta
il be
low
Sou
rce:
U.S
. Cen
sus
Bur
eau
-20
06 A
mer
ican
Com
mun
ity S
urve
y, P
opul
atio
n D
ivis
ion
-N
ew Y
ork
City
Dep
artm
ent o
f City
Pla
nnin
g

City
wid
e C
usto
mer
Sur
vey
Res
ults
12%
26%
45%
18%
9%24
%49
%18
%N
eig
hb
orh
oo
d
Pu
blic
Saf
ety
Ind
ex
14%
34%
42%
10%
12%
37%
43%
8%M
ass
Tra
nsi
t S
ervi
ces
Ind
ex
21%
34%
36%
9%
20%
30%
43%
7%S
tree
ts a
nd
S
idew
alks
In
dex
17%
29%
41%
13%
16%
25%
45%
14%
Cle
anin
g a
nd
M
ain
ten
ance
In
dex
25%
39%
30%
6%
25%
38%
35%
2%P
ub
licE
du
cati
on
In
dex
42%
35%
19%
4%
43%
35%
19%
4%S
oci
al S
up
po
rt
Ser
vice
s In
dex
Ind
ex
Sco
reP
oo
rF
air
Go
od
Exc
elle
nt
Sur
vey
resp
onde
nts
wer
e as
ked
to n
ame
wha
t the
y th
ough
t w
ere
the
thre
e m
ost i
mpo
rtan
t iss
ues
faci
ng N
ew Y
ork
City
. T
he th
ree
resp
onse
s m
ost c
omm
only
giv
en b
y Q
ueen
s C
omm
unity
Boa
rd #
5 re
spon
dent
s ar
e lis
ted
belo
w.
Hig
hest
Rat
edLo
wes
t Rat
ed
Sur
vey
resp
onde
nts
rate
d 24
ser
vice
s in
thei
r ne
ighb
orho
od.
The
hig
hest
and
low
est r
ated
ser
vice
s ar
e di
spla
yed
belo
w.
NYC
All
Com
mun
ity B
oard
#5
Res
pond
ents
All
New
Yor
k C
ity R
espo
nden
ts
Ind
ex R
atin
gs:
Qu
een
s C
om
mu
nit
y B
oar
d #
5 C
om
par
ed t
o R
atin
gs
Giv
en b
y A
ll R
esp
on
den
tsM
ost
Imp
ort
ant
Issu
es F
acin
g N
ew Y
ork
C
ity:
Qu
een
s C
om
mu
nit
y B
oar
d #
5
Rat
ing
s o
f N
eig
hb
orh
oo
d S
ervi
ces:
Q
uee
ns
Co
mm
un
ity
Bo
ard
#5
5857 7575 8384 7980 8688 8991
1.E
duca
tion
2.T
axes
3.H
ousi
ng
1.F
ire p
rote
ctio
n se
rvic
es
2.R
ecyc
ling
serv
ices
3.H
ouse
hold
gar
bage
pic
k-up
4.E
mer
genc
y m
edic
al
serv
ices
5.C
rime
cont
rol
1.M
aint
enan
ce o
f str
eets
an
d ro
ads
2.A
vaila
bilit
y of
cul
tura
l ac
tiviti
es
3.S
torm
wat
er d
rain
age
and
sew
er m
aint
enan
ce
4.C
ontr
ol o
f str
eet n
oise
5.G
raffi
ti co
ntro
l

City
wid
e C
usto
mer
Sur
vey
Res
ults
15%
13%26
%
44%
50%
57%
29%28
%
16% 12
%8%
1%
0%25
%50
%75
%10
0%
All N
ew Y
ork
City
Res
pond
ents
All Q
ueen
s R
espo
nden
ts
All C
omm
unity
Boa
rd #
6 R
espo
nden
ts
Bac
kgro
un
d:
Qu
een
s C
om
mu
nit
y B
oar
d #
6S
urv
ey R
esp
on
ses:
Qu
een
s C
om
mu
nit
y B
oar
d #
6
Th
e N
eig
hb
orh
oo
ds
of
Qu
een
s C
om
mu
nit
y B
oar
d #
6
Sour
ce: N
YC P
lann
ing
Dep
artm
ent
Res
ult
sfr
om
NY
C F
eed
bac
k C
ityw
ide
Cu
sto
mer
Su
rvey
Qu
een
s C
om
mu
nit
y B
oar
d #
6
Rat
ing
s o
f N
eig
hb
orh
oo
d a
s a
Pla
ce t
o L
ive
Rat
ing
s o
f O
vera
ll Q
ual
ity
of
Lif
e in
New
Yo
rk C
ity
Exce
llent
Poor
Fair
Goo
d
Exce
llent
Poor
Fair
Goo
d
Exce
llent
Poor
Fair
Goo
d
Rat
ing
s o
f O
vera
ll Q
ual
ity
of
New
Yo
rk C
ity
Go
vern
men
t S
ervi
ces
45%
47%55
%
37%
39%31
%
12%
11%
4%6% 6%
7%
0%25
%50
%75
%10
0%
All N
ew Y
ork
City
Res
pond
ents
All Q
ueen
s R
espo
nden
ts
All C
omm
unity
Boa
rd #
6 R
espo
nden
ts
38%
38%42%
44%
44%44
%
15%
14%
10%
4%5% 4%
0%25
%50
%75
%10
0%
All N
ew Y
ork
City
Res
pond
ents
All Q
ueen
s R
espo
nden
ts
All C
omm
unity
Boa
rd #
6 R
espo
nden
ts
Gen
der
•M
ale:
48%
•F
emal
e: 5
2%A
ge •<
18 y
ears
old
: 19%
•18
-54
year
s ol
d: 5
2%•
55+
yea
rs o
ld: 3
0%
Rac
e/E
thn
icit
y•
Non
-His
pani
c W
hite
: 59%
•N
on-H
ispa
nic
Bla
ck: 3
%•
Non
-His
pani
c A
sian
: 23%
•H
ispa
nic:
13%
•O
ther
: 2%
Po
pu
lati
on
an
d H
ou
seh
old
s•
Tot
al P
opul
atio
n: 1
16,4
18•
Tot
al H
ouse
hold
s: 5
1,46
6
Med
ian
An
nu
al H
ou
seh
old
Inco
me
•$6
0,08
5(2
006
Infla
tion-
Adj
uste
d D
olla
rs)
•32
6 R
espo
nses
•22
.3%
Res
pons
e R
ate
•±5
.4%
Mar
gin
of E
rror
(95
% C
onfid
ence
Inte
rval
)
See
deta
il be
low
Sou
rce:
U.S
. Cen
sus
Bur
eau
-20
06 A
mer
ican
Com
mun
ity S
urve
y, P
opul
atio
n D
ivis
ion
-N
ew Y
ork
City
Dep
artm
ent o
f City
Pla
nnin
g

City
wid
e C
usto
mer
Sur
vey
Res
ults
12%
26%
45%
18%
4%19
%55
%22
%N
eig
hb
orh
oo
d
Pu
blic
Saf
ety
Ind
ex
14%
34%
42%
10%
11%
33%
45%
11%
Mas
s T
ran
sit
Ser
vice
s In
dex
21%
34%
36%
9%
15%
31%
43%
11%
Str
eets
an
d
Sid
ewal
ks
Ind
ex
17%
29%
41%
13%
10%
24%
47%
19%
Cle
anin
g a
nd
M
ain
ten
ance
In
dex
25%
39%
30%
6%
14%
42%
37%
7%P
ub
licE
du
cati
on
In
dex
42%
35%
19%
4%
33%
40%
20%
7%S
oci
al S
up
po
rt
Ser
vice
s In
dex
Ind
ex
Sco
reP
oo
rF
air
Go
od
Exc
elle
nt
Sur
vey
resp
onde
nts
wer
e as
ked
to n
ame
wha
t the
y th
ough
t w
ere
the
thre
e m
ost i
mpo
rtan
t iss
ues
faci
ng N
ew Y
ork
City
. T
he th
ree
resp
onse
s m
ost c
omm
only
giv
en b
y Q
ueen
s C
omm
unity
Boa
rd #
6 re
spon
dent
s ar
e lis
ted
belo
w.
Hig
hest
Rat
edLo
wes
t Rat
ed
Sur
vey
resp
onde
nts
rate
d 24
ser
vice
s in
thei
r ne
ighb
orho
od.
The
hig
hest
and
low
est r
ated
ser
vice
s ar
e di
spla
yed
belo
w.
NYC
All
Com
mun
ity B
oard
#6
Res
pond
ents
All
New
Yor
k C
ity R
espo
nden
ts
Ind
ex R
atin
gs:
Qu
een
s C
om
mu
nit
y B
oar
d #
6 C
om
par
ed t
o R
atin
gs
Giv
en b
y A
ll R
esp
on
den
tsM
ost
Imp
ort
ant
Issu
es F
acin
g N
ew Y
ork
C
ity:
Qu
een
s C
om
mu
nit
y B
oar
d #
6
Rat
ing
s o
f N
eig
hb
orh
oo
d S
ervi
ces:
Q
uee
ns
Co
mm
un
ity
Bo
ard
#6
5867 7586 8390 7985 8689 8996
1.M
ass
Tra
nsit
2.H
ousi
ng
3.E
duca
tion
1.F
ire p
rote
ctio
n se
rvic
es
2.E
mer
genc
y m
edic
al
serv
ices
3.C
rime
cont
rol
4.H
ouse
hold
gar
bage
pic
k-up
5.A
vaila
bilit
y of
hea
lth c
are
serv
ices
1.A
vaila
bilit
y of
cul
tura
l ac
tiviti
es
2.C
ontr
ol o
f str
eet n
oise
3.S
torm
wat
er d
rain
age
and
sew
er m
aint
enan
ce
4.P
edes
tria
n sa
fety
(c
ross
ing
inte
rsec
tions
)
5.M
aint
enan
ce o
f str
eets
an
d ro
ads

City
wid
e C
usto
mer
Sur
vey
Res
ults
15%
13%21
%
44%
50%44
%
29%28
%
27%
12%8%8%
0%25
%50
%75
%10
0%
All N
ew Y
ork
City
Res
pond
ents
All Q
ueen
s R
espo
nden
ts
All C
omm
unity
Boa
rd #
7 R
espo
nden
ts
Bac
kgro
un
d:
Qu
een
s C
om
mu
nit
y B
oar
d #
7S
urv
ey R
esp
on
ses:
Qu
een
s C
om
mu
nit
y B
oar
d #
7
Th
e N
eig
hb
orh
oo
ds
of
Qu
een
s C
om
mu
nit
y B
oar
d #
7
Sour
ce: N
YC P
lann
ing
Dep
artm
ent
Res
ult
sfr
om
NY
C F
eed
bac
k C
ityw
ide
Cu
sto
mer
Su
rvey
Qu
een
s C
om
mu
nit
y B
oar
d #
7
Rat
ing
s o
f N
eig
hb
orh
oo
d a
s a
Pla
ce t
o L
ive
Rat
ing
s o
f O
vera
ll Q
ual
ity
of
Lif
e in
New
Yo
rk C
ity
Exce
llent
Poor
Fair
Goo
d
Exce
llent
Poor
Fair
Goo
d
Exce
llent
Poor
Fair
Goo
d
Rat
ing
s o
f O
vera
ll Q
ual
ity
of
New
Yo
rk C
ity
Go
vern
men
t S
ervi
ces
45%
47%55
%
37%
39%32
%
12%
11%
4%5% 6%
8%
0%25
%50
%75
%10
0%
All N
ew Y
ork
City
Res
pond
ents
All Q
ueen
s R
espo
nden
ts
All C
omm
unity
Boa
rd #
7 R
espo
nden
ts
38%
38%47
%
44%
44%35
%
15%
14%
13%
6% 4% 4%
0%25
%50
%75
%10
0%
All N
ew Y
ork
City
Res
pond
ents
All Q
ueen
s R
espo
nden
ts
All C
omm
unity
Boa
rd #
7 R
espo
nden
ts
Gen
der
•M
ale:
49%
•F
emal
e: 5
1%A
ge •<
18 y
ears
old
: 18%
•18
-54
year
s ol
d: 5
4%•
55+
yea
rs o
ld: 2
9%
Rac
e/E
thn
icit
y•
Non
-His
pani
c W
hite
: 34%
•N
on-H
ispa
nic
Bla
ck: 3
%•
Non
-His
pani
c A
sian
: 45%
•H
ispa
nic:
16%
•O
ther
: 1%
Po
pu
lati
on
an
d H
ou
seh
old
s•
Tot
al P
opul
atio
n: 2
46,5
42•
Tot
al H
ouse
hold
s: 8
7,53
1
Med
ian
An
nu
al H
ou
seh
old
Inco
me
•$5
0,63
8(2
006
Infla
tion-
Adj
uste
d D
olla
rs)
•31
8 R
espo
nses
•19
.8%
Res
pons
e R
ate
•±5
.5%
Mar
gin
of E
rror
(95
% C
onfid
ence
Inte
rval
)
See
deta
il be
low
Sou
rce:
U.S
. Cen
sus
Bur
eau
-20
06 A
mer
ican
Com
mun
ity S
urve
y, P
opul
atio
n D
ivis
ion
-N
ew Y
ork
City
Dep
artm
ent o
f City
Pla
nnin
g

City
wid
e C
usto
mer
Sur
vey
Res
ults
12%
26%
45%
18%
5%24
%50
%20
%N
eig
hb
orh
oo
d
Pu
blic
Saf
ety
Ind
ex
14%
34%
42%
10%
10%
30%
51%
9%M
ass
Tra
nsi
t S
ervi
ces
Ind
ex
21%
34%
36%
9%
15%
35%
41%
9%S
tree
ts a
nd
S
idew
alks
In
dex
17%
29%
41%
13%
12%
27%
44%
17%
Cle
anin
g a
nd
M
ain
ten
ance
In
dex
25%
39%
30%
6%
12%
39%
42%
7%P
ub
licE
du
cati
on
In
dex
42%
35%
19%
4%
29%
38%
28%
4%S
oci
al S
up
po
rt
Ser
vice
s In
dex
Ind
ex
Sco
reP
oo
rF
air
Go
od
Exc
elle
nt
Sur
vey
resp
onde
nts
wer
e as
ked
to n
ame
wha
t the
y th
ough
t w
ere
the
thre
e m
ost i
mpo
rtan
t iss
ues
faci
ng N
ew Y
ork
City
. T
he th
ree
resp
onse
s m
ost c
omm
only
giv
en b
y Q
ueen
s C
omm
unity
Boa
rd #
7 re
spon
dent
s ar
e lis
ted
belo
w.
Hig
hest
Rat
edLo
wes
t Rat
ed
Sur
vey
resp
onde
nts
rate
d 24
ser
vice
s in
thei
r ne
ighb
orho
od.
The
hig
hest
and
low
est r
ated
ser
vice
s ar
e di
spla
yed
belo
w.
NYC
All
Com
mun
ity B
oard
#7
Res
pond
ents
All
New
Yor
k C
ity R
espo
nden
ts
Ind
ex R
atin
gs:
Qu
een
s C
om
mu
nit
y B
oar
d #
7 C
om
par
ed t
o R
atin
gs
Giv
en b
y A
ll R
esp
on
den
tsM
ost
Imp
ort
ant
Issu
es F
acin
g N
ew Y
ork
C
ity:
Qu
een
s C
om
mu
nit
y B
oar
d #
7
Rat
ing
s o
f N
eig
hb
orh
oo
d S
ervi
ces:
Q
uee
ns
Co
mm
un
ity
Bo
ard
#7
5871 7588 8388 7985 8690 8995
1.C
ost o
f liv
ing
2.M
ass
Tra
nsit
3.E
duca
tion
1.F
ire p
rote
ctio
n se
rvic
es
2.E
mer
genc
y m
edic
al
serv
ices
3.R
ecyc
ling
serv
ices
4.P
ublic
libr
arie
s
5.C
rime
cont
rol
1.C
ontr
ol o
f str
eet n
oise
2.M
aint
enan
ce o
f str
eets
an
d ro
ads
3.S
torm
wat
er d
rain
age
and
sew
er m
aint
enan
ce
4.A
vaila
bilit
y of
cul
tura
l ac
tiviti
es
5.G
raffi
ti co
ntro
l

City
wid
e C
usto
mer
Sur
vey
Res
ults
15%
13%
16%
44%
50%55
%
29%28
%25%
12%8%
4%
0%25
%50
%75
%10
0%
All N
ew Y
ork
City
Res
pond
ents
All Q
ueen
s R
espo
nden
ts
All C
omm
unity
Boa
rd #
8 R
espo
nden
ts
Bac
kgro
un
d:
Qu
een
s C
om
mu
nit
y B
oar
d #
8S
urv
ey R
esp
on
ses:
Qu
een
s C
om
mu
nit
y B
oar
d #
8
Th
e N
eig
hb
orh
oo
ds
of
Qu
een
s C
om
mu
nit
y B
oar
d #
8
Sour
ce: N
YC P
lann
ing
Dep
artm
ent
Res
ult
sfr
om
NY
C F
eed
bac
k C
ityw
ide
Cu
sto
mer
Su
rvey
Qu
een
s C
om
mu
nit
y B
oar
d #
8
Rat
ing
s o
f N
eig
hb
orh
oo
d a
s a
Pla
ce t
o L
ive
Rat
ing
s o
f O
vera
ll Q
ual
ity
of
Lif
e in
New
Yo
rk C
ity
Exce
llent
Poor
Fair
Goo
d
Exce
llent
Poor
Fair
Goo
d
Exce
llent
Poor
Fair
Goo
d
Rat
ing
s o
f O
vera
ll Q
ual
ity
of
New
Yo
rk C
ity
Go
vern
men
t S
ervi
ces
45%
47%51
%
37%
39%32
%
12%
11%
4%7% 6%
10%
0%25
%50
%75
%10
0%
All N
ew Y
ork
City
Res
pond
ents
All Q
ueen
s R
espo
nden
ts
All C
omm
unity
Boa
rd #
8 R
espo
nden
ts
38%
38%42
%
44%
44%
39%
15%
14%
14%
4%5% 4%
0%25
%50
%75
%10
0%
All N
ew Y
ork
City
Res
pond
ents
All Q
ueen
s R
espo
nden
ts
All C
omm
unity
Boa
rd #
8 R
espo
nden
ts
Gen
der
•M
ale:
51%
•F
emal
e: 4
9%A
ge •<
18 y
ears
old
: 23%
•18
-54
year
s ol
d: 5
2%•
55+
yea
rs o
ld: 2
5%
Rac
e/E
thn
icit
y•
Non
-His
pani
c W
hite
: 37%
•N
on-H
ispa
nic
Bla
ck: 1
1%•
Non
-His
pani
c A
sian
: 30%
•H
ispa
nic:
19%
•O
ther
: 3%
Po
pu
lati
on
an
d H
ou
seh
old
s•
Tot
al P
opul
atio
n: 1
47,3
74•
Tot
al H
ouse
hold
s: 5
2,40
7
Med
ian
An
nu
al H
ou
seh
old
Inco
me
•$5
6,66
4(2
006
Infla
tion-
Adj
uste
d D
olla
rs)
•34
3 R
espo
nses
•18
.2%
Res
pons
e R
ate
•±5
.3%
Mar
gin
of E
rror
(95
% C
onfid
ence
Inte
rval
)
Sou
rce:
U.S
. Cen
sus
Bur
eau
-20
06 A
mer
ican
Com
mun
ity S
urve
y, P
opul
atio
n D
ivis
ion
-N
ew Y
ork
City
Dep
artm
ent o
f City
Pla
nnin
g
See
deta
il be
low

City
wid
e C
usto
mer
Sur
vey
Res
ults
12%
26%
45%
18%
8%20
%53
%18
%N
eig
hb
orh
oo
d
Pu
blic
Saf
ety
Ind
ex
14%
34%
42%
10%
12%
29%
45%
15%
Mas
s T
ran
sit
Ser
vice
s In
dex
21%
34%
36%
9%
14%
31%
43%
13%
Str
eets
an
d
Sid
ewal
ks
Ind
ex
17%
29%
41%
13%
12%
24%
46%
18%
Cle
anin
g a
nd
M
ain
ten
ance
In
dex
25%
39%
30%
6%
19%
37%
36%
8%P
ub
licE
du
cati
on
In
dex
42%
35%
19%
4%
35%
35%
24%
5%S
oci
al S
up
po
rt
Ser
vice
s In
dex
Ind
ex
Sco
reP
oo
rF
air
Go
od
Exc
elle
nt
Sur
vey
resp
onde
nts
wer
e as
ked
to n
ame
wha
t the
y th
ough
t w
ere
the
thre
e m
ost i
mpo
rtan
t iss
ues
faci
ng N
ew Y
ork
City
. T
he th
ree
resp
onse
s m
ost c
omm
only
giv
en b
y Q
ueen
s C
omm
unity
Boa
rd #
8 re
spon
dent
s ar
e lis
ted
belo
w.
Hig
hest
Rat
edLo
wes
t Rat
ed
Sur
vey
resp
onde
nts
rate
d 24
ser
vice
s in
thei
r ne
ighb
orho
od.
The
hig
hest
and
low
est r
ated
ser
vice
s ar
e di
spla
yed
belo
w.
NYC
All
Com
mun
ity B
oard
#8
Res
pond
ents
All
New
Yor
k C
ity R
espo
nden
ts
Ind
ex R
atin
gs:
Qu
een
s C
om
mu
nit
y B
oar
d #
8 C
om
par
ed t
o R
atin
gs
Giv
en b
y A
ll R
esp
on
den
tsM
ost
Imp
ort
ant
Issu
es F
acin
g N
ew Y
ork
C
ity:
Qu
een
s C
om
mu
nit
y B
oar
d #
8
Rat
ing
s o
f N
eig
hb
orh
oo
d S
ervi
ces:
Q
uee
ns
Co
mm
un
ity
Bo
ard
#8
5865 7581 8388 7986 8688 8992
1.M
ass
Tra
nsit
2.E
duca
tion
3.H
ousi
ng
1.F
ire p
rote
ctio
n se
rvic
es
2.H
ouse
hold
gar
bage
pic
k-up
3.R
ecyc
ling
serv
ices
4.E
mer
genc
y m
edic
al
serv
ices
5.P
ublic
libr
arie
s
1.A
vaila
bilit
y of
cul
tura
l ac
tiviti
es
2.S
torm
wat
er d
rain
age
and
sew
er m
aint
enan
ce
3.P
olic
e-C
omm
unity
re
latio
ns
4.C
ontr
ol o
f str
eet n
oise
5.R
at c
ontr
ol

City
wid
e C
usto
mer
Sur
vey
Res
ults
15%
13%
9%
44%
50%
46%
29%28
%
35%
12%8%10%
0%25
%50
%75
%10
0%
All N
ew Y
ork
City
Res
pond
ents
All Q
ueen
s R
espo
nden
ts
All C
omm
unity
Boa
rd #
9 R
espo
nden
ts
Bac
kgro
un
d:
Qu
een
s C
om
mu
nit
y B
oar
d #
9S
urv
ey R
esp
on
ses:
Qu
een
s C
om
mu
nit
y B
oar
d #
9
Th
e N
eig
hb
orh
oo
ds
of
Qu
een
s C
om
mu
nit
y B
oar
d #
9
Sour
ce: N
YC P
lann
ing
Dep
artm
ent
Res
ult
sfr
om
NY
C F
eed
bac
k C
ityw
ide
Cu
sto
mer
Su
rvey
Qu
een
s C
om
mu
nit
y B
oar
d #
9
Rat
ing
s o
f N
eig
hb
orh
oo
d a
s a
Pla
ce t
o L
ive
Rat
ing
s o
f O
vera
ll Q
ual
ity
of
Lif
e in
New
Yo
rk C
ity
Exce
llent
Poor
Fair
Goo
d
Exce
llent
Poor
Fair
Goo
d
Exce
llent
Poor
Fair
Goo
d
Rat
ing
s o
f O
vera
ll Q
ual
ity
of
New
Yo
rk C
ity
Go
vern
men
t S
ervi
ces
45%
47%
39%
37%
39%
46%
12%
11%
10%
4%4% 6%
0%25
%50
%75
%10
0%
All N
ew Y
ork
City
Res
pond
ents
All Q
ueen
s R
espo
nden
ts
All C
omm
unity
Boa
rd #
9 R
espo
nden
ts
38%
38%
36%
44%
44%
47%
15%
14%
14%
4%4% 4%
0%25
%50
%75
%10
0%
All N
ew Y
ork
City
Res
pond
ents
All Q
ueen
s R
espo
nden
ts
All C
omm
unity
Boa
rd #
9 R
espo
nden
ts
Gen
der
•M
ale:
49%
•F
emal
e: 5
1%A
ge •<
18 y
ears
old
: 25%
•18
-54
year
s ol
d: 5
6%•
55+
yea
rs o
ld: 1
9%
Rac
e/E
thn
icit
y•
Non
-His
pani
c W
hite
: 26%
•N
on-H
ispa
nic
Bla
ck: 9
%•
Non
-His
pani
c A
sian
: 20%
•
His
pani
c: 3
8%•
Oth
er: 7
%
Po
pu
lati
on
an
d H
ou
seh
old
s•
Tot
al P
opul
atio
n: 1
38,6
79•
Tot
al H
ouse
hold
s: 4
3,11
7
Med
ian
An
nu
al H
ou
seh
old
Inco
me
•$5
2,72
2(2
006
Infla
tion-
Adj
uste
d D
olla
rs)
•36
7 R
espo
nses
•17
.3%
Res
pons
e R
ate
•±5
.1%
Mar
gin
of E
rror
(95
% C
onfid
ence
Inte
rval
)
See
deta
il be
low
Sou
rce:
U.S
. Cen
sus
Bur
eau
-20
06 A
mer
ican
Com
mun
ity S
urve
y, P
opul
atio
n D
ivis
ion
-N
ew Y
ork
City
Dep
artm
ent o
f City
Pla
nnin
g

City
wid
e C
usto
mer
Sur
vey
Res
ults
12%
26%
45%
18%
12%
26%
48%
15%
Nei
gh
bo
rho
od
P
ub
lic S
afet
y In
dex
14%
34%
42%
10%
16%
36%
41%
7%M
ass
Tra
nsi
t S
ervi
ces
Ind
ex
21%
34%
36%
9%
21%
38%
35%
6%S
tree
ts a
nd
S
idew
alks
In
dex
17%
29%
41%
13%
16%
33%
40%
10%
Cle
anin
g a
nd
M
ain
ten
ance
In
dex
25%
39%
30%
6%
23%
40%
33%
4%P
ub
licE
du
cati
on
In
dex
42%
35%
19%
4%
36%
40%
20%
4%S
oci
al S
up
po
rt
Ser
vice
s In
dex
Ind
ex
Sco
reP
oo
rF
air
Go
od
Exc
elle
nt
Sur
vey
resp
onde
nts
wer
e as
ked
to n
ame
wha
t the
y th
ough
t w
ere
the
thre
e m
ost i
mpo
rtan
t iss
ues
faci
ng N
ew Y
ork
City
. T
he th
ree
resp
onse
s m
ost c
omm
only
giv
en b
y Q
ueen
s C
omm
unity
Boa
rd #
9 re
spon
dent
s ar
e lis
ted
belo
w.
Hig
hest
Rat
edLo
wes
t Rat
ed
Sur
vey
resp
onde
nts
rate
d 24
ser
vice
s in
thei
r ne
ighb
orho
od.
The
hig
hest
and
low
est r
ated
ser
vice
s ar
e di
spla
yed
belo
w.
NYC
All
Com
mun
ity B
oard
#9
Res
pond
ents
All
New
Yor
k C
ity R
espo
nden
ts
Ind
ex R
atin
gs:
Qu
een
s C
om
mu
nit
y B
oar
d #
9 C
om
par
ed t
o R
atin
gs
Giv
en b
y A
ll R
esp
on
den
tsM
ost
Imp
ort
ant
Issu
es F
acin
g N
ew Y
ork
C
ity:
Qu
een
s C
om
mu
nit
y B
oar
d #
9
Rat
ing
s o
f N
eig
hb
orh
oo
d S
ervi
ces:
Q
uee
ns
Co
mm
un
ity
Bo
ard
#9
5864 7577 8384 7979 8684 8988
1.M
ass
Tra
nsit
2.C
rime
3.C
ost o
f liv
ing
1.F
ire p
rote
ctio
n se
rvic
es
2.R
ecyc
ling
serv
ices
3.E
mer
genc
y m
edic
al
serv
ices
4.H
ouse
hold
gar
bage
pic
k-up
5.P
ublic
libr
arie
s
1.C
ontr
ol o
f str
eet n
oise
2.S
torm
wat
er d
rain
age
and
sew
er m
aint
enan
ce
3.A
vaila
bilit
y of
cul
tura
l ac
tiviti
es
4.G
raffi
ti co
ntro
l
5.R
at c
ontr
ol

City
wid
e C
usto
mer
Sur
vey
Res
ults
15%
13%
44%
50%
50%
29%28
%
30%
12%
12%
8%
8%
0%25
%50
%75
%10
0%
All N
ew Y
ork
City
Res
pond
ents
All Q
ueen
s R
espo
nden
ts
All C
omm
unity
Boa
rd #
10 R
espo
nden
ts
Bac
kgro
un
d:
Qu
een
s C
om
mu
nit
y B
oar
d #
10S
urv
ey R
esp
on
ses:
Qu
een
s C
om
mu
nit
y B
oar
d #
10
Th
e N
eig
hb
orh
oo
ds
of
Qu
een
s C
om
mu
nit
y B
oar
d #
10 Sour
ce: N
YC P
lann
ing
Dep
artm
ent
Res
ult
sfr
om
NY
C F
eed
bac
k C
ityw
ide
Cu
sto
mer
Su
rvey
Qu
een
s C
om
mu
nit
y B
oar
d #
10
Rat
ing
s o
f N
eig
hb
orh
oo
d a
s a
Pla
ce t
o L
ive
Rat
ing
s o
f O
vera
ll Q
ual
ity
of
Lif
e in
New
Yo
rk C
ity
Exce
llent
Poor
Fair
Goo
d
Exce
llent
Poor
Fair
Goo
d
Exce
llent
Poor
Fair
Goo
d
Rat
ing
s o
f O
vera
ll Q
ual
ity
of
New
Yo
rk C
ity
Go
vern
men
t S
ervi
ces
45%
47%
44%
37%
39%
40%
12%
11%
13%
4%3% 6%
0%25
%50
%75
%10
0%
All N
ew Y
ork
City
Res
pond
ents
All Q
ueen
s R
espo
nden
ts
All C
omm
unity
Boa
rd #
10 R
espo
nden
ts
38%
38%
34%
44%
44%
44%
15%
14%
20%
4%3% 4%
0%25
%50
%75
%10
0%
All N
ew Y
ork
City
Res
pond
ents
All Q
ueen
s R
espo
nden
ts
All C
omm
unity
Boa
rd #
10 R
espo
nden
ts
Gen
der
•M
ale:
49%
•F
emal
e: 5
1%A
ge •<
18 y
ears
old
: 24%
•18
-54
year
s ol
d: 5
0%•
55+
yea
rs o
ld: 2
5%
Rac
e/E
thn
icit
y•
Non
-His
pani
c W
hite
: 30%
•N
on-H
ispa
nic
Bla
ck: 1
5%•
Non
-His
pani
c A
sian
: 21%
•H
ispa
nic:
22%
•O
ther
: 13%
Po
pu
lati
on
an
d H
ou
seh
old
s•
Tot
al P
opul
atio
n: 1
24,6
23•
Tot
al H
ouse
hold
s: 3
7,17
2
Med
ian
An
nu
al H
ou
seh
old
Inco
me
•$5
6,61
5(2
006
Infla
tion-
Adj
uste
d D
olla
rs)
•27
5 R
espo
nses
•15
.9%
Res
pons
e R
ate
•±5
.9%
Mar
gin
of E
rror
(95
% C
onfid
ence
Inte
rval
)
See
deta
il be
low
Sou
rce:
U.S
. Cen
sus
Bur
eau
-20
06 A
mer
ican
Com
mun
ity S
urve
y, P
opul
atio
n D
ivis
ion
-N
ew Y
ork
City
Dep
artm
ent o
f City
Pla
nnin
g

City
wid
e C
usto
mer
Sur
vey
Res
ults
12%
26%
45%
18%
8%28
%46
%18
%N
eig
hb
orh
oo
d
Pu
blic
Saf
ety
Ind
ex
14%
34%
42%
10%
15%
38%
38%
9%M
ass
Tra
nsi
t S
ervi
ces
Ind
ex
21%
34%
36%
9%
21%
33%
38%
9%S
tree
ts a
nd
S
idew
alks
In
dex
17%
29%
41%
13%
14%
27%
45%
15%
Cle
anin
g a
nd
M
ain
ten
ance
In
dex
25%
39%
30%
6%
20%
37%
36%
7%P
ub
licE
du
cati
on
In
dex
42%
35%
19%
4%
39%
36%
22%
3%S
oci
al S
up
po
rt
Ser
vice
s In
dex
Ind
ex
Sco
reP
oo
rF
air
Go
od
Exc
elle
nt
Sur
vey
resp
onde
nts
wer
e as
ked
to n
ame
wha
t the
y th
ough
t w
ere
the
thre
e m
ost i
mpo
rtan
t iss
ues
faci
ng N
ew Y
ork
City
. T
he th
ree
resp
onse
s m
ost c
omm
only
giv
en b
y Q
ueen
s C
omm
unity
Boa
rd #
10 r
espo
nden
ts a
re li
sted
bel
ow.
Hig
hest
Rat
edLo
wes
t Rat
ed
Sur
vey
resp
onde
nts
rate
d 24
ser
vice
s in
thei
r ne
ighb
orho
od.
The
hig
hest
and
low
est r
ated
ser
vice
s ar
e di
spla
yed
belo
w.
NYC
All
Com
mun
ity B
oard
#10
Res
pond
ents
All
New
Yor
k C
ity R
espo
nden
ts
Ind
ex R
atin
gs:
Qu
een
s C
om
mu
nit
y B
oar
d #
10
Co
mp
ared
to
Rat
ing
s G
iven
by
All
Res
po
nd
ents
Mo
st Im
po
rtan
t Is
sues
Fac
ing
New
Yo
rk
Cit
y: Q
uee
ns
Co
mm
un
ity
Bo
ard
#10
Rat
ing
s o
f N
eig
hb
orh
oo
d S
ervi
ces:
Q
uee
ns
Co
mm
un
ity
Bo
ard
#10
5861 7580 8386 7979 8685 8992
1.C
rime
2.E
duca
tion
3.C
ost o
f liv
ing
1.F
ire p
rote
ctio
n se
rvic
es
2.E
mer
genc
y m
edic
al
serv
ices
3.R
ecyc
ling
serv
ices
4.H
ouse
hold
gar
bage
pic
k-up
5.P
ublic
libr
arie
s
1.A
vaila
bilit
y of
cul
tura
l ac
tiviti
es
2.C
ontr
ol o
f str
eet n
oise
3.S
torm
wat
er d
rain
age
and
sew
er m
aint
enan
ce
4.M
aint
enan
ce o
f str
eets
an
d ro
ads
5.M
aint
enan
ce o
f si
dew
alks

City
wid
e C
usto
mer
Sur
vey
Res
ults
15%
13%27
%
44%
50%
61%
29%28
%
12%
11% 8%
1%
0%25
%50
%75
%10
0%
All N
ew Y
ork
City
Res
pond
ents
All Q
ueen
s R
espo
nden
ts
All C
omm
unity
Boa
rd #
11 R
espo
nden
ts
Bac
kgro
un
d:
Qu
een
s C
om
mu
nit
y B
oar
d #
11S
urv
ey R
esp
on
ses:
Qu
een
s C
om
mu
nit
y B
oar
d #
11
Th
e N
eig
hb
orh
oo
ds
of
Qu
een
s C
om
mu
nit
y B
oar
d #
11 Sour
ce: N
YC P
lann
ing
Dep
artm
ent
Res
ult
sfr
om
NY
C F
eed
bac
k C
ityw
ide
Cu
sto
mer
Su
rvey
Qu
een
s C
om
mu
nit
y B
oar
d #
11
Rat
ing
s o
f N
eig
hb
orh
oo
d a
s a
Pla
ce t
o L
ive
Rat
ing
s o
f O
vera
ll Q
ual
ity
of
Lif
e in
New
Yo
rk C
ity
Exce
llent
Poor
Fair
Goo
d
Exce
llent
Poor
Fair
Goo
d
Exce
llent
Poor
Fair
Goo
d
Rat
ing
s o
f O
vera
ll Q
ual
ity
of
New
Yo
rk C
ity
Go
vern
men
t S
ervi
ces
45%
47%53
%
37%
39%38
%
12%
11%
4%4% 6%
5%
0%25
%50
%75
%10
0%
All N
ew Y
ork
City
Res
pond
ents
All Q
ueen
s R
espo
nden
ts
All C
omm
unity
Boa
rd #
11 R
espo
nden
ts
38%
38%47
%
44%
44%40
%
15%
14%
4%5% 4%
8%
0%25
%50
%75
%10
0%
All N
ew Y
ork
City
Res
pond
ents
All Q
ueen
s R
espo
nden
ts
All C
omm
unity
Boa
rd #
11 R
espo
nden
ts
Gen
der
•M
ale:
48%
•F
emal
e: 5
2%
Ag
e •<
18 y
ears
old
: 18%
•18
-54
year
s ol
d: 5
4%•
55+
yea
rs o
ld: 2
8%
Rac
e/E
thn
icit
y•
Non
-His
pani
c W
hite
: 51%
•N
on-H
ispa
nic
Bla
ck: 2
%•
Non
-His
pani
c A
sian
: 32%
•H
ispa
nic:
14%
•O
ther
: 1%
Po
pu
lati
on
an
d H
ou
seh
old
s•
Tot
al P
opul
atio
n: 1
17,7
84•
Tot
al H
ouse
hold
s: 4
6,72
8
Med
ian
An
nu
al H
ou
seh
old
Inco
me
•$6
7,47
2(2
006
Infla
tion-
Adj
uste
d D
olla
rs)
•37
6 R
espo
nses
•30
.6%
Res
pons
e R
ate
•±5
.1%
Mar
gin
of E
rror
(95
% C
onfid
ence
Inte
rval
)
See
deta
il be
low
Sou
rce:
U.S
. Cen
sus
Bur
eau
-20
06 A
mer
ican
Com
mun
ity S
urve
y, P
opul
atio
n D
ivis
ion
-N
ew Y
ork
City
Dep
artm
ent o
f City
Pla
nnin
g

City
wid
e C
usto
mer
Sur
vey
Res
ults
12%
26%
45%
18%
4%17
%55
%23
%N
eig
hb
orh
oo
d
Pu
blic
Saf
ety
Ind
ex
14%
34%
42%
10%
12%
30%
48%
11%
Mas
s T
ran
sit
Ser
vice
s In
dex
21%
34%
36%
9%
11%
28%
48%
14%
Str
eets
an
d
Sid
ewal
ks
Ind
ex
17%
29%
41%
13%
7%18
%48
%26
%C
lean
ing
an
d
Mai
nte
nan
ce
Ind
ex
25%
39%
30%
6%
10%
42%
40%
8%P
ub
licE
du
cati
on
In
dex
42%
35%
19%
4%
33%
39%
24%
4%S
oci
al S
up
po
rt
Ser
vice
s In
dex
Ind
ex
Sco
reP
oo
rF
air
Go
od
Exc
elle
nt
Sur
vey
resp
onde
nts
wer
e as
ked
to n
ame
wha
t the
y th
ough
t w
ere
the
thre
e m
ost i
mpo
rtan
t iss
ues
faci
ng N
ew Y
ork
City
. T
he th
ree
resp
onse
s m
ost c
omm
only
giv
en b
y Q
ueen
s C
omm
unity
Boa
rd #
11 r
espo
nden
ts a
re li
sted
bel
ow.
Hig
hest
Rat
edLo
wes
t Rat
ed
Sur
vey
resp
onde
nts
rate
d 24
ser
vice
s in
thei
r ne
ighb
orho
od.
The
hig
hest
and
low
est r
ated
ser
vice
s ar
e di
spla
yed
belo
w.
NYC
All
Com
mun
ity B
oard
#11
Res
pond
ents
All
New
Yor
k C
ity R
espo
nden
ts
Ind
ex R
atin
gs:
Qu
een
s C
om
mu
nit
y B
oar
d #
11
Co
mp
ared
to
Rat
ing
s G
iven
by
All
Res
po
nd
ents
Mo
st Im
po
rtan
t Is
sues
Fac
ing
New
Yo
rk
Cit
y: Q
uee
ns
Co
mm
un
ity
Bo
ard
#11
Rat
ing
s o
f N
eig
hb
orh
oo
d S
ervi
ces:
Q
uee
ns
Co
mm
un
ity
Bo
ard
#11
5867 7590 8393 7989 8688 8996
1.E
duca
tion
2.T
axes
3.P
ublic
Saf
ety
1.F
ire p
rote
ctio
n se
rvic
es
2.H
ouse
hold
gar
bage
pic
k-up
3.E
mer
genc
y m
edic
al
serv
ices
4.C
lean
lines
s of
you
r ne
ighb
orho
od
5.R
ecyc
ling
serv
ices
1.S
ubw
ay s
ervi
ces
2.S
torm
wat
er d
rain
age
and
sew
er m
aint
enan
ce
3.A
vaila
bilit
y of
cul
tura
l ac
tiviti
es
4.M
aint
enan
ce o
f str
eets
an
d ro
ads
5.C
ondi
tion
of s
tree
t tre
es

City
wid
e C
usto
mer
Sur
vey
Res
ults
15%
13%
44%
50%
37%
29%28
%
42%
12%
17%
3%
8%
0%25
%50
%75
%10
0%
All N
ew Y
ork
City
Res
pond
ents
All Q
ueen
s R
espo
nden
ts
All C
omm
unity
Boa
rd #
12 R
espo
nden
ts
Bac
kgro
un
d:
Qu
een
s C
om
mu
nit
y B
oar
d #
12S
urv
ey R
esp
on
ses:
Qu
een
s C
om
mu
nit
y B
oar
d #
12
Th
e N
eig
hb
orh
oo
ds
of
Qu
een
s C
om
mu
nit
y B
oar
d #
12 Sour
ce: N
YC P
lann
ing
Dep
artm
ent
Res
ult
sfr
om
NY
C F
eed
bac
k C
ityw
ide
Cu
sto
mer
Su
rvey
Qu
een
s C
om
mu
nit
y B
oar
d #
12
Rat
ing
s o
f N
eig
hb
orh
oo
d a
s a
Pla
ce t
o L
ive
Rat
ing
s o
f O
vera
ll Q
ual
ity
of
Lif
e in
New
Yo
rk C
ity
Exce
llent
Poor
Fair
Goo
d
Exce
llent
Poor
Fair
Goo
d
Exce
llent
Poor
Fair
Goo
d
Rat
ing
s o
f O
vera
ll Q
ual
ity
of
New
Yo
rk C
ity
Go
vern
men
t S
ervi
ces
45%
47%
28%
37%
39%
51%
12%
20%
4%2% 6%
11
%
0%25
%50
%75
%10
0%
All N
ew Y
ork
City
Res
pond
ents
All Q
ueen
s R
espo
nden
ts
All C
omm
unity
Boa
rd #
12 R
espo
nden
ts
38%
38%
28%
44%
44%
49%
15%
14%
21%
4%2% 4%
0%25
%50
%75
%10
0%
All N
ew Y
ork
City
Res
pond
ents
All Q
ueen
s R
espo
nden
ts
All C
omm
unity
Boa
rd #
12 R
espo
nden
ts
Gen
der
•M
ale:
46%
•F
emal
e: 5
4%A
ge •<
18 y
ears
old
: 27%
•18
-54
year
s ol
d: 5
2%•
55+
yea
rs o
ld: 2
2%
Rac
e/E
thn
icit
y•
Non
-His
pani
c W
hite
: 2%
•N
on-H
ispa
nic
Bla
ck: 6
9%•
Non
-His
pani
c A
sian
: 10%
•H
ispa
nic:
14%
•O
ther
: 5%
Po
pu
lati
on
an
d H
ou
seh
old
s•
Tot
al P
opul
atio
n: 2
16,1
15•
Tot
al H
ouse
hold
s: 6
6,26
7
Med
ian
An
nu
al H
ou
seh
old
Inco
me
•$4
8,90
3(2
006
Infla
tion-
Adj
uste
d D
olla
rs)
•25
3 R
espo
nses
•12
.8%
Res
pons
e R
ate
•±6
.2%
Mar
gin
of E
rror
(95
% C
onfid
ence
Inte
rval
)
Sou
rce:
U.S
. Cen
sus
Bur
eau
-20
06 A
mer
ican
Com
mun
ity S
urve
y, P
opul
atio
n D
ivis
ion
-N
ew Y
ork
City
Dep
artm
ent o
f City
Pla
nnin
g
See
deta
il be
low

City
wid
e C
usto
mer
Sur
vey
Res
ults
12%
26%
45%
18%
18%
35%
36%
11%
Nei
gh
bo
rho
od
P
ub
lic S
afet
y In
dex
14%
34%
42%
10%
17%
38%
39%
5%M
ass
Tra
nsi
t S
ervi
ces
Ind
ex
21%
34%
36%
9%
22%
39%
35%
4%S
tree
ts a
nd
S
idew
alks
In
dex
17%
29%
41%
13%
19%
32%
40%
10%
Cle
anin
g a
nd
M
ain
ten
ance
In
dex
25%
39%
30%
6%
33%
38%
26%
3%P
ub
licE
du
cati
on
In
dex
42%
35%
19%
4%
53%
33%
12%
3%S
oci
al S
up
po
rt
Ser
vice
s In
dex
Ind
ex
Sco
reP
oo
rF
air
Go
od
Exc
elle
nt
Sur
vey
resp
onde
nts
wer
e as
ked
to n
ame
wha
t the
y th
ough
t w
ere
the
thre
e m
ost i
mpo
rtan
t iss
ues
faci
ng N
ew Y
ork
City
. T
he th
ree
resp
onse
s m
ost c
omm
only
giv
en b
y Q
ueen
s C
omm
unity
Boa
rd #
12 r
espo
nden
ts a
re li
sted
bel
ow.
Hig
hest
Rat
edLo
wes
t Rat
ed
Sur
vey
resp
onde
nts
rate
d 24
ser
vice
s in
thei
r ne
ighb
orho
od.
The
hig
hest
and
low
est r
ated
ser
vice
s ar
e di
spla
yed
belo
w.
NYC
All
Com
mun
ity B
oard
#12
Res
pond
ents
All
New
Yor
k C
ity R
espo
nden
ts
Ind
ex R
atin
gs:
Qu
een
s C
om
mu
nit
y B
oar
d #
12
Co
mp
ared
to
Rat
ing
s G
iven
by
All
Res
po
nd
ents
Mo
st Im
po
rtan
t Is
sues
Fac
ing
New
Yo
rk
Cit
y: Q
uee
ns
Co
mm
un
ity
Bo
ard
#12
Rat
ing
s o
f N
eig
hb
orh
oo
d S
ervi
ces:
Q
uee
ns
Co
mm
un
ity
Bo
ard
#12
5847 7567 8381 7978 8683 8982
1.H
ousi
ng
2.E
duca
tion
3.C
ost o
f liv
ing
1.F
ire p
rote
ctio
n se
rvic
es
2.E
mer
genc
y m
edic
al
serv
ices
3.H
ouse
hold
gar
bage
pic
k-up
4.R
ecyc
ling
serv
ices
5.P
ublic
libr
arie
s
1.A
vaila
bilit
y of
cul
tura
l ac
tiviti
es
2.P
olic
e-C
omm
unity
re
latio
ns
3.S
torm
wat
er d
rain
age
and
sew
er m
aint
enan
ce
4.C
ontr
ol o
f str
eet n
oise
5.M
aint
enan
ce o
f str
eets
an
d ro
ads

City
wid
e C
usto
mer
Sur
vey
Res
ults
15%
13%
12%
44%
50%61
%
29%28
%24%
12%4% 8%
0%25
%50
%75
%10
0%
All N
ew Y
ork
City
Res
pond
ents
All Q
ueen
s R
espo
nden
ts
All C
omm
unity
Boa
rd #
13 R
espo
nden
ts
Bac
kgro
un
d:
Qu
een
s C
om
mu
nit
y B
oar
d #
13S
urv
ey R
esp
on
ses:
Qu
een
s C
om
mu
nit
y B
oar
d #
13
Th
e N
eig
hb
orh
oo
ds
of
Qu
een
s C
om
mu
nit
y B
oar
d #
13 Sour
ce: N
YC P
lann
ing
Dep
artm
ent
Res
ult
sfr
om
NY
C F
eed
bac
k C
ityw
ide
Cu
sto
mer
Su
rvey
Qu
een
s C
om
mu
nit
y B
oar
d #
13
Rat
ing
s o
f N
eig
hb
orh
oo
d a
s a
Pla
ce t
o L
ive
Rat
ing
s o
f O
vera
ll Q
ual
ity
of
Lif
e in
New
Yo
rk C
ity
Exce
llent
Poor
Fair
Goo
d
Exce
llent
Poor
Fair
Goo
d
Exce
llent
Poor
Fair
Goo
d
Rat
ing
s o
f O
vera
ll Q
ual
ity
of
New
Yo
rk C
ity
Go
vern
men
t S
ervi
ces
45%
47%
45%
37%
39%
45%
12%
11%
4%
2% 6%
8%
0%25
%50
%75
%10
0%
All N
ew Y
ork
City
Res
pond
ents
All Q
ueen
s R
espo
nden
ts
All C
omm
unity
Boa
rd #
13 R
espo
nden
ts
38%
38%
34%
44%
44%
50%
15%
14%
14%
4%
2% 4%
0%25
%50
%75
%10
0%
All N
ew Y
ork
City
Res
pond
ents
All Q
ueen
s R
espo
nden
ts
All C
omm
unity
Boa
rd #
13 R
espo
nden
ts
Gen
der
•M
ale:
47%
•F
emal
e: 5
3%A
ge •<
18 y
ears
old
: 23%
•18
-54
year
s ol
d: 5
1%•
55+
yea
rs o
ld: 2
5%
Rac
e/E
thn
icit
y•
Non
-His
pani
c W
hite
: 14%
•N
on-H
ispa
nic
Bla
ck: 5
6%•
Non
-His
pani
c A
sian
: 13%
•H
ispa
nic:
12%
•O
ther
: 5%
Po
pu
lati
on
an
d H
ou
seh
old
s•
Tot
al P
opul
atio
n: 2
13,7
04•
Tot
al H
ouse
hold
s: 6
4,49
0
Med
ian
An
nu
al H
ou
seh
old
Inco
me
•$6
6,04
3(2
006
Infla
tion-
Adj
uste
d D
olla
rs)
•31
1 R
espo
nses
•17
.9%
Res
pons
e R
ate
•±5
.6%
Mar
gin
of E
rror
(95
% C
onfid
ence
Inte
rval
)
Sou
rce:
U.S
. Cen
sus
Bur
eau
-20
06 A
mer
ican
Com
mun
ity S
urve
y, P
opul
atio
n D
ivis
ion
-N
ew Y
ork
City
Dep
artm
ent o
f City
Pla
nnin
g
See
deta
il be
low

City
wid
e C
usto
mer
Sur
vey
Res
ults
12%
26%
45%
18%
7%26
%51
%16
%N
eig
hb
orh
oo
d
Pu
blic
Saf
ety
Ind
ex
14%
34%
42%
10%
14%
36%
44%
6%M
ass
Tra
nsi
t S
ervi
ces
Ind
ex
21%
34%
36%
9%
17%
34%
40%
9%S
tree
ts a
nd
S
idew
alks
In
dex
17%
29%
41%
13%
11%
25%
46%
17%
Cle
anin
g a
nd
M
ain
ten
ance
In
dex
25%
39%
30%
6%
24%
43%
27%
5%P
ub
licE
du
cati
on
In
dex
42%
35%
19%
4%
45%
38%
15%
2%S
oci
al S
up
po
rt
Ser
vice
s In
dex
Ind
ex
Sco
reP
oo
rF
air
Go
od
Exc
elle
nt
Sur
vey
resp
onde
nts
wer
e as
ked
to n
ame
wha
t the
y th
ough
t w
ere
the
thre
e m
ost i
mpo
rtan
t iss
ues
faci
ng N
ew Y
ork
City
. T
he th
ree
resp
onse
s m
ost c
omm
only
giv
en b
y Q
ueen
s C
omm
unity
Boa
rd #
13 r
espo
nden
ts a
re li
sted
bel
ow.
Hig
hest
Rat
edLo
wes
t Rat
ed
Sur
vey
resp
onde
nts
rate
d 24
ser
vice
s in
thei
r ne
ighb
orho
od.
The
hig
hest
and
low
est r
ated
ser
vice
s ar
e di
spla
yed
belo
w.
NYC
All
Com
mun
ity B
oard
#13
Res
pond
ents
All
New
Yor
k C
ity R
espo
nden
ts
Ind
ex R
atin
gs:
Qu
een
s C
om
mu
nit
y B
oar
d #
13
Co
mp
ared
to
Rat
ing
s G
iven
by
All
Res
po
nd
ents
Mo
st Im
po
rtan
t Is
sues
Fac
ing
New
Yo
rk
Cit
y: Q
uee
ns
Co
mm
un
ity
Bo
ard
#13
Rat
ing
s o
f N
eig
hb
orh
oo
d S
ervi
ces:
Q
uee
ns
Co
mm
un
ity
Bo
ard
#13
5855 7576 8389 7983 8686 8993
1.E
duca
tion
2.H
ousi
ng
3.C
rime
1.F
ire p
rote
ctio
n se
rvic
es
2.R
ecyc
ling
serv
ices
3.E
mer
genc
y m
edic
al
serv
ices
4.H
ouse
hold
gar
bage
pic
k-up
5.P
ublic
libr
arie
s
1.A
vaila
bilit
y of
cul
tura
l ac
tiviti
es
2.S
torm
wat
er d
rain
age
and
sew
er m
aint
enan
ce
3.M
aint
enan
ce o
f str
eets
an
d ro
ads
4.C
ondi
tion
of s
tree
t tre
es
5.M
aint
enan
ce o
f si
dew
alks

City
wid
e C
usto
mer
Sur
vey
Res
ults
15%
13%
17%
44%
50%
33%
29%28
%
32%
12%
18% 8%
0%25
%50
%75
%10
0%
All N
ew Y
ork
City
Res
pond
ents
All Q
ueen
s R
espo
nden
ts
All C
omm
unity
Boa
rd #
14 R
espo
nden
ts
Bac
kgro
un
d:
Qu
een
s C
om
mu
nit
y B
oar
d #
14S
urv
ey R
esp
on
ses:
Qu
een
s C
om
mu
nit
y B
oar
d #
14
Th
e N
eig
hb
orh
oo
ds
of
Qu
een
s C
om
mu
nit
y B
oar
d #
14 Sour
ce: N
YC P
lann
ing
Dep
artm
ent
Res
ult
sfr
om
NY
C F
eed
bac
k C
ityw
ide
Cu
sto
mer
Su
rvey
Qu
een
s C
om
mu
nit
y B
oar
d #
14
Rat
ing
s o
f N
eig
hb
orh
oo
d a
s a
Pla
ce t
o L
ive
Rat
ing
s o
f O
vera
ll Q
ual
ity
of
Lif
e in
New
Yo
rk C
ity
Exce
llent
Poor
Fair
Goo
d
Exce
llent
Poor
Fair
Goo
d
Exce
llent
Poor
Fair
Goo
d
Rat
ing
s o
f O
vera
ll Q
ual
ity
of
New
Yo
rk C
ity
Go
vern
men
t S
ervi
ces
45%
47%
49%
37%
39%
34%
12%
14%
4%3% 6%
11%
0%25
%50
%75
%10
0%
All N
ew Y
ork
City
Res
pond
ents
All Q
ueen
s R
espo
nden
ts
All C
omm
unity
Boa
rd #
14 R
espo
nden
ts
38%
38%
36%
44%
44%
43%
15%
14%
15%
4%5% 4%
0%25
%50
%75
%10
0%
All N
ew Y
ork
City
Res
pond
ents
All Q
ueen
s R
espo
nden
ts
All C
omm
unity
Boa
rd #
14 R
espo
nden
ts
Gen
der
•M
ale:
45%
•F
emal
e: 5
5%A
ge •<
18 y
ears
old
: 32%
•18
-54
year
s ol
d: 4
6%•
55+
yea
rs o
ld: 2
2%
Rac
e/E
thn
icit
y•
Non
-His
pani
c W
hite
: 40%
•N
on-H
ispa
nic
Bla
ck: 3
8%•
Non
-His
pani
c A
sian
: 1%
•H
ispa
nic:
18%
•O
ther
: 3%
Po
pu
lati
on
an
d H
ou
seh
old
s•
Tot
al P
opul
atio
n: 1
20,2
68•
Tot
al H
ouse
hold
s: 3
8,78
2
Med
ian
An
nu
al H
ou
seh
old
Inco
me
•$4
3,57
1(2
006
Infla
tion-
Adj
uste
d D
olla
rs)
•34
0 R
espo
nses
•16
.0%
Res
pons
e R
ate
•±5
.3%
Mar
gin
of E
rror
(95
% C
onfid
ence
Inte
rval
)
See
deta
il be
low
Sou
rce:
U.S
. Cen
sus
Bur
eau
-20
06 A
mer
ican
Com
mun
ity S
urve
y, P
opul
atio
n D
ivis
ion
-N
ew Y
ork
City
Dep
artm
ent o
f City
Pla
nnin
g

City
wid
e C
usto
mer
Sur
vey
Res
ults
12%
26%
45%
18%
15%
28%
36%
21%
Nei
gh
bo
rho
od
P
ub
lic S
afet
y In
dex
14%
34%
42%
10%
25%
34%
36%
6%M
ass
Tra
nsi
t S
ervi
ces
Ind
ex
21%
34%
36%
9%
23%
33%
31%
13%
Str
eets
an
d
Sid
ewal
ks
Ind
ex
17%
29%
41%
13%
16%
29%
37%
18%
Cle
anin
g a
nd
M
ain
ten
ance
In
dex
25%
39%
30%
6%
31%
36%
26%
7%P
ub
licE
du
cati
on
In
dex
42%
35%
19%
4%
47%
31%
17%
4%S
oci
al S
up
po
rt
Ser
vice
s In
dex
Ind
ex
Sco
reP
oo
rF
air
Go
od
Exc
elle
nt
Sur
vey
resp
onde
nts
wer
e as
ked
to n
ame
wha
t the
y th
ough
t w
ere
the
thre
e m
ost i
mpo
rtan
t iss
ues
faci
ng N
ew Y
ork
City
. T
he th
ree
resp
onse
s m
ost c
omm
only
giv
en b
y Q
ueen
s C
omm
unity
Boa
rd #
14 r
espo
nden
ts a
re li
sted
bel
ow.
Hig
hest
Rat
edLo
wes
t Rat
ed
Sur
vey
resp
onde
nts
rate
d 24
ser
vice
s in
thei
r ne
ighb
orho
od.
The
hig
hest
and
low
est r
ated
ser
vice
s ar
e di
spla
yed
belo
w.
NYC
All
Com
mun
ity B
oard
#14
Res
pond
ents
All
New
Yor
k C
ity R
espo
nden
ts
Ind
ex R
atin
gs:
Qu
een
s C
om
mu
nit
y B
oar
d #
14
Co
mp
ared
to
Rat
ing
s G
iven
by
All
Res
po
nd
ents
Mo
st Im
po
rtan
t Is
sues
Fac
ing
New
Yo
rk
Cit
y: Q
uee
ns
Co
mm
un
ity
Bo
ard
#14
Rat
ing
s o
f N
eig
hb
orh
oo
d S
ervi
ces:
Q
uee
ns
Co
mm
un
ity
Bo
ard
#14
5853 7569 8384 7977 8675 8985
1.C
rime
2.E
duca
tion
3.H
ousi
ng
1.F
ire p
rote
ctio
n se
rvic
es
2.E
mer
genc
y m
edic
al
serv
ices
3.H
ouse
hold
gar
bage
pic
k-up
4.R
ecyc
ling
serv
ices
5.C
ondi
tion
of s
tree
t tre
es
1.A
vaila
bilit
y of
cul
tura
l ac
tiviti
es
2.S
torm
wat
er d
rain
age
and
sew
er m
aint
enan
ce
3.S
ubw
ay s
ervi
ces
4.M
aint
enan
ce o
f str
eets
an
d ro
ads
5.M
aint
enan
ce o
f si
dew
alks
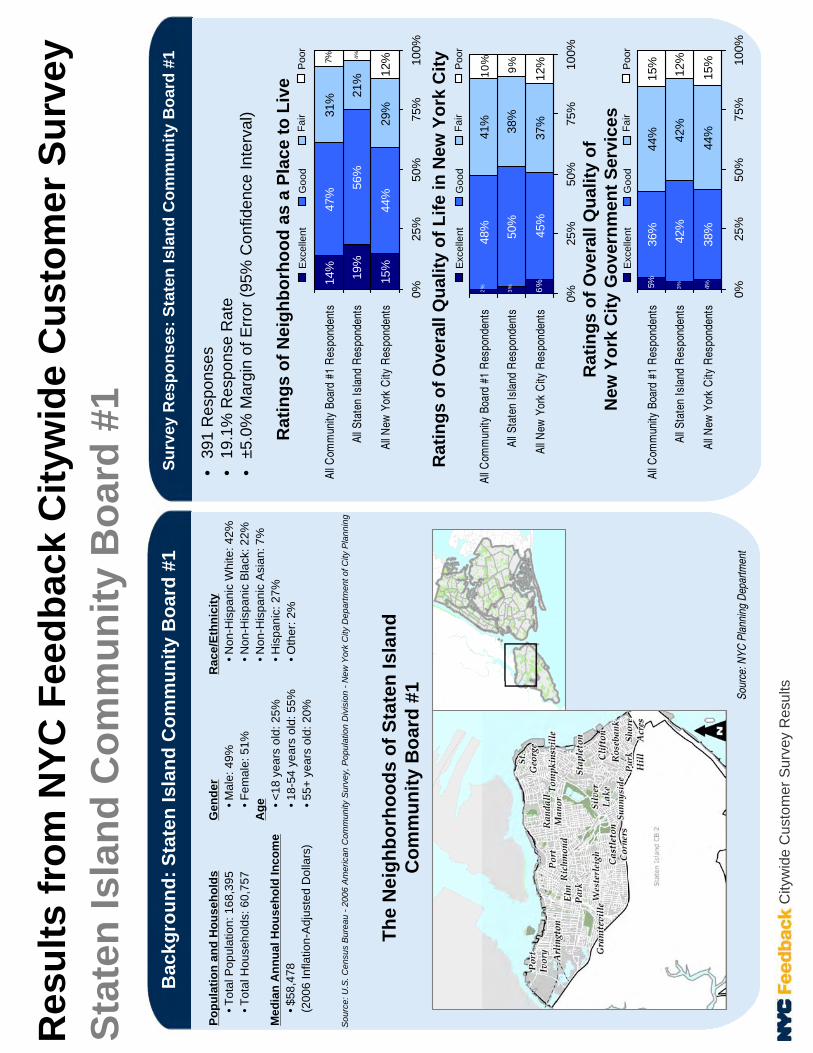
City
wid
e C
usto
mer
Sur
vey
Res
ults
15%
19%
14%
44%
56%
47%
29%
21%
31%
12%4%7%
0%25
%50
%75
%10
0%
All N
ew Y
ork
City
Res
pond
ents
All S
tate
n Is
land
Res
pond
ents
All C
omm
unity
Boa
rd #
1 R
espo
nden
ts
Bac
kgro
un
d:
Sta
ten
Isla
nd
Co
mm
un
ity
Bo
ard
#1
Su
rvey
Res
po
nse
s: S
tate
n Is
lan
d C
om
mu
nit
y B
oar
d #
1
Th
e N
eig
hb
orh
oo
ds
of
Sta
ten
Isla
nd
C
om
mu
nit
y B
oar
d #
1
Sour
ce: N
YC P
lann
ing
Dep
artm
ent
Res
ult
sfr
om
NY
C F
eed
bac
k C
ityw
ide
Cu
sto
mer
Su
rvey
Sta
ten
Isla
nd
Co
mm
un
ity
Bo
ard
#1
Rat
ing
s o
f N
eig
hb
orh
oo
d a
s a
Pla
ce t
o L
ive
Rat
ing
s o
f O
vera
ll Q
ual
ity
of
Lif
e in
New
Yo
rk C
ity
Exce
llent
Poor
Fair
Goo
d
Exce
llent
Poor
Fair
Goo
d
Exce
llent
Poor
Fair
Goo
d
Rat
ing
s o
f O
vera
ll Q
ual
ity
of
New
Yo
rk C
ity
Go
vern
men
t S
ervi
ces
45%
50%
48%
37%38%
41%
12%
3%2% 6%
9%
10
%
0%25
%50
%75
%10
0%
All N
ew Y
ork
City
Res
pond
ents
All S
tate
n Is
land
Res
pond
ents
All C
omm
unity
Boa
rd #
1 R
espo
nden
ts
38%
42%
36%
44%42
%
44%
15%
12%
15%
3%5% 4%
0%25
%50
%75
%10
0%
All N
ew Y
ork
City
Res
pond
ents
All S
tate
n Is
land
Res
pond
ents
All C
omm
unity
Boa
rd #
1 R
espo
nden
ts
Gen
der
•M
ale:
49%
•F
emal
e: 5
1%A
ge •<
18 y
ears
old
: 25%
•18
-54
year
s ol
d: 5
5%•
55+
yea
rs o
ld: 2
0%
Rac
e/E
thn
icit
y•
Non
-His
pani
c W
hite
: 42%
•N
on-H
ispa
nic
Bla
ck: 2
2%•
Non
-His
pani
c A
sian
: 7%
•H
ispa
nic:
27%
•O
ther
: 2%
Po
pu
lati
on
an
d H
ou
seh
old
s•
Tot
al P
opul
atio
n: 1
68,3
95•
Tot
al H
ouse
hold
s: 6
0,75
7
Med
ian
An
nu
al H
ou
seh
old
Inco
me
•$5
8,47
8(2
006
Infla
tion-
Adj
uste
d D
olla
rs)
•39
1 R
espo
nses
•19
.1%
Res
pons
e R
ate
•±5
.0%
Mar
gin
of E
rror
(95
% C
onfid
ence
Inte
rval
)
See
deta
il be
low
Sou
rce:
U.S
. Cen
sus
Bur
eau
-20
06 A
mer
ican
Com
mun
ity S
urve
y, P
opul
atio
n D
ivis
ion
-N
ew Y
ork
City
Dep
artm
ent o
f City
Pla
nnin
g

City
wid
e C
usto
mer
Sur
vey
Res
ults
12%
26%
45%
18%
12%
20%
45%
23%
Nei
gh
bo
rho
od
P
ub
lic S
afet
y In
dex
14%
34%
42%
10%
18%
33%
40%
9%M
ass
Tra
nsi
t S
ervi
ces
Ind
ex
21%
34%
36%
9%
22%
35%
35%
8%S
tree
ts a
nd
S
idew
alks
In
dex
17%
29%
41%
13%
13%
26%
45%
16%
Cle
anin
g a
nd
M
ain
ten
ance
In
dex
25%
39%
30%
6%
20%
39%
33%
8%P
ub
licE
du
cati
on
In
dex
42%
35%
19%
4%
39%
40%
16%
5%S
oci
al S
up
po
rt
Ser
vice
s In
dex
Ind
ex
Sco
reP
oo
rF
air
Go
od
Exc
elle
nt
Sur
vey
resp
onde
nts
wer
e as
ked
to n
ame
wha
t the
y th
ough
t w
ere
the
thre
e m
ost i
mpo
rtan
t iss
ues
faci
ng N
ew Y
ork
City
. T
he th
ree
resp
onse
s m
ost c
omm
only
giv
en b
y S
tate
n Is
land
Com
mun
ity B
oard
#1
resp
onde
nts
are
liste
d be
low
.
Hig
hest
Rat
edLo
wes
t Rat
ed
Sur
vey
resp
onde
nts
rate
d 24
ser
vice
s in
thei
r ne
ighb
orho
od.
The
hig
hest
and
low
est r
ated
ser
vice
s ar
e di
spla
yed
belo
w.
NYC
All
Com
mun
ity B
oard
#1
Res
pond
ents
All
New
Yor
k C
ity R
espo
nden
ts
Ind
ex R
atin
gs:
Sta
ten
Isla
nd
Co
mm
un
ity
Bo
ard
#1
Co
mp
ared
to
Rat
ing
s G
iven
by
All
Res
po
nd
ents
Mo
st Im
po
rtan
t Is
sues
Fac
ing
New
Yo
rk
Cit
y: S
tate
n Is
lan
d C
om
mu
nit
y B
oar
d #
1
Rat
ing
s o
f N
eig
hb
orh
oo
d S
ervi
ces:
S
tate
n Is
lan
d C
om
mu
nit
y B
oar
d #
1
5861 7580 8387 7978 8682 8988
1.E
duca
tion
2.C
rime
3.M
ass
Tra
nsit
1.F
ire p
rote
ctio
n se
rvic
es
2.E
mer
genc
y m
edic
al
serv
ices
3.R
ecyc
ling
serv
ices
4.H
ouse
hold
gar
bage
pic
k-up
5.P
ublic
libr
arie
s
1.M
aint
enan
ce o
f str
eets
an
d ro
ads
2.S
ubw
ay s
ervi
ces
3.M
aint
enan
ce o
f si
dew
alks
4.P
olic
e-C
omm
unity
re
latio
ns
5.S
torm
wat
er d
rain
age
and
sew
er m
aint
enan
ce

City
wid
e C
usto
mer
Sur
vey
Res
ults
15%
19%
16%
44%
56%
61%
29%
21%
19% 12
%4%3%
0%25
%50
%75
%10
0%
All N
ew Y
ork
City
Res
pond
ents
All S
tate
n Is
land
Res
pond
ents
All C
omm
unity
Boa
rd #
2 R
espo
nden
ts
Bac
kgro
un
d:
Sta
ten
Isla
nd
Co
mm
un
ity
Bo
ard
#2
Su
rvey
Res
po
nse
s: S
tate
n Is
lan
d C
om
mu
nit
y B
oar
d #
2
Th
e N
eig
hb
orh
oo
ds
of
Sta
ten
Isla
nd
C
om
mu
nit
y B
oar
d #
2
Sour
ce: N
YC P
lann
ing
Dep
artm
ent
Res
ult
sfr
om
NY
C F
eed
bac
k C
ityw
ide
Cu
sto
mer
Su
rvey
Sta
ten
Isla
nd
Co
mm
un
ity
Bo
ard
#2
Rat
ing
s o
f N
eig
hb
orh
oo
d a
s a
Pla
ce t
o L
ive
Rat
ing
s o
f O
vera
ll Q
ual
ity
of
Lif
e in
New
Yo
rk C
ity
Exce
llent
Poor
Fair
Goo
d
Exce
llent
Poor
Fair
Goo
d
Exce
llent
Poor
Fair
Goo
d
Rat
ing
s o
f O
vera
ll Q
ual
ity
of
New
Yo
rk C
ity
Go
vern
men
t S
ervi
ces
45%
50%
52%
37%38%
34%
12%9%11%
3%3% 6%
0%25
%50
%75
%10
0%
All N
ew Y
ork
City
Res
pond
ents
All S
tate
n Is
land
Res
pond
ents
All C
omm
unity
Boa
rd #
2 R
espo
nden
ts
38%
42%
44%
44%42
%45%
15%
12%8%
3%3% 4%
0%25
%50
%75
%10
0%
All N
ew Y
ork
City
Res
pond
ents
All S
tate
n Is
land
Res
pond
ents
All C
omm
unity
Boa
rd #
2 R
espo
nden
ts
Gen
der
•M
ale:
47%
•F
emal
e: 5
3%A
ge •<
18 y
ears
old
: 23%
•18
-54
year
s ol
d: 5
1%•
55+
yea
rs o
ld: 2
7%
Rac
e/E
thn
icit
y•
Non
-His
pani
c W
hite
: 75%
•N
on-H
ispa
nic
Bla
ck: 5
%•
Non
-His
pani
c A
sian
: 11%
•H
ispa
nic:
8%
•O
ther
: 1%
Po
pu
lati
on
an
d H
ou
seh
old
s•
Tot
al P
opul
atio
n: 1
33,7
36•
Tot
al H
ouse
hold
s: 4
6,98
7
Med
ian
An
nu
al H
ou
seh
old
Inco
me
•$6
9,04
0(2
006
Infla
tion-
Adj
uste
d D
olla
rs)
•38
6 R
espo
nses
•26
.3%
Res
pons
e R
ate
•±5
.0%
Mar
gin
of E
rror
(95
% C
onfid
ence
Inte
rval
)
See
deta
il be
low
Sou
rce:
U.S
. Cen
sus
Bur
eau
-20
06 A
mer
ican
Com
mun
ity S
urve
y, P
opul
atio
n D
ivis
ion
-N
ew Y
ork
City
Dep
artm
ent o
f City
Pla
nnin
g

City
wid
e C
usto
mer
Sur
vey
Res
ults
12%
26%
45%
18%
5%18
%55
%22
%N
eig
hb
orh
oo
d
Pu
blic
Saf
ety
Ind
ex
14%
34%
42%
10%
13%
35%
45%
8%M
ass
Tra
nsi
t S
ervi
ces
Ind
ex
21%
34%
36%
9%
18%
34%
40%
8%S
tree
ts a
nd
S
idew
alks
In
dex
17%
29%
41%
13%
11%
24%
47%
18%
Cle
anin
g a
nd
M
ain
ten
ance
In
dex
25%
39%
30%
6%
14%
40%
41%
5%P
ub
licE
du
cati
on
In
dex
42%
35%
19%
4%
35%
43%
20%
2%S
oci
al S
up
po
rt
Ser
vice
s In
dex
Ind
ex
Sco
reP
oo
rF
air
Go
od
Exc
elle
nt
Sur
vey
resp
onde
nts
wer
e as
ked
to n
ame
wha
t the
y th
ough
t w
ere
the
thre
e m
ost i
mpo
rtan
t iss
ues
faci
ng N
ew Y
ork
City
. T
he th
ree
resp
onse
s m
ost c
omm
only
giv
en b
y S
tate
n Is
land
Com
mun
ity B
oard
#2
resp
onde
nts
are
liste
d be
low
.
Hig
hest
Rat
edLo
wes
t Rat
ed
Sur
vey
resp
onde
nts
rate
d 24
ser
vice
s in
thei
r ne
ighb
orho
od.
The
hig
hest
and
low
est r
ated
ser
vice
s ar
e di
spla
yed
belo
w.
NYC
All
Com
mun
ity B
oard
#2
Res
pond
ents
All
New
Yor
k C
ity R
espo
nden
ts
Ind
ex R
atin
gs:
Sta
ten
Isla
nd
Co
mm
un
ity
Bo
ard
#2
Co
mp
ared
to
Rat
ing
s G
iven
by
All
Res
po
nd
ents
Mo
st Im
po
rtan
t Is
sues
Fac
ing
New
Yo
rk
Cit
y: S
tate
n Is
lan
d C
om
mu
nit
y B
oar
d #
2
Rat
ing
s o
f N
eig
hb
orh
oo
d S
ervi
ces:
S
tate
n Is
lan
d C
om
mu
nit
y B
oar
d #
2
5865 7586 8389 7982 8687 8995
1.T
raffi
c C
onge
stio
n
2.C
rime
3.E
duca
tion
1.F
ire p
rote
ctio
n se
rvic
es
2.P
ublic
libr
arie
s
3.E
mer
genc
y m
edic
al
serv
ices
4.C
lean
lines
s of
you
r ne
ighb
orho
od
5.H
ouse
hold
gar
bage
pic
k-up
1.M
aint
enan
ce o
f str
eets
an
d ro
ads
2.S
ubw
ay s
ervi
ces
3.M
aint
enan
ce o
f si
dew
alks
4.G
raffi
ti co
ntro
l
5.S
torm
wat
er d
rain
age
and
sew
er m
aint
enan
ce

City
wid
e C
usto
mer
Sur
vey
Res
ults
15%
19%25
%
44%
56%
61%
29%
21%12
%
12%
2%
4%
0%25
%50
%75
%10
0%
All N
ew Y
ork
City
Res
pond
ents
All S
tate
n Is
land
Res
pond
ents
All C
omm
unity
Boa
rd #
3 R
espo
nden
ts
Bac
kgro
un
d:
Sta
ten
Isla
nd
Co
mm
un
ity
Bo
ard
#3
Su
rvey
Res
po
nse
s: S
tate
n Is
lan
d C
om
mu
nit
y B
oar
d #
3
Th
e N
eig
hb
orh
oo
ds
of
Sta
ten
Isla
nd
C
om
mu
nit
y B
oar
d #
3
Sour
ce: N
YC P
lann
ing
Dep
artm
ent
Res
ult
sfr
om
NY
C F
eed
bac
k C
ityw
ide
Cu
sto
mer
Su
rvey
Sta
ten
Isla
nd
Co
mm
un
ity
Bo
ard
#3
Rat
ing
s o
f N
eig
hb
orh
oo
d a
s a
Pla
ce t
o L
ive
Rat
ing
s o
f O
vera
ll Q
ual
ity
of
Lif
e in
New
Yo
rk C
ity
Exce
llent
Poor
Fair
Goo
d
Exce
llent
Poor
Fair
Goo
d
Exce
llent
Poor
Fair
Goo
d
Rat
ing
s o
f O
vera
ll Q
ual
ity
of
New
Yo
rk C
ity
Go
vern
men
t S
ervi
ces
45%
50%
50%
37%38%
38%
12%9%
3%4% 6%
8%
0%25
%50
%75
%10
0%
All N
ew Y
ork
City
Res
pond
ents
All S
tate
n Is
land
Res
pond
ents
All C
omm
unity
Boa
rd #
3 R
espo
nden
ts
38%
42%
47%
44%42
%
39%
15%
12%
12%
3%
3% 4%
0%25
%50
%75
%10
0%
All N
ew Y
ork
City
Res
pond
ents
All S
tate
n Is
land
Res
pond
ents
All C
omm
unity
Boa
rd #
3 R
espo
nden
ts
Gen
der
•M
ale:
49%
•F
emal
e: 5
1%A
ge •<
18 y
ears
old
: 24%
•
18-5
4 ye
ars
old:
53%
•55
+ y
ears
old
: 23%
Rac
e/E
thn
icit
y•
Non
-His
pani
c W
hite
: 84%
•N
on-H
ispa
nic
Bla
ck: 1
%•
Non
-His
pani
c A
sian
: 5%
•H
ispa
nic:
9%
•O
ther
: 1%
Po
pu
lati
on
an
d H
ou
seh
old
s•
Tot
al P
opul
atio
n: 1
75,2
46•
Tot
al H
ouse
hold
s: 5
8,75
7
Med
ian
An
nu
al H
ou
seh
old
Inco
me
•$8
1,93
3(2
006
Infla
tion-
Adj
uste
d D
olla
rs)
•36
1 R
espo
nses
•30
.1%
Res
pons
e R
ate
•±5
.2%
Mar
gin
of E
rror
(95
% C
onfid
ence
Inte
rval
)
See
deta
il be
low
Sou
rce:
U.S
. Cen
sus
Bur
eau
-20
06 A
mer
ican
Com
mun
ity S
urve
y, P
opul
atio
n D
ivis
ion
-N
ew Y
ork
City
Dep
artm
ent o
f City
Pla
nnin
g

City
wid
e C
usto
mer
Sur
vey
Res
ults
12%
26%
45%
18%
5%18
%52
%25
%N
eig
hb
orh
oo
d
Pu
blic
Saf
ety
Ind
ex
14%
34%
42%
10%
18%
27%
44%
12%
Mas
s T
ran
sit
Ser
vice
s In
dex
21%
34%
36%
9%
21%
27%
42%
10%
Str
eets
an
d
Sid
ewal
ks
Ind
ex
17%
29%
41%
13%
10%
20%
47%
23%
Cle
anin
g a
nd
M
ain
ten
ance
In
dex
25%
39%
30%
6%
14%
32%
45%
8%P
ub
licE
du
cati
on
In
dex
42%
35%
19%
4%
40%
34%
22%
4%S
oci
al S
up
po
rt
Ser
vice
s In
dex
Ind
ex
Sco
reP
oo
rF
air
Go
od
Exc
elle
nt
Sur
vey
resp
onde
nts
wer
e as
ked
to n
ame
wha
t the
y th
ough
t w
ere
the
thre
e m
ost i
mpo
rtan
t iss
ues
faci
ng N
ew Y
ork
City
. T
he th
ree
resp
onse
s m
ost c
omm
only
giv
en b
y S
tate
n Is
land
Com
mun
ity B
oard
#3
resp
onde
nts
are
liste
d be
low
.
Hig
hest
Rat
edLo
wes
t Rat
ed
Sur
vey
resp
onde
nts
rate
d 24
ser
vice
s in
thei
r ne
ighb
orho
od.
The
hig
hest
and
low
est r
ated
ser
vice
s ar
e di
spla
yed
belo
w.
NYC
All
Com
mun
ity B
oard
#3
Res
pond
ents
All
New
Yor
k C
ity R
espo
nden
ts
Ind
ex R
atin
gs:
Sta
ten
Isla
nd
Co
mm
un
ity
Bo
ard
#3
Co
mp
ared
to
Rat
ing
s G
iven
by
All
Res
po
nd
ents
Mo
st Im
po
rtan
t Is
sues
Fac
ing
New
Yo
rk
Cit
y: S
tate
n Is
lan
d C
om
mu
nit
y B
oar
d #
3
Rat
ing
s o
f N
eig
hb
orh
oo
d S
ervi
ces:
S
tate
n Is
lan
d C
om
mu
nit
y B
oar
d #
3
5860 7586 8390 7979 8682 8995
1.C
rime
2.M
ass
Tra
nsit
3.T
axes
1.F
ire p
rote
ctio
n se
rvic
es
2.E
mer
genc
y m
edic
al
serv
ices
3.C
rime
cont
rol
4.H
ouse
hold
gar
bage
pic
k-up
5.R
ecyc
ling
serv
ices
1.M
aint
enan
ce o
f str
eets
an
d ro
ads
2.M
aint
enan
ce o
f si
dew
alks
3.B
us s
ervi
ces
4.S
ubw
ay s
ervi
ces
5.G
raffi
ti co
ntro
l
