the new zealand joint registry - nzoa 17 year report.pdf · editorial coents p.3 the new zealand...
TRANSCRIPT
THE NEW ZEALAND JOINT REGISTRY SEVENTEEN YEAR REPORT JANUARY 1999 TO DECEMBER 2015
17 YEARS
Email: [email protected] Website: www.nzoa.org.nz/nz-joint-registry
Date of Publication: October 2016
Registry BoardAlastair Rothwell Chairman and Registry Supervisor
Peter Devane Orthopaedic Surgeon
Simon Young Orthopaedic Surgeon
Dawson Muir Orthopaedic Surgeon
Andrew Oakley Secretary New Zealand Orthopaedic Association, Orthopaedic Surgeon
Hugh Griffin Orthopaedic Industry Liaison Association
Peter Larmer Arthritis New Zealand
Andrea Pettett CEO New Zealand Orthopaedic Association
Toni Hobbs Registry Coordinator
Annual Report Editorial CommitteeAlastair Rothwell Registry Supervisor
Toni Hobbs Registry Coordinator
Chris Frampton Statistician
James Taylor Hip and knee
Dawson Muir Ankle
Khalid Mohammed Shoulder and elbow
Editorial Comments P.3The New Zealand Joint Registry Annual Report 2013
Editorial Comment 4
Acknowledgments 8
Participating Hospitals and Coordinators 9
Profile of Average New Zealand Orthopaedic Surgeon 11
Development and Implementation of the New Zealand Registry 12
Inclusion of Other Joint Replacement Arthroplasties 14
Development since the Introduction of the Registry 15
Category Totals 15
Hip Arthroplasty 16
Knee Arthroplasty 79
Unicompartmental Knee Arthroplasty 111
Ankle Arthroplasty 121
Shoulder Arthroplasty 126
Elbow Arthroplasty 140
Lumbar Disc Replacement 145
Cervical Disc Replacement 147
Appendices:
- Appendix 1 - Oxford 12 Questionnaire References 148
- Appendix 2 - Publications 149
- Appendix 3 - Prosthesis Inventory 151
- Appendix 4 - Data forms 155
- Appendix 5 - Oxford 12 Questionnaire forms 170
CONTENTS
The New Zealand Joint RegistryP.4 Editorial Comments
This year’s report contains updated data from last year’s report as well as new analyses including revision rates for “mismatched” hip prostheses, Oxford scores for major hip and knee implants, revision rates for different bearing surfaces for the same hip prosthesis combinations, Kaplan Meier (KM) curves for BMI groupings and unicompartmental prostheses.
In this year’s report the format of previous years has been followed such that each arthroplasty section is self- contained. This does, however, result in a certain amount of intersection repetition.
The total number of registered joint arthroplasties at 31st of December 2015 was 239,726, which had been performed on 166,094 individual patients, of which 32,163 (19%) had died during the 17 year period.
The number of observed component years (ocys) contained within the Registry is now well in excess of one million. The increase of 19,870 registered joints for 2015 compared to the 19,190 in 2014 represents an overall annual gain of 3.5%, compared to the percentage gain of 5.5 in 2014. When compared to 2014 registrations the big gains for primary joint arthroplasties in 2015 were for elbow (58%), shoulder (22%) and unicompartmental knees (14%). There was a small increase for hips (0.3%), no change for ankles and a 2.1% decrease for knees. Due to this reduction the proportion of knees to hips has fallen from 47.1% in 2014 to 46.4% in 2015.
As for previous years, analyses of revision data have been confined to primary registered arthroplasties.
Hip ArthroplastyThere are 110,208 primary hip arthroplasties in the Registry of which 5,092 have been revised (4.7%), a total of 695,879 ocys, an overall revision rate of 0.73 per 100 ocys (95% confidence interval; 0.71 -0.75) and a 16 year K M prosthesis survival of 86.2% (cemented 87.5%; uncemented 85.9% and hybrid 85.6%). The proportion of uncemented (45.4%) and hybrid (44%) has risen slightly at the expense of fully cemented arthroplasties when compared to 2014. However, the KM curves continue to demonstrate better longer term survival for fully cemented arthroplasties. There were 8,373 primary hip registrations for 2015 and the overall mean BMI for hips is 28.86.
There are 1,074 (1,001 in 2014) hip prosthesis combinations in the Registry but only 208 (19%) with 50 or more registrations.
As in previous years, the three types of hip fixation have been analysed against the four age bands: less than 55 years; 55-64 years; 65-74 years, and greater than 75 years. The data shows that overall the hybrid hip has the best performance.
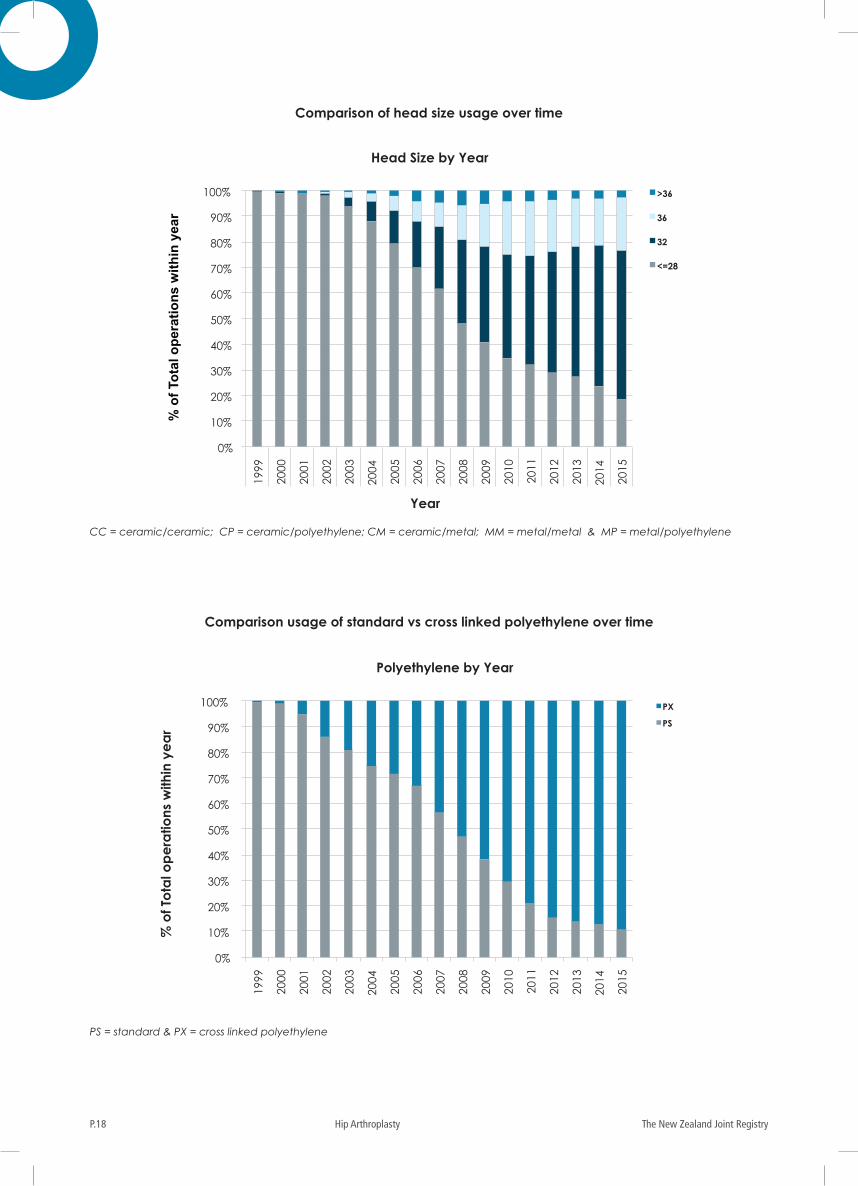
The ceramic on plastic bearing surface continues to increase in popularity and rose to 35% of total in 2015. It is noteworthy
that no metal on metal hip arthroplasties were registered in 2015 for head size > 28mm. However, overall the use of 36mm head sizes increased by 2.1% in 2015 and the increasing use of the ceramic >36 mm head has so far been vindicated in that the revision rate remains low at a mean of three years. On the other hand metal on metal articulations fare poorly when revision rates are analysed against head size, bearing surface materials, age bands and cemented/uncemented/hybrid variants.
In response to negative media publicity earlier this year regarding the failure of the all-metal version of the Pinnacle cup, the bearing surface options for 6 of the more commonly used acetabulae have been analysed separately and it confirms that the metal bearing surfaces have a significantly higher revision rate for the Pinnacle and R3 porous cups and although higher for RM pressfit, Trident and Tritanium cups do not reach statistical significance due to their relatively small numbers.
In another response to adverse publicity the revision rates for combinations with components manufactured from different companies (component “mismatches”) has been calculated for 10 “mismatches” with more than 500 implantations. Just three of them; the Exeter V40 - Continuum TM, Spectron - Duraloc and the Exeter - Duraloc combinations have significantly higher revision rates than the overall mean rate of 0.73 /100 ocys @ the 95% confidence interval.
The use of cross linked polyethylene continues its upward trend, making up 89.1% of the total polyethylene in 2015.
KM curves for the various types of uncemented hip arthroplasties dramatically illustrate the higher revision rates for metal on metal hip arthroplasty.
The Corail-Pinnacle combination remains currently the most popular but the ExeterV40-Trident combination has accumulated the most component years at 34,056 from 6,712 primary arthroplasties and has the very low revision rate of 0.46/100 ocys.
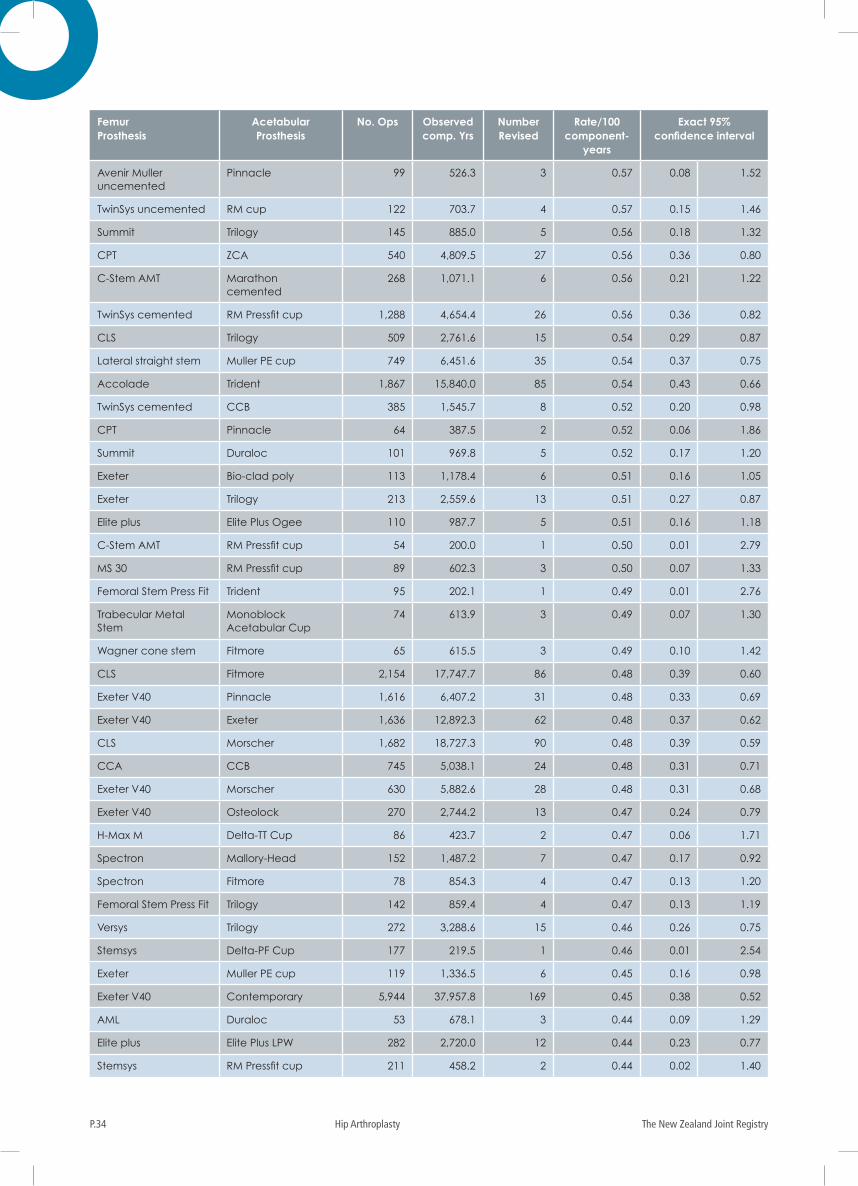
Revision rates for individual hip component combinations (minimum of 50 primary procedures) assembled in order of numbers of arthroplasties as well as revision rates have again been calculated as well as the tables listing combinations by fixation method to make it easier for readers to determine the combination options used within the three types of prosthesis fixation. There is also the table of prosthesis combinations based on the femoral component which should help readers find specific combinations. Three combinations (four in 2014) which are still currently being used have revision rates significantly higher (p<0.05) than the overall rate of 0.73/100 ocys and two of them, Exeter V40-Continuum and Synergy
EDITORIAL COMMENT
It is our great pleasure to present the seventeen year report of the New Zealand Orthopaedic Association’s New Zealand Joint Registry.
P.5The New Zealand Joint Registry Editorial Comments
Porous-R3 Porous, were in the top ten combinations implanted in 2015. It is also worth noting that the revision rate for monoblock stems which have been implanted for an average of 10.5 years is very low at 0.47/100 ocys.
Revision rates for X linked and standard polyethylene have again been compared for both metal and ceramic heads. It was demonstrated that the combination of ceramic head with X linked polyethylene has a significantly lower revision rate compared to the standard polyethylene varieties used with both the metal and ceramic heads.
KM curves for some of the hip combinations with a minimum of 1,500 arthroplasties and 10 years of analysable data have once again been included as well as 12 year KM curves for those combinations with a minimum of 2,000 procedures. It is noted that the Exeter combinations, except for Exeter-Contemporary, are among the better and the Spectron combinations among the poorer KM curves. Note the excellent survival of the Muller-Muller combination.
Again this year the KM curves for minor (defined as replacement of liners, bearings, heads, patellae) versus major (defined as replacement of acetabular, femoral, or tibial components +/- minor components) revisions for both hips and knees have been compared. As was shown last year, the revision rate after a major revision is significantly better than for a minor revision for both hips and knees, thus suggesting that some minor revisions perhaps should have been full revisions.
There has been a further increase in the number of primary hip revisions with ALVAL (aseptic lymphocytic vascular-associated lesions), or similar, listed as the reason for revision. In 2011 the number increased from15 to 72; in 2012 to 102; in 2013 to 146; in 2014 to 182 and in 2015 to 232. Forty-four hips have now been revised for high blood ion levels. These reflect the continuing failure rate of metal on metal hip prosthesis combinations which have >36mm heads. It is worth noting in this context that 52% of the conventional ASR prostheses have been revised.
Other analyses recently introduced, including yearly stacked graphs to demonstrate changes over the last 15 years of head size, bearing surfaces, polyethylene and reasons for revision, have again been included as well as KM curves for
cemented/uncemented stems and cups, different head sizes, the different bearing surfaces and cross linked vs standard polyethylene. All graphically illustrate different survival trends.
New this year are revision rate tables and KM curves for the five different BMI groupings which confirm the higher prosthesis revision rate for the morbidly obese (BMI>40) group.
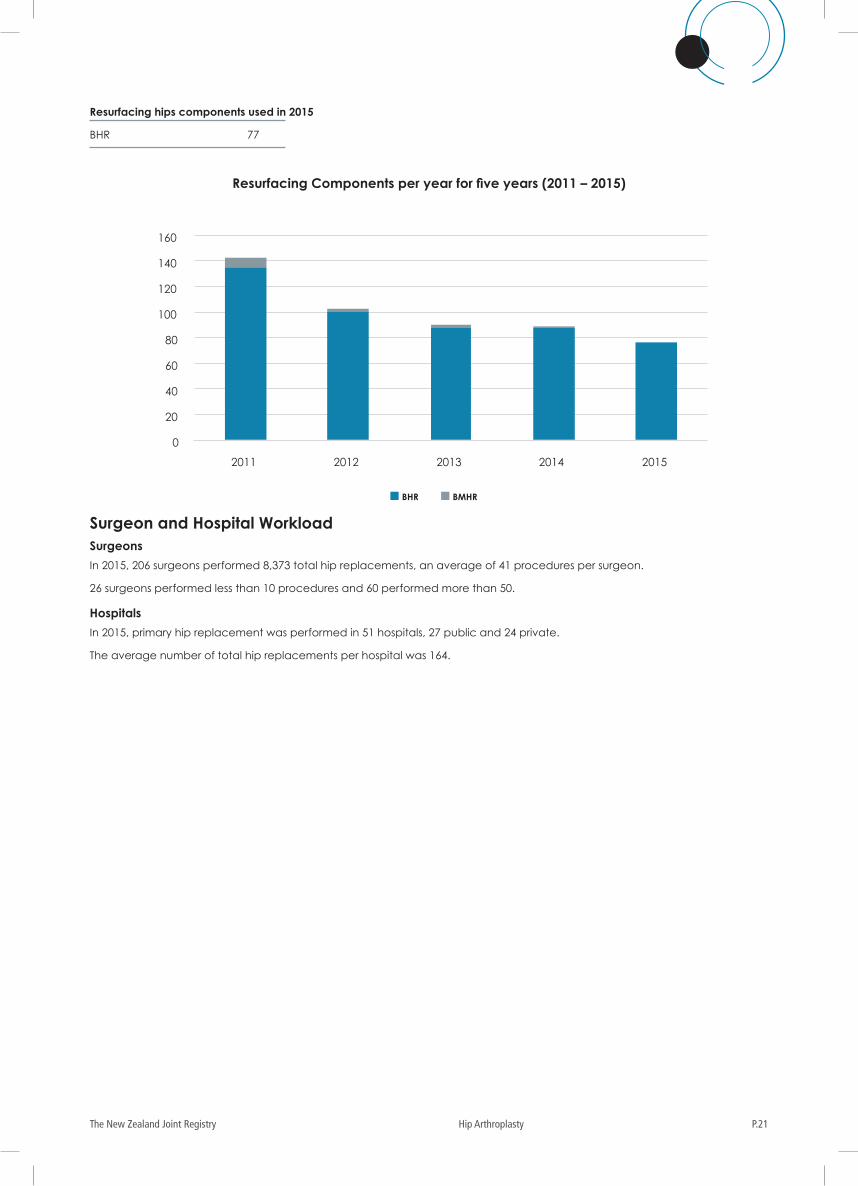
Resurfacing hip arthroplasty registrations continue to decline from the high of 203 in 2009 with just 77 registered in 2015. The revision rate has fallen slightly to 1.25/100 ocys.
The Best and the Worst Combinations From the 17 years of accumulated data it is possible to recommend the generic component combinations which currently should provide the best long term survival. These are: acetabulum – cemented; bearing surfaces - ceramic head with X linked polyethylene liner; head size 32 mm; stem - cemented.
Conversely the component combinations to avoid are: acetabulum - uncemented metal; bearing surfaces - metal on metal; head size >= 36mm; stem - uncemented.
Knee ArthroplastyThere are 86,186 registered primary knee arthroplasties of which 2,569 have been revised (2.9%), a total of 521,421 ocys with the overall revision rate 0.49/100 ocys, (95% confidence interval; 0.47-0.51) and the excellent sixteen year KM survival of 93.20%. There were 7,260 primary knee registrations for 2015 and the overall mean BMI for knees is 31.17.
As was done for recent annual reports several variants of basically the same knee prosthesis type e.g. Nexgen, LCS, which are registered separately, have been merged into the one group to enable comparable statistical analyses with other prostheses which may have also had variants but are registered as one or two prostheses.
There are 59 different types of knee prostheses in the Registry with 30 (50%) having fewer than 10 registrations.
The Triathlon remains as the current most popular prosthesis but the Attune has overtaken the Nexgen for second place. Calculation of revision rates for individual prostheses with a minimum of 50 arthroplasties shows that among the bigger registered numbers the Duracon, although no longer implanted, has the lowest revision rate of 0.30/100 ocys. The Nexgen has the biggest number of registrations at 17,919 and 111,818 ocys. Two of the currently used prostheses, Balansys and Legion, as well as the uncemented version of the LCS knee have significantly higher revision rates than the overall rate of 0.49/100 ocys @ the 95% confidence.
“In this year’s report the format of previous years has been followed such
that each arthroplasty section is self- contained. This does, however, result in a
certain amount of intersection repetition.”
The New Zealand Joint RegistryP.6 Editorial Comments
KM curves for six of the cemented knee prostheses with a minimum of 10 years of analysable data have again been included. The Duracon has the highest and the LCS and Nexgen the lowest (but still very good) survival.
Although uncemented knee arthroplasty represents just 4% of all primary knee arthroplasties it has a significantly higher revision rate (p<0.05) than either fully cemented or hybrid in which the tibial component is cemented and the femoral component uncemented. The KM curves for the three types of fixation show that the uncemented curve continues to steeply diverge from the other two.
Image guidance (IG), first recorded by the Registry in 2005, remains quite popular for primary knee arthroplasty and during 2015 was used in 15% of procedures, down from 18% in 2014. Comparison of revision rates for IG with non IG procedures demonstrates a rate of 0.50 versus 0.49/100 ocys. There is no statistical difference between the two at ten years.
The analyses comparing revision rates and 16 year KM curves of fixed versus mobile bearing knees continue to show that there is no longer a significantly higher revision rate for mobile bearings and the KM curves beyond 10 years are superimposed.
Again this year, separate analyses for cruciate retaining versus posterior stabilised knee prostheses demonstrate that overall there are significantly higher revision rates for posterior stabilised prostheses. This is also graphically illustrated with the KM survival graphs.
There are 417 patello-femoral prostheses registered, with 61 added in 2015, compared to 64 in 2014. Thirty six (8.6%) have been revised and the revision rate at 2.05/100 ocys is four times that for total knee arthroplasty. All except five were revised to a total knee arthroplasty.
New this year are revision rate tables and survival curves for the five different BMI groupings but unlike hip arthroplasty the morbidly obese (BMI>40) group do not have statistically significant different revision rates or KM curves.
Unicompartmental knee arthroplastyThere are 9,635 registered primary unicompartmental prostheses of which 757 have been revised (7.9%), a total of 60,707 ocys with the overall revision rate 1.25/100 ocys, (95% confidence interval; 1.16-1.34) and a 14 year K M survival of 83.29%. Pain is the main reason for revision in almost 50% of cases. There were 809 registrations in 2015, a 14% increase over 2014
Once again the Oxford uncemented prosthesis was very dominant, accounting for more than the total of all the others in 2015. It also continues to have a low revision rate at 0.70/100 ocys. However, the lowest revision rate is currently the Zimmer unicompartmental prosthesis at 0.53/100 ocys. Both of these prostheses have a mean implantation time of just over three years compared to eight years for the Oxford 3, which for many years was the most popular unicompartmental replacement but has a current revision rate of 1.40/100 ocys.
A KM survival curve further demonstrates the divergence of the Oxford from the Oxford uncemented and Zimmer prostheses.
The use of the minimally invasive approach for the unicompartmental knee arthroplasty remains steady at approximately 25% with it being used in 26% of procedures in 2015. It is to be noted that the minimally invasive approach is associated with a significantly lower revision rate compared to the conventional medial parapatellar approach.
When a unicompartmental arthroplasty is converted to a total knee arthroplasty there is a significantly increased subsequent revision rate at 1.67/100ocys which is 3.4 times that for a primary total knee arthroplasty revision rate of 0.49 at the 95% confidence interval This statistic is even more significant following revision of a unicompartmental to a further unicompartmental arthroplasty (11x).
Ankle arthroplastyThere are 1,261 primary registered ankle prostheses of which 134 have been revised (10.3%), a total of 6,590 ocys, a mean revision rate of 2.03/100 ocys and a ten year KM survival of 81.43%.
There were 101 primary ankle arthroplasties registered in 2015 which was one fewer than the previous year. The Salto prosthesis (mobile and fixed bearing versions ie the Salto Talaris) totally overshadowed all others, accounting for 87% of the 2015 registrations. The Salto prosthesis has by far the lowest revision rate (1.08) with a mean implantation time of 3.7 years. The Infinity prosthesis made its debut in 2015.
Shoulder arthroplastyThere are 7,305 registered primary shoulder prostheses of which 356 have been revised (4.9%), a total of 34,369 ocys, a mean revision rate of 1.04/100 ocys and a 12 year KM survival of 91.2%. There were 974 shoulder prostheses within 5 different categories registered during 2015, 22% up on 2014 and continuing the steady year by year increase.
There was no further addition to the Humeral Sphere category and the stack graph demonstrates the evolution over time of the six categories with the reverse prostheses continuing to gain in popularity and accounting in 2015 for 63% of the registered primary shoulders.
With regard to revision rates, there is a significantly higher revision rate for Partial Resurfacing compared to all the other groups. This is also graphically illustrated in the KMs for the six different prosthesis categories. Revision rates also vary greatly among the large number of registered prostheses within the different categories but it is noteworthy that the Conventional SMR with the L1 glenoid, which for some years has been among the most popular of the prosthesis options, has five times the revision rate of the long established Global and the Bigliani/Flatow and 7 times that of the Global AP Conventional total prostheses.
P.7The New Zealand Joint Registry Editorial Comments
Arthroplasties using uncemented glenoids continue to show five times the revision rate compared to those having cemented glenoids.
Elbow arthroplastyThere are 476 registered primary elbow prostheses of which 29 have been revised (4.9%), a total of 2,811 ocys, a mean revision rate of 1.03/100 ocys and a nine year KM survival of 91.8%. Numbers registered in 2015 increased by 41, an increase of 15 (54%) over 2014, which is the biggest ever annual registration. The Coonrad Morrey prosthesis which has been the most popular since the Registry began has been overtaken by its successor the Zimmer Nexel.
Deep InfectionOnce again we have compared the deep infection revision rates within six months of the arthroplasty for primary hip and knee arthroplasty against the theatre environment. Six months has been chosen, as infection within this time period is highly likely to have been introduced at the time of surgery. This year’s analyses again demonstrate that for primary hip and knee arthroplasty there was an increased risk for revision for deep infection when the primary procedure was carried out in a laminar flow theatre with a space suit compared to a conventional theatre without a space suit (2.4 & 2.5 times respectively for hip and knee). The use of space suits also significantly increases the risk of revision for deep infection in both conventional and laminar flow theatres. There has been little change in the percentage of arthroplasties performed in laminar flow theatres or in the use of space suits over the last few years.
Oxford 12 QuestionnaireSix month, 5, 10 and 15 year scores analyses of the individual score categories for primary hip and knee arthroplasties continue to demonstrate that the six-month score is indicative of the longer term outcome. In particular there has been no diminution of the percentage of people with residual pain for both hips and knees and the ability to kneel for knees over the 15 years.
It is noteworthy that the 15 year scores still have a similar high percentage of excellent/good outcomes as the 6 month, 5 and 10 year outcomes. For the 1,538 15 year hip scores available for analysis, 86% had excellent/good scores which compares well with the 84% at 6 months following primary arthroplasty. The findings are similar for the 1,113 available 15 year knee scores, with 79% excellent/good compared to 74% at 6 months post primary arthroplasty.
For revision arthroplasty scores at 6 months just 63% (hip) and 53% (knee) were excellent/good.
As noted in previous years, the statistically significant relationship between the six month, five and ten year scores and revision within two years of the score date for primary hips, knees (including unicompartmental) and shoulders (six months and five years only) has again been demonstrated.
Due to the large number of recorded six month Oxford hip and knee scores the score groupings have been further broken down to demonstrate an even more convincing relationship between score and risk of revision within two years.
Once again analyses of hip and knee six month post - first revision arthroplasty questionnaire data has been undertaken and it demonstrates a similar relationship between the Oxford score at six months and the second revision within two years.
This year Oxford score analyses for some of the larger number hip and knee prostheses have been undertaken and show that there is little score difference among these prostheses at six months and without exception they have higher (better) scores at five years. In addition, this year, six month Oxford mean scores were determined for each of the five BMI groups for hip and knee arthroplasty and the morbidly obese hip group had a significantly lower score than the others except for BMI<19 group.
With regard to shoulder arthroplasty Conventional Total and Resurfacing Head types have significantly higher six month and five year scores.
Deceased Person’s DataA deceased person’s data is valid in perpetuity for all analyses involving the time interval prior to the person’s death e.g. if a person dies eight years post primary hip replacement their data is always valid for all analyses for that eight year period. Hence the rider “deceased patients censored at time of death.”
Publications and PresentationsSince last year’s report further peer reviewed papers based on registry data have been published in, accepted by or submitted to international journals as well multiple podium presentations (see Appendix 2).
Alastair Rothwell Supervisor Toni Hobbs Coordinator Chris Frampton Statistician

The New Zealand Joint RegistryP.8 Editorial Comments
ACKNOWLEDGEMENTSThe Registry is very appreciative of the support from the following:
Canterbury District Health Board:
For accommodation and other facilities
Chris Lewis, Information Analyst, Ministry of Health:
For audit compliance information
Mike Wall, Alumni Software:
For continued monitoring and upgrading of database software
European Arthroplasty Registry:
For Logo Design
Deborah McPherson:
For formatting assistance
DH Designz:
Final design
FUNDING The Registry wishes to acknowledge development and ongoing funding support from:
• ACCIDENT COMPENSATION CORPORATION
• CANTERBURY DISTRICT HEALTH BOARD
• MINISTRY OF HEALTH
• NEW ZEALAND ORTHOPAEDIC ASSOCIATION
• ORTHOPAEDIC SURGEONS
• SOUTHERN CROSS HOSPITALS
• WISHBONE TRUST
PARTICIPATING HOSPITALSWe wish to gratefully acknowledge the support of all participating hospitals and especially the coordinators who have taken responsibility for the data forms.
P.9The New Zealand Joint Registry Contributing Hospitals
HOSPITALS AND CONTACTS
Public HospitalsAuckland Hospital Auckland 1142 Contact: Shelley Thomas
Burwood Hospital Christchurch 8083 Contact: Diane Darley
Christchurch Hospital Christchurch 8140 Contact: Kirsty Harrison
Dunedin Hospital Dunedin 9016 Contact: Jennifer Larsen
Elective Surgery Centre Takapuna 0740 Contact: Alannah Domigan
Gisborne Hospital Gisborne 4010 Contact: Candice Dowell
Grey Base Hospital Greymouth 7840 Contact: Arianne Go
Hawkes Bay Hospital Hastings 4120 Contact: Jacqueline Cornish
Hutt Hospital Lower Hutt 5040 Contact: Juliana Moore/Margot Clapham
Kenepuru Hospital Porirua 5240 Contact: Zoe Perkins
Manukau Surgery Centre Auckland 2104 Contact: Amanda Ellis
Masterton Hospital Masterton 5840 Contact: Lisa Manihera
Middlemore Hospital Auckland 1640 Contact: Lalesh Deo/Luisa Lilo
Nelson Hospital Nelson 7040 Contact: Claudia Teunissen/Scott Hunter
North Shore Hospital, Takapuna 0740 Contact: Chris Cavalier
Palmerston North Hospital Palmerston North 4442 Contact: Karen McKie
Rotorua Hospital Rotorua 3046 Contact: Janice Reynolds/Jackie Dearman
Southland Hospital Invercargill 9812 Contact: Helen Powley
Taranaki Base Hospital New Plymouth 4342 Contact: Allison Tijsen
Tauranga Hospital Tauranga 3143 Contact: David Nyhoff
Timaru Hospital Timaru 7940 Contact: Ruby Kelly-Smith
Waikato Hospital Hamilton 3204 Contact: Monette Johnston
Wairau Hospital Blenheim 7240 Contact: Monette Johnston
Wellington Hospital Newtown 6242 Contact: Brigitte Stravens
Whakatane Hospital Whakatane 3158 Contact: Karen Burke
Whanganui Hospital Whanganui 4540 Contact: Susan Slight
Whangarei Area Hospital Whangarei 0140 Contact: Helen Harris
Private HospitalsAscot Integrated Hospital Remuera 1050 Contact: Margie Robertson /Sean Haycock
Belverdale Hospital Wanganui 4500 Contact: Jane Young
Bidwill Trust Hospital Timaru 7910 Contact: Kay Taylor
Boulcott Hospital Lower Hutt 5040 Contact: Karen Hall
Bowen Hospital Wellington 6035 Contact: Pam Kohnke
The New Zealand Joint RegistryP.10 Contributing Hospitals
Braemar Private Hospital Hamilton 3204 Contact: Phyllis Lee
Chelsea Hospital Gisborne 4010 Contact: Kirsten Clarke
Crest Hospital Palmerston North 4440 Contact: Ann Nicholls
Grace Hospital Tauranga 3112 Contact: Anne Heke
Kensington Hospital Whangarei 0112 Contact: Sandy Brace
Manuka Street Hospital Nelson 7010 Contact: Karen Tijsen
Mercy Hospital Dunedin 9054 Contact: Liz Cadman
Mercy Integrated Hospital Auckland 1023 Contact: Marie Buitenhek/Janine Wells
Ormiston Hospital Auckland 2016 Contact: Julie Hodgson
Royston Hospital Hastings 4122 Contact: Suzette Du Plessis
Southern Cross Hospital, Brightside Epsom 1023 Contact: Theresa Lambert
Southern Cross Hospital Christchurch Central 8013 Contact: Diane Kennedy
Southern Cross Hospital Hamilton East 3216 Contact: Christine Gregor
Southern Cross Hospital Invercargill Central 9810 Contact: Maree Henderson
Southern Cross Hospital New Plymouth 4310 Contact: Leanne Belgrave/Brendon Toole
Southern Cross North Harbour Glenfield 0627 Contact: Belinda Stevens
Southern Cross Hospital Rotorua 3015 Contact: Chris Mott
Southern Cross Hospital Newtown, Wellington 6021 Contact: Marian Lee
St Georges Hospital Christchurch 8014 Contact: Tania Chin
Wakefield Hospital Newtown, Wellington 6021 Contact: Jan Kereopa
P.11The New Zealand Joint Registry Profile of an Orthopaedic Surgeon
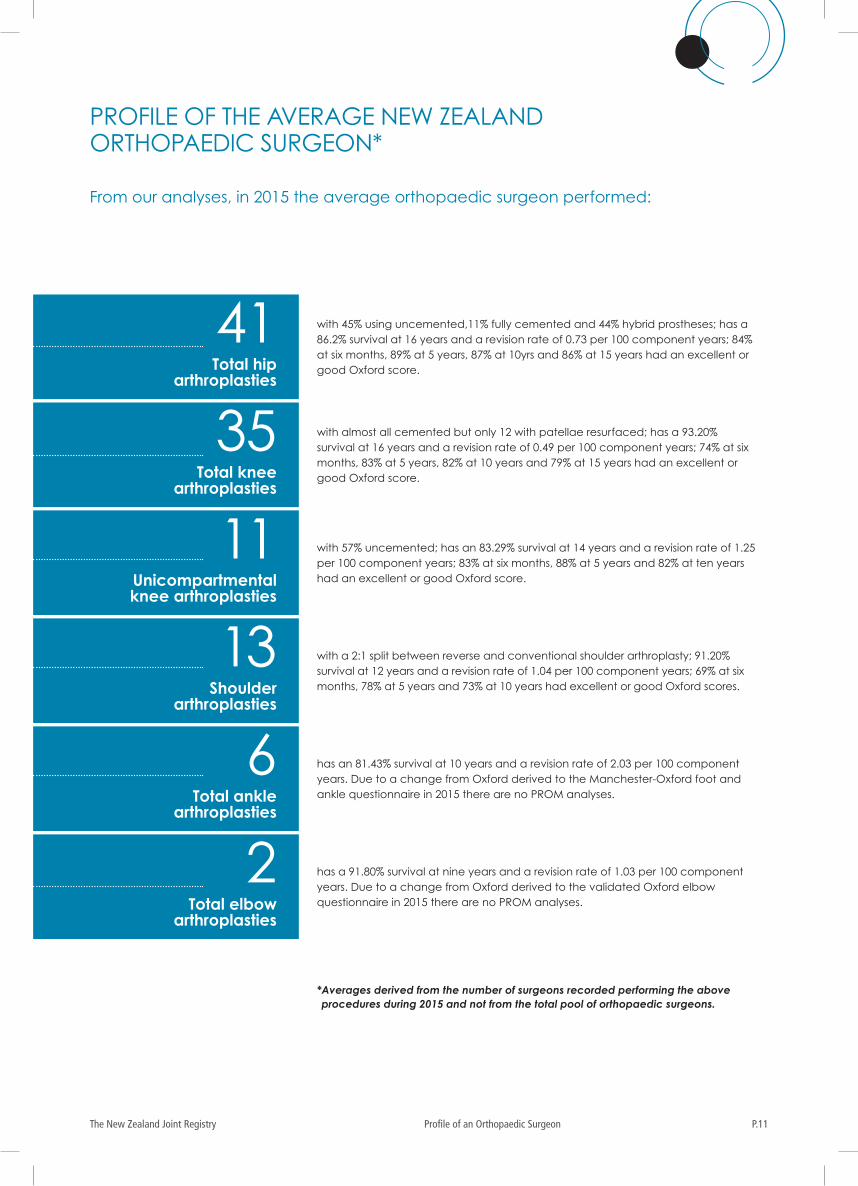
PROFILE OF THE AVERAGE NEW ZEALAND ORTHOPAEDIC SURGEON*
* Averages derived from the number of surgeons recorded performing the above procedures during 2015 and not from the total pool of orthopaedic surgeons.
41 Total hip
arthroplasties
35 Total knee
arthroplasties
11 Unicompartmental knee arthroplasties
13 Shoulder
arthroplasties
6 Total ankle
arthroplasties
2 Total elbow
arthroplasties
From our analyses, in 2015 the average orthopaedic surgeon performed:
with 45% using uncemented,11% fully cemented and 44% hybrid prostheses; has a 86.2% survival at 16 years and a revision rate of 0.73 per 100 component years; 84% at six months, 89% at 5 years, 87% at 10yrs and 86% at 15 years had an excellent or good Oxford score.
with almost all cemented but only 12 with patellae resurfaced; has a 93.20% survival at 16 years and a revision rate of 0.49 per 100 component years; 74% at six months, 83% at 5 years, 82% at 10 years and 79% at 15 years had an excellent or good Oxford score.
with 57% uncemented; has an 83.29% survival at 14 years and a revision rate of 1.25 per 100 component years; 83% at six months, 88% at 5 years and 82% at ten years had an excellent or good Oxford score.
with a 2:1 split between reverse and conventional shoulder arthroplasty; 91.20% survival at 12 years and a revision rate of 1.04 per 100 component years; 69% at six months, 78% at 5 years and 73% at 10 years had excellent or good Oxford scores.
has an 81.43% survival at 10 years and a revision rate of 2.03 per 100 component years. Due to a change from Oxford derived to the Manchester-Oxford foot and ankle questionnaire in 2015 there are no PROM analyses.
has a 91.80% survival at nine years and a revision rate of 1.03 per 100 component years. Due to a change from Oxford derived to the validated Oxford elbow questionnaire in 2015 there are no PROM analyses.
The New Zealand Joint RegistryP.12 History
DEVELOPMENT AND IMPLEMENTATION OF THE NEW ZEALAND JOINT REGISTRY
The year 1997 marked 30 years since the first total hip replacement had been performed in New Zealand and as a way of marking this milestone it was unanimously agreed by the membership of the New Zealand Orthopaedic Association (NZOA) to adopt a proposal by the then President, Alastair Rothwell, to set up a National Joint Registry.
New Zealand surgeons had always been heavily dependent upon northern hemisphere teaching, training and outcome studies for developing their joint arthroplasty practice and it was felt that it was more than timely to determine the characteristics of joint arthroplasty practice in New Zealand and compare the outcomes with northern hemisphere counterparts. It was further considered that New Zealand would be ideally suited for a National Registry with its strong and co-operative NZOA membership, close relationship with the implant supply industry and its relatively small population. Advantages of a Registry were seen to be: survivorship of different types of implants and techniques; revision rates and reasons for these; infection and dislocation rates; patient satisfaction outcomes; audit for individual surgeons, hospitals, and regions; opportunities for in-depth studies of certain cohorts and as a database for fundraising for research.
Administrative NetworkIt was decided that the Registry should be based in the Department of Orthopaedic Surgery, Christchurch Hospital, and initially run by three part-time staff: a Registry Supervisor (Alastair Rothwell), the Registry Coordinator (Toni Hobbs) and the Registry Secretary (Pat Manning). As all three already worked in the Orthopaedic Department, it was a cost-effective and efficient arrangement to get the Registry underway.
New Zealand was divided into 19 geographic regions and an orthopaedic surgeon in each region was designated as the Regional Coordinator whose task was to set up and maintain the data collection network within the hospitals for that region.
This network included a Theatre Nurse Coordinator in every hospital in New Zealand who voluntarily took responsibility for supervising the completion, collection and dispatch of the data forms to the Registry.
Data Collection FormsThe clear message from the NZOA membership was to keep the forms for data collection simple and user friendly. The Norwegian Joint Register’s form was used as a starting point but a number of changes were made following early trials. The forms are largely if not completely filled out by the operating theatre circulating nurse ready to be checked and signed by the surgeon at the end of the operation.
Database The Microsoft Access 97 database programme was chosen because it is easy to use, has powerful query functions, can cope with one patient having several procedures on one or more joints over a lifetime and has “add on” provisions.
The database is expected to meet the projected requirements of the Registry for at least 20 years. It can accommodate software upgrades as required.
Patient Generated Outcomes The New Zealand Registry was one of the first to collect data from patient generated outcomes. The validated Oxford Hip and Knee outcomes questionnaires were chosen and questions were added to these, relating to dislocation, infection and any other complication that did not require further joint surgery. It was agreed that these questionnaires should be sent to all registered patients six months following surgery and then at five yearly intervals. The initial response rate was between 70 and 75% and this has remained steady over the five year period.
However, because of the large number of registered primary hip and knee arthroplasties and, on the advice of our statistician, questionnaires have been sent out on a random selection basis since July 2002 to achieve an annual response of 20% for each group. All patients in the other arthroplasty groups, including revision arthroplasty, are sent the questionnaires.
FundingSeveral sources of funding were investigated including contributions from the Ministry of Health, various funding agencies, medical insurance societies and an implant levy payable by surgeons and public hospitals to supplement a grant from the NZOA. In the early years the Registry had a “hand to mouth” existence relying on grants from the NZOA and Wishbone Trust until it received significant annual grants from the Accident Compensation Corporation. From 2002, funding became more reliable with the surgeons paying a $10 levy, increased to $15 in 2008 and to $20 in 2012 for each joint registered from a private hospital, and the Ministry of Health agreeing to pay $72,000 a year as part of the Government Joint Initiative. Since 2005 the Southern Cross Hospitals have contributed $10,000 annually.
Ethical ApprovalApplication was made to the Canterbury Ethical Committee early in 1998; first for approval for hospital data collection without the need for patient consent and second for the patient generated outcomes using the Oxford 12 questionnaire plus the additional questions. The first part of the application was initially readily approved but the second part required several amendments to patient information and consent forms before approval was obtained.
P.13The New Zealand Joint Registry History
A reapplication had to be made when the Ethics Committee of a private hospital chain refused to allow their nurses to participate in the project unless there was prior written patient consent. This view was supported by the Privacy Commissioner on the grounds that the Registry data includes patient identification details. The approval process was eventually successful but did delay the New Zealand-wide launch.
Surgeon and Hospital ReportsIt was agreed that, every six months, reports were to be generated from the Registry database for primary and revision hip and knee replacements and to consist of: the number of procedures performed by the individual surgeon or at the hospital; the total number of procedures performed in the region in which the surgeon works; and the national total and cumulative totals for each of these categories. Six month and, more recently, five year Oxford 12 scores are also included. Since 2008 each surgeon also receives their individual revision rate for their registered primary arthroplasties, and the reports have become annual rather than six monthly.
Introduction of the RegistryThe National Joint Registry was introduced as a planned staged procedure.
Stage I: November 1997 to March 1998 The base administrative structure was established. The data forms and the database were developed and a trial was performed at Burwood Hospital.
Stage II: April 1998 to June 1998Further trialling was performed throughout the Christchurch Hospitals and the data forms and information packages were further refined.
Stage III: July 1998 to March 1999The data collection was expanded into five selected New Zealand regions for trial and assessment.
In addition communication networks and the distribution of information packages into the remaining regions of New Zealand were carried out.
Stage IV: April 1st 1999 The National Joint Registry became fully operational throughout New Zealand.
The New Zealand Joint RegistryP.14 History
INCLUSION OF OTHER JOINT REPLACEMENT ARTHROPLASTIES
At the request of the NZOA membership, the database for the Registry was expanded to include total hip replacements for fractured neck of femur, unicompartmental replacements for knees, and total joint replacements for ankles, elbows and shoulders (including hemiarthroplasty for the latter). Commencement of this data collection was in January 2000 and this information is included in the annual surgeon and hospital reports.
The validated Oxford questionnaire was available for the shoulder and derived, but not validated, questionnaires developed for the elbow and ankle joints. All persons receiving total arthroplasty of the above joints, as well as unicompartmental knee arthroplasties, are sent questionnaires with a reply rate of between 70 and 75%. As for hips and knees, the questionnaires are sent out six months post-surgery and then at five yearly intervals.
Monitoring of Data CollectionThe aim of the Registry is to achieve a minimum of 90% compliance for all hospitals undertaking joint replacement surgery in New Zealand.
It is quite easy to check the compliance for public hospitals as they are required to make regular returns with details of all joint replacement surgery to the NZ Health Information Service. For a small fee, the registered joints from the Registry can be compared against the hospital returns for the same period and the compliance calculated. Any obvious discrepancies are checked out with the hospitals concerned and the situation remedied. It is more difficult with private hospital surgery as they are not required to file electronic returns. However, by enlisting the aid of prosthesis supply companies, it is possible to check the use of prostheses region by region and any significant discrepancy is further investigated. In addition any change in the pattern of returns from both public and private hospitals is investigated.
The most recent compliance audit in March 2016 again demonstrated a New Zealand-wide public hospital compliance of > 95% when compared to NZHIS data.
Registered patient deaths are also obtained from the NZHIS.
NZJR Staff The current staff are Data Operators (1.6 FTEs) Registry co-ordinator (0.8 FTEs) Registry Supervisor (0.4 FTEs) and Statistician (0.4 FTEs).
P.15The New Zealand Joint Registry Procedures Registered
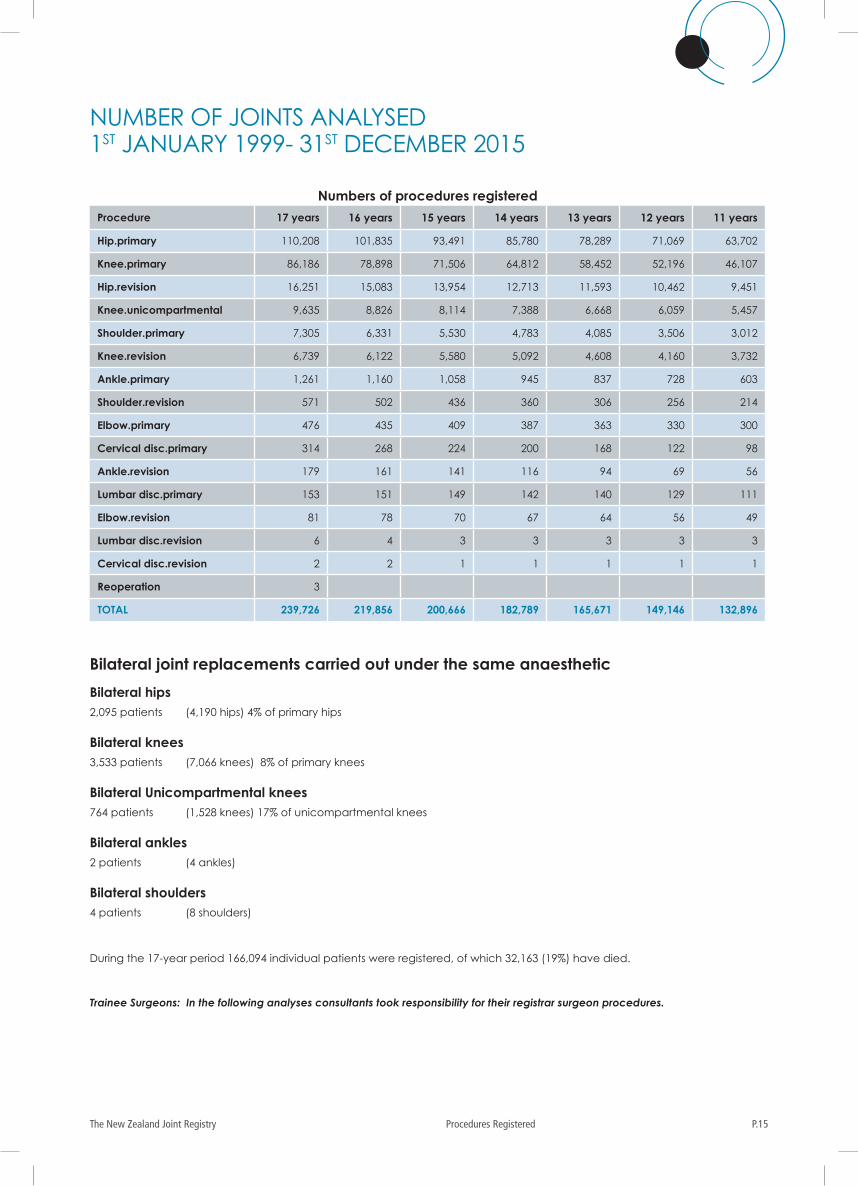
NUMBER OF JOINTS ANALYSED 1ST JANUARY 1999- 31ST DECEMBER 2015
Numbers of procedures registered
Procedure 17 years 16 years 15 years 14 years 13 years 12 years 11 years
Hip.primary 110,208 101,835 93,491 85,780 78,289 71,069 63,702
Knee.primary 86,186 78,898 71,506 64,812 58,452 52,196 46,107
Hip.revision 16,251 15,083 13,954 12,713 11,593 10,462 9,451
Knee.unicompartmental 9,635 8,826 8,114 7,388 6,668 6,059 5,457
Shoulder.primary 7,305 6,331 5,530 4,783 4,085 3,506 3,012
Knee.revision 6,739 6,122 5,580 5,092 4,608 4,160 3,732
Ankle.primary 1,261 1,160 1,058 945 837 728 603
Shoulder.revision 571 502 436 360 306 256 214
Elbow.primary 476 435 409 387 363 330 300
Cervical disc.primary 314 268 224 200 168 122 98
Ankle.revision 179 161 141 116 94 69 56
Lumbar disc.primary 153 151 149 142 140 129 111
Elbow.revision 81 78 70 67 64 56 49
Lumbar disc.revision 6 4 3 3 3 3 3
Cervical disc.revision 2 2 1 1 1 1 1
Reoperation 3
TOTAL 239,726 219,856 200,666 182,789 165,671 149,146 132,896
Bilateral joint replacements carried out under the same anaesthetic
Bilateral hips2,095 patients (4,190 hips) 4% of primary hips
Bilateral knees3,533 patients (7,066 knees) 8% of primary knees
Bilateral Unicompartmental knees764 patients (1,528 knees) 17% of unicompartmental knees
Bilateral ankles2 patients (4 ankles)
Bilateral shoulders4 patients (8 shoulders)
During the 17-year period 166,094 individual patients were registered, of which 32,163 (19%) have died.
Trainee Surgeons: In the following analyses consultants took responsibility for their registrar surgeon procedures.
The New Zealand Joint RegistryP.16 Hip Arthroplasty
HIP ARTHROPLASTY
PRIMARY HIP ARTHROPLASTY The seventeen-year report analyses data for the period January 1999 – December 2015. There were 110,208 primary hip procedures registered including 1,595 resurfacing arthroplasties. This is an additional 8,373 compared to last year’s report and represents a 0.3% increase in hip registrations for 2015 compared to the 8.2% for 2014.
1999 4,114 2000 4,715 2001 4,932 2002 4,830 2003 5,058 2004 6,029 2005 6,322 2006 6,430 2007 6,962 2008 7,004 2009 7,306 2010 7,366 2011 7,220 2012 7,491 2013 7,711 2014 8,345 2015 8,373
Data AnalysisAge and sex distribution
The average age for all patients with primary hip arthroplasty was 66.96 years, with a range of 13.43 – 100.95 years.
All hip arthroplasty
Female Male
Number 58,137 52,071 Percentage 52.75 47.25 Mean age 68.42 65.34 Maximum age 100.95 99.62 Minimum age 13.43 15.86 Standard dev. 11.54 11.50
Conventional hip arthroplasty
Female Male
Number 57,879 50,734 Percentage 53.29 46.71 Mean age 68.50 65.70 Maximum age 100.95 99.62 Minimum age 13.43 15.86 Standard dev. 11.49 11.36
Resurfacing hip arthroplasty
Female Male
Number 258 1,337 Percentage 16.18 83.82 Mean age 50.07 51.90 Maximum age 65.88 75.69 Minimum age 25.72 17.74 Standard dev. 7.15 8.56
Annual numbers for Resurfacing hips
2004 21 2005 38 2006 169 2007 188 2008 191 2009 203 2010 185 2011 142 2012 102 2013 90 2014 89 2015 77
Body Mass Index
BMI registrations for primary hip replacements. The average was 28.86 with a range of 14 – 62 and a standard deviation of 5.56.
Previous operation
None 105,643 Internal fixation 2,090 Osteotomy 583 Arthrodesis 82
Diagnosis
Osteoarthritis 96,291 Acute fracture NOF 4,036 Avascular necrosis 3,363 Developmental dysplasia 2,431 Rheumatoid arthritis 1,459 Old fracture NOF 1,349 Other inflammatory 828 Tumour 516 Post-acute dislocation 319
Approach
Posterior 70,988 Lateral 28,589 Anterior 4,045 Minimally invasive 1,748 Trochanteric osteotomy 198 Image guided surgery 480
Image guided surgery was added to the updated forms at the beginning of 2005, but there continues to be little interest in the technique. The minimally invasive approach has also waned after a surge in 2008.
P.17The New Zealand Joint Registry Hip Arthroplasty
0%
10%
20%
30%
40%
50%
60%
70%
80%
90%
100%
1999
2000
2001
2002
2003
2004
2005
2006
2007
2008
2009
2010
2011
2012
2013
2014
2015
YEAR
% o
f To
tal o
pe
ratio
ns w
ithin
ye
ar
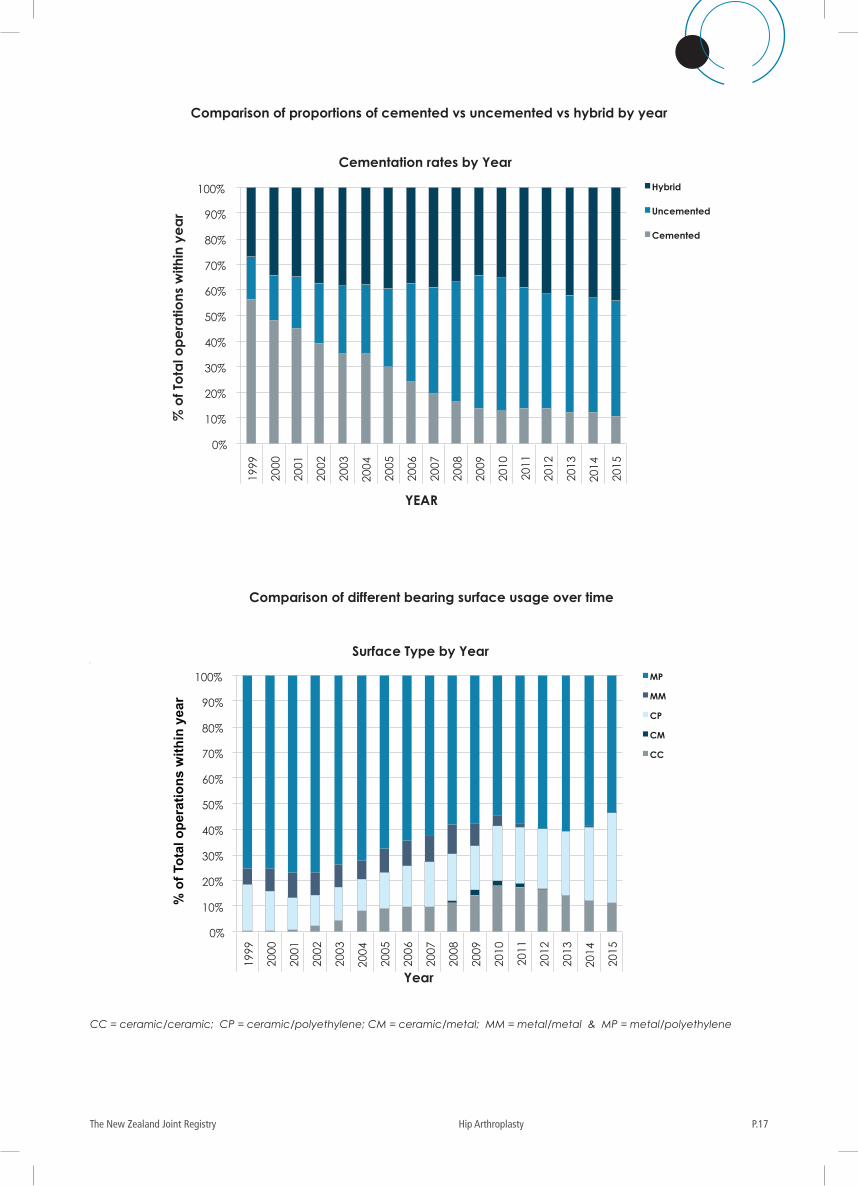
Cementation rates by Year
Hybrid
Uncemented
Cemented
0%
10%
20%
30%
40%
50%
60%
70%
80%
90%
100%
1999
2000
2001
2002
2003
2004
2005
2006
2007
2008
2009
2010
2011
2012
2013
2014
2015
MP
MM
CP
CM
CC
Year
% o
f To
tal o
per
atio
ns
wit
hin
yea
r
Surface Type by Year
Comparison of proportions of cemented vs uncemented vs hybrid by year
Comparison of different bearing surface usage over time
CC = ceramic/ceramic; CP = ceramic/polyethylene; CM = ceramic/metal; MM = metal/metal & MP = metal/polyethylene
The New Zealand Joint RegistryP.18 Hip Arthroplasty
Comparison of head size usage over time
Comparison usage of standard vs cross linked polyethylene over time
PS = standard & PX = cross linked polyethylene
0%
10%
20%
30%
40%
50%
60%
70%
80%
90%
100%
1999
2000
2001
2002
2003
2004
2005
2006
2007
2008
2009
2010
2011
2012
2013
2014
2015
Year
% o
f Tot
al o
pera
tions
with
in y
ear
Head Size by Year
>36
36
32
<=28
% o
f To
tal o
pe
ratio
ns w
ithin
ye
ar
Polyethylene by Year
PX
PS
0%
10%
20%
30%
40%
50%
60%
70%
80%
90%
100%
1999
2000
2001
2002
2003
2004
2005
2006
2007
2008
2009
2010
2011
2012
2013
2014
2015
CC = ceramic/ceramic; CP = ceramic/polyethylene; CM = ceramic/metal; MM = metal/metal & MP = metal/polyethylene
P.19The New Zealand Joint Registry Hip Arthroplasty
Bone graft
Femoral autograft 226 Femoral allograft 44 Femoral synthetic 7 Acetabular autograft 882 Acetabular allograft 113 Acetabular synthetic 5
Cement
Femur cemented 67,478 (61%) Antibiotic in cement 44,128 (65%) Acetabulum cemented 25,898 (24%) Antibiotic in cement 16,053 (62%)
Systemic antibiotic prophylaxis
Patient number receiving at least one systemic antibiotic: 105,656 (96%)
A cephalosporin was used in 87% of patients.
Operating theatre
Conventional 66,355 Laminar flow 42,085 Space suits 32,207
In 2015, 41% of arthroplasties were performed in laminar flow theatres, down from 42% in 2014, and 31% with space suits, which is 2% lower than for 2014.
ASA ClassThis was introduced with the updated forms at the beginning of 2005.
Definitions
ASA class 1: A healthy patient
ASA class 2: A patient with mild systemic disease
ASA class 3: A patient with severe systemic disease that limits activity but is not incapacitating
ASA class 4: A patient with an incapacitating systemic disease that is a constant threat to life
ASA Number Percentage
1 12,950 17 2 45,426 59 3 17,484 23 4 642 1
For the eleven-year period 2005 – 2015, there were 76,502 (95%) primary hip procedures with the ASA class recorded.
Operative time (skin to skin in minutes)Mean 79 minutes
Surgeon grade
The updated forms introduced in 2005 have separated advanced trainee into supervised and unsupervised. The following figures are for the eleven-year period 2005 – 2015.
Consultant 69,787 Advanced trainee supervised 6,655 Advanced trainee unsupervised 2,232 Basic trainee 1,679
Prosthesis usage
Conventional primary hips
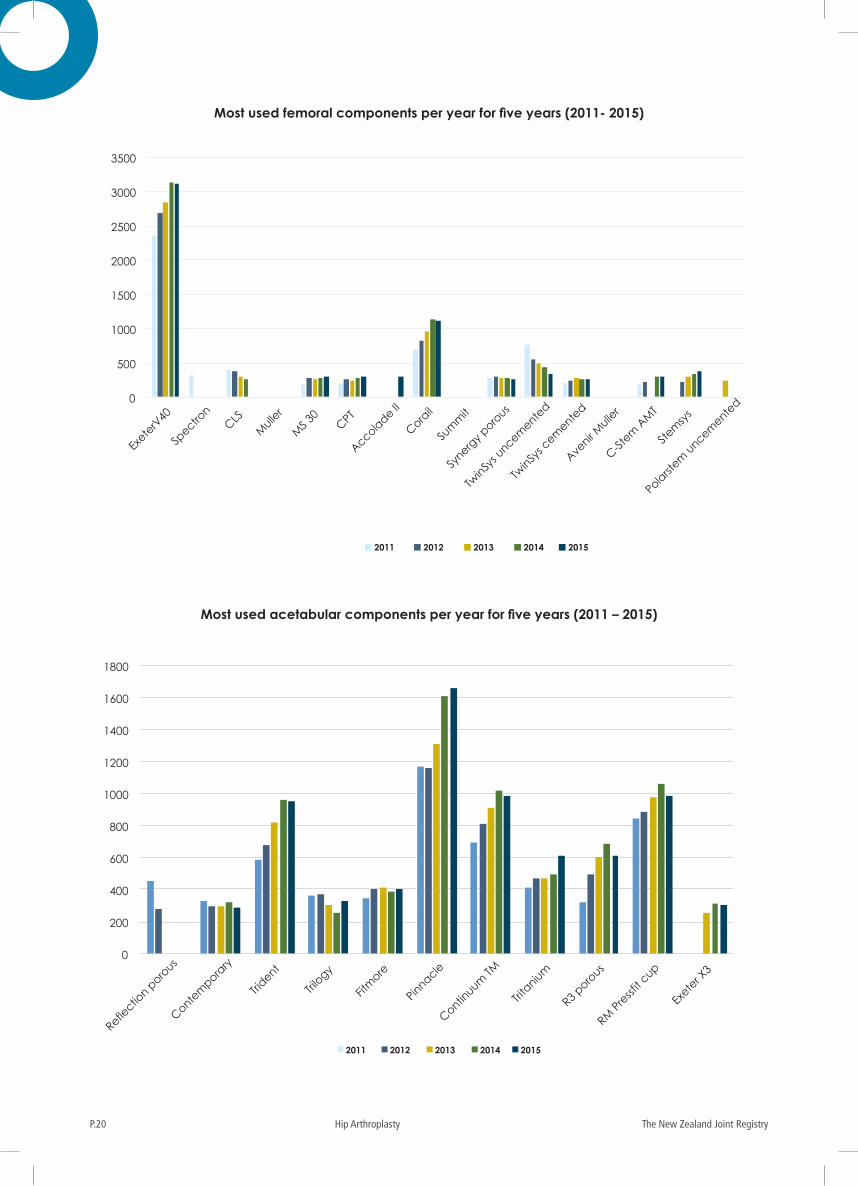
Top 10 femoral components used in 2015
Exeter V40 3,121 Corail 1,111 Stemsys 379 Twinsys uncemented 341 MS 30 307 Accolade II 306 C-stem AMT 300 CPT 295 Twinsys cemented 262 Synergy porous 257
The only change from 2014 is that the Accolade II has made its first appearance at the expense of the CLS.
Top 10 acetabular components used in 2015
Pinnacle 1,660 Continuum TM 985 RM Pressfit 984 Trident 956 R3 porous 612 Tritanium 611 Fitmore 407 Trilogy 331 Exeter X3 305 Contemporary 288
No change from 2014.
Top Ten Combinations used in 2015
Femur Acetabulum All Years 2015 Corail Pinnacle 6,468 936 Exeter V40 Trident 7,472 759 Exeter V40 Tritanium 1,798 424 Exeter V40 Continuum TM 1,660 345 TwinSys uncemented RM Pressfit cup 4,064 326 Exeter V40 Exeter X3 1,297 304 Exeter V40 Contemporary 5,944 277 Polarstem uncemented R3 porous 740 237 C-Stem AMT Pinnacle 1,124 222 Synergy Porous R3 porous 1,281 221
No change from 2014.
The New Zealand Joint RegistryP.20 Hip Arthroplasty
0
500
1000
1500
2000
2500
3000
3500
Exete
rV40
Spectro
n
CLS
Mulle
r
MS 3
0 CPT
Accolade II
Corail
Sum
mit
Synerg
y poro
us
TwinSy
s uncem
ented
TwinSy
s cem
ented
Avenir M
uller
C-Stem
AM
T
Stem
sys
Polarst
em u
ncemente
d
20152011 2012 2013 2014
0
200
400
600
800
1000
1200
1400
1600
1800
Reflectio
n poro
us
Contem
porary
Trident
Trilo
gy
Fitm
ore
Pinnacle
Continuum
TM
Trita
nium
R3 poro
us
RM P
ressf
it cup
Exete
r X3
20152011 2012 2013 2014
Most used femoral components per year for five years (2011- 2015)
Most used acetabular components per year for five years (2011 – 2015)
P.21The New Zealand Joint Registry Hip Arthroplasty
Resurfacing hips components used in 2015
BHR 77
Surgeon and Hospital WorkloadSurgeons
In 2015, 206 surgeons performed 8,373 total hip replacements, an average of 41 procedures per surgeon.
26 surgeons performed less than 10 procedures and 60 performed more than 50.
Hospitals
In 2015, primary hip replacement was performed in 51 hospitals, 27 public and 24 private.
The average number of total hip replacements per hospital was 164.
0
20
40
60
80
100
120
140
160
2011 2012 2013 2014 2015
BHR BMHR
Resurfacing Components per year for five years (2011 – 2015)
The New Zealand Joint RegistryP.22 Hip Arthroplasty
REVISION HIP ARTHROPLASTYRevision is defined by the Registry as a new operation in a previously replaced hip joint during which one of the components is exchanged, removed, manipulated or added. It includes excision arthroplasty and amputation, but not soft tissue procedures. A two-stage procedure is registered as one revision.
Data AnalysisFor the seventeen-year period January 1999 – December 2015, there were 16,251 revision hip procedures registered. This is an additional 1,168 compared to last year’s report.
The average age for a revision hip replacement was 70.03 years, with a range of 17.52–100.28 years.
Revision hips
Female Male Number 7,853 8,398 Percentage 47.09 52.91 Mean age 70.24 69.83 Maximum age 100.28 97.17 Minimum age 17.52 25.68 Standard dev. 12.12 10.82
The percentage of revision to primary hips performed is 13% and the ratio is 1:7.
Body Mass IndexFor the six year period 2010 - 2015, there were 2,075 BMI registrations for revision hip replacements. The average BMI was 28.83 with a range of 15- 55 with a standard deviation of 5.65.
Revision of Registered Primary Hip Arthroplasties This section analyses data for revisions of registered primary hip arthroplasties for the seventeen year period.
There were 5,092 revisions of the 108,613 primary conventional hip replacements (4.7%) and 119 revisions of the 1,595 resurfacing hip replacements (7.5%), a total of 5,211 revisions.
Conventional hip arthroplasty analyses
Time to revision for conventional hips
Mean 1,869 days Maximum 6,053 days Minimum 0 days Standard deviation 1,597 days
Reason for revision
Dislocation 1,177 Loosening acetabular component 1,140 Loosening femoral component 875 Pain 731 Deep infection 603 Fracture femur 526 ALVAL* 232 High blood level of metal ions 44
There was often more than one reason listed on the data form and all were entered.
* ALVAL(aseptic lymphocytic vascular-associated lesions) also includes listed revision reasons of metallosis, pseudotumour, hypersensitivity and synovitis. They all relate to metal on metal bearing revisions.
P.23The New Zealand Joint Registry Hip Arthroplasty
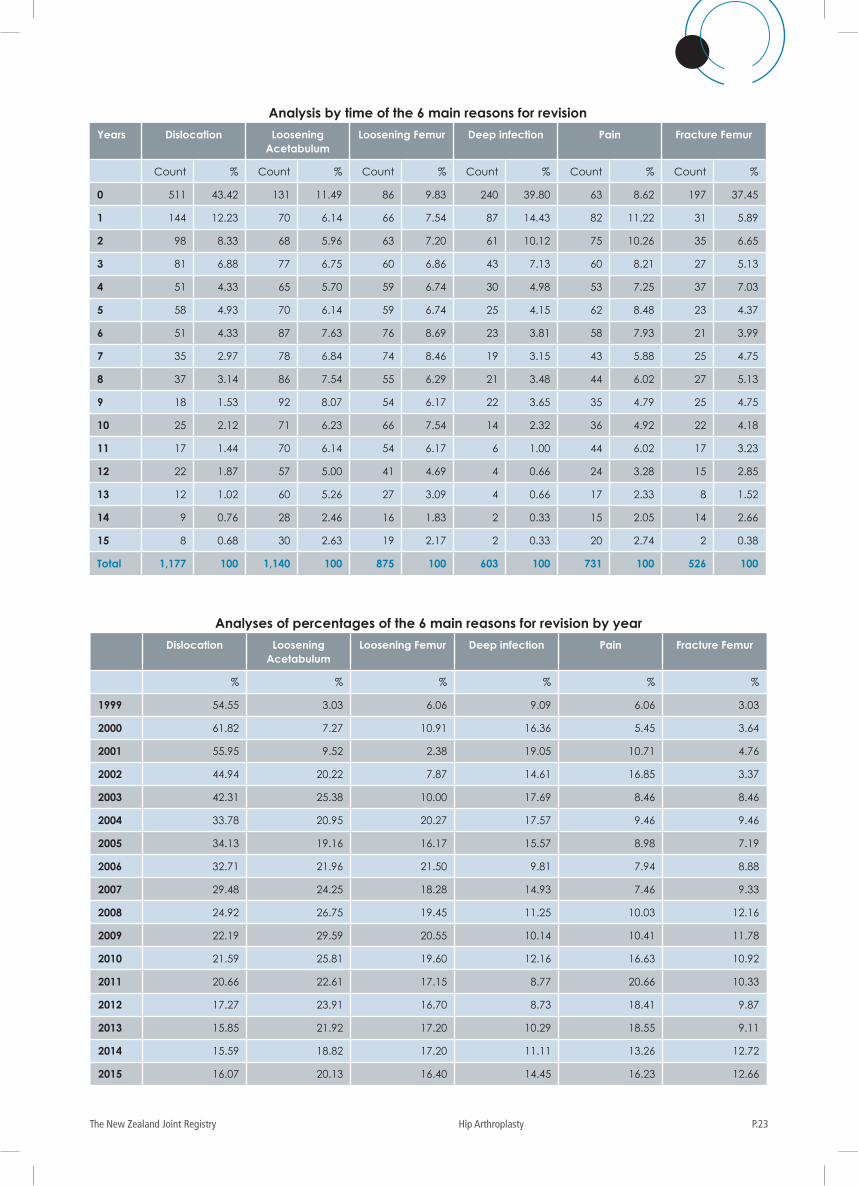
Analysis by time of the 6 main reasons for revision
Years Dislocation Loosening Acetabulum
Loosening Femur Deep infection Pain Fracture Femur
Count % Count % Count % Count % Count % Count %
0 511 43.42 131 11.49 86 9.83 240 39.80 63 8.62 197 37.45
1 144 12.23 70 6.14 66 7.54 87 14.43 82 11.22 31 5.89
2 98 8.33 68 5.96 63 7.20 61 10.12 75 10.26 35 6.65
3 81 6.88 77 6.75 60 6.86 43 7.13 60 8.21 27 5.13
4 51 4.33 65 5.70 59 6.74 30 4.98 53 7.25 37 7.03
5 58 4.93 70 6.14 59 6.74 25 4.15 62 8.48 23 4.37
6 51 4.33 87 7.63 76 8.69 23 3.81 58 7.93 21 3.99
7 35 2.97 78 6.84 74 8.46 19 3.15 43 5.88 25 4.75
8 37 3.14 86 7.54 55 6.29 21 3.48 44 6.02 27 5.13
9 18 1.53 92 8.07 54 6.17 22 3.65 35 4.79 25 4.75
10 25 2.12 71 6.23 66 7.54 14 2.32 36 4.92 22 4.18
11 17 1.44 70 6.14 54 6.17 6 1.00 44 6.02 17 3.23
12 22 1.87 57 5.00 41 4.69 4 0.66 24 3.28 15 2.85
13 12 1.02 60 5.26 27 3.09 4 0.66 17 2.33 8 1.52
14 9 0.76 28 2.46 16 1.83 2 0.33 15 2.05 14 2.66
15 8 0.68 30 2.63 19 2.17 2 0.33 20 2.74 2 0.38
Total 1,177 100 1,140 100 875 100 603 100 731 100 526 100
Analyses of percentages of the 6 main reasons for revision by year
Dislocation Loosening Acetabulum
Loosening Femur Deep infection Pain Fracture Femur
% % % % % %
1999 54.55 3.03 6.06 9.09 6.06 3.03
2000 61.82 7.27 10.91 16.36 5.45 3.64
2001 55.95 9.52 2.38 19.05 10.71 4.76
2002 44.94 20.22 7.87 14.61 16.85 3.37
2003 42.31 25.38 10.00 17.69 8.46 8.46
2004 33.78 20.95 20.27 17.57 9.46 9.46
2005 34.13 19.16 16.17 15.57 8.98 7.19
2006 32.71 21.96 21.50 9.81 7.94 8.88
2007 29.48 24.25 18.28 14.93 7.46 9.33
2008 24.92 26.75 19.45 11.25 10.03 12.16
2009 22.19 29.59 20.55 10.14 10.41 11.78
2010 21.59 25.81 19.60 12.16 16.63 10.92
2011 20.66 22.61 17.15 8.77 20.66 10.33
2012 17.27 23.91 16.70 8.73 18.41 9.87
2013 15.85 21.92 17.20 10.29 18.55 9.11
2014 15.59 18.82 17.20 11.11 13.26 12.72
2015 16.07 20.13 16.40 14.45 16.23 12.66
The New Zealand Joint RegistryP.24 Hip Arthroplasty
Resurfaced Hip Analyses There were 1,595 resurfacing hips registered for the period 2000 – 2015, and 119 (7.5%) have been revised.
Time to revision for resurfaced hips
Mean 1,724 daysMaximum 3,668 daysMinimum 10 daysStandard deviation 988 days
Reason for revision
Pain 37Loosening acetabulum 15Deep infection 13Loosening femoral component 14Fracture femur 10Dislocation 2
Statistical note
In the tables below there are two statistical terms readers may not be familiar with:
i) Observed component years
This is the number of registered primary procedures multiplied by the number of years each component has been in place.
ii) Rate/100 component years
This is equivalent to the yearly revision rate expressed as a percentage and is derived by dividing the number of prostheses revised by the observed component years multiplied by 100. It therefore allows for the number of years of post-operative follow up in calculating the revision rate. These rates are usually very low, hence it is expressed per 100 component years rather than per component year. Statisticians consider that this is a more accurate way of deriving a revision rate for comparison when analysing data with widely varying follow up times. It is also important to note the confidence intervals. The closer they are to the estimated revision rate/100 component years, the more precise the estimate is.
Statistical Significance
Where it is stated that a difference among results is significant the p value is 0.05 or less. In most of these situations this is because there is no overlap of the confidence intervals (CI’s) but sometimes significance can apply in the presence of CI overlap.
0%
10%
20%
30%
40%
50%
60%
70%
80%
90%
100%
1999
2000
2001
2002
2003
2004
2005
2006
2007
2008
2009
2010
2011
2012
2013
2014
2015
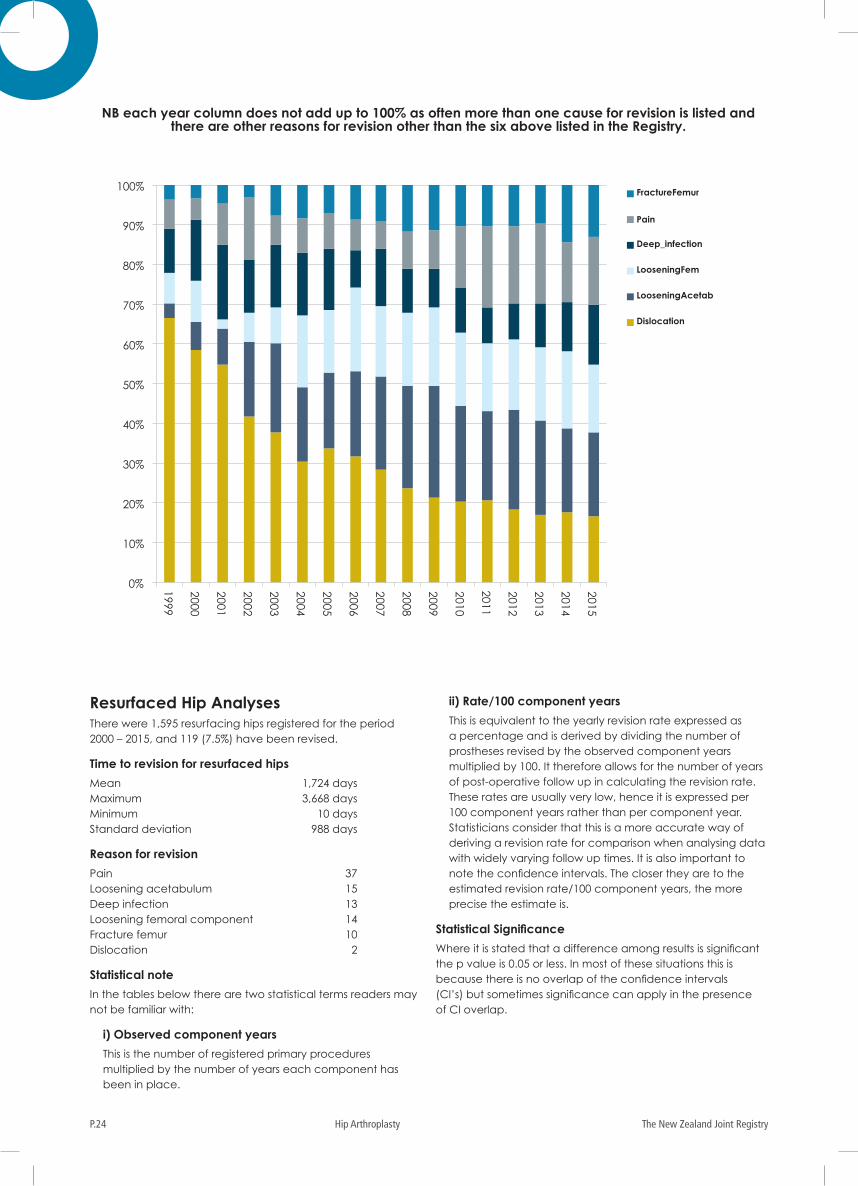
FractureFemur
Pain
Deep_infection
LooseningFem
LooseningAcetab
Dislocation
NB each year column does not add up to 100% as often more than one cause for revision is listed and there are other reasons for revision other than the six above listed in the Registry.
P.25The New Zealand Joint Registry Hip Arthroplasty
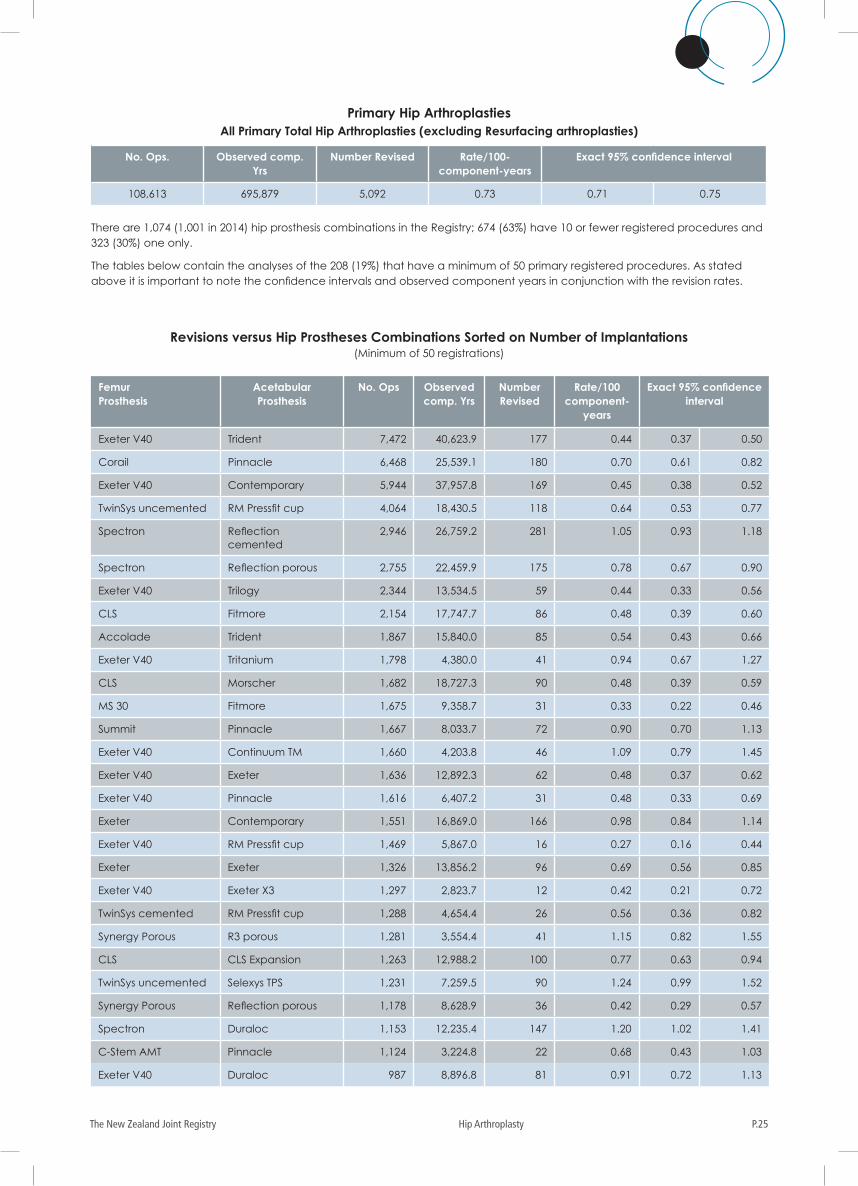
Primary Hip ArthroplastiesAll Primary Total Hip Arthroplasties (excluding Resurfacing arthroplasties)
No. Ops. Observed comp. Yrs
Number Revised Rate/100- component-years
Exact 95% confidence interval
108,613 695,879 5,092 0.73 0.71 0.75
There are 1,074 (1,001 in 2014) hip prosthesis combinations in the Registry; 674 (63%) have 10 or fewer registered procedures and 323 (30%) one only.
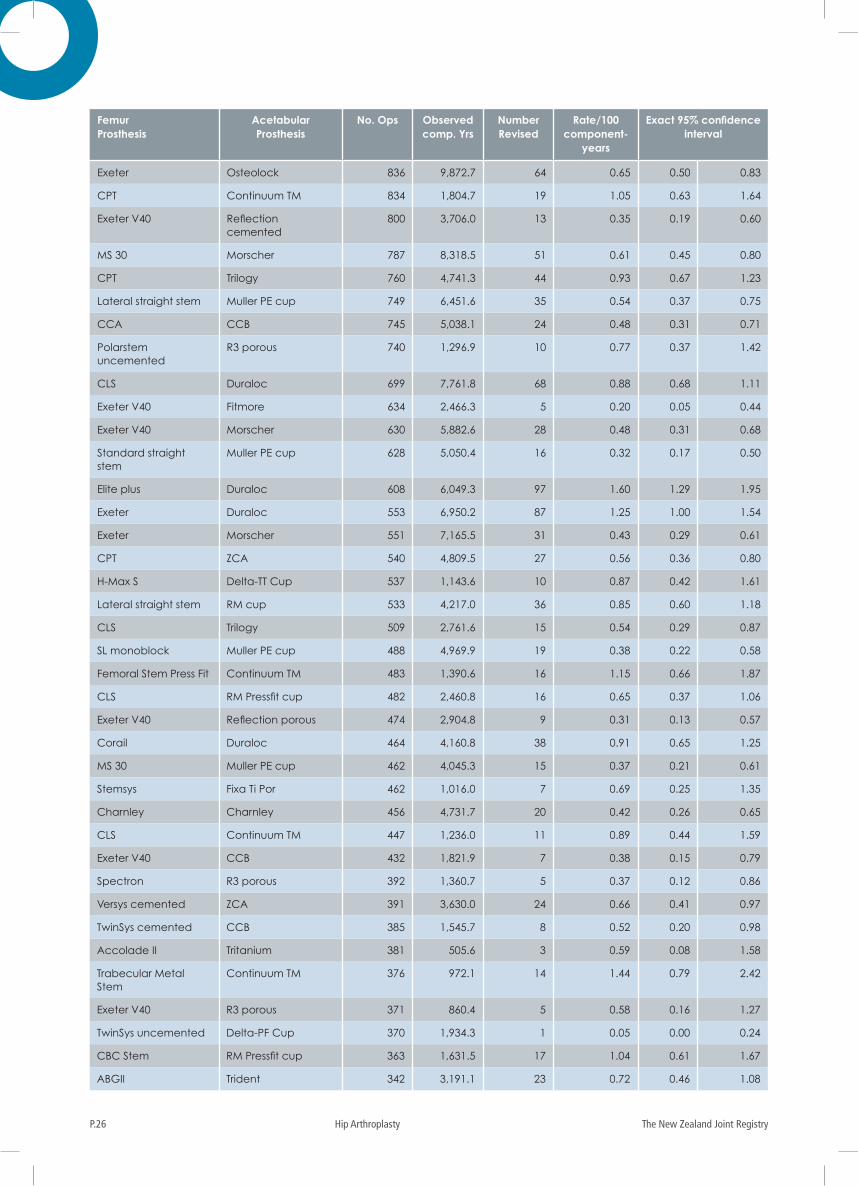
The tables below contain the analyses of the 208 (19%) that have a minimum of 50 primary registered procedures. As stated above it is important to note the confidence intervals and observed component years in conjunction with the revision rates.
Femur Prosthesis
Acetabular Prosthesis
No. Ops Observed comp. Yrs
Number Revised
Rate/100 component-
years
Exact 95% confidence interval
Exeter V40 Trident 7,472 40,623.9 177 0.44 0.37 0.50
Corail Pinnacle 6,468 25,539.1 180 0.70 0.61 0.82
Exeter V40 Contemporary 5,944 37,957.8 169 0.45 0.38 0.52
TwinSys uncemented RM Pressfit cup 4,064 18,430.5 118 0.64 0.53 0.77
Spectron Reflection cemented
2,946 26,759.2 281 1.05 0.93 1.18
Spectron Reflection porous 2,755 22,459.9 175 0.78 0.67 0.90
Exeter V40 Trilogy 2,344 13,534.5 59 0.44 0.33 0.56
CLS Fitmore 2,154 17,747.7 86 0.48 0.39 0.60
Accolade Trident 1,867 15,840.0 85 0.54 0.43 0.66
Exeter V40 Tritanium 1,798 4,380.0 41 0.94 0.67 1.27
CLS Morscher 1,682 18,727.3 90 0.48 0.39 0.59
MS 30 Fitmore 1,675 9,358.7 31 0.33 0.22 0.46
Summit Pinnacle 1,667 8,033.7 72 0.90 0.70 1.13
Exeter V40 Continuum TM 1,660 4,203.8 46 1.09 0.79 1.45
Exeter V40 Exeter 1,636 12,892.3 62 0.48 0.37 0.62
Exeter V40 Pinnacle 1,616 6,407.2 31 0.48 0.33 0.69
Exeter Contemporary 1,551 16,869.0 166 0.98 0.84 1.14
Exeter V40 RM Pressfit cup 1,469 5,867.0 16 0.27 0.16 0.44
Exeter Exeter 1,326 13,856.2 96 0.69 0.56 0.85
Exeter V40 Exeter X3 1,297 2,823.7 12 0.42 0.21 0.72
TwinSys cemented RM Pressfit cup 1,288 4,654.4 26 0.56 0.36 0.82
Synergy Porous R3 porous 1,281 3,554.4 41 1.15 0.82 1.55
CLS CLS Expansion 1,263 12,988.2 100 0.77 0.63 0.94
TwinSys uncemented Selexys TPS 1,231 7,259.5 90 1.24 0.99 1.52
Synergy Porous Reflection porous 1,178 8,628.9 36 0.42 0.29 0.57
Spectron Duraloc 1,153 12,235.4 147 1.20 1.02 1.41
C-Stem AMT Pinnacle 1,124 3,224.8 22 0.68 0.43 1.03
Exeter V40 Duraloc 987 8,896.8 81 0.91 0.72 1.13
Revisions versus Hip Prostheses Combinations Sorted on Number of Implantations(Minimum of 50 registrations)
The New Zealand Joint RegistryP.26 Hip Arthroplasty
Femur Prosthesis
Acetabular Prosthesis
No. Ops Observed comp. Yrs
Number Revised
Rate/100 component-
years
Exact 95% confidence interval
Exeter Osteolock 836 9,872.7 64 0.65 0.50 0.83
CPT Continuum TM 834 1,804.7 19 1.05 0.63 1.64
Exeter V40 Reflection cemented
800 3,706.0 13 0.35 0.19 0.60
MS 30 Morscher 787 8,318.5 51 0.61 0.45 0.80
CPT Trilogy 760 4,741.3 44 0.93 0.67 1.23
Lateral straight stem Muller PE cup 749 6,451.6 35 0.54 0.37 0.75
CCA CCB 745 5,038.1 24 0.48 0.31 0.71
Polarstem uncemented
R3 porous 740 1,296.9 10 0.77 0.37 1.42
CLS Duraloc 699 7,761.8 68 0.88 0.68 1.11
Exeter V40 Fitmore 634 2,466.3 5 0.20 0.05 0.44
Exeter V40 Morscher 630 5,882.6 28 0.48 0.31 0.68
Standard straight stem
Muller PE cup 628 5,050.4 16 0.32 0.17 0.50
Elite plus Duraloc 608 6,049.3 97 1.60 1.29 1.95
Exeter Duraloc 553 6,950.2 87 1.25 1.00 1.54
Exeter Morscher 551 7,165.5 31 0.43 0.29 0.61
CPT ZCA 540 4,809.5 27 0.56 0.36 0.80
H-Max S Delta-TT Cup 537 1,143.6 10 0.87 0.42 1.61
Lateral straight stem RM cup 533 4,217.0 36 0.85 0.60 1.18
CLS Trilogy 509 2,761.6 15 0.54 0.29 0.87
SL monoblock Muller PE cup 488 4,969.9 19 0.38 0.22 0.58
Femoral Stem Press Fit Continuum TM 483 1,390.6 16 1.15 0.66 1.87
CLS RM Pressfit cup 482 2,460.8 16 0.65 0.37 1.06
Exeter V40 Reflection porous 474 2,904.8 9 0.31 0.13 0.57
Corail Duraloc 464 4,160.8 38 0.91 0.65 1.25
MS 30 Muller PE cup 462 4,045.3 15 0.37 0.21 0.61
Stemsys Fixa Ti Por 462 1,016.0 7 0.69 0.25 1.35
Charnley Charnley 456 4,731.7 20 0.42 0.26 0.65
CLS Continuum TM 447 1,236.0 11 0.89 0.44 1.59
Exeter V40 CCB 432 1,821.9 7 0.38 0.15 0.79
Spectron R3 porous 392 1,360.7 5 0.37 0.12 0.86
Versys cemented ZCA 391 3,630.0 24 0.66 0.41 0.97
TwinSys cemented CCB 385 1,545.7 8 0.52 0.20 0.98
Accolade II Tritanium 381 505.6 3 0.59 0.08 1.58
Trabecular Metal Stem
Continuum TM 376 972.1 14 1.44 0.79 2.42
Exeter V40 R3 porous 371 860.4 5 0.58 0.16 1.27
TwinSys uncemented Delta-PF Cup 370 1,934.3 1 0.05 0.00 0.24
CBC Stem RM Pressfit cup 363 1,631.5 17 1.04 0.61 1.67
ABGII Trident 342 3,191.1 23 0.72 0.46 1.08
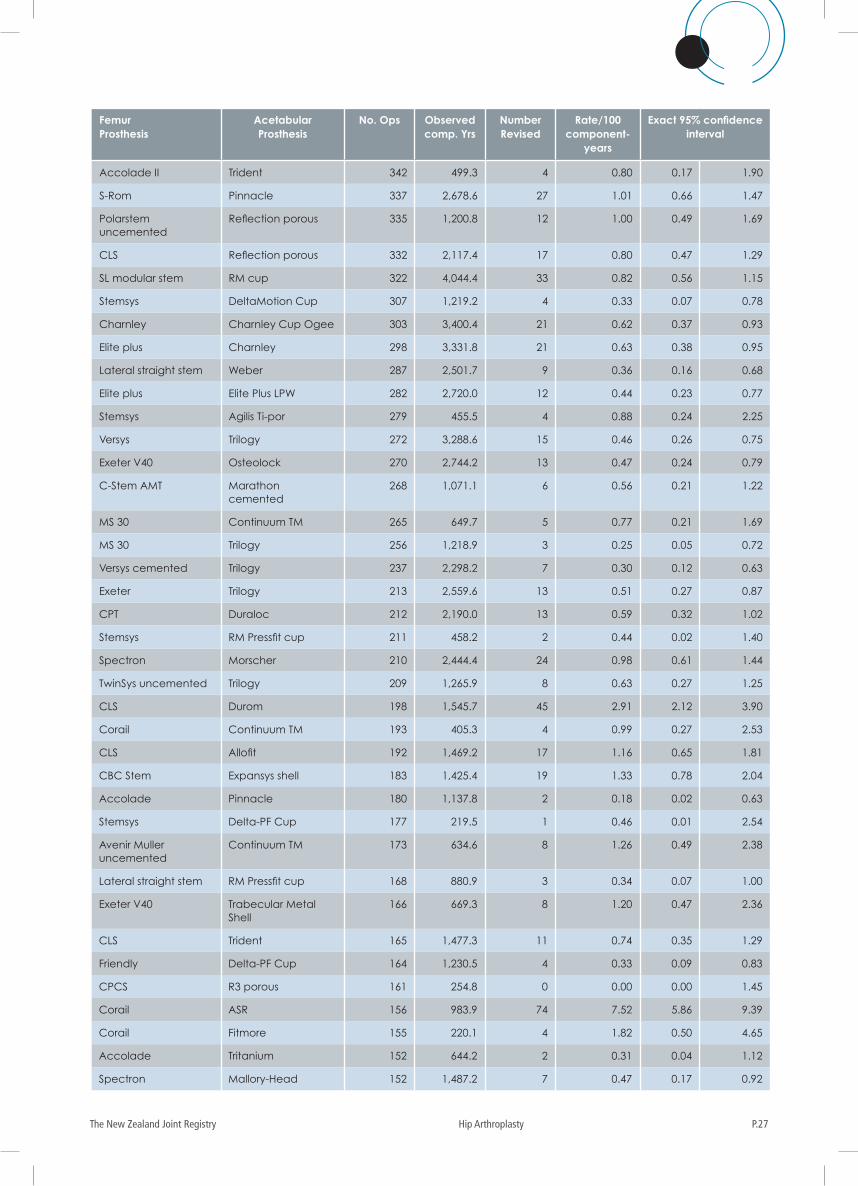
P.27The New Zealand Joint Registry Hip Arthroplasty
Femur Prosthesis
Acetabular Prosthesis
No. Ops Observed comp. Yrs
Number Revised
Rate/100 component-
years
Exact 95% confidence interval
Accolade II Trident 342 499.3 4 0.80 0.17 1.90
S-Rom Pinnacle 337 2,678.6 27 1.01 0.66 1.47
Polarstem uncemented
Reflection porous 335 1,200.8 12 1.00 0.49 1.69
CLS Reflection porous 332 2,117.4 17 0.80 0.47 1.29
SL modular stem RM cup 322 4,044.4 33 0.82 0.56 1.15
Stemsys DeltaMotion Cup 307 1,219.2 4 0.33 0.07 0.78
Charnley Charnley Cup Ogee 303 3,400.4 21 0.62 0.37 0.93
Elite plus Charnley 298 3,331.8 21 0.63 0.38 0.95
Lateral straight stem Weber 287 2,501.7 9 0.36 0.16 0.68
Elite plus Elite Plus LPW 282 2,720.0 12 0.44 0.23 0.77
Stemsys Agilis Ti-por 279 455.5 4 0.88 0.24 2.25
Versys Trilogy 272 3,288.6 15 0.46 0.26 0.75
Exeter V40 Osteolock 270 2,744.2 13 0.47 0.24 0.79
C-Stem AMT Marathon cemented
268 1,071.1 6 0.56 0.21 1.22
MS 30 Continuum TM 265 649.7 5 0.77 0.21 1.69
MS 30 Trilogy 256 1,218.9 3 0.25 0.05 0.72
Versys cemented Trilogy 237 2,298.2 7 0.30 0.12 0.63
Exeter Trilogy 213 2,559.6 13 0.51 0.27 0.87
CPT Duraloc 212 2,190.0 13 0.59 0.32 1.02
Stemsys RM Pressfit cup 211 458.2 2 0.44 0.02 1.40
Spectron Morscher 210 2,444.4 24 0.98 0.61 1.44
TwinSys uncemented Trilogy 209 1,265.9 8 0.63 0.27 1.25
CLS Durom 198 1,545.7 45 2.91 2.12 3.90
Corail Continuum TM 193 405.3 4 0.99 0.27 2.53
CLS Allofit 192 1,469.2 17 1.16 0.65 1.81
CBC Stem Expansys shell 183 1,425.4 19 1.33 0.78 2.04
Accolade Pinnacle 180 1,137.8 2 0.18 0.02 0.63
Stemsys Delta-PF Cup 177 219.5 1 0.46 0.01 2.54
Avenir Muller uncemented
Continuum TM 173 634.6 8 1.26 0.49 2.38
Lateral straight stem RM Pressfit cup 168 880.9 3 0.34 0.07 1.00
Exeter V40 Trabecular Metal Shell
166 669.3 8 1.20 0.47 2.36
CLS Trident 165 1,477.3 11 0.74 0.35 1.29
Friendly Delta-PF Cup 164 1,230.5 4 0.33 0.09 0.83
CPCS R3 porous 161 254.8 0 0.00 0.00 1.45
Corail ASR 156 983.9 74 7.52 5.86 9.39
Corail Fitmore 155 220.1 4 1.82 0.50 4.65
Accolade Tritanium 152 644.2 2 0.31 0.04 1.12
Spectron Mallory-Head 152 1,487.2 7 0.47 0.17 0.92
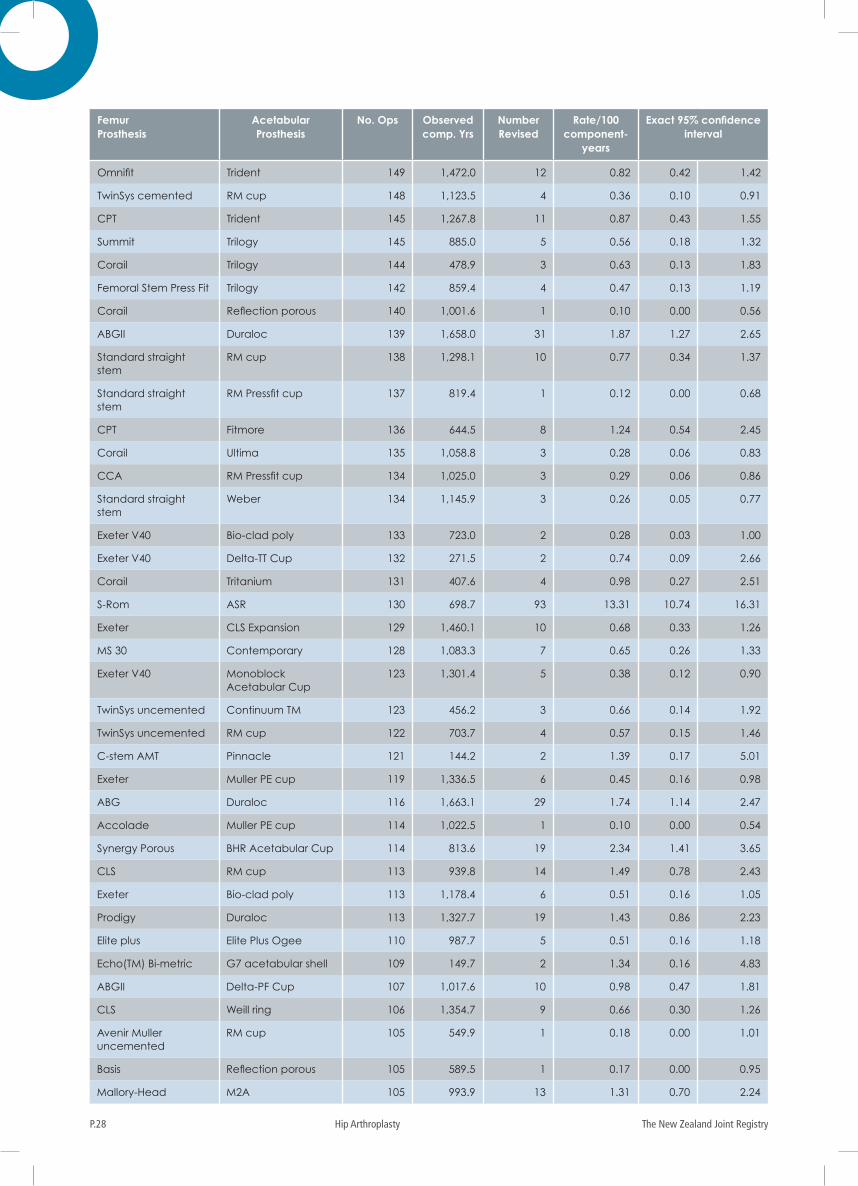
The New Zealand Joint RegistryP.28 Hip Arthroplasty
Femur Prosthesis
Acetabular Prosthesis
No. Ops Observed comp. Yrs
Number Revised
Rate/100 component-
years
Exact 95% confidence interval
Omnifit Trident 149 1,472.0 12 0.82 0.42 1.42
TwinSys cemented RM cup 148 1,123.5 4 0.36 0.10 0.91
CPT Trident 145 1,267.8 11 0.87 0.43 1.55
Summit Trilogy 145 885.0 5 0.56 0.18 1.32
Corail Trilogy 144 478.9 3 0.63 0.13 1.83
Femoral Stem Press Fit Trilogy 142 859.4 4 0.47 0.13 1.19
Corail Reflection porous 140 1,001.6 1 0.10 0.00 0.56
ABGII Duraloc 139 1,658.0 31 1.87 1.27 2.65
Standard straight stem
RM cup 138 1,298.1 10 0.77 0.34 1.37
Standard straight stem
RM Pressfit cup 137 819.4 1 0.12 0.00 0.68
CPT Fitmore 136 644.5 8 1.24 0.54 2.45
Corail Ultima 135 1,058.8 3 0.28 0.06 0.83
CCA RM Pressfit cup 134 1,025.0 3 0.29 0.06 0.86
Standard straight stem
Weber 134 1,145.9 3 0.26 0.05 0.77
Exeter V40 Bio-clad poly 133 723.0 2 0.28 0.03 1.00
Exeter V40 Delta-TT Cup 132 271.5 2 0.74 0.09 2.66
Corail Tritanium 131 407.6 4 0.98 0.27 2.51
S-Rom ASR 130 698.7 93 13.31 10.74 16.31
Exeter CLS Expansion 129 1,460.1 10 0.68 0.33 1.26
MS 30 Contemporary 128 1,083.3 7 0.65 0.26 1.33
Exeter V40 Monoblock Acetabular Cup
123 1,301.4 5 0.38 0.12 0.90
TwinSys uncemented Continuum TM 123 456.2 3 0.66 0.14 1.92
TwinSys uncemented RM cup 122 703.7 4 0.57 0.15 1.46
C-stem AMT Pinnacle 121 144.2 2 1.39 0.17 5.01
Exeter Muller PE cup 119 1,336.5 6 0.45 0.16 0.98
ABG Duraloc 116 1,663.1 29 1.74 1.14 2.47
Accolade Muller PE cup 114 1,022.5 1 0.10 0.00 0.54
Synergy Porous BHR Acetabular Cup 114 813.6 19 2.34 1.41 3.65
CLS RM cup 113 939.8 14 1.49 0.78 2.43
Exeter Bio-clad poly 113 1,178.4 6 0.51 0.16 1.05
Prodigy Duraloc 113 1,327.7 19 1.43 0.86 2.23
Elite plus Elite Plus Ogee 110 987.7 5 0.51 0.16 1.18
Echo(TM) Bi-metric G7 acetabular shell 109 149.7 2 1.34 0.16 4.83
ABGII Delta-PF Cup 107 1,017.6 10 0.98 0.47 1.81
CLS Weill ring 106 1,354.7 9 0.66 0.30 1.26
Avenir Muller uncemented
RM cup 105 549.9 1 0.18 0.00 1.01
Basis Reflection porous 105 589.5 1 0.17 0.00 0.95
Mallory-Head M2A 105 993.9 13 1.31 0.70 2.24
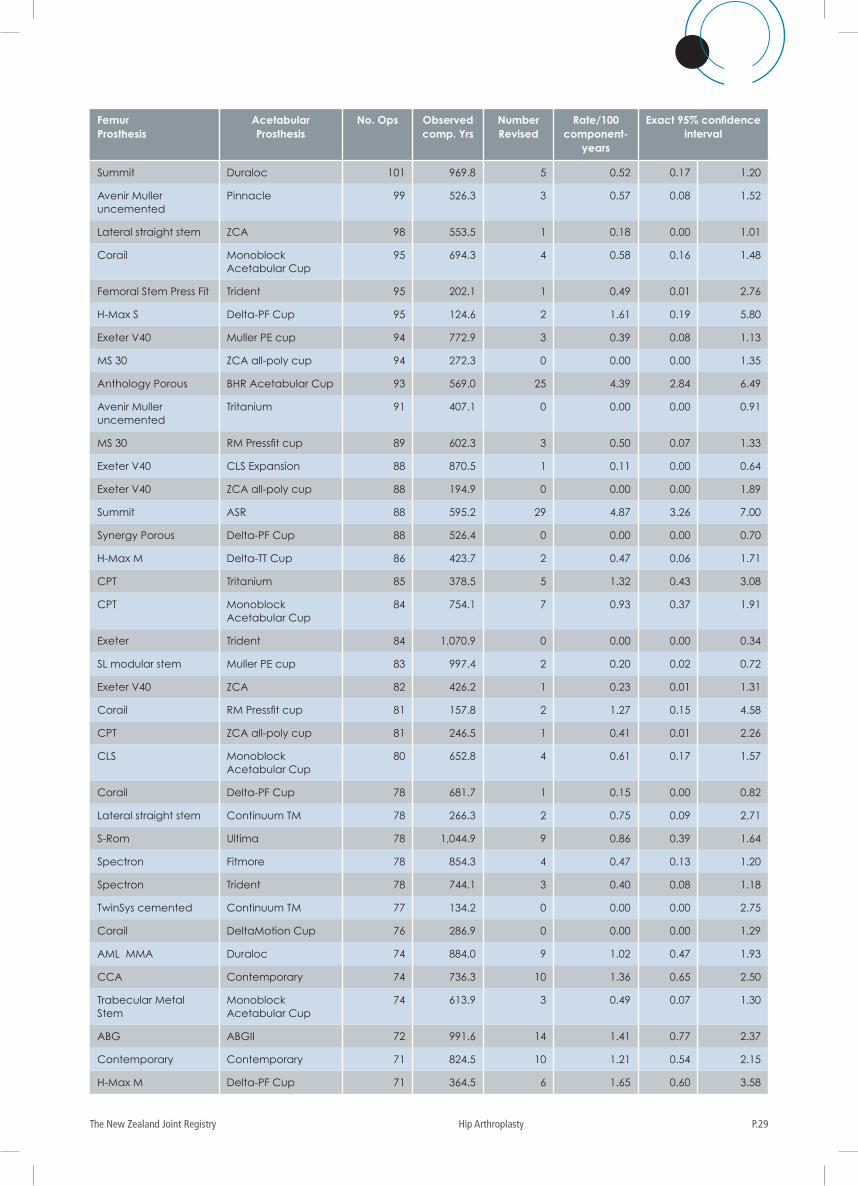
P.29The New Zealand Joint Registry Hip Arthroplasty
Femur Prosthesis
Acetabular Prosthesis
No. Ops Observed comp. Yrs
Number Revised
Rate/100 component-
years
Exact 95% confidence interval
Summit Duraloc 101 969.8 5 0.52 0.17 1.20
Avenir Muller uncemented
Pinnacle 99 526.3 3 0.57 0.08 1.52
Lateral straight stem ZCA 98 553.5 1 0.18 0.00 1.01
Corail Monoblock Acetabular Cup
95 694.3 4 0.58 0.16 1.48
Femoral Stem Press Fit Trident 95 202.1 1 0.49 0.01 2.76
H-Max S Delta-PF Cup 95 124.6 2 1.61 0.19 5.80
Exeter V40 Muller PE cup 94 772.9 3 0.39 0.08 1.13
MS 30 ZCA all-poly cup 94 272.3 0 0.00 0.00 1.35
Anthology Porous BHR Acetabular Cup 93 569.0 25 4.39 2.84 6.49
Avenir Muller uncemented
Tritanium 91 407.1 0 0.00 0.00 0.91
MS 30 RM Pressfit cup 89 602.3 3 0.50 0.07 1.33
Exeter V40 CLS Expansion 88 870.5 1 0.11 0.00 0.64
Exeter V40 ZCA all-poly cup 88 194.9 0 0.00 0.00 1.89
Summit ASR 88 595.2 29 4.87 3.26 7.00
Synergy Porous Delta-PF Cup 88 526.4 0 0.00 0.00 0.70
H-Max M Delta-TT Cup 86 423.7 2 0.47 0.06 1.71
CPT Tritanium 85 378.5 5 1.32 0.43 3.08
CPT Monoblock Acetabular Cup
84 754.1 7 0.93 0.37 1.91
Exeter Trident 84 1,070.9 0 0.00 0.00 0.34
SL modular stem Muller PE cup 83 997.4 2 0.20 0.02 0.72
Exeter V40 ZCA 82 426.2 1 0.23 0.01 1.31
Corail RM Pressfit cup 81 157.8 2 1.27 0.15 4.58
CPT ZCA all-poly cup 81 246.5 1 0.41 0.01 2.26
CLS Monoblock Acetabular Cup
80 652.8 4 0.61 0.17 1.57
Corail Delta-PF Cup 78 681.7 1 0.15 0.00 0.82
Lateral straight stem Continuum TM 78 266.3 2 0.75 0.09 2.71
S-Rom Ultima 78 1,044.9 9 0.86 0.39 1.64
Spectron Fitmore 78 854.3 4 0.47 0.13 1.20
Spectron Trident 78 744.1 3 0.40 0.08 1.18
TwinSys cemented Continuum TM 77 134.2 0 0.00 0.00 2.75
Corail DeltaMotion Cup 76 286.9 0 0.00 0.00 1.29
AML MMA Duraloc 74 884.0 9 1.02 0.47 1.93
CCA Contemporary 74 736.3 10 1.36 0.65 2.50
Trabecular Metal Stem
Monoblock Acetabular Cup
74 613.9 3 0.49 0.07 1.30
ABG ABGII 72 991.6 14 1.41 0.77 2.37
Contemporary Contemporary 71 824.5 10 1.21 0.54 2.15
H-Max M Delta-PF Cup 71 364.5 6 1.65 0.60 3.58
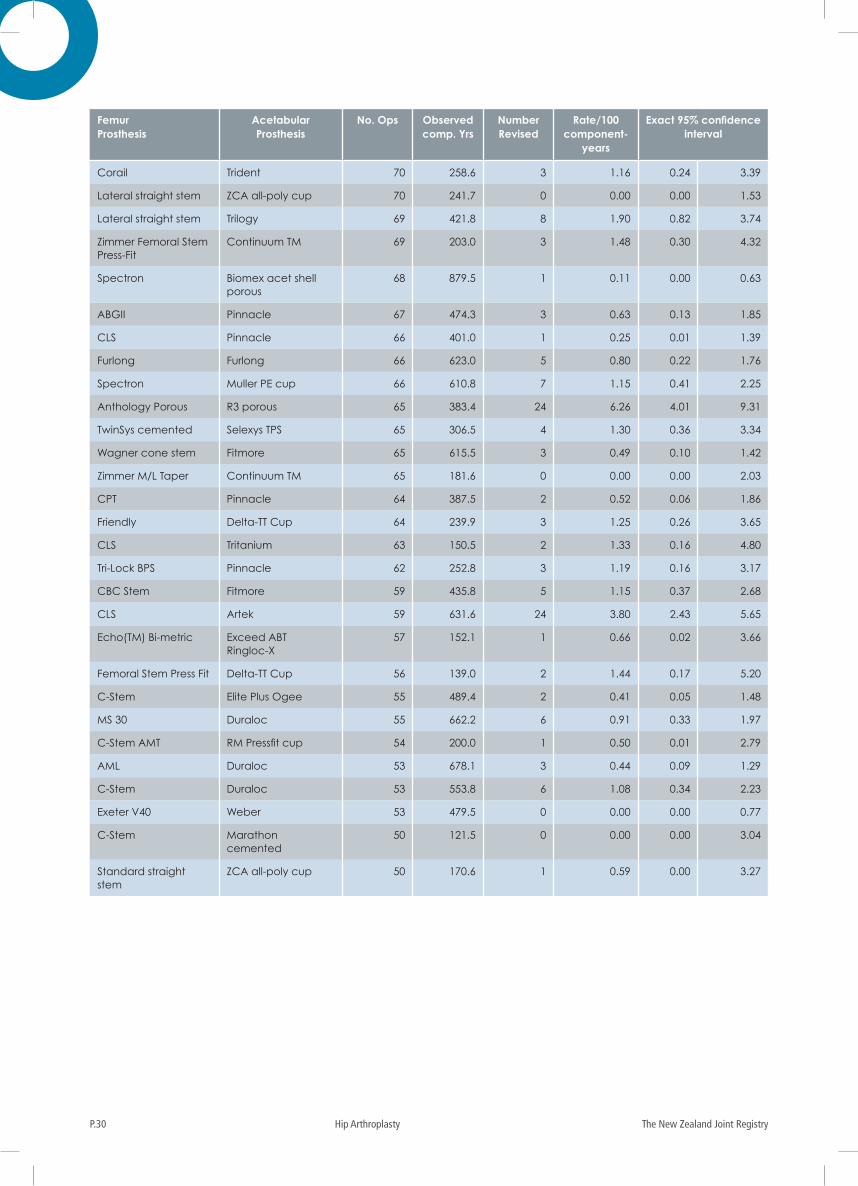
The New Zealand Joint RegistryP.30 Hip Arthroplasty
Femur Prosthesis
Acetabular Prosthesis
No. Ops Observed comp. Yrs
Number Revised
Rate/100 component-
years
Exact 95% confidence interval
Corail Trident 70 258.6 3 1.16 0.24 3.39
Lateral straight stem ZCA all-poly cup 70 241.7 0 0.00 0.00 1.53
Lateral straight stem Trilogy 69 421.8 8 1.90 0.82 3.74
Zimmer Femoral Stem Press-Fit
Continuum TM 69 203.0 3 1.48 0.30 4.32
Spectron Biomex acet shell porous
68 879.5 1 0.11 0.00 0.63
ABGII Pinnacle 67 474.3 3 0.63 0.13 1.85
CLS Pinnacle 66 401.0 1 0.25 0.01 1.39
Furlong Furlong 66 623.0 5 0.80 0.22 1.76
Spectron Muller PE cup 66 610.8 7 1.15 0.41 2.25
Anthology Porous R3 porous 65 383.4 24 6.26 4.01 9.31
TwinSys cemented Selexys TPS 65 306.5 4 1.30 0.36 3.34
Wagner cone stem Fitmore 65 615.5 3 0.49 0.10 1.42
Zimmer M/L Taper Continuum TM 65 181.6 0 0.00 0.00 2.03
CPT Pinnacle 64 387.5 2 0.52 0.06 1.86
Friendly Delta-TT Cup 64 239.9 3 1.25 0.26 3.65
CLS Tritanium 63 150.5 2 1.33 0.16 4.80
Tri-Lock BPS Pinnacle 62 252.8 3 1.19 0.16 3.17
CBC Stem Fitmore 59 435.8 5 1.15 0.37 2.68
CLS Artek 59 631.6 24 3.80 2.43 5.65
Echo(TM) Bi-metric Exceed ABT Ringloc-X
57 152.1 1 0.66 0.02 3.66
Femoral Stem Press Fit Delta-TT Cup 56 139.0 2 1.44 0.17 5.20
C-Stem Elite Plus Ogee 55 489.4 2 0.41 0.05 1.48
MS 30 Duraloc 55 662.2 6 0.91 0.33 1.97
C-Stem AMT RM Pressfit cup 54 200.0 1 0.50 0.01 2.79
AML Duraloc 53 678.1 3 0.44 0.09 1.29
C-Stem Duraloc 53 553.8 6 1.08 0.34 2.23
Exeter V40 Weber 53 479.5 0 0.00 0.00 0.77
C-Stem Marathon cemented
50 121.5 0 0.00 0.00 3.04
Standard straight stem
ZCA all-poly cup 50 170.6 1 0.59 0.00 3.27
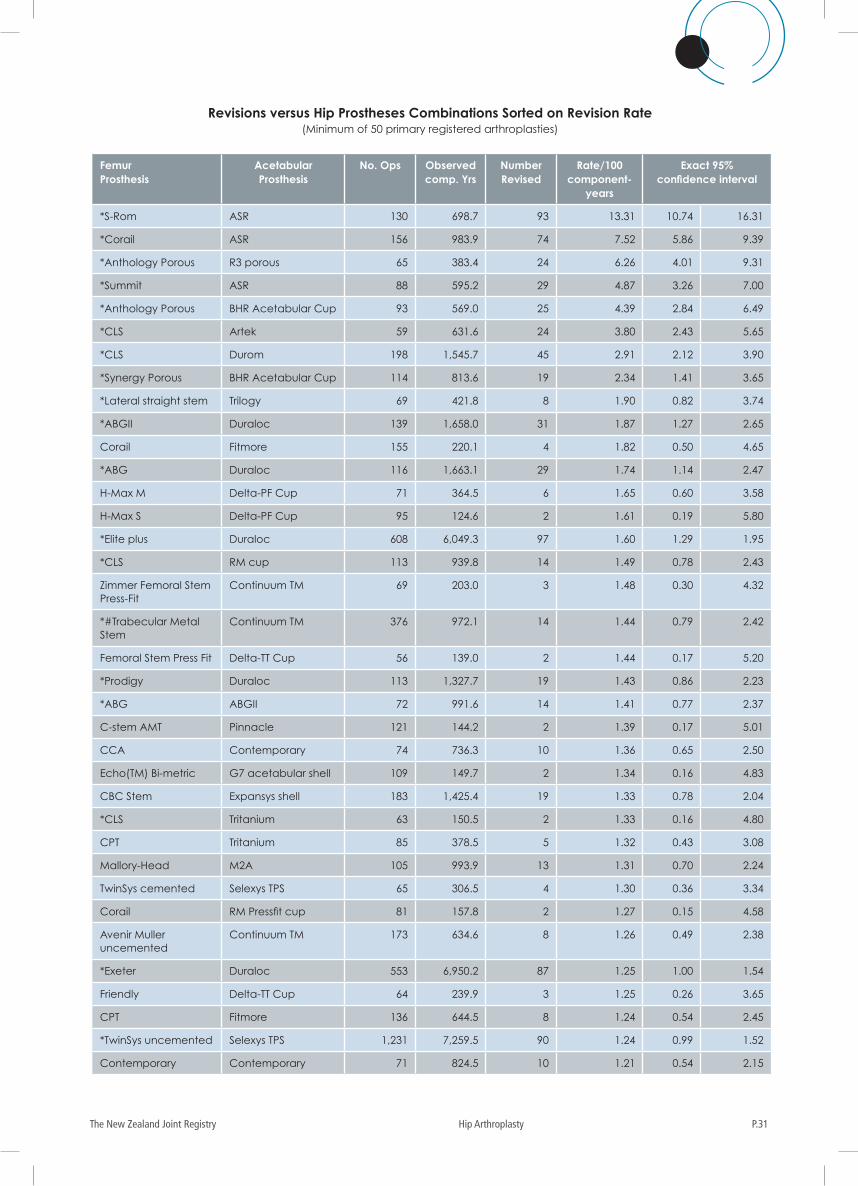
P.31The New Zealand Joint Registry Hip Arthroplasty
Femur Prosthesis
Acetabular Prosthesis
No. Ops Observed comp. Yrs
Number Revised
Rate/100 component-
years
Exact 95% confidence interval
*S-Rom ASR 130 698.7 93 13.31 10.74 16.31
*Corail ASR 156 983.9 74 7.52 5.86 9.39
*Anthology Porous R3 porous 65 383.4 24 6.26 4.01 9.31
*Summit ASR 88 595.2 29 4.87 3.26 7.00
*Anthology Porous BHR Acetabular Cup 93 569.0 25 4.39 2.84 6.49
*CLS Artek 59 631.6 24 3.80 2.43 5.65
*CLS Durom 198 1,545.7 45 2.91 2.12 3.90
*Synergy Porous BHR Acetabular Cup 114 813.6 19 2.34 1.41 3.65
*Lateral straight stem Trilogy 69 421.8 8 1.90 0.82 3.74
*ABGII Duraloc 139 1,658.0 31 1.87 1.27 2.65
Corail Fitmore 155 220.1 4 1.82 0.50 4.65
*ABG Duraloc 116 1,663.1 29 1.74 1.14 2.47
H-Max M Delta-PF Cup 71 364.5 6 1.65 0.60 3.58
H-Max S Delta-PF Cup 95 124.6 2 1.61 0.19 5.80
*Elite plus Duraloc 608 6,049.3 97 1.60 1.29 1.95
*CLS RM cup 113 939.8 14 1.49 0.78 2.43
Zimmer Femoral Stem Press-Fit
Continuum TM 69 203.0 3 1.48 0.30 4.32
*#Trabecular Metal Stem
Continuum TM 376 972.1 14 1.44 0.79 2.42
Femoral Stem Press Fit Delta-TT Cup 56 139.0 2 1.44 0.17 5.20
*Prodigy Duraloc 113 1,327.7 19 1.43 0.86 2.23
*ABG ABGII 72 991.6 14 1.41 0.77 2.37
C-stem AMT Pinnacle 121 144.2 2 1.39 0.17 5.01
CCA Contemporary 74 736.3 10 1.36 0.65 2.50
Echo(TM) Bi-metric G7 acetabular shell 109 149.7 2 1.34 0.16 4.83
CBC Stem Expansys shell 183 1,425.4 19 1.33 0.78 2.04
*CLS Tritanium 63 150.5 2 1.33 0.16 4.80
CPT Tritanium 85 378.5 5 1.32 0.43 3.08
Mallory-Head M2A 105 993.9 13 1.31 0.70 2.24
TwinSys cemented Selexys TPS 65 306.5 4 1.30 0.36 3.34
Corail RM Pressfit cup 81 157.8 2 1.27 0.15 4.58
Avenir Muller uncemented
Continuum TM 173 634.6 8 1.26 0.49 2.38
*Exeter Duraloc 553 6,950.2 87 1.25 1.00 1.54
Friendly Delta-TT Cup 64 239.9 3 1.25 0.26 3.65
CPT Fitmore 136 644.5 8 1.24 0.54 2.45
*TwinSys uncemented Selexys TPS 1,231 7,259.5 90 1.24 0.99 1.52
Contemporary Contemporary 71 824.5 10 1.21 0.54 2.15
Revisions versus Hip Prostheses Combinations Sorted on Revision Rate(Minimum of 50 primary registered arthroplasties)
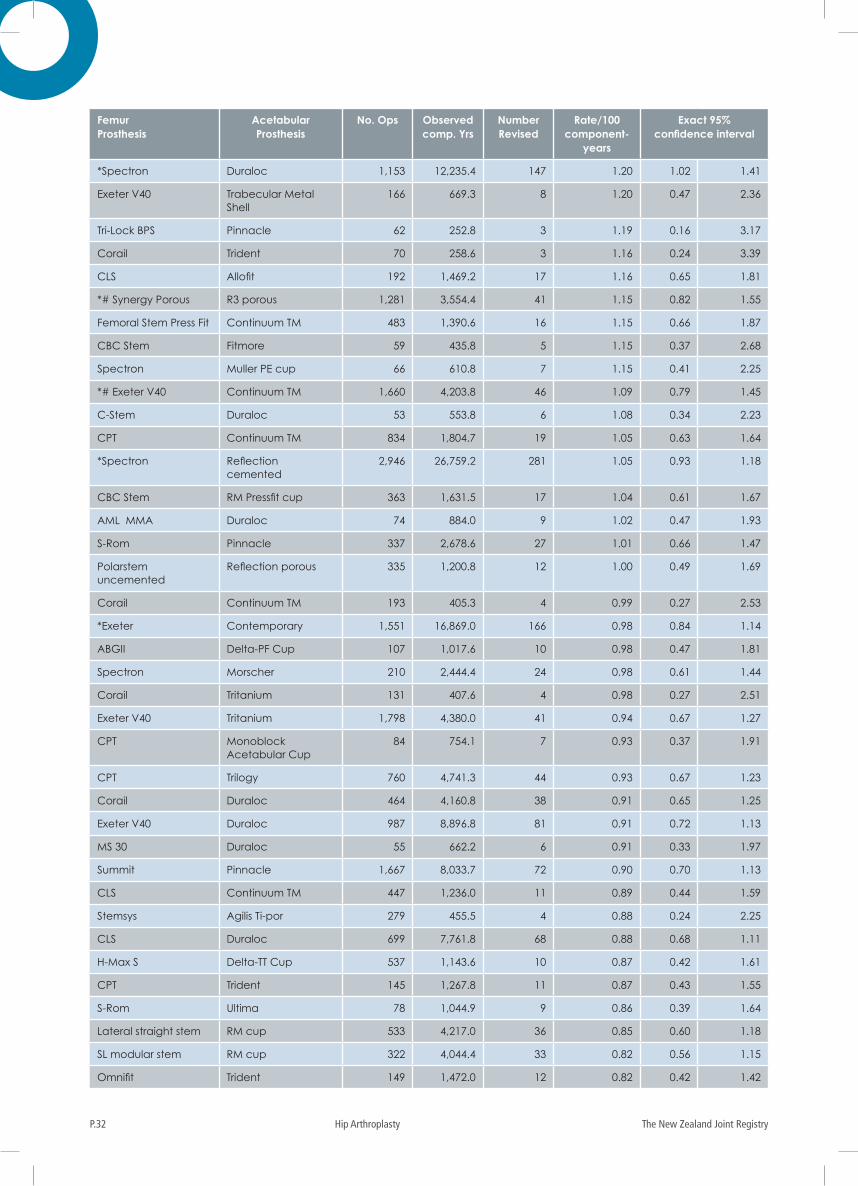
The New Zealand Joint RegistryP.32 Hip Arthroplasty
Femur Prosthesis
Acetabular Prosthesis
No. Ops Observed comp. Yrs
Number Revised
Rate/100 component-
years
Exact 95% confidence interval
*Spectron Duraloc 1,153 12,235.4 147 1.20 1.02 1.41
Exeter V40 Trabecular Metal Shell
166 669.3 8 1.20 0.47 2.36
Tri-Lock BPS Pinnacle 62 252.8 3 1.19 0.16 3.17
Corail Trident 70 258.6 3 1.16 0.24 3.39
CLS Allofit 192 1,469.2 17 1.16 0.65 1.81
*# Synergy Porous R3 porous 1,281 3,554.4 41 1.15 0.82 1.55
Femoral Stem Press Fit Continuum TM 483 1,390.6 16 1.15 0.66 1.87
CBC Stem Fitmore 59 435.8 5 1.15 0.37 2.68
Spectron Muller PE cup 66 610.8 7 1.15 0.41 2.25
*# Exeter V40 Continuum TM 1,660 4,203.8 46 1.09 0.79 1.45
C-Stem Duraloc 53 553.8 6 1.08 0.34 2.23
CPT Continuum TM 834 1,804.7 19 1.05 0.63 1.64
*Spectron Reflection cemented
2,946 26,759.2 281 1.05 0.93 1.18
CBC Stem RM Pressfit cup 363 1,631.5 17 1.04 0.61 1.67
AML MMA Duraloc 74 884.0 9 1.02 0.47 1.93
S-Rom Pinnacle 337 2,678.6 27 1.01 0.66 1.47
Polarstem uncemented
Reflection porous 335 1,200.8 12 1.00 0.49 1.69
Corail Continuum TM 193 405.3 4 0.99 0.27 2.53
*Exeter Contemporary 1,551 16,869.0 166 0.98 0.84 1.14
ABGII Delta-PF Cup 107 1,017.6 10 0.98 0.47 1.81
Spectron Morscher 210 2,444.4 24 0.98 0.61 1.44
Corail Tritanium 131 407.6 4 0.98 0.27 2.51
Exeter V40 Tritanium 1,798 4,380.0 41 0.94 0.67 1.27
CPT Monoblock Acetabular Cup
84 754.1 7 0.93 0.37 1.91
CPT Trilogy 760 4,741.3 44 0.93 0.67 1.23
Corail Duraloc 464 4,160.8 38 0.91 0.65 1.25
Exeter V40 Duraloc 987 8,896.8 81 0.91 0.72 1.13
MS 30 Duraloc 55 662.2 6 0.91 0.33 1.97
Summit Pinnacle 1,667 8,033.7 72 0.90 0.70 1.13
CLS Continuum TM 447 1,236.0 11 0.89 0.44 1.59
Stemsys Agilis Ti-por 279 455.5 4 0.88 0.24 2.25
CLS Duraloc 699 7,761.8 68 0.88 0.68 1.11
H-Max S Delta-TT Cup 537 1,143.6 10 0.87 0.42 1.61
CPT Trident 145 1,267.8 11 0.87 0.43 1.55
S-Rom Ultima 78 1,044.9 9 0.86 0.39 1.64
Lateral straight stem RM cup 533 4,217.0 36 0.85 0.60 1.18
SL modular stem RM cup 322 4,044.4 33 0.82 0.56 1.15
Omnifit Trident 149 1,472.0 12 0.82 0.42 1.42
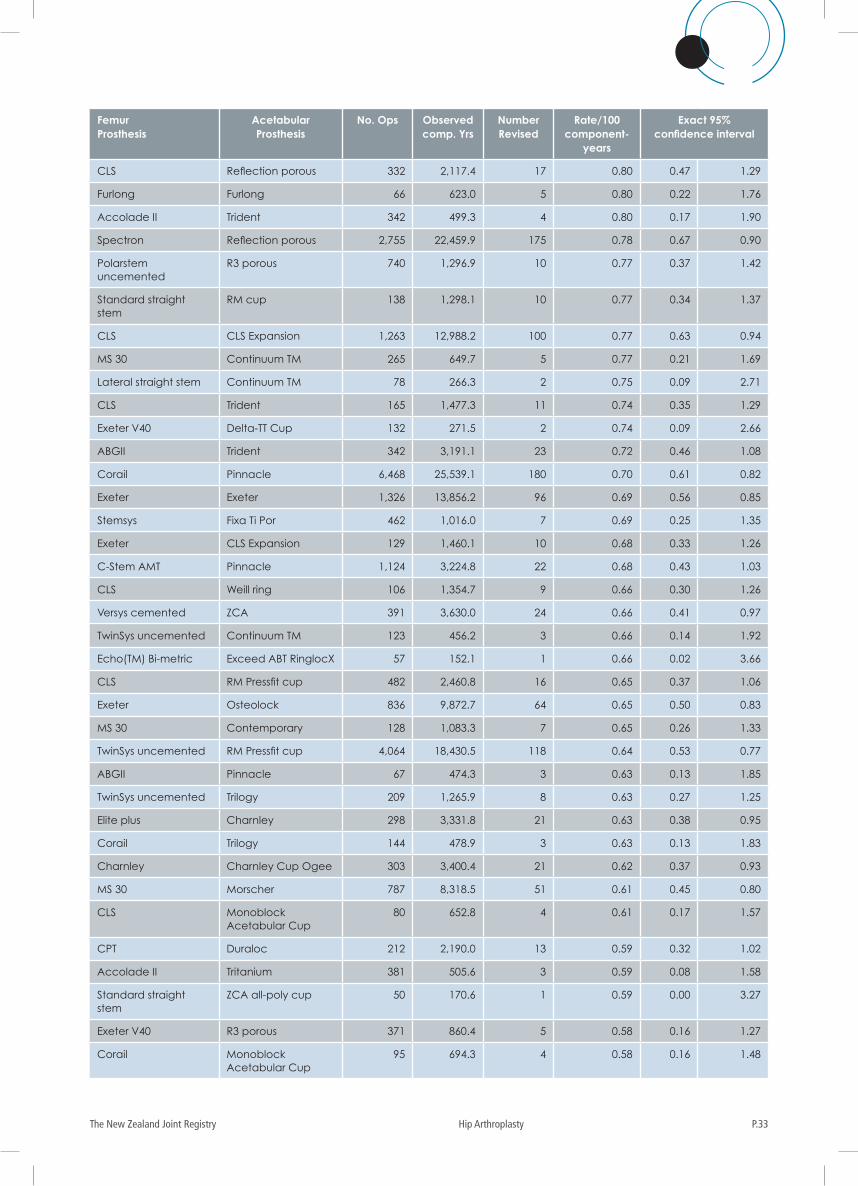
P.33The New Zealand Joint Registry Hip Arthroplasty
Femur Prosthesis
Acetabular Prosthesis
No. Ops Observed comp. Yrs
Number Revised
Rate/100 component-
years
Exact 95% confidence interval
CLS Reflection porous 332 2,117.4 17 0.80 0.47 1.29
Furlong Furlong 66 623.0 5 0.80 0.22 1.76
Accolade II Trident 342 499.3 4 0.80 0.17 1.90
Spectron Reflection porous 2,755 22,459.9 175 0.78 0.67 0.90
Polarstem uncemented
R3 porous 740 1,296.9 10 0.77 0.37 1.42
Standard straight stem
RM cup 138 1,298.1 10 0.77 0.34 1.37
CLS CLS Expansion 1,263 12,988.2 100 0.77 0.63 0.94
MS 30 Continuum TM 265 649.7 5 0.77 0.21 1.69
Lateral straight stem Continuum TM 78 266.3 2 0.75 0.09 2.71
CLS Trident 165 1,477.3 11 0.74 0.35 1.29
Exeter V40 Delta-TT Cup 132 271.5 2 0.74 0.09 2.66
ABGII Trident 342 3,191.1 23 0.72 0.46 1.08
Corail Pinnacle 6,468 25,539.1 180 0.70 0.61 0.82
Exeter Exeter 1,326 13,856.2 96 0.69 0.56 0.85
Stemsys Fixa Ti Por 462 1,016.0 7 0.69 0.25 1.35
Exeter CLS Expansion 129 1,460.1 10 0.68 0.33 1.26
C-Stem AMT Pinnacle 1,124 3,224.8 22 0.68 0.43 1.03
CLS Weill ring 106 1,354.7 9 0.66 0.30 1.26
Versys cemented ZCA 391 3,630.0 24 0.66 0.41 0.97
TwinSys uncemented Continuum TM 123 456.2 3 0.66 0.14 1.92
Echo(TM) Bi-metric Exceed ABT RinglocX 57 152.1 1 0.66 0.02 3.66
CLS RM Pressfit cup 482 2,460.8 16 0.65 0.37 1.06
Exeter Osteolock 836 9,872.7 64 0.65 0.50 0.83
MS 30 Contemporary 128 1,083.3 7 0.65 0.26 1.33
TwinSys uncemented RM Pressfit cup 4,064 18,430.5 118 0.64 0.53 0.77
ABGII Pinnacle 67 474.3 3 0.63 0.13 1.85
TwinSys uncemented Trilogy 209 1,265.9 8 0.63 0.27 1.25
Elite plus Charnley 298 3,331.8 21 0.63 0.38 0.95
Corail Trilogy 144 478.9 3 0.63 0.13 1.83
Charnley Charnley Cup Ogee 303 3,400.4 21 0.62 0.37 0.93
MS 30 Morscher 787 8,318.5 51 0.61 0.45 0.80
CLS Monoblock Acetabular Cup
80 652.8 4 0.61 0.17 1.57
CPT Duraloc 212 2,190.0 13 0.59 0.32 1.02
Accolade II Tritanium 381 505.6 3 0.59 0.08 1.58
Standard straight stem
ZCA all-poly cup 50 170.6 1 0.59 0.00 3.27
Exeter V40 R3 porous 371 860.4 5 0.58 0.16 1.27
Corail Monoblock Acetabular Cup
95 694.3 4 0.58 0.16 1.48
The New Zealand Joint RegistryP.34 Hip Arthroplasty
Femur Prosthesis
Acetabular Prosthesis
No. Ops Observed comp. Yrs
Number Revised
Rate/100 component-
years
Exact 95% confidence interval
Avenir Muller uncemented
Pinnacle 99 526.3 3 0.57 0.08 1.52
TwinSys uncemented RM cup 122 703.7 4 0.57 0.15 1.46
Summit Trilogy 145 885.0 5 0.56 0.18 1.32
CPT ZCA 540 4,809.5 27 0.56 0.36 0.80
C-Stem AMT Marathon cemented
268 1,071.1 6 0.56 0.21 1.22
TwinSys cemented RM Pressfit cup 1,288 4,654.4 26 0.56 0.36 0.82
CLS Trilogy 509 2,761.6 15 0.54 0.29 0.87
Lateral straight stem Muller PE cup 749 6,451.6 35 0.54 0.37 0.75
Accolade Trident 1,867 15,840.0 85 0.54 0.43 0.66
TwinSys cemented CCB 385 1,545.7 8 0.52 0.20 0.98
CPT Pinnacle 64 387.5 2 0.52 0.06 1.86
Summit Duraloc 101 969.8 5 0.52 0.17 1.20
Exeter Bio-clad poly 113 1,178.4 6 0.51 0.16 1.05
Exeter Trilogy 213 2,559.6 13 0.51 0.27 0.87
Elite plus Elite Plus Ogee 110 987.7 5 0.51 0.16 1.18
C-Stem AMT RM Pressfit cup 54 200.0 1 0.50 0.01 2.79
MS 30 RM Pressfit cup 89 602.3 3 0.50 0.07 1.33
Femoral Stem Press Fit Trident 95 202.1 1 0.49 0.01 2.76
Trabecular Metal Stem
Monoblock Acetabular Cup
74 613.9 3 0.49 0.07 1.30
Wagner cone stem Fitmore 65 615.5 3 0.49 0.10 1.42
CLS Fitmore 2,154 17,747.7 86 0.48 0.39 0.60
Exeter V40 Pinnacle 1,616 6,407.2 31 0.48 0.33 0.69
Exeter V40 Exeter 1,636 12,892.3 62 0.48 0.37 0.62
CLS Morscher 1,682 18,727.3 90 0.48 0.39 0.59
CCA CCB 745 5,038.1 24 0.48 0.31 0.71
Exeter V40 Morscher 630 5,882.6 28 0.48 0.31 0.68
Exeter V40 Osteolock 270 2,744.2 13 0.47 0.24 0.79
H-Max M Delta-TT Cup 86 423.7 2 0.47 0.06 1.71
Spectron Mallory-Head 152 1,487.2 7 0.47 0.17 0.92
Spectron Fitmore 78 854.3 4 0.47 0.13 1.20
Femoral Stem Press Fit Trilogy 142 859.4 4 0.47 0.13 1.19
Versys Trilogy 272 3,288.6 15 0.46 0.26 0.75
Stemsys Delta-PF Cup 177 219.5 1 0.46 0.01 2.54
Exeter Muller PE cup 119 1,336.5 6 0.45 0.16 0.98
Exeter V40 Contemporary 5,944 37,957.8 169 0.45 0.38 0.52
AML Duraloc 53 678.1 3 0.44 0.09 1.29
Elite plus Elite Plus LPW 282 2,720.0 12 0.44 0.23 0.77
Stemsys RM Pressfit cup 211 458.2 2 0.44 0.02 1.40
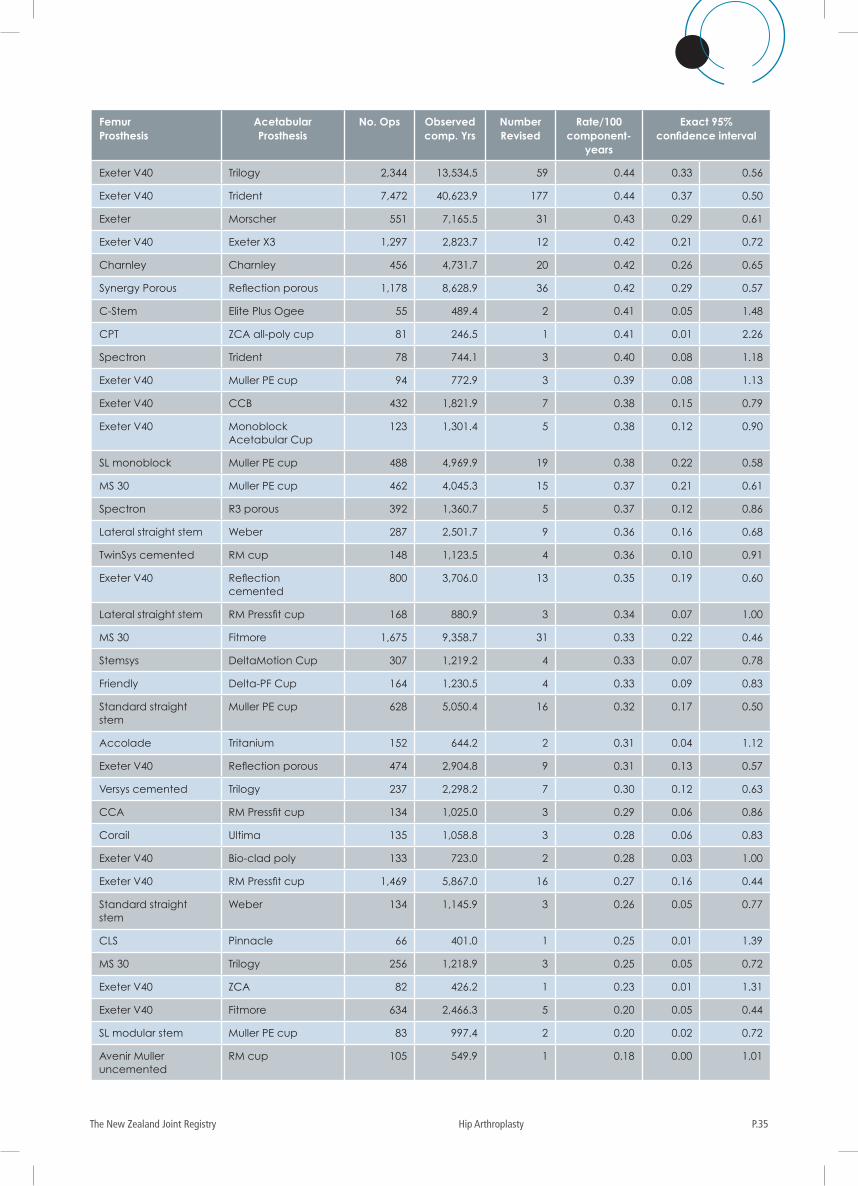
P.35The New Zealand Joint Registry Hip Arthroplasty
Femur Prosthesis
Acetabular Prosthesis
No. Ops Observed comp. Yrs
Number Revised
Rate/100 component-
years
Exact 95% confidence interval
Exeter V40 Trilogy 2,344 13,534.5 59 0.44 0.33 0.56
Exeter V40 Trident 7,472 40,623.9 177 0.44 0.37 0.50
Exeter Morscher 551 7,165.5 31 0.43 0.29 0.61
Exeter V40 Exeter X3 1,297 2,823.7 12 0.42 0.21 0.72
Charnley Charnley 456 4,731.7 20 0.42 0.26 0.65
Synergy Porous Reflection porous 1,178 8,628.9 36 0.42 0.29 0.57
C-Stem Elite Plus Ogee 55 489.4 2 0.41 0.05 1.48
CPT ZCA all-poly cup 81 246.5 1 0.41 0.01 2.26
Spectron Trident 78 744.1 3 0.40 0.08 1.18
Exeter V40 Muller PE cup 94 772.9 3 0.39 0.08 1.13
Exeter V40 CCB 432 1,821.9 7 0.38 0.15 0.79
Exeter V40 Monoblock Acetabular Cup
123 1,301.4 5 0.38 0.12 0.90
SL monoblock Muller PE cup 488 4,969.9 19 0.38 0.22 0.58
MS 30 Muller PE cup 462 4,045.3 15 0.37 0.21 0.61
Spectron R3 porous 392 1,360.7 5 0.37 0.12 0.86
Lateral straight stem Weber 287 2,501.7 9 0.36 0.16 0.68
TwinSys cemented RM cup 148 1,123.5 4 0.36 0.10 0.91
Exeter V40 Reflection cemented
800 3,706.0 13 0.35 0.19 0.60
Lateral straight stem RM Pressfit cup 168 880.9 3 0.34 0.07 1.00
MS 30 Fitmore 1,675 9,358.7 31 0.33 0.22 0.46
Stemsys DeltaMotion Cup 307 1,219.2 4 0.33 0.07 0.78
Friendly Delta-PF Cup 164 1,230.5 4 0.33 0.09 0.83
Standard straight stem
Muller PE cup 628 5,050.4 16 0.32 0.17 0.50
Accolade Tritanium 152 644.2 2 0.31 0.04 1.12
Exeter V40 Reflection porous 474 2,904.8 9 0.31 0.13 0.57
Versys cemented Trilogy 237 2,298.2 7 0.30 0.12 0.63
CCA RM Pressfit cup 134 1,025.0 3 0.29 0.06 0.86
Corail Ultima 135 1,058.8 3 0.28 0.06 0.83
Exeter V40 Bio-clad poly 133 723.0 2 0.28 0.03 1.00
Exeter V40 RM Pressfit cup 1,469 5,867.0 16 0.27 0.16 0.44
Standard straight stem
Weber 134 1,145.9 3 0.26 0.05 0.77
CLS Pinnacle 66 401.0 1 0.25 0.01 1.39
MS 30 Trilogy 256 1,218.9 3 0.25 0.05 0.72
Exeter V40 ZCA 82 426.2 1 0.23 0.01 1.31
Exeter V40 Fitmore 634 2,466.3 5 0.20 0.05 0.44
SL modular stem Muller PE cup 83 997.4 2 0.20 0.02 0.72
Avenir Muller uncemented
RM cup 105 549.9 1 0.18 0.00 1.01
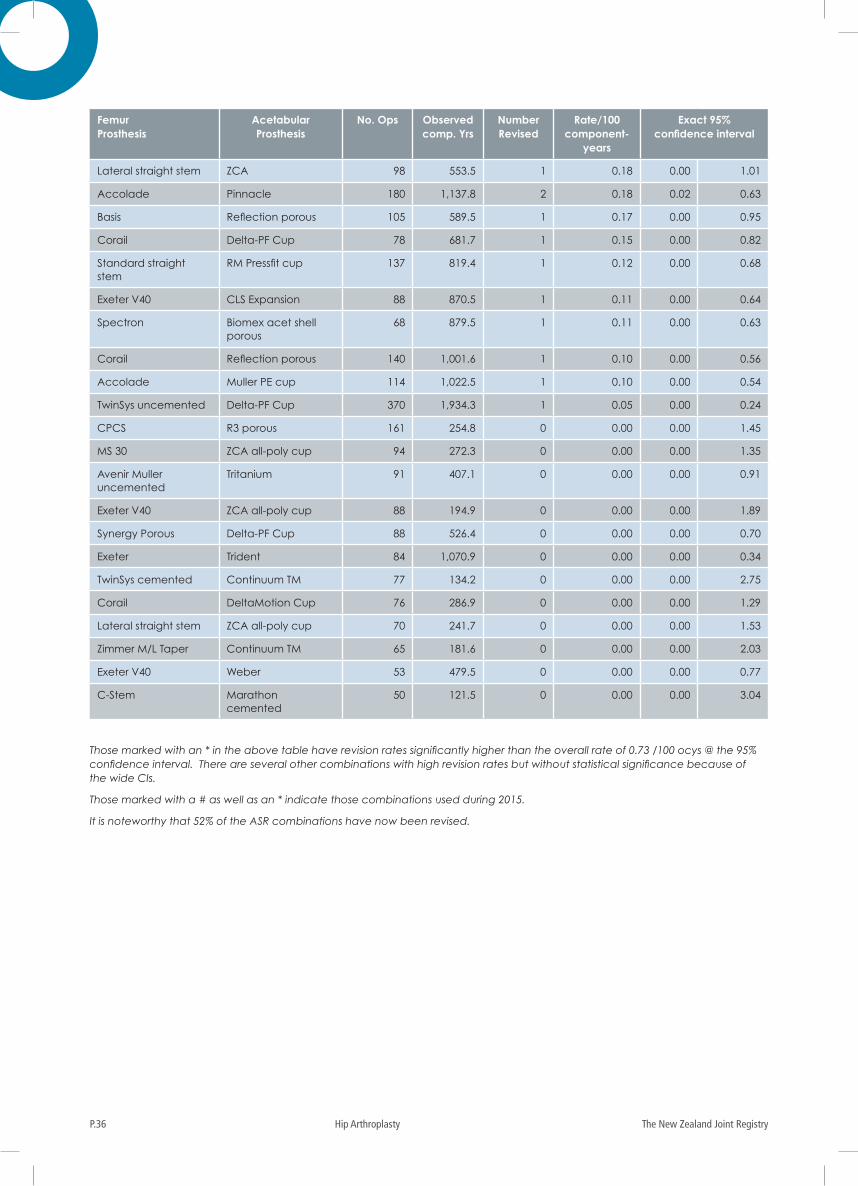
The New Zealand Joint RegistryP.36 Hip Arthroplasty
Femur Prosthesis
Acetabular Prosthesis
No. Ops Observed comp. Yrs
Number Revised
Rate/100 component-
years
Exact 95% confidence interval
Lateral straight stem ZCA 98 553.5 1 0.18 0.00 1.01
Accolade Pinnacle 180 1,137.8 2 0.18 0.02 0.63
Basis Reflection porous 105 589.5 1 0.17 0.00 0.95
Corail Delta-PF Cup 78 681.7 1 0.15 0.00 0.82
Standard straight stem
RM Pressfit cup 137 819.4 1 0.12 0.00 0.68
Exeter V40 CLS Expansion 88 870.5 1 0.11 0.00 0.64
Spectron Biomex acet shell porous
68 879.5 1 0.11 0.00 0.63
Corail Reflection porous 140 1,001.6 1 0.10 0.00 0.56
Accolade Muller PE cup 114 1,022.5 1 0.10 0.00 0.54
TwinSys uncemented Delta-PF Cup 370 1,934.3 1 0.05 0.00 0.24
CPCS R3 porous 161 254.8 0 0.00 0.00 1.45
MS 30 ZCA all-poly cup 94 272.3 0 0.00 0.00 1.35
Avenir Muller uncemented
Tritanium 91 407.1 0 0.00 0.00 0.91
Exeter V40 ZCA all-poly cup 88 194.9 0 0.00 0.00 1.89
Synergy Porous Delta-PF Cup 88 526.4 0 0.00 0.00 0.70
Exeter Trident 84 1,070.9 0 0.00 0.00 0.34
TwinSys cemented Continuum TM 77 134.2 0 0.00 0.00 2.75
Corail DeltaMotion Cup 76 286.9 0 0.00 0.00 1.29
Lateral straight stem ZCA all-poly cup 70 241.7 0 0.00 0.00 1.53
Zimmer M/L Taper Continuum TM 65 181.6 0 0.00 0.00 2.03
Exeter V40 Weber 53 479.5 0 0.00 0.00 0.77
C-Stem Marathon cemented
50 121.5 0 0.00 0.00 3.04
Those marked with an * in the above table have revision rates significantly higher than the overall rate of 0.73 /100 ocys @ the 95% confidence interval. There are several other combinations with high revision rates but without statistical significance because of the wide CIs.
Those marked with a # as well as an * indicate those combinations used during 2015.
It is noteworthy that 52% of the ASR combinations have now been revised.
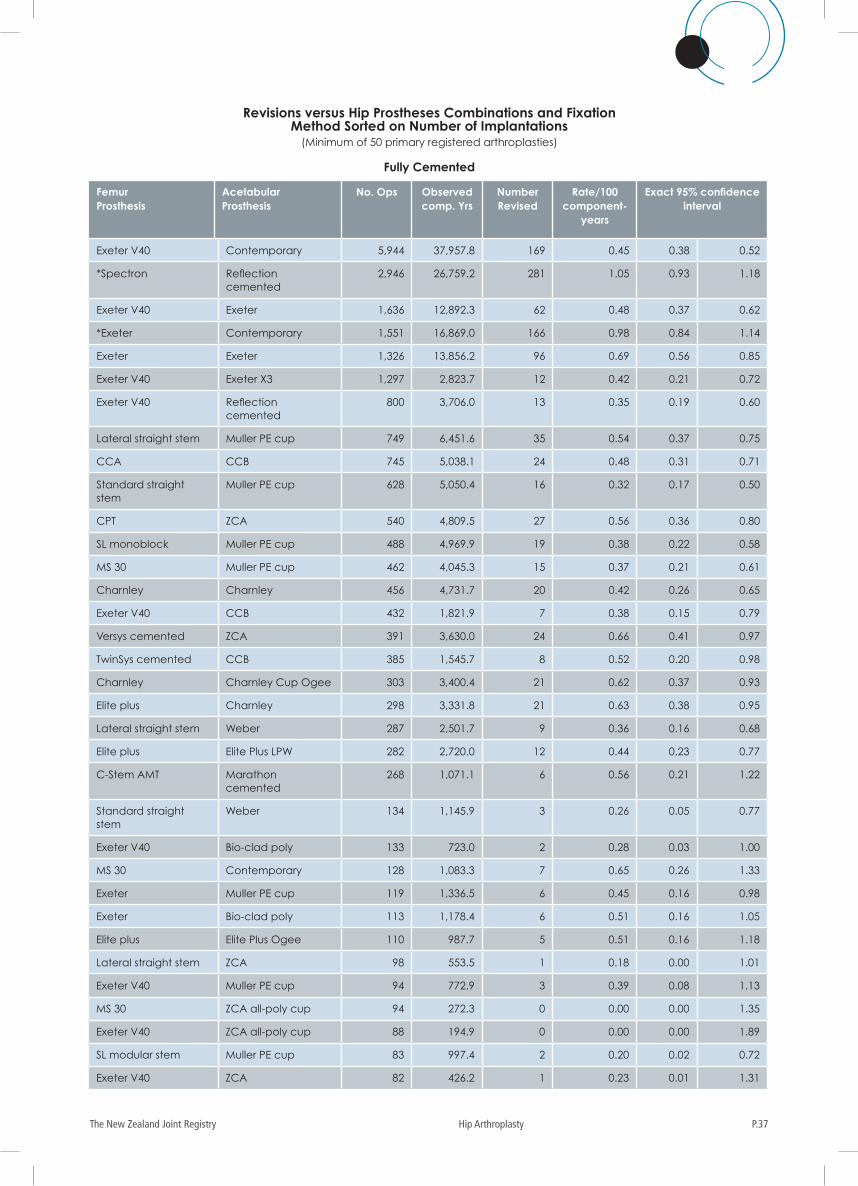
P.37The New Zealand Joint Registry Hip Arthroplasty
Revisions versus Hip Prostheses Combinations and Fixation Method Sorted on Number of Implantations
(Minimum of 50 primary registered arthroplasties)
Fully Cemented
Femur Prosthesis
Acetabular Prosthesis
No. Ops Observed comp. Yrs
Number Revised
Rate/100 component-
years
Exact 95% confidence interval
Exeter V40 Contemporary 5,944 37,957.8 169 0.45 0.38 0.52
*Spectron Reflection cemented
2,946 26,759.2 281 1.05 0.93 1.18
Exeter V40 Exeter 1,636 12,892.3 62 0.48 0.37 0.62
*Exeter Contemporary 1,551 16,869.0 166 0.98 0.84 1.14
Exeter Exeter 1,326 13,856.2 96 0.69 0.56 0.85
Exeter V40 Exeter X3 1,297 2,823.7 12 0.42 0.21 0.72
Exeter V40 Reflection cemented
800 3,706.0 13 0.35 0.19 0.60
Lateral straight stem Muller PE cup 749 6,451.6 35 0.54 0.37 0.75
CCA CCB 745 5,038.1 24 0.48 0.31 0.71
Standard straight stem
Muller PE cup 628 5,050.4 16 0.32 0.17 0.50
CPT ZCA 540 4,809.5 27 0.56 0.36 0.80
SL monoblock Muller PE cup 488 4,969.9 19 0.38 0.22 0.58
MS 30 Muller PE cup 462 4,045.3 15 0.37 0.21 0.61
Charnley Charnley 456 4,731.7 20 0.42 0.26 0.65
Exeter V40 CCB 432 1,821.9 7 0.38 0.15 0.79
Versys cemented ZCA 391 3,630.0 24 0.66 0.41 0.97
TwinSys cemented CCB 385 1,545.7 8 0.52 0.20 0.98
Charnley Charnley Cup Ogee 303 3,400.4 21 0.62 0.37 0.93
Elite plus Charnley 298 3,331.8 21 0.63 0.38 0.95
Lateral straight stem Weber 287 2,501.7 9 0.36 0.16 0.68
Elite plus Elite Plus LPW 282 2,720.0 12 0.44 0.23 0.77
C-Stem AMT Marathon cemented
268 1,071.1 6 0.56 0.21 1.22
Standard straight stem
Weber 134 1,145.9 3 0.26 0.05 0.77
Exeter V40 Bio-clad poly 133 723.0 2 0.28 0.03 1.00
MS 30 Contemporary 128 1,083.3 7 0.65 0.26 1.33
Exeter Muller PE cup 119 1,336.5 6 0.45 0.16 0.98
Exeter Bio-clad poly 113 1,178.4 6 0.51 0.16 1.05
Elite plus Elite Plus Ogee 110 987.7 5 0.51 0.16 1.18
Lateral straight stem ZCA 98 553.5 1 0.18 0.00 1.01
Exeter V40 Muller PE cup 94 772.9 3 0.39 0.08 1.13
MS 30 ZCA all-poly cup 94 272.3 0 0.00 0.00 1.35
Exeter V40 ZCA all-poly cup 88 194.9 0 0.00 0.00 1.89
SL modular stem Muller PE cup 83 997.4 2 0.20 0.02 0.72
Exeter V40 ZCA 82 426.2 1 0.23 0.01 1.31
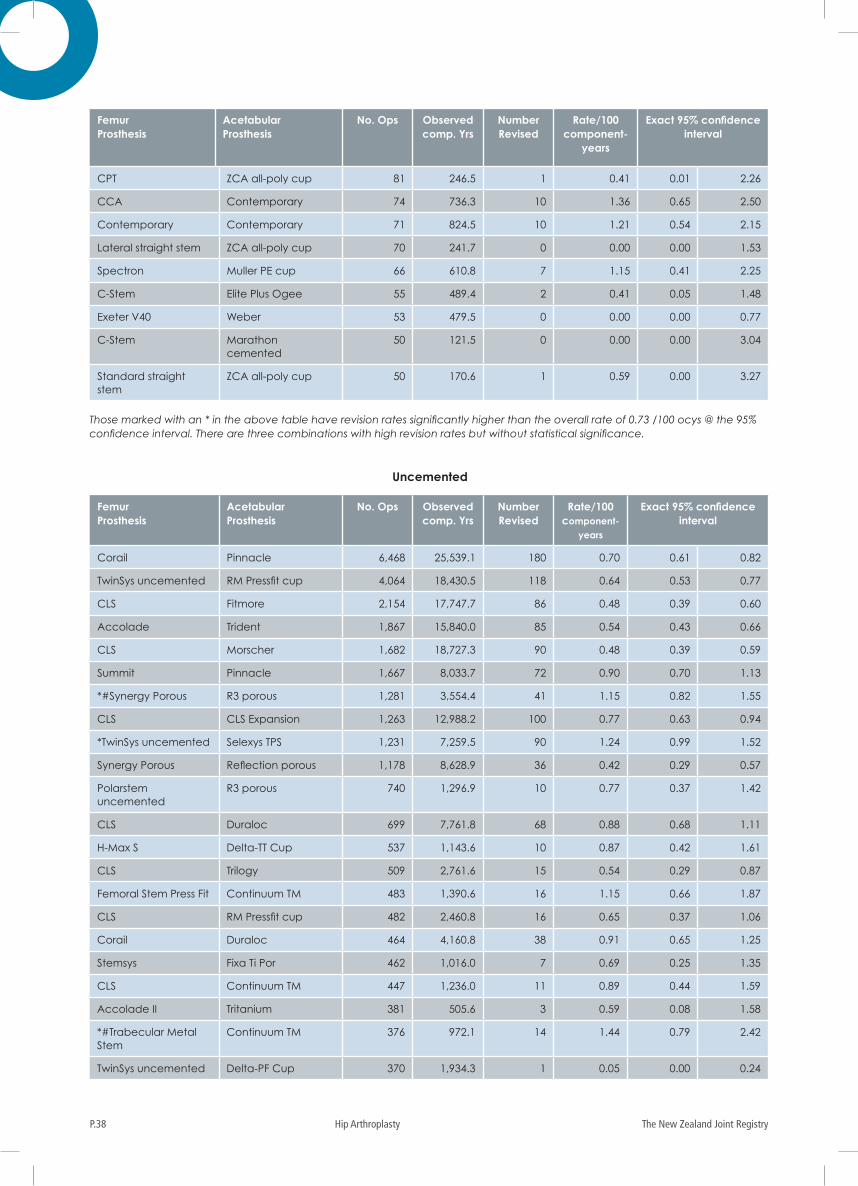
The New Zealand Joint RegistryP.38 Hip Arthroplasty
Femur Prosthesis
Acetabular Prosthesis
No. Ops Observed comp. Yrs
Number Revised
Rate/100 component-
years
Exact 95% confidence interval
CPT ZCA all-poly cup 81 246.5 1 0.41 0.01 2.26
CCA Contemporary 74 736.3 10 1.36 0.65 2.50
Contemporary Contemporary 71 824.5 10 1.21 0.54 2.15
Lateral straight stem ZCA all-poly cup 70 241.7 0 0.00 0.00 1.53
Spectron Muller PE cup 66 610.8 7 1.15 0.41 2.25
C-Stem Elite Plus Ogee 55 489.4 2 0.41 0.05 1.48
Exeter V40 Weber 53 479.5 0 0.00 0.00 0.77
C-Stem Marathon cemented
50 121.5 0 0.00 0.00 3.04
Standard straight stem
ZCA all-poly cup 50 170.6 1 0.59 0.00 3.27
Uncemented
Femur Prosthesis
Acetabular Prosthesis
No. Ops Observed comp. Yrs
Number Revised
Rate/100 component-
years
Exact 95% confidence interval
Corail Pinnacle 6,468 25,539.1 180 0.70 0.61 0.82
TwinSys uncemented RM Pressfit cup 4,064 18,430.5 118 0.64 0.53 0.77
CLS Fitmore 2,154 17,747.7 86 0.48 0.39 0.60
Accolade Trident 1,867 15,840.0 85 0.54 0.43 0.66
CLS Morscher 1,682 18,727.3 90 0.48 0.39 0.59
Summit Pinnacle 1,667 8,033.7 72 0.90 0.70 1.13
*#Synergy Porous R3 porous 1,281 3,554.4 41 1.15 0.82 1.55
CLS CLS Expansion 1,263 12,988.2 100 0.77 0.63 0.94
*TwinSys uncemented Selexys TPS 1,231 7,259.5 90 1.24 0.99 1.52
Synergy Porous Reflection porous 1,178 8,628.9 36 0.42 0.29 0.57
Polarstem uncemented
R3 porous 740 1,296.9 10 0.77 0.37 1.42
CLS Duraloc 699 7,761.8 68 0.88 0.68 1.11
H-Max S Delta-TT Cup 537 1,143.6 10 0.87 0.42 1.61
CLS Trilogy 509 2,761.6 15 0.54 0.29 0.87
Femoral Stem Press Fit Continuum TM 483 1,390.6 16 1.15 0.66 1.87
CLS RM Pressfit cup 482 2,460.8 16 0.65 0.37 1.06
Corail Duraloc 464 4,160.8 38 0.91 0.65 1.25
Stemsys Fixa Ti Por 462 1,016.0 7 0.69 0.25 1.35
CLS Continuum TM 447 1,236.0 11 0.89 0.44 1.59
Accolade II Tritanium 381 505.6 3 0.59 0.08 1.58
*#Trabecular Metal Stem
Continuum TM 376 972.1 14 1.44 0.79 2.42
TwinSys uncemented Delta-PF Cup 370 1,934.3 1 0.05 0.00 0.24
Those marked with an * in the above table have revision rates significantly higher than the overall rate of 0.73 /100 ocys @ the 95% confidence interval. There are three combinations with high revision rates but without statistical significance.
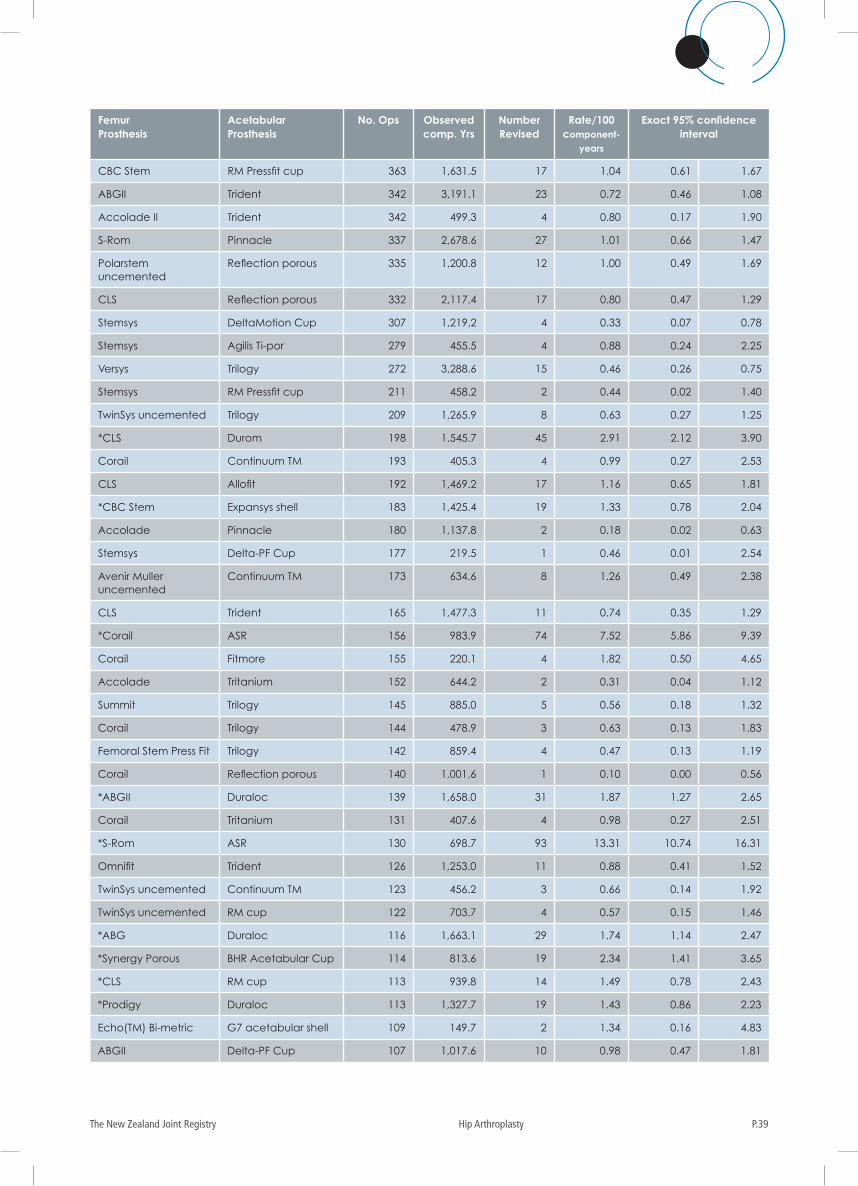
P.39The New Zealand Joint Registry Hip Arthroplasty
Femur Prosthesis
Acetabular Prosthesis
No. Ops Observed comp. Yrs
Number Revised
Rate/100 component-
years
Exact 95% confidence interval
CBC Stem RM Pressfit cup 363 1,631.5 17 1.04 0.61 1.67
ABGII Trident 342 3,191.1 23 0.72 0.46 1.08
Accolade II Trident 342 499.3 4 0.80 0.17 1.90
S-Rom Pinnacle 337 2,678.6 27 1.01 0.66 1.47
Polarstem uncemented
Reflection porous 335 1,200.8 12 1.00 0.49 1.69
CLS Reflection porous 332 2,117.4 17 0.80 0.47 1.29
Stemsys DeltaMotion Cup 307 1,219.2 4 0.33 0.07 0.78
Stemsys Agilis Ti-por 279 455.5 4 0.88 0.24 2.25
Versys Trilogy 272 3,288.6 15 0.46 0.26 0.75
Stemsys RM Pressfit cup 211 458.2 2 0.44 0.02 1.40
TwinSys uncemented Trilogy 209 1,265.9 8 0.63 0.27 1.25
*CLS Durom 198 1,545.7 45 2.91 2.12 3.90
Corail Continuum TM 193 405.3 4 0.99 0.27 2.53
CLS Allofit 192 1,469.2 17 1.16 0.65 1.81
*CBC Stem Expansys shell 183 1,425.4 19 1.33 0.78 2.04
Accolade Pinnacle 180 1,137.8 2 0.18 0.02 0.63
Stemsys Delta-PF Cup 177 219.5 1 0.46 0.01 2.54
Avenir Muller uncemented
Continuum TM 173 634.6 8 1.26 0.49 2.38
CLS Trident 165 1,477.3 11 0.74 0.35 1.29
*Corail ASR 156 983.9 74 7.52 5.86 9.39
Corail Fitmore 155 220.1 4 1.82 0.50 4.65
Accolade Tritanium 152 644.2 2 0.31 0.04 1.12
Summit Trilogy 145 885.0 5 0.56 0.18 1.32
Corail Trilogy 144 478.9 3 0.63 0.13 1.83
Femoral Stem Press Fit Trilogy 142 859.4 4 0.47 0.13 1.19
Corail Reflection porous 140 1,001.6 1 0.10 0.00 0.56
*ABGII Duraloc 139 1,658.0 31 1.87 1.27 2.65
Corail Tritanium 131 407.6 4 0.98 0.27 2.51
*S-Rom ASR 130 698.7 93 13.31 10.74 16.31
Omnifit Trident 126 1,253.0 11 0.88 0.41 1.52
TwinSys uncemented Continuum TM 123 456.2 3 0.66 0.14 1.92
TwinSys uncemented RM cup 122 703.7 4 0.57 0.15 1.46
*ABG Duraloc 116 1,663.1 29 1.74 1.14 2.47
*Synergy Porous BHR Acetabular Cup 114 813.6 19 2.34 1.41 3.65
*CLS RM cup 113 939.8 14 1.49 0.78 2.43
*Prodigy Duraloc 113 1,327.7 19 1.43 0.86 2.23
Echo(TM) Bi-metric G7 acetabular shell 109 149.7 2 1.34 0.16 4.83
ABGII Delta-PF Cup 107 1,017.6 10 0.98 0.47 1.81
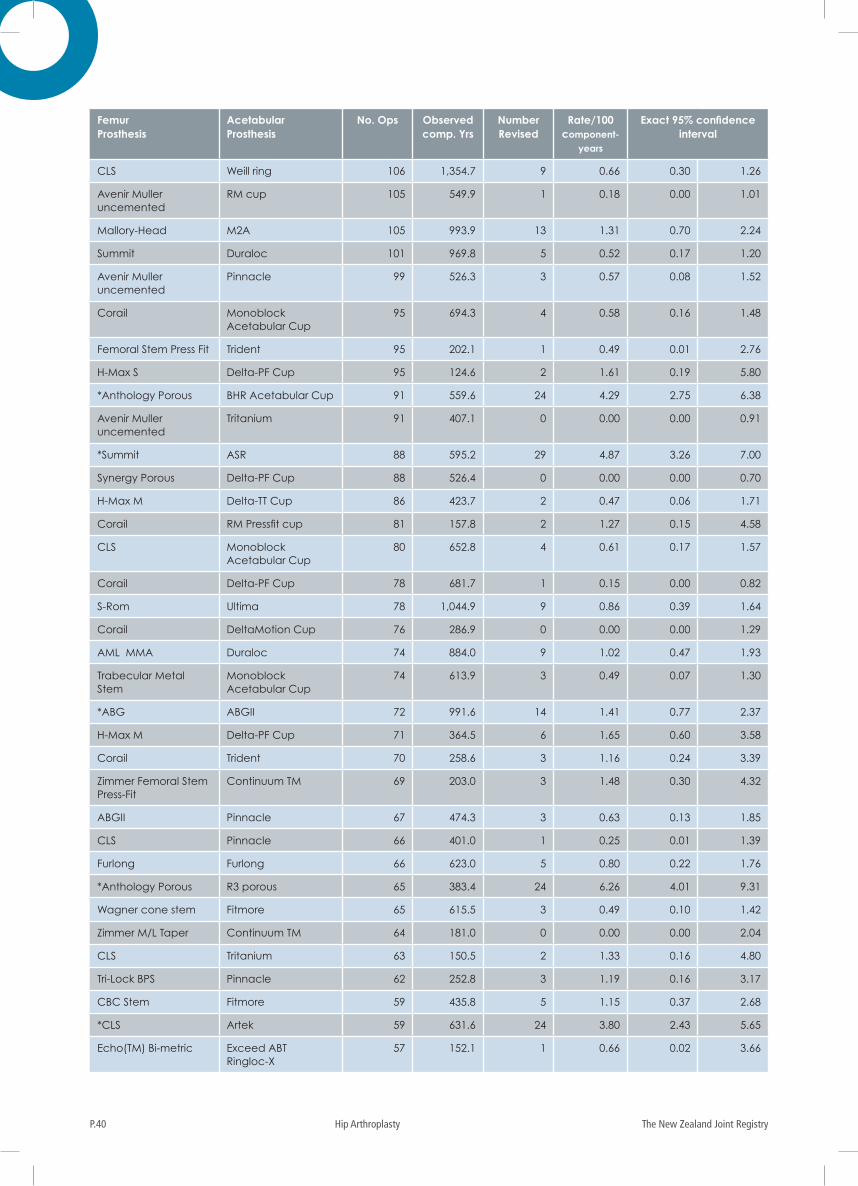
The New Zealand Joint RegistryP.40 Hip Arthroplasty
Femur Prosthesis
Acetabular Prosthesis
No. Ops Observed comp. Yrs
Number Revised
Rate/100 component-
years
Exact 95% confidence interval
CLS Weill ring 106 1,354.7 9 0.66 0.30 1.26
Avenir Muller uncemented
RM cup 105 549.9 1 0.18 0.00 1.01
Mallory-Head M2A 105 993.9 13 1.31 0.70 2.24
Summit Duraloc 101 969.8 5 0.52 0.17 1.20
Avenir Muller uncemented
Pinnacle 99 526.3 3 0.57 0.08 1.52
Corail Monoblock Acetabular Cup
95 694.3 4 0.58 0.16 1.48
Femoral Stem Press Fit Trident 95 202.1 1 0.49 0.01 2.76
H-Max S Delta-PF Cup 95 124.6 2 1.61 0.19 5.80
*Anthology Porous BHR Acetabular Cup 91 559.6 24 4.29 2.75 6.38
Avenir Muller uncemented
Tritanium 91 407.1 0 0.00 0.00 0.91
*Summit ASR 88 595.2 29 4.87 3.26 7.00
Synergy Porous Delta-PF Cup 88 526.4 0 0.00 0.00 0.70
H-Max M Delta-TT Cup 86 423.7 2 0.47 0.06 1.71
Corail RM Pressfit cup 81 157.8 2 1.27 0.15 4.58
CLS Monoblock Acetabular Cup
80 652.8 4 0.61 0.17 1.57
Corail Delta-PF Cup 78 681.7 1 0.15 0.00 0.82
S-Rom Ultima 78 1,044.9 9 0.86 0.39 1.64
Corail DeltaMotion Cup 76 286.9 0 0.00 0.00 1.29
AML MMA Duraloc 74 884.0 9 1.02 0.47 1.93
Trabecular Metal Stem
Monoblock Acetabular Cup
74 613.9 3 0.49 0.07 1.30
*ABG ABGII 72 991.6 14 1.41 0.77 2.37
H-Max M Delta-PF Cup 71 364.5 6 1.65 0.60 3.58
Corail Trident 70 258.6 3 1.16 0.24 3.39
Zimmer Femoral Stem Press-Fit
Continuum TM 69 203.0 3 1.48 0.30 4.32
ABGII Pinnacle 67 474.3 3 0.63 0.13 1.85
CLS Pinnacle 66 401.0 1 0.25 0.01 1.39
Furlong Furlong 66 623.0 5 0.80 0.22 1.76
*Anthology Porous R3 porous 65 383.4 24 6.26 4.01 9.31
Wagner cone stem Fitmore 65 615.5 3 0.49 0.10 1.42
Zimmer M/L Taper Continuum TM 64 181.0 0 0.00 0.00 2.04
CLS Tritanium 63 150.5 2 1.33 0.16 4.80
Tri-Lock BPS Pinnacle 62 252.8 3 1.19 0.16 3.17
CBC Stem Fitmore 59 435.8 5 1.15 0.37 2.68
*CLS Artek 59 631.6 24 3.80 2.43 5.65
Echo(TM) Bi-metric Exceed ABT Ringloc-X
57 152.1 1 0.66 0.02 3.66
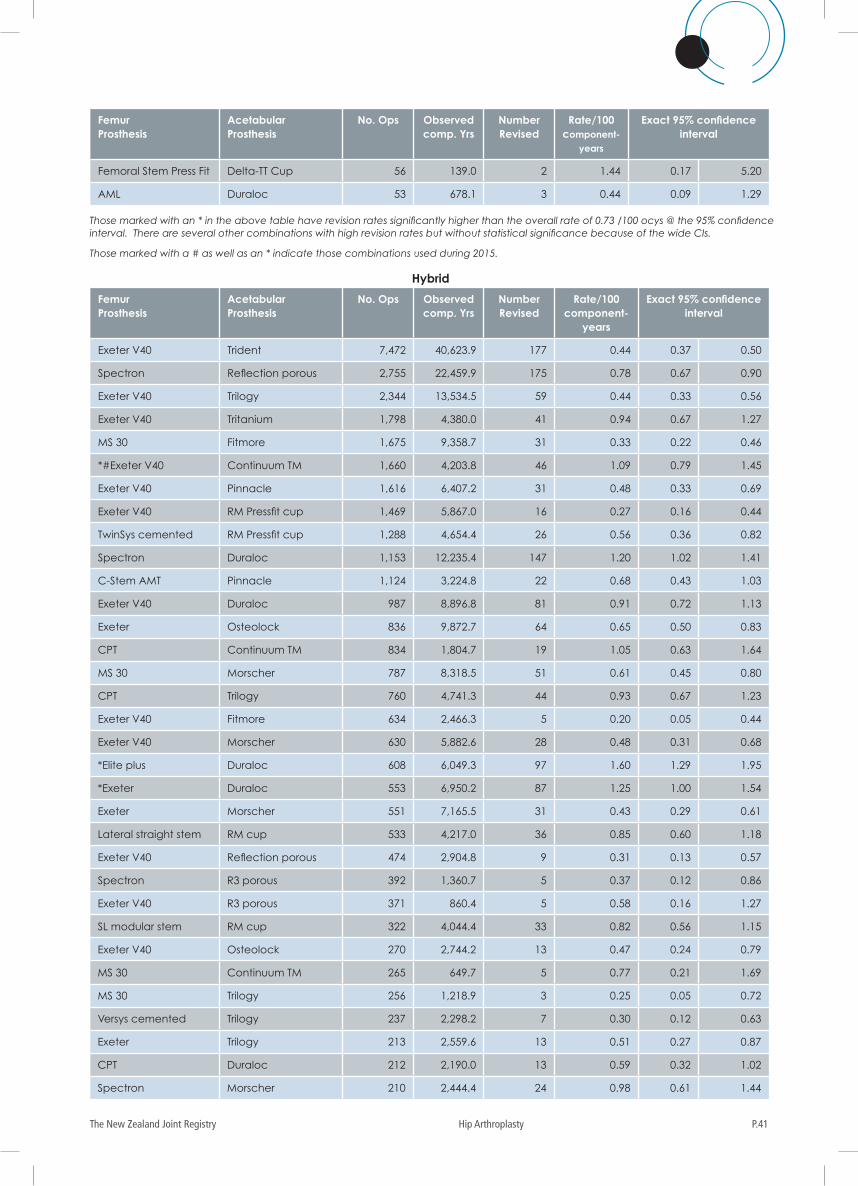
P.41The New Zealand Joint Registry Hip Arthroplasty
Hybrid
Femur Prosthesis
Acetabular Prosthesis
No. Ops Observed comp. Yrs
Number Revised
Rate/100 component-
years
Exact 95% confidence interval
Exeter V40 Trident 7,472 40,623.9 177 0.44 0.37 0.50
Spectron Reflection porous 2,755 22,459.9 175 0.78 0.67 0.90
Exeter V40 Trilogy 2,344 13,534.5 59 0.44 0.33 0.56
Exeter V40 Tritanium 1,798 4,380.0 41 0.94 0.67 1.27
MS 30 Fitmore 1,675 9,358.7 31 0.33 0.22 0.46
*#Exeter V40 Continuum TM 1,660 4,203.8 46 1.09 0.79 1.45
Exeter V40 Pinnacle 1,616 6,407.2 31 0.48 0.33 0.69
Exeter V40 RM Pressfit cup 1,469 5,867.0 16 0.27 0.16 0.44
TwinSys cemented RM Pressfit cup 1,288 4,654.4 26 0.56 0.36 0.82
Spectron Duraloc 1,153 12,235.4 147 1.20 1.02 1.41
C-Stem AMT Pinnacle 1,124 3,224.8 22 0.68 0.43 1.03
Exeter V40 Duraloc 987 8,896.8 81 0.91 0.72 1.13
Exeter Osteolock 836 9,872.7 64 0.65 0.50 0.83
CPT Continuum TM 834 1,804.7 19 1.05 0.63 1.64
MS 30 Morscher 787 8,318.5 51 0.61 0.45 0.80
CPT Trilogy 760 4,741.3 44 0.93 0.67 1.23
Exeter V40 Fitmore 634 2,466.3 5 0.20 0.05 0.44
Exeter V40 Morscher 630 5,882.6 28 0.48 0.31 0.68
*Elite plus Duraloc 608 6,049.3 97 1.60 1.29 1.95
*Exeter Duraloc 553 6,950.2 87 1.25 1.00 1.54
Exeter Morscher 551 7,165.5 31 0.43 0.29 0.61
Lateral straight stem RM cup 533 4,217.0 36 0.85 0.60 1.18
Exeter V40 Reflection porous 474 2,904.8 9 0.31 0.13 0.57
Spectron R3 porous 392 1,360.7 5 0.37 0.12 0.86
Exeter V40 R3 porous 371 860.4 5 0.58 0.16 1.27
SL modular stem RM cup 322 4,044.4 33 0.82 0.56 1.15
Exeter V40 Osteolock 270 2,744.2 13 0.47 0.24 0.79
MS 30 Continuum TM 265 649.7 5 0.77 0.21 1.69
MS 30 Trilogy 256 1,218.9 3 0.25 0.05 0.72
Versys cemented Trilogy 237 2,298.2 7 0.30 0.12 0.63
Exeter Trilogy 213 2,559.6 13 0.51 0.27 0.87
CPT Duraloc 212 2,190.0 13 0.59 0.32 1.02
Spectron Morscher 210 2,444.4 24 0.98 0.61 1.44
Femur Prosthesis
Acetabular Prosthesis
No. Ops Observed comp. Yrs
Number Revised
Rate/100 component-
years
Exact 95% confidence interval
Femoral Stem Press Fit Delta-TT Cup 56 139.0 2 1.44 0.17 5.20
AML Duraloc 53 678.1 3 0.44 0.09 1.29
Those marked with an * in the above table have revision rates significantly higher than the overall rate of 0.73 /100 ocys @ the 95% confidence interval. There are several other combinations with high revision rates but without statistical significance because of the wide CIs.
Those marked with a # as well as an * indicate those combinations used during 2015.
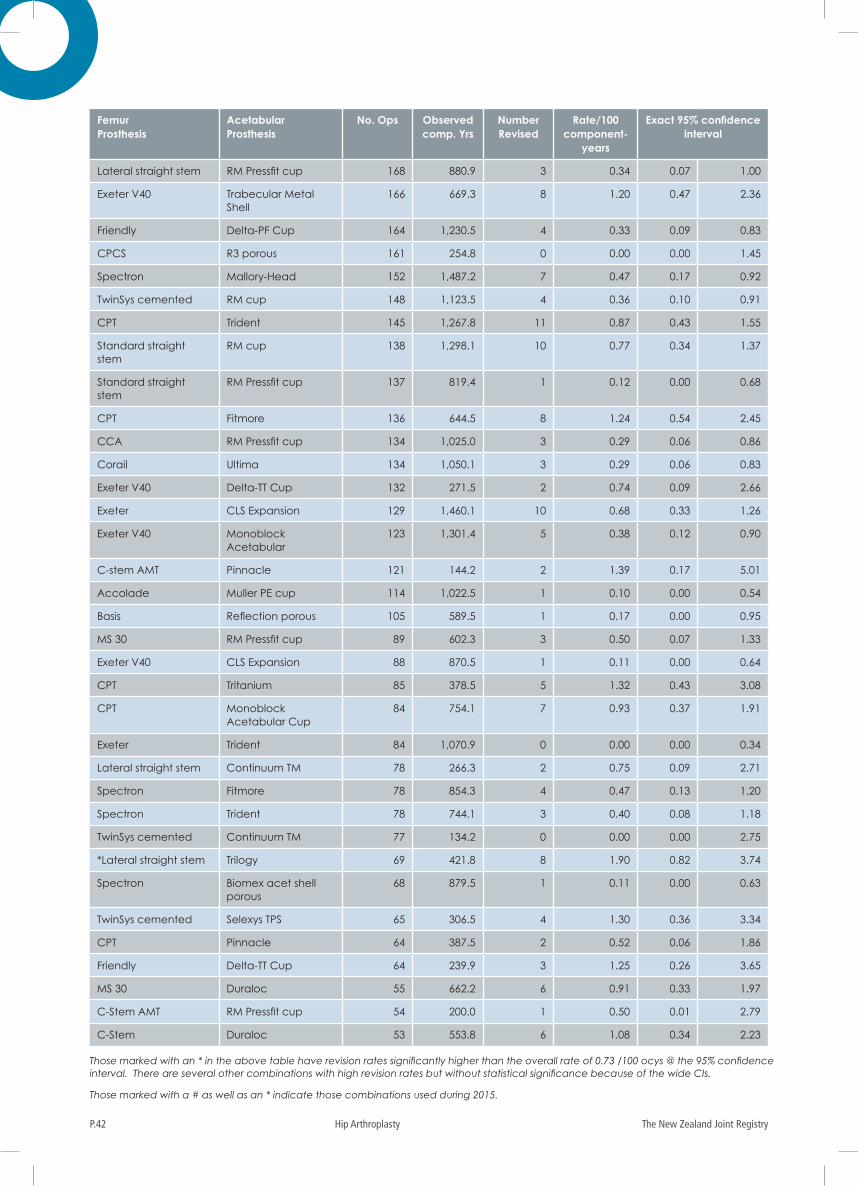
The New Zealand Joint RegistryP.42 Hip Arthroplasty
Femur Prosthesis
Acetabular Prosthesis
No. Ops Observed comp. Yrs
Number Revised
Rate/100 component-
years
Exact 95% confidence interval
Lateral straight stem RM Pressfit cup 168 880.9 3 0.34 0.07 1.00
Exeter V40 Trabecular Metal Shell
166 669.3 8 1.20 0.47 2.36
Friendly Delta-PF Cup 164 1,230.5 4 0.33 0.09 0.83
CPCS R3 porous 161 254.8 0 0.00 0.00 1.45
Spectron Mallory-Head 152 1,487.2 7 0.47 0.17 0.92
TwinSys cemented RM cup 148 1,123.5 4 0.36 0.10 0.91
CPT Trident 145 1,267.8 11 0.87 0.43 1.55
Standard straight stem
RM cup 138 1,298.1 10 0.77 0.34 1.37
Standard straight stem
RM Pressfit cup 137 819.4 1 0.12 0.00 0.68
CPT Fitmore 136 644.5 8 1.24 0.54 2.45
CCA RM Pressfit cup 134 1,025.0 3 0.29 0.06 0.86
Corail Ultima 134 1,050.1 3 0.29 0.06 0.83
Exeter V40 Delta-TT Cup 132 271.5 2 0.74 0.09 2.66
Exeter CLS Expansion 129 1,460.1 10 0.68 0.33 1.26
Exeter V40 Monoblock Acetabular
123 1,301.4 5 0.38 0.12 0.90
C-stem AMT Pinnacle 121 144.2 2 1.39 0.17 5.01
Accolade Muller PE cup 114 1,022.5 1 0.10 0.00 0.54
Basis Reflection porous 105 589.5 1 0.17 0.00 0.95
MS 30 RM Pressfit cup 89 602.3 3 0.50 0.07 1.33
Exeter V40 CLS Expansion 88 870.5 1 0.11 0.00 0.64
CPT Tritanium 85 378.5 5 1.32 0.43 3.08
CPT Monoblock Acetabular Cup
84 754.1 7 0.93 0.37 1.91
Exeter Trident 84 1,070.9 0 0.00 0.00 0.34
Lateral straight stem Continuum TM 78 266.3 2 0.75 0.09 2.71
Spectron Fitmore 78 854.3 4 0.47 0.13 1.20
Spectron Trident 78 744.1 3 0.40 0.08 1.18
TwinSys cemented Continuum TM 77 134.2 0 0.00 0.00 2.75
*Lateral straight stem Trilogy 69 421.8 8 1.90 0.82 3.74
Spectron Biomex acet shell porous
68 879.5 1 0.11 0.00 0.63
TwinSys cemented Selexys TPS 65 306.5 4 1.30 0.36 3.34
CPT Pinnacle 64 387.5 2 0.52 0.06 1.86
Friendly Delta-TT Cup 64 239.9 3 1.25 0.26 3.65
MS 30 Duraloc 55 662.2 6 0.91 0.33 1.97
C-Stem AMT RM Pressfit cup 54 200.0 1 0.50 0.01 2.79
C-Stem Duraloc 53 553.8 6 1.08 0.34 2.23
Those marked with an * in the above table have revision rates significantly higher than the overall rate of 0.73 /100 ocys @ the 95% confidence interval. There are several other combinations with high revision rates but without statistical significance because of the wide CIs.
Those marked with a # as well as an * indicate those combinations used during 2015.
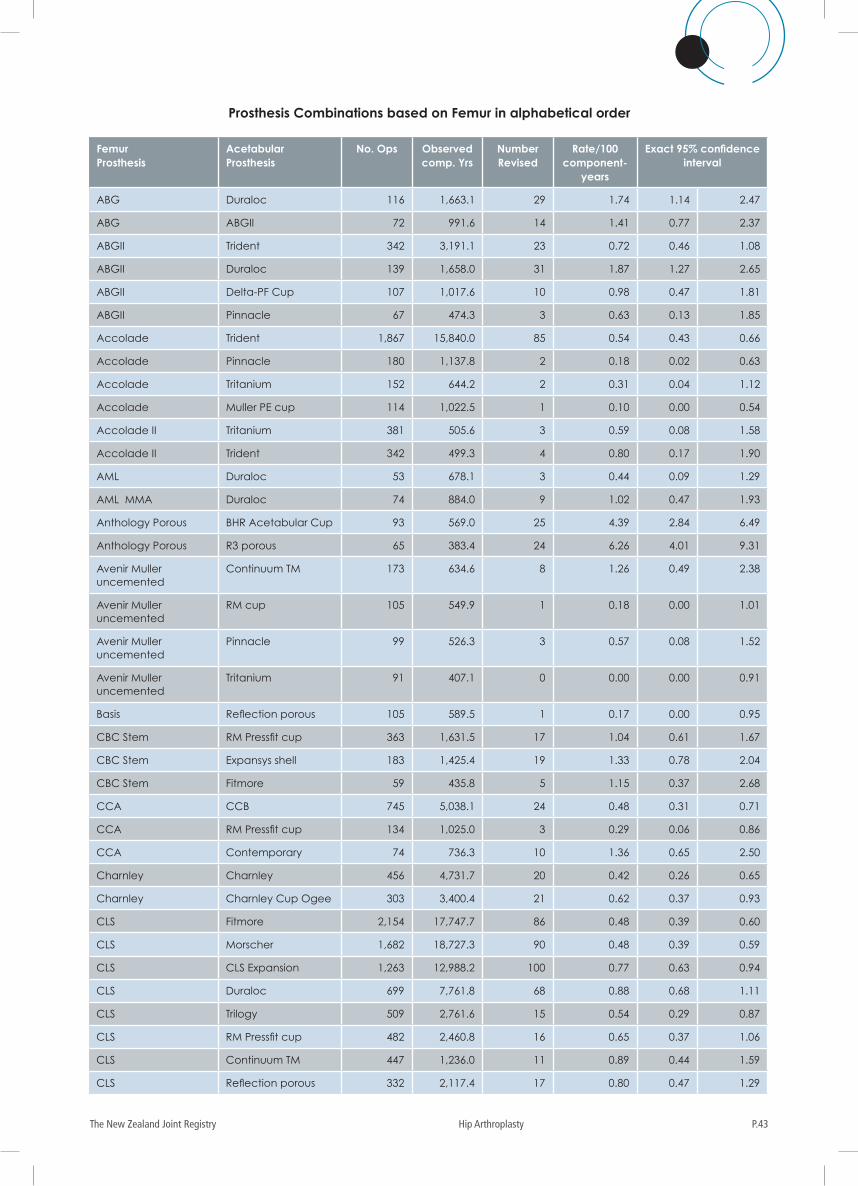
P.43The New Zealand Joint Registry Hip Arthroplasty
Prosthesis Combinations based on Femur in alphabetical order
Femur Prosthesis
Acetabular Prosthesis
No. Ops Observed comp. Yrs
Number Revised
Rate/100 component-
years
Exact 95% confidence interval
ABG Duraloc 116 1,663.1 29 1.74 1.14 2.47
ABG ABGII 72 991.6 14 1.41 0.77 2.37
ABGII Trident 342 3,191.1 23 0.72 0.46 1.08
ABGII Duraloc 139 1,658.0 31 1.87 1.27 2.65
ABGII Delta-PF Cup 107 1,017.6 10 0.98 0.47 1.81
ABGII Pinnacle 67 474.3 3 0.63 0.13 1.85
Accolade Trident 1,867 15,840.0 85 0.54 0.43 0.66
Accolade Pinnacle 180 1,137.8 2 0.18 0.02 0.63
Accolade Tritanium 152 644.2 2 0.31 0.04 1.12
Accolade Muller PE cup 114 1,022.5 1 0.10 0.00 0.54
Accolade II Tritanium 381 505.6 3 0.59 0.08 1.58
Accolade II Trident 342 499.3 4 0.80 0.17 1.90
AML Duraloc 53 678.1 3 0.44 0.09 1.29
AML MMA Duraloc 74 884.0 9 1.02 0.47 1.93
Anthology Porous BHR Acetabular Cup 93 569.0 25 4.39 2.84 6.49
Anthology Porous R3 porous 65 383.4 24 6.26 4.01 9.31
Avenir Muller uncemented
Continuum TM 173 634.6 8 1.26 0.49 2.38
Avenir Muller uncemented
RM cup 105 549.9 1 0.18 0.00 1.01
Avenir Muller uncemented
Pinnacle 99 526.3 3 0.57 0.08 1.52
Avenir Muller uncemented
Tritanium 91 407.1 0 0.00 0.00 0.91
Basis Reflection porous 105 589.5 1 0.17 0.00 0.95
CBC Stem RM Pressfit cup 363 1,631.5 17 1.04 0.61 1.67
CBC Stem Expansys shell 183 1,425.4 19 1.33 0.78 2.04
CBC Stem Fitmore 59 435.8 5 1.15 0.37 2.68
CCA CCB 745 5,038.1 24 0.48 0.31 0.71
CCA RM Pressfit cup 134 1,025.0 3 0.29 0.06 0.86
CCA Contemporary 74 736.3 10 1.36 0.65 2.50
Charnley Charnley 456 4,731.7 20 0.42 0.26 0.65
Charnley Charnley Cup Ogee 303 3,400.4 21 0.62 0.37 0.93
CLS Fitmore 2,154 17,747.7 86 0.48 0.39 0.60
CLS Morscher 1,682 18,727.3 90 0.48 0.39 0.59
CLS CLS Expansion 1,263 12,988.2 100 0.77 0.63 0.94
CLS Duraloc 699 7,761.8 68 0.88 0.68 1.11
CLS Trilogy 509 2,761.6 15 0.54 0.29 0.87
CLS RM Pressfit cup 482 2,460.8 16 0.65 0.37 1.06
CLS Continuum TM 447 1,236.0 11 0.89 0.44 1.59
CLS Reflection porous 332 2,117.4 17 0.80 0.47 1.29
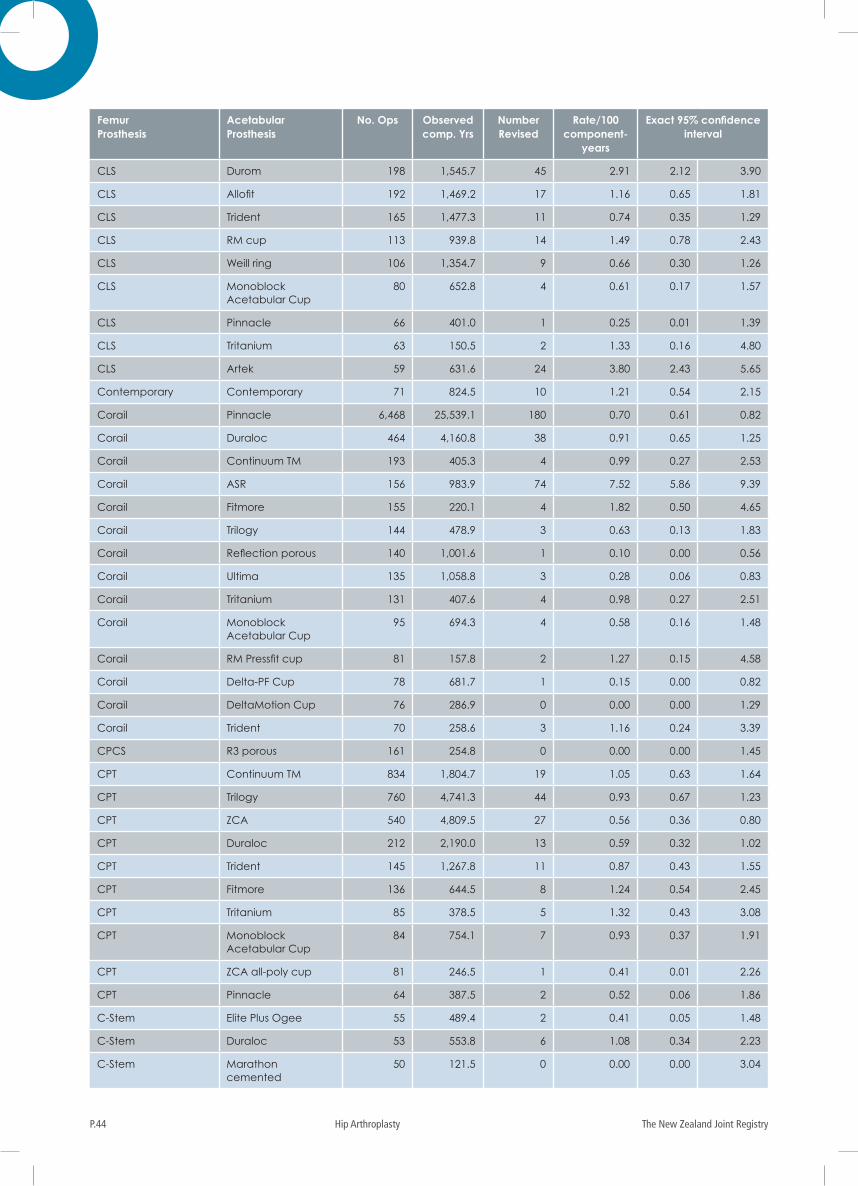
The New Zealand Joint RegistryP.44 Hip Arthroplasty
Femur Prosthesis
Acetabular Prosthesis
No. Ops Observed comp. Yrs
Number Revised
Rate/100 component-
years
Exact 95% confidence interval
CLS Durom 198 1,545.7 45 2.91 2.12 3.90
CLS Allofit 192 1,469.2 17 1.16 0.65 1.81
CLS Trident 165 1,477.3 11 0.74 0.35 1.29
CLS RM cup 113 939.8 14 1.49 0.78 2.43
CLS Weill ring 106 1,354.7 9 0.66 0.30 1.26
CLS Monoblock Acetabular Cup
80 652.8 4 0.61 0.17 1.57
CLS Pinnacle 66 401.0 1 0.25 0.01 1.39
CLS Tritanium 63 150.5 2 1.33 0.16 4.80
CLS Artek 59 631.6 24 3.80 2.43 5.65
Contemporary Contemporary 71 824.5 10 1.21 0.54 2.15
Corail Pinnacle 6,468 25,539.1 180 0.70 0.61 0.82
Corail Duraloc 464 4,160.8 38 0.91 0.65 1.25
Corail Continuum TM 193 405.3 4 0.99 0.27 2.53
Corail ASR 156 983.9 74 7.52 5.86 9.39
Corail Fitmore 155 220.1 4 1.82 0.50 4.65
Corail Trilogy 144 478.9 3 0.63 0.13 1.83
Corail Reflection porous 140 1,001.6 1 0.10 0.00 0.56
Corail Ultima 135 1,058.8 3 0.28 0.06 0.83
Corail Tritanium 131 407.6 4 0.98 0.27 2.51
Corail Monoblock Acetabular Cup
95 694.3 4 0.58 0.16 1.48
Corail RM Pressfit cup 81 157.8 2 1.27 0.15 4.58
Corail Delta-PF Cup 78 681.7 1 0.15 0.00 0.82
Corail DeltaMotion Cup 76 286.9 0 0.00 0.00 1.29
Corail Trident 70 258.6 3 1.16 0.24 3.39
CPCS R3 porous 161 254.8 0 0.00 0.00 1.45
CPT Continuum TM 834 1,804.7 19 1.05 0.63 1.64
CPT Trilogy 760 4,741.3 44 0.93 0.67 1.23
CPT ZCA 540 4,809.5 27 0.56 0.36 0.80
CPT Duraloc 212 2,190.0 13 0.59 0.32 1.02
CPT Trident 145 1,267.8 11 0.87 0.43 1.55
CPT Fitmore 136 644.5 8 1.24 0.54 2.45
CPT Tritanium 85 378.5 5 1.32 0.43 3.08
CPT Monoblock Acetabular Cup
84 754.1 7 0.93 0.37 1.91
CPT ZCA all-poly cup 81 246.5 1 0.41 0.01 2.26
CPT Pinnacle 64 387.5 2 0.52 0.06 1.86
C-Stem Elite Plus Ogee 55 489.4 2 0.41 0.05 1.48
C-Stem Duraloc 53 553.8 6 1.08 0.34 2.23
C-Stem Marathon cemented
50 121.5 0 0.00 0.00 3.04
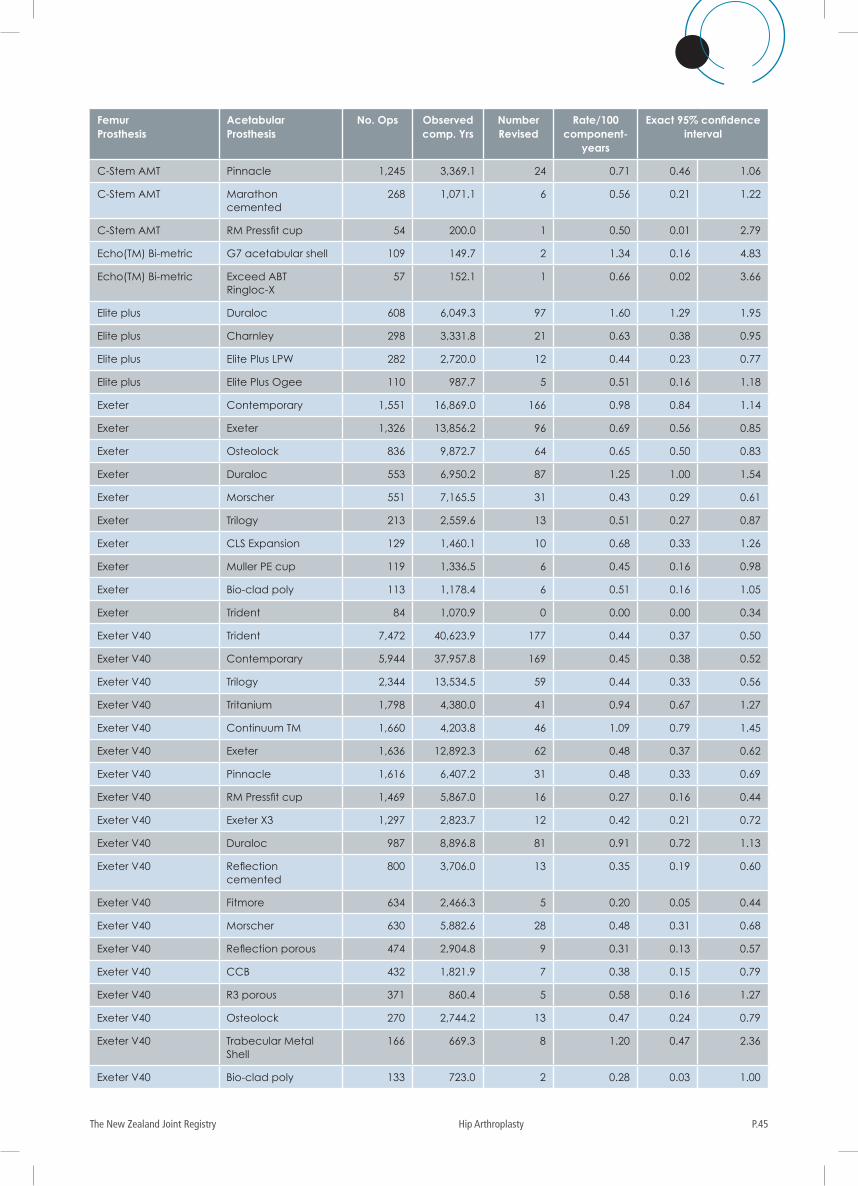
P.45The New Zealand Joint Registry Hip Arthroplasty
Femur Prosthesis
Acetabular Prosthesis
No. Ops Observed comp. Yrs
Number Revised
Rate/100 component-
years
Exact 95% confidence interval
C-Stem AMT Pinnacle 1,245 3,369.1 24 0.71 0.46 1.06
C-Stem AMT Marathon cemented
268 1,071.1 6 0.56 0.21 1.22
C-Stem AMT RM Pressfit cup 54 200.0 1 0.50 0.01 2.79
Echo(TM) Bi-metric G7 acetabular shell 109 149.7 2 1.34 0.16 4.83
Echo(TM) Bi-metric Exceed ABT Ringloc-X
57 152.1 1 0.66 0.02 3.66
Elite plus Duraloc 608 6,049.3 97 1.60 1.29 1.95
Elite plus Charnley 298 3,331.8 21 0.63 0.38 0.95
Elite plus Elite Plus LPW 282 2,720.0 12 0.44 0.23 0.77
Elite plus Elite Plus Ogee 110 987.7 5 0.51 0.16 1.18
Exeter Contemporary 1,551 16,869.0 166 0.98 0.84 1.14
Exeter Exeter 1,326 13,856.2 96 0.69 0.56 0.85
Exeter Osteolock 836 9,872.7 64 0.65 0.50 0.83
Exeter Duraloc 553 6,950.2 87 1.25 1.00 1.54
Exeter Morscher 551 7,165.5 31 0.43 0.29 0.61
Exeter Trilogy 213 2,559.6 13 0.51 0.27 0.87
Exeter CLS Expansion 129 1,460.1 10 0.68 0.33 1.26
Exeter Muller PE cup 119 1,336.5 6 0.45 0.16 0.98
Exeter Bio-clad poly 113 1,178.4 6 0.51 0.16 1.05
Exeter Trident 84 1,070.9 0 0.00 0.00 0.34
Exeter V40 Trident 7,472 40,623.9 177 0.44 0.37 0.50
Exeter V40 Contemporary 5,944 37,957.8 169 0.45 0.38 0.52
Exeter V40 Trilogy 2,344 13,534.5 59 0.44 0.33 0.56
Exeter V40 Tritanium 1,798 4,380.0 41 0.94 0.67 1.27
Exeter V40 Continuum TM 1,660 4,203.8 46 1.09 0.79 1.45
Exeter V40 Exeter 1,636 12,892.3 62 0.48 0.37 0.62
Exeter V40 Pinnacle 1,616 6,407.2 31 0.48 0.33 0.69
Exeter V40 RM Pressfit cup 1,469 5,867.0 16 0.27 0.16 0.44
Exeter V40 Exeter X3 1,297 2,823.7 12 0.42 0.21 0.72
Exeter V40 Duraloc 987 8,896.8 81 0.91 0.72 1.13
Exeter V40 Reflection cemented
800 3,706.0 13 0.35 0.19 0.60
Exeter V40 Fitmore 634 2,466.3 5 0.20 0.05 0.44
Exeter V40 Morscher 630 5,882.6 28 0.48 0.31 0.68
Exeter V40 Reflection porous 474 2,904.8 9 0.31 0.13 0.57
Exeter V40 CCB 432 1,821.9 7 0.38 0.15 0.79
Exeter V40 R3 porous 371 860.4 5 0.58 0.16 1.27
Exeter V40 Osteolock 270 2,744.2 13 0.47 0.24 0.79
Exeter V40 Trabecular Metal Shell
166 669.3 8 1.20 0.47 2.36
Exeter V40 Bio-clad poly 133 723.0 2 0.28 0.03 1.00
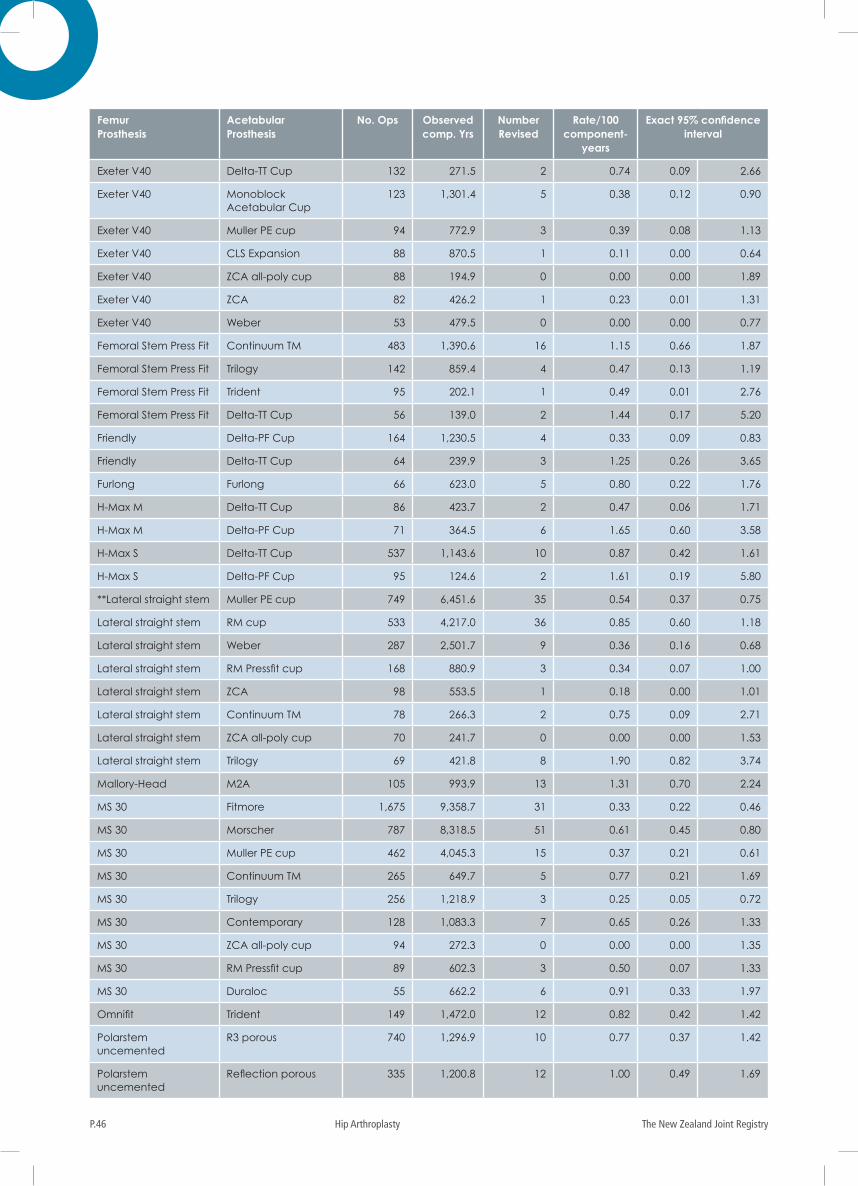
The New Zealand Joint RegistryP.46 Hip Arthroplasty
Femur Prosthesis
Acetabular Prosthesis
No. Ops Observed comp. Yrs
Number Revised
Rate/100 component-
years
Exact 95% confidence interval
Exeter V40 Delta-TT Cup 132 271.5 2 0.74 0.09 2.66
Exeter V40 Monoblock Acetabular Cup
123 1,301.4 5 0.38 0.12 0.90
Exeter V40 Muller PE cup 94 772.9 3 0.39 0.08 1.13
Exeter V40 CLS Expansion 88 870.5 1 0.11 0.00 0.64
Exeter V40 ZCA all-poly cup 88 194.9 0 0.00 0.00 1.89
Exeter V40 ZCA 82 426.2 1 0.23 0.01 1.31
Exeter V40 Weber 53 479.5 0 0.00 0.00 0.77
Femoral Stem Press Fit Continuum TM 483 1,390.6 16 1.15 0.66 1.87
Femoral Stem Press Fit Trilogy 142 859.4 4 0.47 0.13 1.19
Femoral Stem Press Fit Trident 95 202.1 1 0.49 0.01 2.76
Femoral Stem Press Fit Delta-TT Cup 56 139.0 2 1.44 0.17 5.20
Friendly Delta-PF Cup 164 1,230.5 4 0.33 0.09 0.83
Friendly Delta-TT Cup 64 239.9 3 1.25 0.26 3.65
Furlong Furlong 66 623.0 5 0.80 0.22 1.76
H-Max M Delta-TT Cup 86 423.7 2 0.47 0.06 1.71
H-Max M Delta-PF Cup 71 364.5 6 1.65 0.60 3.58
H-Max S Delta-TT Cup 537 1,143.6 10 0.87 0.42 1.61
H-Max S Delta-PF Cup 95 124.6 2 1.61 0.19 5.80
**Lateral straight stem Muller PE cup 749 6,451.6 35 0.54 0.37 0.75
Lateral straight stem RM cup 533 4,217.0 36 0.85 0.60 1.18
Lateral straight stem Weber 287 2,501.7 9 0.36 0.16 0.68
Lateral straight stem RM Pressfit cup 168 880.9 3 0.34 0.07 1.00
Lateral straight stem ZCA 98 553.5 1 0.18 0.00 1.01
Lateral straight stem Continuum TM 78 266.3 2 0.75 0.09 2.71
Lateral straight stem ZCA all-poly cup 70 241.7 0 0.00 0.00 1.53
Lateral straight stem Trilogy 69 421.8 8 1.90 0.82 3.74
Mallory-Head M2A 105 993.9 13 1.31 0.70 2.24
MS 30 Fitmore 1,675 9,358.7 31 0.33 0.22 0.46
MS 30 Morscher 787 8,318.5 51 0.61 0.45 0.80
MS 30 Muller PE cup 462 4,045.3 15 0.37 0.21 0.61
MS 30 Continuum TM 265 649.7 5 0.77 0.21 1.69
MS 30 Trilogy 256 1,218.9 3 0.25 0.05 0.72
MS 30 Contemporary 128 1,083.3 7 0.65 0.26 1.33
MS 30 ZCA all-poly cup 94 272.3 0 0.00 0.00 1.35
MS 30 RM Pressfit cup 89 602.3 3 0.50 0.07 1.33
MS 30 Duraloc 55 662.2 6 0.91 0.33 1.97
Omnifit Trident 149 1,472.0 12 0.82 0.42 1.42
Polarstem uncemented
R3 porous 740 1,296.9 10 0.77 0.37 1.42
Polarstem uncemented
Reflection porous 335 1,200.8 12 1.00 0.49 1.69
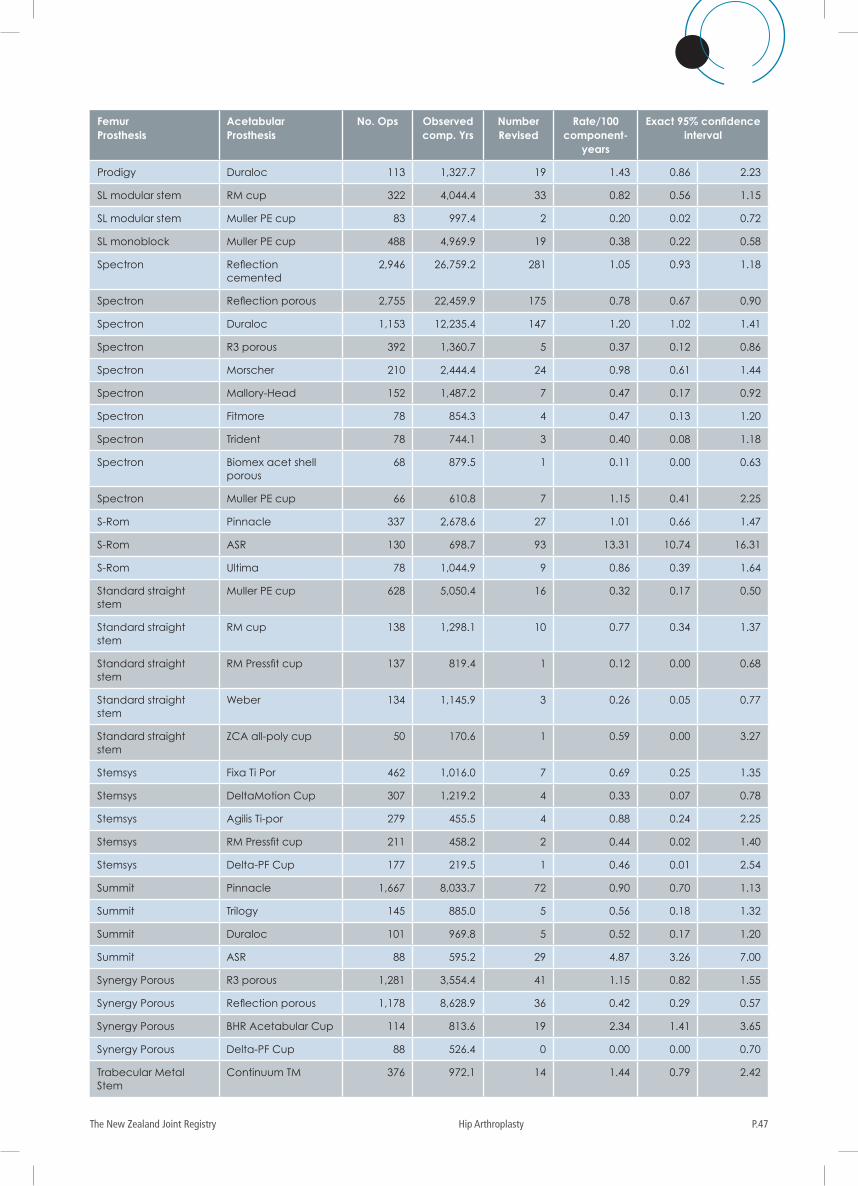
P.47The New Zealand Joint Registry Hip Arthroplasty
Femur Prosthesis
Acetabular Prosthesis
No. Ops Observed comp. Yrs
Number Revised
Rate/100 component-
years
Exact 95% confidence interval
Prodigy Duraloc 113 1,327.7 19 1.43 0.86 2.23
SL modular stem RM cup 322 4,044.4 33 0.82 0.56 1.15
SL modular stem Muller PE cup 83 997.4 2 0.20 0.02 0.72
SL monoblock Muller PE cup 488 4,969.9 19 0.38 0.22 0.58
Spectron Reflection cemented
2,946 26,759.2 281 1.05 0.93 1.18
Spectron Reflection porous 2,755 22,459.9 175 0.78 0.67 0.90
Spectron Duraloc 1,153 12,235.4 147 1.20 1.02 1.41
Spectron R3 porous 392 1,360.7 5 0.37 0.12 0.86
Spectron Morscher 210 2,444.4 24 0.98 0.61 1.44
Spectron Mallory-Head 152 1,487.2 7 0.47 0.17 0.92
Spectron Fitmore 78 854.3 4 0.47 0.13 1.20
Spectron Trident 78 744.1 3 0.40 0.08 1.18
Spectron Biomex acet shell porous
68 879.5 1 0.11 0.00 0.63
Spectron Muller PE cup 66 610.8 7 1.15 0.41 2.25
S-Rom Pinnacle 337 2,678.6 27 1.01 0.66 1.47
S-Rom ASR 130 698.7 93 13.31 10.74 16.31
S-Rom Ultima 78 1,044.9 9 0.86 0.39 1.64
Standard straight stem
Muller PE cup 628 5,050.4 16 0.32 0.17 0.50
Standard straight stem
RM cup 138 1,298.1 10 0.77 0.34 1.37
Standard straight stem
RM Pressfit cup 137 819.4 1 0.12 0.00 0.68
Standard straight stem
Weber 134 1,145.9 3 0.26 0.05 0.77
Standard straight stem
ZCA all-poly cup 50 170.6 1 0.59 0.00 3.27
Stemsys Fixa Ti Por 462 1,016.0 7 0.69 0.25 1.35
Stemsys DeltaMotion Cup 307 1,219.2 4 0.33 0.07 0.78
Stemsys Agilis Ti-por 279 455.5 4 0.88 0.24 2.25
Stemsys RM Pressfit cup 211 458.2 2 0.44 0.02 1.40
Stemsys Delta-PF Cup 177 219.5 1 0.46 0.01 2.54
Summit Pinnacle 1,667 8,033.7 72 0.90 0.70 1.13
Summit Trilogy 145 885.0 5 0.56 0.18 1.32
Summit Duraloc 101 969.8 5 0.52 0.17 1.20
Summit ASR 88 595.2 29 4.87 3.26 7.00
Synergy Porous R3 porous 1,281 3,554.4 41 1.15 0.82 1.55
Synergy Porous Reflection porous 1,178 8,628.9 36 0.42 0.29 0.57
Synergy Porous BHR Acetabular Cup 114 813.6 19 2.34 1.41 3.65
Synergy Porous Delta-PF Cup 88 526.4 0 0.00 0.00 0.70
Trabecular Metal Stem
Continuum TM 376 972.1 14 1.44 0.79 2.42
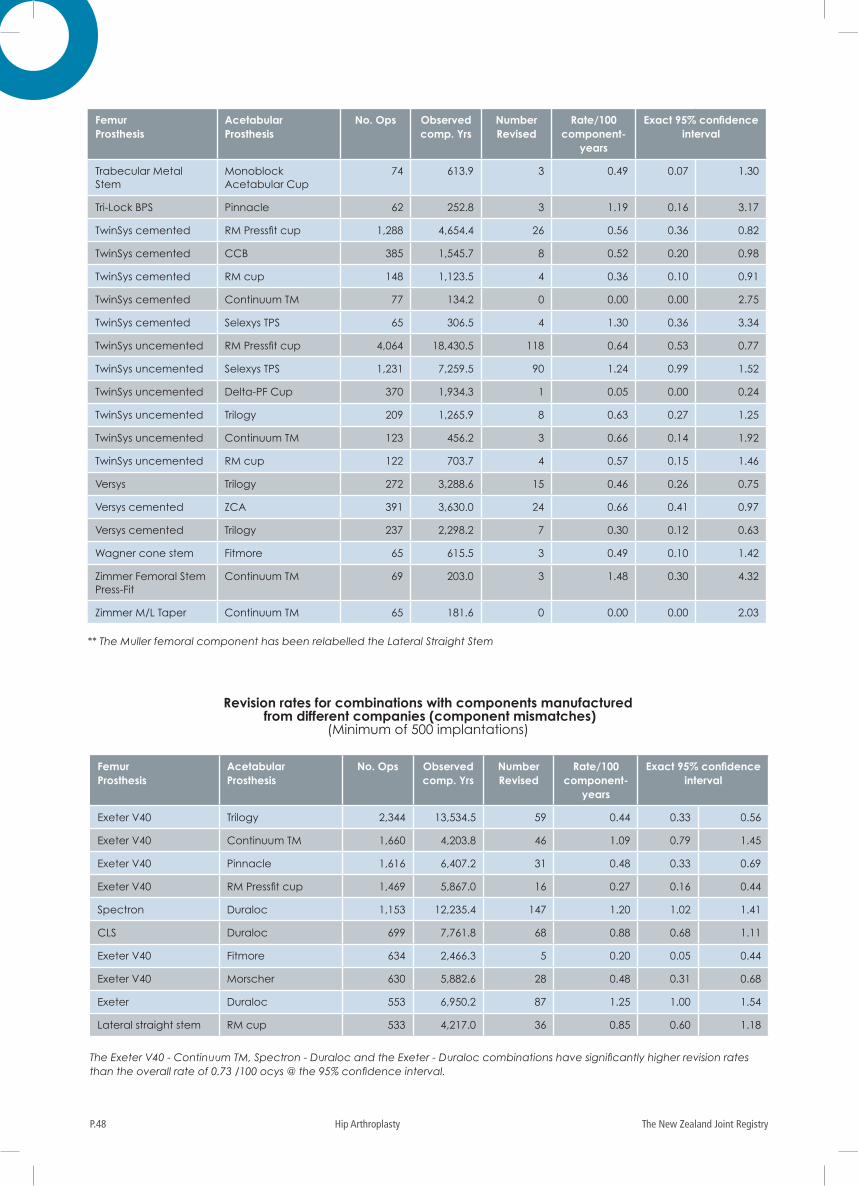
The New Zealand Joint RegistryP.48 Hip Arthroplasty
Femur Prosthesis
Acetabular Prosthesis
No. Ops Observed comp. Yrs
Number Revised
Rate/100 component-
years
Exact 95% confidence interval
Trabecular Metal Stem
Monoblock Acetabular Cup
74 613.9 3 0.49 0.07 1.30
Tri-Lock BPS Pinnacle 62 252.8 3 1.19 0.16 3.17
TwinSys cemented RM Pressfit cup 1,288 4,654.4 26 0.56 0.36 0.82
TwinSys cemented CCB 385 1,545.7 8 0.52 0.20 0.98
TwinSys cemented RM cup 148 1,123.5 4 0.36 0.10 0.91
TwinSys cemented Continuum TM 77 134.2 0 0.00 0.00 2.75
TwinSys cemented Selexys TPS 65 306.5 4 1.30 0.36 3.34
TwinSys uncemented RM Pressfit cup 4,064 18,430.5 118 0.64 0.53 0.77
TwinSys uncemented Selexys TPS 1,231 7,259.5 90 1.24 0.99 1.52
TwinSys uncemented Delta-PF Cup 370 1,934.3 1 0.05 0.00 0.24
TwinSys uncemented Trilogy 209 1,265.9 8 0.63 0.27 1.25
TwinSys uncemented Continuum TM 123 456.2 3 0.66 0.14 1.92
TwinSys uncemented RM cup 122 703.7 4 0.57 0.15 1.46
Versys Trilogy 272 3,288.6 15 0.46 0.26 0.75
Versys cemented ZCA 391 3,630.0 24 0.66 0.41 0.97
Versys cemented Trilogy 237 2,298.2 7 0.30 0.12 0.63
Wagner cone stem Fitmore 65 615.5 3 0.49 0.10 1.42
Zimmer Femoral Stem Press-Fit
Continuum TM 69 203.0 3 1.48 0.30 4.32
Zimmer M/L Taper Continuum TM 65 181.6 0 0.00 0.00 2.03
** The Muller femoral component has been relabelled the Lateral Straight Stem
Revision rates for combinations with components manufactured from different companies (component mismatches)
(Minimum of 500 implantations)
Femur Prosthesis
Acetabular Prosthesis
No. Ops Observed comp. Yrs
Number Revised
Rate/100 component-
years
Exact 95% confidence interval
Exeter V40 Trilogy 2,344 13,534.5 59 0.44 0.33 0.56
Exeter V40 Continuum TM 1,660 4,203.8 46 1.09 0.79 1.45
Exeter V40 Pinnacle 1,616 6,407.2 31 0.48 0.33 0.69
Exeter V40 RM Pressfit cup 1,469 5,867.0 16 0.27 0.16 0.44
Spectron Duraloc 1,153 12,235.4 147 1.20 1.02 1.41
CLS Duraloc 699 7,761.8 68 0.88 0.68 1.11
Exeter V40 Fitmore 634 2,466.3 5 0.20 0.05 0.44
Exeter V40 Morscher 630 5,882.6 28 0.48 0.31 0.68
Exeter Duraloc 553 6,950.2 87 1.25 1.00 1.54
Lateral straight stem RM cup 533 4,217.0 36 0.85 0.60 1.18
The Exeter V40 - Continuum TM, Spectron - Duraloc and the Exeter - Duraloc combinations have significantly higher revision rates than the overall rate of 0.73 /100 ocys @ the 95% confidence interval.
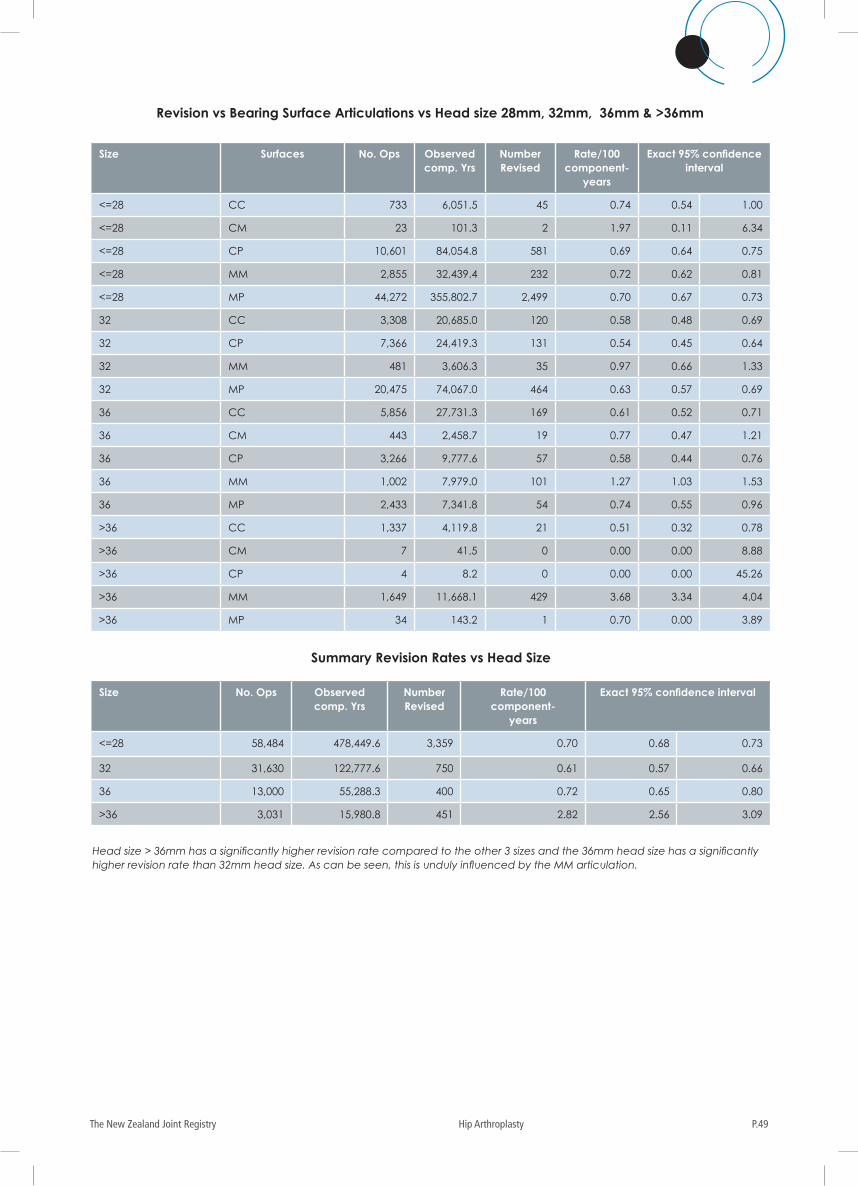
P.49The New Zealand Joint Registry Hip Arthroplasty
Revision vs Bearing Surface Articulations vs Head size 28mm, 32mm, 36mm & >36mm
Size Surfaces No. Ops Observed comp. Yrs
Number Revised
Rate/100 component-
years
Exact 95% confidence interval
<=28 CC 733 6,051.5 45 0.74 0.54 1.00
<=28 CM 23 101.3 2 1.97 0.11 6.34
<=28 CP 10,601 84,054.8 581 0.69 0.64 0.75
<=28 MM 2,855 32,439.4 232 0.72 0.62 0.81
<=28 MP 44,272 355,802.7 2,499 0.70 0.67 0.73
32 CC 3,308 20,685.0 120 0.58 0.48 0.69
32 CP 7,366 24,419.3 131 0.54 0.45 0.64
32 MM 481 3,606.3 35 0.97 0.66 1.33
32 MP 20,475 74,067.0 464 0.63 0.57 0.69
36 CC 5,856 27,731.3 169 0.61 0.52 0.71
36 CM 443 2,458.7 19 0.77 0.47 1.21
36 CP 3,266 9,777.6 57 0.58 0.44 0.76
36 MM 1,002 7,979.0 101 1.27 1.03 1.53
36 MP 2,433 7,341.8 54 0.74 0.55 0.96
>36 CC 1,337 4,119.8 21 0.51 0.32 0.78
>36 CM 7 41.5 0 0.00 0.00 8.88
>36 CP 4 8.2 0 0.00 0.00 45.26
>36 MM 1,649 11,668.1 429 3.68 3.34 4.04
>36 MP 34 143.2 1 0.70 0.00 3.89
Summary Revision Rates vs Head Size
Size No. Ops Observed comp. Yrs
Number Revised
Rate/100 component-
years
Exact 95% confidence interval
<=28 58,484 478,449.6 3,359 0.70 0.68 0.73
32 31,630 122,777.6 750 0.61 0.57 0.66
36 13,000 55,288.3 400 0.72 0.65 0.80
>36 3,031 15,980.8 451 2.82 2.56 3.09
Head size > 36mm has a significantly higher revision rate compared to the other 3 sizes and the 36mm head size has a significantly higher revision rate than 32mm head size. As can be seen, this is unduly influenced by the MM articulation.
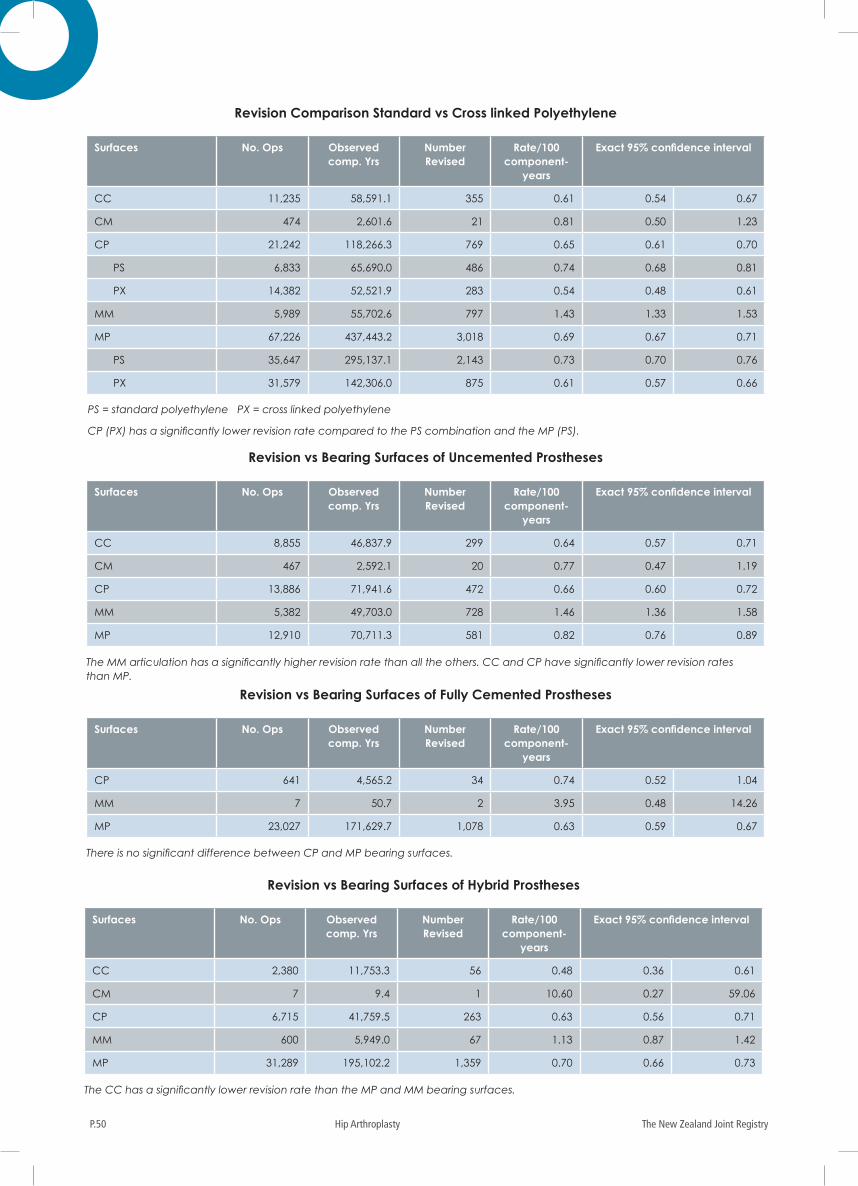
The New Zealand Joint RegistryP.50 Hip Arthroplasty
Revision Comparison Standard vs Cross linked Polyethylene
Revision vs Bearing Surfaces of Uncemented Prostheses
Revision vs Bearing Surfaces of Fully Cemented Prostheses
Surfaces No. Ops Observed comp. Yrs
Number Revised
Rate/100 component-
years
Exact 95% confidence interval
CC 11,235 58,591.1 355 0.61 0.54 0.67
CM 474 2,601.6 21 0.81 0.50 1.23
CP 21,242 118,266.3 769 0.65 0.61 0.70
PS 6,833 65,690.0 486 0.74 0.68 0.81
PX 14,382 52,521.9 283 0.54 0.48 0.61
MM 5,989 55,702.6 797 1.43 1.33 1.53
MP 67,226 437,443.2 3,018 0.69 0.67 0.71
PS 35,647 295,137.1 2,143 0.73 0.70 0.76
PX 31,579 142,306.0 875 0.61 0.57 0.66
Surfaces No. Ops Observed comp. Yrs
Number Revised
Rate/100 component-
years
Exact 95% confidence interval
CC 8,855 46,837.9 299 0.64 0.57 0.71
CM 467 2,592.1 20 0.77 0.47 1.19
CP 13,886 71,941.6 472 0.66 0.60 0.72
MM 5,382 49,703.0 728 1.46 1.36 1.58
MP 12,910 70,711.3 581 0.82 0.76 0.89
Surfaces No. Ops Observed comp. Yrs
Number Revised
Rate/100 component-
years
Exact 95% confidence interval
CP 641 4,565.2 34 0.74 0.52 1.04
MM 7 50.7 2 3.95 0.48 14.26
MP 23,027 171,629.7 1,078 0.63 0.59 0.67
PS = standard polyethylene PX = cross linked polyethylene
CP (PX) has a significantly lower revision rate compared to the PS combination and the MP (PS).
The MM articulation has a significantly higher revision rate than all the others. CC and CP have significantly lower revision rates than MP.
There is no significant difference between CP and MP bearing surfaces.
Revision vs Bearing Surfaces of Hybrid Prostheses
Surfaces No. Ops Observed comp. Yrs
Number Revised
Rate/100 component-
years
Exact 95% confidence interval
CC 2,380 11,753.3 56 0.48 0.36 0.61
CM 7 9.4 1 10.60 0.27 59.06
CP 6,715 41,759.5 263 0.63 0.56 0.71
MM 600 5,949.0 67 1.13 0.87 1.42
MP 31,289 195,102.2 1,359 0.70 0.66 0.73
The CC has a significantly lower revision rate than the MP and MM bearing surfaces.
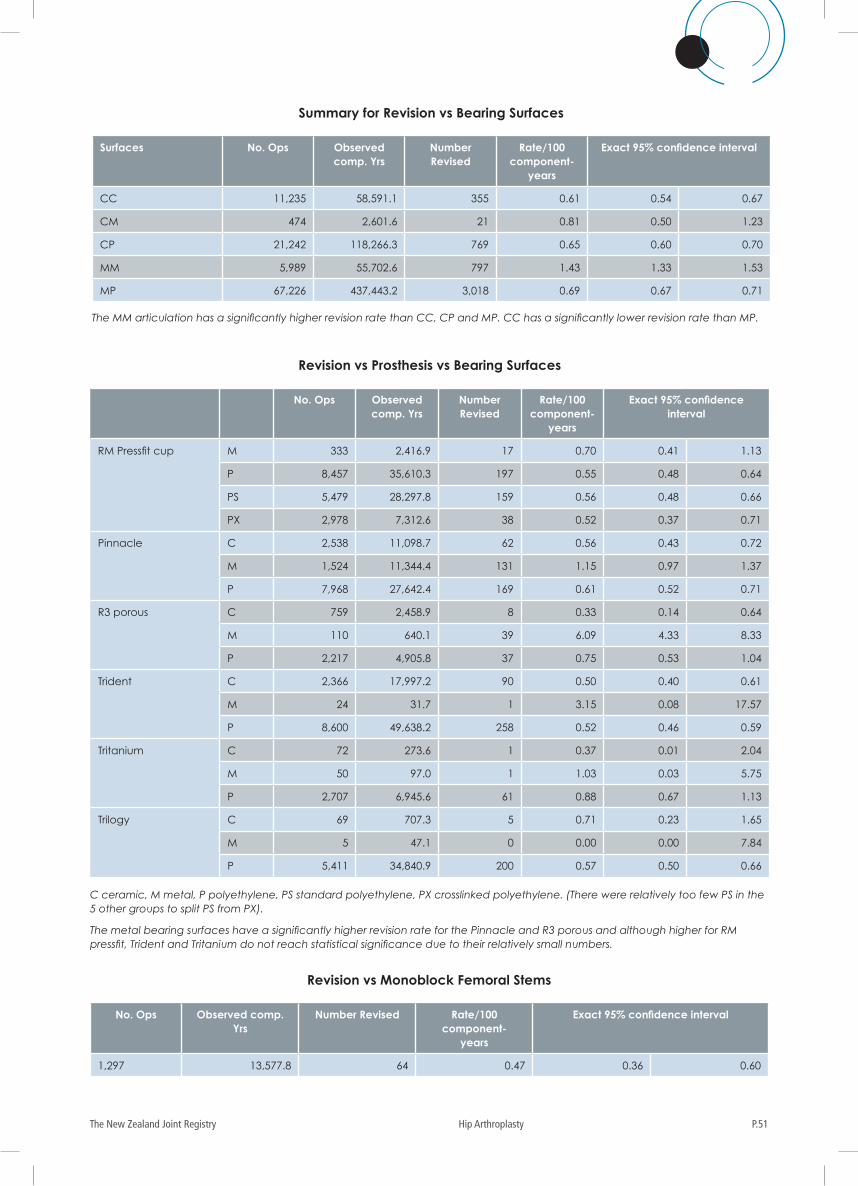
P.51The New Zealand Joint Registry Hip Arthroplasty
Summary for Revision vs Bearing Surfaces
Revision vs Monoblock Femoral Stems
Surfaces No. Ops Observed comp. Yrs
Number Revised
Rate/100 component-
years
Exact 95% confidence interval
CC 11,235 58,591.1 355 0.61 0.54 0.67
CM 474 2,601.6 21 0.81 0.50 1.23
CP 21,242 118,266.3 769 0.65 0.60 0.70
MM 5,989 55,702.6 797 1.43 1.33 1.53
MP 67,226 437,443.2 3,018 0.69 0.67 0.71
No. Ops Observed comp. Yrs
Number Revised Rate/100 component-
years
Exact 95% confidence interval
1,297 13,577.8 64 0.47 0.36 0.60
The MM articulation has a significantly higher revision rate than CC, CP and MP. CC has a significantly lower revision rate than MP.
Revision vs Prosthesis vs Bearing Surfaces
No. Ops Observed comp. Yrs
Number Revised
Rate/100 component-
years
Exact 95% confidence interval
RM Pressfit cup M 333 2,416.9 17 0.70 0.41 1.13
P 8,457 35,610.3 197 0.55 0.48 0.64
PS 5,479 28,297.8 159 0.56 0.48 0.66
PX 2,978 7,312.6 38 0.52 0.37 0.71
Pinnacle C 2,538 11,098.7 62 0.56 0.43 0.72
M 1,524 11,344.4 131 1.15 0.97 1.37
P 7,968 27,642.4 169 0.61 0.52 0.71
R3 porous C 759 2,458.9 8 0.33 0.14 0.64
M 110 640.1 39 6.09 4.33 8.33
P 2,217 4,905.8 37 0.75 0.53 1.04
Trident C 2,366 17,997.2 90 0.50 0.40 0.61
M 24 31.7 1 3.15 0.08 17.57
P 8,600 49,638.2 258 0.52 0.46 0.59
Tritanium C 72 273.6 1 0.37 0.01 2.04
M 50 97.0 1 1.03 0.03 5.75
P 2,707 6,945.6 61 0.88 0.67 1.13
Trilogy C 69 707.3 5 0.71 0.23 1.65
M 5 47.1 0 0.00 0.00 7.84
P 5,411 34,840.9 200 0.57 0.50 0.66
C ceramic, M metal, P polyethylene, PS standard polyethylene, PX crosslinked polyethylene. (There were relatively too few PS in the 5 other groups to split PS from PX).
The metal bearing surfaces have a significantly higher revision rate for the Pinnacle and R3 porous and although higher for RM pressfit, Trident and Tritanium do not reach statistical significance due to their relatively small numbers.
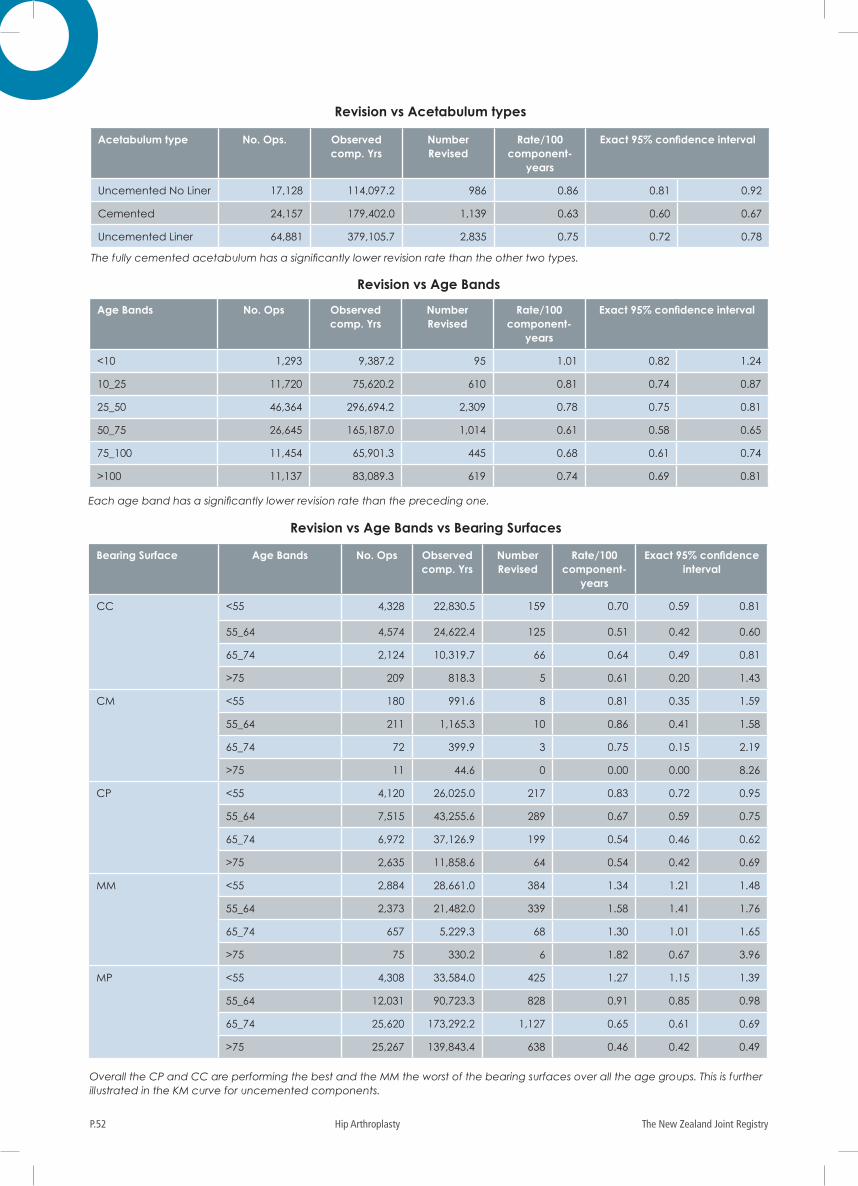
The New Zealand Joint RegistryP.52 Hip Arthroplasty
Revision vs Age Bands
Revision vs Age Bands vs Bearing Surfaces
Revision vs Acetabulum types
Age Bands No. Ops Observed comp. Yrs
Number Revised
Rate/100 component-
years
Exact 95% confidence interval
<10 1,293 9,387.2 95 1.01 0.82 1.24
10_25 11,720 75,620.2 610 0.81 0.74 0.87
25_50 46,364 296,694.2 2,309 0.78 0.75 0.81
50_75 26,645 165,187.0 1,014 0.61 0.58 0.65
75_100 11,454 65,901.3 445 0.68 0.61 0.74
>100 11,137 83,089.3 619 0.74 0.69 0.81
Acetabulum type No. Ops. Observed comp. Yrs
Number Revised
Rate/100 component-
years
Exact 95% confidence interval
Uncemented No Liner 17,128 114,097.2 986 0.86 0.81 0.92
Cemented 24,157 179,402.0 1,139 0.63 0.60 0.67
Uncemented Liner 64,881 379,105.7 2,835 0.75 0.72 0.78
Each age band has a significantly lower revision rate than the preceding one.
The fully cemented acetabulum has a significantly lower revision rate than the other two types.
Bearing Surface Age Bands No. Ops Observed comp. Yrs
Number Revised
Rate/100 component-
years
Exact 95% confidence interval
CC <55 4,328 22,830.5 159 0.70 0.59 0.81
55_64 4,574 24,622.4 125 0.51 0.42 0.60
65_74 2,124 10,319.7 66 0.64 0.49 0.81
>75 209 818.3 5 0.61 0.20 1.43
CM <55 180 991.6 8 0.81 0.35 1.59
55_64 211 1,165.3 10 0.86 0.41 1.58
65_74 72 399.9 3 0.75 0.15 2.19
>75 11 44.6 0 0.00 0.00 8.26
CP <55 4,120 26,025.0 217 0.83 0.72 0.95
55_64 7,515 43,255.6 289 0.67 0.59 0.75
65_74 6,972 37,126.9 199 0.54 0.46 0.62
>75 2,635 11,858.6 64 0.54 0.42 0.69
MM <55 2,884 28,661.0 384 1.34 1.21 1.48
55_64 2,373 21,482.0 339 1.58 1.41 1.76
65_74 657 5,229.3 68 1.30 1.01 1.65
>75 75 330.2 6 1.82 0.67 3.96
MP <55 4,308 33,584.0 425 1.27 1.15 1.39
55_64 12,031 90,723.3 828 0.91 0.85 0.98
65_74 25,620 173,292.2 1,127 0.65 0.61 0.69
>75 25,267 139,843.4 638 0.46 0.42 0.49
Overall the CP and CC are performing the best and the MM the worst of the bearing surfaces over all the age groups. This is further illustrated in the KM curve for uncemented components.
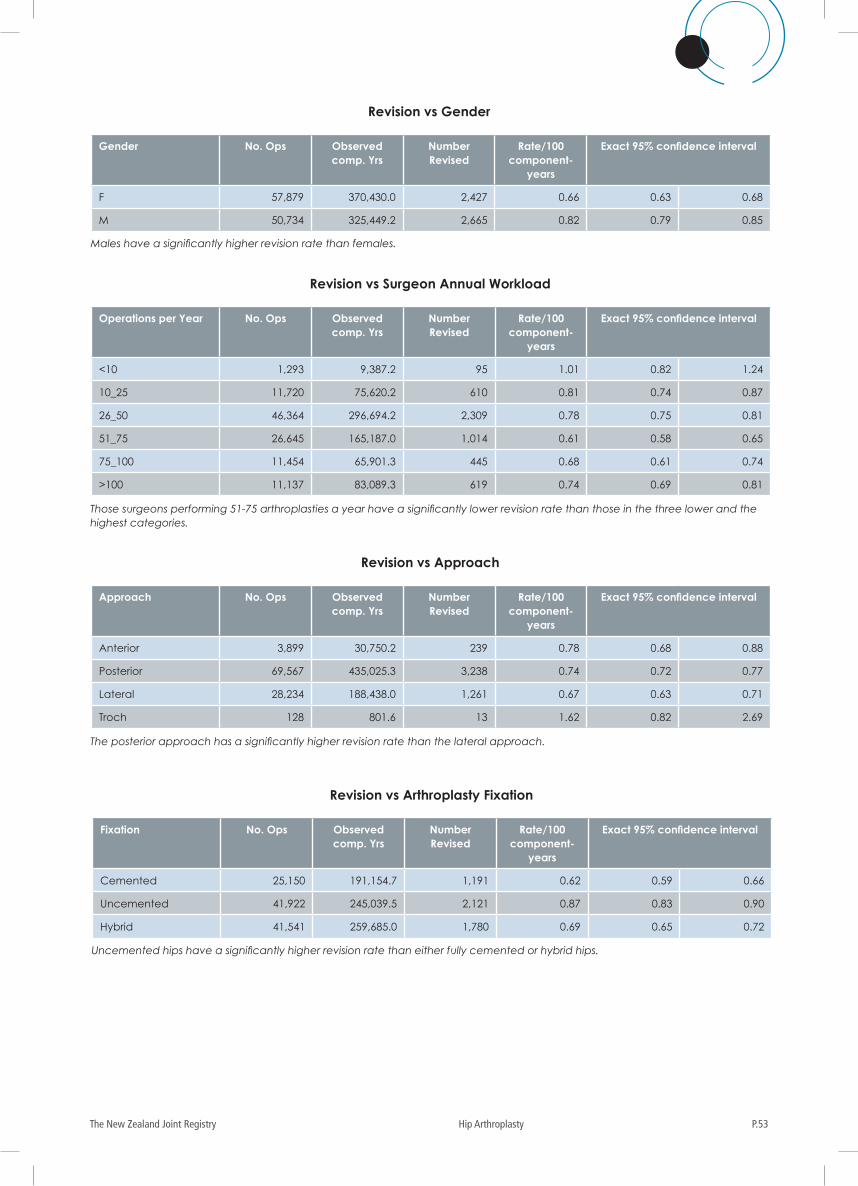
P.53The New Zealand Joint Registry Hip Arthroplasty
Revision vs Gender
Gender No. Ops Observed comp. Yrs
Number Revised
Rate/100 component-
years
Exact 95% confidence interval
F 57,879 370,430.0 2,427 0.66 0.63 0.68
M 50,734 325,449.2 2,665 0.82 0.79 0.85
Males have a significantly higher revision rate than females.
Revision vs Surgeon Annual Workload
Revision vs Approach
Revision vs Arthroplasty Fixation
Operations per Year No. Ops Observed comp. Yrs
Number Revised
Rate/100 component-
years
Exact 95% confidence interval
<10 1,293 9,387.2 95 1.01 0.82 1.24
10_25 11,720 75,620.2 610 0.81 0.74 0.87
26_50 46,364 296,694.2 2,309 0.78 0.75 0.81
51_75 26,645 165,187.0 1,014 0.61 0.58 0.65
75_100 11,454 65,901.3 445 0.68 0.61 0.74
>100 11,137 83,089.3 619 0.74 0.69 0.81
Approach No. Ops Observed comp. Yrs
Number Revised
Rate/100 component-
years
Exact 95% confidence interval
Anterior 3,899 30,750.2 239 0.78 0.68 0.88
Posterior 69,567 435,025.3 3,238 0.74 0.72 0.77
Lateral 28,234 188,438.0 1,261 0.67 0.63 0.71
Troch 128 801.6 13 1.62 0.82 2.69
Fixation No. Ops Observed comp. Yrs
Number Revised
Rate/100 component-
years
Exact 95% confidence interval
Cemented 25,150 191,154.7 1,191 0.62 0.59 0.66
Uncemented 41,922 245,039.5 2,121 0.87 0.83 0.90
Hybrid 41,541 259,685.0 1,780 0.69 0.65 0.72
Those surgeons performing 51-75 arthroplasties a year have a significantly lower revision rate than those in the three lower and the highest categories.
The posterior approach has a significantly higher revision rate than the lateral approach.
Uncemented hips have a significantly higher revision rate than either fully cemented or hybrid hips.
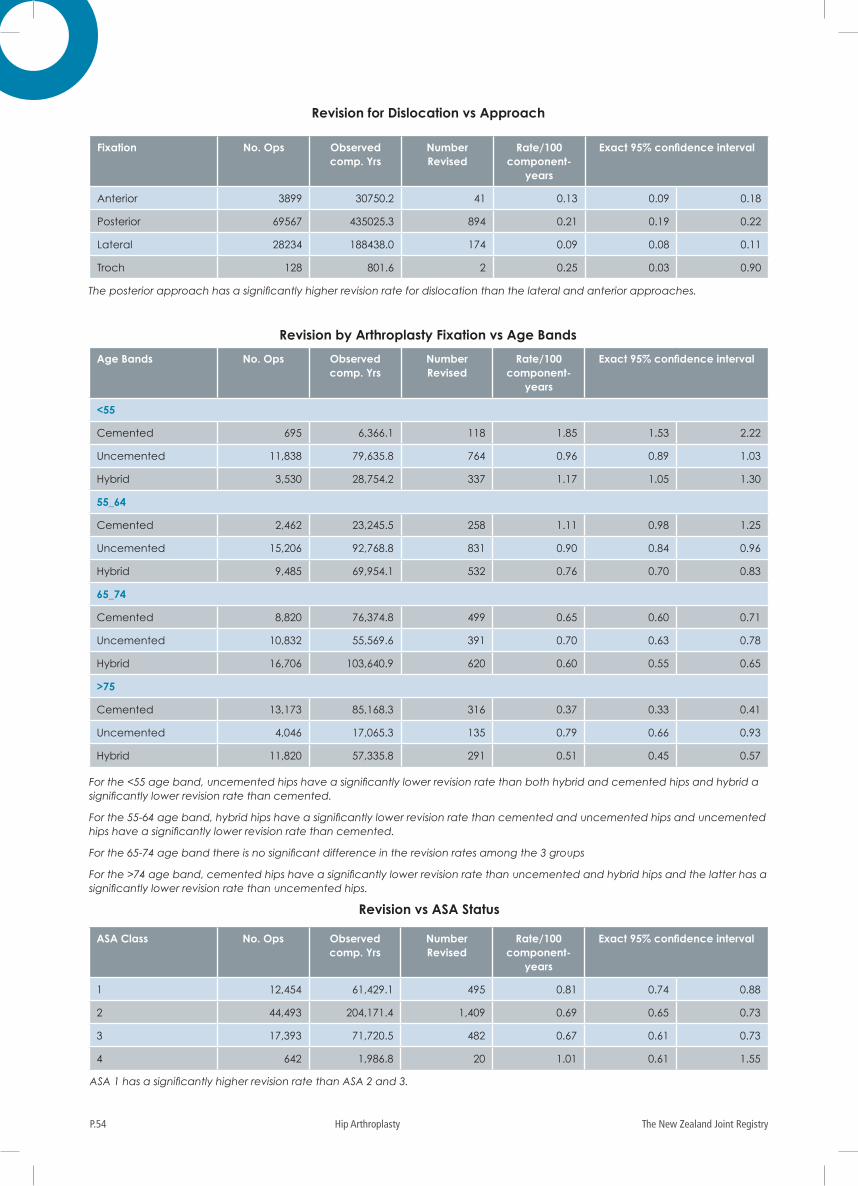
The New Zealand Joint RegistryP.54 Hip Arthroplasty
Revision for Dislocation vs Approach
Fixation No. Ops Observed comp. Yrs
Number Revised
Rate/100 component-
years
Exact 95% confidence interval
Anterior 3899 30750.2 41 0.13 0.09 0.18
Posterior 69567 435025.3 894 0.21 0.19 0.22
Lateral 28234 188438.0 174 0.09 0.08 0.11
Troch 128 801.6 2 0.25 0.03 0.90
The posterior approach has a significantly higher revision rate for dislocation than the lateral and anterior approaches.
Revision by Arthroplasty Fixation vs Age Bands
Revision vs ASA Status
Age Bands No. Ops Observed comp. Yrs
Number Revised
Rate/100 component-
years
Exact 95% confidence interval
<55
Cemented 695 6,366.1 118 1.85 1.53 2.22
Uncemented 11,838 79,635.8 764 0.96 0.89 1.03
Hybrid 3,530 28,754.2 337 1.17 1.05 1.30
55_64
Cemented 2,462 23,245.5 258 1.11 0.98 1.25
Uncemented 15,206 92,768.8 831 0.90 0.84 0.96
Hybrid 9,485 69,954.1 532 0.76 0.70 0.83
65_74
Cemented 8,820 76,374.8 499 0.65 0.60 0.71
Uncemented 10,832 55,569.6 391 0.70 0.63 0.78
Hybrid 16,706 103,640.9 620 0.60 0.55 0.65
>75
Cemented 13,173 85,168.3 316 0.37 0.33 0.41
Uncemented 4,046 17,065.3 135 0.79 0.66 0.93
Hybrid 11,820 57,335.8 291 0.51 0.45 0.57
ASA Class No. Ops Observed comp. Yrs
Number Revised
Rate/100 component-
years
Exact 95% confidence interval
1 12,454 61,429.1 495 0.81 0.74 0.88
2 44,493 204,171.4 1,409 0.69 0.65 0.73
3 17,393 71,720.5 482 0.67 0.61 0.73
4 642 1,986.8 20 1.01 0.61 1.55
For the <55 age band, uncemented hips have a significantly lower revision rate than both hybrid and cemented hips and hybrid a significantly lower revision rate than cemented.
For the 55-64 age band, hybrid hips have a significantly lower revision rate than cemented and uncemented hips and uncemented hips have a significantly lower revision rate than cemented.
For the 65-74 age band there is no significant difference in the revision rates among the 3 groups
For the >74 age band, cemented hips have a significantly lower revision rate than uncemented and hybrid hips and the latter has a significantly lower revision rate than uncemented hips.
ASA 1 has a significantly higher revision rate than ASA 2 and 3.
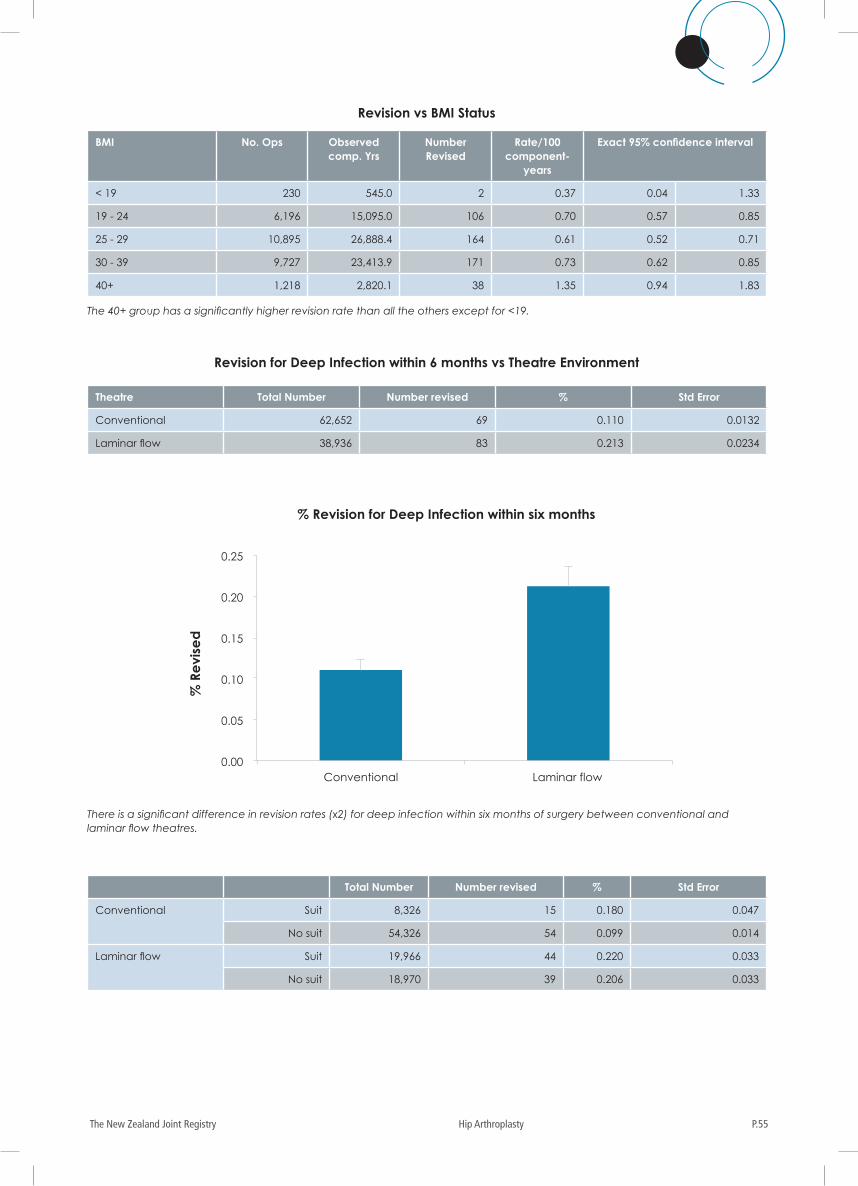
P.55The New Zealand Joint Registry Hip Arthroplasty
Revision for Deep Infection within 6 months vs Theatre Environment
Theatre Total Number Number revised % Std Error
Conventional 62,652 69 0.110 0.0132
Laminar flow 38,936 83 0.213 0.0234
Total Number Number revised % Std Error
Conventional Suit 8,326 15 0.180 0.047
No suit 54,326 54 0.099 0.014
Laminar flow Suit 19,966 44 0.220 0.033
No suit 18,970 39 0.206 0.033
There is a significant difference in revision rates (x2) for deep infection within six months of surgery between conventional and laminar flow theatres.
0.00
0.05
0.10
0.15
0.20
0.25
Conventional Laminar flow
% R
evi
sed
% Revision for Deep Infection within six months
Revision vs BMI Status
BMI No. Ops Observed comp. Yrs
Number Revised
Rate/100 component-
years
Exact 95% confidence interval
< 19 230 545.0 2 0.37 0.04 1.33
19 - 24 6,196 15,095.0 106 0.70 0.57 0.85
25 - 29 10,895 26,888.4 164 0.61 0.52 0.71
30 - 39 9,727 23,413.9 171 0.73 0.62 0.85
40+ 1,218 2,820.1 38 1.35 0.94 1.83
The 40+ group has a significantly higher revision rate than all the others except for <19.
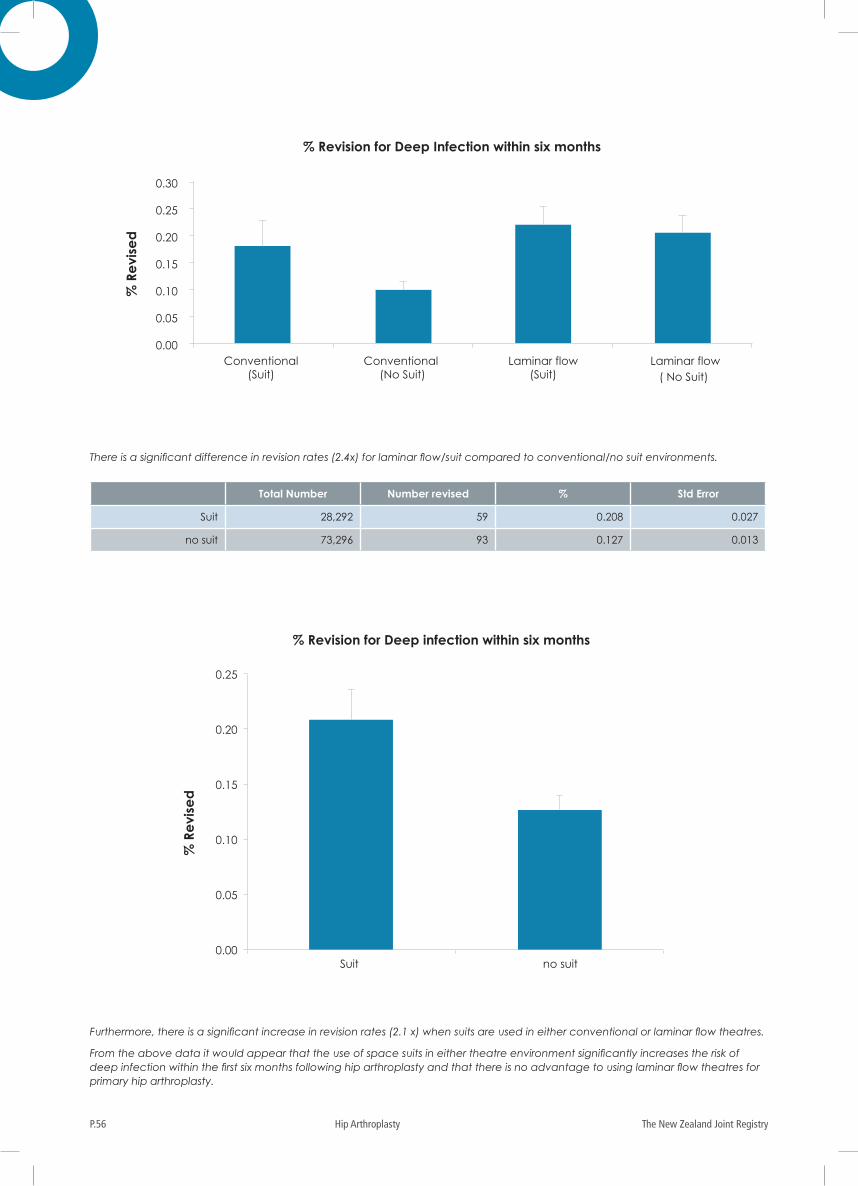
The New Zealand Joint RegistryP.56 Hip Arthroplasty
There is a significant difference in revision rates (2.4x) for laminar flow/suit compared to conventional/no suit environments.
0.00
0.05
0.10
0.15
0.20
0.25
0.30
% R
evi
sed
% Revision for Deep Infection within six months
Conventional (Suit)
Conventional (No Suit)
Laminar flow (Suit)
Laminar flow( No Suit)
Total Number Number revised % Std Error
Suit 28,292 59 0.208 0.027
no suit 73,296 93 0.127 0.013
Furthermore, there is a significant increase in revision rates (2.1 x) when suits are used in either conventional or laminar flow theatres.
From the above data it would appear that the use of space suits in either theatre environment significantly increases the risk of deep infection within the first six months following hip arthroplasty and that there is no advantage to using laminar flow theatres for primary hip arthroplasty.
0.00
0.05
0.10
0.15
0.20
0.25
Suit no suit
% R
evi
sed
% Revision for Deep infection within six months
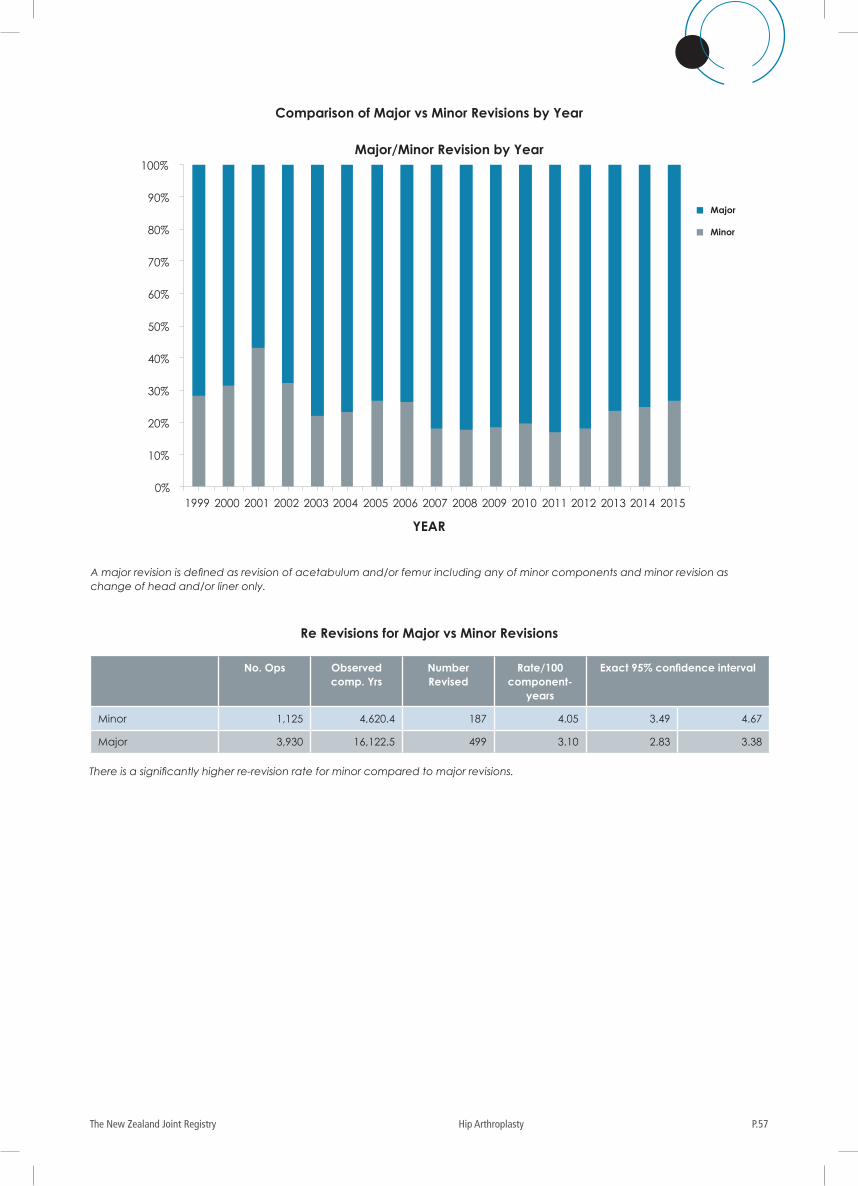
P.57The New Zealand Joint Registry Hip Arthroplasty
Comparison of Major vs Minor Revisions by Year
A major revision is defined as revision of acetabulum and/or femur including any of minor components and minor revision as change of head and/or liner only.
Re Revisions for Major vs Minor Revisions
No. Ops Observed comp. Yrs
Number Revised
Rate/100 component-
years
Exact 95% confidence interval
Minor 1,125 4,620.4 187 4.05 3.49 4.67
Major 3,930 16,122.5 499 3.10 2.83 3.38
There is a significantly higher re-revision rate for minor compared to major revisions.
0%
10%
20%
30%
40%
50%
60%
70%
80%
90%
100%
1999 2000 2001 2002 2003 2004 2005 2006 2007 2008 2009 2010 2011 2012 2013 2014 2015
YEAR
Major/Minor Revision by Year
Major
Minor
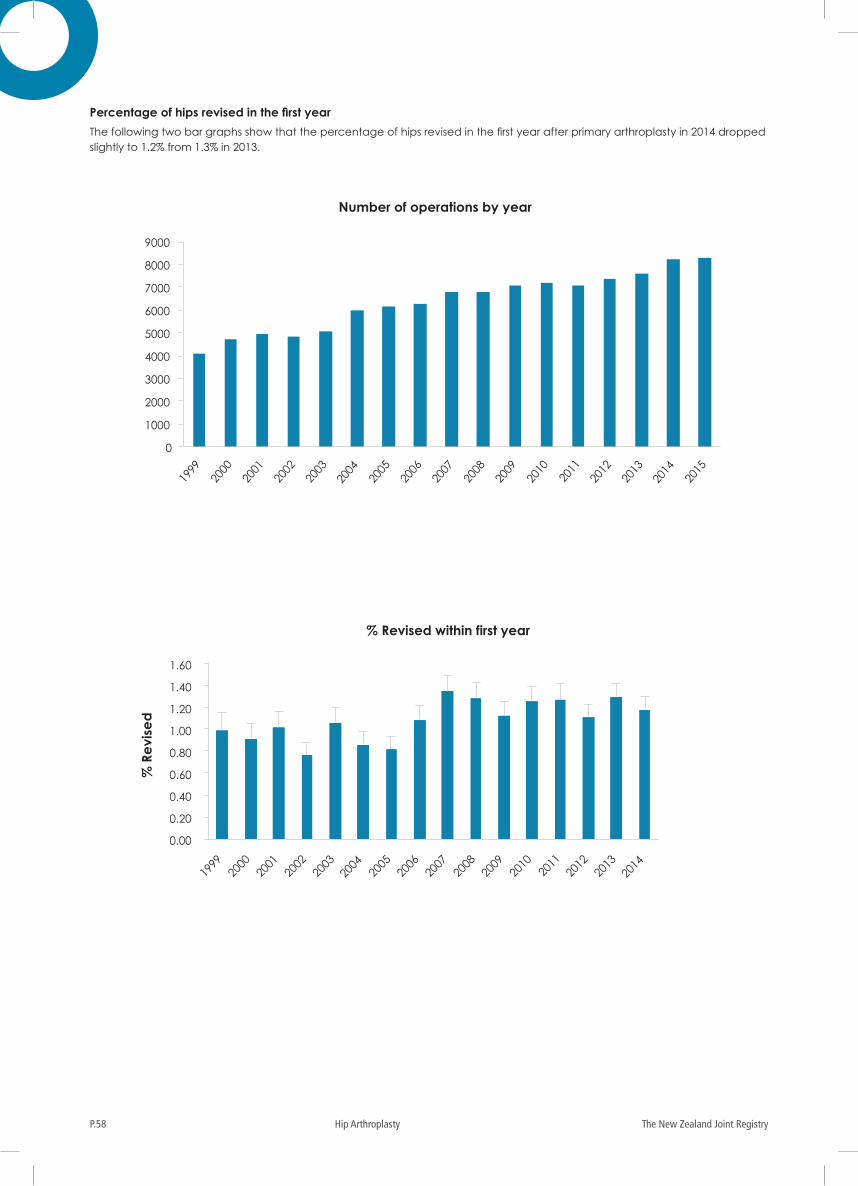
The New Zealand Joint RegistryP.58 Hip Arthroplasty
Percentage of hips revised in the first year
The following two bar graphs show that the percentage of hips revised in the first year after primary arthroplasty in 2014 dropped slightly to 1.2% from 1.3% in 2013.
0
1000
2000
3000
4000
5000
6000
7000
8000
9000
1999
20
00
2001
20
02
2003
20
04
2005
20
06
2007
20
08
2009
20
10
2011
20
12
2013
20
14
2015
Number of operations by year
0.00
0.20
0.40
0.60
0.80
1.00
1.20
1.40
1.60
1999
2000
2001
2002
2003
2004
2005
2006
2007
2008
2009
2010
2011
2012
2013
2014
% R
evi
sed
% Revised within first year
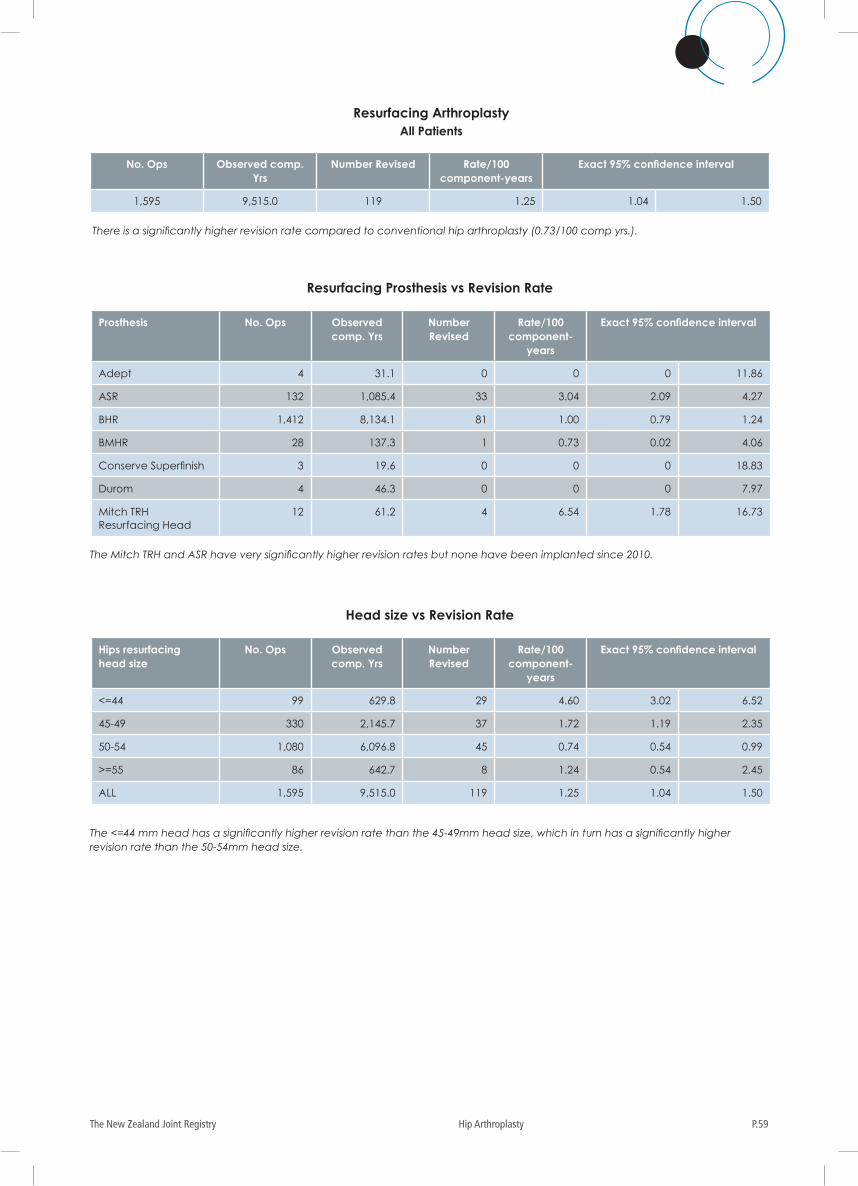
P.59The New Zealand Joint Registry Hip Arthroplasty
Resurfacing ArthroplastyAll Patients
There is a significantly higher revision rate compared to conventional hip arthroplasty (0.73/100 comp yrs.).
No. Ops Observed comp. Yrs
Number Revised Rate/100 component-years
Exact 95% confidence interval
1,595 9,515.0 119 1.25 1.04 1.50
Resurfacing Prosthesis vs Revision Rate
Head size vs Revision Rate
Prosthesis No. Ops Observed comp. Yrs
Number Revised
Rate/100 component-
years
Exact 95% confidence interval
Adept 4 31.1 0 0 0 11.86
ASR 132 1,085.4 33 3.04 2.09 4.27
BHR 1,412 8,134.1 81 1.00 0.79 1.24
BMHR 28 137.3 1 0.73 0.02 4.06
Conserve Superfinish 3 19.6 0 0 0 18.83
Durom 4 46.3 0 0 0 7.97
Mitch TRH Resurfacing Head
12 61.2 4 6.54 1.78 16.73
Hips resurfacing head size
No. Ops Observed comp. Yrs
Number Revised
Rate/100 component-
years
Exact 95% confidence interval
<=44 99 629.8 29 4.60 3.02 6.52
45-49 330 2,145.7 37 1.72 1.19 2.35
50-54 1,080 6,096.8 45 0.74 0.54 0.99
>=55 86 642.7 8 1.24 0.54 2.45
ALL 1,595 9,515.0 119 1.25 1.04 1.50
The Mitch TRH and ASR have very significantly higher revision rates but none have been implanted since 2010.
The <=44 mm head has a significantly higher revision rate than the 45-49mm head size, which in turn has a significantly higher revision rate than the 50-54mm head size.
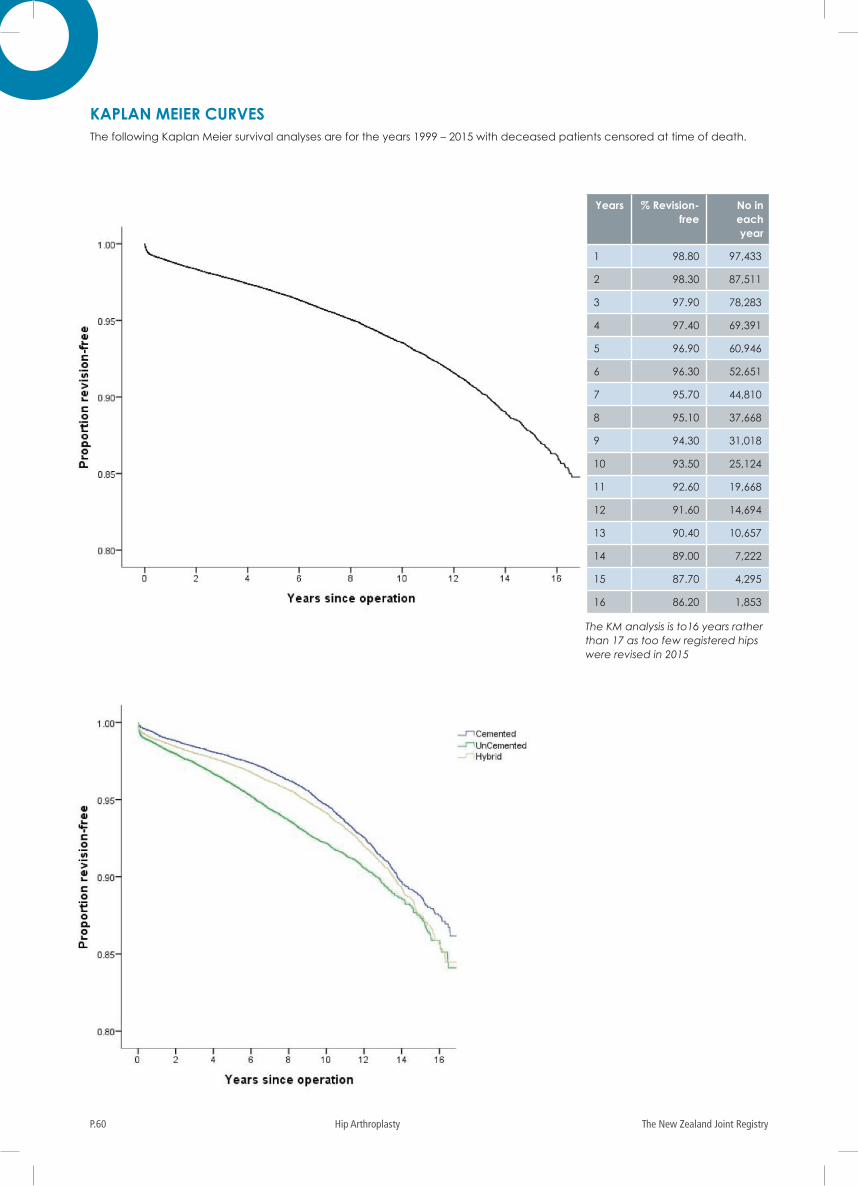
The New Zealand Joint RegistryP.60 Hip Arthroplasty
KAPLAN MEIER CURVESThe following Kaplan Meier survival analyses are for the years 1999 – 2015 with deceased patients censored at time of death.
Years % Revision-free
No in each year
1 98.80 97,433
2 98.30 87,511
3 97.90 78,283
4 97.40 69,391
5 96.90 60,946
6 96.30 52,651
7 95.70 44,810
8 95.10 37,668
9 94.30 31,018
10 93.50 25,124
11 92.60 19,668
12 91.60 14,694
13 90.40 10,657
14 89.00 7,222
15 87.70 4,295
16 86.20 1,853
The KM analysis is to16 years rather than 17 as too few registered hips were revised in 2015
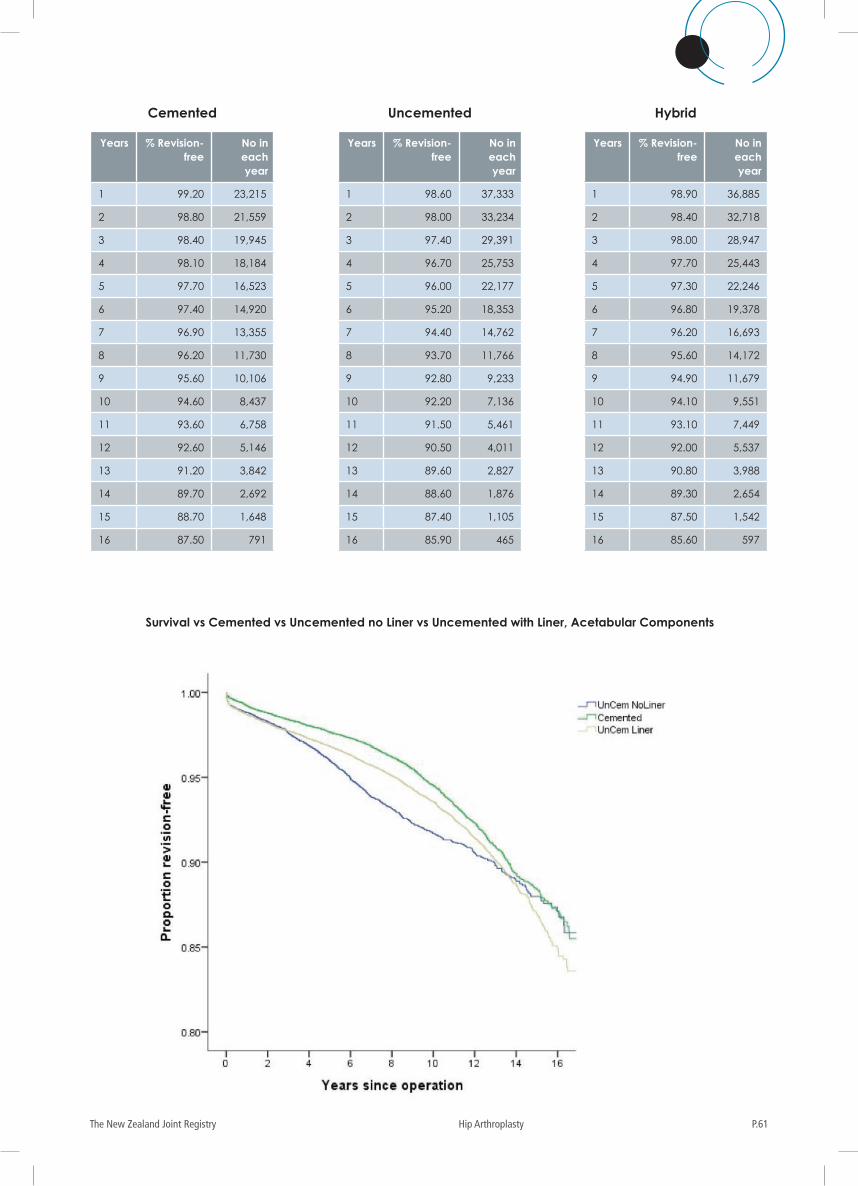
P.61The New Zealand Joint Registry Hip Arthroplasty
Uncemented Hybrid
Years % Revision-free
No in each year
1 98.60 37,333
2 98.00 33,234
3 97.40 29,391
4 96.70 25,753
5 96.00 22,177
6 95.20 18,353
7 94.40 14,762
8 93.70 11,766
9 92.80 9,233
10 92.20 7,136
11 91.50 5,461
12 90.50 4,011
13 89.60 2,827
14 88.60 1,876
15 87.40 1,105
16 85.90 465
Years % Revision-free
No in each year
1 98.90 36,885
2 98.40 32,718
3 98.00 28,947
4 97.70 25,443
5 97.30 22,246
6 96.80 19,378
7 96.20 16,693
8 95.60 14,172
9 94.90 11,679
10 94.10 9,551
11 93.10 7,449
12 92.00 5,537
13 90.80 3,988
14 89.30 2,654
15 87.50 1,542
16 85.60 597
Cemented
Years % Revision-free
No in each year
1 99.20 23,215
2 98.80 21,559
3 98.40 19,945
4 98.10 18,184
5 97.70 16,523
6 97.40 14,920
7 96.90 13,355
8 96.20 11,730
9 95.60 10,106
10 94.60 8,437
11 93.60 6,758
12 92.60 5,146
13 91.20 3,842
14 89.70 2,692
15 88.70 1,648
16 87.50 791
Survival vs Cemented vs Uncemented no Liner vs Uncemented with Liner, Acetabular Components
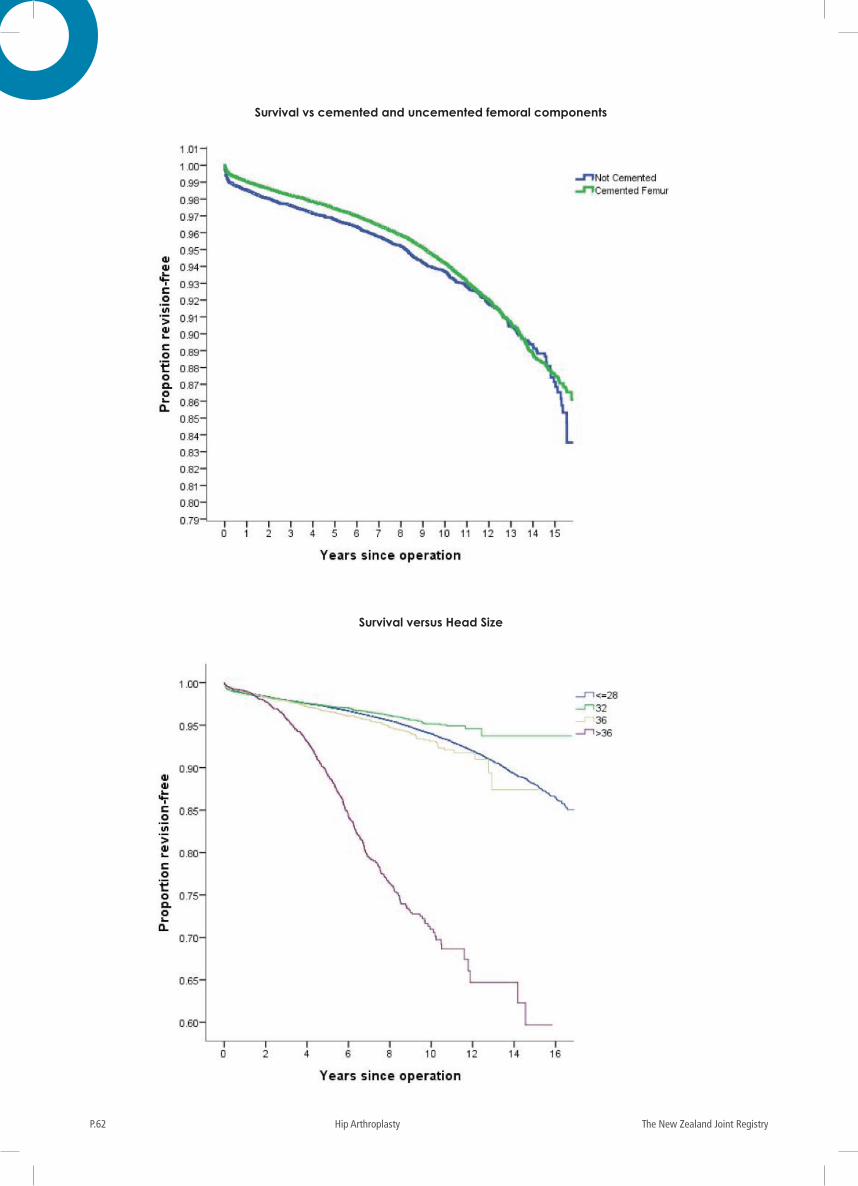
The New Zealand Joint RegistryP.62 Hip Arthroplasty
Survival vs cemented and uncemented femoral components
Survival versus Head Size
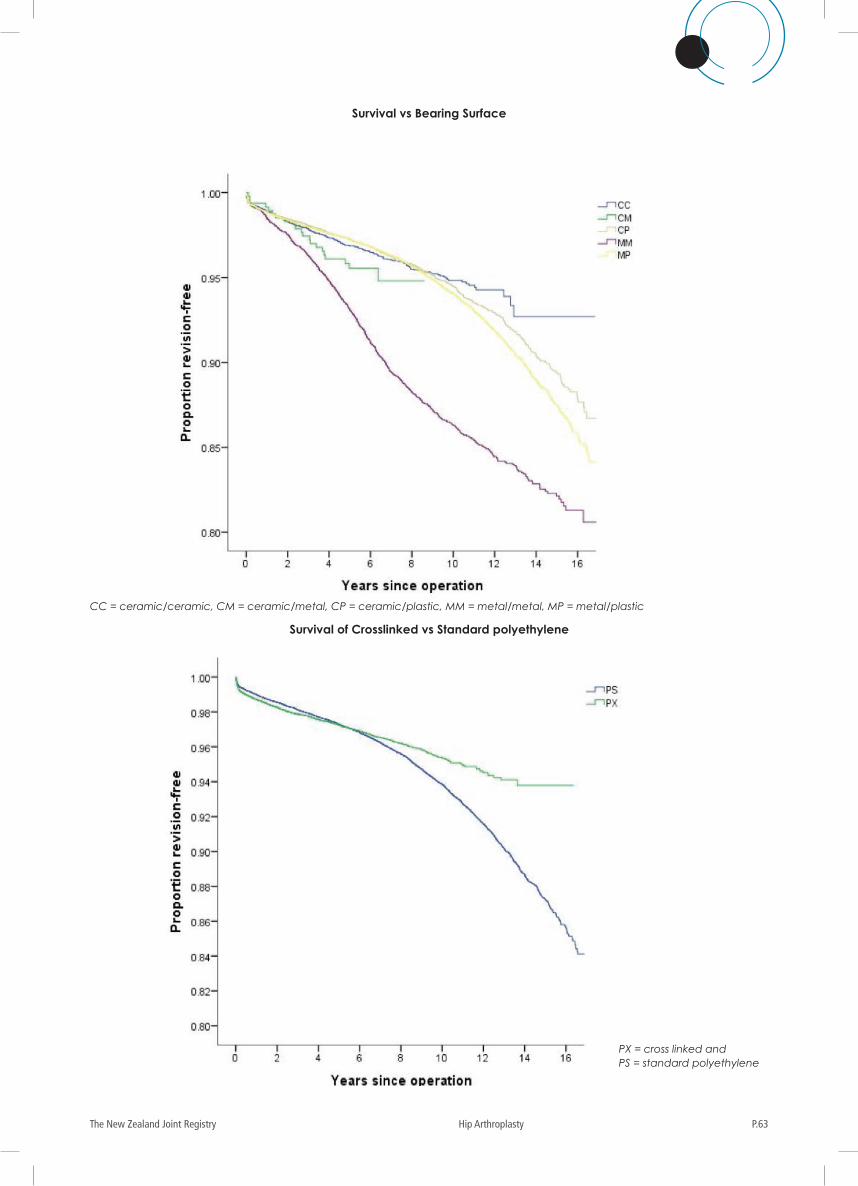
P.63The New Zealand Joint Registry Hip Arthroplasty
Survival vs Bearing Surface
Survival of Crosslinked vs Standard polyethylene
PX = cross linked and PS = standard polyethylene
CC = ceramic/ceramic, CM = ceramic/metal, CP = ceramic/plastic, MM = metal/metal, MP = metal/plastic
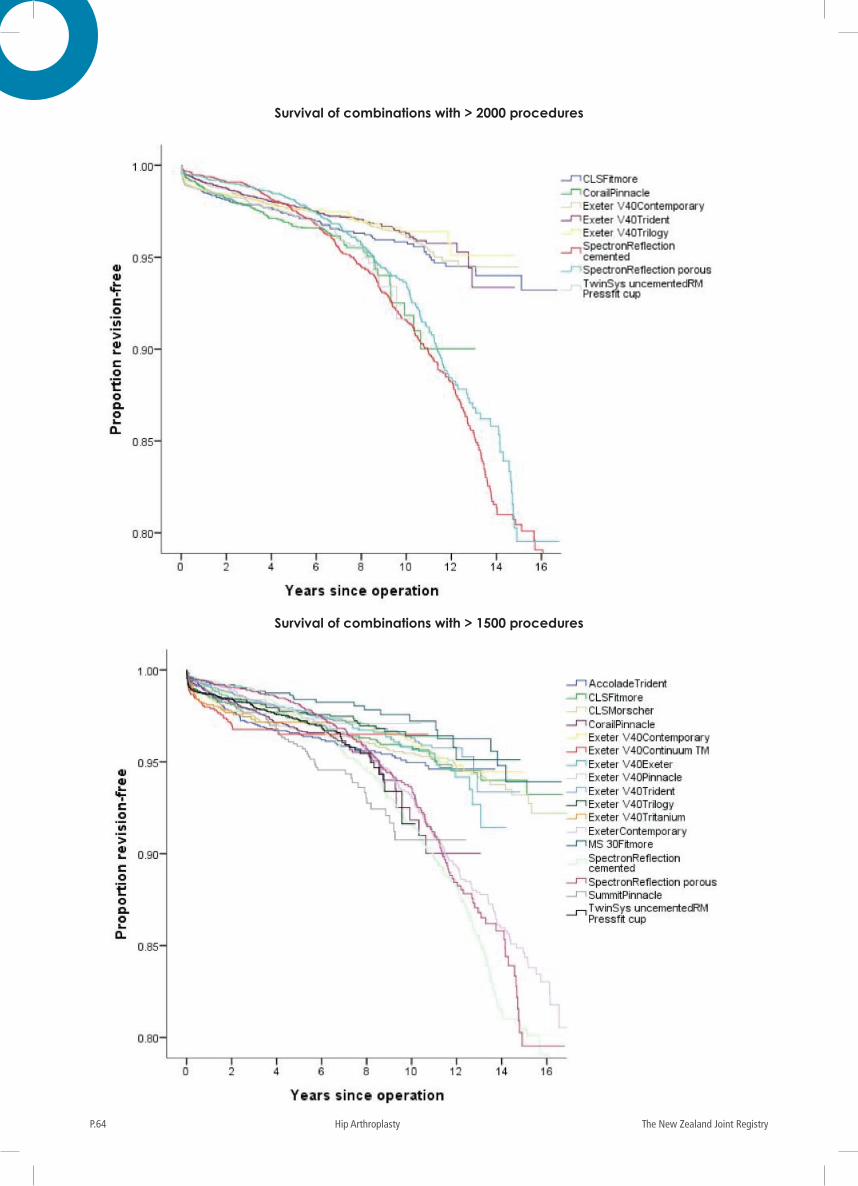
The New Zealand Joint RegistryP.64 Hip Arthroplasty
Survival of combinations with > 2000 procedures
Survival of combinations with > 1500 procedures
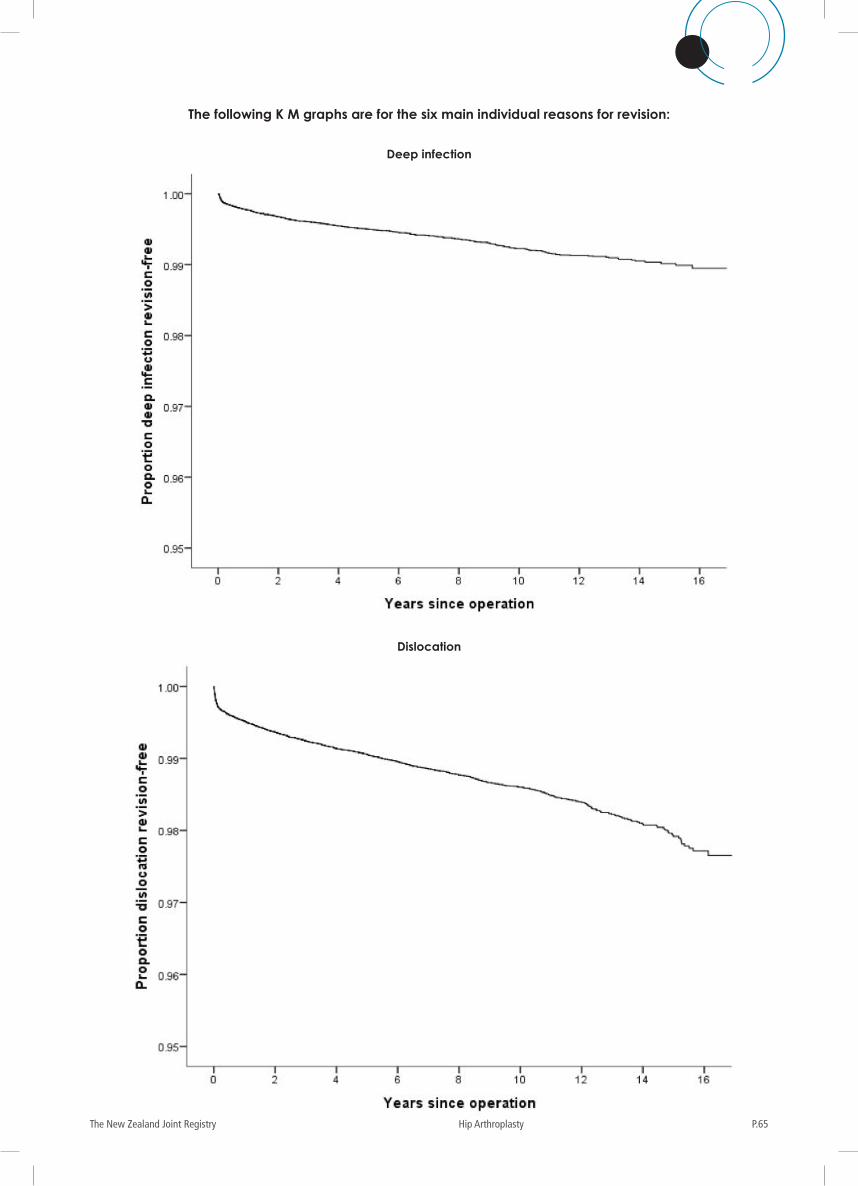
P.65The New Zealand Joint Registry Hip Arthroplasty
Deep infection
Dislocation
The following K M graphs are for the six main individual reasons for revision:
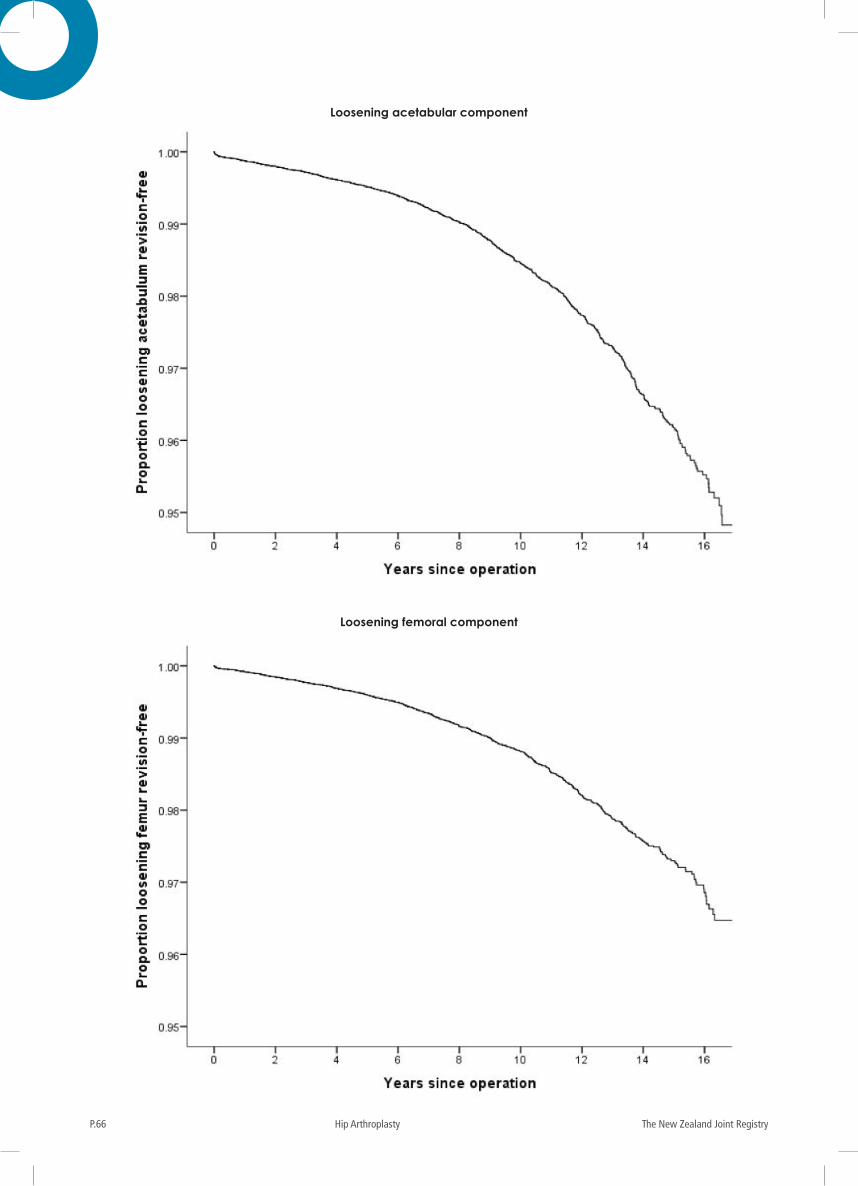
The New Zealand Joint RegistryP.66 Hip Arthroplasty
Loosening acetabular component
Loosening femoral component
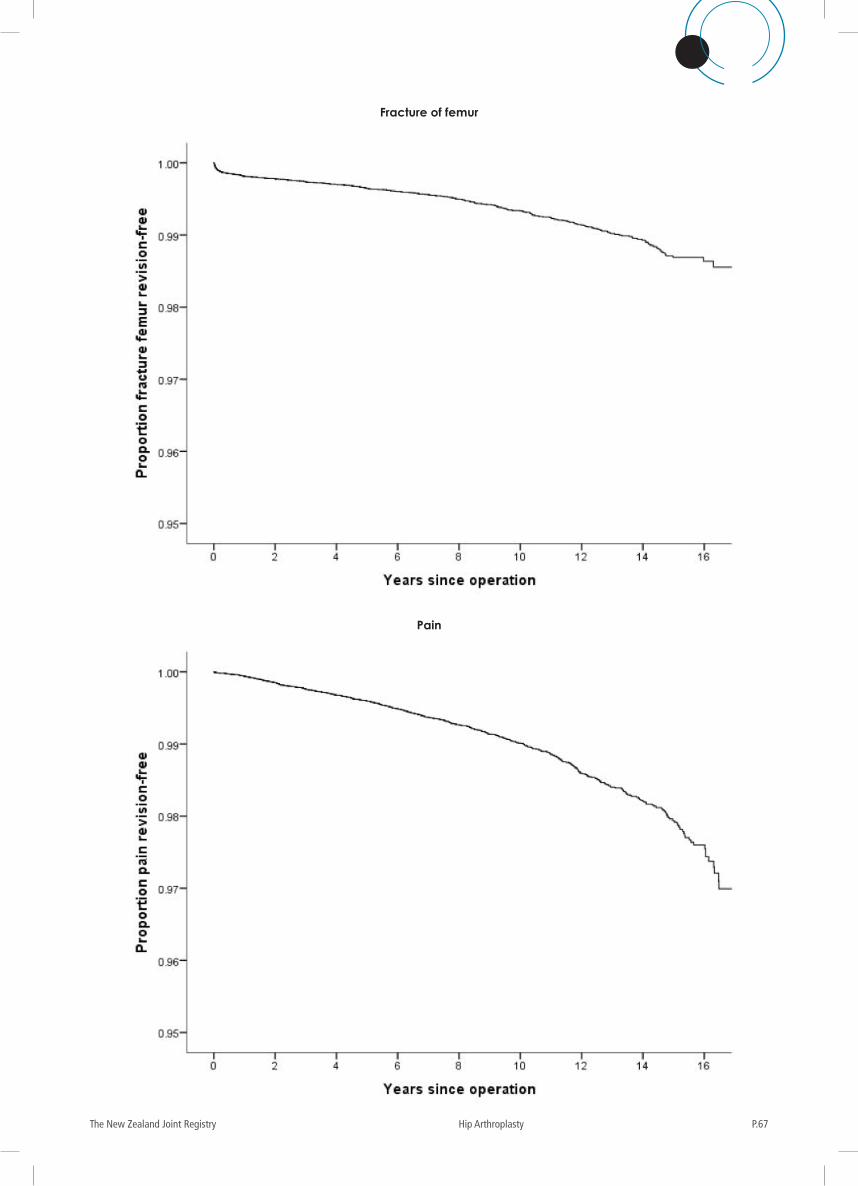
P.67The New Zealand Joint Registry Hip Arthroplasty
Fracture of femur
Pain
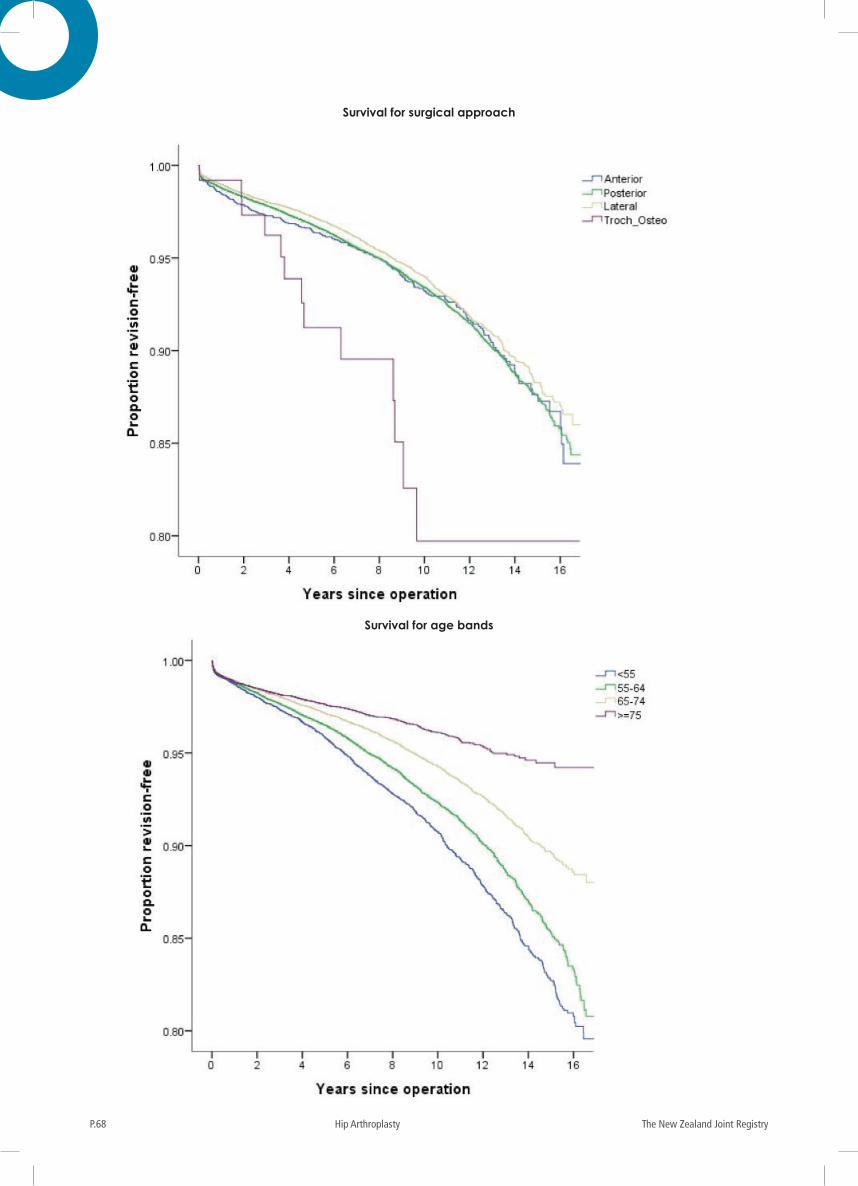
The New Zealand Joint RegistryP.68 Hip Arthroplasty
Survival for surgical approach
Survival for age bands
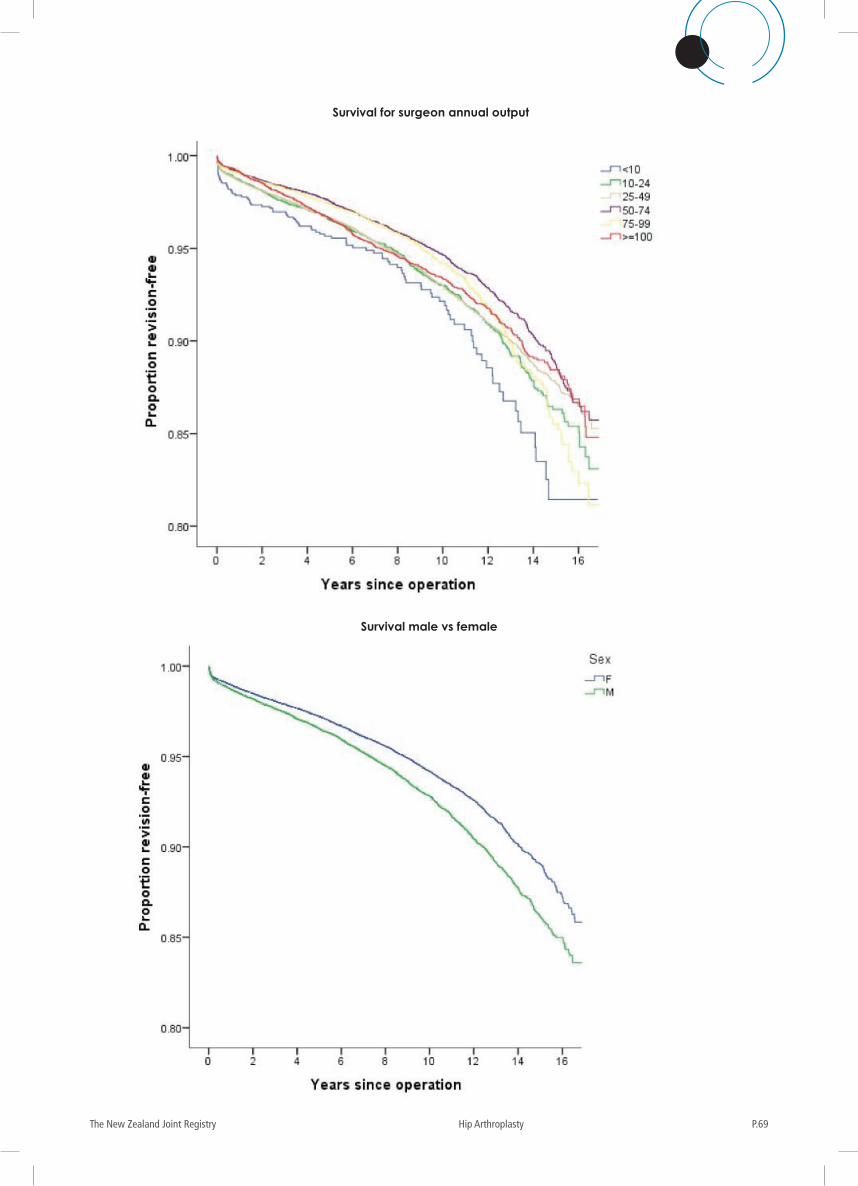
P.69The New Zealand Joint Registry Hip Arthroplasty
Survival for surgeon annual output
Survival male vs female
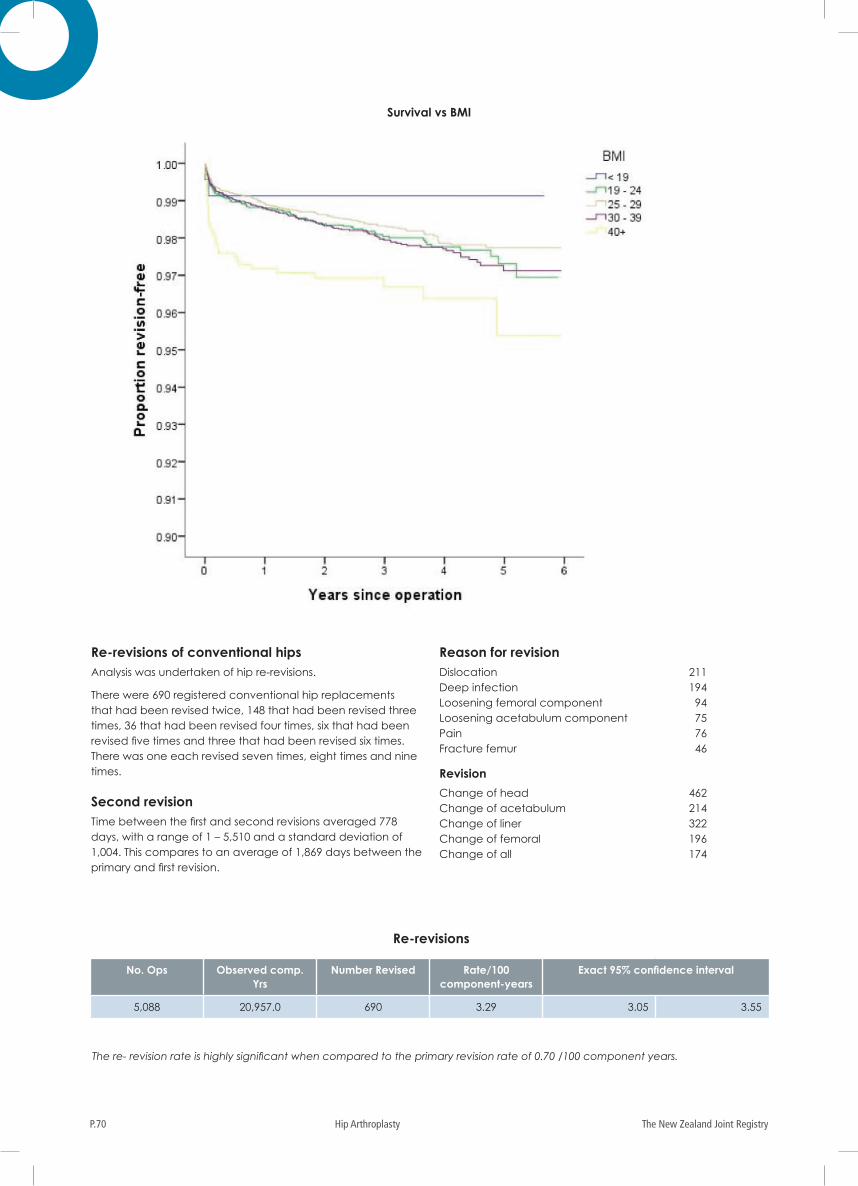
The New Zealand Joint RegistryP.70 Hip Arthroplasty
Survival vs BMI
Re-revisions of conventional hipsAnalysis was undertaken of hip re-revisions.
There were 690 registered conventional hip replacements that had been revised twice, 148 that had been revised three times, 36 that had been revised four times, six that had been revised five times and three that had been revised six times. There was one each revised seven times, eight times and nine times.
Second revisionTime between the first and second revisions averaged 778 days, with a range of 1 – 5,510 and a standard deviation of 1,004. This compares to an average of 1,869 days between the primary and first revision.
Reason for revisionDislocation 211Deep infection 194Loosening femoral component 94Loosening acetabulum component 75Pain 76Fracture femur 46
Revision
Change of head 462Change of acetabulum 214Change of liner 322Change of femoral 196Change of all 174
Re-revisions
No. Ops Observed comp. Yrs
Number Revised Rate/100 component-years
Exact 95% confidence interval
5,088 20,957.0 690 3.29 3.05 3.55
The re- revision rate is highly significant when compared to the primary revision rate of 0.70 /100 component years.
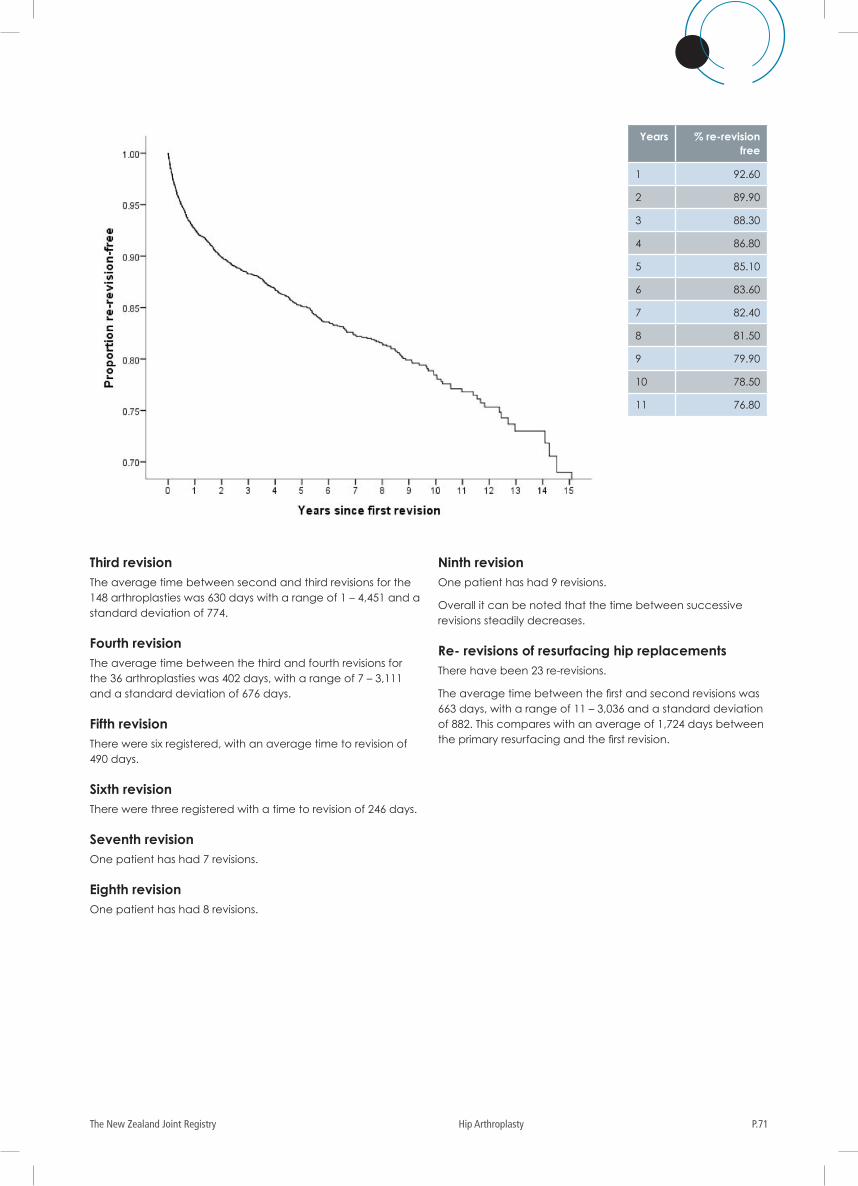
P.71The New Zealand Joint Registry Hip Arthroplasty
Third revisionThe average time between second and third revisions for the 148 arthroplasties was 630 days with a range of 1 – 4,451 and a standard deviation of 774.
Fourth revisionThe average time between the third and fourth revisions for the 36 arthroplasties was 402 days, with a range of 7 – 3,111 and a standard deviation of 676 days.
Fifth revisionThere were six registered, with an average time to revision of 490 days.
Sixth revisionThere were three registered with a time to revision of 246 days.
Seventh revisionOne patient has had 7 revisions.
Eighth revisionOne patient has had 8 revisions.
Ninth revisionOne patient has had 9 revisions.
Overall it can be noted that the time between successive revisions steadily decreases.
Re- revisions of resurfacing hip replacementsThere have been 23 re-revisions.
The average time between the first and second revisions was 663 days, with a range of 11 – 3,036 and a standard deviation of 882. This compares with an average of 1,724 days between the primary resurfacing and the first revision.
Years % re-revision free
1 92.60
2 89.90
3 88.30
4 86.80
5 85.10
6 83.60
7 82.40
8 81.50
9 79.90
10 78.50
11 76.80
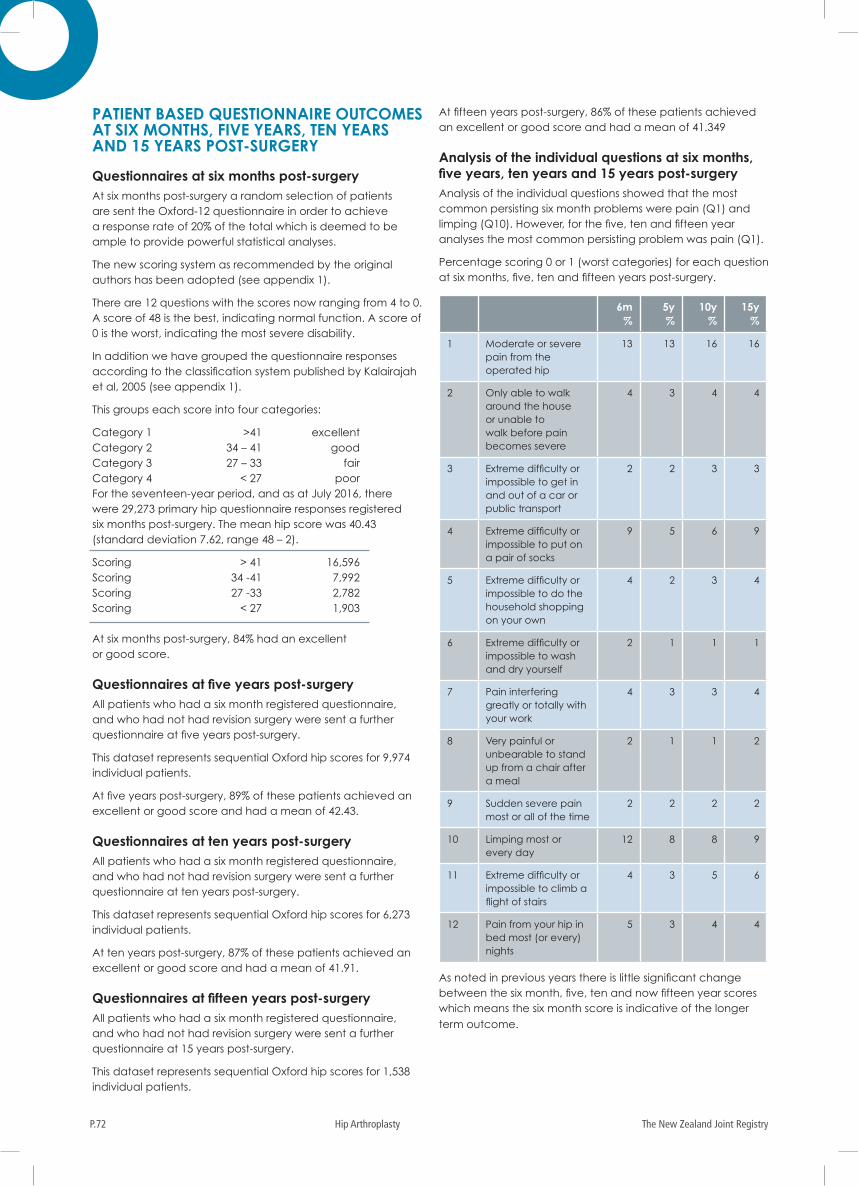
The New Zealand Joint RegistryP.72 Hip Arthroplasty
PATIENT BASED QUESTIONNAIRE OUTCOMES AT SIX MONTHS, FIVE YEARS, TEN YEARS AND 15 YEARS POST-SURGERY
Questionnaires at six months post-surgeryAt six months post-surgery a random selection of patients are sent the Oxford-12 questionnaire in order to achieve a response rate of 20% of the total which is deemed to be ample to provide powerful statistical analyses.
The new scoring system as recommended by the original authors has been adopted (see appendix 1).
There are 12 questions with the scores now ranging from 4 to 0. A score of 48 is the best, indicating normal function. A score of 0 is the worst, indicating the most severe disability.
In addition we have grouped the questionnaire responses according to the classification system published by Kalairajah et al, 2005 (see appendix 1).
This groups each score into four categories:
Category 1 >41 excellent Category 2 34 – 41 good Category 3 27 – 33 fair Category 4 < 27 poorFor the seventeen-year period, and as at July 2016, there were 29,273 primary hip questionnaire responses registered six months post-surgery. The mean hip score was 40.43 (standard deviation 7.62, range 48 – 2).
Scoring > 41 16,596Scoring 34 -41 7,992Scoring 27 -33 2,782Scoring < 27 1,903
At six months post-surgery, 84% had an excellent or good score.
Questionnaires at five years post-surgeryAll patients who had a six month registered questionnaire, and who had not had revision surgery were sent a further questionnaire at five years post-surgery.
This dataset represents sequential Oxford hip scores for 9,974 individual patients.
At five years post-surgery, 89% of these patients achieved an excellent or good score and had a mean of 42.43.
Questionnaires at ten years post-surgeryAll patients who had a six month registered questionnaire, and who had not had revision surgery were sent a further questionnaire at ten years post-surgery.
This dataset represents sequential Oxford hip scores for 6,273 individual patients.
At ten years post-surgery, 87% of these patients achieved an excellent or good score and had a mean of 41.91.
Questionnaires at fifteen years post-surgeryAll patients who had a six month registered questionnaire, and who had not had revision surgery were sent a further questionnaire at 15 years post-surgery.
This dataset represents sequential Oxford hip scores for 1,538 individual patients.
At fifteen years post-surgery, 86% of these patients achieved an excellent or good score and had a mean of 41.349
Analysis of the individual questions at six months, five years, ten years and 15 years post-surgeryAnalysis of the individual questions showed that the most common persisting six month problems were pain (Q1) and limping (Q10). However, for the five, ten and fifteen year analyses the most common persisting problem was pain (Q1).
Percentage scoring 0 or 1 (worst categories) for each question at six months, five, ten and fifteen years post-surgery.
As noted in previous years there is little significant change between the six month, five, ten and now fifteen year scores which means the six month score is indicative of the longer term outcome.
6m %
5y %
10y %
15y %
1 Moderate or severe pain from the operated hip
13 13 16 16
2 Only able to walk around the house or unable to walk before pain becomes severe
4 3 4 4
3 Extreme difficulty or impossible to get in and out of a car or public transport
2 2 3 3
4 Extreme difficulty or impossible to put on a pair of socks
9 5 6 9
5 Extreme difficulty or impossible to do the household shopping on your own
4 2 3 4
6 Extreme difficulty or impossible to wash and dry yourself
2 1 1 1
7 Pain interfering greatly or totally with your work
4 3 3 4
8 Very painful or unbearable to stand up from a chair after a meal
2 1 1 2
9 Sudden severe pain most or all of the time
2 2 2 2
10 Limping most or every day
12 8 8 9
11 Extreme difficulty or impossible to climb a flight of stairs
4 3 5 6
12 Pain from your hip in bed most (or every) nights
5 3 4 4
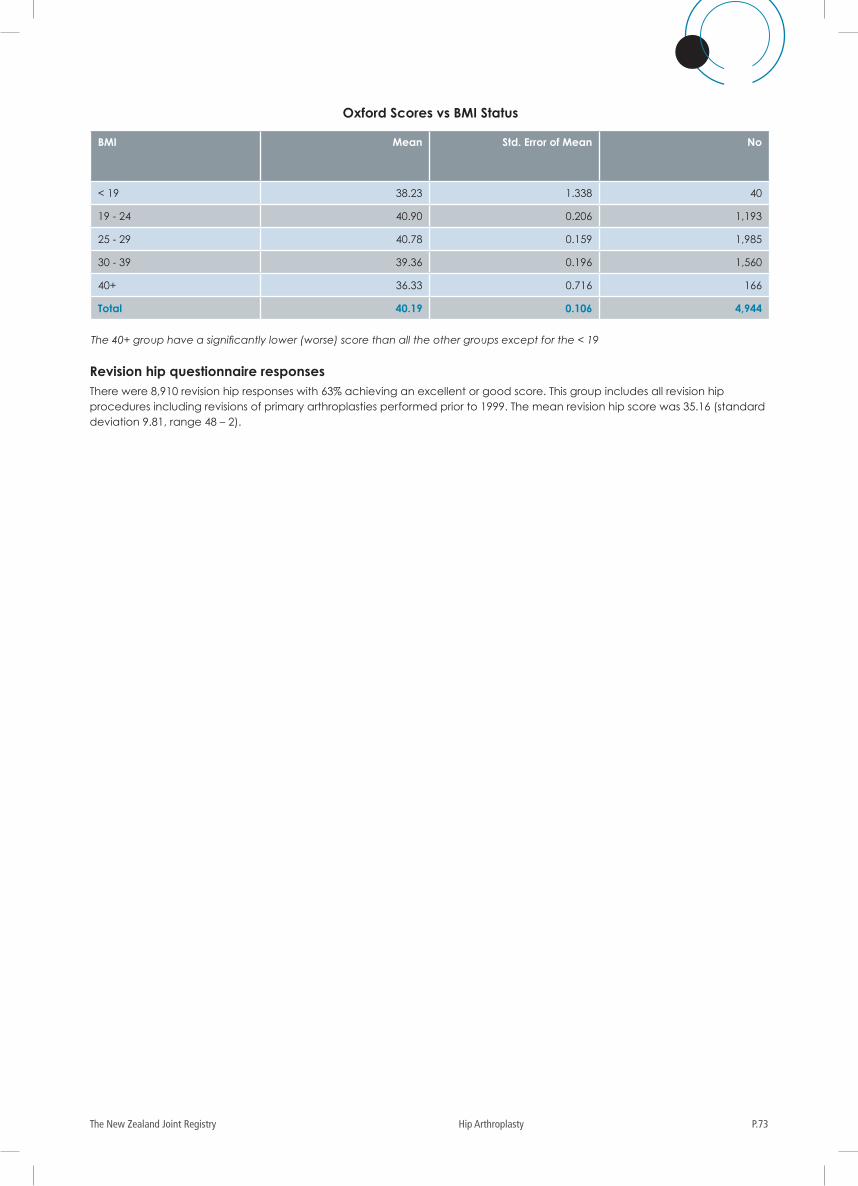
P.73The New Zealand Joint Registry Hip Arthroplasty
Oxford Scores vs BMI Status
BMI Mean Std. Error of Mean No
< 19 38.23 1.338 40
19 - 24 40.90 0.206 1,193
25 - 29 40.78 0.159 1,985
30 - 39 39.36 0.196 1,560
40+ 36.33 0.716 166
Total 40.19 0.106 4,944
The 40+ group have a significantly lower (worse) score than all the other groups except for the < 19
Revision hip questionnaire responsesThere were 8,910 revision hip responses with 63% achieving an excellent or good score. This group includes all revision hip procedures including revisions of primary arthroplasties performed prior to 1999. The mean revision hip score was 35.16 (standard deviation 9.81, range 48 – 2).
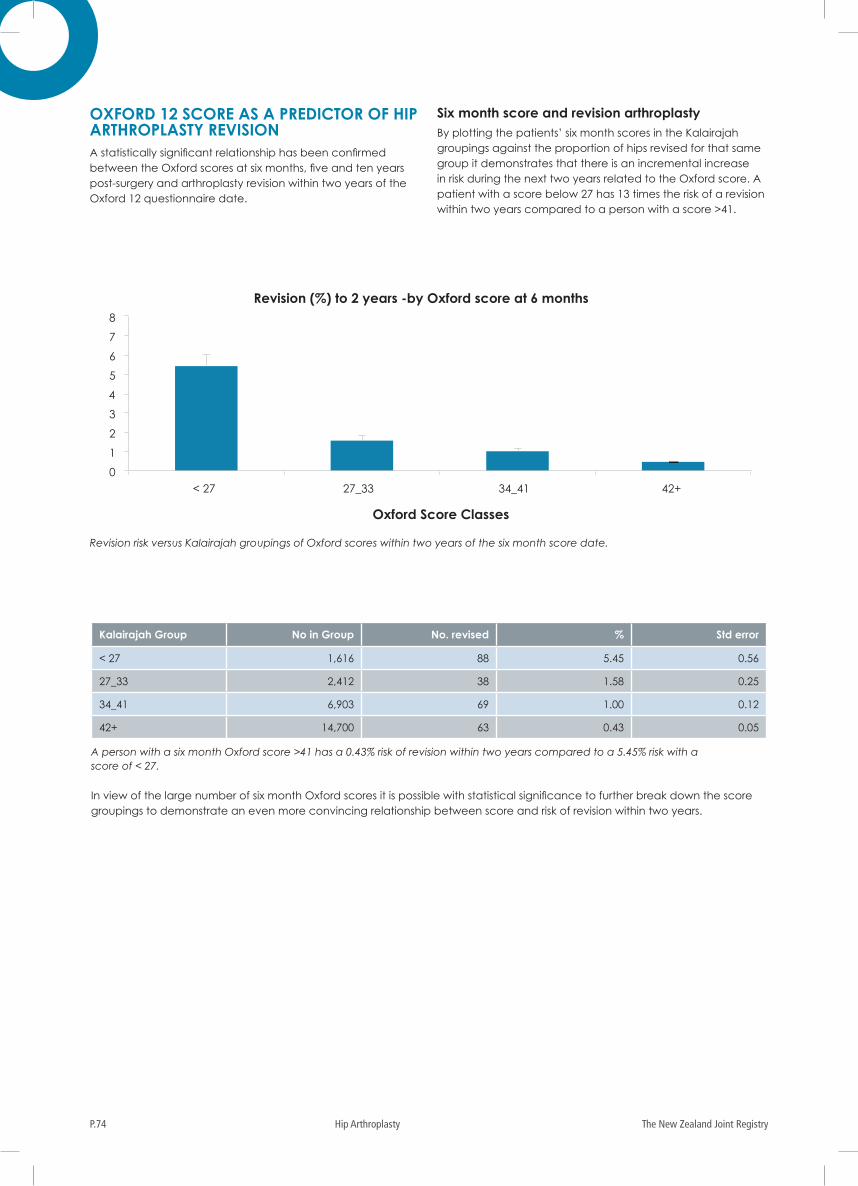
The New Zealand Joint RegistryP.74 Hip Arthroplasty
OXFORD 12 SCORE AS A PREDICTOR OF HIP ARTHROPLASTY REVISIONA statistically significant relationship has been confirmed between the Oxford scores at six months, five and ten years post-surgery and arthroplasty revision within two years of the Oxford 12 questionnaire date.
Six month score and revision arthroplastyBy plotting the patients’ six month scores in the Kalairajah groupings against the proportion of hips revised for that same group it demonstrates that there is an incremental increase in risk during the next two years related to the Oxford score. A patient with a score below 27 has 13 times the risk of a revision within two years compared to a person with a score >41.
Revision risk versus Kalairajah groupings of Oxford scores within two years of the six month score date.
Kalairajah Group No in Group No. revised % Std error
< 27 1,616 88 5.45 0.56
27_33 2,412 38 1.58 0.25
34_41 6,903 69 1.00 0.12
42+ 14,700 63 0.43 0.05
A person with a six month Oxford score >41 has a 0.43% risk of revision within two years compared to a 5.45% risk with a score of < 27.
In view of the large number of six month Oxford scores it is possible with statistical significance to further break down the score groupings to demonstrate an even more convincing relationship between score and risk of revision within two years.
0
1
2
3
4
5
6
7
8
< 27 27_33 34_41 42+
Oxford Score Classes
Revision (%) to 2 years -by Oxford score at 6 months
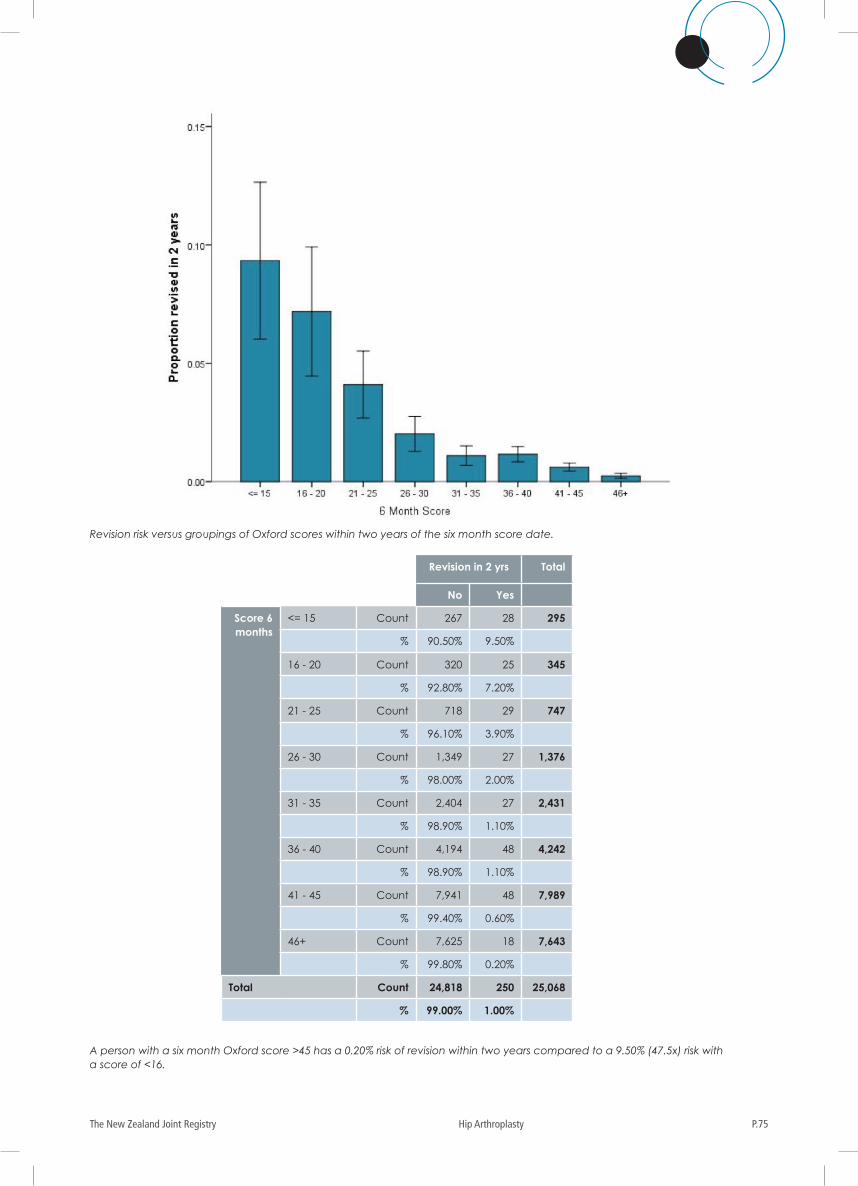
P.75The New Zealand Joint Registry Hip Arthroplasty
Revision in 2 yrs Total
No Yes
Score 6 months
<= 15 Count 267 28 295
% 90.50% 9.50%
16 - 20 Count 320 25 345
% 92.80% 7.20%
21 - 25 Count 718 29 747
% 96.10% 3.90%
26 - 30 Count 1,349 27 1,376
% 98.00% 2.00%
31 - 35 Count 2,404 27 2,431
% 98.90% 1.10%
36 - 40 Count 4,194 48 4,242
% 98.90% 1.10%
41 - 45 Count 7,941 48 7,989
% 99.40% 0.60%
46+ Count 7,625 18 7,643
% 99.80% 0.20%
Total Count 24,818 250 25,068
% 99.00% 1.00%
A person with a six month Oxford score >45 has a 0.20% risk of revision within two years compared to a 9.50% (47.5x) risk with a score of <16.
Revision risk versus groupings of Oxford scores within two years of the six month score date.
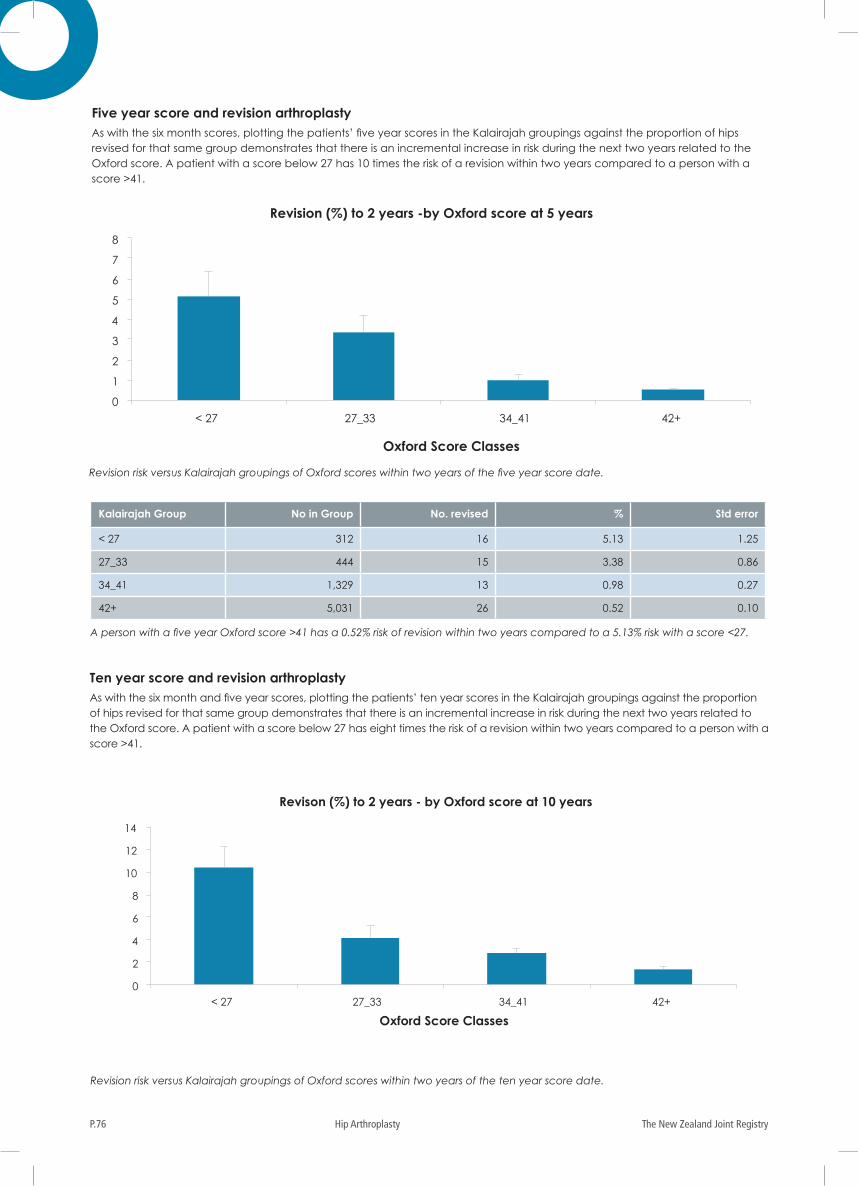
The New Zealand Joint RegistryP.76 Hip Arthroplasty
Revision risk versus Kalairajah groupings of Oxford scores within two years of the five year score date.
Kalairajah Group No in Group No. revised % Std error
< 27 312 16 5.13 1.25
27_33 444 15 3.38 0.86
34_41 1,329 13 0.98 0.27
42+ 5,031 26 0.52 0.10
A person with a five year Oxford score >41 has a 0.52% risk of revision within two years compared to a 5.13% risk with a score <27.
Ten year score and revision arthroplastyAs with the six month and five year scores, plotting the patients’ ten year scores in the Kalairajah groupings against the proportion of hips revised for that same group demonstrates that there is an incremental increase in risk during the next two years related to the Oxford score. A patient with a score below 27 has eight times the risk of a revision within two years compared to a person with a score >41.
Five year score and revision arthroplastyAs with the six month scores, plotting the patients’ five year scores in the Kalairajah groupings against the proportion of hips revised for that same group demonstrates that there is an incremental increase in risk during the next two years related to the Oxford score. A patient with a score below 27 has 10 times the risk of a revision within two years compared to a person with a score >41.
Revision risk versus Kalairajah groupings of Oxford scores within two years of the ten year score date.
0
1
2
3
4
5
6
7
8
< 27 27_33 34_41 42+
Oxford Score Classes
Revision (%) to 2 years -by Oxford score at 5 years
0
2
4
6
8
10
12
14
< 27 27_33 34_41 42+
Oxford Score Classes
Revison (%) to 2 years - by Oxford score at 10 years
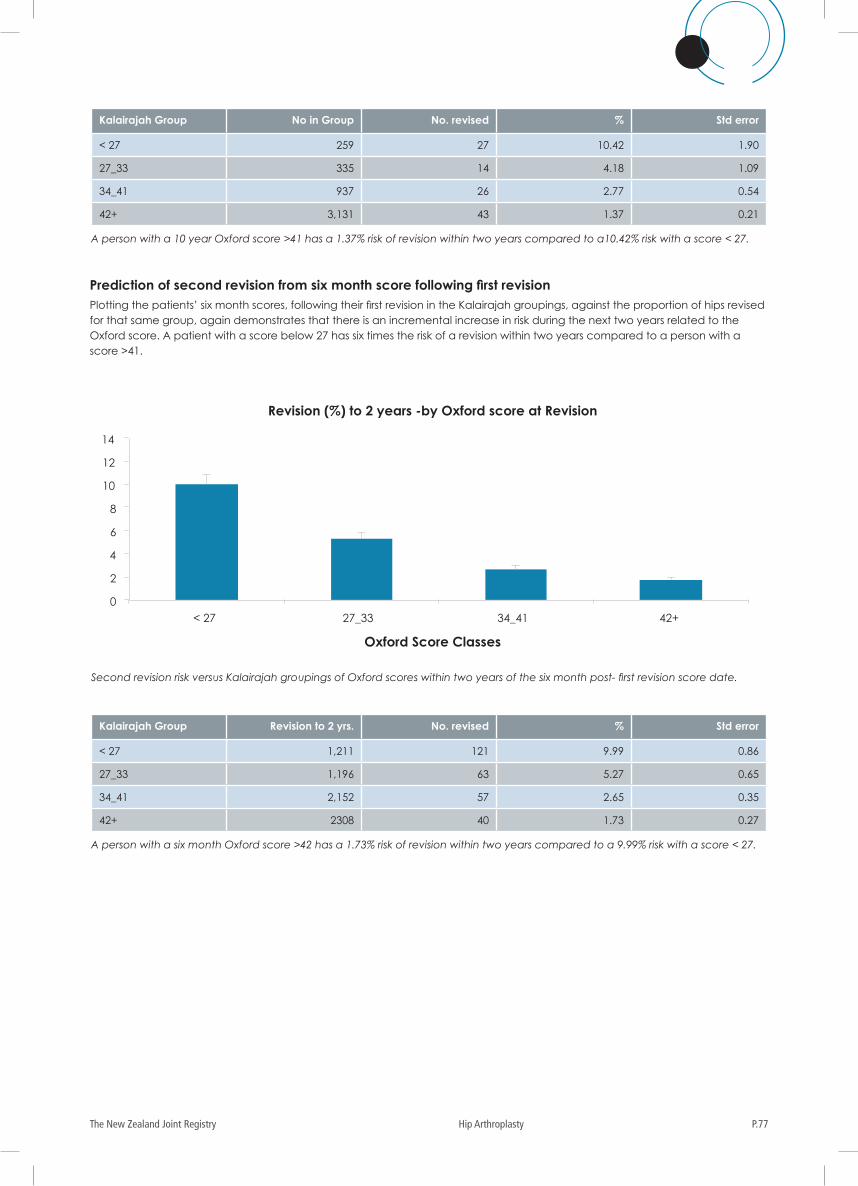
P.77The New Zealand Joint Registry Hip Arthroplasty
Second revision risk versus Kalairajah groupings of Oxford scores within two years of the six month post- first revision score date.
Kalairajah Group No in Group No. revised % Std error
< 27 259 27 10.42 1.90
27_33 335 14 4.18 1.09
34_41 937 26 2.77 0.54
42+ 3,131 43 1.37 0.21
A person with a 10 year Oxford score >41 has a 1.37% risk of revision within two years compared to a10.42% risk with a score < 27.
Kalairajah Group Revision to 2 yrs. No. revised % Std error
< 27 1,211 121 9.99 0.86
27_33 1,196 63 5.27 0.65
34_41 2,152 57 2.65 0.35
42+ 2308 40 1.73 0.27
A person with a six month Oxford score >42 has a 1.73% risk of revision within two years compared to a 9.99% risk with a score < 27.
Prediction of second revision from six month score following first revision Plotting the patients’ six month scores, following their first revision in the Kalairajah groupings, against the proportion of hips revised for that same group, again demonstrates that there is an incremental increase in risk during the next two years related to the Oxford score. A patient with a score below 27 has six times the risk of a revision within two years compared to a person with a score >41.
0
2
4
6
8
10
12
14
< 27 27_33 34_41 42+
Oxford Score Classes
Revision (%) to 2 years -by Oxford score at Revision
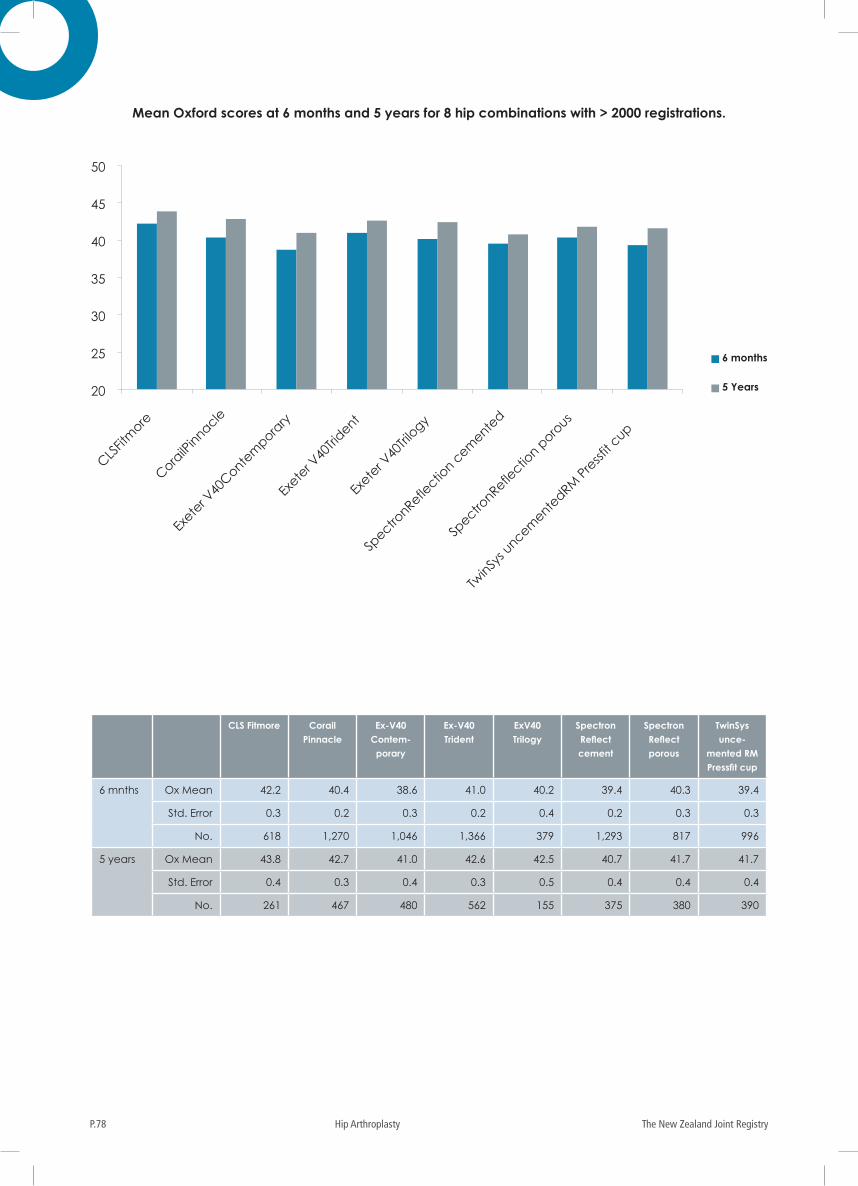
The New Zealand Joint RegistryP.78 Hip Arthroplasty
CLS Fitmore Corail Pinnacle
Ex-V40 Contem-
porary
Ex-V40 Trident
ExV40 Trilogy
Spectron Reflect cement
Spectron Reflect porous
TwinSys unce-
mented RM Pressfit cup
6 mnths Ox Mean 42.2 40.4 38.6 41.0 40.2 39.4 40.3 39.4
Std. Error 0.3 0.2 0.3 0.2 0.4 0.2 0.3 0.3
No. 618 1,270 1,046 1,366 379 1,293 817 996
5 years Ox Mean 43.8 42.7 41.0 42.6 42.5 40.7 41.7 41.7
Std. Error 0.4 0.3 0.4 0.3 0.5 0.4 0.4 0.4
No. 261 467 480 562 155 375 380 390
Mean Oxford scores at 6 months and 5 years for 8 hip combinations with > 2000 registrations.
20
25
30
35
40
45
50
CLSFit
more
CorailP
innacle
Exete
r V40
Contem
porary
Exete
r V40
Trident
Exete
r V40
Trilo
gy
Spectro
nReflectio
n cem
ented
Spectro
nReflectio
n poro
us
TwinSy
s uncem
entedRM
Pre
ssfit c
up
6 months
5 Years
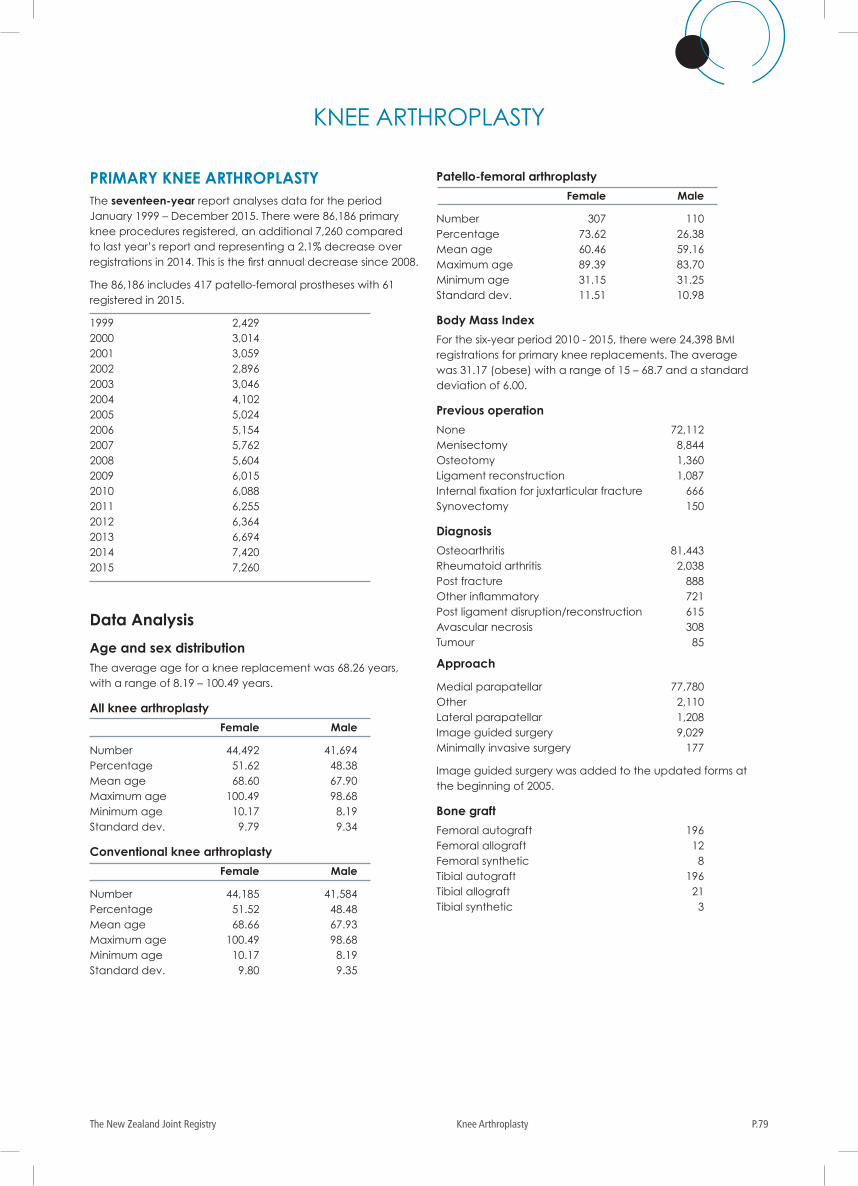
P.79The New Zealand Joint Registry Knee Arthroplasty
PRIMARY KNEE ARTHROPLASTY The seventeen-year report analyses data for the period January 1999 – December 2015. There were 86,186 primary knee procedures registered, an additional 7,260 compared to last year’s report and representing a 2.1% decrease over registrations in 2014. This is the first annual decrease since 2008.
The 86,186 includes 417 patello-femoral prostheses with 61 registered in 2015.
1999 2,4292000 3,0142001 3,0592002 2,8962003 3,0462004 4,1022005 5,0242006 5,1542007 5,7622008 5,6042009 6,0152010 6,0882011 6,2552012 6,3642013 6,6942014 7,4202015 7,260
Data Analysis
Age and sex distributionThe average age for a knee replacement was 68.26 years, with a range of 8.19 – 100.49 years.
All knee arthroplasty
Female Male
Number 44,492 41,694Percentage 51.62 48.38Mean age 68.60 67.90Maximum age 100.49 98.68Minimum age 10.17 8.19Standard dev. 9.79 9.34
Conventional knee arthroplasty
Female Male
Number 44,185 41,584Percentage 51.52 48.48Mean age 68.66 67.93Maximum age 100.49 98.68Minimum age 10.17 8.19Standard dev. 9.80 9.35
Patello-femoral arthroplasty
Female Male
Number 307 110Percentage 73.62 26.38Mean age 60.46 59.16Maximum age 89.39 83.70Minimum age 31.15 31.25Standard dev. 11.51 10.98
Body Mass Index
For the six-year period 2010 - 2015, there were 24,398 BMI registrations for primary knee replacements. The average was 31.17 (obese) with a range of 15 – 68.7 and a standard deviation of 6.00.
Previous operation
None 72,112Menisectomy 8,844Osteotomy 1,360Ligament reconstruction 1,087Internal fixation for juxtarticular fracture 666Synovectomy 150
Diagnosis
Osteoarthritis 81,443Rheumatoid arthritis 2,038Post fracture 888Other inflammatory 721Post ligament disruption/reconstruction 615Avascular necrosis 308Tumour 85
Approach
Medial parapatellar 77,780Other 2,110Lateral parapatellar 1,208Image guided surgery 9,029Minimally invasive surgery 177
Image guided surgery was added to the updated forms at the beginning of 2005.
Bone graft
Femoral autograft 196Femoral allograft 12Femoral synthetic 8Tibial autograft 196Tibial allograft 21Tibial synthetic 3
KNEE ARTHROPLASTY
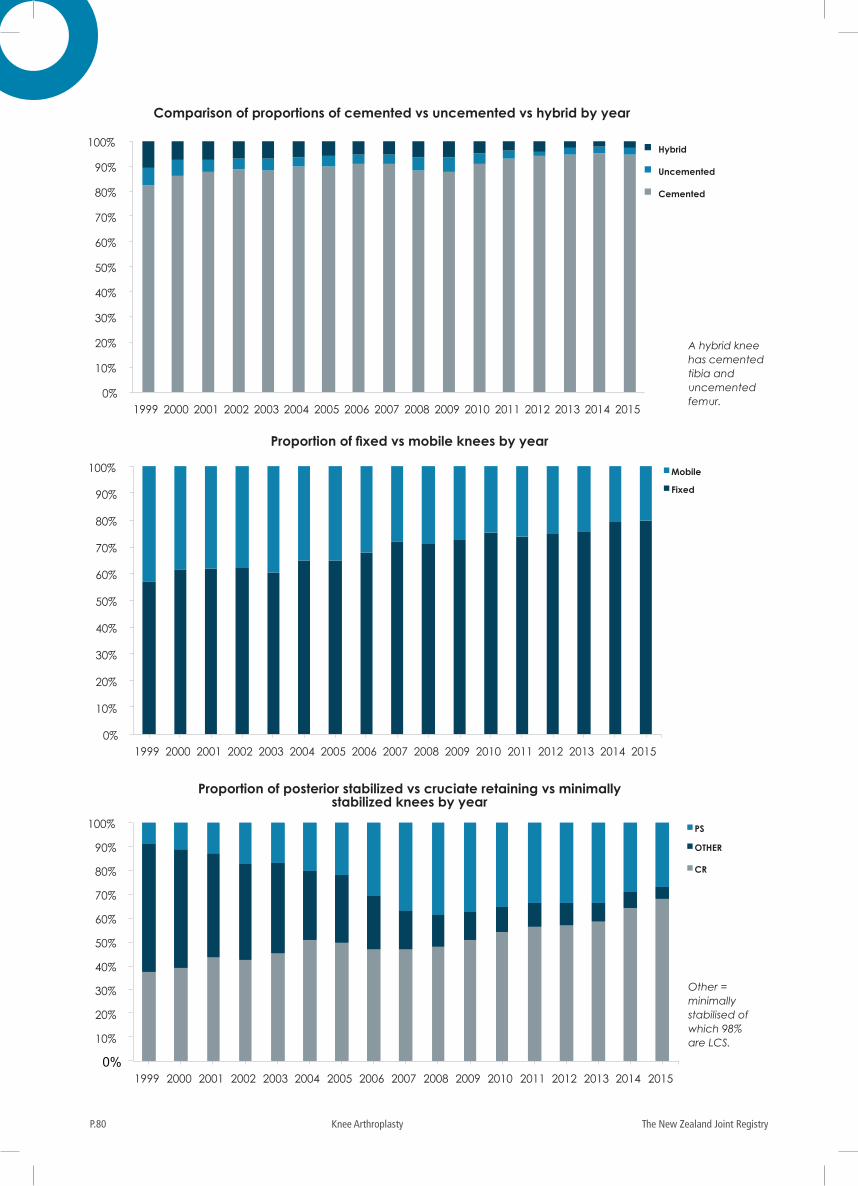
The New Zealand Joint RegistryP.80 Knee Arthroplasty
0%
10%
20%
30%
40%
50%
60%
70%
80%
90%
100%
1999 2000 2001 2002 2003 2004 2005 2006 2007 2008 2009 2010 2011 2012 2013 2014 2015
YEAR
Hybrid
Uncemented
Cemented
0%
10%
20%
30%
40%
50%
60%
70%
80%
90%
100%
1999 2000 2001 2002 2003 2004 2005 2006 2007 2008 2009 2010 2011 2012 2013 2014 2015
Mobile
Fixed
0%
10%
20%
30%
40%
50%
60%
70%
80%
90%
100%
1999 2000 2001 2002 2003 2004 2005 2006 2007 2008 2009 2010 2011 2012 2013 2014 2015
PS
OTHER
CR
A hybrid knee has cemented tibia and uncemented femur.
Comparison of proportions of cemented vs uncemented vs hybrid by year
Proportion of posterior stabilized vs cruciate retaining vs minimally stabilized knees by year
Proportion of fixed vs mobile knees by year
Other = minimally stabilised of which 98% are LCS.
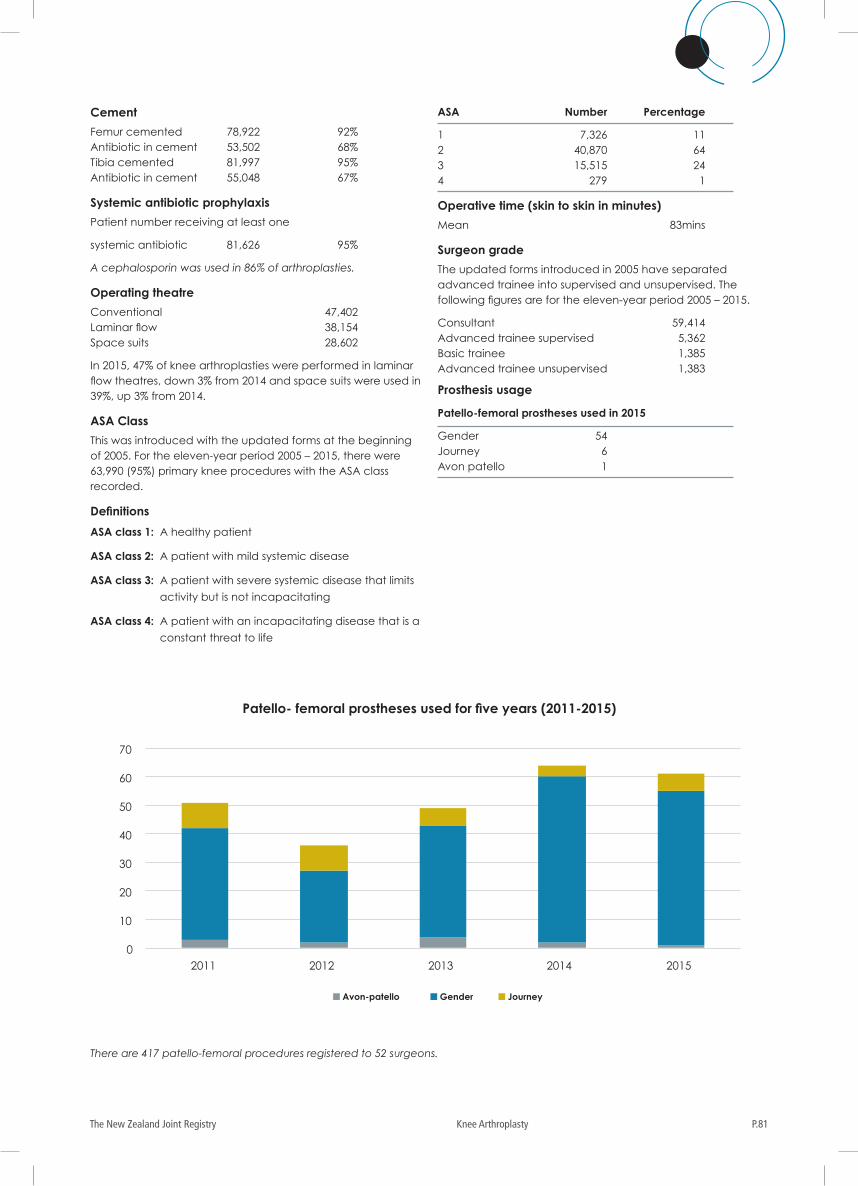
P.81The New Zealand Joint Registry Knee Arthroplasty
Cement
Femur cemented 78,922 92%Antibiotic in cement 53,502 68%Tibia cemented 81,997 95%Antibiotic in cement 55,048 67%
Systemic antibiotic prophylaxis
Patient number receiving at least one
systemic antibiotic 81,626 95%
A cephalosporin was used in 86% of arthroplasties.
Operating theatre
Conventional 47,402Laminar flow 38,154Space suits 28,602
In 2015, 47% of knee arthroplasties were performed in laminar flow theatres, down 3% from 2014 and space suits were used in 39%, up 3% from 2014.
ASA Class
This was introduced with the updated forms at the beginning of 2005. For the eleven-year period 2005 – 2015, there were 63,990 (95%) primary knee procedures with the ASA class recorded.
Definitions
ASA class 1: A healthy patient
ASA class 2: A patient with mild systemic disease
ASA class 3: A patient with severe systemic disease that limits
activity but is not incapacitating
ASA class 4: A patient with an incapacitating disease that is a
constant threat to life
ASA Number Percentage
1 7,326 112 40,870 643 15,515 244 279 1
Operative time (skin to skin in minutes)
Mean 83mins
Surgeon grade
The updated forms introduced in 2005 have separated advanced trainee into supervised and unsupervised. The following figures are for the eleven-year period 2005 – 2015.
Consultant 59,414Advanced trainee supervised 5,362Basic trainee 1,385Advanced trainee unsupervised 1,383
Prosthesis usage
Patello-femoral prostheses used in 2015
Gender 54Journey 6Avon patello 1
There are 417 patello-femoral procedures registered to 52 surgeons.
0
10
20
30
40
50
60
70
2011 2012 2013 2014 2015
Avon-patello Gender Journey
Patello- femoral prostheses used for five years (2011-2015)
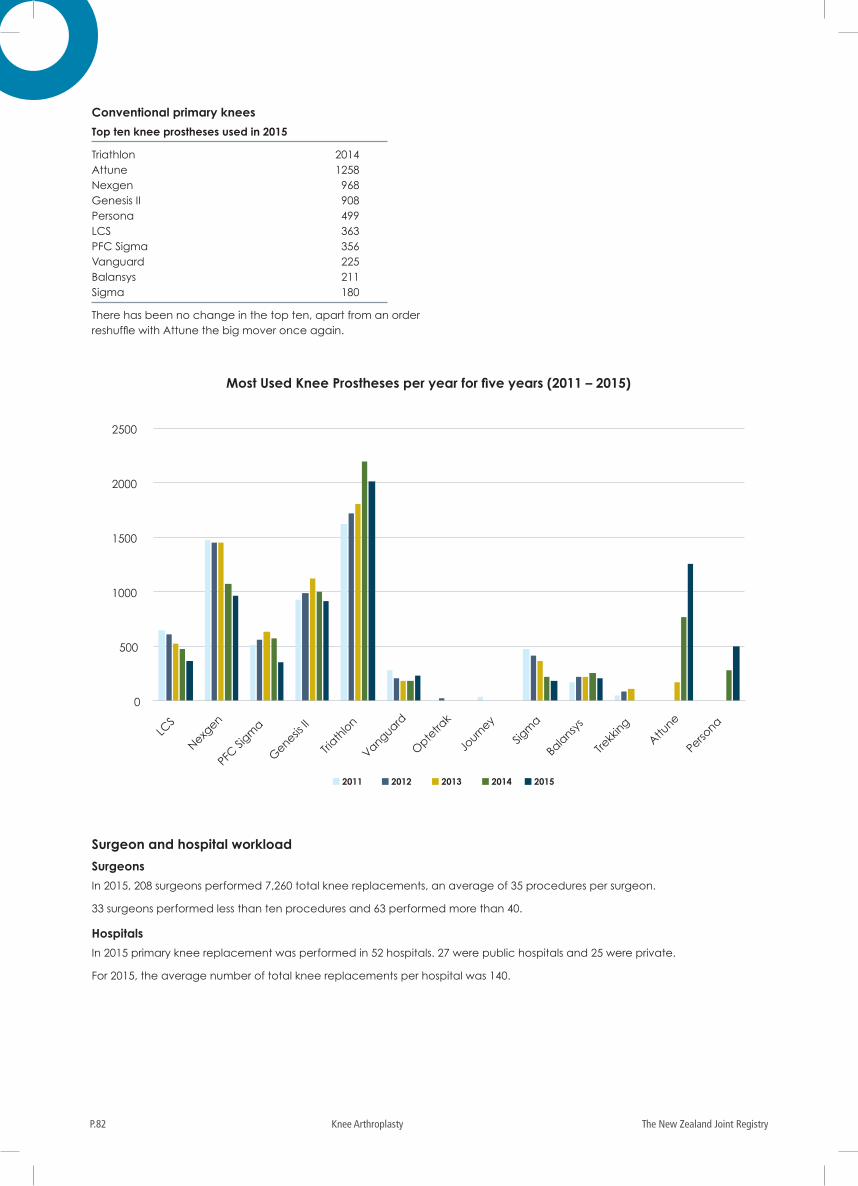
The New Zealand Joint RegistryP.82 Knee Arthroplasty
Conventional primary knees
Top ten knee prostheses used in 2015
Triathlon 2014Attune 1258Nexgen 968Genesis II 908Persona 499LCS 363PFC Sigma 356Vanguard 225Balansys 211Sigma 180
There has been no change in the top ten, apart from an order reshuffle with Attune the big mover once again.
Surgeon and hospital workload
Surgeons
In 2015, 208 surgeons performed 7,260 total knee replacements, an average of 35 procedures per surgeon.
33 surgeons performed less than ten procedures and 63 performed more than 40.
Hospitals
In 2015 primary knee replacement was performed in 52 hospitals. 27 were public hospitals and 25 were private.
For 2015, the average number of total knee replacements per hospital was 140.
Most Used Knee Prostheses per year for five years (2011 – 2015)
0
500
1000
1500
2000
2500
LCS
Nexgen
PFC Si
gma
Genesis
II
Triath
lon
Vanguard
Opte
trak
Journ
ey
Sigm
a
Bala
nsys
Trekk
ing
Attune
Persona
20152011 2012 2013 2014
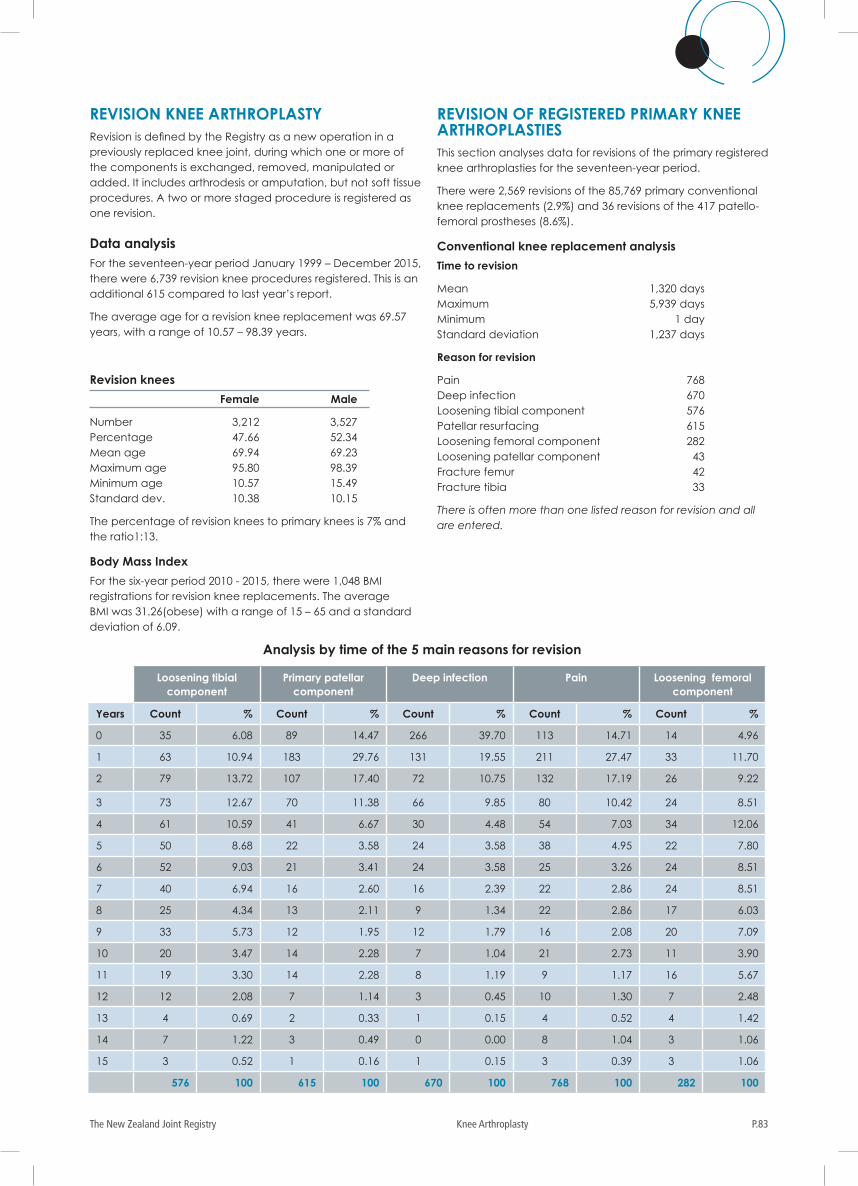
P.83The New Zealand Joint Registry Knee Arthroplasty
REVISION KNEE ARTHROPLASTYRevision is defined by the Registry as a new operation in a previously replaced knee joint, during which one or more of the components is exchanged, removed, manipulated or added. It includes arthrodesis or amputation, but not soft tissue procedures. A two or more staged procedure is registered as one revision.
Data analysisFor the seventeen-year period January 1999 – December 2015, there were 6,739 revision knee procedures registered. This is an additional 615 compared to last year’s report.
The average age for a revision knee replacement was 69.57 years, with a range of 10.57 – 98.39 years.
Revision knees
Female Male
Number 3,212 3,527Percentage 47.66 52.34Mean age 69.94 69.23Maximum age 95.80 98.39Minimum age 10.57 15.49Standard dev. 10.38 10.15
The percentage of revision knees to primary knees is 7% and the ratio1:13.
Body Mass Index
For the six-year period 2010 - 2015, there were 1,048 BMI registrations for revision knee replacements. The average BMI was 31.26(obese) with a range of 15 – 65 and a standard deviation of 6.09.
REVISION OF REGISTERED PRIMARY KNEE ARTHROPLASTIESThis section analyses data for revisions of the primary registered knee arthroplasties for the seventeen-year period.
There were 2,569 revisions of the 85,769 primary conventional knee replacements (2.9%) and 36 revisions of the 417 patello-femoral prostheses (8.6%).
Conventional knee replacement analysis
Time to revision
Mean 1,320 daysMaximum 5,939 daysMinimum 1 day Standard deviation 1,237 days
Reason for revision
Pain 768Deep infection 670Loosening tibial component 576Patellar resurfacing 615Loosening femoral component 282Loosening patellar component 43Fracture femur 42Fracture tibia 33
There is often more than one listed reason for revision and all are entered.
Analysis by time of the 5 main reasons for revision
Loosening tibial component
Primary patellar component
Deep infection Pain Loosening femoral component
Years Count % Count % Count % Count % Count %
0 35 6.08 89 14.47 266 39.70 113 14.71 14 4.96
1 63 10.94 183 29.76 131 19.55 211 27.47 33 11.70
2 79 13.72 107 17.40 72 10.75 132 17.19 26 9.22
3 73 12.67 70 11.38 66 9.85 80 10.42 24 8.51
4 61 10.59 41 6.67 30 4.48 54 7.03 34 12.06
5 50 8.68 22 3.58 24 3.58 38 4.95 22 7.80
6 52 9.03 21 3.41 24 3.58 25 3.26 24 8.51
7 40 6.94 16 2.60 16 2.39 22 2.86 24 8.51
8 25 4.34 13 2.11 9 1.34 22 2.86 17 6.03
9 33 5.73 12 1.95 12 1.79 16 2.08 20 7.09
10 20 3.47 14 2.28 7 1.04 21 2.73 11 3.90
11 19 3.30 14 2.28 8 1.19 9 1.17 16 5.67
12 12 2.08 7 1.14 3 0.45 10 1.30 7 2.48
13 4 0.69 2 0.33 1 0.15 4 0.52 4 1.42
14 7 1.22 3 0.49 0 0.00 8 1.04 3 1.06
15 3 0.52 1 0.16 1 0.15 3 0.39 3 1.06
576 100 615 100 670 100 768 100 282 100
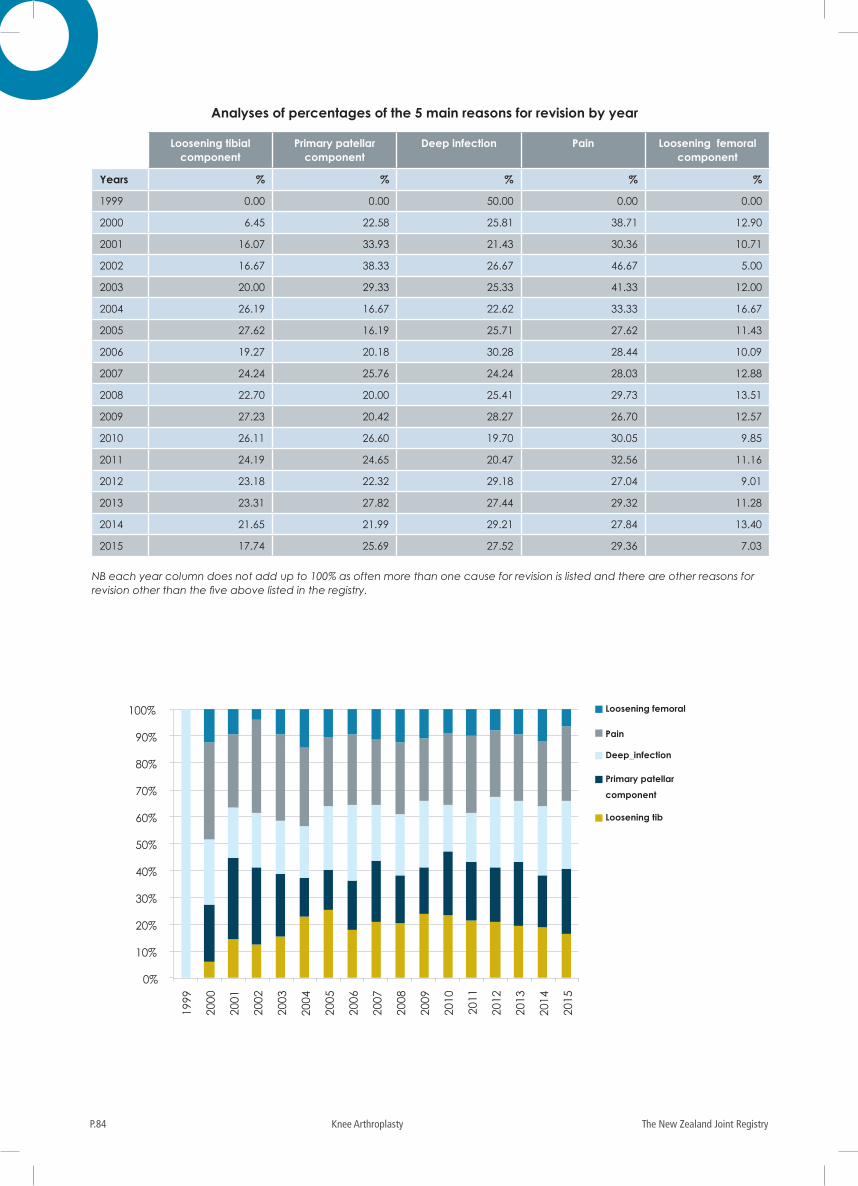
The New Zealand Joint RegistryP.84 Knee Arthroplasty
Analyses of percentages of the 5 main reasons for revision by year
Loosening tibial component
Primary patellar component
Deep infection Pain Loosening femoral component
Years % % % % %
1999 0.00 0.00 50.00 0.00 0.00
2000 6.45 22.58 25.81 38.71 12.90
2001 16.07 33.93 21.43 30.36 10.71
2002 16.67 38.33 26.67 46.67 5.00
2003 20.00 29.33 25.33 41.33 12.00
2004 26.19 16.67 22.62 33.33 16.67
2005 27.62 16.19 25.71 27.62 11.43
2006 19.27 20.18 30.28 28.44 10.09
2007 24.24 25.76 24.24 28.03 12.88
2008 22.70 20.00 25.41 29.73 13.51
2009 27.23 20.42 28.27 26.70 12.57
2010 26.11 26.60 19.70 30.05 9.85
2011 24.19 24.65 20.47 32.56 11.16
2012 23.18 22.32 29.18 27.04 9.01
2013 23.31 27.82 27.44 29.32 11.28
2014 21.65 21.99 29.21 27.84 13.40
2015 17.74 25.69 27.52 29.36 7.03
NB each year column does not add up to 100% as often more than one cause for revision is listed and there are other reasons for revision other than the five above listed in the registry.
0%
10%
20%
30%
40%
50%
60%
70%
80%
90%
100%
1999
2000
2001
2002
2003
2004
2005
2006
2007
2008
2009
2010
2011
2012
2013
2014
2015
Loosening femoral
Pain
Deep_infection
Primary patellar
component
Loosening tib
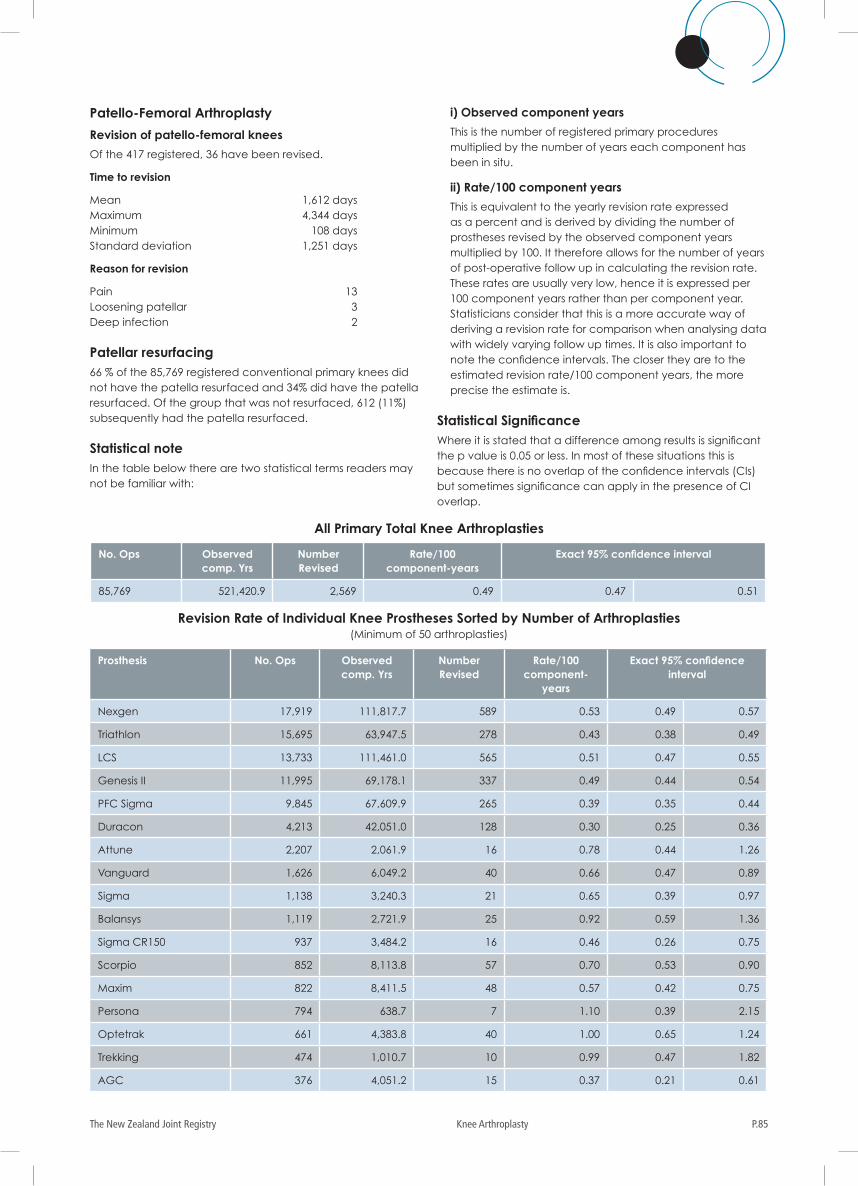
P.85The New Zealand Joint Registry Knee Arthroplasty
Patello-Femoral Arthroplasty
Revision of patello-femoral knees
Of the 417 registered, 36 have been revised.
Time to revision
Mean 1,612 daysMaximum 4,344 daysMinimum 108 daysStandard deviation 1,251 days
Reason for revision
Pain 13Loosening patellar 3Deep infection 2
Patellar resurfacing66 % of the 85,769 registered conventional primary knees did not have the patella resurfaced and 34% did have the patella resurfaced. Of the group that was not resurfaced, 612 (11%) subsequently had the patella resurfaced.
Statistical noteIn the table below there are two statistical terms readers may not be familiar with:
i) Observed component years
This is the number of registered primary procedures multiplied by the number of years each component has been in situ.
ii) Rate/100 component years
This is equivalent to the yearly revision rate expressed as a percent and is derived by dividing the number of prostheses revised by the observed component years multiplied by 100. It therefore allows for the number of years of post-operative follow up in calculating the revision rate. These rates are usually very low, hence it is expressed per 100 component years rather than per component year. Statisticians consider that this is a more accurate way of deriving a revision rate for comparison when analysing data with widely varying follow up times. It is also important to note the confidence intervals. The closer they are to the estimated revision rate/100 component years, the more precise the estimate is.
Statistical Significance Where it is stated that a difference among results is significant the p value is 0.05 or less. In most of these situations this is because there is no overlap of the confidence intervals (CIs) but sometimes significance can apply in the presence of CI overlap.
All Primary Total Knee Arthroplasties
Revision Rate of Individual Knee Prostheses Sorted by Number of Arthroplasties(Minimum of 50 arthroplasties)
No. Ops Observed comp. Yrs
Number Revised
Rate/100 component-years
Exact 95% confidence interval
85,769 521,420.9 2,569 0.49 0.47 0.51
Prosthesis No. Ops Observed comp. Yrs
Number Revised
Rate/100 component-
years
Exact 95% confidence interval
Nexgen 17,919 111,817.7 589 0.53 0.49 0.57
Triathlon 15,695 63,947.5 278 0.43 0.38 0.49
LCS 13,733 111,461.0 565 0.51 0.47 0.55
Genesis II 11,995 69,178.1 337 0.49 0.44 0.54
PFC Sigma 9,845 67,609.9 265 0.39 0.35 0.44
Duracon 4,213 42,051.0 128 0.30 0.25 0.36
Attune 2,207 2,061.9 16 0.78 0.44 1.26
Vanguard 1,626 6,049.2 40 0.66 0.47 0.89
Sigma 1,138 3,240.3 21 0.65 0.39 0.97
Balansys 1,119 2,721.9 25 0.92 0.59 1.36
Sigma CR150 937 3,484.2 16 0.46 0.26 0.75
Scorpio 852 8,113.8 57 0.70 0.53 0.90
Maxim 822 8,411.5 48 0.57 0.42 0.75
Persona 794 638.7 7 1.10 0.39 2.15
Optetrak 661 4,383.8 40 1.00 0.65 1.24
Trekking 474 1,010.7 10 0.99 0.47 1.82
AGC 376 4,051.2 15 0.37 0.21 0.61
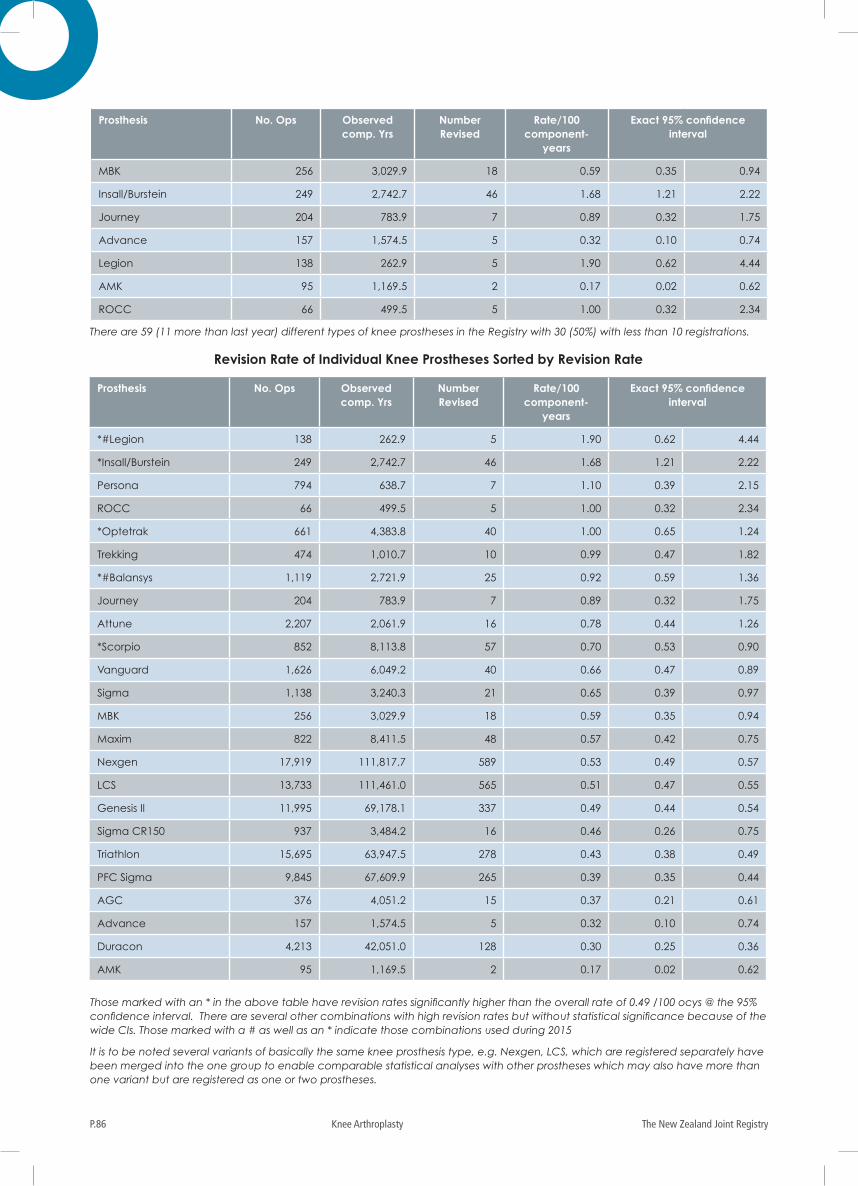
The New Zealand Joint RegistryP.86 Knee Arthroplasty
Prosthesis No. Ops Observed comp. Yrs
Number Revised
Rate/100 component-
years
Exact 95% confidence interval
MBK 256 3,029.9 18 0.59 0.35 0.94
Insall/Burstein 249 2,742.7 46 1.68 1.21 2.22
Journey 204 783.9 7 0.89 0.32 1.75
Advance 157 1,574.5 5 0.32 0.10 0.74
Legion 138 262.9 5 1.90 0.62 4.44
AMK 95 1,169.5 2 0.17 0.02 0.62
ROCC 66 499.5 5 1.00 0.32 2.34
There are 59 (11 more than last year) different types of knee prostheses in the Registry with 30 (50%) with less than 10 registrations.
Those marked with an * in the above table have revision rates significantly higher than the overall rate of 0.49 /100 ocys @ the 95% confidence interval. There are several other combinations with high revision rates but without statistical significance because of the wide CIs. Those marked with a # as well as an * indicate those combinations used during 2015
It is to be noted several variants of basically the same knee prosthesis type, e.g. Nexgen, LCS, which are registered separately have been merged into the one group to enable comparable statistical analyses with other prostheses which may also have more than one variant but are registered as one or two prostheses.
Revision Rate of Individual Knee Prostheses Sorted by Revision Rate
Prosthesis No. Ops Observed comp. Yrs
Number Revised
Rate/100 component-
years
Exact 95% confidence interval
*#Legion 138 262.9 5 1.90 0.62 4.44
*Insall/Burstein 249 2,742.7 46 1.68 1.21 2.22
Persona 794 638.7 7 1.10 0.39 2.15
ROCC 66 499.5 5 1.00 0.32 2.34
*Optetrak 661 4,383.8 40 1.00 0.65 1.24
Trekking 474 1,010.7 10 0.99 0.47 1.82
*#Balansys 1,119 2,721.9 25 0.92 0.59 1.36
Journey 204 783.9 7 0.89 0.32 1.75
Attune 2,207 2,061.9 16 0.78 0.44 1.26
*Scorpio 852 8,113.8 57 0.70 0.53 0.90
Vanguard 1,626 6,049.2 40 0.66 0.47 0.89
Sigma 1,138 3,240.3 21 0.65 0.39 0.97
MBK 256 3,029.9 18 0.59 0.35 0.94
Maxim 822 8,411.5 48 0.57 0.42 0.75
Nexgen 17,919 111,817.7 589 0.53 0.49 0.57
LCS 13,733 111,461.0 565 0.51 0.47 0.55
Genesis II 11,995 69,178.1 337 0.49 0.44 0.54
Sigma CR150 937 3,484.2 16 0.46 0.26 0.75
Triathlon 15,695 63,947.5 278 0.43 0.38 0.49
PFC Sigma 9,845 67,609.9 265 0.39 0.35 0.44
AGC 376 4,051.2 15 0.37 0.21 0.61
Advance 157 1,574.5 5 0.32 0.10 0.74
Duracon 4,213 42,051.0 128 0.30 0.25 0.36
AMK 95 1,169.5 2 0.17 0.02 0.62
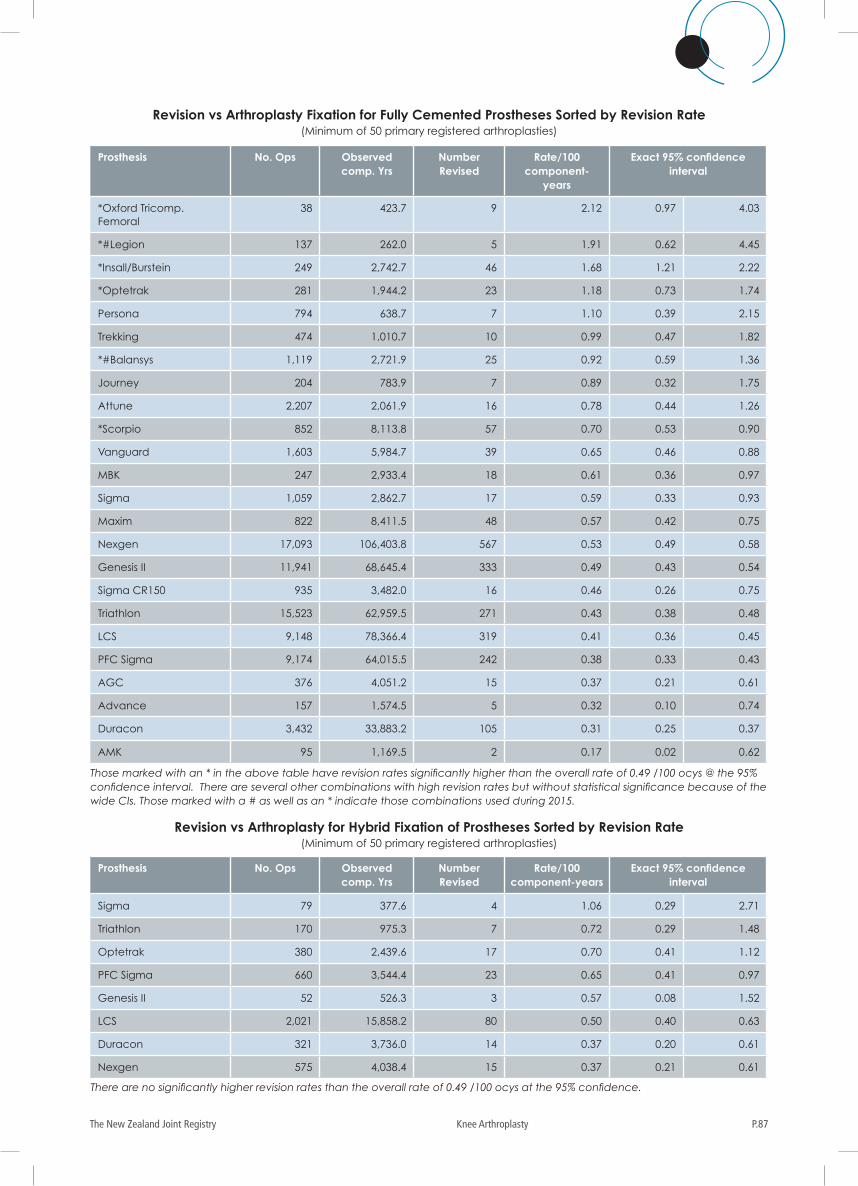
P.87The New Zealand Joint Registry Knee Arthroplasty
Revision vs Arthroplasty Fixation for Fully Cemented Prostheses Sorted by Revision Rate(Minimum of 50 primary registered arthroplasties)
Prosthesis No. Ops Observed comp. Yrs
Number Revised
Rate/100 component-
years
Exact 95% confidence interval
*Oxford Tricomp. Femoral
38 423.7 9 2.12 0.97 4.03
*#Legion 137 262.0 5 1.91 0.62 4.45
*Insall/Burstein 249 2,742.7 46 1.68 1.21 2.22
*Optetrak 281 1,944.2 23 1.18 0.73 1.74
Persona 794 638.7 7 1.10 0.39 2.15
Trekking 474 1,010.7 10 0.99 0.47 1.82
*#Balansys 1,119 2,721.9 25 0.92 0.59 1.36
Journey 204 783.9 7 0.89 0.32 1.75
Attune 2,207 2,061.9 16 0.78 0.44 1.26
*Scorpio 852 8,113.8 57 0.70 0.53 0.90
Vanguard 1,603 5,984.7 39 0.65 0.46 0.88
MBK 247 2,933.4 18 0.61 0.36 0.97
Sigma 1,059 2,862.7 17 0.59 0.33 0.93
Maxim 822 8,411.5 48 0.57 0.42 0.75
Nexgen 17,093 106,403.8 567 0.53 0.49 0.58
Genesis II 11,941 68,645.4 333 0.49 0.43 0.54
Sigma CR150 935 3,482.0 16 0.46 0.26 0.75
Triathlon 15,523 62,959.5 271 0.43 0.38 0.48
LCS 9,148 78,366.4 319 0.41 0.36 0.45
PFC Sigma 9,174 64,015.5 242 0.38 0.33 0.43
AGC 376 4,051.2 15 0.37 0.21 0.61
Advance 157 1,574.5 5 0.32 0.10 0.74
Duracon 3,432 33,883.2 105 0.31 0.25 0.37
AMK 95 1,169.5 2 0.17 0.02 0.62
Those marked with an * in the above table have revision rates significantly higher than the overall rate of 0.49 /100 ocys @ the 95% confidence interval. There are several other combinations with high revision rates but without statistical significance because of the wide CIs. Those marked with a # as well as an * indicate those combinations used during 2015.
There are no significantly higher revision rates than the overall rate of 0.49 /100 ocys at the 95% confidence.
Revision vs Arthroplasty for Hybrid Fixation of Prostheses Sorted by Revision Rate(Minimum of 50 primary registered arthroplasties)
Prosthesis No. Ops Observed comp. Yrs
Number Revised
Rate/100 component-years
Exact 95% confidence interval
Sigma 79 377.6 4 1.06 0.29 2.71
Triathlon 170 975.3 7 0.72 0.29 1.48
Optetrak 380 2,439.6 17 0.70 0.41 1.12
PFC Sigma 660 3,544.4 23 0.65 0.41 0.97
Genesis II 52 526.3 3 0.57 0.08 1.52
LCS 2,021 15,858.2 80 0.50 0.40 0.63
Duracon 321 3,736.0 14 0.37 0.20 0.61
Nexgen 575 4,038.4 15 0.37 0.21 0.61
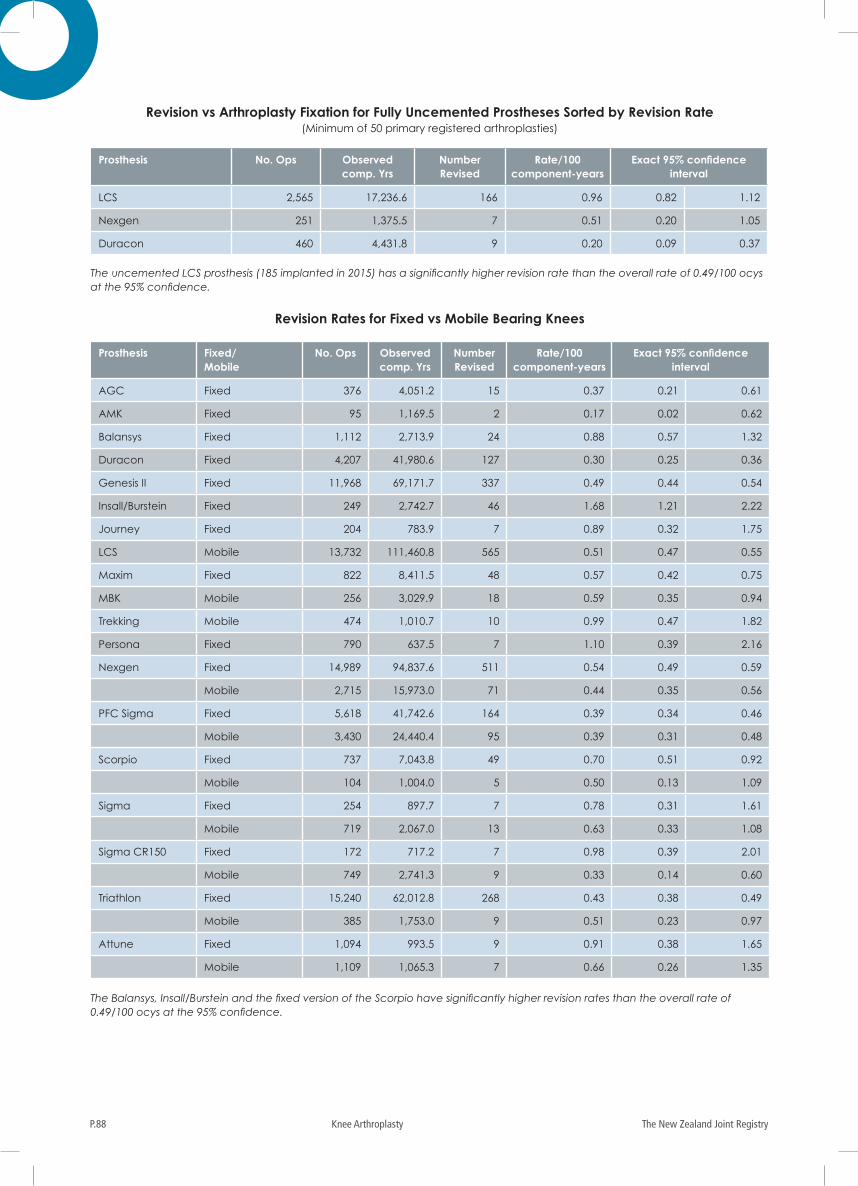
The New Zealand Joint RegistryP.88 Knee Arthroplasty
The uncemented LCS prosthesis (185 implanted in 2015) has a significantly higher revision rate than the overall rate of 0.49/100 ocys at the 95% confidence.
Revision vs Arthroplasty Fixation for Fully Uncemented Prostheses Sorted by Revision Rate(Minimum of 50 primary registered arthroplasties)
Prosthesis No. Ops Observed comp. Yrs
Number Revised
Rate/100 component-years
Exact 95% confidence interval
LCS 2,565 17,236.6 166 0.96 0.82 1.12
Nexgen 251 1,375.5 7 0.51 0.20 1.05
Duracon 460 4,431.8 9 0.20 0.09 0.37
Revision Rates for Fixed vs Mobile Bearing Knees
Prosthesis Fixed/ Mobile
No. Ops Observed comp. Yrs
Number Revised
Rate/100 component-years
Exact 95% confidence interval
AGC Fixed 376 4,051.2 15 0.37 0.21 0.61
AMK Fixed 95 1,169.5 2 0.17 0.02 0.62
Balansys Fixed 1,112 2,713.9 24 0.88 0.57 1.32
Duracon Fixed 4,207 41,980.6 127 0.30 0.25 0.36
Genesis II Fixed 11,968 69,171.7 337 0.49 0.44 0.54
Insall/Burstein Fixed 249 2,742.7 46 1.68 1.21 2.22
Journey Fixed 204 783.9 7 0.89 0.32 1.75
LCS Mobile 13,732 111,460.8 565 0.51 0.47 0.55
Maxim Fixed 822 8,411.5 48 0.57 0.42 0.75
MBK Mobile 256 3,029.9 18 0.59 0.35 0.94
Trekking Mobile 474 1,010.7 10 0.99 0.47 1.82
Persona Fixed 790 637.5 7 1.10 0.39 2.16
Nexgen Fixed 14,989 94,837.6 511 0.54 0.49 0.59
Mobile 2,715 15,973.0 71 0.44 0.35 0.56
PFC Sigma Fixed 5,618 41,742.6 164 0.39 0.34 0.46
Mobile 3,430 24,440.4 95 0.39 0.31 0.48
Scorpio Fixed 737 7,043.8 49 0.70 0.51 0.92
Mobile 104 1,004.0 5 0.50 0.13 1.09
Sigma Fixed 254 897.7 7 0.78 0.31 1.61
Mobile 719 2,067.0 13 0.63 0.33 1.08
Sigma CR150 Fixed 172 717.2 7 0.98 0.39 2.01
Mobile 749 2,741.3 9 0.33 0.14 0.60
Triathlon Fixed 15,240 62,012.8 268 0.43 0.38 0.49
Mobile 385 1,753.0 9 0.51 0.23 0.97
Attune Fixed 1,094 993.5 9 0.91 0.38 1.65
Mobile 1,109 1,065.3 7 0.66 0.26 1.35
The Balansys, Insall/Burstein and the fixed version of the Scorpio have significantly higher revision rates than the overall rate of 0.49/100 ocys at the 95% confidence.
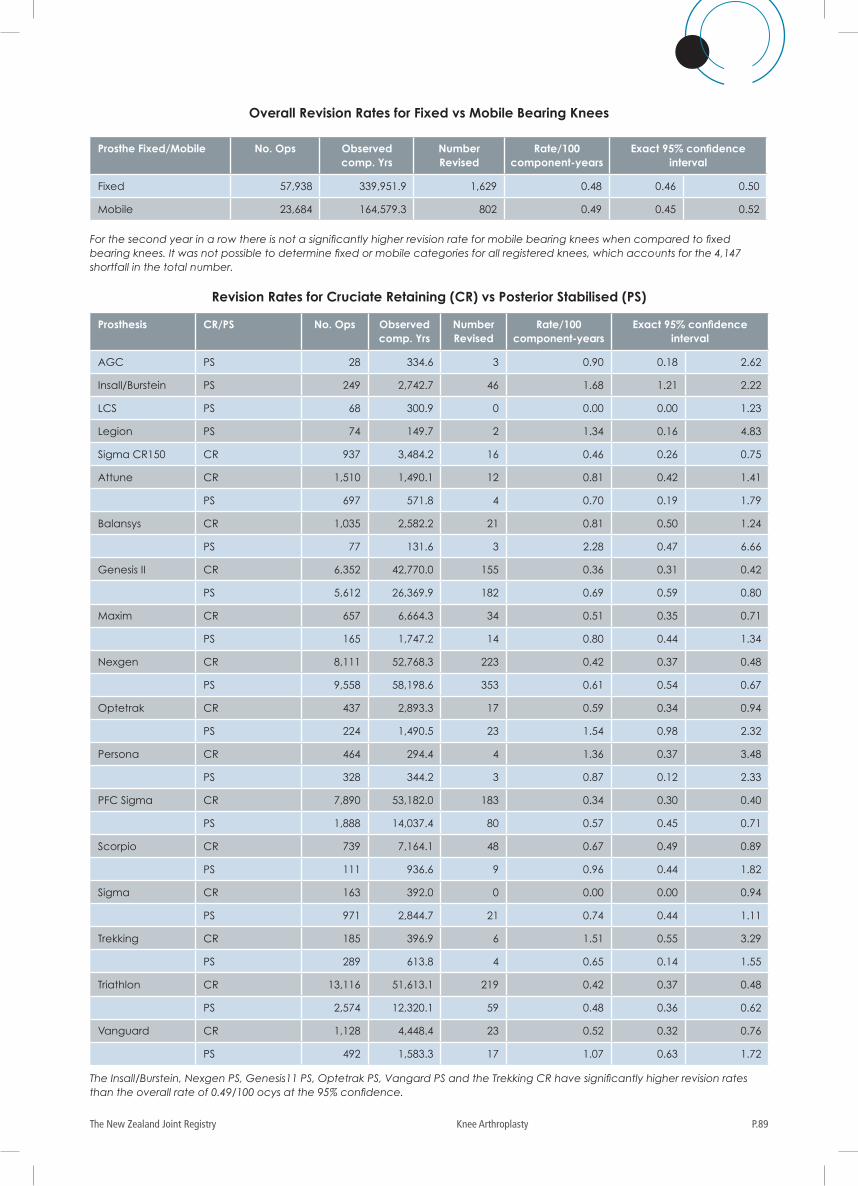
P.89The New Zealand Joint Registry Knee Arthroplasty
For the second year in a row there is not a significantly higher revision rate for mobile bearing knees when compared to fixed bearing knees. It was not possible to determine fixed or mobile categories for all registered knees, which accounts for the 4,147 shortfall in the total number.
The Insall/Burstein, Nexgen PS, Genesis11 PS, Optetrak PS, Vangard PS and the Trekking CR have significantly higher revision rates than the overall rate of 0.49/100 ocys at the 95% confidence.
Overall Revision Rates for Fixed vs Mobile Bearing Knees
Prosthe Fixed/Mobile No. Ops Observed comp. Yrs
Number Revised
Rate/100 component-years
Exact 95% confidence interval
Fixed 57,938 339,951.9 1,629 0.48 0.46 0.50
Mobile 23,684 164,579.3 802 0.49 0.45 0.52
Revision Rates for Cruciate Retaining (CR) vs Posterior Stabilised (PS)
Prosthesis CR/PS No. Ops Observed comp. Yrs
Number Revised
Rate/100 component-years
Exact 95% confidence interval
AGC PS 28 334.6 3 0.90 0.18 2.62
Insall/Burstein PS 249 2,742.7 46 1.68 1.21 2.22
LCS PS 68 300.9 0 0.00 0.00 1.23
Legion PS 74 149.7 2 1.34 0.16 4.83
Sigma CR150 CR 937 3,484.2 16 0.46 0.26 0.75
Attune CR 1,510 1,490.1 12 0.81 0.42 1.41
PS 697 571.8 4 0.70 0.19 1.79
Balansys CR 1,035 2,582.2 21 0.81 0.50 1.24
PS 77 131.6 3 2.28 0.47 6.66
Genesis II CR 6,352 42,770.0 155 0.36 0.31 0.42
PS 5,612 26,369.9 182 0.69 0.59 0.80
Maxim CR 657 6,664.3 34 0.51 0.35 0.71
PS 165 1,747.2 14 0.80 0.44 1.34
Nexgen CR 8,111 52,768.3 223 0.42 0.37 0.48
PS 9,558 58,198.6 353 0.61 0.54 0.67
Optetrak CR 437 2,893.3 17 0.59 0.34 0.94
PS 224 1,490.5 23 1.54 0.98 2.32
Persona CR 464 294.4 4 1.36 0.37 3.48
PS 328 344.2 3 0.87 0.12 2.33
PFC Sigma CR 7,890 53,182.0 183 0.34 0.30 0.40
PS 1,888 14,037.4 80 0.57 0.45 0.71
Scorpio CR 739 7,164.1 48 0.67 0.49 0.89
PS 111 936.6 9 0.96 0.44 1.82
Sigma CR 163 392.0 0 0.00 0.00 0.94
PS 971 2,844.7 21 0.74 0.44 1.11
Trekking CR 185 396.9 6 1.51 0.55 3.29
PS 289 613.8 4 0.65 0.14 1.55
Triathlon CR 13,116 51,613.1 219 0.42 0.37 0.48
PS 2,574 12,320.1 59 0.48 0.36 0.62
Vanguard CR 1,128 4,448.4 23 0.52 0.32 0.76
PS 492 1,583.3 17 1.07 0.63 1.72
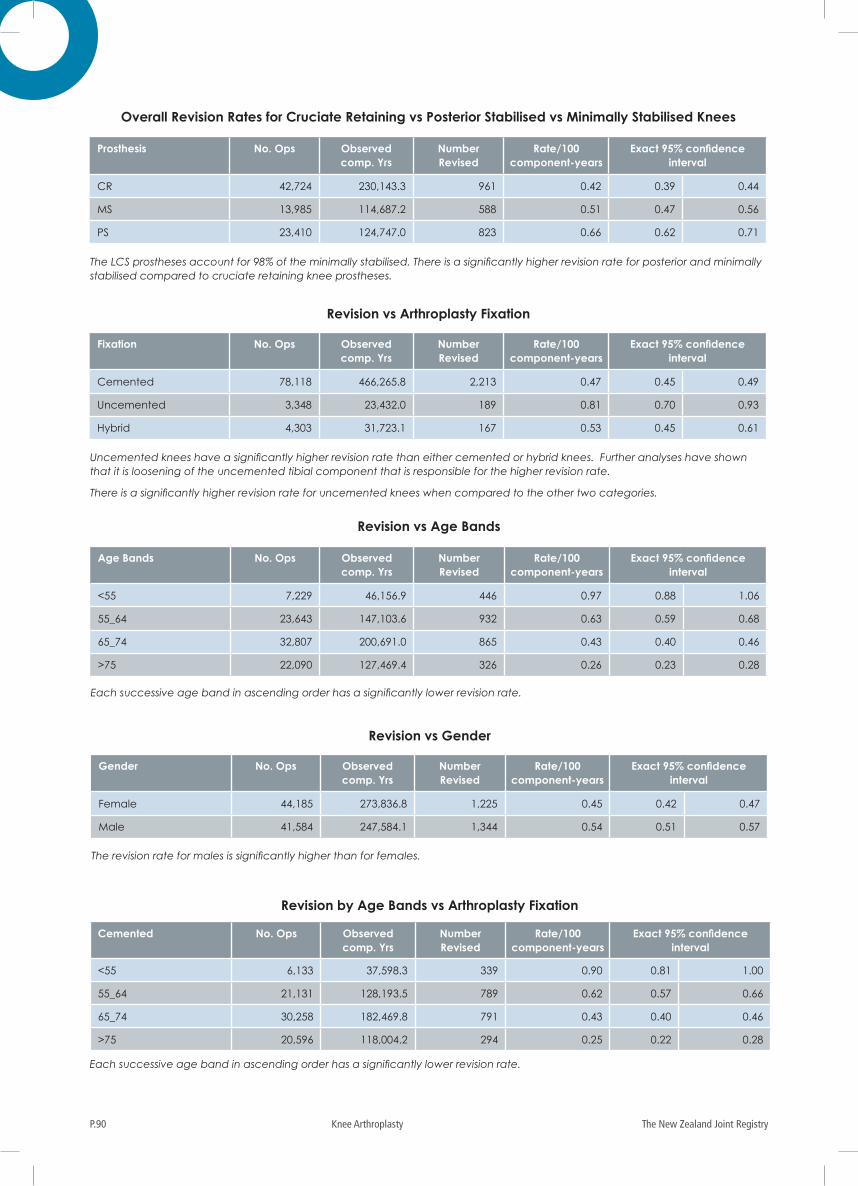
The New Zealand Joint RegistryP.90 Knee Arthroplasty
The LCS prostheses account for 98% of the minimally stabilised. There is a significantly higher revision rate for posterior and minimally stabilised compared to cruciate retaining knee prostheses.
Uncemented knees have a significantly higher revision rate than either cemented or hybrid knees. Further analyses have shown that it is loosening of the uncemented tibial component that is responsible for the higher revision rate.
There is a significantly higher revision rate for uncemented knees when compared to the other two categories.
Each successive age band in ascending order has a significantly lower revision rate.
Overall Revision Rates for Cruciate Retaining vs Posterior Stabilised vs Minimally Stabilised Knees
Revision vs Arthroplasty Fixation
Revision vs Age Bands
Prosthesis No. Ops Observed comp. Yrs
Number Revised
Rate/100 component-years
Exact 95% confidence interval
CR 42,724 230,143.3 961 0.42 0.39 0.44
MS 13,985 114,687.2 588 0.51 0.47 0.56
PS 23,410 124,747.0 823 0.66 0.62 0.71
Fixation No. Ops Observed comp. Yrs
Number Revised
Rate/100 component-years
Exact 95% confidence interval
Cemented 78,118 466,265.8 2,213 0.47 0.45 0.49
Uncemented 3,348 23,432.0 189 0.81 0.70 0.93
Hybrid 4,303 31,723.1 167 0.53 0.45 0.61
Age Bands No. Ops Observed comp. Yrs
Number Revised
Rate/100 component-years
Exact 95% confidence interval
<55 7,229 46,156.9 446 0.97 0.88 1.06
55_64 23,643 147,103.6 932 0.63 0.59 0.68
65_74 32,807 200,691.0 865 0.43 0.40 0.46
>75 22,090 127,469.4 326 0.26 0.23 0.28
The revision rate for males is significantly higher than for females.
Revision vs Gender
Gender No. Ops Observed comp. Yrs
Number Revised
Rate/100 component-years
Exact 95% confidence interval
Female 44,185 273,836.8 1,225 0.45 0.42 0.47
Male 41,584 247,584.1 1,344 0.54 0.51 0.57
Cemented No. Ops Observed comp. Yrs
Number Revised
Rate/100 component-years
Exact 95% confidence interval
<55 6,133 37,598.3 339 0.90 0.81 1.00
55_64 21,131 128,193.5 789 0.62 0.57 0.66
65_74 30,258 182,469.8 791 0.43 0.40 0.46
>75 20,596 118,004.2 294 0.25 0.22 0.28
Each successive age band in ascending order has a significantly lower revision rate.
Revision by Age Bands vs Arthroplasty Fixation
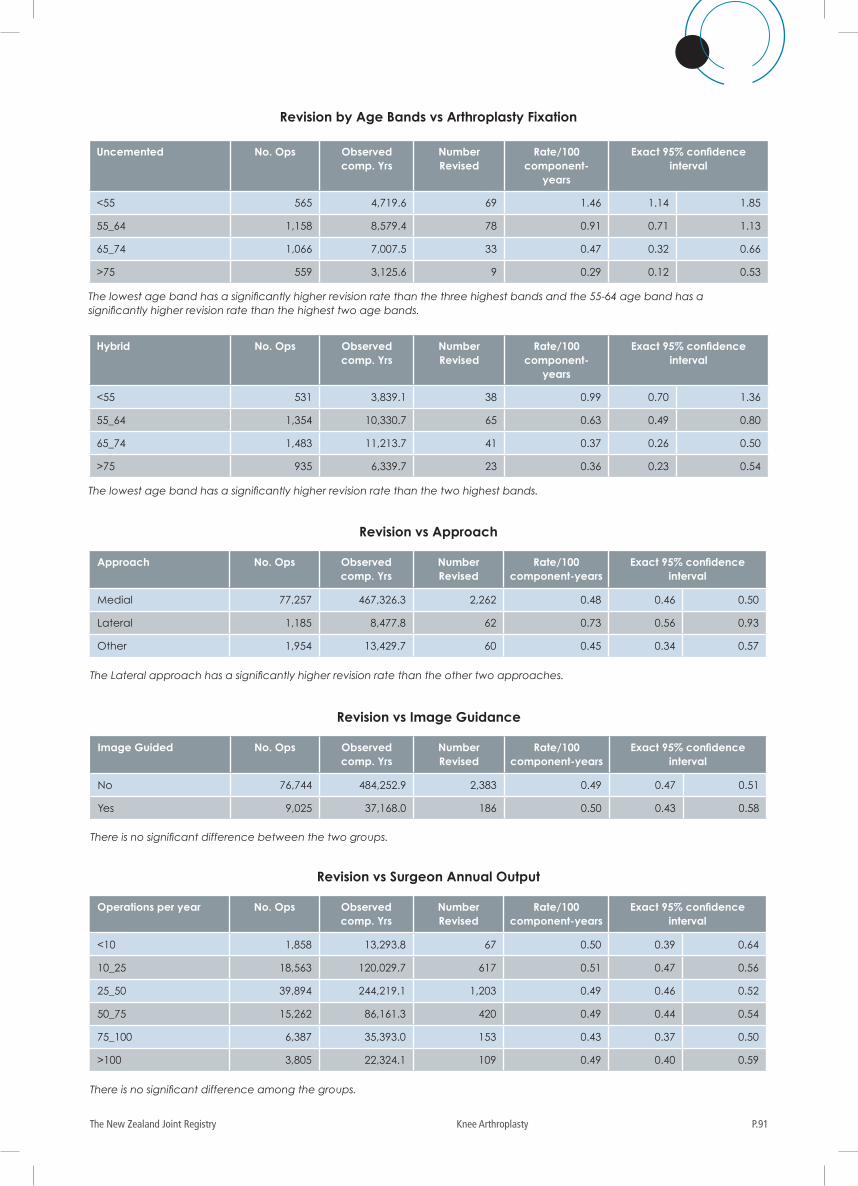
P.91The New Zealand Joint Registry Knee Arthroplasty
Uncemented No. Ops Observed comp. Yrs
Number Revised
Rate/100 component-
years
Exact 95% confidence interval
<55 565 4,719.6 69 1.46 1.14 1.85
55_64 1,158 8,579.4 78 0.91 0.71 1.13
65_74 1,066 7,007.5 33 0.47 0.32 0.66
>75 559 3,125.6 9 0.29 0.12 0.53
The lowest age band has a significantly higher revision rate than the three highest bands and the 55-64 age band has a significantly higher revision rate than the highest two age bands.
Hybrid No. Ops Observed comp. Yrs
Number Revised
Rate/100 component-
years
Exact 95% confidence interval
<55 531 3,839.1 38 0.99 0.70 1.36
55_64 1,354 10,330.7 65 0.63 0.49 0.80
65_74 1,483 11,213.7 41 0.37 0.26 0.50
>75 935 6,339.7 23 0.36 0.23 0.54
The lowest age band has a significantly higher revision rate than the two highest bands.
Revision by Age Bands vs Arthroplasty Fixation
The Lateral approach has a significantly higher revision rate than the other two approaches.
Revision vs Approach
Approach No. Ops Observed comp. Yrs
Number Revised
Rate/100 component-years
Exact 95% confidence interval
Medial 77,257 467,326.3 2,262 0.48 0.46 0.50
Lateral 1,185 8,477.8 62 0.73 0.56 0.93
Other 1,954 13,429.7 60 0.45 0.34 0.57
There is no significant difference between the two groups.
Revision vs Image Guidance
Image Guided No. Ops Observed comp. Yrs
Number Revised
Rate/100 component-years
Exact 95% confidence interval
No 76,744 484,252.9 2,383 0.49 0.47 0.51
Yes 9,025 37,168.0 186 0.50 0.43 0.58
There is no significant difference among the groups.
Revision vs Surgeon Annual Output
Operations per year No. Ops Observed comp. Yrs
Number Revised
Rate/100 component-years
Exact 95% confidence interval
<10 1,858 13,293.8 67 0.50 0.39 0.64
10_25 18,563 120,029.7 617 0.51 0.47 0.56
25_50 39,894 244,219.1 1,203 0.49 0.46 0.52
50_75 15,262 86,161.3 420 0.49 0.44 0.54
75_100 6,387 35,393.0 153 0.43 0.37 0.50
>100 3,805 22,324.1 109 0.49 0.40 0.59
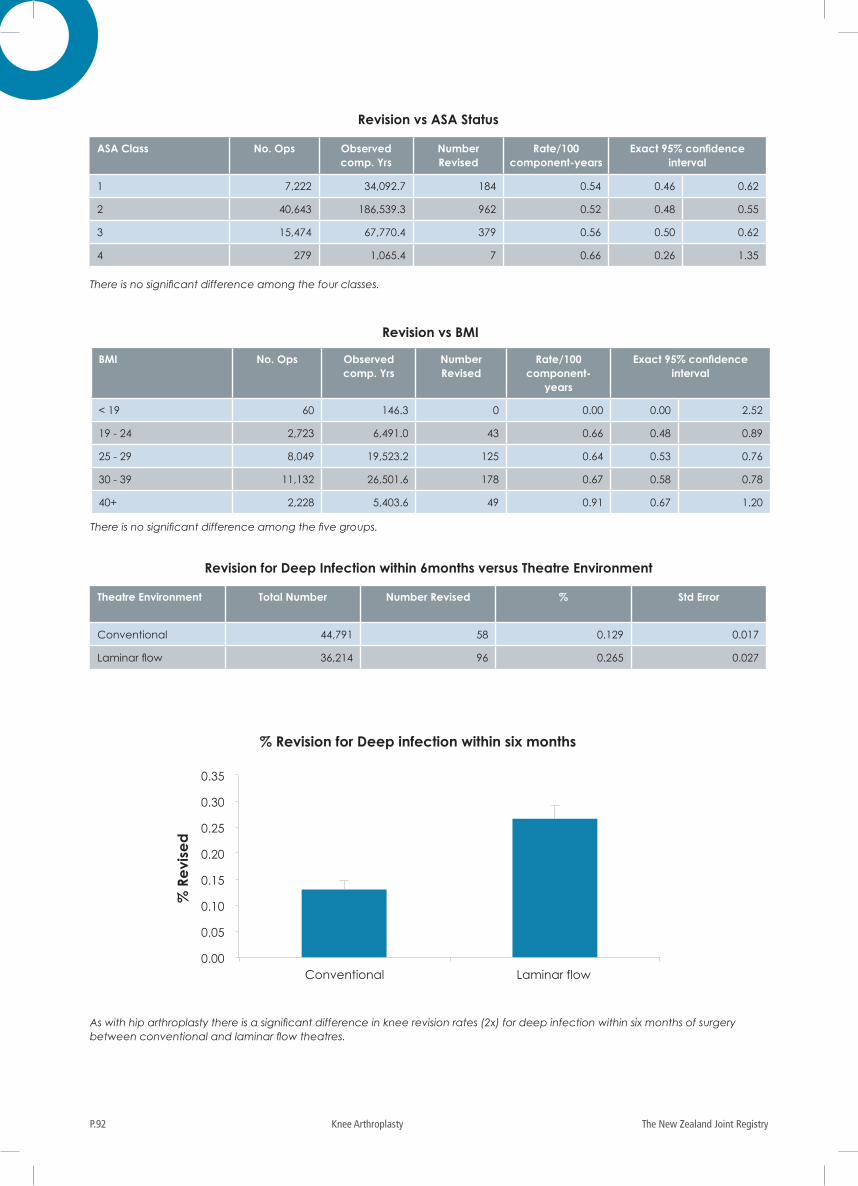
The New Zealand Joint RegistryP.92 Knee Arthroplasty
BMI No. Ops Observed comp. Yrs
Number Revised
Rate/100 component-
years
Exact 95% confidence interval
< 19 60 146.3 0 0.00 0.00 2.52
19 - 24 2,723 6,491.0 43 0.66 0.48 0.89
25 - 29 8,049 19,523.2 125 0.64 0.53 0.76
30 - 39 11,132 26,501.6 178 0.67 0.58 0.78
40+ 2,228 5,403.6 49 0.91 0.67 1.20
There is no significant difference among the five groups.
Revision vs BMI
There is no significant difference among the four classes.
Revision vs ASA Status
ASA Class No. Ops Observed comp. Yrs
Number Revised
Rate/100 component-years
Exact 95% confidence interval
1 7,222 34,092.7 184 0.54 0.46 0.62
2 40,643 186,539.3 962 0.52 0.48 0.55
3 15,474 67,770.4 379 0.56 0.50 0.62
4 279 1,065.4 7 0.66 0.26 1.35
Revision for Deep Infection within 6months versus Theatre Environment
Theatre Environment Total Number Number Revised % Std Error
Conventional 44,791 58 0.129 0.017
Laminar flow 36,214 96 0.265 0.027
As with hip arthroplasty there is a significant difference in knee revision rates (2x) for deep infection within six months of surgery between conventional and laminar flow theatres.
0.00
0.05
0.10
0.15
0.20
0.25
0.30
0.35
Conventional Laminar flow
% R
evi
sed
% Revision for Deep infection within six months
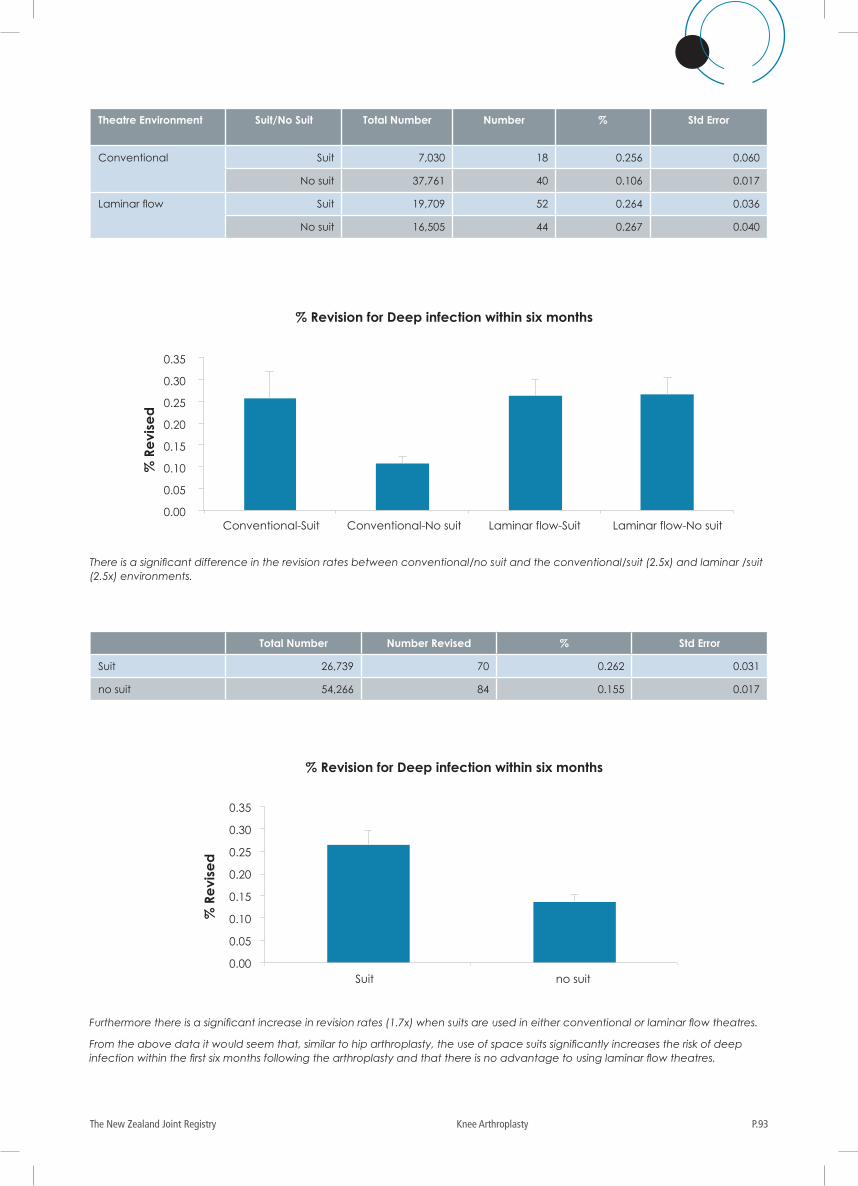
P.93The New Zealand Joint Registry Knee Arthroplasty
Theatre Environment Suit/No Suit Total Number Number % Std Error
Conventional Suit 7,030 18 0.256 0.060
No suit 37,761 40 0.106 0.017
Laminar flow Suit 19,709 52 0.264 0.036
No suit 16,505 44 0.267 0.040
There is a significant difference in the revision rates between conventional/no suit and the conventional/suit (2.5x) and laminar /suit (2.5x) environments.
0.00
0.05
0.10
0.15
0.20
0.25
0.30
0.35
Conventional-Suit Conventional-No suit Laminar flow-Suit Laminar flow-No suit
% R
evi
sed
% Revision for Deep infection within six months
Total Number Number Revised % Std Error
Suit 26,739 70 0.262 0.031
no suit 54,266 84 0.155 0.017
Furthermore there is a significant increase in revision rates (1.7x) when suits are used in either conventional or laminar flow theatres.
From the above data it would seem that, similar to hip arthroplasty, the use of space suits significantly increases the risk of deep infection within the first six months following the arthroplasty and that there is no advantage to using laminar flow theatres.
0.00
0.05
0.10
0.15
0.20
0.25
0.30
0.35
Suit no suit
% R
evi
sed
% Revision for Deep infection within six months
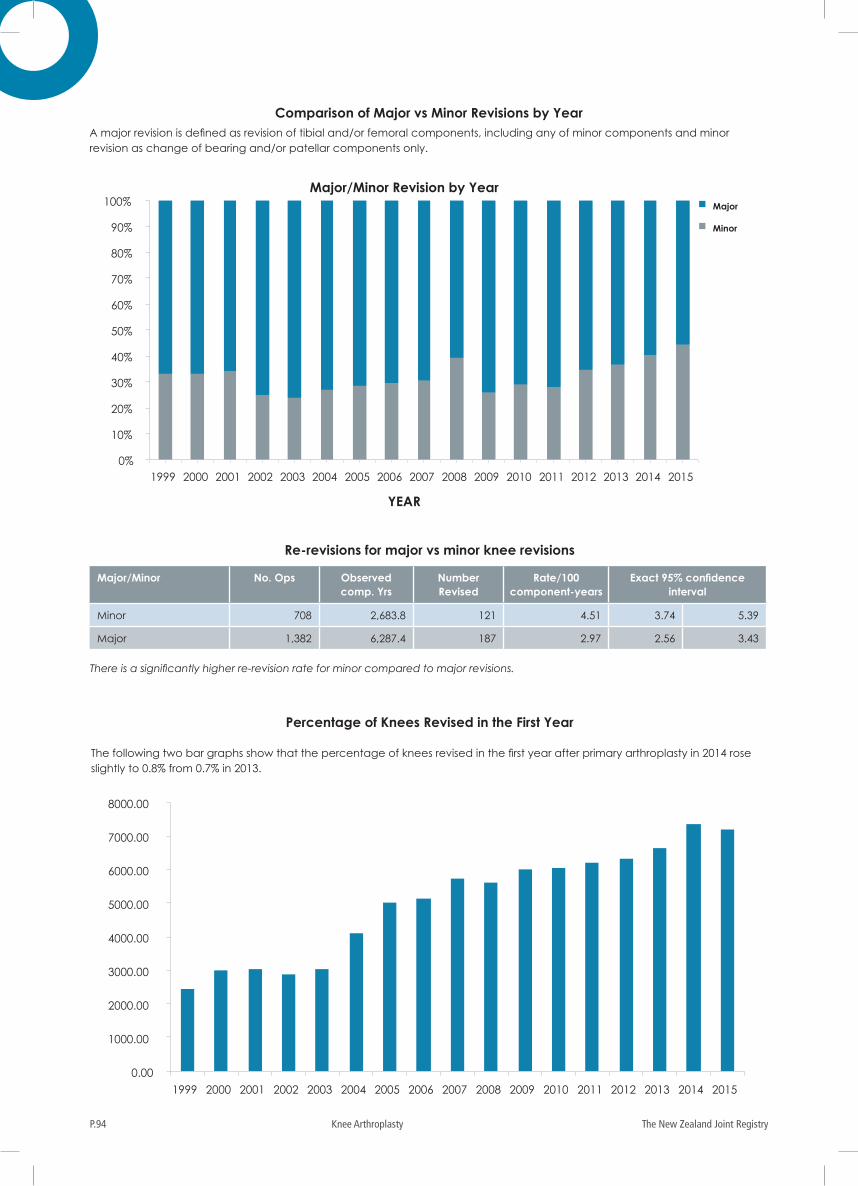
The New Zealand Joint RegistryP.94 Knee Arthroplasty
Comparison of Major vs Minor Revisions by YearA major revision is defined as revision of tibial and/or femoral components, including any of minor components and minor revision as change of bearing and/or patellar components only.
0%
10%
20%
30%
40%
50%
60%
70%
80%
90%
100%
1999 2000 2001 2002 2003 2004 2005 2006 2007 2008 2009 2010 2011 2012 2013 2014 2015
YEAR
Major/Minor Revision by Year Major
Minor
There is a significantly higher re-revision rate for minor compared to major revisions.
Re-revisions for major vs minor knee revisions
Percentage of Knees Revised in the First Year
Major/Minor No. Ops Observed comp. Yrs
Number Revised
Rate/100 component-years
Exact 95% confidence interval
Minor 708 2,683.8 121 4.51 3.74 5.39
Major 1,382 6,287.4 187 2.97 2.56 3.43
0.00
1000.00
2000.00
3000.00
4000.00
5000.00
6000.00
7000.00
8000.00
1999 2000 2001 2002 2003 2004 2005 2006 2007 2008 2009 2010 2011 2012 2013 2014 2015
Number of operations by year The following two bar graphs show that the percentage of knees revised in the first year after primary arthroplasty in 2014 rose slightly to 0.8% from 0.7% in 2013.
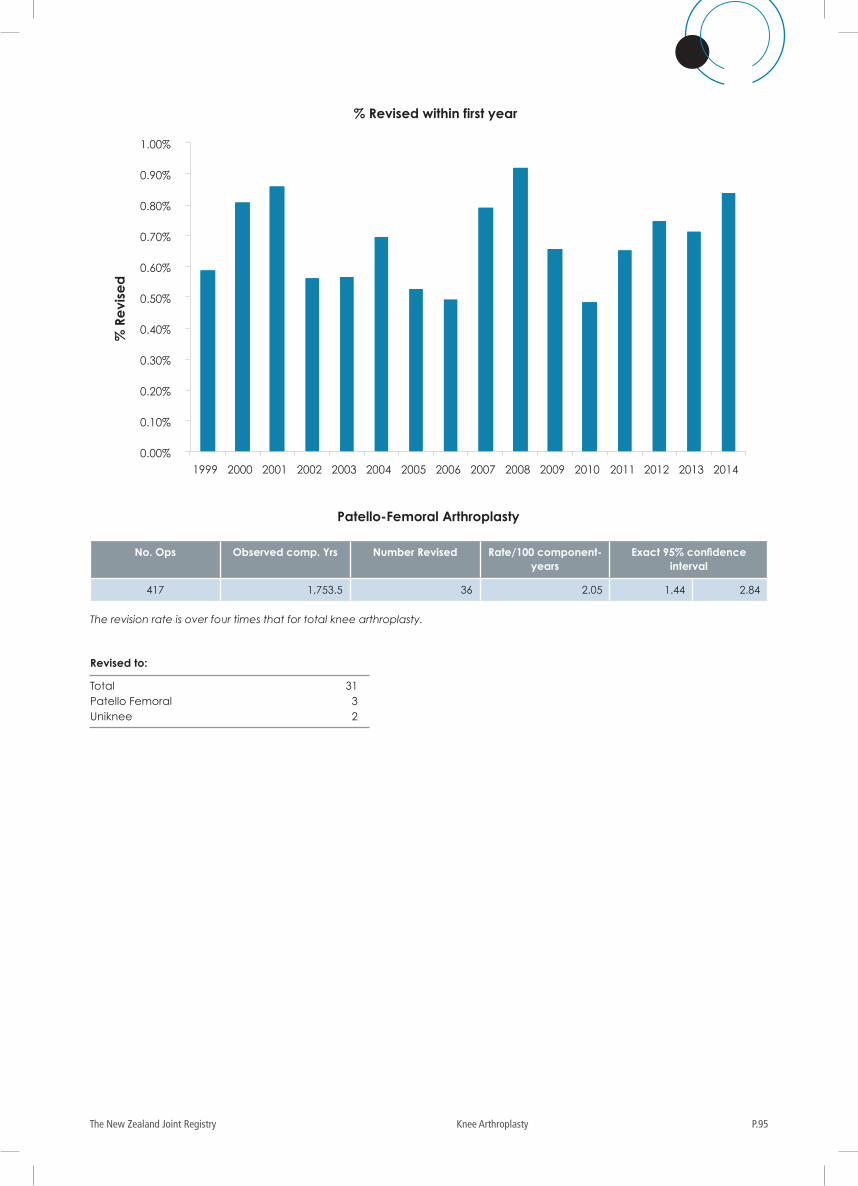
P.95The New Zealand Joint Registry Knee Arthroplasty
The revision rate is over four times that for total knee arthroplasty.
Revised to:
Total 31Patello Femoral 3Uniknee 2
Patello-Femoral Arthroplasty
No. Ops Observed comp. Yrs Number Revised Rate/100 component-years
Exact 95% confidence interval
417 1,753.5 36 2.05 1.44 2.84
0.00%
0.10%
0.20%
0.30%
0.40%
0.50%
0.60%
0.70%
0.80%
0.90%
1.00%
1999 2000 2001 2002 2003 2004 2005 2006 2007 2008 2009 2010 2011 2012 2013 2014
% R
evi
sed
% Revised within first year
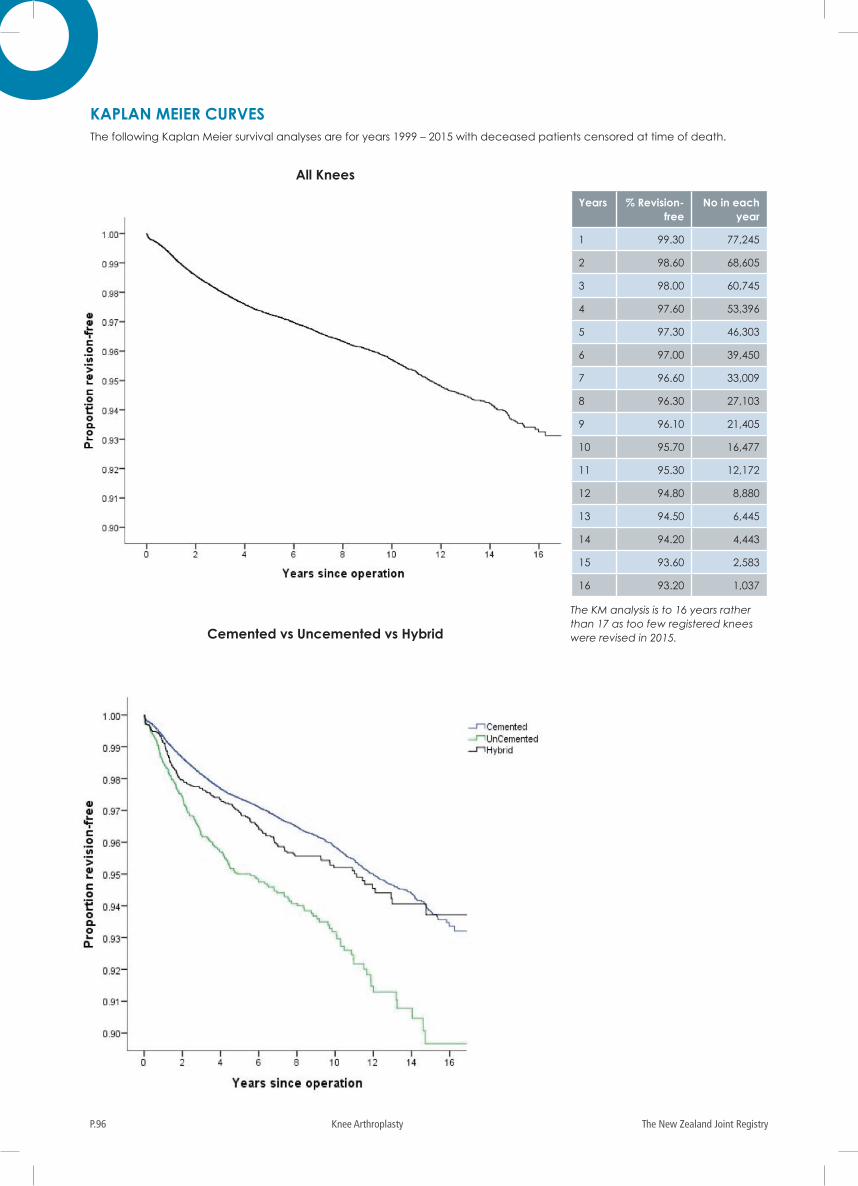
The New Zealand Joint RegistryP.96 Knee Arthroplasty
All Knees
KAPLAN MEIER CURVESThe following Kaplan Meier survival analyses are for years 1999 – 2015 with deceased patients censored at time of death.
Years % Revision-free
No in each year
1 99.30 77,245
2 98.60 68,605
3 98.00 60,745
4 97.60 53,396
5 97.30 46,303
6 97.00 39,450
7 96.60 33,009
8 96.30 27,103
9 96.10 21,405
10 95.70 16,477
11 95.30 12,172
12 94.80 8,880
13 94.50 6,445
14 94.20 4,443
15 93.60 2,583
16 93.20 1,037
The KM analysis is to 16 years rather than 17 as too few registered knees were revised in 2015.Cemented vs Uncemented vs Hybrid
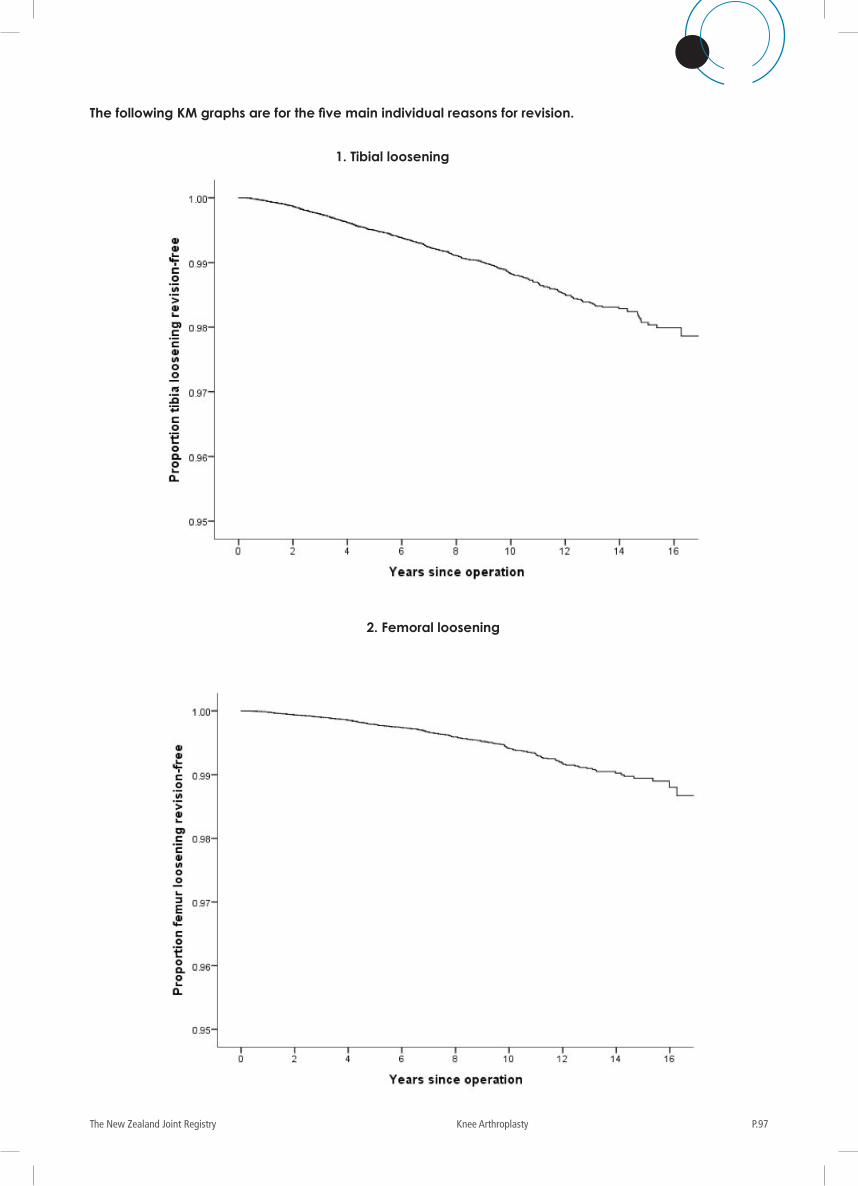
P.97The New Zealand Joint Registry Knee Arthroplasty
The following KM graphs are for the five main individual reasons for revision.
1. Tibial loosening
2. Femoral loosening
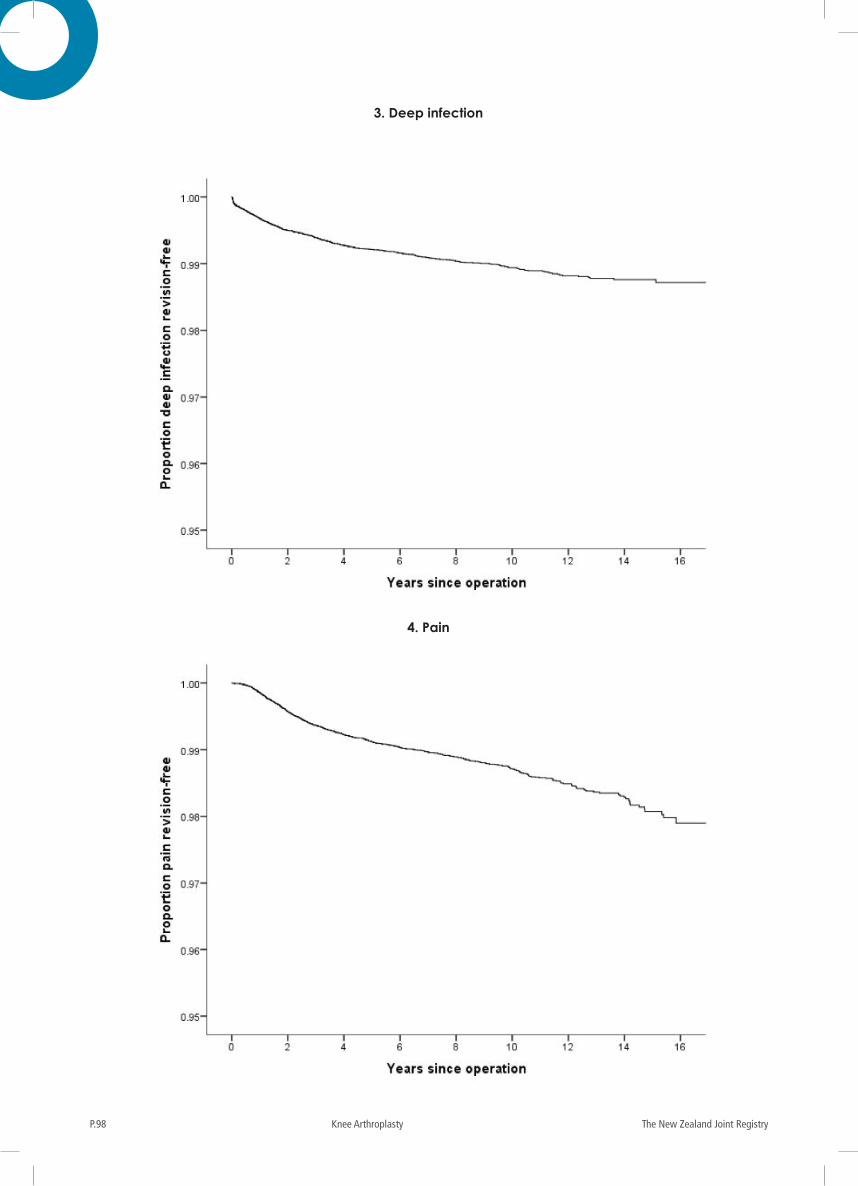
The New Zealand Joint RegistryP.98 Knee Arthroplasty
3. Deep infection
4. Pain
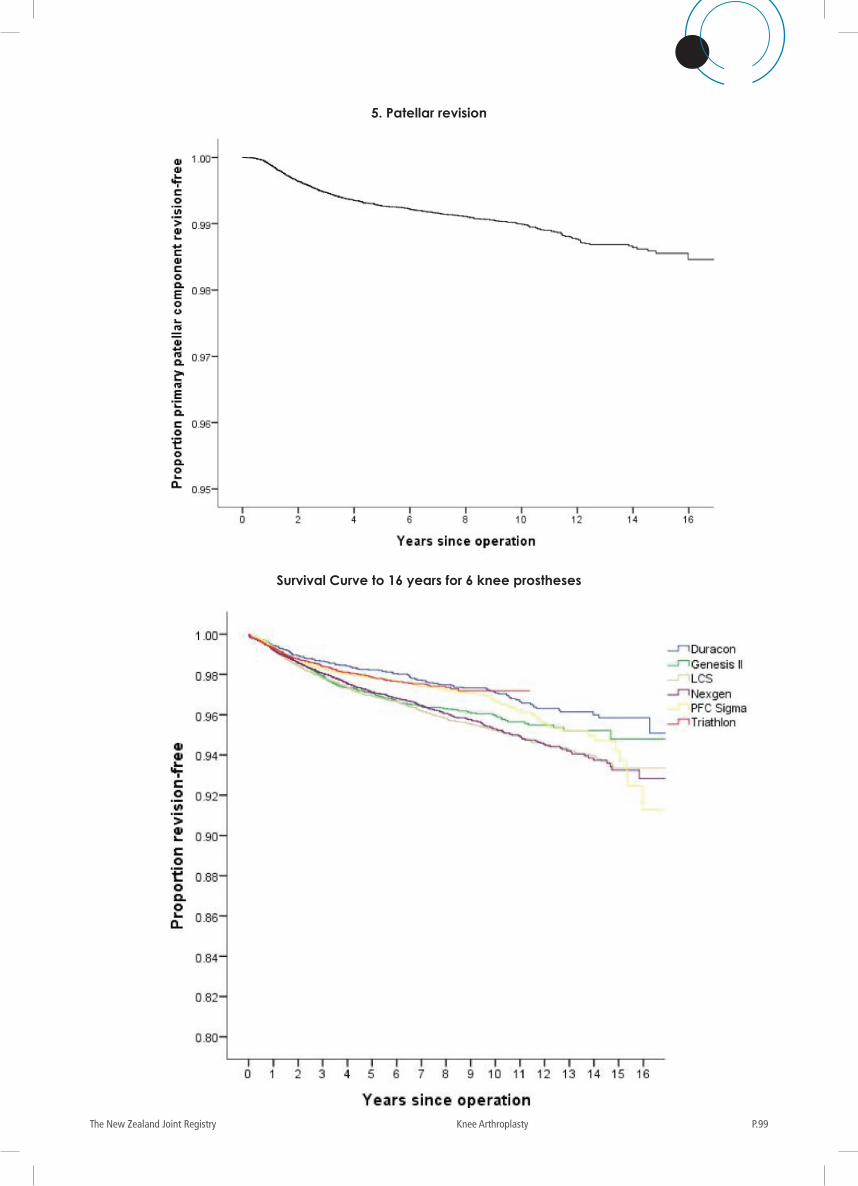
P.99The New Zealand Joint Registry Knee Arthroplasty
5. Patellar revision
Survival Curve to 16 years for 6 knee prostheses
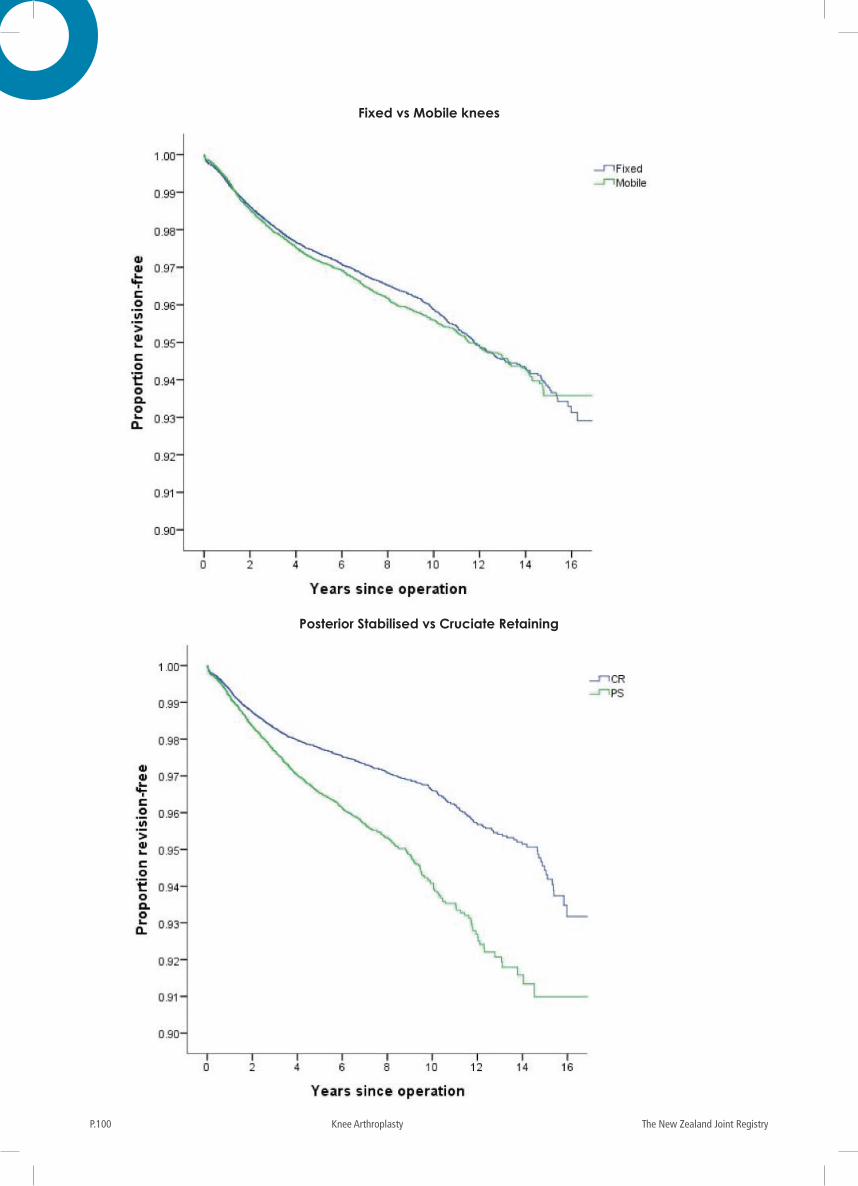
The New Zealand Joint RegistryP.100 Knee Arthroplasty
Fixed vs Mobile knees
Posterior Stabilised vs Cruciate Retaining
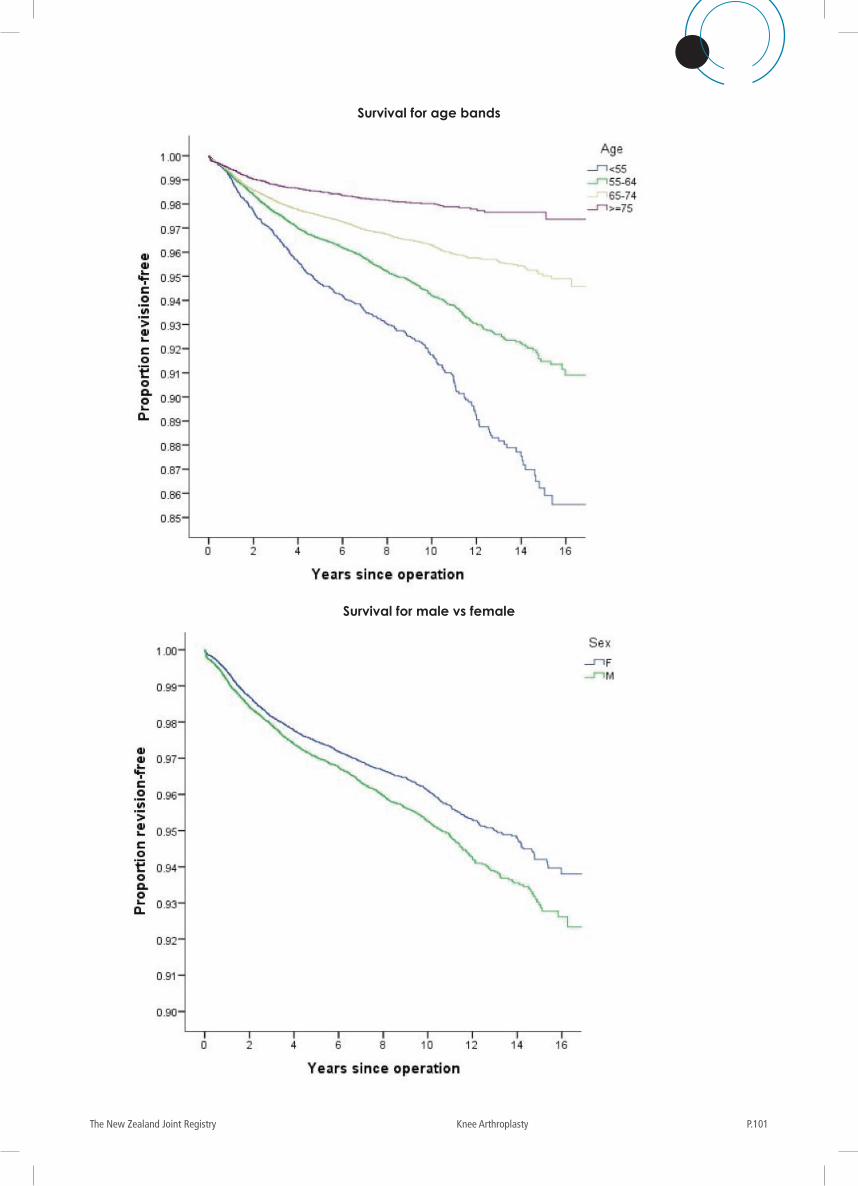
P.101The New Zealand Joint Registry Knee Arthroplasty
Survival for age bands
Survival for male vs female
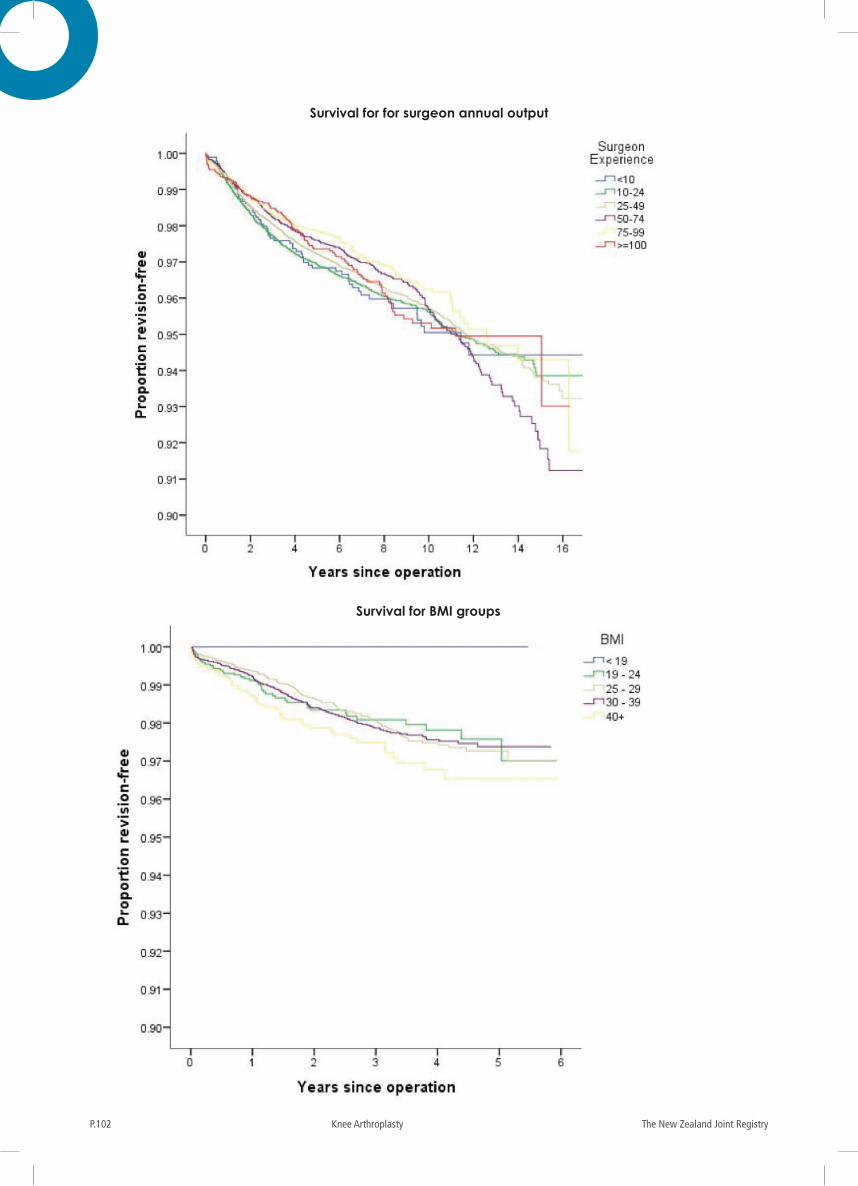
The New Zealand Joint RegistryP.102 Knee Arthroplasty
Survival for for surgeon annual output
Survival for BMI groups
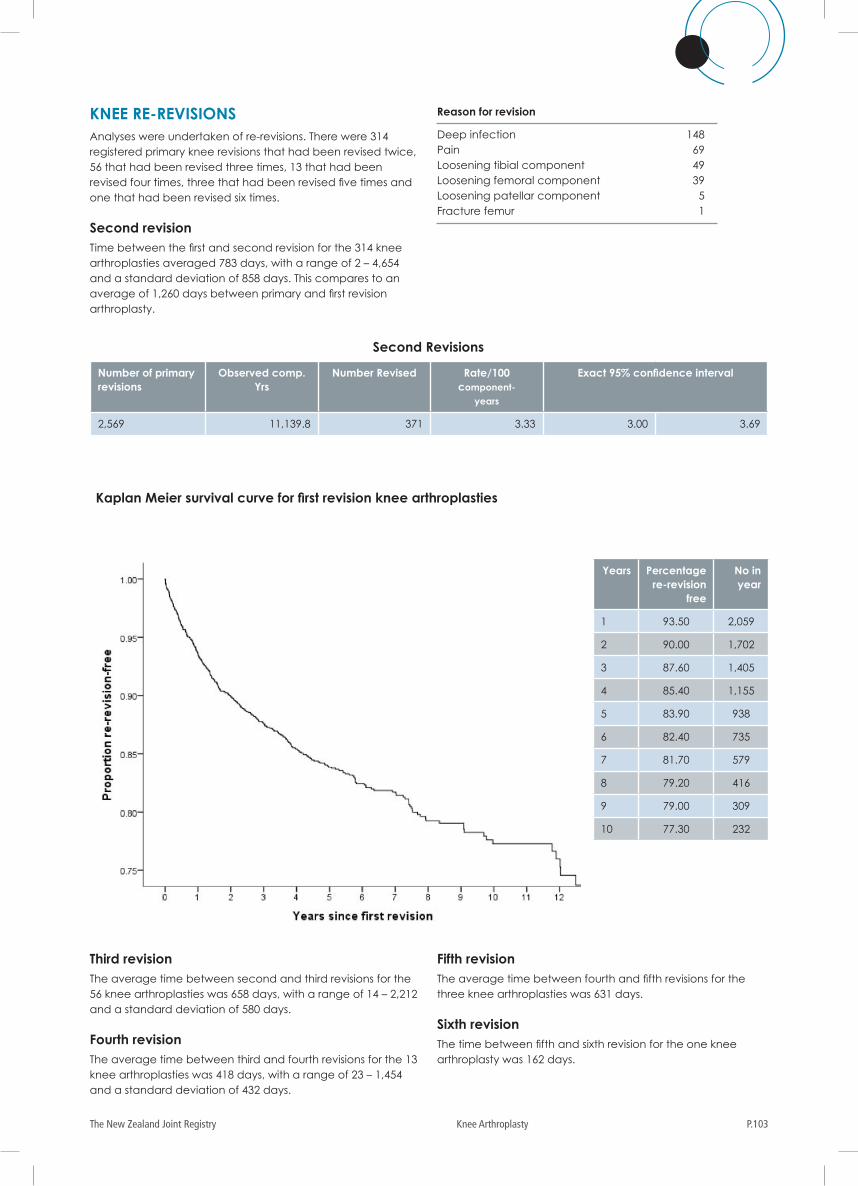
P.103The New Zealand Joint Registry Knee Arthroplasty
KNEE RE-REVISIONSAnalyses were undertaken of re-revisions. There were 314 registered primary knee revisions that had been revised twice, 56 that had been revised three times, 13 that had been revised four times, three that had been revised five times and one that had been revised six times.
Second revision Time between the first and second revision for the 314 knee arthroplasties averaged 783 days, with a range of 2 – 4,654 and a standard deviation of 858 days. This compares to an average of 1,260 days between primary and first revision arthroplasty.
Reason for revision
Deep infection 148Pain 69Loosening tibial component 49Loosening femoral component 39Loosening patellar component 5Fracture femur 1
Number of primary revisions
Observed comp. Yrs
Number Revised Rate/100 component-
years
Exact 95% confidence interval
2,569 11,139.8 371 3.33 3.00 3.69
Second Revisions
Years Percentage re-revision
free
No in year
1 93.50 2,059
2 90.00 1,702
3 87.60 1,405
4 85.40 1,155
5 83.90 938
6 82.40 735
7 81.70 579
8 79.20 416
9 79.00 309
10 77.30 232
Third revision The average time between second and third revisions for the 56 knee arthroplasties was 658 days, with a range of 14 – 2,212 and a standard deviation of 580 days.
Fourth revision The average time between third and fourth revisions for the 13 knee arthroplasties was 418 days, with a range of 23 – 1,454 and a standard deviation of 432 days.
Fifth revision The average time between fourth and fifth revisions for the three knee arthroplasties was 631 days.
Sixth revision The time between fifth and sixth revision for the one knee arthroplasty was 162 days.
Kaplan Meier survival curve for first revision knee arthroplasties
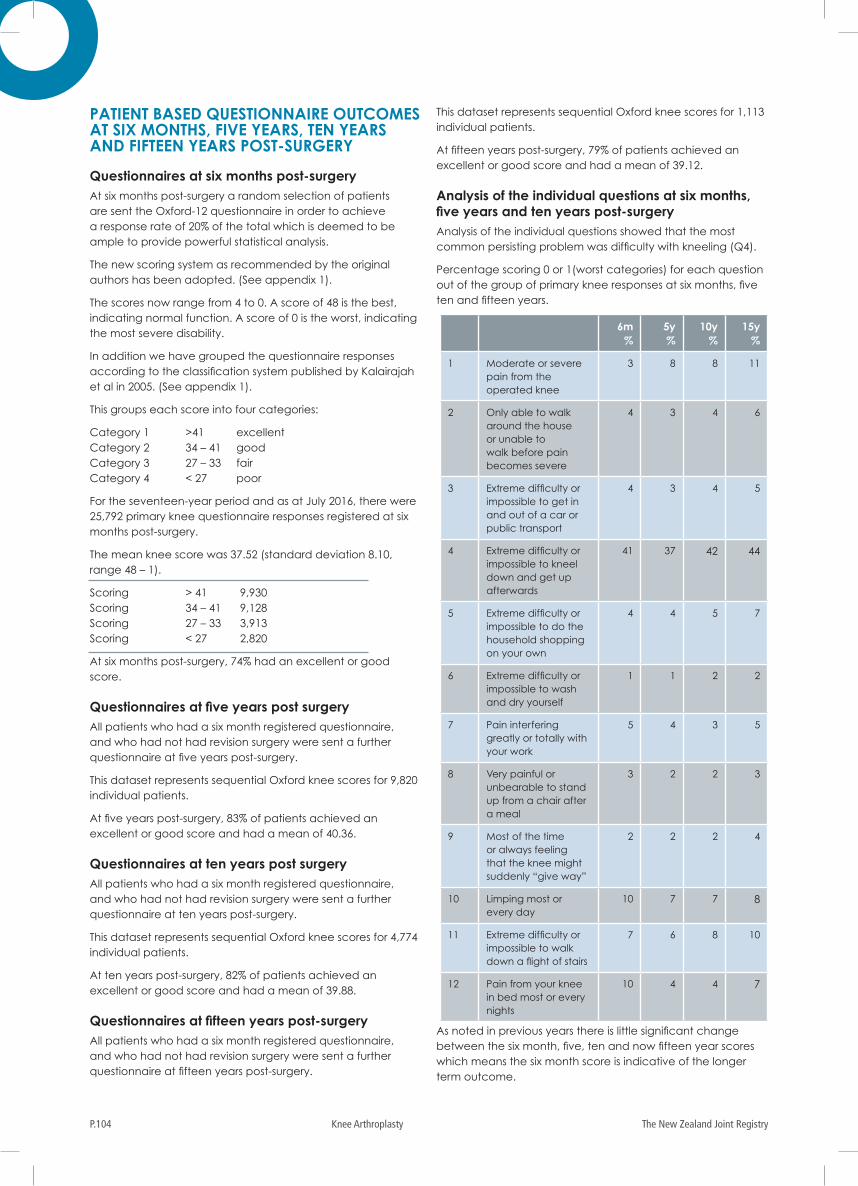
The New Zealand Joint RegistryP.104 Knee Arthroplasty
PATIENT BASED QUESTIONNAIRE OUTCOMES AT SIX MONTHS, FIVE YEARS, TEN YEARS AND FIFTEEN YEARS POST-SURGERY
Questionnaires at six months post-surgeryAt six months post-surgery a random selection of patients are sent the Oxford-12 questionnaire in order to achieve a response rate of 20% of the total which is deemed to be ample to provide powerful statistical analysis.
The new scoring system as recommended by the original authors has been adopted. (See appendix 1).
The scores now range from 4 to 0. A score of 48 is the best, indicating normal function. A score of 0 is the worst, indicating the most severe disability.
In addition we have grouped the questionnaire responses according to the classification system published by Kalairajah et al in 2005. (See appendix 1).
This groups each score into four categories:
Category 1 >41 excellent Category 2 34 – 41 good Category 3 27 – 33 fair Category 4 < 27 poor
For the seventeen-year period and as at July 2016, there were 25,792 primary knee questionnaire responses registered at six months post-surgery.
The mean knee score was 37.52 (standard deviation 8.10, range 48 – 1).
Scoring > 41 9,930 Scoring 34 – 41 9,128 Scoring 27 – 33 3,913 Scoring < 27 2,820
At six months post-surgery, 74% had an excellent or good score.
Questionnaires at five years post surgeryAll patients who had a six month registered questionnaire, and who had not had revision surgery were sent a further questionnaire at five years post-surgery.
This dataset represents sequential Oxford knee scores for 9,820 individual patients.
At five years post-surgery, 83% of patients achieved an excellent or good score and had a mean of 40.36.
Questionnaires at ten years post surgeryAll patients who had a six month registered questionnaire, and who had not had revision surgery were sent a further questionnaire at ten years post-surgery.
This dataset represents sequential Oxford knee scores for 4,774 individual patients.
At ten years post-surgery, 82% of patients achieved an excellent or good score and had a mean of 39.88.
Questionnaires at fifteen years post-surgeryAll patients who had a six month registered questionnaire, and who had not had revision surgery were sent a further questionnaire at fifteen years post-surgery.
This dataset represents sequential Oxford knee scores for 1,113 individual patients.
At fifteen years post-surgery, 79% of patients achieved an excellent or good score and had a mean of 39.12.
Analysis of the individual questions at six months, five years and ten years post-surgeryAnalysis of the individual questions showed that the most common persisting problem was difficulty with kneeling (Q4).
Percentage scoring 0 or 1(worst categories) for each question out of the group of primary knee responses at six months, five ten and fifteen years.
As noted in previous years there is little significant change between the six month, five, ten and now fifteen year scores which means the six month score is indicative of the longer term outcome.
6m %
5y %
10y %
15y %
1 Moderate or severe pain from the operated knee
3 8 8 11
2 Only able to walk around the house or unable to walk before pain becomes severe
4 3 4 6
3 Extreme difficulty or impossible to get in and out of a car or public transport
4 3 4 5
4 Extreme difficulty or impossible to kneel down and get up afterwards
41 37 42 44
5 Extreme difficulty or impossible to do the household shopping on your own
4 4 5 7
6 Extreme difficulty or impossible to wash and dry yourself
1 1 2 2
7 Pain interfering greatly or totally with your work
5 4 3 5
8 Very painful or unbearable to stand up from a chair after a meal
3 2 2 3
9 Most of the time or always feeling that the knee might suddenly “give way”
2 2 2 4
10 Limping most or every day
10 7 7 8
11 Extreme difficulty or impossible to walk down a flight of stairs
7 6 8 10
12 Pain from your knee in bed most or every nights
10 4 4 7
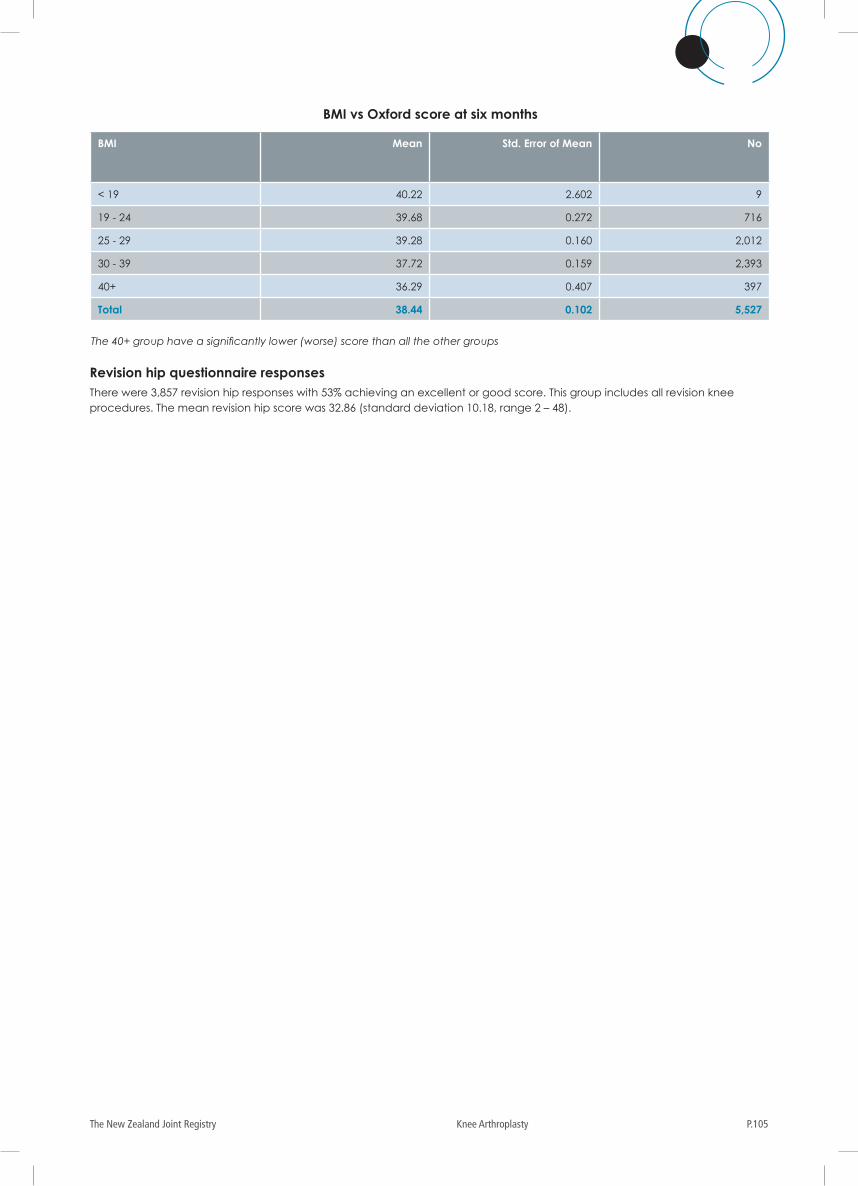
P.105The New Zealand Joint Registry Knee Arthroplasty
BMI vs Oxford score at six months
BMI Mean Std. Error of Mean No
< 19 40.22 2.602 9
19 - 24 39.68 0.272 716
25 - 29 39.28 0.160 2,012
30 - 39 37.72 0.159 2,393
40+ 36.29 0.407 397
Total 38.44 0.102 5,527
The 40+ group have a significantly lower (worse) score than all the other groups
Revision hip questionnaire responsesThere were 3,857 revision hip responses with 53% achieving an excellent or good score. This group includes all revision knee procedures. The mean revision hip score was 32.86 (standard deviation 10.18, range 2 – 48).
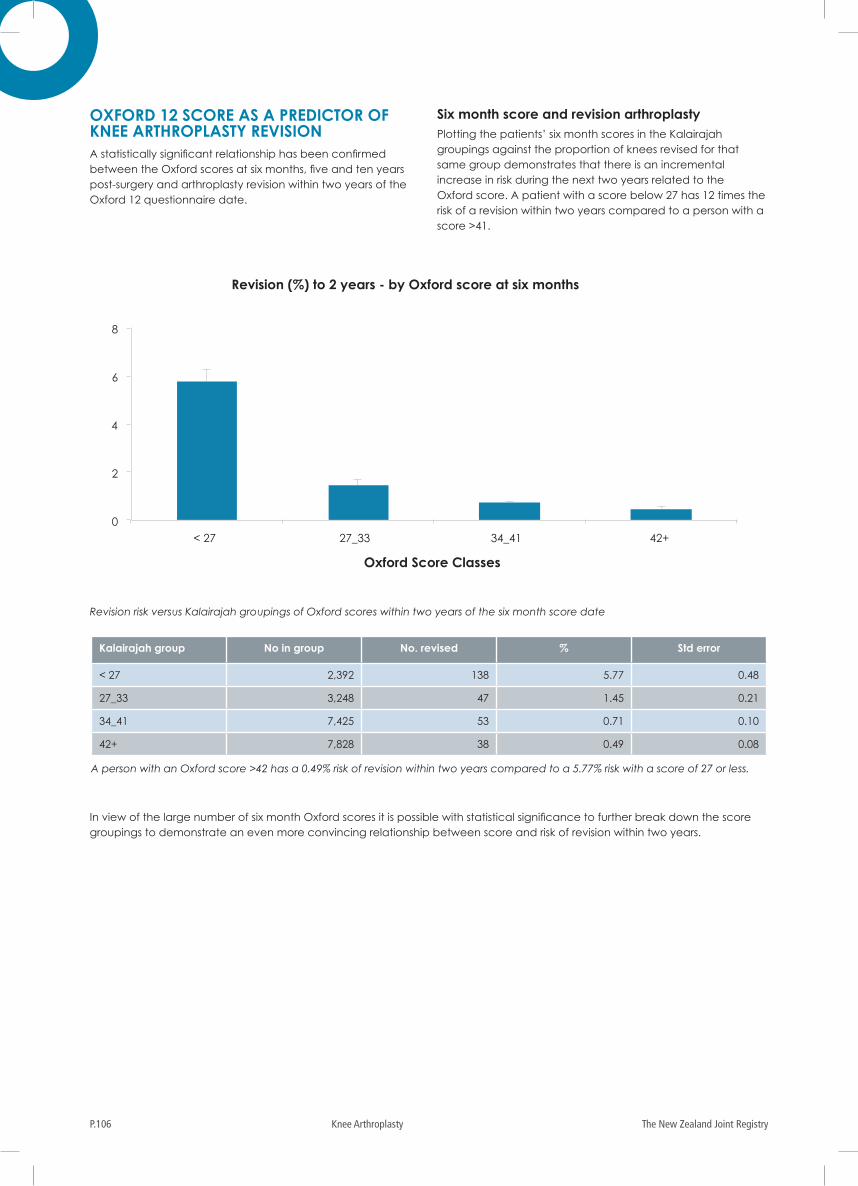
The New Zealand Joint RegistryP.106 Knee Arthroplasty
OXFORD 12 SCORE AS A PREDICTOR OF KNEE ARTHROPLASTY REVISION A statistically significant relationship has been confirmed between the Oxford scores at six months, five and ten years post-surgery and arthroplasty revision within two years of the Oxford 12 questionnaire date.
Six month score and revision arthroplastyPlotting the patients’ six month scores in the Kalairajah groupings against the proportion of knees revised for that same group demonstrates that there is an incremental increase in risk during the next two years related to the Oxford score. A patient with a score below 27 has 12 times the risk of a revision within two years compared to a person with a score >41.
Revision risk versus Kalairajah groupings of Oxford scores within two years of the six month score date
Kalairajah group No in group No. revised % Std error
< 27 2,392 138 5.77 0.48
27_33 3,248 47 1.45 0.21
34_41 7,425 53 0.71 0.10
42+ 7,828 38 0.49 0.08
A person with an Oxford score >42 has a 0.49% risk of revision within two years compared to a 5.77% risk with a score of 27 or less.
In view of the large number of six month Oxford scores it is possible with statistical significance to further break down the score groupings to demonstrate an even more convincing relationship between score and risk of revision within two years.
0
2
4
6
8
< 27 27_33 34_41 42+
Oxford Score Classes
Revision (%) to 2 years - by Oxford score at six months
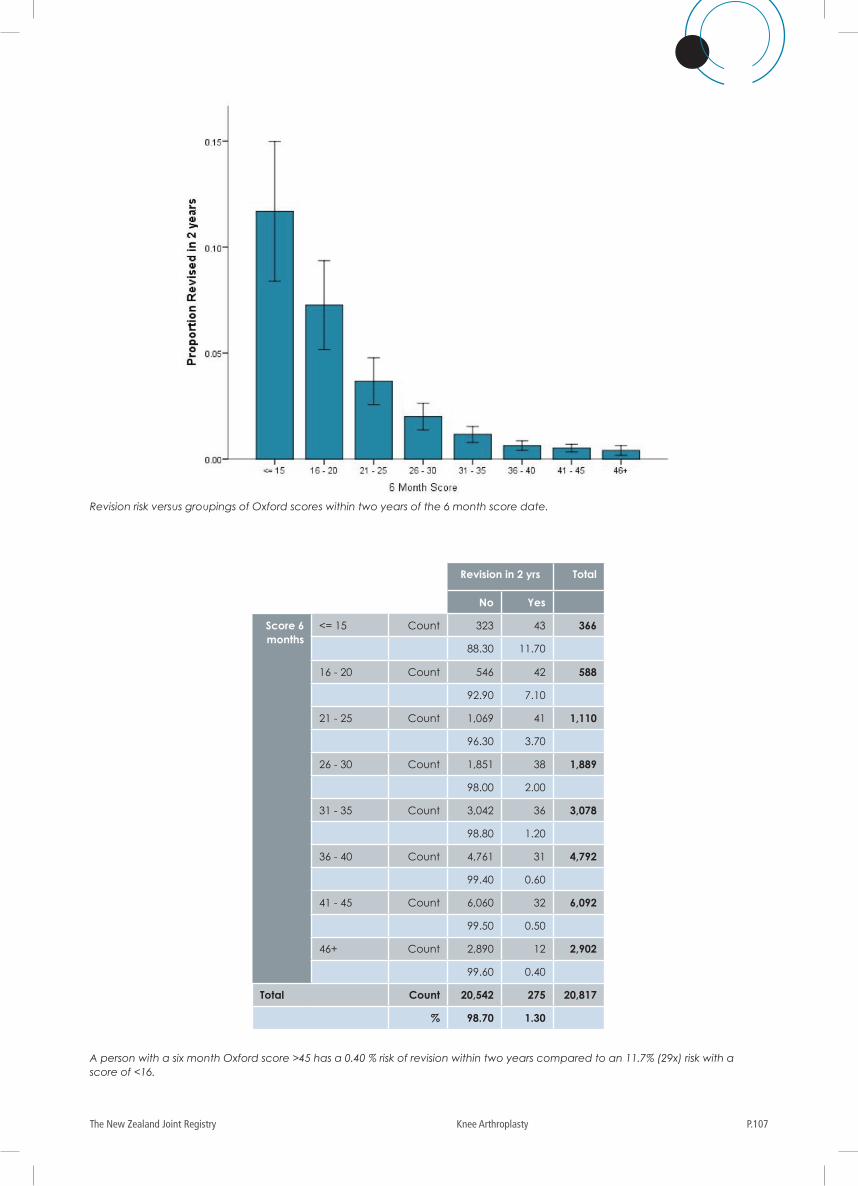
P.107The New Zealand Joint Registry Knee Arthroplasty
Revision in 2 yrs Total
No Yes
Score 6 months
<= 15 Count 323 43 366
88.30 11.70
16 - 20 Count 546 42 588
92.90 7.10
21 - 25 Count 1,069 41 1,110
96.30 3.70
26 - 30 Count 1,851 38 1,889
98.00 2.00
31 - 35 Count 3,042 36 3,078
98.80 1.20
36 - 40 Count 4,761 31 4,792
99.40 0.60
41 - 45 Count 6,060 32 6,092
99.50 0.50
46+ Count 2,890 12 2,902
99.60 0.40
Total Count 20,542 275 20,817
% 98.70 1.30
A person with a six month Oxford score >45 has a 0.40 % risk of revision within two years compared to an 11.7% (29x) risk with a score of <16.
Revision risk versus groupings of Oxford scores within two years of the 6 month score date.
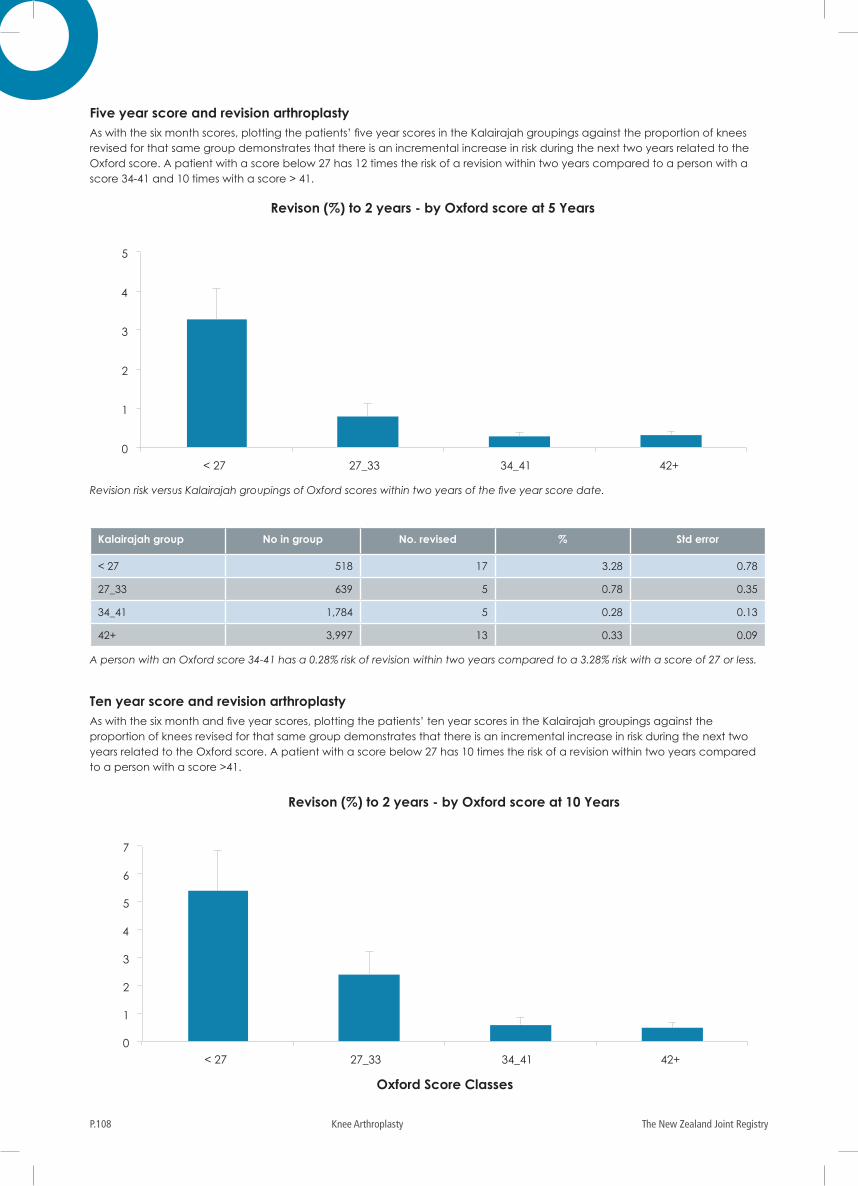
The New Zealand Joint RegistryP.108 Knee Arthroplasty
Kalairajah group No in group No. revised % Std error
< 27 518 17 3.28 0.78
27_33 639 5 0.78 0.35
34_41 1,784 5 0.28 0.13
42+ 3,997 13 0.33 0.09
A person with an Oxford score 34-41 has a 0.28% risk of revision within two years compared to a 3.28% risk with a score of 27 or less.
Revision risk versus Kalairajah groupings of Oxford scores within two years of the five year score date.
0
1
2
3
4
5
< 27 27_33 34_41 42+
Oxford Score Classes
Revison (%) to 2 years - by Oxford score at 5 Years
Five year score and revision arthroplastyAs with the six month scores, plotting the patients’ five year scores in the Kalairajah groupings against the proportion of knees revised for that same group demonstrates that there is an incremental increase in risk during the next two years related to the Oxford score. A patient with a score below 27 has 12 times the risk of a revision within two years compared to a person with a score 34-41 and 10 times with a score > 41.
Ten year score and revision arthroplastyAs with the six month and five year scores, plotting the patients’ ten year scores in the Kalairajah groupings against the proportion of knees revised for that same group demonstrates that there is an incremental increase in risk during the next two years related to the Oxford score. A patient with a score below 27 has 10 times the risk of a revision within two years compared to a person with a score >41.
0
1
2
3
4
5
6
7
< 27 27_33 34_41 42+
Oxford Score Classes
Revison (%) to 2 years - by Oxford score at 10 Years
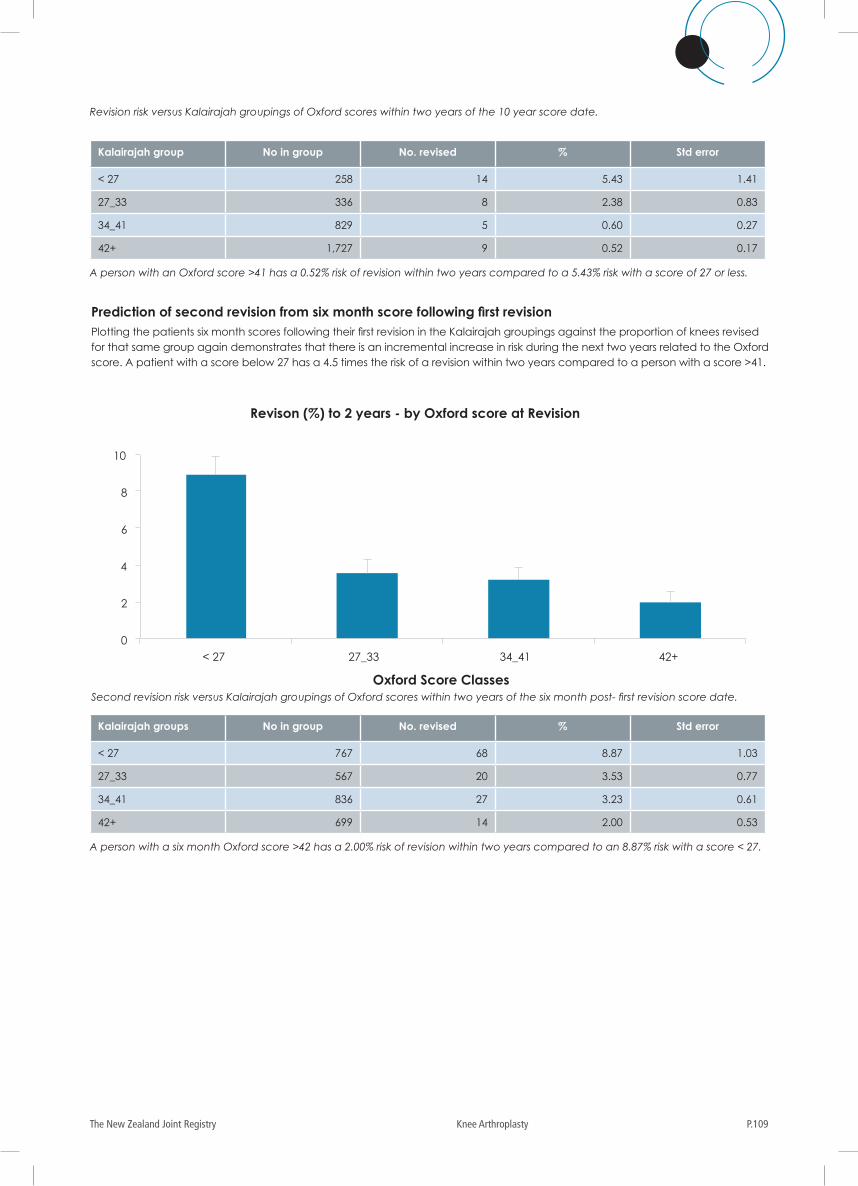
P.109The New Zealand Joint Registry Knee Arthroplasty
Kalairajah group No in group No. revised % Std error
< 27 258 14 5.43 1.41
27_33 336 8 2.38 0.83
34_41 829 5 0.60 0.27
42+ 1,727 9 0.52 0.17
A person with an Oxford score >41 has a 0.52% risk of revision within two years compared to a 5.43% risk with a score of 27 or less.
Prediction of second revision from six month score following first revisionPlotting the patients six month scores following their first revision in the Kalairajah groupings against the proportion of knees revised for that same group again demonstrates that there is an incremental increase in risk during the next two years related to the Oxford score. A patient with a score below 27 has a 4.5 times the risk of a revision within two years compared to a person with a score >41.
Second revision risk versus Kalairajah groupings of Oxford scores within two years of the six month post- first revision score date.
0
2
4
6
8
10
< 27 27_33 34_41 42+
Oxford Score Classes
Revison (%) to 2 years - by Oxford score at Revision
Kalairajah groups No in group No. revised % Std error
< 27 767 68 8.87 1.03
27_33 567 20 3.53 0.77
34_41 836 27 3.23 0.61
42+ 699 14 2.00 0.53
A person with a six month Oxford score >42 has a 2.00% risk of revision within two years compared to an 8.87% risk with a score < 27.
Revision risk versus Kalairajah groupings of Oxford scores within two years of the 10 year score date.
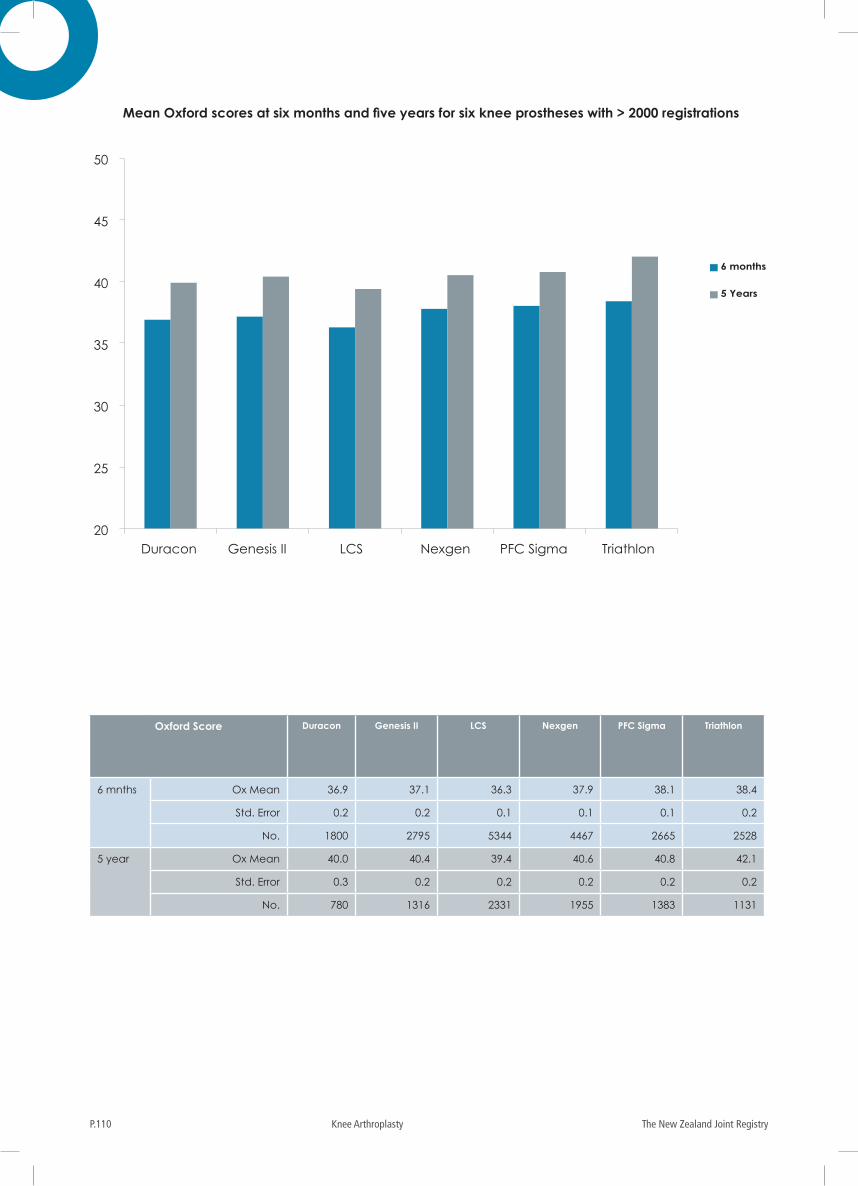
The New Zealand Joint RegistryP.110 Knee Arthroplasty
Oxford Score Duracon Genesis II LCS Nexgen PFC Sigma Triathlon
6 mnths Ox Mean 36.9 37.1 36.3 37.9 38.1 38.4
Std. Error 0.2 0.2 0.1 0.1 0.1 0.2
No. 1800 2795 5344 4467 2665 2528
5 year Ox Mean 40.0 40.4 39.4 40.6 40.8 42.1
Std. Error 0.3 0.2 0.2 0.2 0.2 0.2
No. 780 1316 2331 1955 1383 1131
Mean Oxford scores at six months and five years for six knee prostheses with > 2000 registrations
6 months
5 Years
20
25
30
35
40
45
50
Duracon Genesis II LCS Nexgen PFC Sigma Triathlon
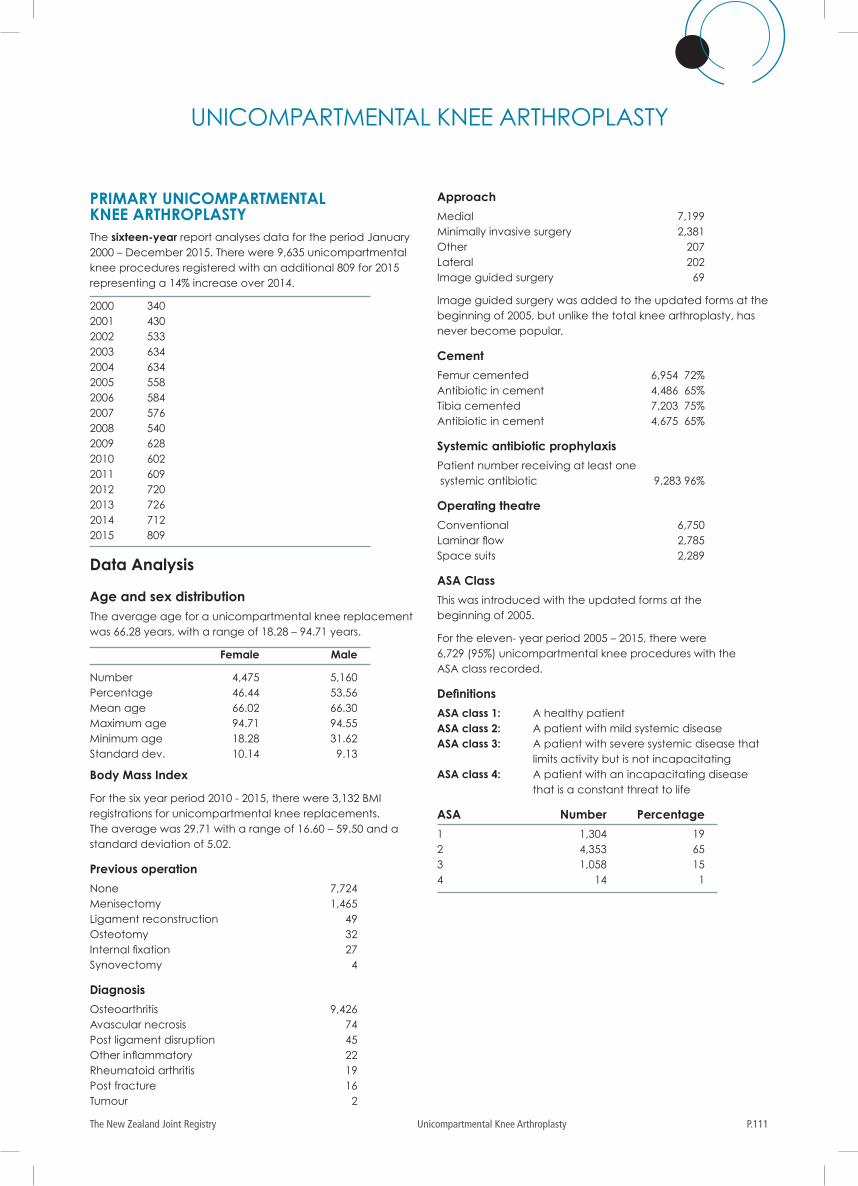
P.111The New Zealand Joint Registry Unicompartmental Knee Arthroplasty
PRIMARY UNICOMPARTMENTAL KNEE ARTHROPLASTY The sixteen-year report analyses data for the period January 2000 – December 2015. There were 9,635 unicompartmental knee procedures registered with an additional 809 for 2015 representing a 14% increase over 2014.
2000 340 2001 430 2002 533 2003 634 2004 634 2005 558 2006 584 2007 576 2008 540 2009 628 2010 602 2011 609 2012 720 2013 726 2014 712 2015 809
Data Analysis
Age and sex distributionThe average age for a unicompartmental knee replacement was 66.28 years, with a range of 18.28 – 94.71 years.
Female Male
Number 4,475 5,160Percentage 46.44 53.56Mean age 66.02 66.30Maximum age 94.71 94.55Minimum age 18.28 31.62Standard dev. 10.14 9.13
Body Mass Index
For the six year period 2010 - 2015, there were 3,132 BMI registrations for unicompartmental knee replacements. The average was 29.71 with a range of 16.60 – 59.50 and a standard deviation of 5.02.
Previous operation
None 7,724Menisectomy 1,465Ligament reconstruction 49Osteotomy 32Internal fixation 27Synovectomy 4
Diagnosis
Osteoarthritis 9,426Avascular necrosis 74Post ligament disruption 45Other inflammatory 22Rheumatoid arthritis 19Post fracture 16Tumour 2
Approach
Medial 7,199Minimally invasive surgery 2,381Other 207Lateral 202Image guided surgery 69
Image guided surgery was added to the updated forms at the beginning of 2005, but unlike the total knee arthroplasty, has never become popular.
Cement
Femur cemented 6,954 72%Antibiotic in cement 4,486 65%Tibia cemented 7,203 75%Antibiotic in cement 4,675 65%
Systemic antibiotic prophylaxis
Patient number receiving at least one systemic antibiotic 9,283 96%
Operating theatre
Conventional 6,750Laminar flow 2,785Space suits 2,289
ASA Class
This was introduced with the updated forms at the beginning of 2005.
For the eleven- year period 2005 – 2015, there were 6,729 (95%) unicompartmental knee procedures with the ASA class recorded.
Definitions
ASA class 1: A healthy patient ASA class 2: A patient with mild systemic disease ASA class 3: A patient with severe systemic disease that
limits activity but is not incapacitatingASA class 4: A patient with an incapacitating disease
that is a constant threat to life
ASA Number Percentage
1 1,304 192 4,353 653 1,058 154 14 1
UNICOMPARTMENTAL KNEE ARTHROPLASTY
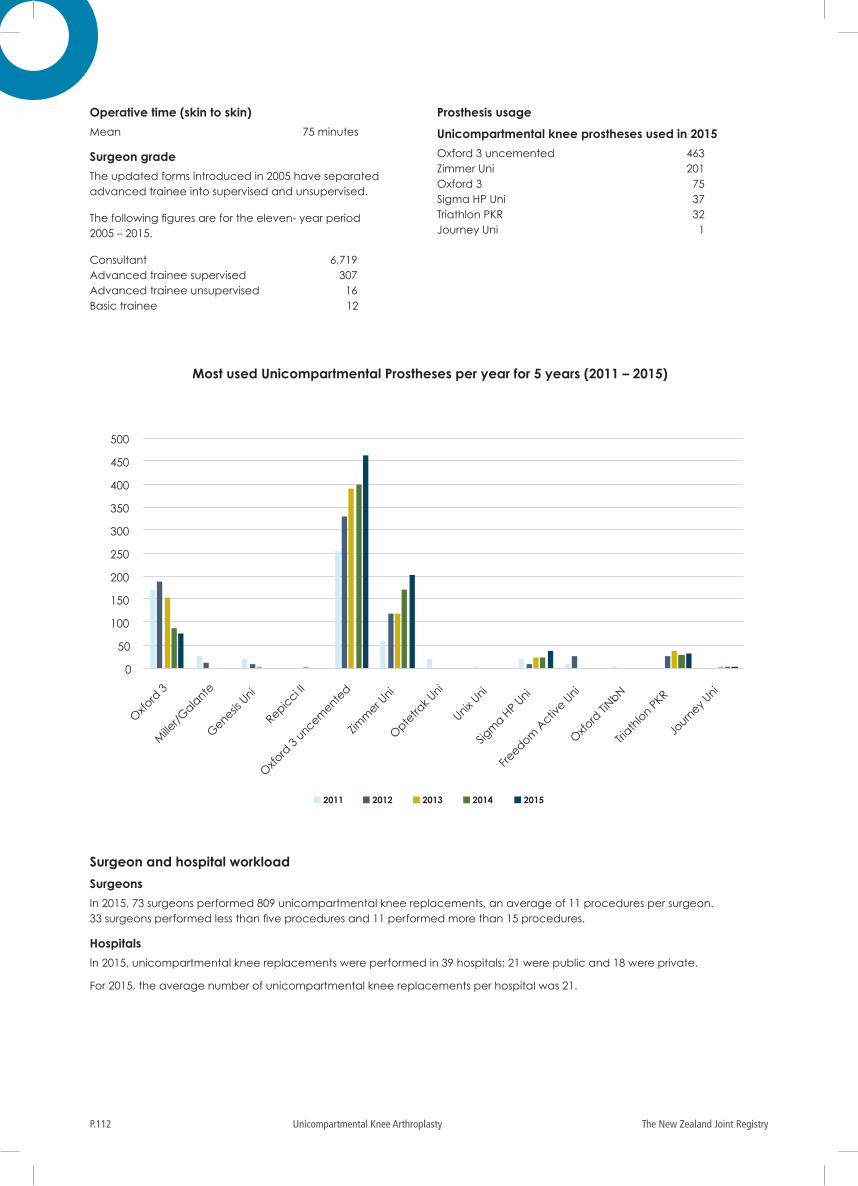
The New Zealand Joint RegistryP.112 Unicompartmental Knee Arthroplasty
Operative time (skin to skin)
Mean 75 minutes
Surgeon grade
The updated forms introduced in 2005 have separated advanced trainee into supervised and unsupervised.
The following figures are for the eleven- year period 2005 – 2015.
Consultant 6,719Advanced trainee supervised 307Advanced trainee unsupervised 16 Basic trainee 12
Prosthesis usage
Unicompartmental knee prostheses used in 2015
Oxford 3 uncemented 463Zimmer Uni 201Oxford 3 75Sigma HP Uni 37Triathlon PKR 32Journey Uni 1
0
50
100
150
200
250
300
350
400
450
500
Oxfo
rd 3
Mille
r/Gala
nte
Genesis
Uni
Repicci II
Oxfo
rd 3
uncemente
d
Zimm
er Uni
Opte
trak U
ni
Unix Uni
Sigm
a HP U
ni
Freedom
Activ
e Uni
Oxfo
rd Ti
NbN
Triath
lon P
KR
Journ
ey Uni
2011 2012 2013 2014 2015
Most used Unicompartmental Prostheses per year for 5 years (2011 – 2015)
Surgeon and hospital workload
Surgeons
In 2015, 73 surgeons performed 809 unicompartmental knee replacements, an average of 11 procedures per surgeon. 33 surgeons performed less than five procedures and 11 performed more than 15 procedures.
Hospitals
In 2015, unicompartmental knee replacements were performed in 39 hospitals; 21 were public and 18 were private.
For 2015, the average number of unicompartmental knee replacements per hospital was 21.
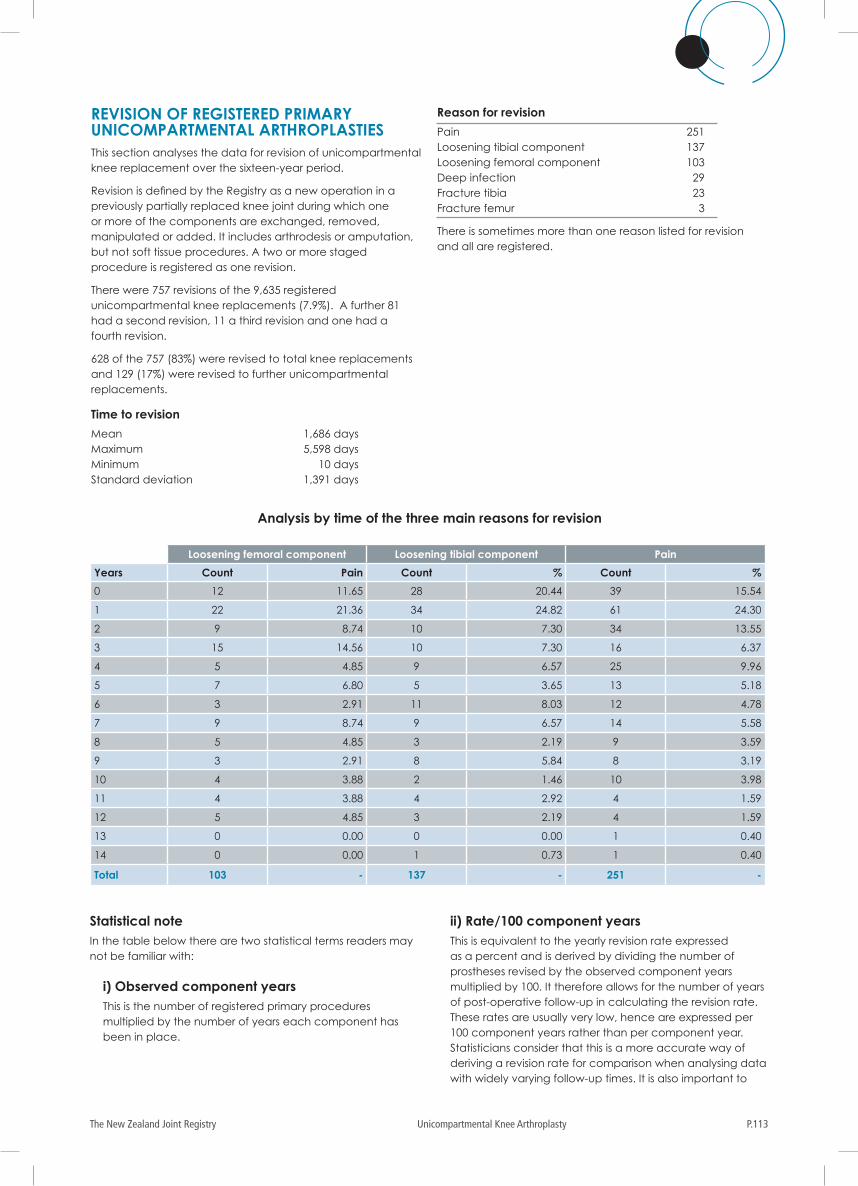
P.113The New Zealand Joint Registry Unicompartmental Knee Arthroplasty
Analysis by time of the three main reasons for revision
REVISION OF REGISTERED PRIMARY UNICOMPARTMENTAL ARTHROPLASTIESThis section analyses the data for revision of unicompartmental knee replacement over the sixteen-year period.
Revision is defined by the Registry as a new operation in a previously partially replaced knee joint during which one or more of the components are exchanged, removed, manipulated or added. It includes arthrodesis or amputation, but not soft tissue procedures. A two or more staged procedure is registered as one revision.
There were 757 revisions of the 9,635 registered unicompartmental knee replacements (7.9%). A further 81 had a second revision, 11 a third revision and one had a fourth revision.
628 of the 757 (83%) were revised to total knee replacements and 129 (17%) were revised to further unicompartmental replacements.
Time to revision
Mean 1,686 daysMaximum 5,598 daysMinimum 10 daysStandard deviation 1,391 days
Reason for revision
Pain 251Loosening tibial component 137Loosening femoral component 103Deep infection 29Fracture tibia 23Fracture femur 3
There is sometimes more than one reason listed for revision and all are registered.
Statistical noteIn the table below there are two statistical terms readers may not be familiar with:
i) Observed component yearsThis is the number of registered primary procedures multiplied by the number of years each component has been in place.
ii) Rate/100 component yearsThis is equivalent to the yearly revision rate expressed as a percent and is derived by dividing the number of prostheses revised by the observed component years multiplied by 100. It therefore allows for the number of years of post-operative follow-up in calculating the revision rate. These rates are usually very low, hence are expressed per 100 component years rather than per component year. Statisticians consider that this is a more accurate way of deriving a revision rate for comparison when analysing data with widely varying follow-up times. It is also important to
Loosening femoral component Loosening tibial component Pain
Years Count Pain Count % Count %
0 12 11.65 28 20.44 39 15.54
1 22 21.36 34 24.82 61 24.30
2 9 8.74 10 7.30 34 13.55
3 15 14.56 10 7.30 16 6.37
4 5 4.85 9 6.57 25 9.96
5 7 6.80 5 3.65 13 5.18
6 3 2.91 11 8.03 12 4.78
7 9 8.74 9 6.57 14 5.58
8 5 4.85 3 2.19 9 3.59
9 3 2.91 8 5.84 8 3.19
10 4 3.88 2 1.46 10 3.98
11 4 3.88 4 2.92 4 1.59
12 5 4.85 3 2.19 4 1.59
13 0 0.00 0 0.00 1 0.40
14 0 0.00 1 0.73 1 0.40
Total 103 - 137 - 251 -
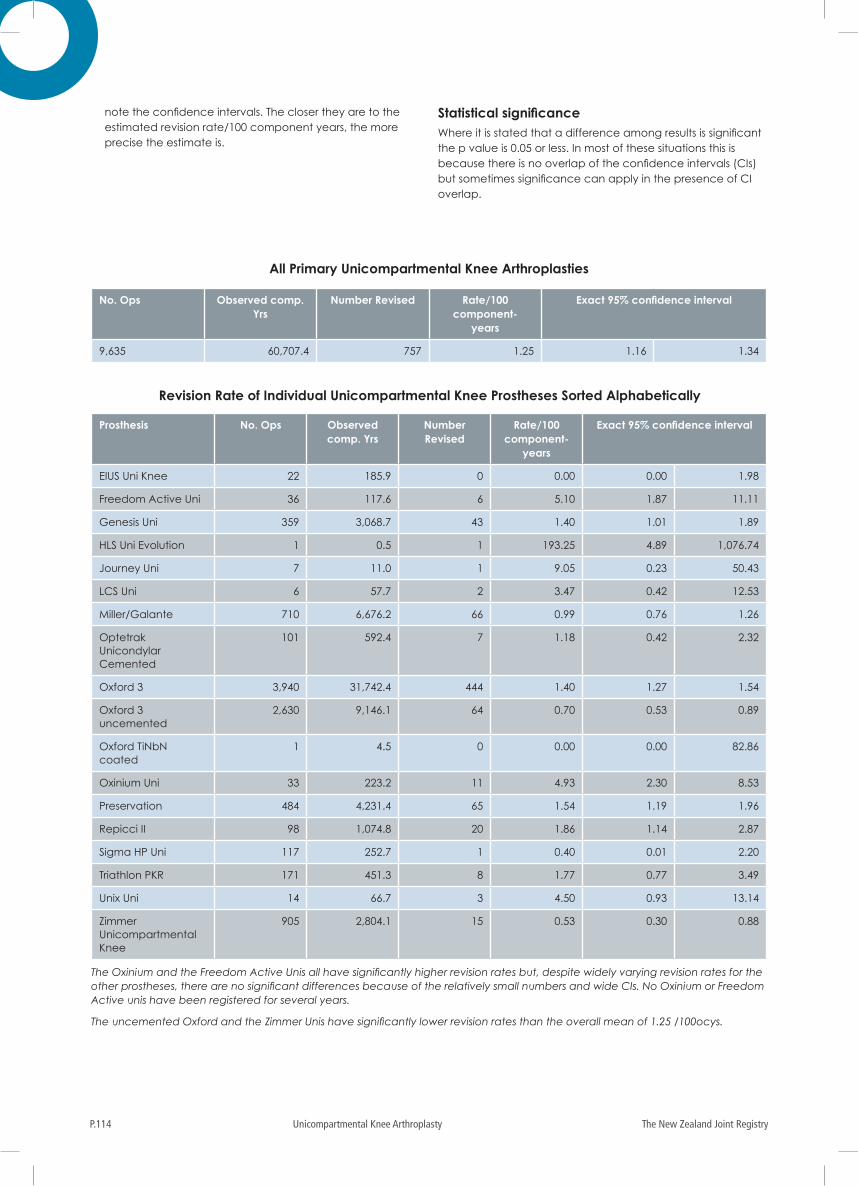
The New Zealand Joint RegistryP.114 Unicompartmental Knee Arthroplasty
All Primary Unicompartmental Knee Arthroplasties
No. Ops Observed comp. Yrs
Number Revised Rate/100 component-
years
Exact 95% confidence interval
9,635 60,707.4 757 1.25 1.16 1.34
Prosthesis No. Ops Observed comp. Yrs
Number Revised
Rate/100 component-
years
Exact 95% confidence interval
EIUS Uni Knee 22 185.9 0 0.00 0.00 1.98
Freedom Active Uni 36 117.6 6 5.10 1.87 11.11
Genesis Uni 359 3,068.7 43 1.40 1.01 1.89
HLS Uni Evolution 1 0.5 1 193.25 4.89 1,076.74
Journey Uni 7 11.0 1 9.05 0.23 50.43
LCS Uni 6 57.7 2 3.47 0.42 12.53
Miller/Galante 710 6,676.2 66 0.99 0.76 1.26
Optetrak Unicondylar Cemented
101 592.4 7 1.18 0.42 2.32
Oxford 3 3,940 31,742.4 444 1.40 1.27 1.54
Oxford 3 uncemented
2,630 9,146.1 64 0.70 0.53 0.89
Oxford TiNbN coated
1 4.5 0 0.00 0.00 82.86
Oxinium Uni 33 223.2 11 4.93 2.30 8.53
Preservation 484 4,231.4 65 1.54 1.19 1.96
Repicci II 98 1,074.8 20 1.86 1.14 2.87
Sigma HP Uni 117 252.7 1 0.40 0.01 2.20
Triathlon PKR 171 451.3 8 1.77 0.77 3.49
Unix Uni 14 66.7 3 4.50 0.93 13.14
Zimmer Unicompartmental Knee
905 2,804.1 15 0.53 0.30 0.88
The Oxinium and the Freedom Active Unis all have significantly higher revision rates but, despite widely varying revision rates for the other prostheses, there are no significant differences because of the relatively small numbers and wide CIs. No Oxinium or Freedom Active unis have been registered for several years.
The uncemented Oxford and the Zimmer Unis have significantly lower revision rates than the overall mean of 1.25 /100ocys.
Revision Rate of Individual Unicompartmental Knee Prostheses Sorted Alphabetically
note the confidence intervals. The closer they are to the estimated revision rate/100 component years, the more precise the estimate is.
Statistical significance Where it is stated that a difference among results is significant the p value is 0.05 or less. In most of these situations this is because there is no overlap of the confidence intervals (CIs) but sometimes significance can apply in the presence of CI overlap.
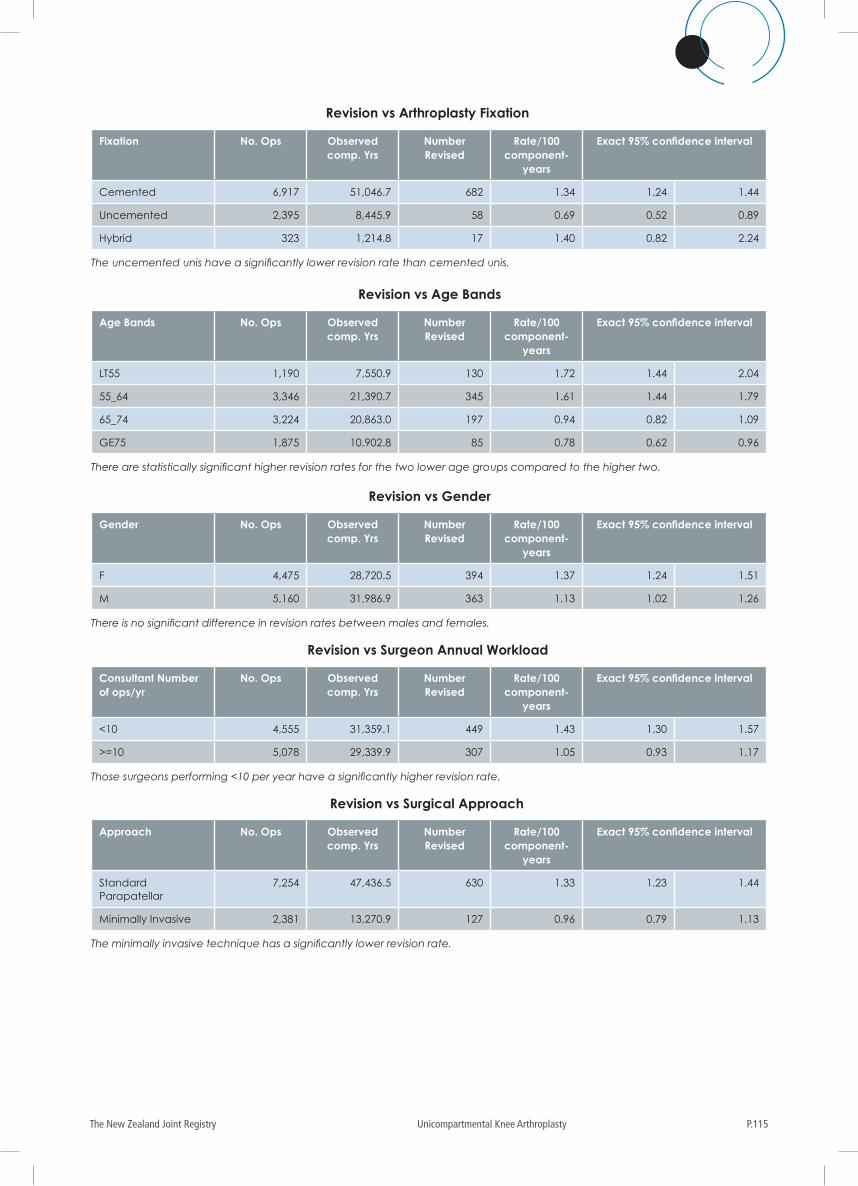
P.115The New Zealand Joint Registry Unicompartmental Knee Arthroplasty
Fixation No. Ops Observed comp. Yrs
Number Revised
Rate/100 component-
years
Exact 95% confidence interval
Cemented 6,917 51,046.7 682 1.34 1.24 1.44
Uncemented 2,395 8,445.9 58 0.69 0.52 0.89
Hybrid 323 1,214.8 17 1.40 0.82 2.24
The uncemented unis have a significantly lower revision rate than cemented unis.
Revision vs Arthroplasty Fixation
Age Bands No. Ops Observed comp. Yrs
Number Revised
Rate/100 component-
years
Exact 95% confidence interval
LT55 1,190 7,550.9 130 1.72 1.44 2.04
55_64 3,346 21,390.7 345 1.61 1.44 1.79
65_74 3,224 20,863.0 197 0.94 0.82 1.09
GE75 1,875 10,902.8 85 0.78 0.62 0.96
There are statistically significant higher revision rates for the two lower age groups compared to the higher two.
Gender No. Ops Observed comp. Yrs
Number Revised
Rate/100 component-
years
Exact 95% confidence interval
F 4,475 28,720.5 394 1.37 1.24 1.51
M 5,160 31,986.9 363 1.13 1.02 1.26
There is no significant difference in revision rates between males and females.
Consultant Number of ops/yr
No. Ops Observed comp. Yrs
Number Revised
Rate/100 component-
years
Exact 95% confidence interval
<10 4,555 31,359.1 449 1.43 1.30 1.57
>=10 5,078 29,339.9 307 1.05 0.93 1.17
Those surgeons performing <10 per year have a significantly higher revision rate.
Approach No. Ops Observed comp. Yrs
Number Revised
Rate/100 component-
years
Exact 95% confidence interval
Standard Parapatellar
7,254 47,436.5 630 1.33 1.23 1.44
Minimally Invasive 2,381 13,270.9 127 0.96 0.79 1.13
The minimally invasive technique has a significantly lower revision rate.
Revision vs Age Bands
Revision vs Gender
Revision vs Surgeon Annual Workload
Revision vs Surgical Approach
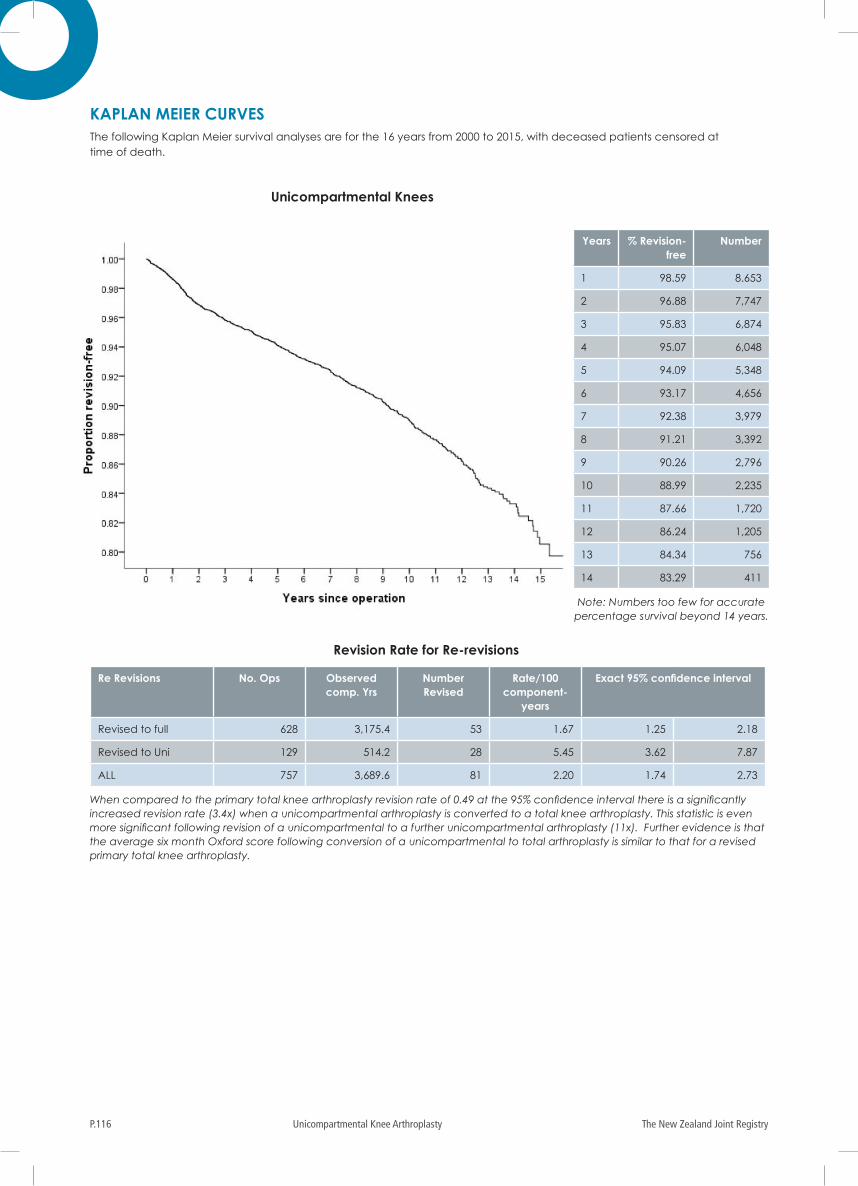
The New Zealand Joint RegistryP.116 Unicompartmental Knee Arthroplasty
Revision Rate for Re-revisions
KAPLAN MEIER CURVESThe following Kaplan Meier survival analyses are for the 16 years from 2000 to 2015, with deceased patients censored at time of death.
Re Revisions No. Ops Observed comp. Yrs
Number Revised
Rate/100 component-
years
Exact 95% confidence interval
Revised to full 628 3,175.4 53 1.67 1.25 2.18
Revised to Uni 129 514.2 28 5.45 3.62 7.87
ALL 757 3,689.6 81 2.20 1.74 2.73
When compared to the primary total knee arthroplasty revision rate of 0.49 at the 95% confidence interval there is a significantly increased revision rate (3.4x) when a unicompartmental arthroplasty is converted to a total knee arthroplasty. This statistic is even more significant following revision of a unicompartmental to a further unicompartmental arthroplasty (11x). Further evidence is that the average six month Oxford score following conversion of a unicompartmental to total arthroplasty is similar to that for a revised primary total knee arthroplasty.
Unicompartmental Knees
Years % Revision-free
Number
1 98.59 8.653
2 96.88 7,747
3 95.83 6,874
4 95.07 6,048
5 94.09 5,348
6 93.17 4,656
7 92.38 3,979
8 91.21 3,392
9 90.26 2,796
10 88.99 2,235
11 87.66 1,720
12 86.24 1,205
13 84.34 756
14 83.29 411
Note: Numbers too few for accurate percentage survival beyond 14 years.
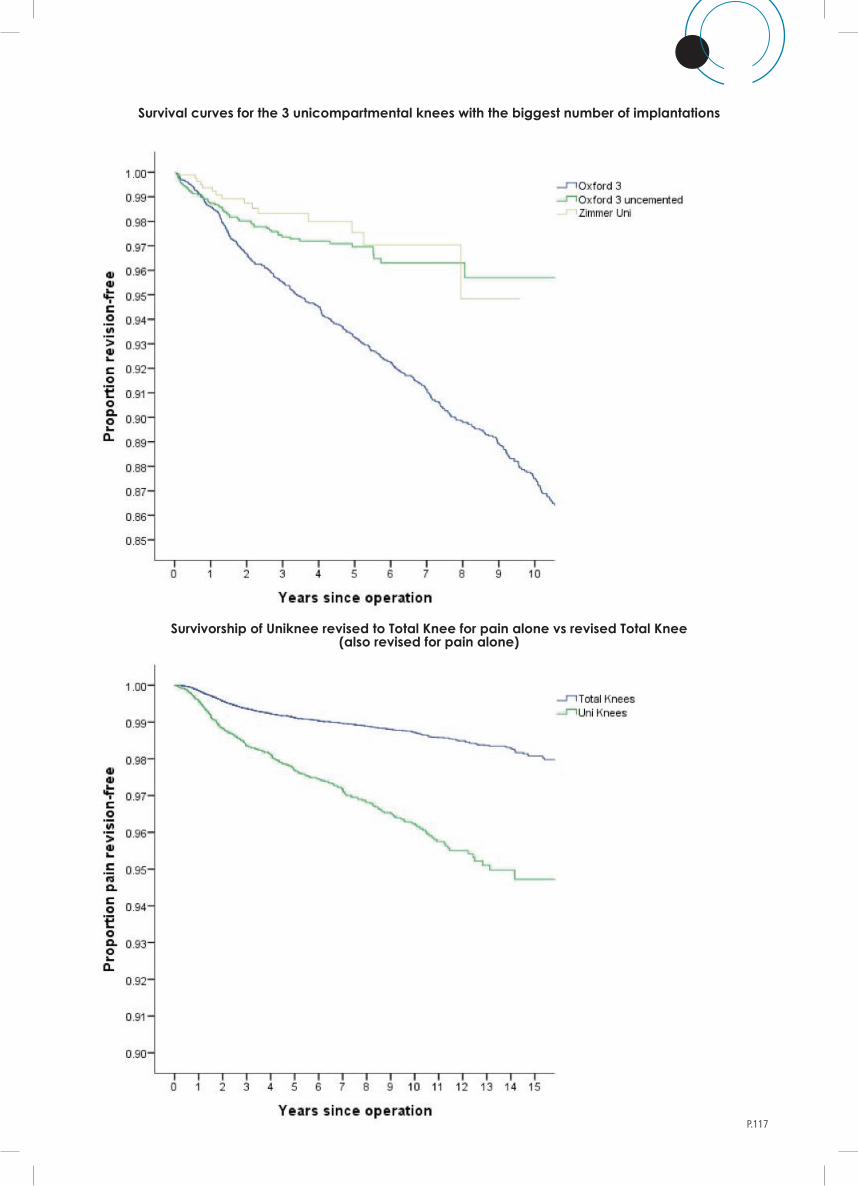
P.117The New Zealand Joint Registry Unicompartmental Knee Arthroplasty
Survival curves for the 3 unicompartmental knees with the biggest number of implantations
Survivorship of Uniknee revised to Total Knee for pain alone vs revised Total Knee (also revised for pain alone)
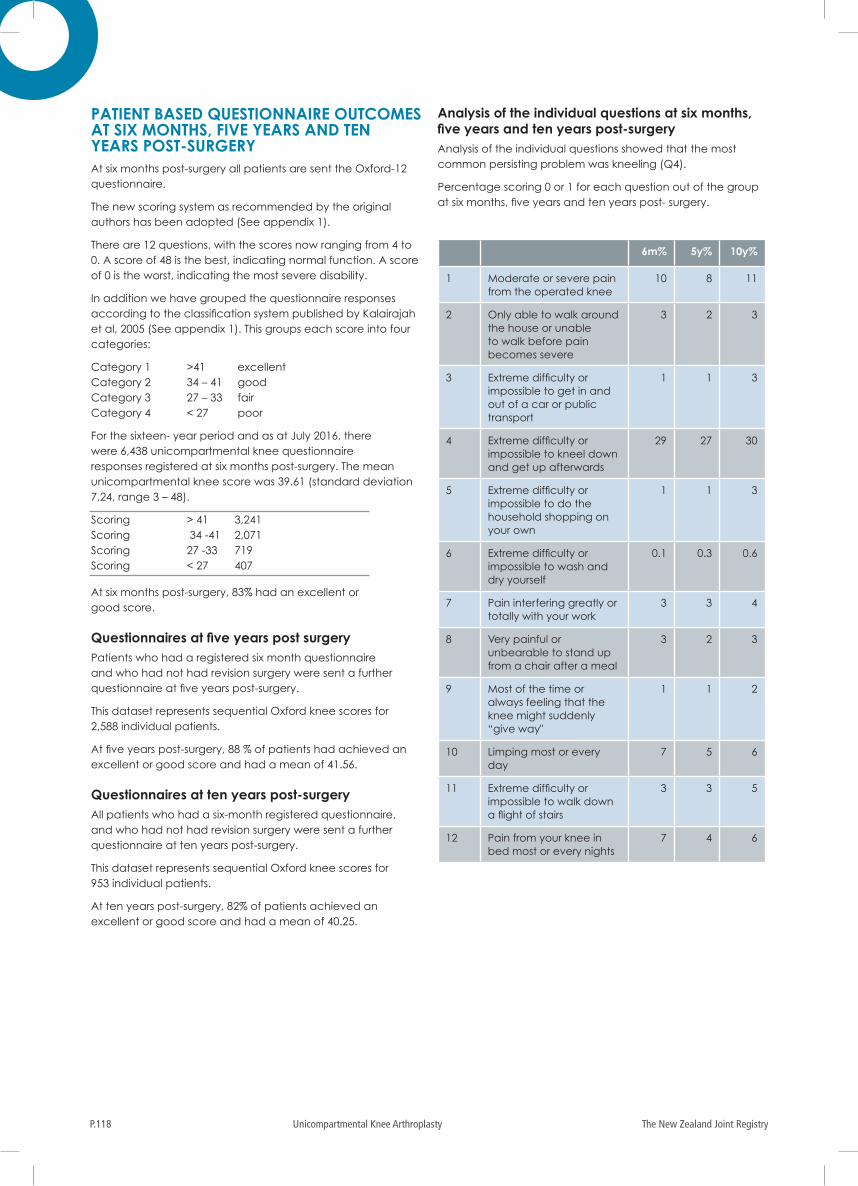
The New Zealand Joint RegistryP.118 Unicompartmental Knee Arthroplasty
PATIENT BASED QUESTIONNAIRE OUTCOMES AT SIX MONTHS, FIVE YEARS AND TEN YEARS POST-SURGERYAt six months post-surgery all patients are sent the Oxford-12 questionnaire.
The new scoring system as recommended by the original authors has been adopted (See appendix 1).
There are 12 questions, with the scores now ranging from 4 to 0. A score of 48 is the best, indicating normal function. A score of 0 is the worst, indicating the most severe disability.
In addition we have grouped the questionnaire responses according to the classification system published by Kalairajah et al, 2005 (See appendix 1). This groups each score into four categories:
Category 1 >41 excellent Category 2 34 – 41 good Category 3 27 – 33 fair Category 4 < 27 poor
For the sixteen- year period and as at July 2016, there were 6,438 unicompartmental knee questionnaire responses registered at six months post-surgery. The mean unicompartmental knee score was 39.61 (standard deviation 7.24, range 3 – 48).
Scoring > 41 3,241 Scoring 34 -41 2,071 Scoring 27 -33 719 Scoring < 27 407
At six months post-surgery, 83% had an excellent or good score.
Questionnaires at five years post surgeryPatients who had a registered six month questionnaire and who had not had revision surgery were sent a further questionnaire at five years post-surgery.
This dataset represents sequential Oxford knee scores for 2,588 individual patients.
At five years post-surgery, 88 % of patients had achieved an excellent or good score and had a mean of 41.56.
Questionnaires at ten years post-surgeryAll patients who had a six-month registered questionnaire, and who had not had revision surgery were sent a further questionnaire at ten years post-surgery.
This dataset represents sequential Oxford knee scores for 953 individual patients.
At ten years post-surgery, 82% of patients achieved an excellent or good score and had a mean of 40.25.
Analysis of the individual questions at six months, five years and ten years post-surgeryAnalysis of the individual questions showed that the most common persisting problem was kneeling (Q4).
Percentage scoring 0 or 1 for each question out of the group at six months, five years and ten years post- surgery.
6m% 5y% 10y%
1 Moderate or severe pain from the operated knee
10 8 11
2 Only able to walk around the house or unable to walk before pain becomes severe
3 2 3
3 Extreme difficulty or impossible to get in and out of a car or public transport
1 1 3
4 Extreme difficulty or impossible to kneel down and get up afterwards
29 27 30
5 Extreme difficulty or impossible to do the household shopping on your own
1 1 3
6 Extreme difficulty or impossible to wash and dry yourself
0.1 0.3 0.6
7 Pain interfering greatly or totally with your work
3 3 4
8 Very painful or unbearable to stand up from a chair after a meal
3 2 3
9 Most of the time or always feeling that the knee might suddenly “give way"
1 1 2
10 Limping most or every day
7 5 6
11 Extreme difficulty or impossible to walk down a flight of stairs
3 3 5
12 Pain from your knee in bed most or every nights
7 4 6
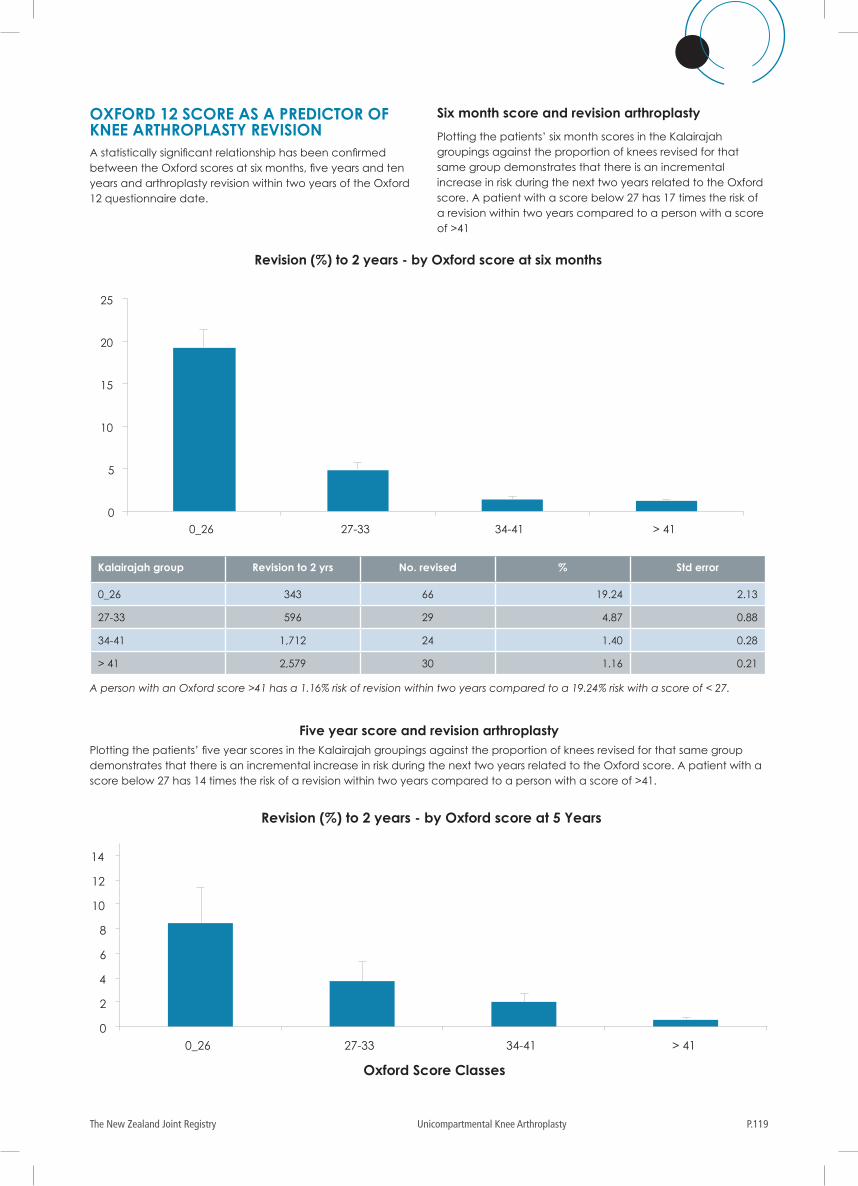
P.119The New Zealand Joint Registry Unicompartmental Knee Arthroplasty
OXFORD 12 SCORE AS A PREDICTOR OF KNEE ARTHROPLASTY REVISION A statistically significant relationship has been confirmed between the Oxford scores at six months, five years and ten years and arthroplasty revision within two years of the Oxford 12 questionnaire date.
Six month score and revision arthroplasty
Plotting the patients’ six month scores in the Kalairajah groupings against the proportion of knees revised for that same group demonstrates that there is an incremental increase in risk during the next two years related to the Oxford score. A patient with a score below 27 has 17 times the risk of a revision within two years compared to a person with a score of >41
Five year score and revision arthroplasty
Kalairajah group Revision to 2 yrs No. revised % Std error
0_26 343 66 19.24 2.13
27-33 596 29 4.87 0.88
34-41 1,712 24 1.40 0.28
> 41 2,579 30 1.16 0.21
A person with an Oxford score >41 has a 1.16% risk of revision within two years compared to a 19.24% risk with a score of < 27.
0
5
10
15
20
25
0_26 27-33 34-41 > 41
Oxford Score Classes
Revision (%) to 2 years - by Oxford score at six months
Plotting the patients’ five year scores in the Kalairajah groupings against the proportion of knees revised for that same group demonstrates that there is an incremental increase in risk during the next two years related to the Oxford score. A patient with a score below 27 has 14 times the risk of a revision within two years compared to a person with a score of >41.
0
2
4
6
8
10
12
14
0_26 27-33 34-41 > 41
Oxford Score Classes
Revision (%) to 2 years - by Oxford score at 5 Years
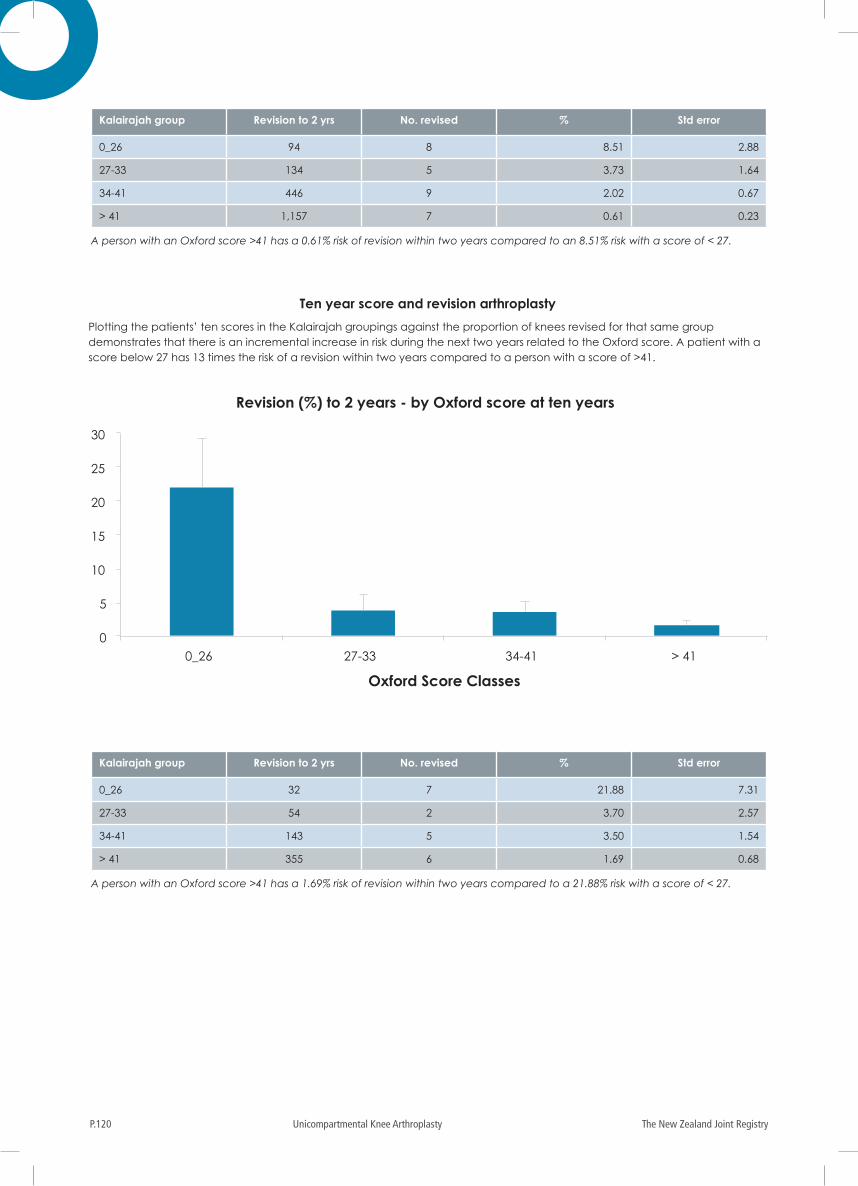
The New Zealand Joint RegistryP.120 Unicompartmental Knee Arthroplasty
Ten year score and revision arthroplasty
Kalairajah group Revision to 2 yrs No. revised % Std error
0_26 94 8 8.51 2.88
27-33 134 5 3.73 1.64
34-41 446 9 2.02 0.67
> 41 1,157 7 0.61 0.23
A person with an Oxford score >41 has a 0.61% risk of revision within two years compared to an 8.51% risk with a score of < 27.
Kalairajah group Revision to 2 yrs No. revised % Std error
0_26 32 7 21.88 7.31
27-33 54 2 3.70 2.57
34-41 143 5 3.50 1.54
> 41 355 6 1.69 0.68
A person with an Oxford score >41 has a 1.69% risk of revision within two years compared to a 21.88% risk with a score of < 27.
Plotting the patients’ ten scores in the Kalairajah groupings against the proportion of knees revised for that same group demonstrates that there is an incremental increase in risk during the next two years related to the Oxford score. A patient with a score below 27 has 13 times the risk of a revision within two years compared to a person with a score of >41.
0
5
10
15
20
25
30
0_26 27-33 34-41 > 41
Oxford Score Classes
Revision (%) to 2 years - by Oxford score at ten years
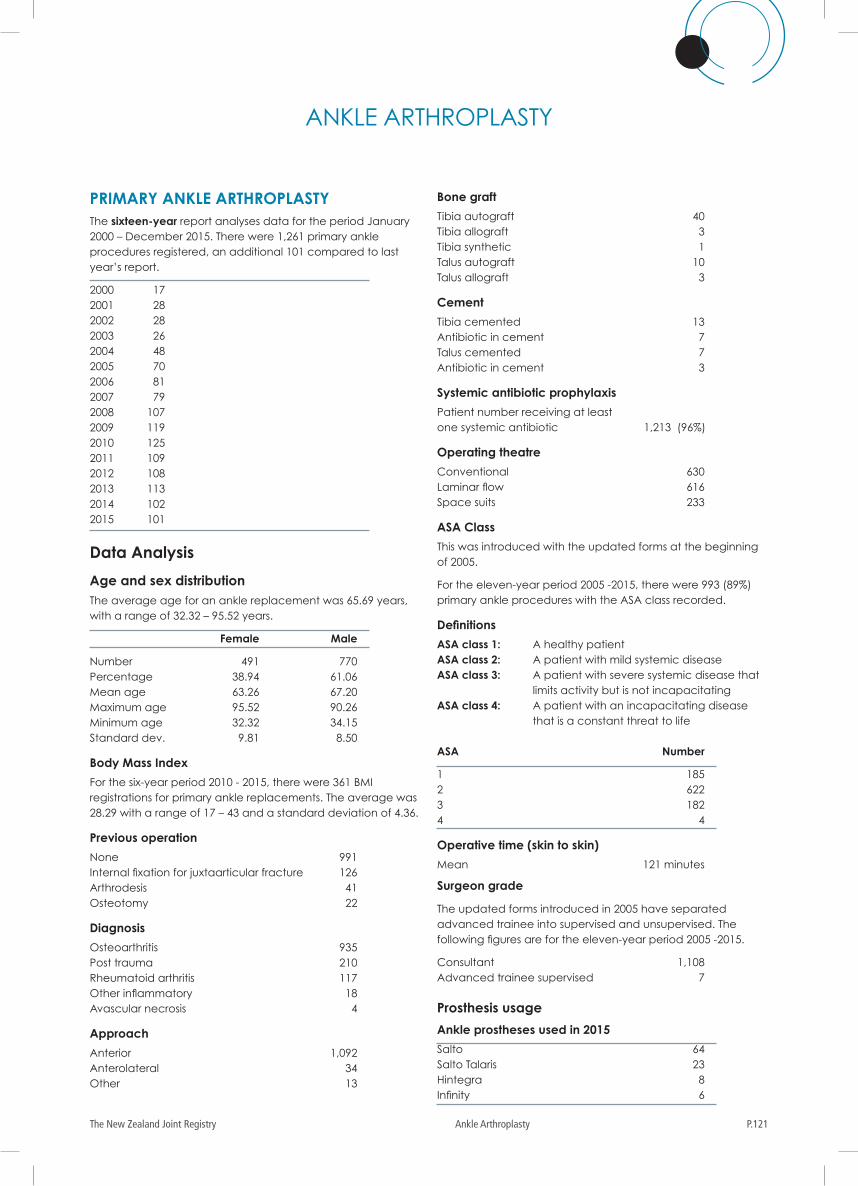
P.121The New Zealand Joint Registry Ankle Arthroplasty
PRIMARY ANKLE ARTHROPLASTY The sixteen-year report analyses data for the period January 2000 – December 2015. There were 1,261 primary ankle procedures registered, an additional 101 compared to last year’s report.
2000 17 2001 28 2002 28 2003 26 2004 48 2005 70 2006 81 2007 79 2008 107 2009 119 2010 125 2011 109 2012 108 2013 113 2014 102 2015 101
Data Analysis
Age and sex distributionThe average age for an ankle replacement was 65.69 years, with a range of 32.32 – 95.52 years.
Female Male
Number 491 770Percentage 38.94 61.06Mean age 63.26 67.20Maximum age 95.52 90.26Minimum age 32.32 34.15Standard dev. 9.81 8.50
Body Mass Index
For the six-year period 2010 - 2015, there were 361 BMI registrations for primary ankle replacements. The average was 28.29 with a range of 17 – 43 and a standard deviation of 4.36.
Previous operation
None 991Internal fixation for juxtaarticular fracture 126Arthrodesis 41Osteotomy 22
Diagnosis
Osteoarthritis 935Post trauma 210Rheumatoid arthritis 117Other inflammatory 18Avascular necrosis 4
Approach
Anterior 1,092Anterolateral 34Other 13
Bone graft
Tibia autograft 40Tibia allograft 3Tibia synthetic 1Talus autograft 10Talus allograft 3
Cement
Tibia cemented 13Antibiotic in cement 7Talus cemented 7Antibiotic in cement 3
Systemic antibiotic prophylaxis
Patient number receiving at least one systemic antibiotic 1,213 (96%)
Operating theatre
Conventional 630Laminar flow 616Space suits 233
ASA Class
This was introduced with the updated forms at the beginning of 2005.
For the eleven-year period 2005 -2015, there were 993 (89%) primary ankle procedures with the ASA class recorded.
Definitions
ASA class 1: A healthy patient ASA class 2: A patient with mild systemic disease ASA class 3: A patient with severe systemic disease that
limits activity but is not incapacitatingASA class 4: A patient with an incapacitating disease
that is a constant threat to life
ASA Number
1 185 2 622 3 182 4 4
Operative time (skin to skin)
Mean 121 minutes
Surgeon grade
The updated forms introduced in 2005 have separated advanced trainee into supervised and unsupervised. The following figures are for the eleven-year period 2005 -2015.
Consultant 1,108Advanced trainee supervised 7
Prosthesis usage
Ankle prostheses used in 2015
Salto 64Salto Talaris 23Hintegra 8Infinity 6
ANKLE ARTHROPLASTY
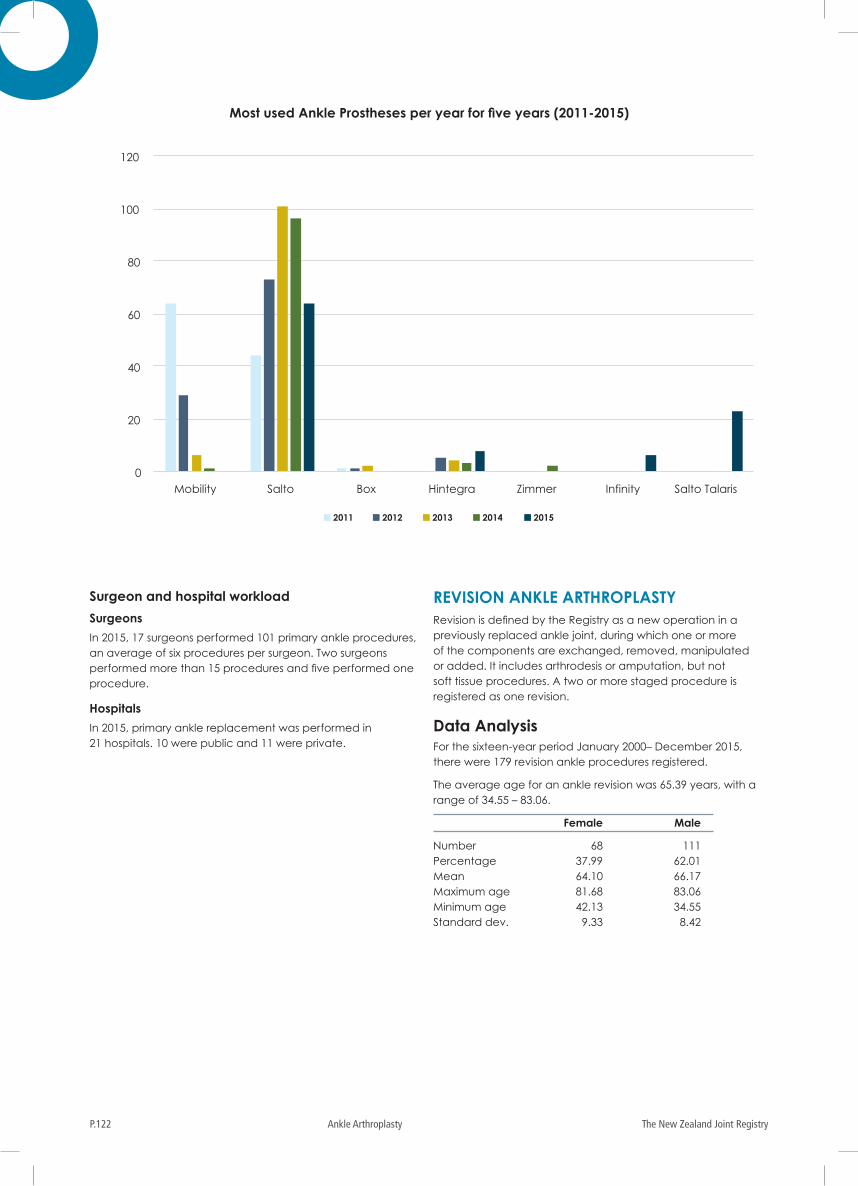
The New Zealand Joint RegistryP.122 Ankle Arthroplasty
Surgeon and hospital workload
Surgeons
In 2015, 17 surgeons performed 101 primary ankle procedures, an average of six procedures per surgeon. Two surgeons performed more than 15 procedures and five performed one procedure.
Hospitals
In 2015, primary ankle replacement was performed in 21 hospitals. 10 were public and 11 were private.
REVISION ANKLE ARTHROPLASTYRevision is defined by the Registry as a new operation in a previously replaced ankle joint, during which one or more of the components are exchanged, removed, manipulated or added. It includes arthrodesis or amputation, but not soft tissue procedures. A two or more staged procedure is registered as one revision.
Data AnalysisFor the sixteen-year period January 2000– December 2015, there were 179 revision ankle procedures registered.
The average age for an ankle revision was 65.39 years, with a range of 34.55 – 83.06.
Female Male
Number 68 111Percentage 37.99 62.01Mean 64.10 66.17Maximum age 81.68 83.06Minimum age 42.13 34.55Standard dev. 9.33 8.42
0
20
40
60
80
100
120
Mobility Salto Box Hintegra Zimmer Infinity Salto Talaris
2011 2012 2013 2014 2015
Most used Ankle Prostheses per year for five years (2011-2015)
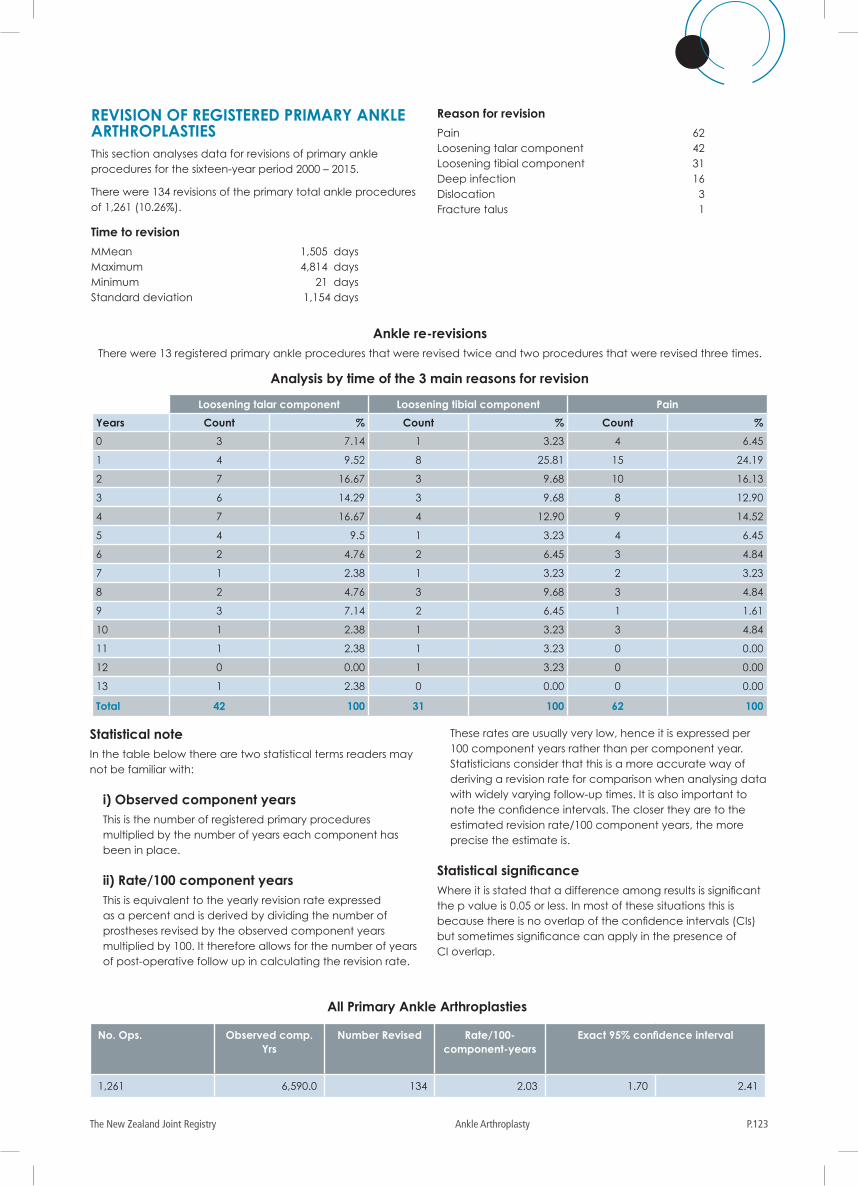
P.123The New Zealand Joint Registry Ankle Arthroplasty
Analysis by time of the 3 main reasons for revision
REVISION OF REGISTERED PRIMARY ANKLE ARTHROPLASTIESThis section analyses data for revisions of primary ankle procedures for the sixteen-year period 2000 – 2015.
There were 134 revisions of the primary total ankle procedures of 1,261 (10.26%).
Time to revision
MMean 1,505 daysMaximum 4,814 daysMinimum 21 daysStandard deviation 1,154 days
Reason for revision
Pain 62Loosening talar component 42Loosening tibial component 31Deep infection 16Dislocation 3Fracture talus 1
Statistical noteIn the table below there are two statistical terms readers may not be familiar with:
i) Observed component yearsThis is the number of registered primary procedures multiplied by the number of years each component has been in place.
ii) Rate/100 component yearsThis is equivalent to the yearly revision rate expressed as a percent and is derived by dividing the number of prostheses revised by the observed component years multiplied by 100. It therefore allows for the number of years of post-operative follow up in calculating the revision rate.
These rates are usually very low, hence it is expressed per 100 component years rather than per component year. Statisticians consider that this is a more accurate way of deriving a revision rate for comparison when analysing data with widely varying follow-up times. It is also important to note the confidence intervals. The closer they are to the estimated revision rate/100 component years, the more precise the estimate is.
Statistical significance Where it is stated that a difference among results is significant the p value is 0.05 or less. In most of these situations this is because there is no overlap of the confidence intervals (CIs) but sometimes significance can apply in the presence of CI overlap.
All Primary Ankle Arthroplasties
No. Ops. Observed comp. Yrs
Number Revised Rate/100- component-years
Exact 95% confidence interval
1,261 6,590.0 134 2.03 1.70 2.41
Loosening talar component Loosening tibial component Pain
Years Count % Count % Count %
0 3 7.14 1 3.23 4 6.45
1 4 9.52 8 25.81 15 24.19
2 7 16.67 3 9.68 10 16.13
3 6 14.29 3 9.68 8 12.90
4 7 16.67 4 12.90 9 14.52
5 4 9.5 1 3.23 4 6.45
6 2 4.76 2 6.45 3 4.84
7 1 2.38 1 3.23 2 3.23
8 2 4.76 3 9.68 3 4.84
9 3 7.14 2 6.45 1 1.61
10 1 2.38 1 3.23 3 4.84
11 1 2.38 1 3.23 0 0.00
12 0 0.00 1 3.23 0 0.00
13 1 2.38 0 0.00 0 0.00
Total 42 100 31 100 62 100
Ankle re-revisionsThere were 13 registered primary ankle procedures that were revised twice and two procedures that were revised three times.
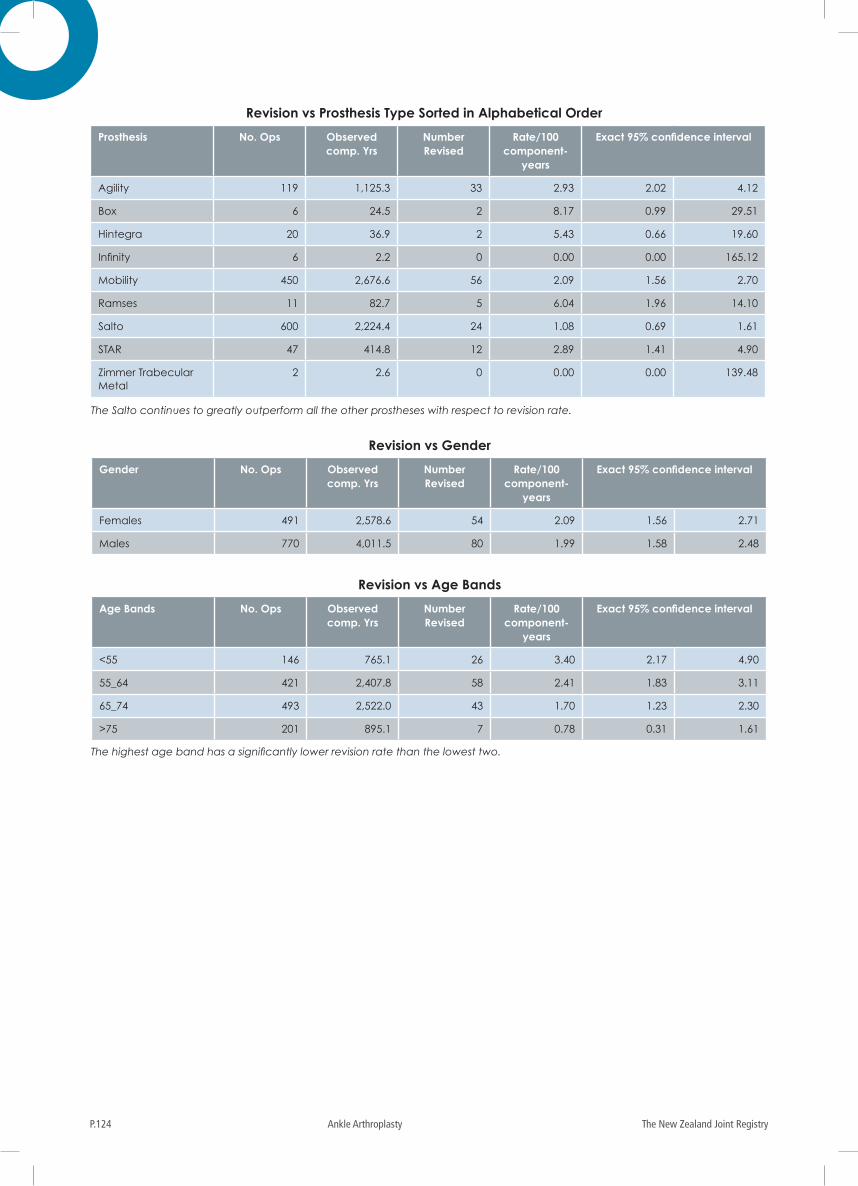
The New Zealand Joint RegistryP.124 Ankle Arthroplasty
Prosthesis No. Ops Observed comp. Yrs
Number Revised
Rate/100 component-
years
Exact 95% confidence interval
Agility 119 1,125.3 33 2.93 2.02 4.12
Box 6 24.5 2 8.17 0.99 29.51
Hintegra 20 36.9 2 5.43 0.66 19.60
Infinity 6 2.2 0 0.00 0.00 165.12
Mobility 450 2,676.6 56 2.09 1.56 2.70
Ramses 11 82.7 5 6.04 1.96 14.10
Salto 600 2,224.4 24 1.08 0.69 1.61
STAR 47 414.8 12 2.89 1.41 4.90
Zimmer Trabecular Metal
2 2.6 0 0.00 0.00 139.48
Revision vs Prosthesis Type Sorted in Alphabetical Order
Gender No. Ops Observed comp. Yrs
Number Revised
Rate/100 component-
years
Exact 95% confidence interval
Females 491 2,578.6 54 2.09 1.56 2.71
Males 770 4,011.5 80 1.99 1.58 2.48
Age Bands No. Ops Observed comp. Yrs
Number Revised
Rate/100 component-
years
Exact 95% confidence interval
<55 146 765.1 26 3.40 2.17 4.90
55_64 421 2,407.8 58 2.41 1.83 3.11
65_74 493 2,522.0 43 1.70 1.23 2.30
>75 201 895.1 7 0.78 0.31 1.61
Revision vs Gender
Revision vs Age Bands
The highest age band has a significantly lower revision rate than the lowest two.
The Salto continues to greatly outperform all the other prostheses with respect to revision rate.
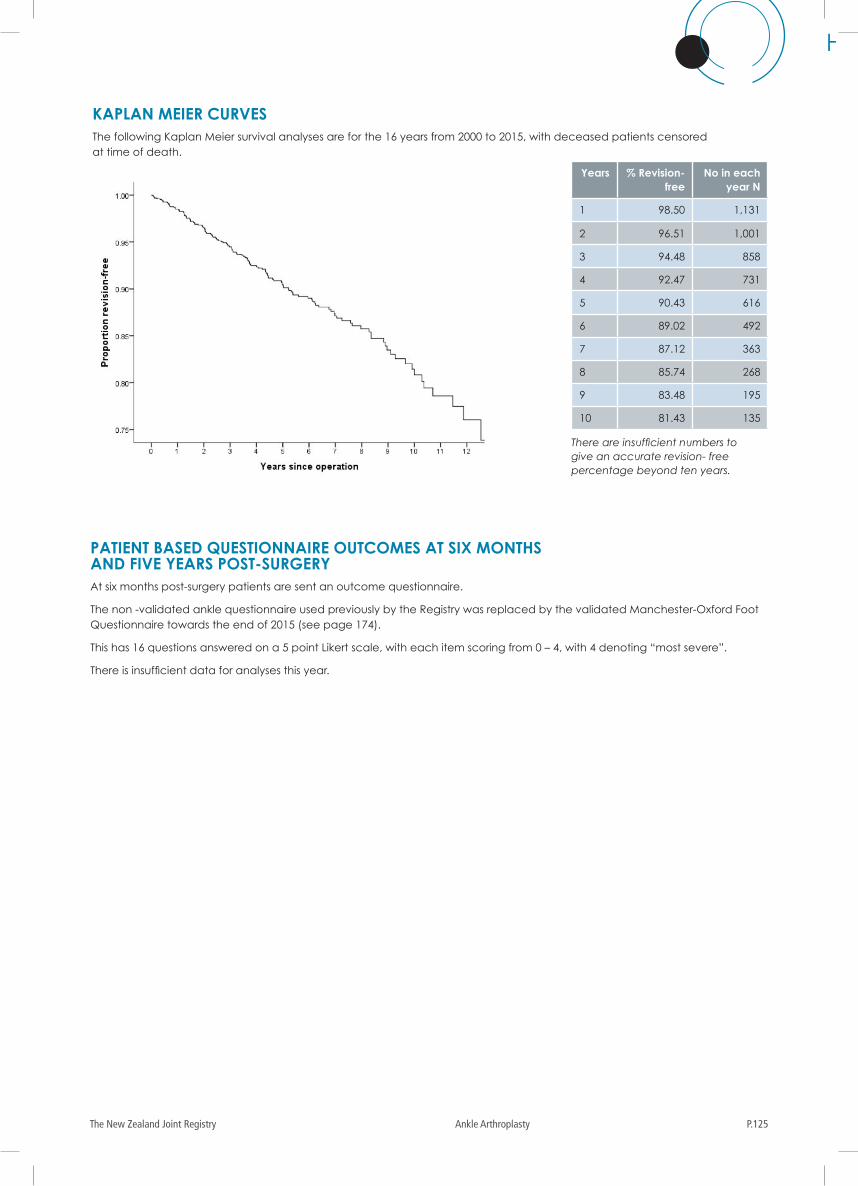
P.125The New Zealand Joint Registry Ankle Arthroplasty
HIP ANTHROPLASTY
PATIENT BASED QUESTIONNAIRE OUTCOMES AT SIX MONTHS AND FIVE YEARS POST-SURGERYAt six months post-surgery patients are sent an outcome questionnaire.
The non -validated ankle questionnaire used previously by the Registry was replaced by the validated Manchester-Oxford Foot Questionnaire towards the end of 2015 (see page 174).
This has 16 questions answered on a 5 point Likert scale, with each item scoring from 0 – 4, with 4 denoting “most severe”.
There is insufficient data for analyses this year.
KAPLAN MEIER CURVESThe following Kaplan Meier survival analyses are for the 16 years from 2000 to 2015, with deceased patients censored at time of death.
Years % Revision-free
No in each year N
1 98.50 1,131
2 96.51 1,001
3 94.48 858
4 92.47 731
5 90.43 616
6 89.02 492
7 87.12 363
8 85.74 268
9 83.48 195
10 81.43 135
There are insufficient numbers to give an accurate revision- free percentage beyond ten years.
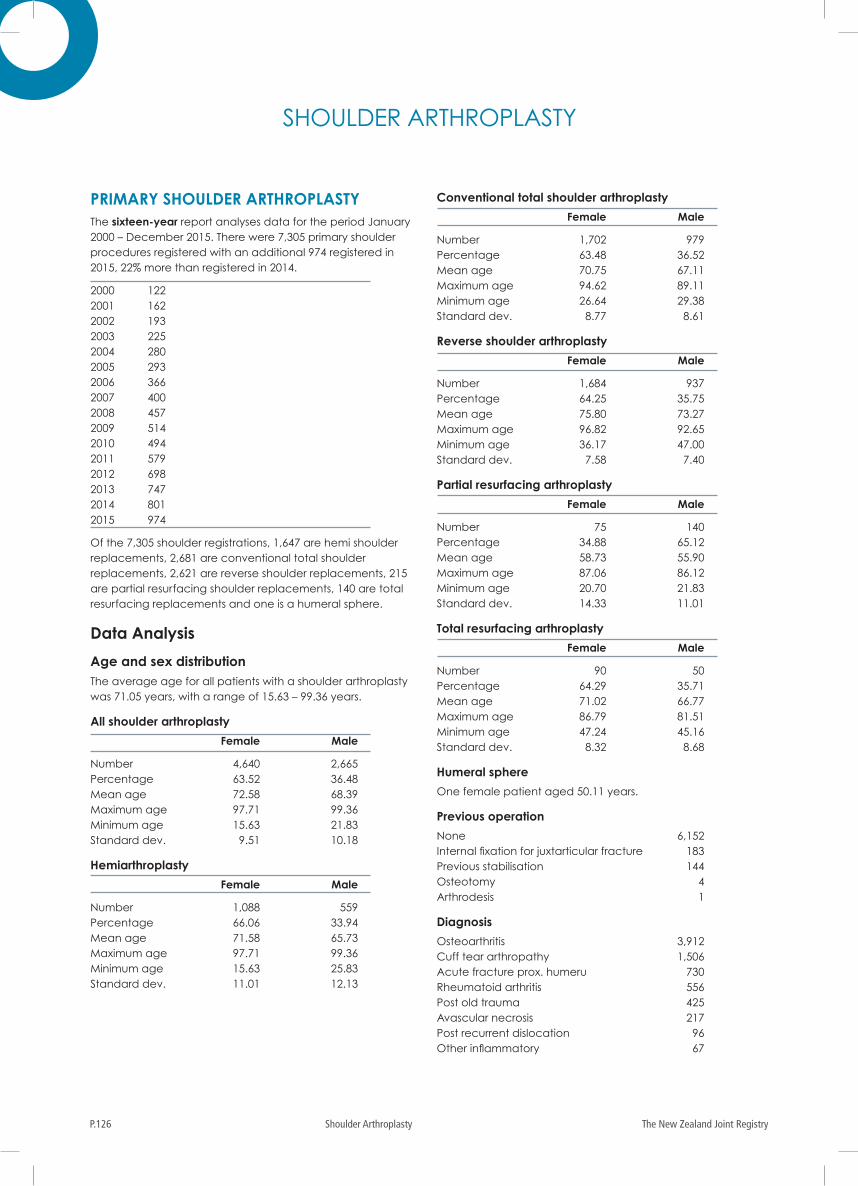
The New Zealand Joint RegistryP.126 Shoulder Arthroplasty
PRIMARY SHOULDER ARTHROPLASTY The sixteen-year report analyses data for the period January 2000 – December 2015. There were 7,305 primary shoulder procedures registered with an additional 974 registered in 2015, 22% more than registered in 2014.
2000 122 2001 162 2002 193 2003 225 2004 280 2005 293 2006 366 2007 400 2008 457 2009 514 2010 494 2011 579 2012 698 2013 747 2014 801 2015 974
Of the 7,305 shoulder registrations, 1,647 are hemi shoulder replacements, 2,681 are conventional total shoulder replacements, 2,621 are reverse shoulder replacements, 215 are partial resurfacing shoulder replacements, 140 are total resurfacing replacements and one is a humeral sphere.
Data Analysis
Age and sex distributionThe average age for all patients with a shoulder arthroplasty was 71.05 years, with a range of 15.63 – 99.36 years.
All shoulder arthroplasty
Female Male
Number 4,640 2,665Percentage 63.52 36.48Mean age 72.58 68.39Maximum age 97.71 99.36Minimum age 15.63 21.83Standard dev. 9.51 10.18
Hemiarthroplasty
Female Male
Number 1,088 559Percentage 66.06 33.94Mean age 71.58 65.73Maximum age 97.71 99.36Minimum age 15.63 25.83Standard dev. 11.01 12.13
Conventional total shoulder arthroplasty
Female Male
Number 1,702 979Percentage 63.48 36.52Mean age 70.75 67.11Maximum age 94.62 89.11Minimum age 26.64 29.38Standard dev. 8.77 8.61
Reverse shoulder arthroplasty
Female Male
Number 1,684 937Percentage 64.25 35.75Mean age 75.80 73.27Maximum age 96.82 92.65Minimum age 36.17 47.00Standard dev. 7.58 7.40
Partial resurfacing arthroplasty
Female Male
Number 75 140Percentage 34.88 65.12Mean age 58.73 55.90Maximum age 87.06 86.12Minimum age 20.70 21.83Standard dev. 14.33 11.01
Total resurfacing arthroplasty
Female Male
Number 90 50Percentage 64.29 35.71Mean age 71.02 66.77Maximum age 86.79 81.51Minimum age 47.24 45.16Standard dev. 8.32 8.68
Humeral sphere
One female patient aged 50.11 years.
Previous operation
None 6,152Internal fixation for juxtarticular fracture 183Previous stabilisation 144Osteotomy 4Arthrodesis 1
Diagnosis
Osteoarthritis 3,912Cuff tear arthropathy 1,506Acute fracture prox. humeru 730Rheumatoid arthritis 556Post old trauma 425Avascular necrosis 217Post recurrent dislocation 96Other inflammatory 67
SHOULDER ARTHROPLASTY
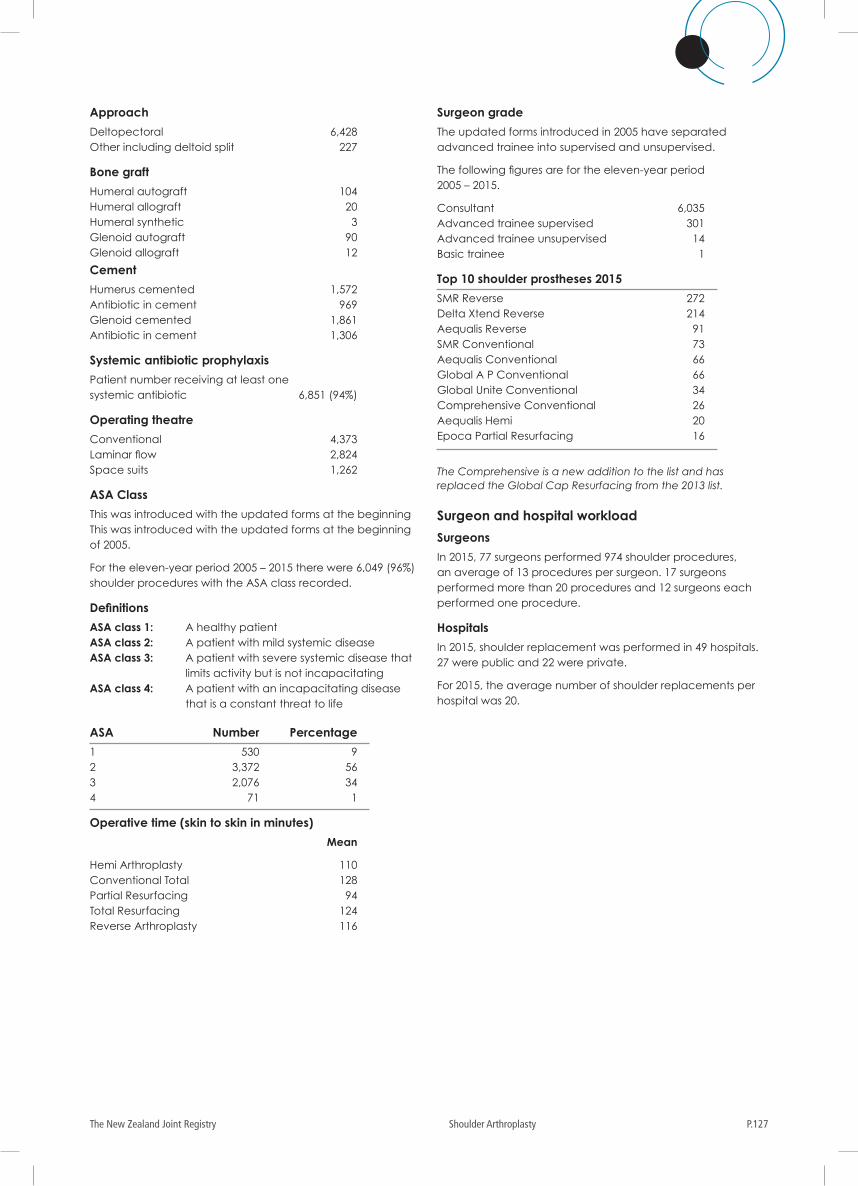
P.127The New Zealand Joint Registry Shoulder Arthroplasty
Approach
Deltopectoral 6,428Other including deltoid split 227
Bone graft
Humeral autograft 104Humeral allograft 20Humeral synthetic 3Glenoid autograft 90Glenoid allograft 12
Cement
Humerus cemented 1,572Antibiotic in cement 969 Glenoid cemented 1,861Antibiotic in cement 1,306
Systemic antibiotic prophylaxis
Patient number receiving at least one systemic antibiotic 6,851 (94%)
Operating theatre
Conventional 4,373Laminar flow 2,824Space suits 1,262
ASA Class
This was introduced with the updated forms at the beginning This was introduced with the updated forms at the beginning of 2005.
For the eleven-year period 2005 – 2015 there were 6,049 (96%) shoulder procedures with the ASA class recorded.
Definitions
ASA class 1: A healthy patient ASA class 2: A patient with mild systemic disease ASA class 3: A patient with severe systemic disease that
limits activity but is not incapacitatingASA class 4: A patient with an incapacitating disease
that is a constant threat to life
ASA Number Percentage
1 530 92 3,372 563 2,076 344 71 1
Operative time (skin to skin in minutes)
Mean
Hemi Arthroplasty 110Conventional Total 128Partial Resurfacing 94Total Resurfacing 124Reverse Arthroplasty 116
Surgeon grade
The updated forms introduced in 2005 have separated advanced trainee into supervised and unsupervised.
The following figures are for the eleven-year period 2005 – 2015.
Consultant 6,035Advanced trainee supervised 301Advanced trainee unsupervised 14Basic trainee 1
Top 10 shoulder prostheses 2015
SMR Reverse 272Delta Xtend Reverse 214Aequalis Reverse 91SMR Conventional 73Aequalis Conventional 66Global A P Conventional 66Global Unite Conventional 34Comprehensive Conventional 26Aequalis Hemi 20Epoca Partial Resurfacing 16
The Comprehensive is a new addition to the list and has replaced the Global Cap Resurfacing from the 2013 list.
Surgeon and hospital workload
Surgeons
In 2015, 77 surgeons performed 974 shoulder procedures, an average of 13 procedures per surgeon. 17 surgeons performed more than 20 procedures and 12 surgeons each performed one procedure.
Hospitals
In 2015, shoulder replacement was performed in 49 hospitals. 27 were public and 22 were private.
For 2015, the average number of shoulder replacements per hospital was 20.
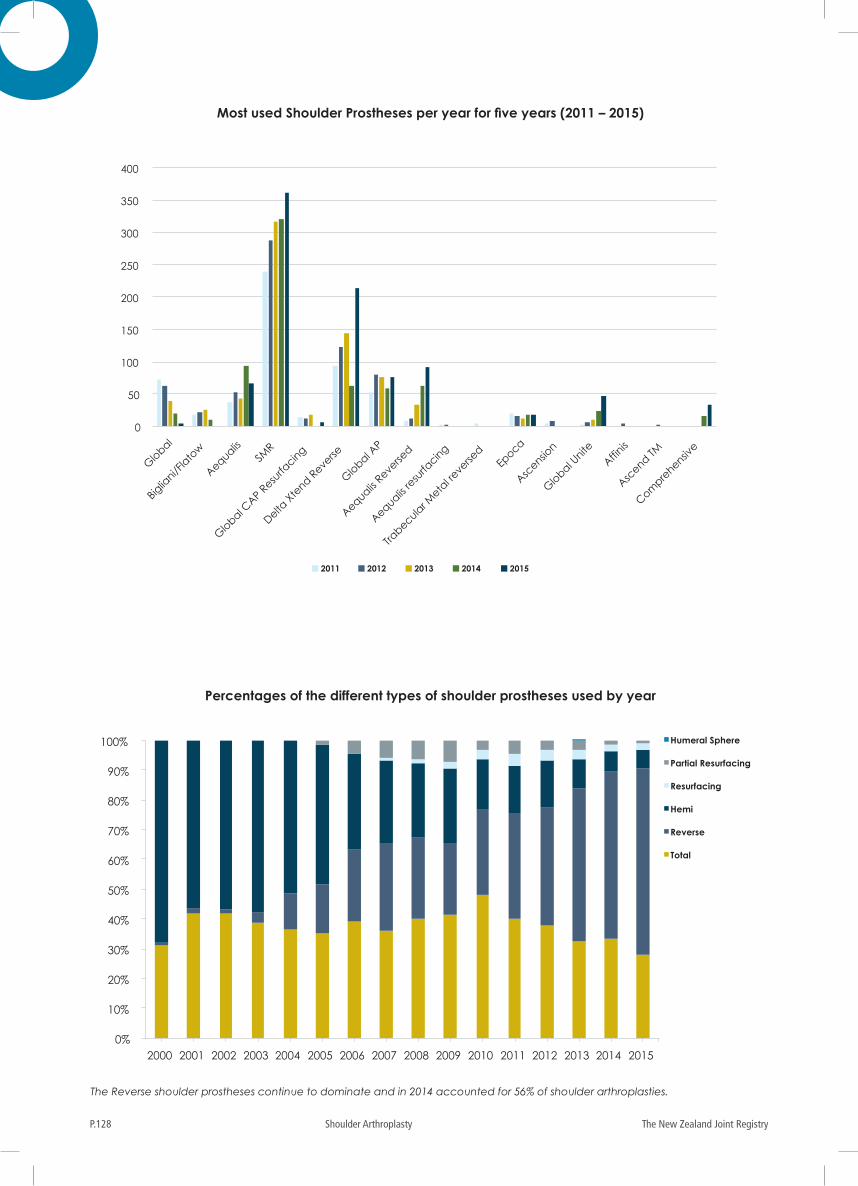
The New Zealand Joint RegistryP.128 Shoulder Arthroplasty
0
50
100
150
200
250
300
350
400
Glo
bal
Biglia
ni/Fla
tow
Aequalis
SMR
Glo
bal CAP R
esurfa
cing
Delta X
tend R
everse
Glo
bal AP
Aequalis Reve
rsed
Aequalis re
surfa
cing
Trabecula
r Meta
l reve
rsed
Epoca
Ascensio
n
Glo
bal Unite
Affinis
Ascend TM
Compre
hensive
2011 2012 2013 2014 2015
Humeral Sphere
Partial Resurfacing
Resurfacing
Hemi
Reverse
Total
0%
10%
20%
30%
40%
50%
60%
70%
80%
90%
100%
2000 2001 2002 2003 2004 2005 2006 2007 2008 2009 2010 2011 2012 2013 2014 2015
Most used Shoulder Prostheses per year for five years (2011 – 2015)
Percentages of the different types of shoulder prostheses used by year
The Reverse shoulder prostheses continue to dominate and in 2014 accounted for 56% of shoulder arthroplasties.
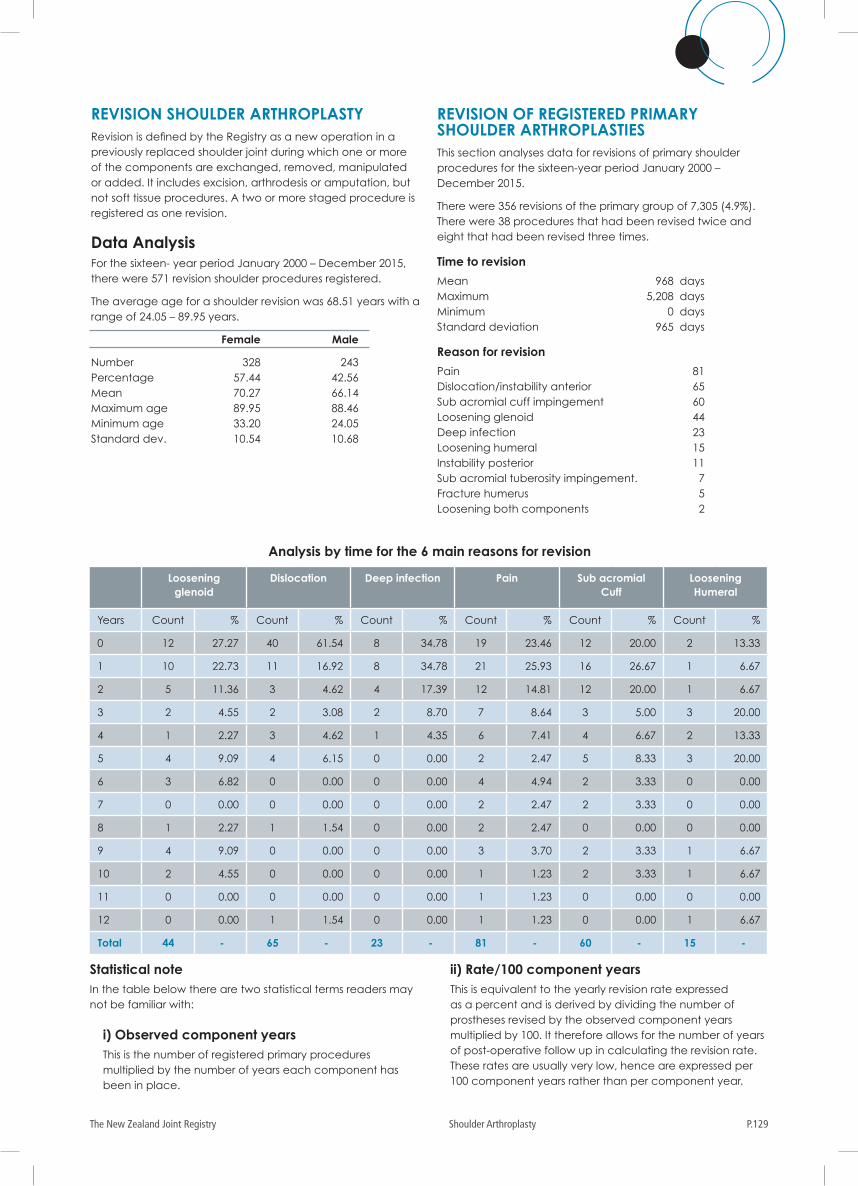
P.129The New Zealand Joint Registry Shoulder Arthroplasty
Analysis by time for the 6 main reasons for revision
REVISION SHOULDER ARTHROPLASTY Revision is defined by the Registry as a new operation in a previously replaced shoulder joint during which one or more of the components are exchanged, removed, manipulated or added. It includes excision, arthrodesis or amputation, but not soft tissue procedures. A two or more staged procedure is registered as one revision.
Data AnalysisFor the sixteen- year period January 2000 – December 2015, there were 571 revision shoulder procedures registered.
The average age for a shoulder revision was 68.51 years with a range of 24.05 – 89.95 years.
Female Male
Number 328 243Percentage 57.44 42.56Mean 70.27 66.14Maximum age 89.95 88.46Minimum age 33.20 24.05Standard dev. 10.54 10.68
REVISION OF REGISTERED PRIMARY SHOULDER ARTHROPLASTIESThis section analyses data for revisions of primary shoulder procedures for the sixteen-year period January 2000 – December 2015.
There were 356 revisions of the primary group of 7,305 (4.9%). There were 38 procedures that had been revised twice and eight that had been revised three times.
Time to revision
Mean 968 daysMaximum 5,208 daysMinimum 0 days Standard deviation 965 days
Reason for revision
Pain 81Dislocation/instability anterior 65Sub acromial cuff impingement 60Loosening glenoid 44Deep infection 23Loosening humeral 15Instability posterior 11Sub acromial tuberosity impingement. 7Fracture humerus 5Loosening both components 2
Statistical noteIn the table below there are two statistical terms readers may not be familiar with:
i) Observed component yearsThis is the number of registered primary procedures multiplied by the number of years each component has been in place.
ii) Rate/100 component yearsThis is equivalent to the yearly revision rate expressed as a percent and is derived by dividing the number of prostheses revised by the observed component years multiplied by 100. It therefore allows for the number of years of post-operative follow up in calculating the revision rate. These rates are usually very low, hence are expressed per 100 component years rather than per component year.
Loosening glenoid
Dislocation Deep infection Pain Sub acromial Cuff
Loosening Humeral
Years Count % Count % Count % Count % Count % Count %
0 12 27.27 40 61.54 8 34.78 19 23.46 12 20.00 2 13.33
1 10 22.73 11 16.92 8 34.78 21 25.93 16 26.67 1 6.67
2 5 11.36 3 4.62 4 17.39 12 14.81 12 20.00 1 6.67
3 2 4.55 2 3.08 2 8.70 7 8.64 3 5.00 3 20.00
4 1 2.27 3 4.62 1 4.35 6 7.41 4 6.67 2 13.33
5 4 9.09 4 6.15 0 0.00 2 2.47 5 8.33 3 20.00
6 3 6.82 0 0.00 0 0.00 4 4.94 2 3.33 0 0.00
7 0 0.00 0 0.00 0 0.00 2 2.47 2 3.33 0 0.00
8 1 2.27 1 1.54 0 0.00 2 2.47 0 0.00 0 0.00
9 4 9.09 0 0.00 0 0.00 3 3.70 2 3.33 1 6.67
10 2 4.55 0 0.00 0 0.00 1 1.23 2 3.33 1 6.67
11 0 0.00 0 0.00 0 0.00 1 1.23 0 0.00 0 0.00
12 0 0.00 1 1.54 0 0.00 1 1.23 0 0.00 1 6.67
Total 44 - 65 - 23 - 81 - 60 - 15 -
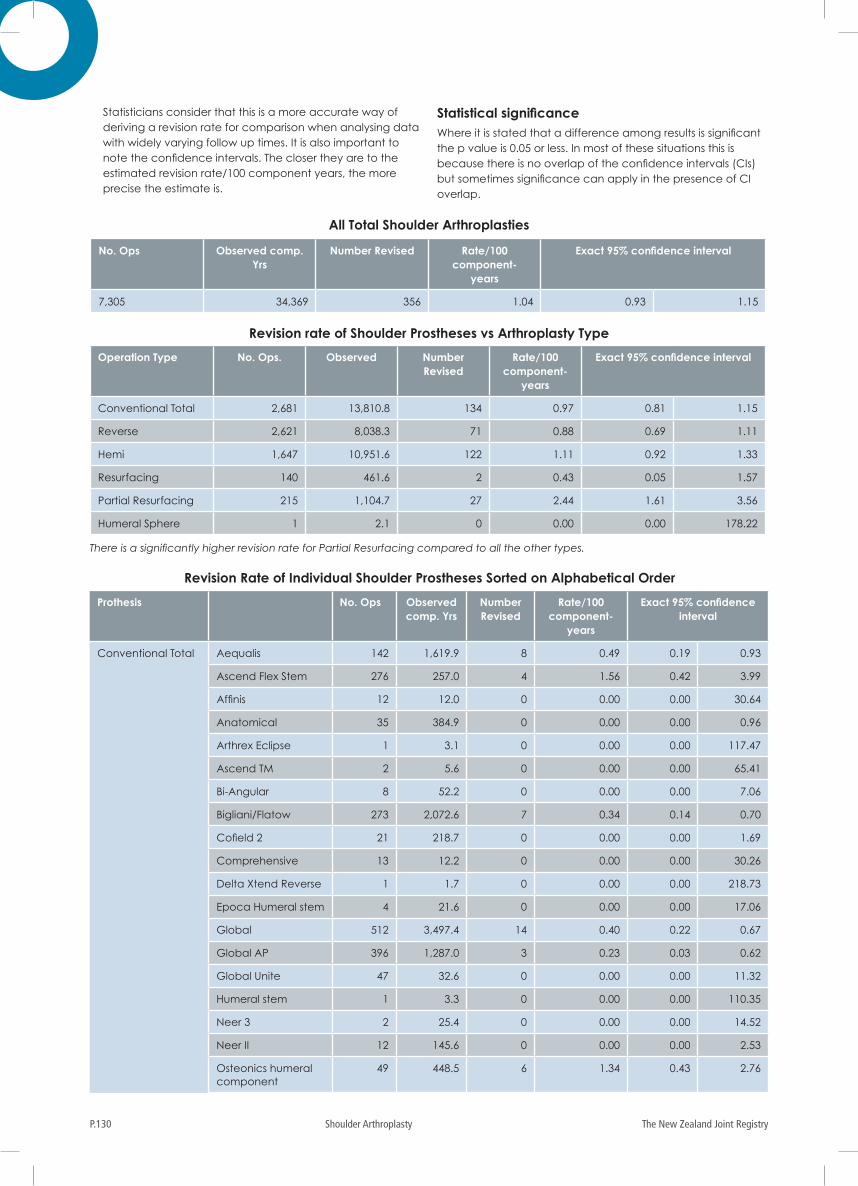
The New Zealand Joint RegistryP.130 Shoulder Arthroplasty
No. Ops Observed comp. Yrs
Number Revised Rate/100 component-
years
Exact 95% confidence interval
7,305 34,369 356 1.04 0.93 1.15
All Total Shoulder Arthroplasties
Operation Type No. Ops. Observed Number Revised
Rate/100 component-
years
Exact 95% confidence interval
Conventional Total 2,681 13,810.8 134 0.97 0.81 1.15
Reverse 2,621 8,038.3 71 0.88 0.69 1.11
Hemi 1,647 10,951.6 122 1.11 0.92 1.33
Resurfacing 140 461.6 2 0.43 0.05 1.57
Partial Resurfacing 215 1,104.7 27 2.44 1.61 3.56
Humeral Sphere 1 2.1 0 0.00 0.00 178.22
There is a significantly higher revision rate for Partial Resurfacing compared to all the other types.
Revision rate of Shoulder Prostheses vs Arthroplasty Type
Statisticians consider that this is a more accurate way of deriving a revision rate for comparison when analysing data with widely varying follow up times. It is also important to note the confidence intervals. The closer they are to the estimated revision rate/100 component years, the more precise the estimate is.
Statistical significance Where it is stated that a difference among results is significant the p value is 0.05 or less. In most of these situations this is because there is no overlap of the confidence intervals (CIs) but sometimes significance can apply in the presence of CI overlap.
Prothesis No. Ops Observed comp. Yrs
Number Revised
Rate/100 component-
years
Exact 95% confidence interval
Conventional Total Aequalis 142 1,619.9 8 0.49 0.19 0.93
Ascend Flex Stem 276 257.0 4 1.56 0.42 3.99
Affinis 12 12.0 0 0.00 0.00 30.64
Anatomical 35 384.9 0 0.00 0.00 0.96
Arthrex Eclipse 1 3.1 0 0.00 0.00 117.47
Ascend TM 2 5.6 0 0.00 0.00 65.41
Bi-Angular 8 52.2 0 0.00 0.00 7.06
Bigliani/Flatow 273 2,072.6 7 0.34 0.14 0.70
Cofield 2 21 218.7 0 0.00 0.00 1.69
Comprehensive 13 12.2 0 0.00 0.00 30.26
Delta Xtend Reverse 1 1.7 0 0.00 0.00 218.73
Epoca Humeral stem 4 21.6 0 0.00 0.00 17.06
Global 512 3,497.4 14 0.40 0.22 0.67
Global AP 396 1,287.0 3 0.23 0.03 0.62
Global Unite 47 32.6 0 0.00 0.00 11.32
Humeral stem 1 3.3 0 0.00 0.00 110.35
Neer 3 2 25.4 0 0.00 0.00 14.52
Neer II 12 145.6 0 0.00 0.00 2.53
Osteonics humeral component
49 448.5 6 1.34 0.43 2.76
Revision Rate of Individual Shoulder Prostheses Sorted on Alphabetical Order
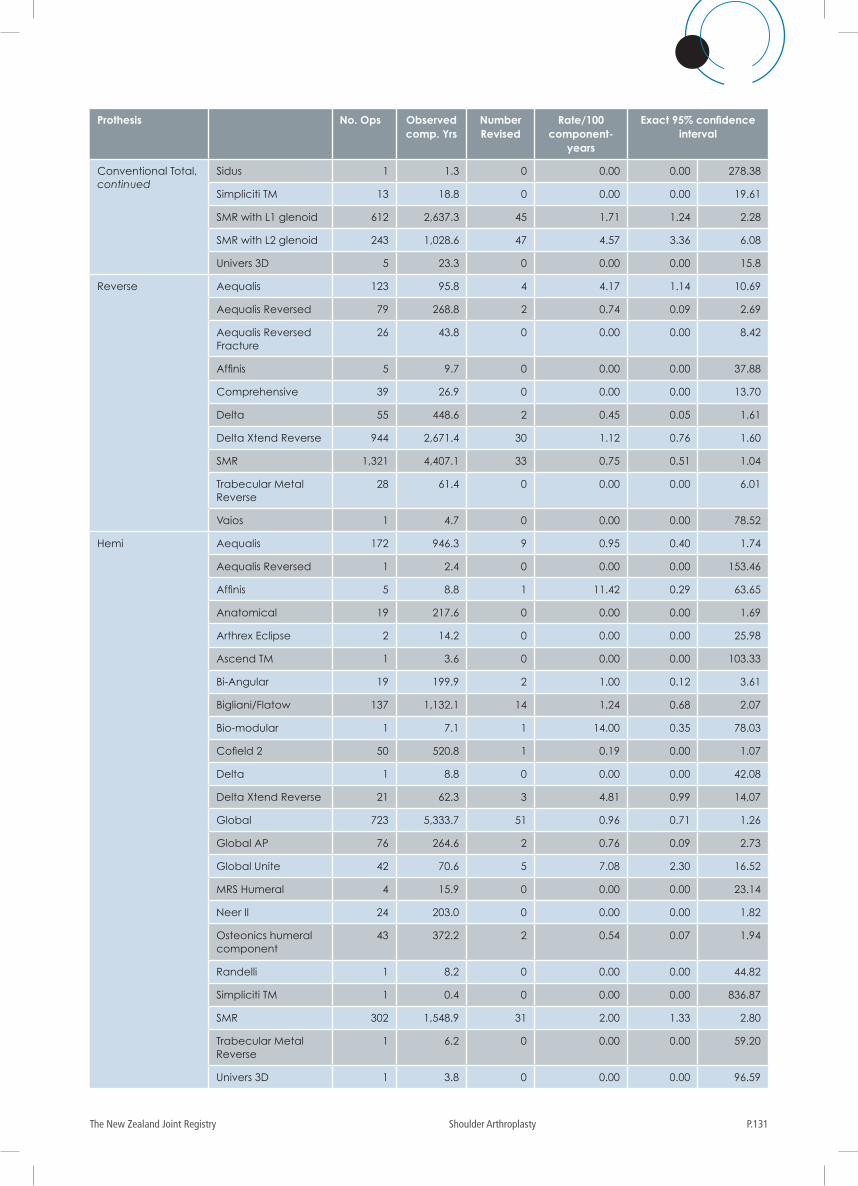
P.131The New Zealand Joint Registry Shoulder Arthroplasty
Prothesis No. Ops Observed comp. Yrs
Number Revised
Rate/100 component-
years
Exact 95% confidence interval
Conventional Total, continued
Sidus 1 1.3 0 0.00 0.00 278.38
Simpliciti TM 13 18.8 0 0.00 0.00 19.61
SMR with L1 glenoid 612 2,637.3 45 1.71 1.24 2.28
SMR with L2 glenoid 243 1,028.6 47 4.57 3.36 6.08
Univers 3D 5 23.3 0 0.00 0.00 15.8
Reverse Aequalis 123 95.8 4 4.17 1.14 10.69
Aequalis Reversed 79 268.8 2 0.74 0.09 2.69
Aequalis Reversed Fracture
26 43.8 0 0.00 0.00 8.42
Affinis 5 9.7 0 0.00 0.00 37.88
Comprehensive 39 26.9 0 0.00 0.00 13.70
Delta 55 448.6 2 0.45 0.05 1.61
Delta Xtend Reverse 944 2,671.4 30 1.12 0.76 1.60
SMR 1,321 4,407.1 33 0.75 0.51 1.04
Trabecular Metal Reverse
28 61.4 0 0.00 0.00 6.01
Vaios 1 4.7 0 0.00 0.00 78.52
Hemi Aequalis 172 946.3 9 0.95 0.40 1.74
Aequalis Reversed 1 2.4 0 0.00 0.00 153.46
Affinis 5 8.8 1 11.42 0.29 63.65
Anatomical 19 217.6 0 0.00 0.00 1.69
Arthrex Eclipse 2 14.2 0 0.00 0.00 25.98
Ascend TM 1 3.6 0 0.00 0.00 103.33
Bi-Angular 19 199.9 2 1.00 0.12 3.61
Bigliani/Flatow 137 1,132.1 14 1.24 0.68 2.07
Bio-modular 1 7.1 1 14.00 0.35 78.03
Cofield 2 50 520.8 1 0.19 0.00 1.07
Delta 1 8.8 0 0.00 0.00 42.08
Delta Xtend Reverse 21 62.3 3 4.81 0.99 14.07
Global 723 5,333.7 51 0.96 0.71 1.26
Global AP 76 264.6 2 0.76 0.09 2.73
Global Unite 42 70.6 5 7.08 2.30 16.52
MRS Humeral 4 15.9 0 0.00 0.00 23.14
Neer II 24 203.0 0 0.00 0.00 1.82
Osteonics humeral component
43 372.2 2 0.54 0.07 1.94
Randelli 1 8.2 0 0.00 0.00 44.82
Simpliciti TM 1 0.4 0 0.00 0.00 836.87
SMR 302 1,548.9 31 2.00 1.33 2.80
Trabecular Metal Reverse
1 6.2 0 0.00 0.00 59.20
Univers 3D 1 3.8 0 0.00 0.00 96.59
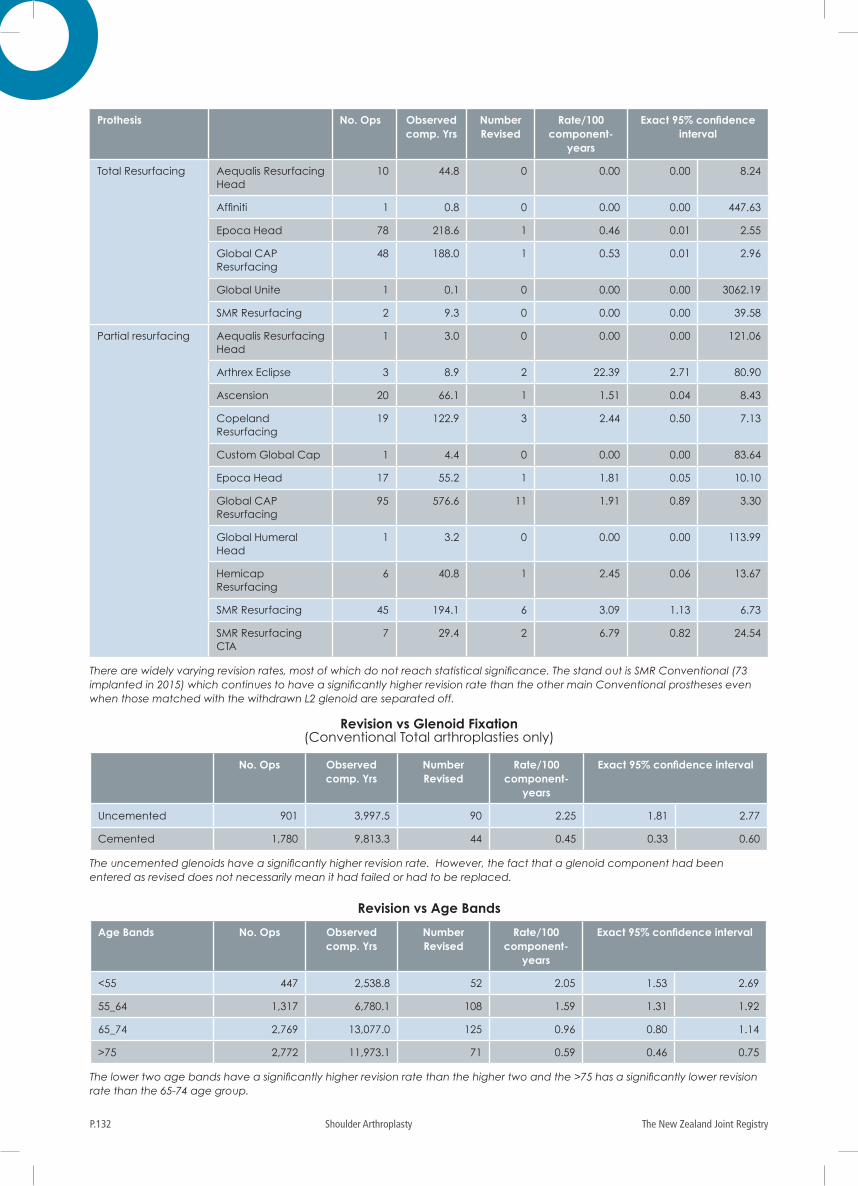
The New Zealand Joint RegistryP.132 Shoulder Arthroplasty
Prothesis No. Ops Observed comp. Yrs
Number Revised
Rate/100 component-
years
Exact 95% confidence interval
Total Resurfacing Aequalis Resurfacing Head
10 44.8 0 0.00 0.00 8.24
Affiniti 1 0.8 0 0.00 0.00 447.63
Epoca Head 78 218.6 1 0.46 0.01 2.55
Global CAP Resurfacing
48 188.0 1 0.53 0.01 2.96
Global Unite 1 0.1 0 0.00 0.00 3062.19
SMR Resurfacing 2 9.3 0 0.00 0.00 39.58
Partial resurfacing Aequalis Resurfacing Head
1 3.0 0 0.00 0.00 121.06
Arthrex Eclipse 3 8.9 2 22.39 2.71 80.90
Ascension 20 66.1 1 1.51 0.04 8.43
Copeland Resurfacing
19 122.9 3 2.44 0.50 7.13
Custom Global Cap 1 4.4 0 0.00 0.00 83.64
Epoca Head 17 55.2 1 1.81 0.05 10.10
Global CAP Resurfacing
95 576.6 11 1.91 0.89 3.30
Global Humeral Head
1 3.2 0 0.00 0.00 113.99
Hemicap Resurfacing
6 40.8 1 2.45 0.06 13.67
SMR Resurfacing 45 194.1 6 3.09 1.13 6.73
SMR Resurfacing CTA
7 29.4 2 6.79 0.82 24.54
There are widely varying revision rates, most of which do not reach statistical significance. The stand out is SMR Conventional (73 implanted in 2015) which continues to have a significantly higher revision rate than the other main Conventional prostheses even when those matched with the withdrawn L2 glenoid are separated off.
No. Ops Observed comp. Yrs
Number Revised
Rate/100 component-
years
Exact 95% confidence interval
Uncemented 901 3,997.5 90 2.25 1.81 2.77
Cemented 1,780 9,813.3 44 0.45 0.33 0.60
The uncemented glenoids have a significantly higher revision rate. However, the fact that a glenoid component had been entered as revised does not necessarily mean it had failed or had to be replaced.
Revision vs Glenoid Fixation (Conventional Total arthroplasties only)
Age Bands No. Ops Observed comp. Yrs
Number Revised
Rate/100 component-
years
Exact 95% confidence interval
<55 447 2,538.8 52 2.05 1.53 2.69
55_64 1,317 6,780.1 108 1.59 1.31 1.92
65_74 2,769 13,077.0 125 0.96 0.80 1.14
>75 2,772 11,973.1 71 0.59 0.46 0.75
The lower two age bands have a significantly higher revision rate than the higher two and the >75 has a significantly lower revision rate than the 65-74 age group.
Revision vs Age Bands
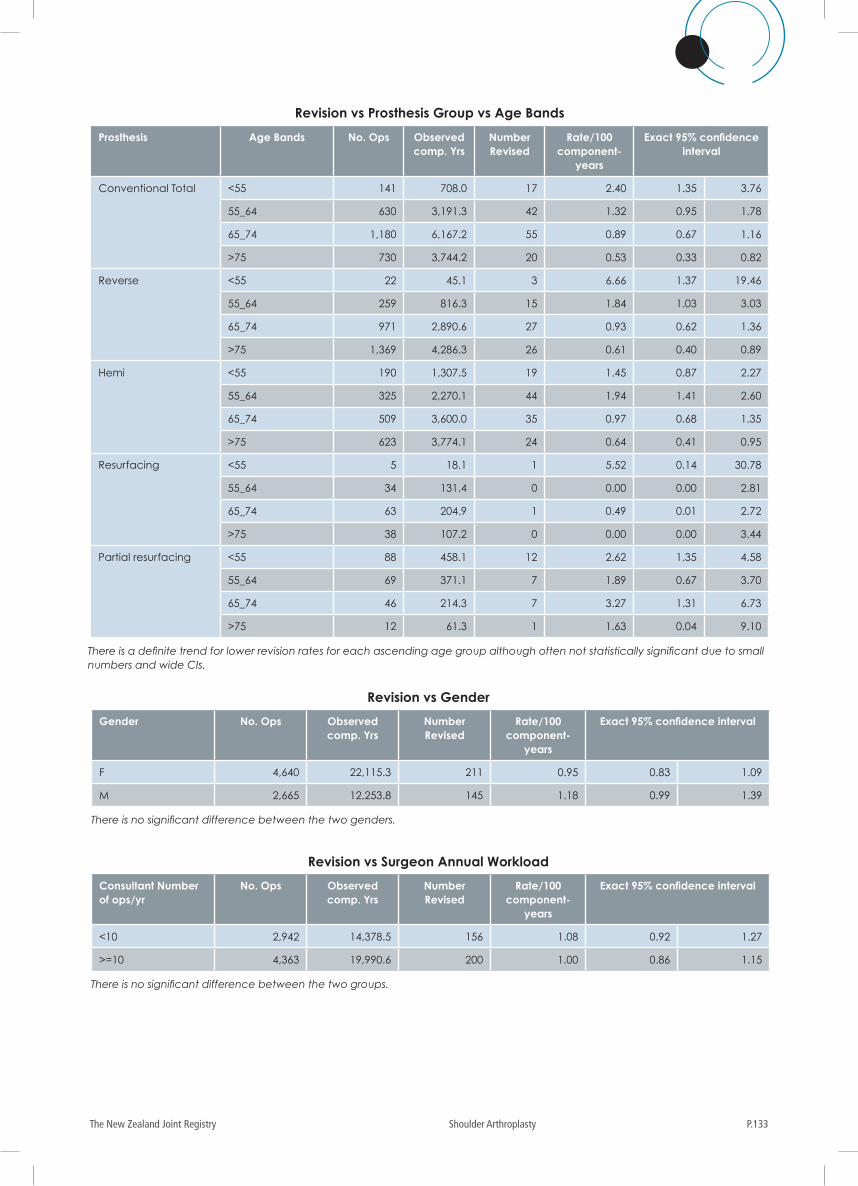
P.133The New Zealand Joint Registry Shoulder Arthroplasty
Gender No. Ops Observed comp. Yrs
Number Revised
Rate/100 component-
years
Exact 95% confidence interval
F 4,640 22,115.3 211 0.95 0.83 1.09
M 2,665 12,253.8 145 1.18 0.99 1.39
There is no significant difference between the two genders.
Consultant Number of ops/yr
No. Ops Observed comp. Yrs
Number Revised
Rate/100 component-
years
Exact 95% confidence interval
<10 2,942 14,378.5 156 1.08 0.92 1.27
>=10 4,363 19,990.6 200 1.00 0.86 1.15
There is no significant difference between the two groups.
Revision vs Gender
Revision vs Surgeon Annual Workload
Prosthesis Age Bands No. Ops Observed comp. Yrs
Number Revised
Rate/100 component-
years
Exact 95% confidence interval
Conventional Total <55 141 708.0 17 2.40 1.35 3.76
55_64 630 3,191.3 42 1.32 0.95 1.78
65_74 1,180 6,167.2 55 0.89 0.67 1.16
>75 730 3,744.2 20 0.53 0.33 0.82
Reverse <55 22 45.1 3 6.66 1.37 19.46
55_64 259 816.3 15 1.84 1.03 3.03
65_74 971 2,890.6 27 0.93 0.62 1.36
>75 1,369 4,286.3 26 0.61 0.40 0.89
Hemi <55 190 1,307.5 19 1.45 0.87 2.27
55_64 325 2,270.1 44 1.94 1.41 2.60
65_74 509 3,600.0 35 0.97 0.68 1.35
>75 623 3,774.1 24 0.64 0.41 0.95
Resurfacing <55 5 18.1 1 5.52 0.14 30.78
55_64 34 131.4 0 0.00 0.00 2.81
65_74 63 204.9 1 0.49 0.01 2.72
>75 38 107.2 0 0.00 0.00 3.44
Partial resurfacing <55 88 458.1 12 2.62 1.35 4.58
55_64 69 371.1 7 1.89 0.67 3.70
65_74 46 214.3 7 3.27 1.31 6.73
>75 12 61.3 1 1.63 0.04 9.10
Revision vs Prosthesis Group vs Age Bands
There is a definite trend for lower revision rates for each ascending age group although often not statistically significant due to small numbers and wide CIs.
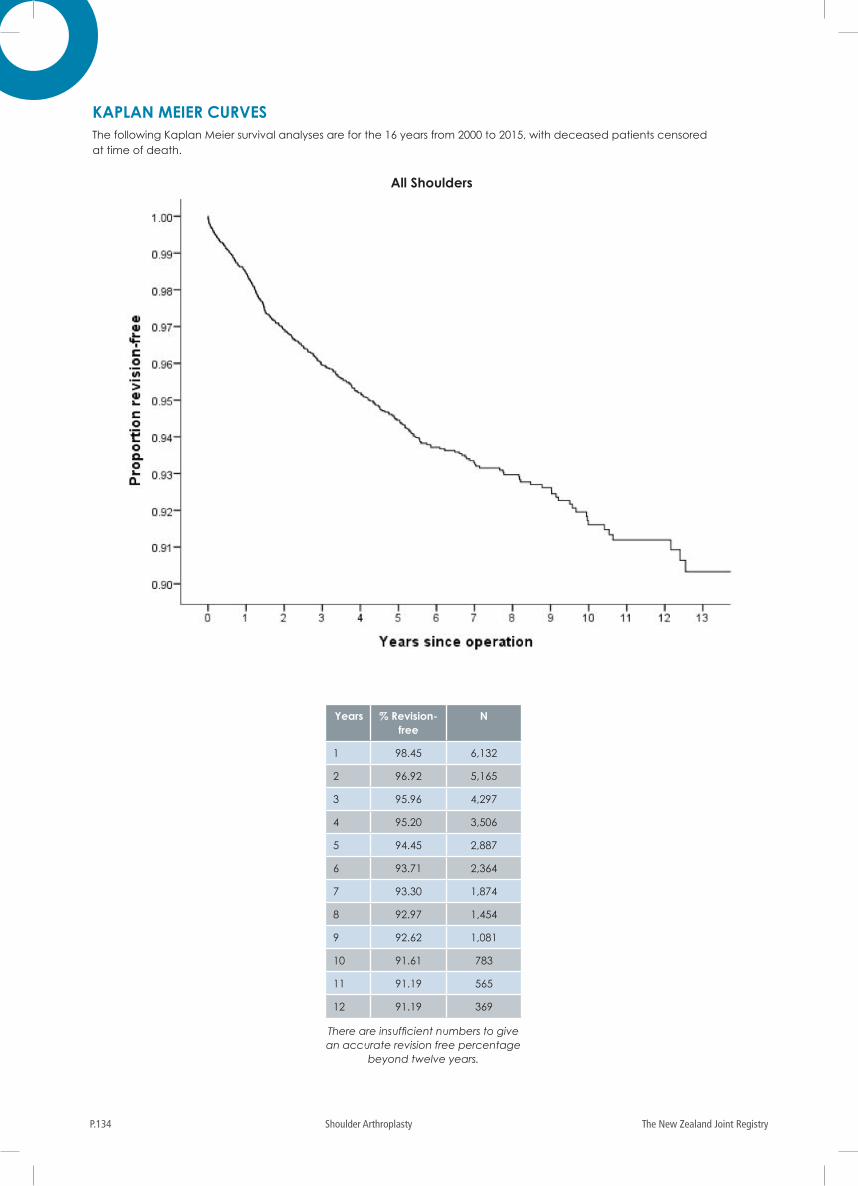
The New Zealand Joint RegistryP.134 Shoulder Arthroplasty
All Shoulders
KAPLAN MEIER CURVESThe following Kaplan Meier survival analyses are for the 16 years from 2000 to 2015, with deceased patients censored at time of death.
Years % Revision-free
N
1 98.45 6,132
2 96.92 5,165
3 95.96 4,297
4 95.20 3,506
5 94.45 2,887
6 93.71 2,364
7 93.30 1,874
8 92.97 1,454
9 92.62 1,081
10 91.61 783
11 91.19 565
12 91.19 369
There are insufficient numbers to give an accurate revision free percentage
beyond twelve years.
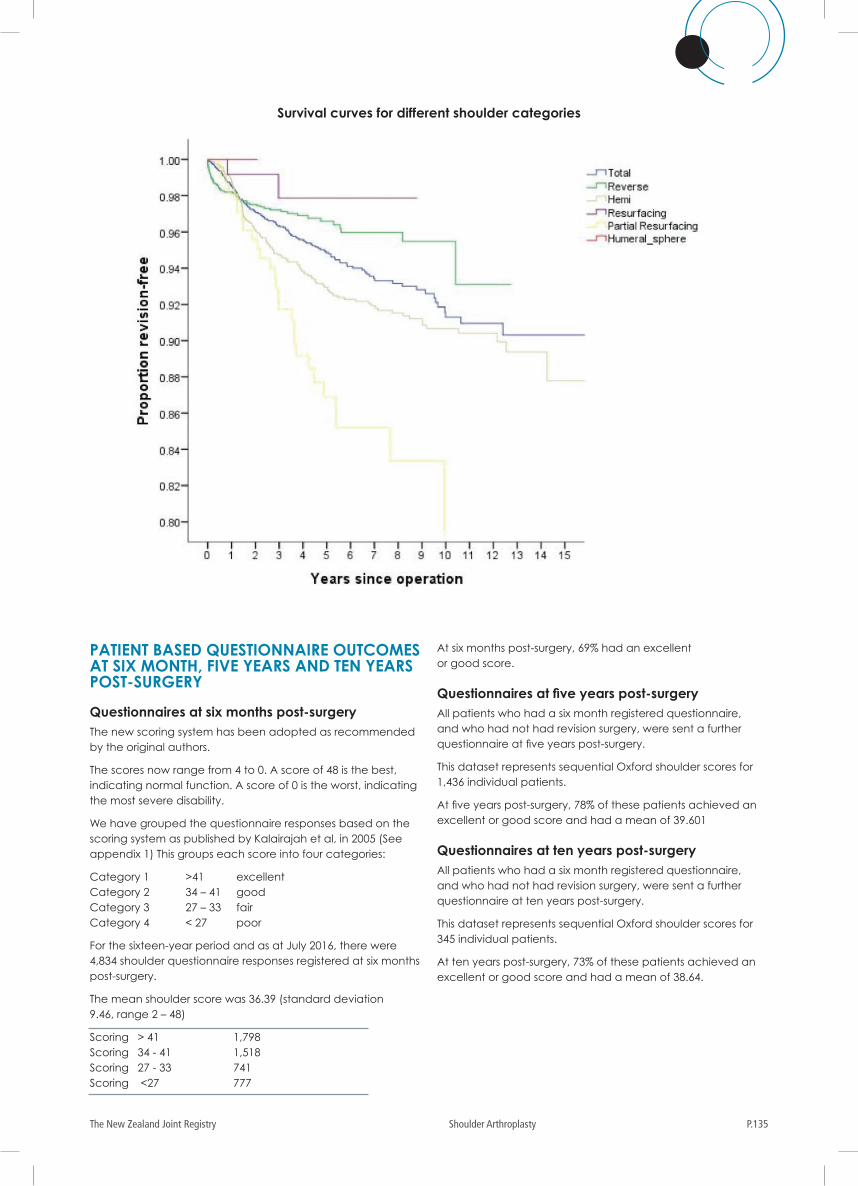
P.135The New Zealand Joint Registry Shoulder Arthroplasty
PATIENT BASED QUESTIONNAIRE OUTCOMES AT SIX MONTH, FIVE YEARS AND TEN YEARS POST-SURGERY
Questionnaires at six months post-surgeryThe new scoring system has been adopted as recommended by the original authors.
The scores now range from 4 to 0. A score of 48 is the best, indicating normal function. A score of 0 is the worst, indicating the most severe disability.
We have grouped the questionnaire responses based on the scoring system as published by Kalairajah et al, in 2005 (See appendix 1) This groups each score into four categories:
Category 1 >41 excellent Category 2 34 – 41 good Category 3 27 – 33 fair Category 4 < 27 poor
For the sixteen-year period and as at July 2016, there were 4,834 shoulder questionnaire responses registered at six months post-surgery.
The mean shoulder score was 36.39 (standard deviation 9.46, range 2 – 48)
Scoring > 41 1,798 Scoring 34 - 41 1,518 Scoring 27 - 33 741 Scoring <27 777
At six months post-surgery, 69% had an excellent or good score.
Questionnaires at five years post-surgeryAll patients who had a six month registered questionnaire, and who had not had revision surgery, were sent a further questionnaire at five years post-surgery.
This dataset represents sequential Oxford shoulder scores for 1,436 individual patients.
At five years post-surgery, 78% of these patients achieved an excellent or good score and had a mean of 39.601
Questionnaires at ten years post-surgeryAll patients who had a six month registered questionnaire, and who had not had revision surgery, were sent a further questionnaire at ten years post-surgery.
This dataset represents sequential Oxford shoulder scores for 345 individual patients.
At ten years post-surgery, 73% of these patients achieved an excellent or good score and had a mean of 38.64.
Survival curves for different shoulder categories
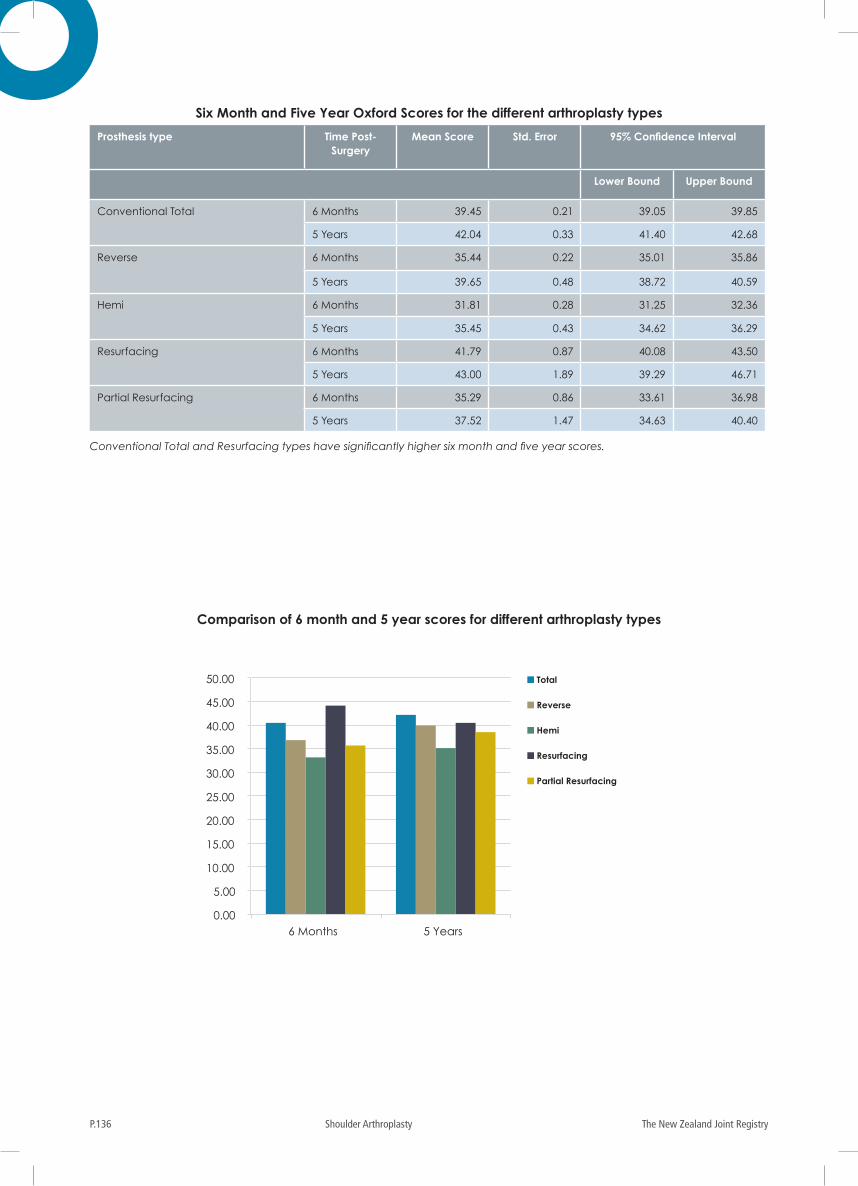
The New Zealand Joint RegistryP.136 Shoulder Arthroplasty
Prosthesis type Time Post-Surgery
Mean Score Std. Error 95% Confidence Interval
Lower Bound Upper Bound
Conventional Total 6 Months 39.45 0.21 39.05 39.85
5 Years 42.04 0.33 41.40 42.68
Reverse 6 Months 35.44 0.22 35.01 35.86
5 Years 39.65 0.48 38.72 40.59
Hemi 6 Months 31.81 0.28 31.25 32.36
5 Years 35.45 0.43 34.62 36.29
Resurfacing 6 Months 41.79 0.87 40.08 43.50
5 Years 43.00 1.89 39.29 46.71
Partial Resurfacing 6 Months 35.29 0.86 33.61 36.98
5 Years 37.52 1.47 34.63 40.40
Conventional Total and Resurfacing types have significantly higher six month and five year scores.
Six Month and Five Year Oxford Scores for the different arthroplasty types
0.00
5.00
10.00
15.00
20.00
25.00
30.00
35.00
40.00
45.00
50.00
6 Months 5 Years
Total
Reverse
Hemi
Resurfacing
Partial Resurfacing
Comparison of 6 month and 5 year scores for different arthroplasty types
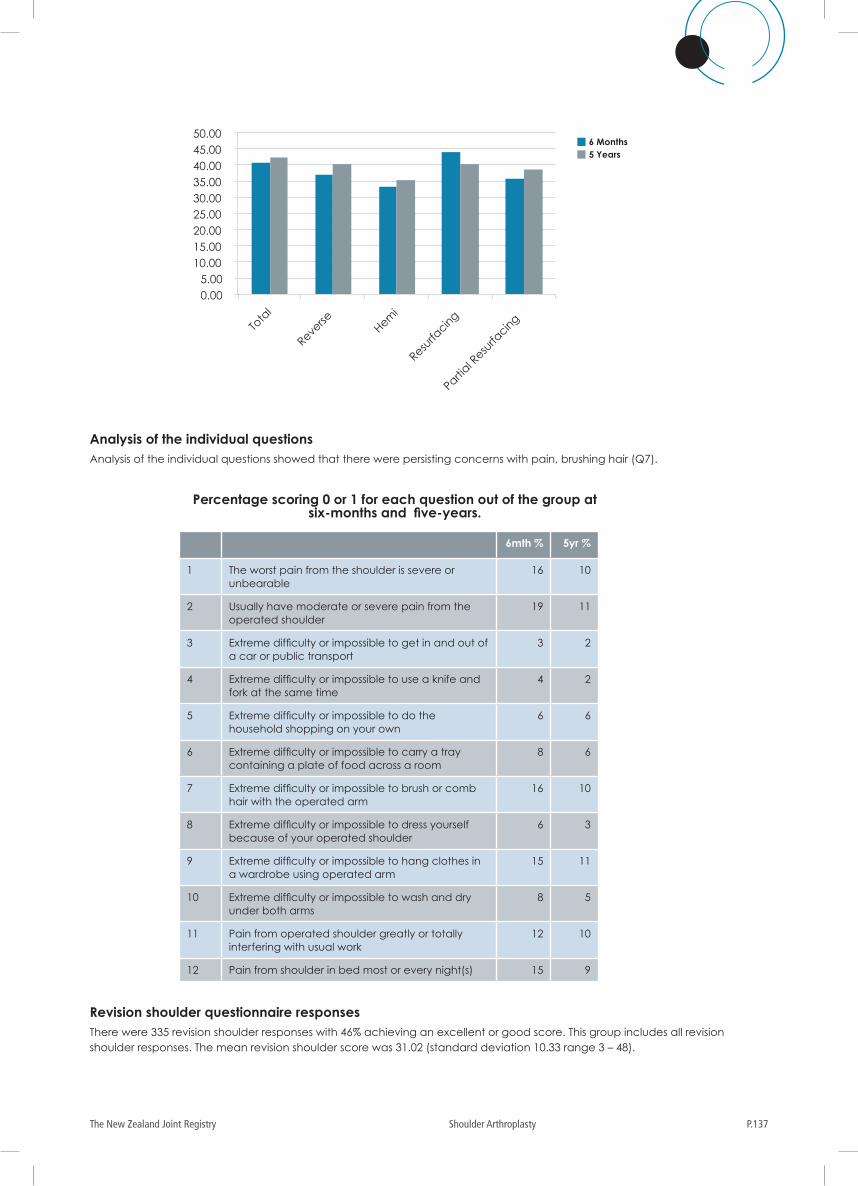
P.137The New Zealand Joint Registry Shoulder Arthroplasty
6 Months5 Years
0.00 5.00
10.00 15.00 20.00 25.00 30.00 35.00 40.00 45.00 50.00
Tota
l
Reverse
Hemi
Resurfa
cing
Partial R
esurfa
cing
6mth % 5yr %
1 The worst pain from the shoulder is severe or unbearable
16 10
2 Usually have moderate or severe pain from the operated shoulder
19 11
3 Extreme difficulty or impossible to get in and out of a car or public transport
3 2
4 Extreme difficulty or impossible to use a knife and fork at the same time
4 2
5 Extreme difficulty or impossible to do the household shopping on your own
6 6
6 Extreme difficulty or impossible to carry a tray containing a plate of food across a room
8 6
7 Extreme difficulty or impossible to brush or comb hair with the operated arm
16 10
8 Extreme difficulty or impossible to dress yourself because of your operated shoulder
6 3
9 Extreme difficulty or impossible to hang clothes in a wardrobe using operated arm
15 11
10 Extreme difficulty or impossible to wash and dry under both arms
8 5
11 Pain from operated shoulder greatly or totally interfering with usual work
12 10
12 Pain from shoulder in bed most or every night(s) 15 9
Analysis of the individual questions Analysis of the individual questions showed that there were persisting concerns with pain, brushing hair (Q7).
Revision shoulder questionnaire responsesThere were 335 revision shoulder responses with 46% achieving an excellent or good score. This group includes all revision shoulder responses. The mean revision shoulder score was 31.02 (standard deviation 10.33 range 3 – 48).
Percentage scoring 0 or 1 for each question out of the group at six-months and five-years.
Prosthesis type Time Post-Surgery
Mean Score Std. Error 95% Confidence Interval
Lower Bound Upper Bound
Conventional Total 6 Months 39.45 0.21 39.05 39.85
5 Years 42.04 0.33 41.40 42.68
Reverse 6 Months 35.44 0.22 35.01 35.86
5 Years 39.65 0.48 38.72 40.59
Hemi 6 Months 31.81 0.28 31.25 32.36
5 Years 35.45 0.43 34.62 36.29
Resurfacing 6 Months 41.79 0.87 40.08 43.50
5 Years 43.00 1.89 39.29 46.71
Partial Resurfacing 6 Months 35.29 0.86 33.61 36.98
5 Years 37.52 1.47 34.63 40.40
Conventional Total and Resurfacing types have significantly higher six month and five year scores.
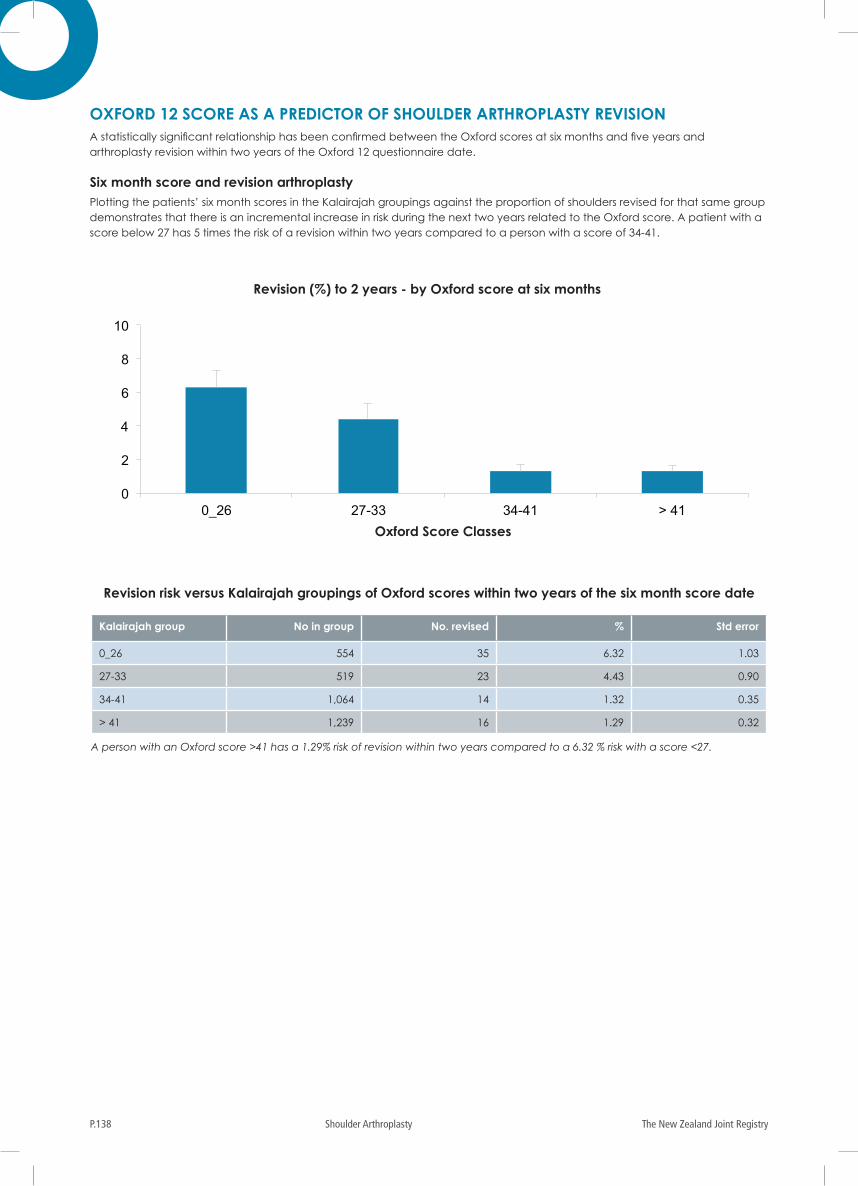
The New Zealand Joint RegistryP.138 Shoulder Arthroplasty
OXFORD 12 SCORE AS A PREDICTOR OF SHOULDER ARTHROPLASTY REVISION A statistically significant relationship has been confirmed between the Oxford scores at six months and five years and arthroplasty revision within two years of the Oxford 12 questionnaire date.
Six month score and revision arthroplastyPlotting the patients’ six month scores in the Kalairajah groupings against the proportion of shoulders revised for that same group demonstrates that there is an incremental increase in risk during the next two years related to the Oxford score. A patient with a score below 27 has 5 times the risk of a revision within two years compared to a person with a score of 34-41.
Revision risk versus Kalairajah groupings of Oxford scores within two years of the six month score date
Kalairajah group No in group No. revised % Std error
0_26 554 35 6.32 1.03
27-33 519 23 4.43 0.90
34-41 1,064 14 1.32 0.35
> 41 1,239 16 1.29 0.32
A person with an Oxford score >41 has a 1.29% risk of revision within two years compared to a 6.32 % risk with a score <27.
0
2
4
6
8
10
0_26 27-33 34-41 > 41 Oxford Score Classes
Revision (%) to 2 years - by Oxford score at six months
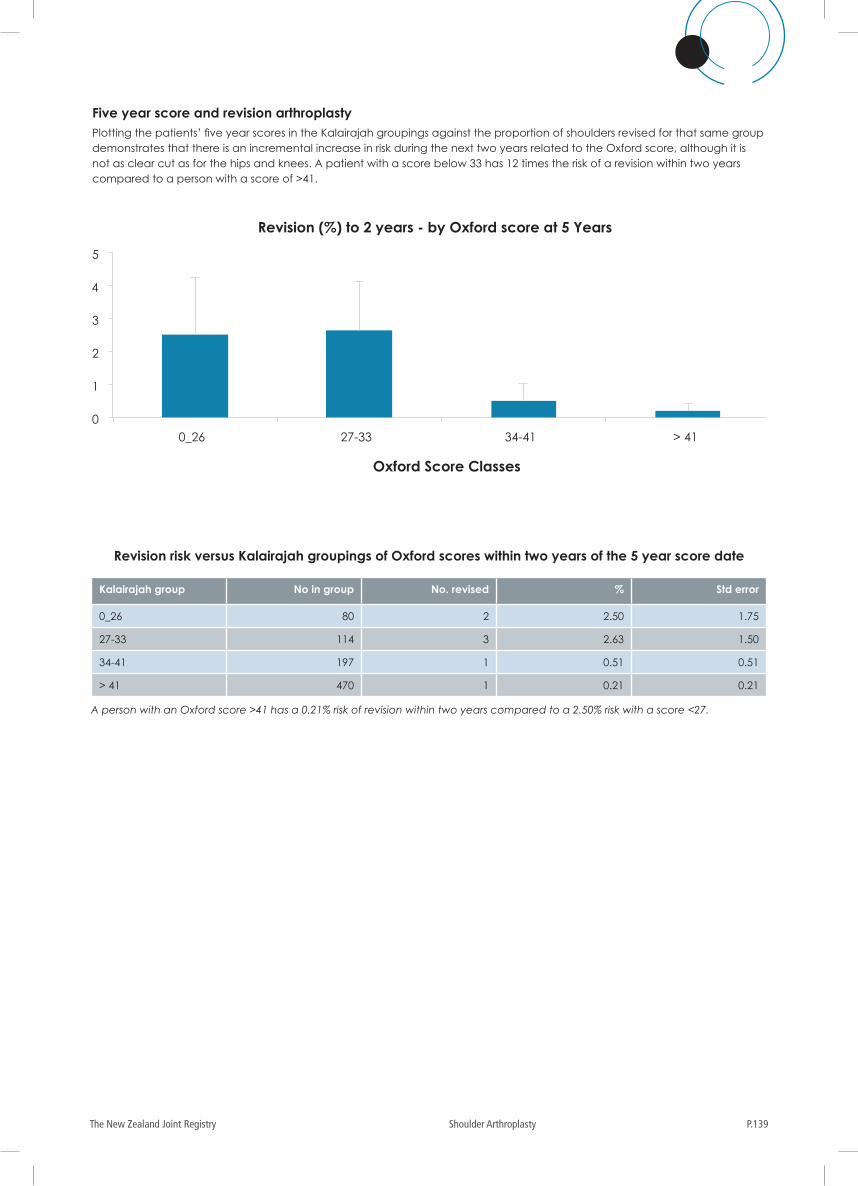
P.139The New Zealand Joint Registry Shoulder Arthroplasty
Five year score and revision arthroplastyPlotting the patients’ five year scores in the Kalairajah groupings against the proportion of shoulders revised for that same group demonstrates that there is an incremental increase in risk during the next two years related to the Oxford score, although it is not as clear cut as for the hips and knees. A patient with a score below 33 has 12 times the risk of a revision within two years compared to a person with a score of >41.
Revision risk versus Kalairajah groupings of Oxford scores within two years of the 5 year score date
Kalairajah group No in group No. revised % Std error
0_26 80 2 2.50 1.75
27-33 114 3 2.63 1.50
34-41 197 1 0.51 0.51
> 41 470 1 0.21 0.21
A person with an Oxford score >41 has a 0.21% risk of revision within two years compared to a 2.50% risk with a score <27.
0
1
2
3
4
5
0_26 27-33 34-41 > 41
Oxford Score Classes
Revision (%) to 2 years - by Oxford score at 5 Years
The New Zealand Joint RegistryP.140 Elbow Arthroplasty
PRIMARY ELBOW ARTHROPLASTY The sixteen-year report analyses data for the period January 2000 – December 2015. There were 476 primary elbow procedures registered with an additional 41 registered in 2015, 54% more than registered in 2014.
2000 17 2001 29 2002 32 2003 23 2004 28 2005 30 2006 31 2007 36 2008 40 2009 34 2010 30 2011 33 2012 24 2013 22 2014 26 2015 41
Data AnalysisAge and sex distribution
The average age for an elbow replacement was 67.14 years, with range of 15.16 – 92.41 years.
Female Male
Number 368 108Percentage 77.31 22.69Mean age 67.44 66.13Maximum age 92.41 91.73Minimum age 36.38 15.16Standard dev. 11.73 13.53
Previous operation
None 401Internal fixation for juxtarticular fracture 22 Synovectomy+-removal radial head 16Debridement 12Osteotomy 2Ligament reconstruction 3Interposition arthroplasty 1
Diagnosis
Rheumatoid arthritis 257Post fracture 138Osteoarthritis 64Other inflammatory 8Post dislocation 8Post ligament disruption 6
Approach
Posterior 299Medial 93Lateral 29
Bone graft
Humeral autograft 33Humeral allograft 3Humeral synthetic 1Ulnar autograft 2
Cement
Humerus cemented 440Antibiotic in cement 329 (75%)Ulna cemented 415Antibiotic in cement 305 (74%)Radius cemented 23Antibiotic in cement 22 (96%)
Systemic antibiotic prophylaxis
Patient number receiving at least one systemic antibiotic 444 (93%)
Operating theatre
Conventional 321Laminar flow 150Space suits 71
ASA Class
This was introduced with the updated forms at the beginning of 2005.
For the eleven-year period 2005 – 2015, there were 324 (93%) primary elbow procedures with the ASA class recorded.
Definitions
ASA class 1: A healthy patient
ASA class 2: A patient with mild systemic disease
ASA class 3: A patient with severe systemic disease that limits
activity but is not incapacitating
ASA class 4: A patient with an incapacitating disease that is a
constant threat to life
ASA Number
1 92 1423 1664 7
Operative time (skin to skin)
Mean 142 minutes
Surgeon grade
The updated forms introduced in 2005 have separated advanced trainee into supervised and unsupervised.
The following figures are for the eleven- year period 2005 – 2015.
Consultant 341Advanced trainee supervised 7Advanced trainee unsupervised 3
ELBOW ARTHROPLASTY
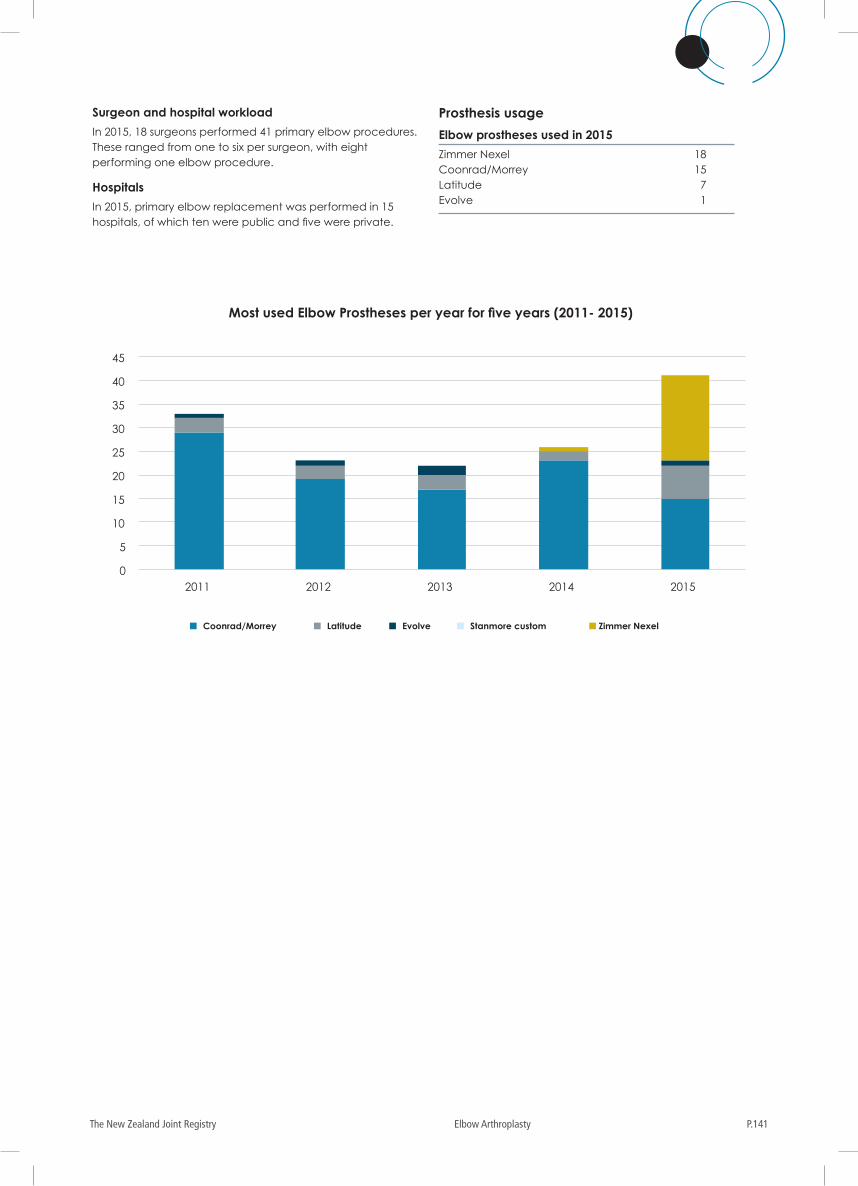
P.141The New Zealand Joint Registry Elbow Arthroplasty
Surgeon and hospital workload
In 2015, 18 surgeons performed 41 primary elbow procedures. These ranged from one to six per surgeon, with eight performing one elbow procedure.
Hospitals
In 2015, primary elbow replacement was performed in 15 hospitals, of which ten were public and five were private.
Prosthesis usage
Elbow prostheses used in 2015
Zimmer Nexel 18Coonrad/Morrey 15Latitude 7Evolve 1
Coonrad/Morrey Latitude Evolve Stanmore custom Zimmer Nexel
0
5
10
15
20
25
30
35
40
45
2011 2012 2013 2014 2015
Most used Elbow Prostheses per year for five years (2011- 2015)
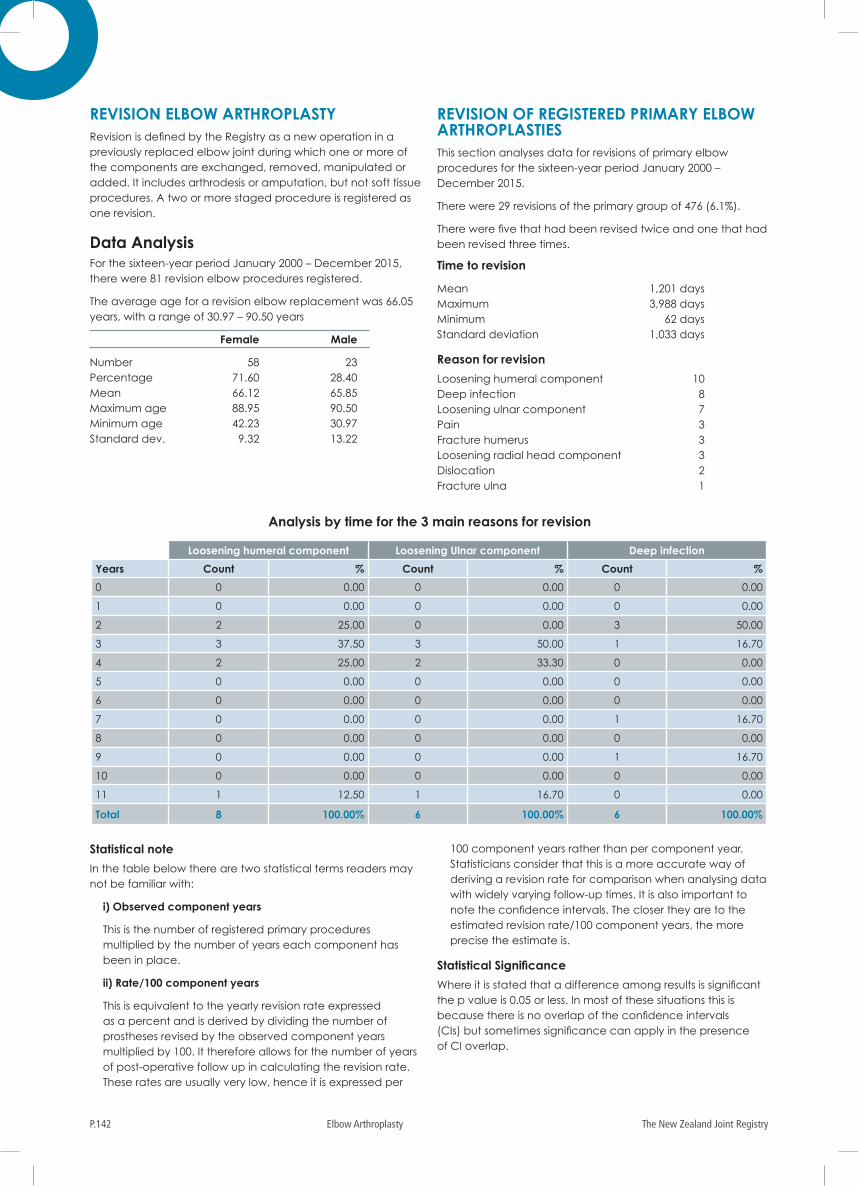
The New Zealand Joint RegistryP.142 Elbow Arthroplasty
REVISION ELBOW ARTHROPLASTYRevision is defined by the Registry as a new operation in a previously replaced elbow joint during which one or more of the components are exchanged, removed, manipulated or added. It includes arthrodesis or amputation, but not soft tissue procedures. A two or more staged procedure is registered as one revision.
Data AnalysisFor the sixteen-year period January 2000 – December 2015, there were 81 revision elbow procedures registered.
The average age for a revision elbow replacement was 66.05 years, with a range of 30.97 – 90.50 years
Female Male
Number 58 23Percentage 71.60 28.40Mean 66.12 65.85Maximum age 88.95 90.50Minimum age 42.23 30.97Standard dev. 9.32 13.22
REVISION OF REGISTERED PRIMARY ELBOW ARTHROPLASTIESThis section analyses data for revisions of primary elbow procedures for the sixteen-year period January 2000 – December 2015.
There were 29 revisions of the primary group of 476 (6.1%).
There were five that had been revised twice and one that had been revised three times.
Time to revision
Mean 1,201 daysMaximum 3,988 daysMinimum 62 daysStandard deviation 1,033 days
Reason for revision
Loosening humeral component 10Deep infection 8Loosening ulnar component 7Pain 3Fracture humerus 3Loosening radial head component 3Dislocation 2Fracture ulna 1
Loosening humeral component Loosening Ulnar component Deep infection
Years Count % Count % Count %
0 0 0.00 0 0.00 0 0.00
1 0 0.00 0 0.00 0 0.00
2 2 25.00 0 0.00 3 50.00
3 3 37.50 3 50.00 1 16.70
4 2 25.00 2 33.30 0 0.00
5 0 0.00 0 0.00 0 0.00
6 0 0.00 0 0.00 0 0.00
7 0 0.00 0 0.00 1 16.70
8 0 0.00 0 0.00 0 0.00
9 0 0.00 0 0.00 1 16.70
10 0 0.00 0 0.00 0 0.00
11 1 12.50 1 16.70 0 0.00
Total 8 100.00% 6 100.00% 6 100.00%
Analysis by time for the 3 main reasons for revision
Statistical note
In the table below there are two statistical terms readers may not be familiar with:
i) Observed component years
This is the number of registered primary procedures multiplied by the number of years each component has been in place.
ii) Rate/100 component years
This is equivalent to the yearly revision rate expressed as a percent and is derived by dividing the number of prostheses revised by the observed component years multiplied by 100. It therefore allows for the number of years of post-operative follow up in calculating the revision rate. These rates are usually very low, hence it is expressed per
100 component years rather than per component year. Statisticians consider that this is a more accurate way of deriving a revision rate for comparison when analysing data with widely varying follow-up times. It is also important to note the confidence intervals. The closer they are to the estimated revision rate/100 component years, the more precise the estimate is.
Statistical Significance
Where it is stated that a difference among results is significant the p value is 0.05 or less. In most of these situations this is because there is no overlap of the confidence intervals (CIs) but sometimes significance can apply in the presence of CI overlap.
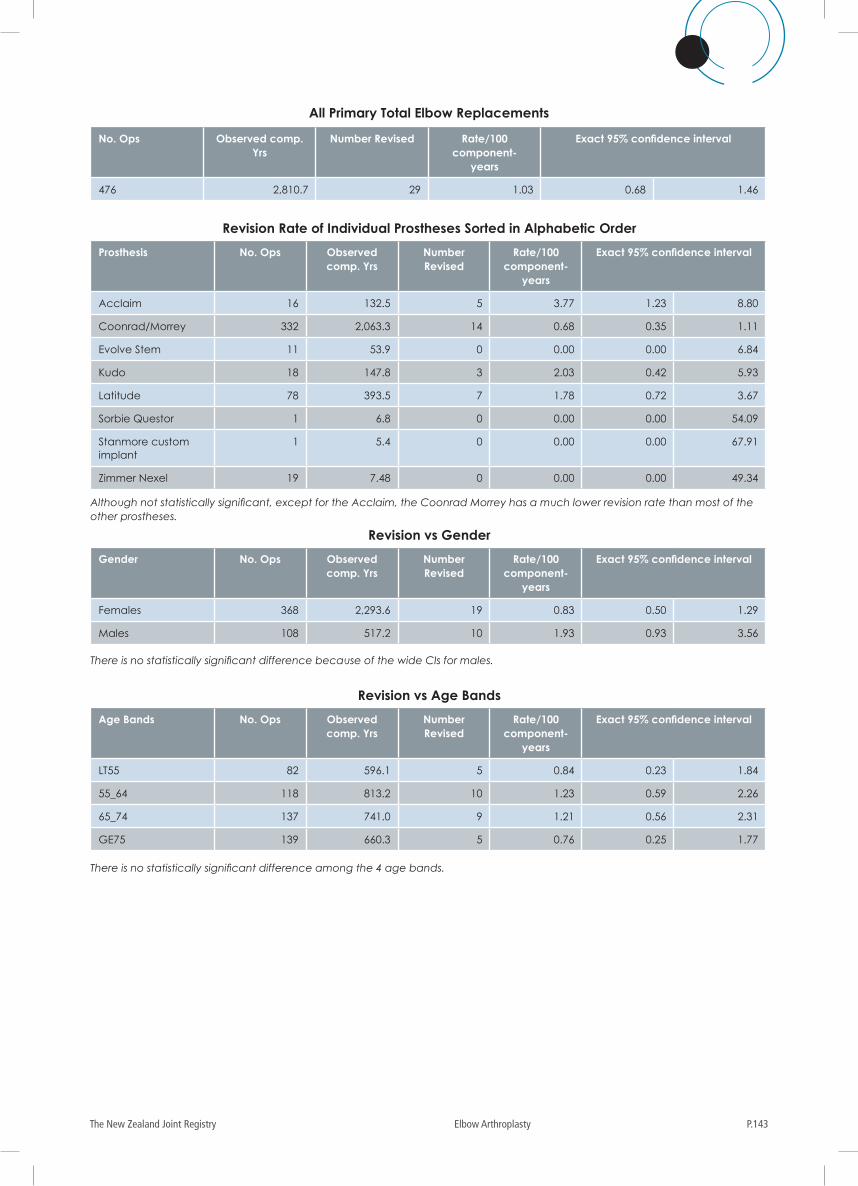
P.143The New Zealand Joint Registry Elbow Arthroplasty
No. Ops Observed comp. Yrs
Number Revised Rate/100 component-
years
Exact 95% confidence interval
476 2,810.7 29 1.03 0.68 1.46
All Primary Total Elbow Replacements
Prosthesis No. Ops Observed comp. Yrs
Number Revised
Rate/100 component-
years
Exact 95% confidence interval
Acclaim 16 132.5 5 3.77 1.23 8.80
Coonrad/Morrey 332 2,063.3 14 0.68 0.35 1.11
Evolve Stem 11 53.9 0 0.00 0.00 6.84
Kudo 18 147.8 3 2.03 0.42 5.93
Latitude 78 393.5 7 1.78 0.72 3.67
Sorbie Questor 1 6.8 0 0.00 0.00 54.09
Stanmore custom implant
1 5.4 0 0.00 0.00 67.91
Zimmer Nexel 19 7.48 0 0.00 0.00 49.34
Although not statistically significant, except for the Acclaim, the Coonrad Morrey has a much lower revision rate than most of the other prostheses.
Age Bands No. Ops Observed comp. Yrs
Number Revised
Rate/100 component-
years
Exact 95% confidence interval
LT55 82 596.1 5 0.84 0.23 1.84
55_64 118 813.2 10 1.23 0.59 2.26
65_74 137 741.0 9 1.21 0.56 2.31
GE75 139 660.3 5 0.76 0.25 1.77
Gender No. Ops Observed comp. Yrs
Number Revised
Rate/100 component-
years
Exact 95% confidence interval
Females 368 2,293.6 19 0.83 0.50 1.29
Males 108 517.2 10 1.93 0.93 3.56
Revision Rate of Individual Prostheses Sorted in Alphabetic Order
Revision vs Age Bands
Revision vs Gender
There is no statistically significant difference because of the wide CIs for males.
There is no statistically significant difference among the 4 age bands.
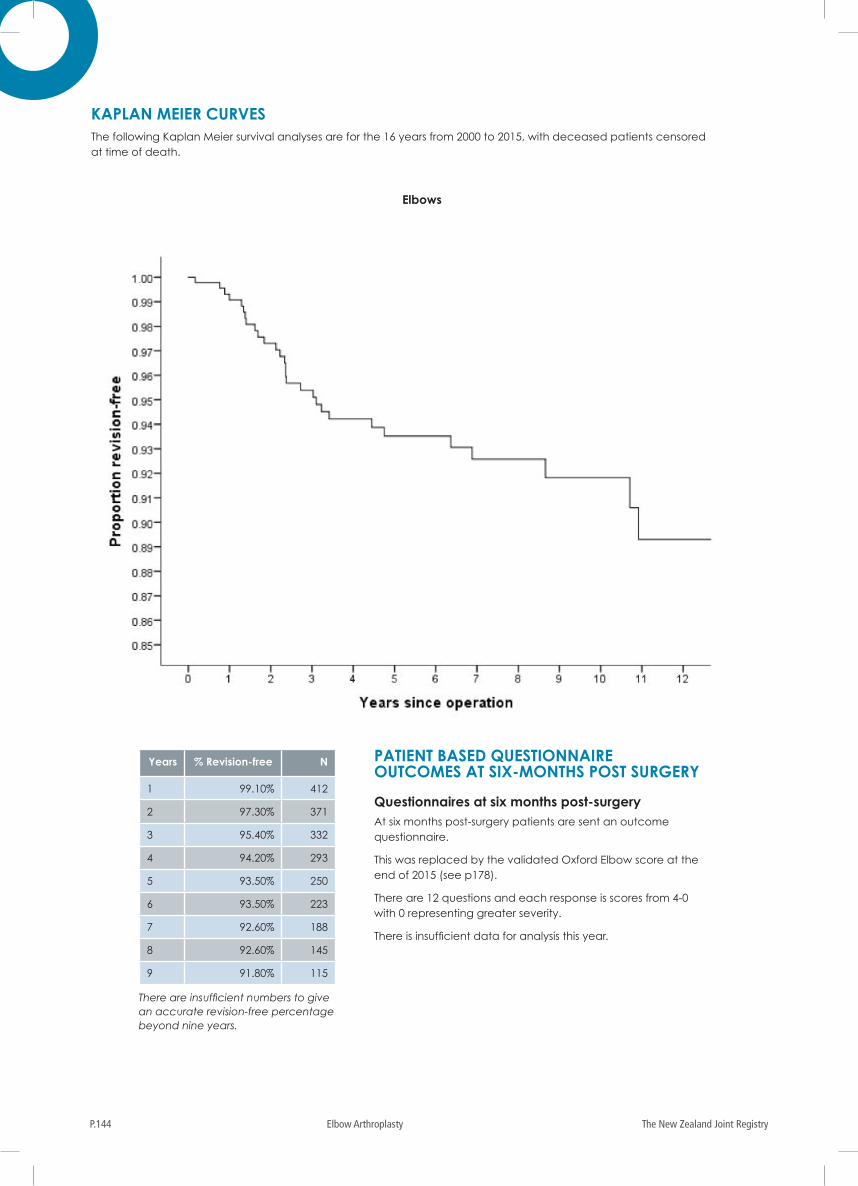
The New Zealand Joint RegistryP.144 Elbow Arthroplasty
KAPLAN MEIER CURVESThe following Kaplan Meier survival analyses are for the 16 years from 2000 to 2015, with deceased patients censored at time of death.
Years % Revision-free N
1 99.10% 412
2 97.30% 371
3 95.40% 332
4 94.20% 293
5 93.50% 250
6 93.50% 223
7 92.60% 188
8 92.60% 145
9 91.80% 115
There are insufficient numbers to give an accurate revision-free percentage beyond nine years.
Elbows
PATIENT BASED QUESTIONNAIRE OUTCOMES AT SIX-MONTHS POST SURGERY
Questionnaires at six months post-surgery At six months post-surgery patients are sent an outcome questionnaire.
This was replaced by the validated Oxford Elbow score at the end of 2015 (see p178).
There are 12 questions and each response is scores from 4-0 with 0 representing greater severity.
There is insufficient data for analysis this year.
P.145The New Zealand Joint Registry Lumbar Disc Replacement
PRIMARY LUMBAR DISC REPLACEMENTThis report analyses data for the fourteen-year period January 2002 – December 2015. There were 153 lumbar disc replacements registered, an additional two compared to last year’s report.
Data AnalysisThe average age for a lumbar disc replacement was 40.61 years, with a range of 24.07 – 84.09 years.
Female Male
Number 72 81Percentage 47.06 52.94Mean age 40.45 40.75Maximum age 62.19 84.09Minimum age 24.07 27.19Standard dev. 8.60 8.72
Disc replacement levels
L3/4 20L4/5 103L5/S1 32
Fusion levels
L3/4 2L4/5 13L5/S1 58
Previous operation
Discectomy 29L3/4 0L4/5 15L5/S1 19
Diagnosis
Degenerative disc disease
L3/4 11L4/5 61L5/S1 83Other 4
Annular tear MRI scan
L3/4 13L4/5 67L5/S1 26Other 1
Discogenic pain on discography
L3/4 20L4/5 85L5/S1 63Other 1
Approach
Retroperitoneal midline 138Retroperitoneal lateral 3Transperitoneal 2Other- mini open horizontal 3
Intraoperative complications
Damage to major veins 13Subsidence 1
Systemic antibiotic prophylaxis
Patient number receiving systemic antibiotic prophylaxis 125
Operating theatre
Conventional 87Laminar flow 65Spacesuits 2
Operative time (skin to skin)
Mean 138 minutes
Surgeon grade
Consultant 153
LUMBAR DISC REPLACEMENT
The New Zealand Joint RegistryP.146 Lumbar Disc Replacement
REVISION OF REGISTERED PRIMARY LUMBAR DISC REPLACEMENTSThis section analyses data for revisions of primary lumbar disc replacements for the 14-year period.
There were three revisions of the primary group of 153 lumbar disc replacements and one re-revision.
Time to revision
Mean 1,841 daysMaximum 4,528 daysMinimum 242 days
Reason for revision
Pain 2Loss of spinal alignment 1
Oswestry Disability Index
There are 10 sections. For each section, the total score is 5: if the first statement is marked the score = 0; if the last statement is marked, the score = 5. Intervening statements are scored according to rank.
If more than one box is marked in each section, take the highest score.
If all 10 sections are completed, the score is calculated as follows:
Example: 16 (total scored)/50(total possible score) x 100 = 32%
Pre operative scores
Modified Roland and Morris 119Mean 15Maximum 66Minimum 1Standard deviation 7
Oswestry Disability Index 49Mean 56Maximum 82Minimum 30Standard deviation 13
Post operative score
Oswestry Disability Index 32 Mean 22Maximum 58Minimum 0Standard deviation 16
P.147The New Zealand Joint Registry Cervical Disc Replacement
This report analyses data for the twelve-year period January 2004 – December 2015. There were 314 primary cervical disc replacements, an increase of 46 from the previous year.
Data AnalysisThe average age for a cervical disc replacement was 44.42 years, with a range of 23.26 – 65.79 years.
Female Male
Number 130 184Percentage 41.40 58.60Mean age 45.23 43.84Maximum age 65.79 63.00Minimum age 22.26 24.92Standard dev. 8.10 8.10
Disc replacement levels
C3/4 10C4/5 31C5/6 176C6/7 143C7T1 4Other 4
Previous operation
Foraminotomy 8Adjacent level fusion 16Adjacent level disc arthroplast y 2Other 13
Diagnosis
Acute disc prolapse 223Chronic spondylosis 27Neck pain 16Other 31
Approach
Anterior right 187Anterior left 62Other 1
Intra operative complications
Equipment failure 1Removal of implant 1Tear jugular vein 1
Systemic antibiotic prophylaxis
Patient number receiving systemic antibiotic prophylaxis 260
Operating theatre
Conventional 181Laminar flow 130Spacesuits 1
Operative time (skin to skin)
Mean 118 minutes
Surgeon grade
Consultant 313Advanced trainee supervised 1
Revision Cervical disc replacement
There was no change from the previous year, with one revision cervical disc replacement registered.
Neck Disability Index Scoring
There are 10 sections. For each section, the total score is 5: if the first statement is marked the score = 0; if the last statement is marked, the score = 5. Intervening statements are scored according to rank.
If more than one box is marked in each section, take the highest score.
If all 10 sections are completed, the score is calculated as follows:
Example: 16 (total scored)/50(total possible score) x 100 = 32%
If one section is missed (or not applicable) the score is calculated:
Example: 16 (total scored)/45(total possible score) x 100 = 35.5%
0 is the best score and 100 is the worst score.
Pre-operative score
Neck Disability Index 169Mean 46
Post-operative score
Neck Disability Index 146Mean 20
CERVICAL DISC REPLACEMENT
The New Zealand Joint RegistryP.148 Oxford 12 Questionnaire References
APPENDIX 1 - OXFORD 12 QUESTIONNAIRE REFERENCES
Murray, D.W et al, The use of the Oxford hip and knee scores. J Bone Joint Surg (Br) 2007; 89-B: 1010-14
Jill Dawson, Ray Fitzpatrick, Andrew Carr. Questionnaire on the perceptions of patients about shoulder surgery. J Bone Joint Surg B. 1996 July; 78(4) 593-600
Kalairajah, Y et al, Health outcome measures in the evaluation of total hip arthroplasties: a comparison between the Harris hip score and the Oxford hip score. J Arthroplasty 2005; 20: 1037-41
Dawson J., Doll H., Boller I., Fitzpatrick R., Little C., Rees J., Jenkinson C., and Carr, A. J.; The development and validation of a patient-reported questionnaire to assess outcomes of elbow surgery; J Bone Joint Surg. [Br] (2008) 90-B: 466-473.
Dawson J, Boller I, Doll H, Lavis G, Sharp R, Cooke P, Jenkinson C. The MOXFQ patient-reported questionnaire: assessment of data quality, reliability and validity in relation to foot and ankle surgery. Foot, 2011; 21(2):92-102.
P.149The New Zealand Joint Registry Publications
APPENDIX 2
Publications in Peer Reviewed Journals Development of the New Zealand Joint Register. Rothwell A G. Bull Hosp Jt Dis. 1999;58(3):148-60
The early failure of the Oxford Phase 3 unicompartmental arthroplasty - an audit of revisions. The New Zealand experience. Hartnett NI, Tregonning RJA, Rothwell A, Hobbs T. J Bone Joint. Surg Br, Orthopaedic Proceedings 2006;88 B Supp II:318
A New Zealand national joint registry review of 202 total ankle replacements followed for up to 6 years Hosman AH, Mason RB, Hobbs T, Rothwell AG. Acta Orthop. 2007 Oct; 78(5):584-91
Functional outcomes of femoral peri prosthetic fracture and revision hip arthroplasty: a matched pair study from the New Zealand Registry. Young SW, Walker CG, Pitto RP. Acta Orthop. 2008 Aug: 79(4); 483-8
Bilateral total joint arthroplasty: the early results from the New Zealand National Joint Registry. Hooper GJ, Hopper NM, Rothwell AG, Hobbs T. J Arthroplasty. 2008 Dec
Revision following cemented and uncemented primary total hip replacement: a seven year analysis from the New Zealand Joint Registry. Hooper GJ, Rothwell AG, Stringer M, Frampton C. J Bone Joint Surg Br. 2009 Apr;91(4):451-8
An analysis of the Oxford hip and knee scores and their relationship to early joint revision; data from the New Zealand Joint Registry. Rothwell AG, Hooper GJ, Hobbs A, Frampton C. J Bone Joint Surg Br.2010 Mar;92(3)413-418
The survivorship and functional outcomes of unicompartmental knee replacements converted to total knee replacements: The New Zealand National Joint Registry. Andrew J Pearse, Gary J Hooper, Alastair G Rothwell, Chris Frampton.J Bone Joint Surg Br. 2010 Apr;92(4):508-12
Does the use of Laminar Flow and Space Suits Reduce Early Deep Infection in Total Hip and Knee Replacement? The ten year results of the New Zealand Joint Registry. G J Hooper, AG Rothwell, M Wyatt, C Frampton J bone Joint Surg Br.2011 Jan;93(1): 85-90
Use of Patient-Reported Outcomes in the context of Different Levels of Data. O Rolfson, A Rothwell, K Chenok, E Bohm, K Bozic, G Garellick J Bone Joint Surg Am 2011;93 Suppl 3(E):66-71
A Multinational Assessment of Metal in Metal bearings in Hip Replacement. S Graves, A Rothwell, K Tucker, J Jacobs, A Sedrakyan J Bone Joint Surg Am 2011;93 Suppl 3(E):43-7
Osteotomy and Unicompartmental Knee Arthroplasty Converted to Total Knee Arthroplasty: Data From the New Zealand Joint Registry. Pearse AJ, Hooper GJ, Rothwell AG, Frampton C. J Arthroplasty. 2012 Oct 11
Does the ASA physical rating score predict early complications or poorer outcomes following hip or knee arthroplasty. Analyses from the New Zealand Joint Registry. Hooper G J, Rothwell A G, Hooper N, Frampton C J Bone Joint Surg Am. 2012 Jun 20;94(12):1065-70.
A Review of National Shoulder and Elbow Joint Replacement Registries. J V.Rasmussen, B S.Olsen, B S. Fevang, O Furnes, E Skytta, H Rahme, B Salomonsson, KD Mohammed, R S. Page, A J Carr, J Shoulder Elbow Surg. 2012 Oct;21(10):1328-35
Do joint registries report true rates of hip dislocation? Devane PA, Wraighte PJ, Ong DC, Horne JG .Clin Orthop Relat Res. 2012 Nov;470(11):3003-6
Does orthopedic training compromise the outcome in total hip arthroplasty? Inglis T, Dalzell K, Hooper G, Rothwell A, Frampton C. J Surg Educ. 2013 Jan-Feb;70(1):76-80
The ageing population and the increasing demand for joint replacement. Hooper G. N Z Med J. 2013 Jun 28;126(1377):5-6
Mobile versus fixed-bearing modern total knee replacements- which is the more patella-friendly design?: The 11-year New Zealand Joint Registry study. Wyatt MC, Frampton C, Horne JG, Devane P. Bone Joint Res. 2013 Jul 1;2(7):129-31
Oxford hip scores at 6 months and 5 years are associated with total hip revision within the subsequent 2 years. Devane P, Horne G, Gehling DJ. Clin Orthop Relat Res. 2013 Dec;471(12):3870-4
Effect of glenoid cementation on total shoulder arthroplasty for degenerative arthritis of the shoulder; a review of the New Zealand National Joint Registry. Harry D.S. Clitherow, Christopher M.A. Frampton, Timothy M. Ashley J Shoulder Elbow Surg. 2014 Jun;23(6):775-81.
The New Zealand Joint RegistryP.150 Publications
Current trends and projections in the utilisation rates of hip and knee replacement in New Zealand from 2001 to 2026. Gary Hooper, Alex J-J Lee, Alastair Rothwell, Chris Frampton NZMJ 29 August 2014, Vol 127 No 1401
The effect of body mass index on outcome in total hip arthroplasty: early analysis from the New Zealand Joint Registry. Murgatroyd SE, Frampton CM, Wright MS. J Arthroplasty. 2014 Oct;29(10):1884-8
The impact of patient and surgical factors on the rate of infection after primary total knee arthroplasty. An analysis of 64,566 joints from the New Zealand Joint Registry E.R. Tayton, C. Frampton, G. J. Hooper, S W Young Bone Joint J 2016; 98-B:334–40.
Perioperative mortality in New Zealand related to hip and knee replacement surgery: comparing administrative and registry data. Hider P, Frampton C, Theis JC, Wilson L, Rothwell A. N Z Med J. 2016 Apr 1;129(1432):33-40.
New Zealand Joint Registry data underestimates the rate of prosthetic joint infection. Zhu M, Ravi S, Frampton C, Luey C, Young S. Acta Orthop. 2016 Aug;87(4):346-50.
Periprosthetic Joint Infection in Hip Arthroplasty: Is There an Association Between Infection and Bearing Surface Type? Pitto RP, Sedel L. Clin Orthop Relat Res. 2016 Oct; 474(10):2213-8
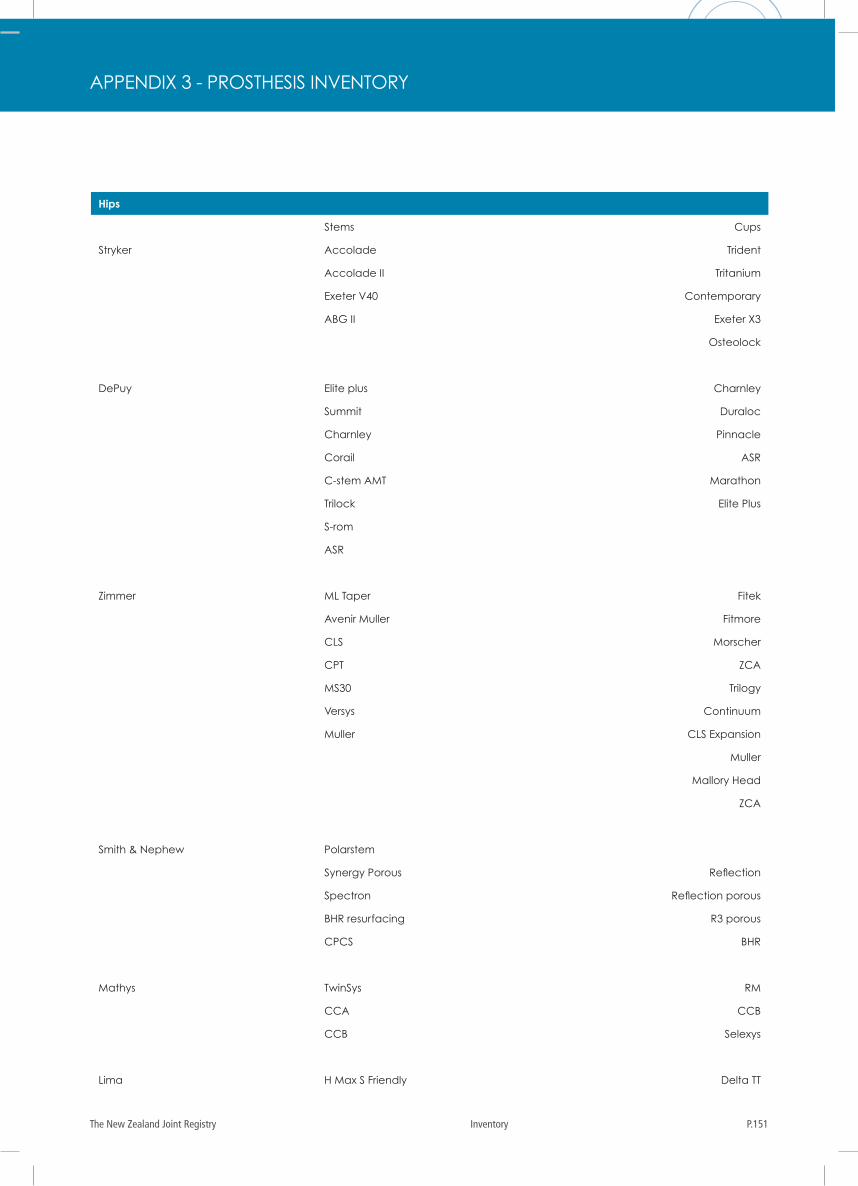
P.151The New Zealand Joint Registry Inventory
APPENDIX 3 - PROSTHESIS INVENTORY
Hips
Stems Cups
Stryker Accolade Trident
Accolade II Tritanium
Exeter V40 Contemporary
ABG II Exeter X3
Osteolock
DePuy Elite plus Charnley
Summit Duraloc
Charnley Pinnacle
Corail ASR
C-stem AMT Marathon
Trilock Elite Plus
S-rom
ASR
Zimmer ML Taper Fitek
Avenir Muller Fitmore
CLS Morscher
CPT ZCA
MS30 Trilogy
Versys Continuum
Muller CLS Expansion
Muller
Mallory Head
ZCA
Smith & Nephew Polarstem
Synergy Porous Reflection
Spectron Reflection porous
BHR resurfacing R3 porous
CPCS BHR
Mathys TwinSys RM
CCA CCB
CCB Selexys
Lima H Max S Friendly Delta TT
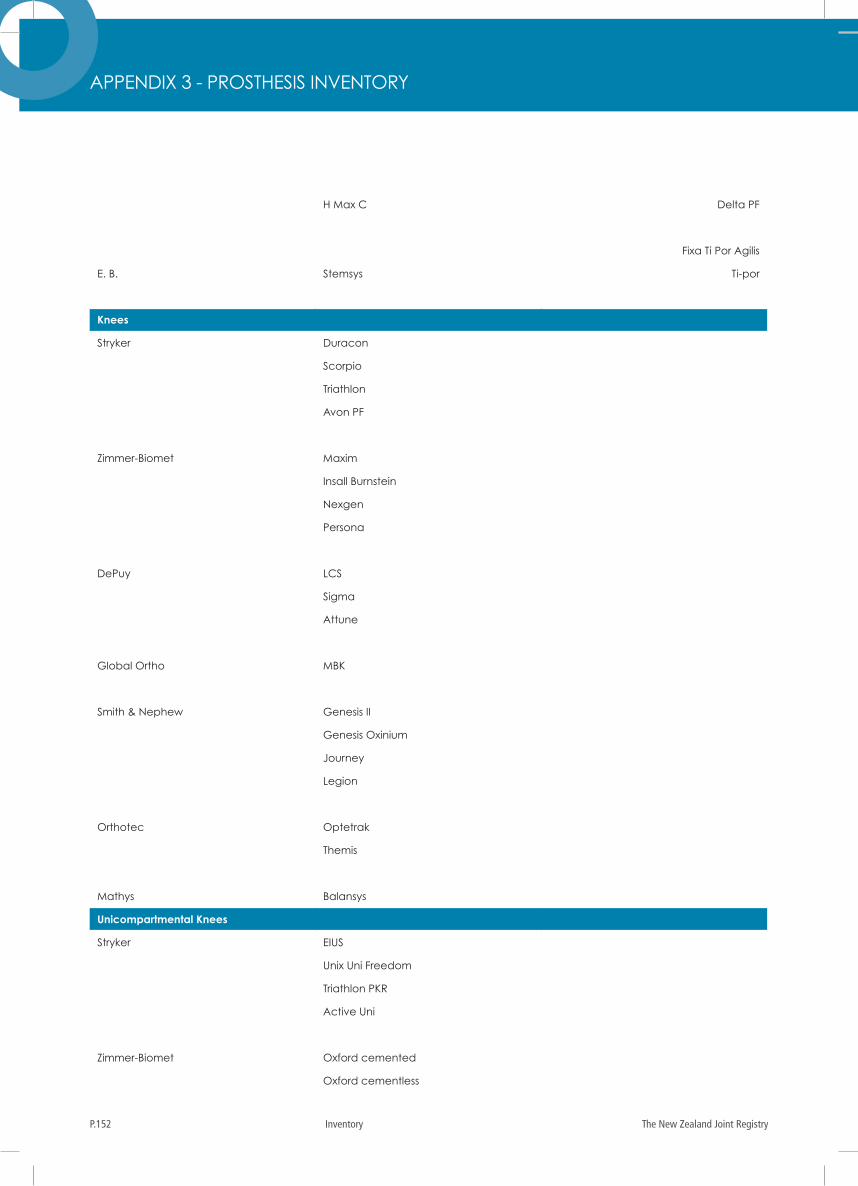
The New Zealand Joint RegistryP.152 Inventory
H Max C Delta PF
Fixa Ti Por Agilis
E. B. Stemsys Ti-por
Knees
Stryker Duracon
Scorpio
Triathlon
Avon PF
Zimmer-Biomet Maxim
Insall Burnstein
Nexgen
Persona
DePuy LCS
Sigma
Attune
Global Ortho MBK
Smith & Nephew Genesis II
Genesis Oxinium
Journey
Legion
Orthotec Optetrak
Themis
Mathys Balansys
Unicompartmental Knees
Stryker EIUS
Unix Uni Freedom
Triathlon PKR
Active Uni
Zimmer-Biomet Oxford cemented
Oxford cementless
APPENDIX 3 - PROSTHESIS INVENTORY
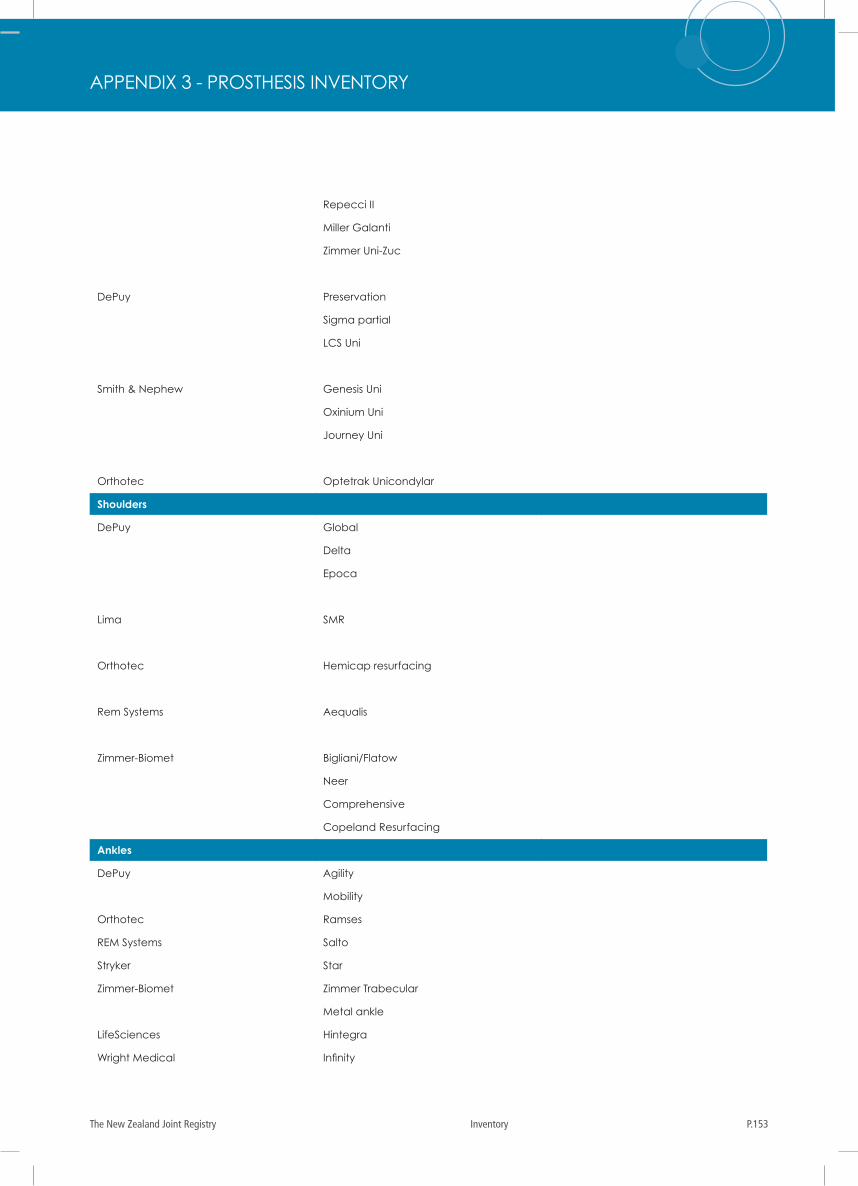
P.153The New Zealand Joint Registry Inventory
Repecci II
Miller Galanti
Zimmer Uni-Zuc
DePuy Preservation
Sigma partial
LCS Uni
Smith & Nephew Genesis Uni
Oxinium Uni
Journey Uni
Orthotec Optetrak Unicondylar
Shoulders
DePuy Global
Delta
Epoca
Lima SMR
Orthotec Hemicap resurfacing
Rem Systems Aequalis
Zimmer-Biomet Bigliani/Flatow
Neer
Comprehensive
Copeland Resurfacing
Ankles
DePuy Agility
Mobility
Orthotec Ramses
REM Systems Salto
Stryker Star
Zimmer-Biomet Zimmer Trabecular
Metal ankle
LifeSciences Hintegra
Wright Medical Infinity
APPENDIX 3 - PROSTHESIS INVENTORY

The New Zealand Joint RegistryP.154 Inventory
Elbows
Zimmer Coonrad/Morrey
Nexel
DePuy Acclaim
Biomet Kudo
Discovery Elbow
REM Systems Latitude
APPENDIX 3 - PROSTHESIS INVENTORY
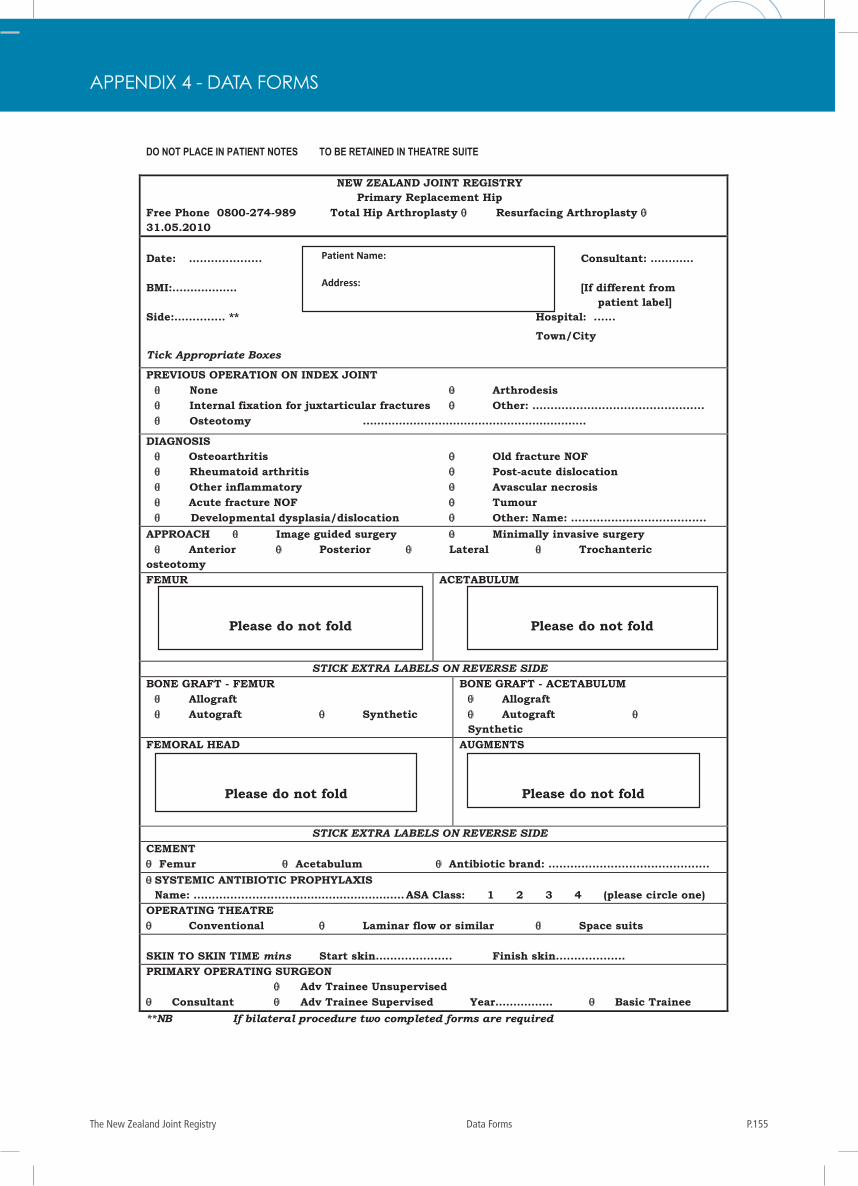
P.155The New Zealand Joint Registry Data Forms
APPENDIX 4 - DATA FORMS
_________________________________________________________________________________________________________________________ The New Zealand Joint Registry Inventory 204 of 228
Data Forms
DO NOT PLACE IN PATIENT NOTES TO BE RETAINED IN THEATRE SUITE
NEW ZEALAND JOINT REGISTRY Primary Replacement Hip
Free Phone 0800-274-989 Total Hip Arthroplasty Resurfacing Arthroplasty 31.05.2010 Date: .................... Consultant: ………… BMI:……………… [If different from
patient label] Side:.............. ** Hospital: ...... Town/City Tick Appropriate Boxes
PREVIOUS OPERATION ON INDEX JOINT None Arthrodesis Internal fixation for juxtarticular fractures Other: ............................................... Osteotomy ……………………………………………………..
DIAGNOSIS Osteoarthritis Old fracture NOF Rheumatoid arthritis Post-acute dislocation Other inflammatory Avascular necrosis Acute fracture NOF Tumour Developmental dysplasia/dislocation Other: Name: ..................................... APPROACH Image guided surgery Minimally invasive surgery Anterior Posterior Lateral Trochanteric osteotomy FEMUR
ACETABULUM
STICK EXTRA LABELS ON REVERSE SIDE BONE GRAFT - FEMUR Allograft Autograft Synthetic
BONE GRAFT - ACETABULUM Allograft Autograft Synthetic
FEMORAL HEAD
AUGMENTS
STICK EXTRA LABELS ON REVERSE SIDE CEMENT Femur Acetabulum Antibiotic brand: ............................................ SYSTEMIC ANTIBIOTIC PROPHYLAXIS Name: ............................………………………… ASA Class: 1 2 3 4 (please circle one) OPERATING THEATRE Conventional Laminar flow or similar Space suits SKIN TO SKIN TIME mins Start skin..................... Finish skin................... PRIMARY OPERATING SURGEON Adv Trainee Unsupervised Consultant Adv Trainee Supervised Year………….… Basic Trainee **NB If bilateral procedure two completed forms are required
Patient Name:
Address:
d.o.b. NHI:
Attach Patient Label
Please do not fold
bar-coded label
Please do not fold
bar-coded label
Please do not fold
bar-coded label
Please do not fold
bar-coded label
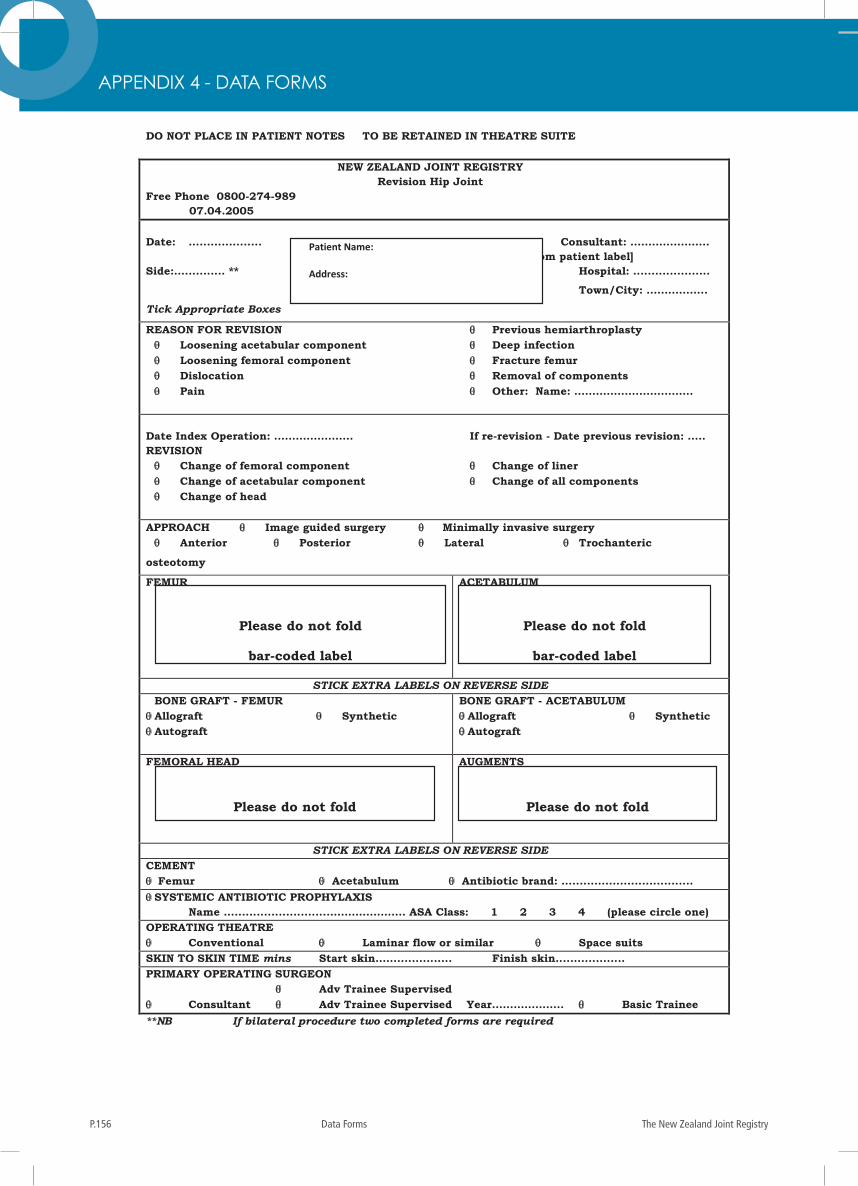
The New Zealand Joint RegistryP.156 Data Forms
205 of 228 Data Forms The New Zealand Joint Registry
DO NOT PLACE IN PATIENT NOTES TO BE RETAINED IN THEATRE SUITE
NEW ZEALAND JOINT REGISTRY Revision Hip Joint
Free Phone 0800-274-989 07.04.2005 Date: .................... Consultant: …………………. [If different from patient label] Side:.............. ** Hospital: ..................... Town/City: …………….. Tick Appropriate Boxes
REASON FOR REVISION Previous hemiarthroplasty Loosening acetabular component Deep infection Loosening femoral component Fracture femur Dislocation Removal of components Pain Other: Name: …………………………… Date Index Operation: …………………. If re-revision - Date previous revision: ….. REVISION Change of femoral component Change of liner Change of acetabular component Change of all components Change of head APPROACH Image guided surgery Minimally invasive surgery Anterior Posterior Lateral Trochanteric
osteotomy
FEMUR
ACETABULUM
STICK EXTRA LABELS ON REVERSE SIDE BONE GRAFT - FEMUR Allograft Synthetic Autograft
BONE GRAFT - ACETABULUM Allograft Synthetic Autograft
FEMORAL HEAD
AUGMENTS
STICK EXTRA LABELS ON REVERSE SIDE CEMENT Femur Acetabulum Antibiotic brand: .................................... SYSTEMIC ANTIBIOTIC PROPHYLAXIS Name ............................…………………. ASA Class: 1 2 3 4 (please circle one) OPERATING THEATRE Conventional Laminar flow or similar Space suits SKIN TO SKIN TIME mins Start skin..................... Finish skin................... PRIMARY OPERATING SURGEON Adv Trainee Supervised Consultant Adv Trainee Supervised Year…………..…… Basic Trainee **NB If bilateral procedure two completed forms are required
Patient Name:
Address:
d.o.b. NHI:
Attach Patient Label
Please do not fold
bar-coded label
Please do not fold
bar-coded label
Please do not fold
bar-coded label
Please do not fold
bar-coded label
APPENDIX 4 - DATA FORMS
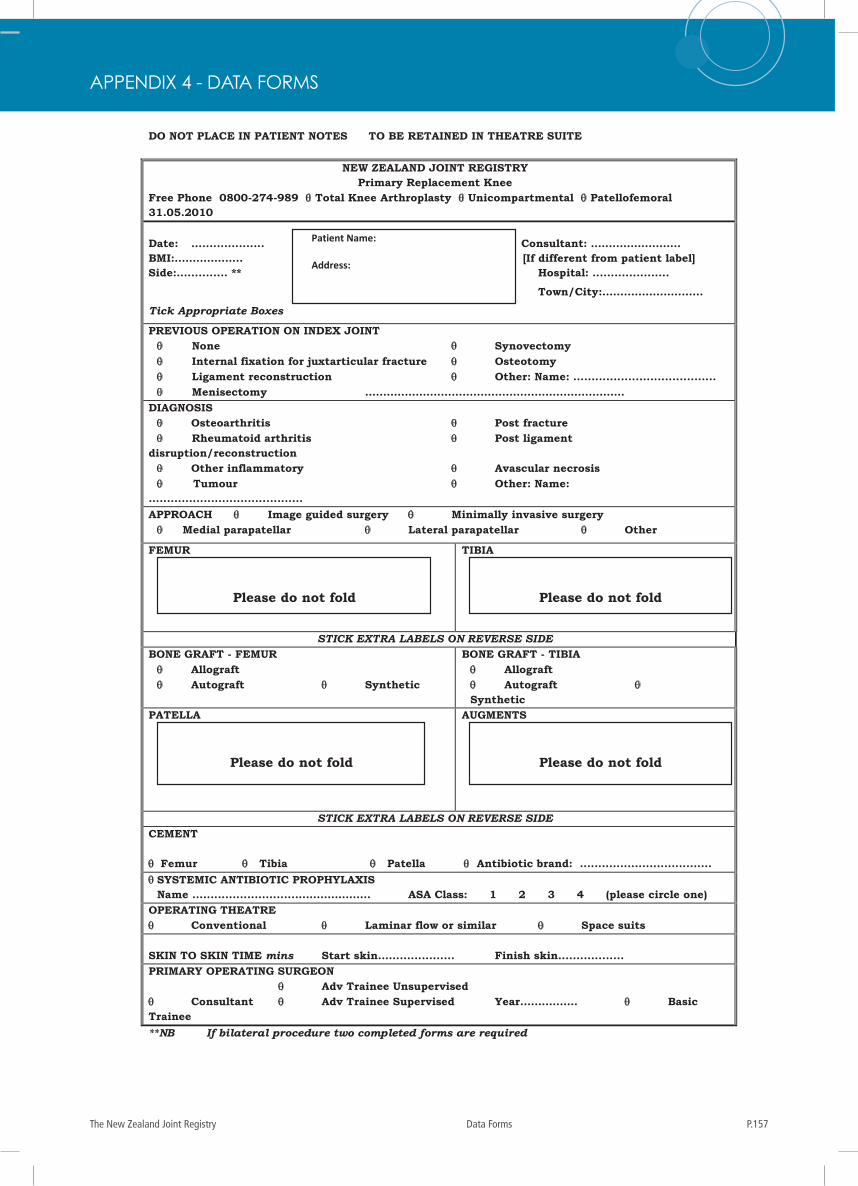
P.157The New Zealand Joint Registry Data Forms
_________________________________________________________________________________________________________________________ The New Zealand Joint Registry Data Forms 206 of 228
DO NOT PLACE IN PATIENT NOTES TO BE RETAINED IN THEATRE SUITE
NEW ZEALAND JOINT REGISTRY Primary Replacement Knee
Free Phone 0800-274-989 Total Knee Arthroplasty Unicompartmental Patellofemoral 31.05.2010 Date: .................... Consultant: ……………………. BMI:………………. [If different from patient label] Side:.............. ** Hospital: ..................... Town/City:.……………………… Tick Appropriate Boxes
PREVIOUS OPERATION ON INDEX JOINT None Synovectomy Internal fixation for juxtarticular fracture Osteotomy Ligament reconstruction Other: Name: ....................................... Menisectomy ……………………………………………………………… DIAGNOSIS Osteoarthritis Post fracture Rheumatoid arthritis Post ligament disruption/reconstruction Other inflammatory Avascular necrosis Tumour Other: Name: .......................................... APPROACH Image guided surgery Minimally invasive surgery Medial parapatellar Lateral parapatellar Other
FEMUR
TIBIA
STICK EXTRA LABELS ON REVERSE SIDE BONE GRAFT - FEMUR Allograft Autograft Synthetic
BONE GRAFT - TIBIA Allograft Autograft Synthetic
PATELLA
AUGMENTS
STICK EXTRA LABELS ON REVERSE SIDE CEMENT Femur Tibia Patella Antibiotic brand: .................................... SYSTEMIC ANTIBIOTIC PROPHYLAXIS Name ............................………………… ASA Class: 1 2 3 4 (please circle one) OPERATING THEATRE Conventional Laminar flow or similar Space suits SKIN TO SKIN TIME mins Start skin..................... Finish skin.................. PRIMARY OPERATING SURGEON Adv Trainee Unsupervised Consultant Adv Trainee Supervised Year………….… Basic Trainee **NB If bilateral procedure two completed forms are required
Patient Name:
Address:
d.o.b. NHI:
Attach Patient Label
Please do not fold
bar-coded label
Please do not fold
bar-coded label
Please do not fold
bar-coded label
Please do not fold
bar-coded label
APPENDIX 4 - DATA FORMS
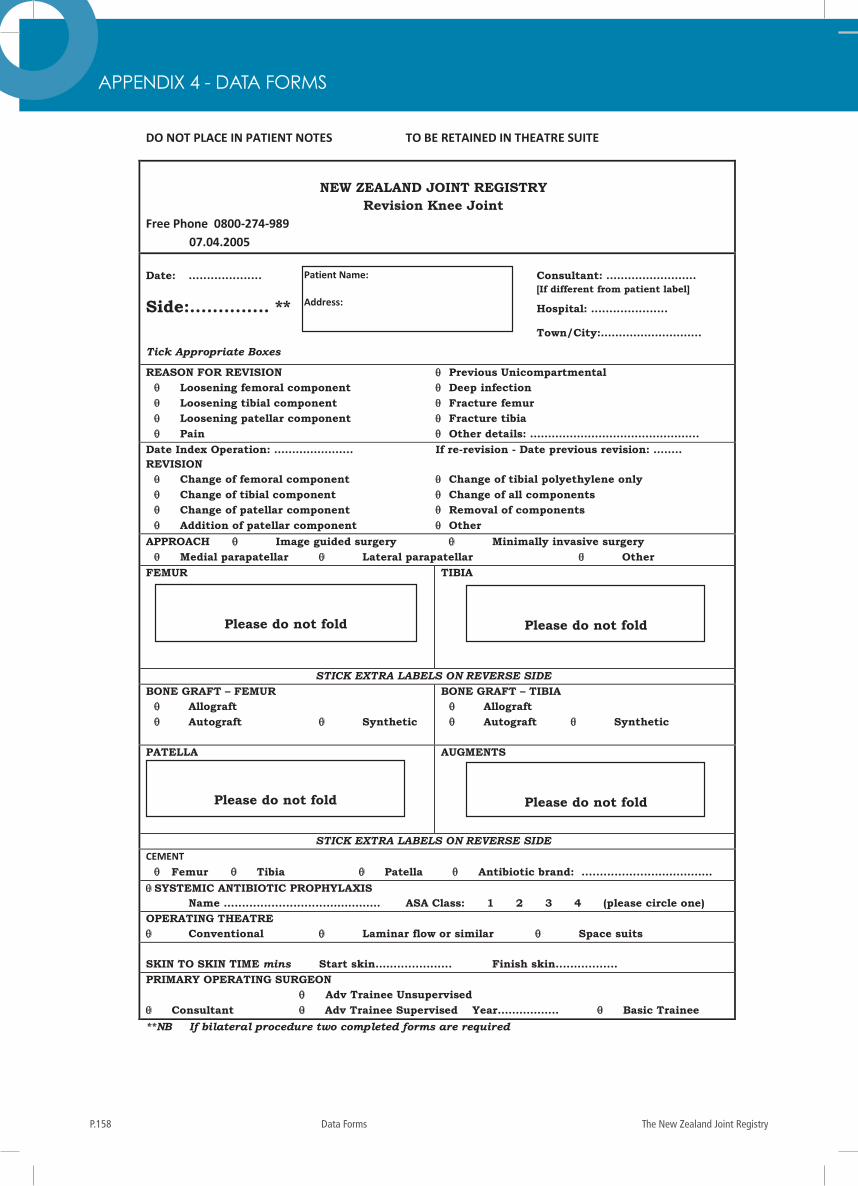
The New Zealand Joint RegistryP.158 Data Forms
207 of 228 Data Forms The New Zealand Joint Registry
DO NOT PLACE IN PATIENT NOTES TO BE RETAINED IN THEATRE SUITE
NEW ZEALAND JOINT REGISTRY
Revision Knee Joint Free Phone 0800-274-989 07.04.2005 Date: .................... Consultant: ……………………. [If different from patient label]
Side:.............. ** Hospital: .....................
Town/City:………………………. Tick Appropriate Boxes
REASON FOR REVISION Previous Unicompartmental Loosening femoral component Deep infection Loosening tibial component Fracture femur Loosening patellar component Fracture tibia Pain Other details: ……………………………………….. Date Index Operation: …………………. If re-revision - Date previous revision: …….. REVISION Change of femoral component Change of tibial polyethylene only Change of tibial component Change of all components Change of patellar component Removal of components Addition of patellar component Other APPROACH Image guided surgery Minimally invasive surgery Medial parapatellar Lateral parapatellar Other FEMUR
TIBIA
STICK EXTRA LABELS ON REVERSE SIDE BONE GRAFT – FEMUR Allograft Autograft Synthetic
BONE GRAFT – TIBIA Allograft Autograft Synthetic
PATELLA
AUGMENTS
STICK EXTRA LABELS ON REVERSE SIDE CEMENT Femur Tibia Patella Antibiotic brand: .....................…………… SYSTEMIC ANTIBIOTIC PROPHYLAXIS Name ............................…………… ASA Class: 1 2 3 4 (please circle one) OPERATING THEATRE Conventional Laminar flow or similar Space suits SKIN TO SKIN TIME mins Start skin..................... Finish skin................. PRIMARY OPERATING SURGEON Adv Trainee Unsupervised Consultant Adv Trainee Supervised Year…………….. Basic Trainee **NB If bilateral procedure two completed forms are required
Patient Name:
Address:
d.o.b. NHI:
Attach Patient Label
Please do not fold
bar-coded label
Please do not fold
bar-coded label
Please do not fold
bar-coded label
Please do not fold
bar-coded label
APPENDIX 4 - DATA FORMS
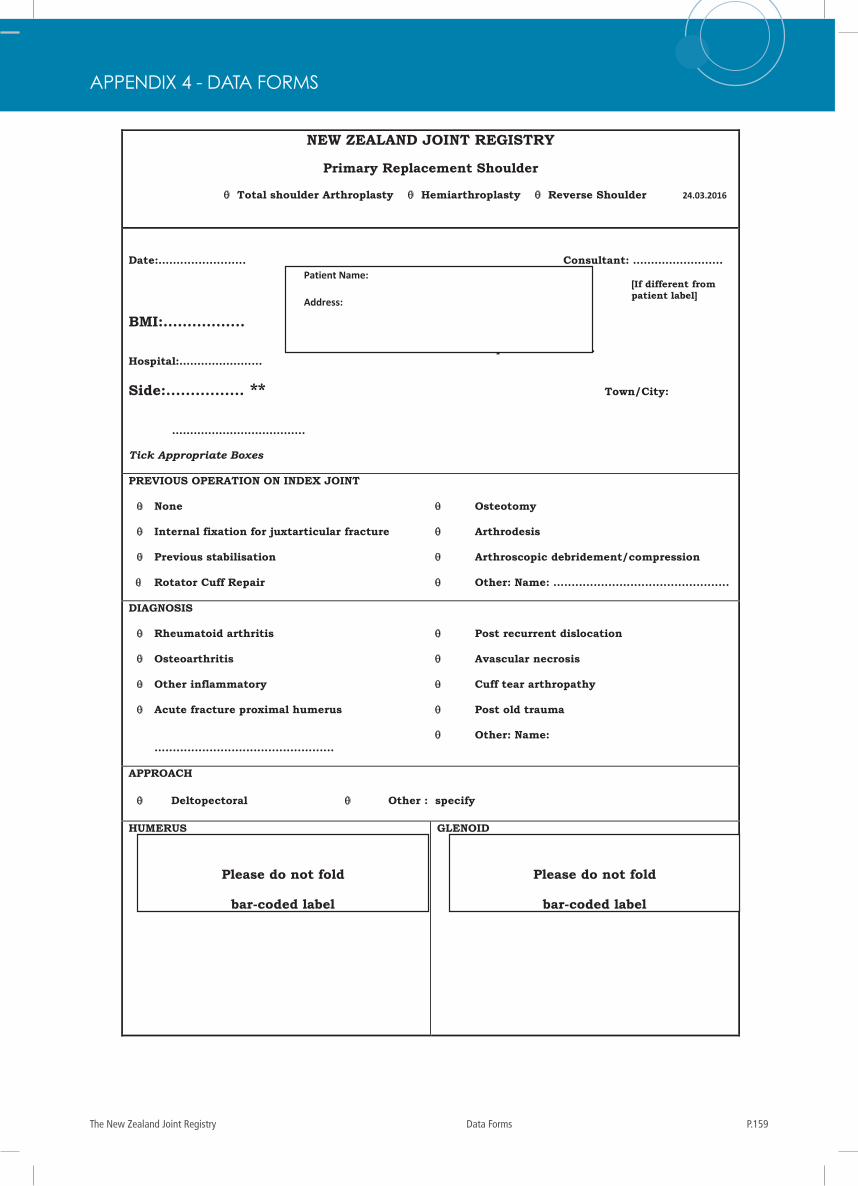
P.159The New Zealand Joint Registry Data Forms
_________________________________________________________________________________________________________________________ The New Zealand Joint Registry Data Forms 208 of 228
NEW ZEALAND JOINT REGISTRY
Primary Replacement Shoulder
Total shoulder Arthroplasty Hemiarthroplasty Reverse Shoulder 24.03.2016
Date:…..................... Consultant: …………………….
[If different from patient label]
BMI:…………….. Hospital: ................. Hospital:..………………...
Side:................ ** Town/City:
……………………………….
Tick Appropriate Boxes
PREVIOUS OPERATION ON INDEX JOINT
None Osteotomy
Internal fixation for juxtarticular fracture Arthrodesis
Previous stabilisation Arthroscopic debridement/compression
Rotator Cuff Repair Other: Name: ................................................
DIAGNOSIS
Rheumatoid arthritis Post recurrent dislocation
Osteoarthritis Avascular necrosis
Other inflammatory Cuff tear arthropathy
Acute fracture proximal humerus Post old trauma
Other: Name: .................................................
APPROACH
Deltopectoral Other : specify
HUMERUS
GLENOID
Patient Name:
Address:
d.o.b. NHI:
Attach Patient Label
Please do not fold
bar-coded label
Please do not fold
bar-coded label
APPENDIX 4 - DATA FORMS
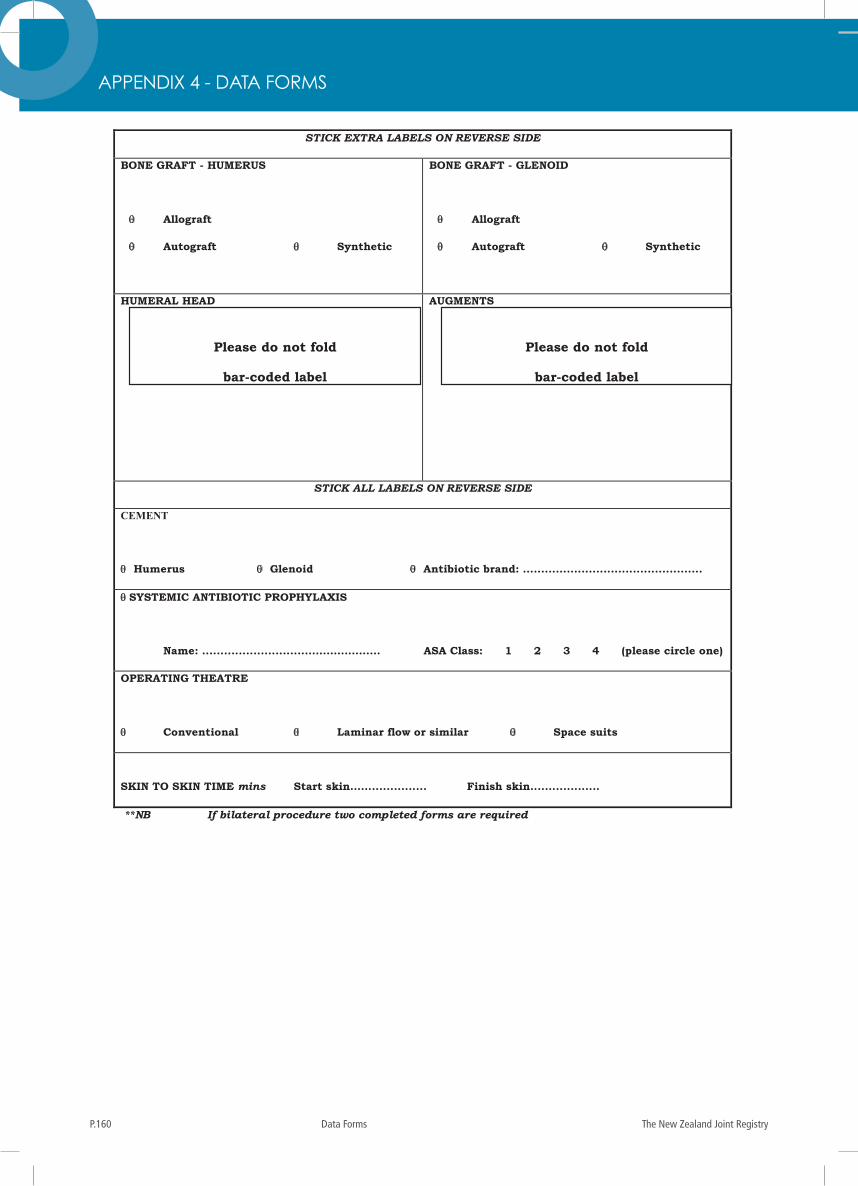
The New Zealand Joint RegistryP.160 Data Forms
209 of 228 Data Forms The New Zealand Joint Registry
STICK EXTRA LABELS ON REVERSE SIDE
BONE GRAFT - HUMERUS
Allograft
Autograft Synthetic
BONE GRAFT - GLENOID
Allograft
Autograft Synthetic
HUMERAL HEAD
AUGMENTS
STICK ALL LABELS ON REVERSE SIDE
CEMENT
Humerus Glenoid Antibiotic brand: .................................................
SYSTEMIC ANTIBIOTIC PROPHYLAXIS
Name: ............................………………… ASA Class: 1 2 3 4 (please circle one)
OPERATING THEATRE
Conventional Laminar flow or similar Space suits
SKIN TO SKIN TIME mins Start skin..................... Finish skin...................
**NB If bilateral procedure two completed forms are required
Please do not fold
bar-coded label
Please do not fold
bar-coded label
APPENDIX 4 - DATA FORMS
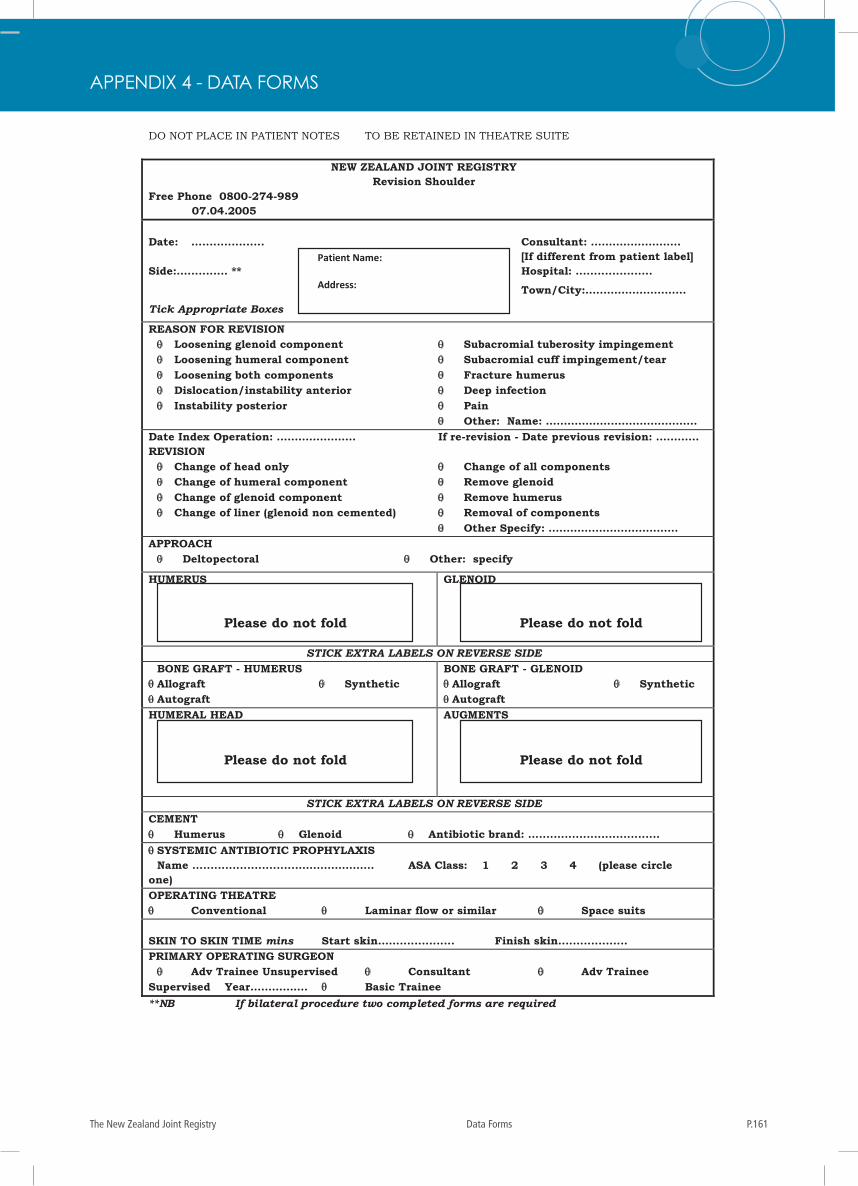
P.161The New Zealand Joint Registry Data Forms
_________________________________________________________________________________________________________________________ The New Zealand Joint Registry Data Forms 210 of 228
DO NOT PLACE IN PATIENT NOTES TO BE RETAINED IN THEATRE SUITE
NEW ZEALAND JOINT REGISTRY Revision Shoulder
Free Phone 0800-274-989 07.04.2005 Date: .................... Consultant: ……………………. [If different from patient label] Side:.............. ** Hospital: ..................... Town/City:………………………. Tick Appropriate Boxes
REASON FOR REVISION Loosening glenoid component Subacromial tuberosity impingement Loosening humeral component Subacromial cuff impingement/tear Loosening both components Fracture humerus Dislocation/instability anterior Deep infection Instability posterior Pain Other: Name: …………………………………… Date Index Operation: …………………. If re-revision - Date previous revision: ………… REVISION Change of head only Change of all components Change of humeral component Remove glenoid Change of glenoid component Remove humerus Change of liner (glenoid non cemented) Removal of components Other Specify: ……………………………… APPROACH Deltopectoral Other: specify
HUMERUS
GLENOID
STICK EXTRA LABELS ON REVERSE SIDE BONE GRAFT - HUMERUS Allograft Synthetic Autograft
BONE GRAFT - GLENOID Allograft Synthetic Autograft
HUMERAL HEAD
AUGMENTS
STICK EXTRA LABELS ON REVERSE SIDE CEMENT Humerus Glenoid Antibiotic brand: .................................... SYSTEMIC ANTIBIOTIC PROPHYLAXIS Name ............................…………………. ASA Class: 1 2 3 4 (please circle one) OPERATING THEATRE Conventional Laminar flow or similar Space suits SKIN TO SKIN TIME mins Start skin..................... Finish skin................... PRIMARY OPERATING SURGEON Adv Trainee Unsupervised Consultant Adv Trainee Supervised Year……………. Basic Trainee **NB If bilateral procedure two completed forms are required
Patient Name:
Address:
d.o.b. NHI:
Attach Patient Label
Please do not fold
bar-coded labels
Please do not fold
bar-coded labels
Please do not fold
bar-coded labels
Please do not fold
bar-coded labels
APPENDIX 4 - DATA FORMS
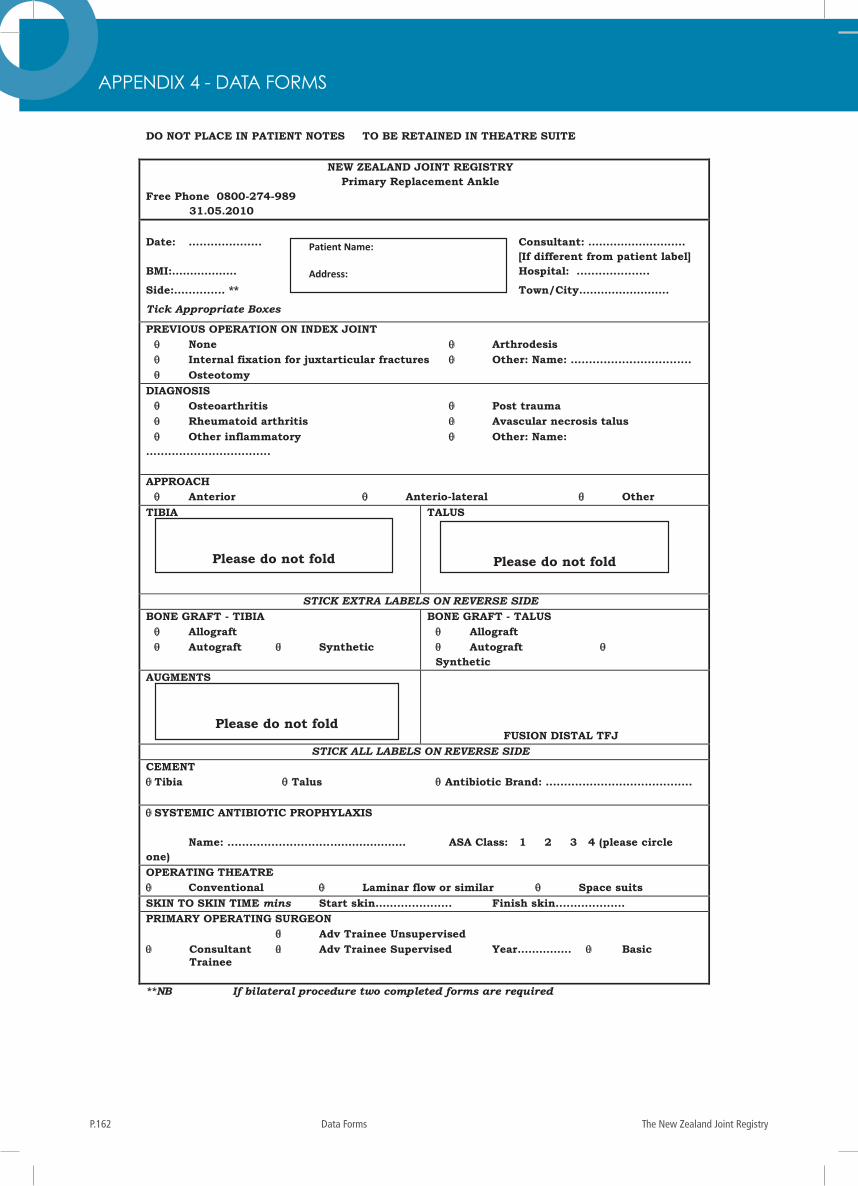
The New Zealand Joint RegistryP.162 Data Forms
211 of 228 Data Forms The New Zealand Joint Registry
DO NOT PLACE IN PATIENT NOTES TO BE RETAINED IN THEATRE SUITE
NEW ZEALAND JOINT REGISTRY Primary Replacement Ankle
Free Phone 0800-274-989 31.05.2010 Date: .................... Consultant: ……………………… [If different from patient label] BMI:……………… Hospital: .................... Side:.............. ** Town/City……………………. Tick Appropriate Boxes
PREVIOUS OPERATION ON INDEX JOINT None Arthrodesis Internal fixation for juxtarticular fractures Other: Name: ................................. Osteotomy DIAGNOSIS Osteoarthritis Post trauma Rheumatoid arthritis Avascular necrosis talus Other inflammatory Other: Name: .................................. APPROACH Anterior Anterio-lateral Other TIBIA
TALUS
STICK EXTRA LABELS ON REVERSE SIDE BONE GRAFT - TIBIA Allograft Autograft Synthetic
BONE GRAFT - TALUS Allograft Autograft Synthetic
AUGMENTS
FUSION DISTAL TFJ STICK ALL LABELS ON REVERSE SIDE
CEMENT Tibia Talus Antibiotic Brand: ........................................ SYSTEMIC ANTIBIOTIC PROPHYLAXIS Name: ............................………………… ASA Class: 1 2 3 4 (please circle one) OPERATING THEATRE Conventional Laminar flow or similar Space suits SKIN TO SKIN TIME mins Start skin..................... Finish skin................... PRIMARY OPERATING SURGEON Adv Trainee Unsupervised Consultant Adv Trainee Supervised Year…………… Basic
Trainee **NB If bilateral procedure two completed forms are required
Patient Name:
Address:
d.o.b. NHI:
Attach Patient Label
Please do not fold
bar-coded label
Please do not fold
bar-coded label
Please do not fold
bar-coded label
APPENDIX 4 - DATA FORMS
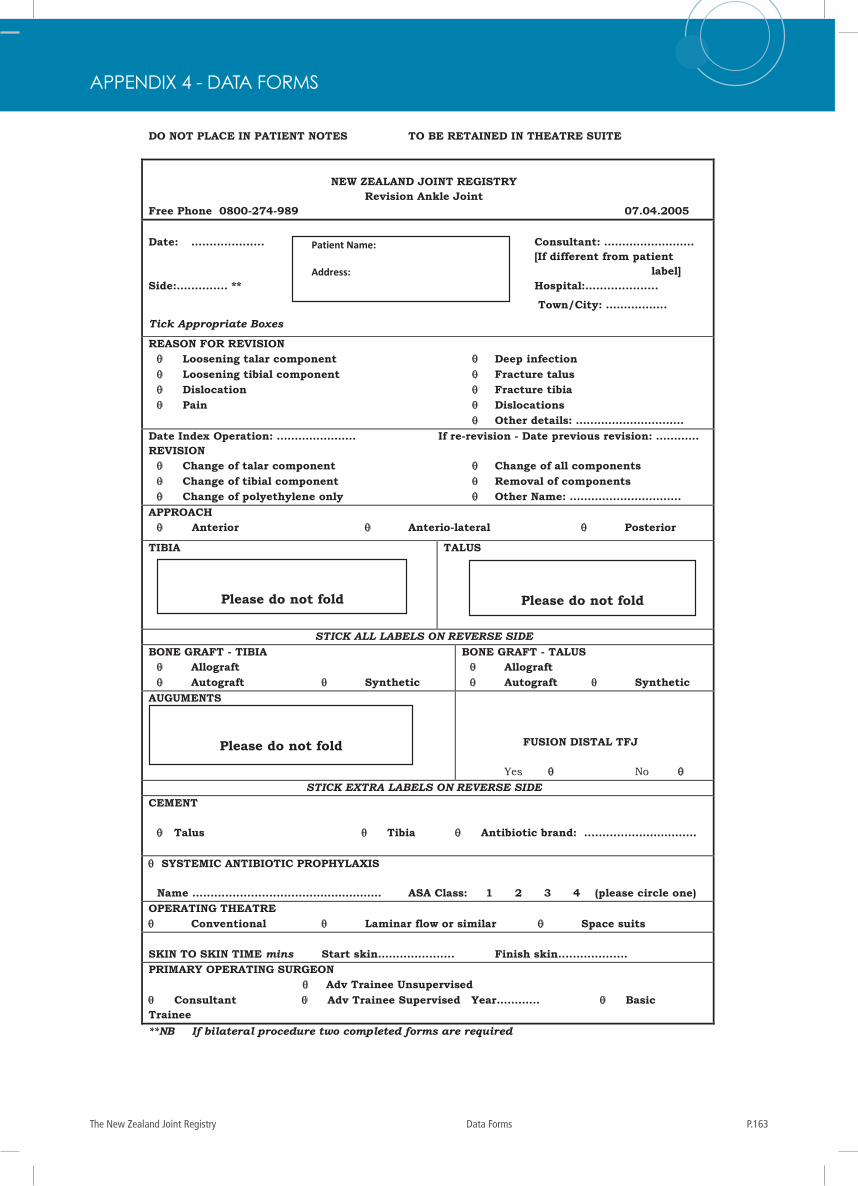
P.163The New Zealand Joint Registry Data Forms
_________________________________________________________________________________________________________________________ The New Zealand Joint Registry Data Forms 212 of 228
DO NOT PLACE IN PATIENT NOTES TO BE RETAINED IN THEATRE SUITE
NEW ZEALAND JOINT REGISTRY
Revision Ankle Joint Free Phone 0800-274-989 07.04.2005 Date: .................... Consultant: ……………………. [If different from patient
label] Side:.............. ** Hospital:.................... Town/City: …………….. Tick Appropriate Boxes
REASON FOR REVISION Loosening talar component Deep infection Loosening tibial component Fracture talus Dislocation Fracture tibia Pain Dislocations Other details: ………………………… Date Index Operation: …………………. If re-revision - Date previous revision: ………… REVISION Change of talar component Change of all components Change of tibial component Removal of components Change of polyethylene only Other Name: …………………………. APPROACH Anterior Anterio-lateral Posterior
TIBIA
TALUS
STICK ALL LABELS ON REVERSE SIDE BONE GRAFT - TIBIA Allograft Autograft Synthetic
BONE GRAFT - TALUS Allograft Autograft Synthetic
AUGUMENTS
FUSION DISTAL TFJ Yes No
STICK EXTRA LABELS ON REVERSE SIDE CEMENT Talus Tibia Antibiotic brand: ................…………… SYSTEMIC ANTIBIOTIC PROPHYLAXIS Name ............................…………………… ASA Class: 1 2 3 4 (please circle one) OPERATING THEATRE Conventional Laminar flow or similar Space suits SKIN TO SKIN TIME mins Start skin..................... Finish skin................... PRIMARY OPERATING SURGEON Adv Trainee Unsupervised Consultant Adv Trainee Supervised Year………… Basic Trainee **NB If bilateral procedure two completed forms are required
Patient Name:
Address:
d.o.b. NHI:
Attach Patient Label
Please do not fold
bar-coded label
Please do not fold
bar-coded label
Please do not fold
bar-coded label
APPENDIX 4 - DATA FORMS
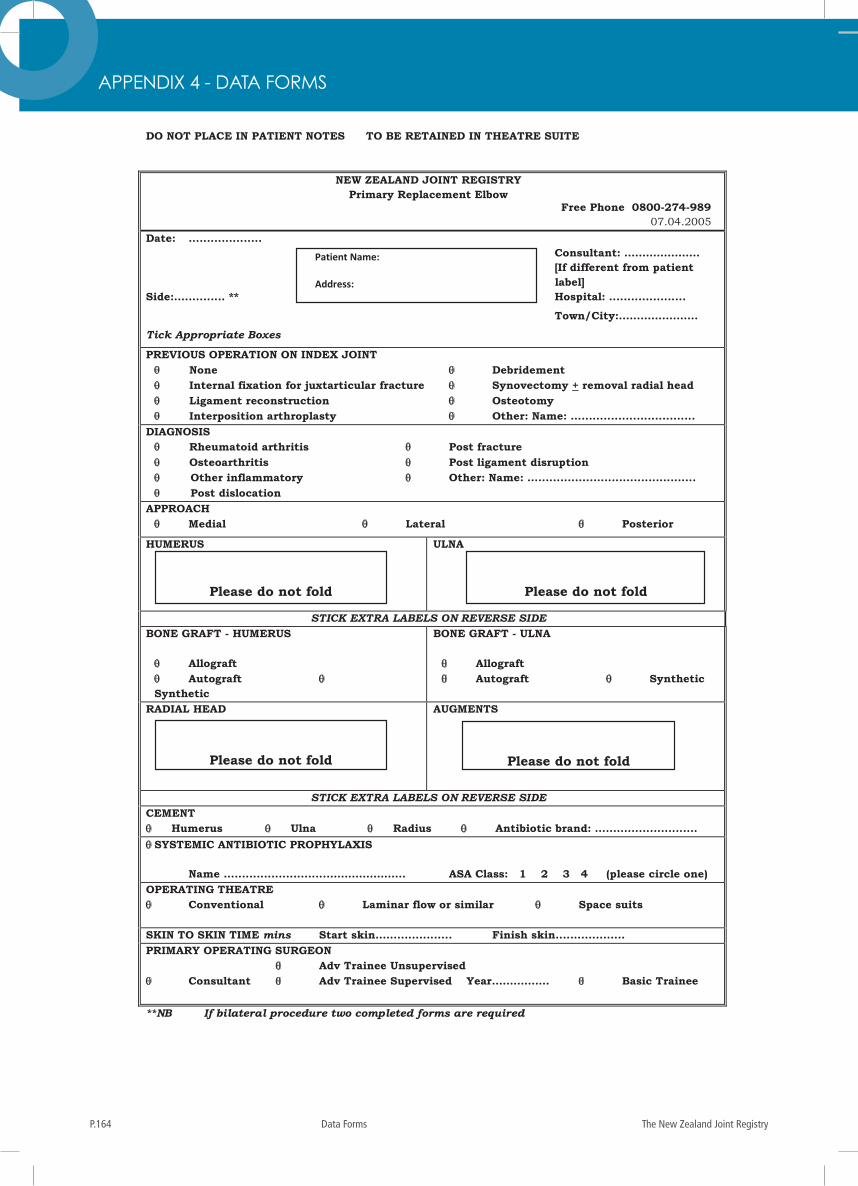
The New Zealand Joint RegistryP.164 Data Forms
213 of 228 Data Forms The New Zealand Joint Registry
DO NOT PLACE IN PATIENT NOTES TO BE RETAINED IN THEATRE SUITE
NEW ZEALAND JOINT REGISTRY
Primary Replacement Elbow Free Phone 0800-274-989
07.04.2005 Date: .................... Consultant: ………………… [If different from patient
label] Side:.............. ** Hospital: ..................... Town/City:…………………. Tick Appropriate Boxes
PREVIOUS OPERATION ON INDEX JOINT None Debridement Internal fixation for juxtarticular fracture Synovectomy + removal radial head Ligament reconstruction Osteotomy Interposition arthroplasty Other: Name: .................................. DIAGNOSIS Rheumatoid arthritis Post fracture Osteoarthritis Post ligament disruption Other inflammatory Other: Name: .............................................. Post dislocation APPROACH Medial Lateral Posterior
HUMERUS
ULNA
STICK EXTRA LABELS ON REVERSE SIDE BONE GRAFT - HUMERUS Allograft Autograft Synthetic
BONE GRAFT - ULNA Allograft Autograft Synthetic
RADIAL HEAD
AUGMENTS
STICK EXTRA LABELS ON REVERSE SIDE CEMENT Humerus Ulna Radius Antibiotic brand: ............................ SYSTEMIC ANTIBIOTIC PROPHYLAXIS Name ............................…………………. ASA Class: 1 2 3 4 (please circle one) OPERATING THEATRE Conventional Laminar flow or similar Space suits SKIN TO SKIN TIME mins Start skin..................... Finish skin................... PRIMARY OPERATING SURGEON Adv Trainee Unsupervised Consultant Adv Trainee Supervised Year………….… Basic Trainee **NB If bilateral procedure two completed forms are required
Patient Name:
Address:
d.o.b. NHI:
Attach Patient Label
Please do not fold
bar-coded label
Please do not fold
bar-coded label
Please do not fold
bar-coded label
Please do not fold
bar-coded label
APPENDIX 4 - DATA FORMS
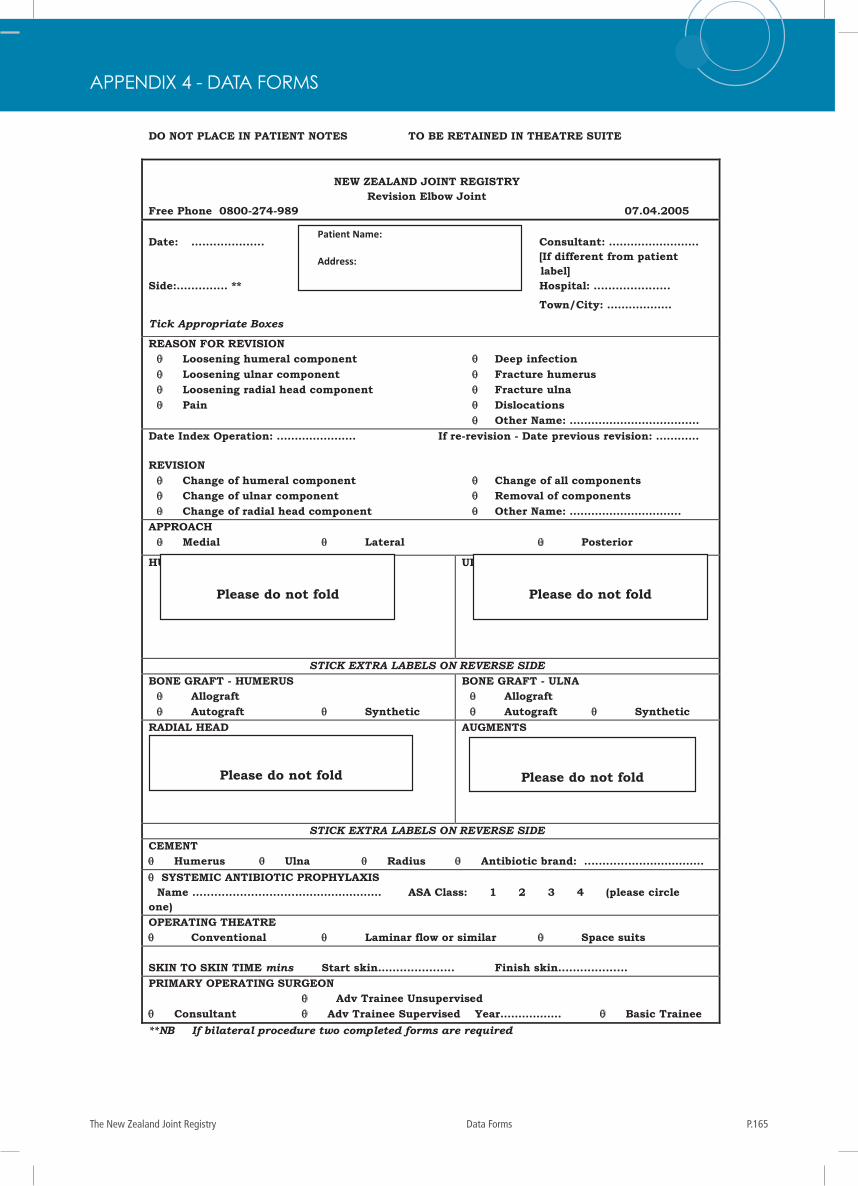
P.165The New Zealand Joint Registry Data Forms
_________________________________________________________________________________________________________________________ The New Zealand Joint Registry Data Forms 214 of 228
DO NOT PLACE IN PATIENT NOTES TO BE RETAINED IN THEATRE SUITE
NEW ZEALAND JOINT REGISTRY
Revision Elbow Joint Free Phone 0800-274-989 07.04.2005 Date: .................... Consultant: ……………………. [If different from patient
label] Side:.............. ** Hospital: ..................... Town/City: ……………… Tick Appropriate Boxes
REASON FOR REVISION Loosening humeral component Deep infection Loosening ulnar component Fracture humerus Loosening radial head component Fracture ulna Pain Dislocations Other Name: ……………………………… Date Index Operation: …………………. If re-revision - Date previous revision: ………… REVISION Change of humeral component Change of all components Change of ulnar component Removal of components Change of radial head component Other Name: …………………………. APPROACH Medial Lateral Posterior
HUMERUS
ULNA
STICK EXTRA LABELS ON REVERSE SIDE BONE GRAFT - HUMERUS Allograft Autograft Synthetic
BONE GRAFT - ULNA Allograft Autograft Synthetic
RADIAL HEAD
AUGMENTS
STICK EXTRA LABELS ON REVERSE SIDE CEMENT Humerus Ulna Radius Antibiotic brand: ..................…………… SYSTEMIC ANTIBIOTIC PROPHYLAXIS Name ............................…………………… ASA Class: 1 2 3 4 (please circle one) OPERATING THEATRE Conventional Laminar flow or similar Space suits SKIN TO SKIN TIME mins Start skin..................... Finish skin................... PRIMARY OPERATING SURGEON Adv Trainee Unsupervised Consultant Adv Trainee Supervised Year………..…… Basic Trainee **NB If bilateral procedure two completed forms are required
Patient Name:
Address:
d.o.b. NHI:
Attach Patient Label
Please do not fold
bar-coded label
Please do not fold
bar-coded label
Please do not fold
bar-coded label
Please do not fold
bar-coded label
APPENDIX 4 - DATA FORMS
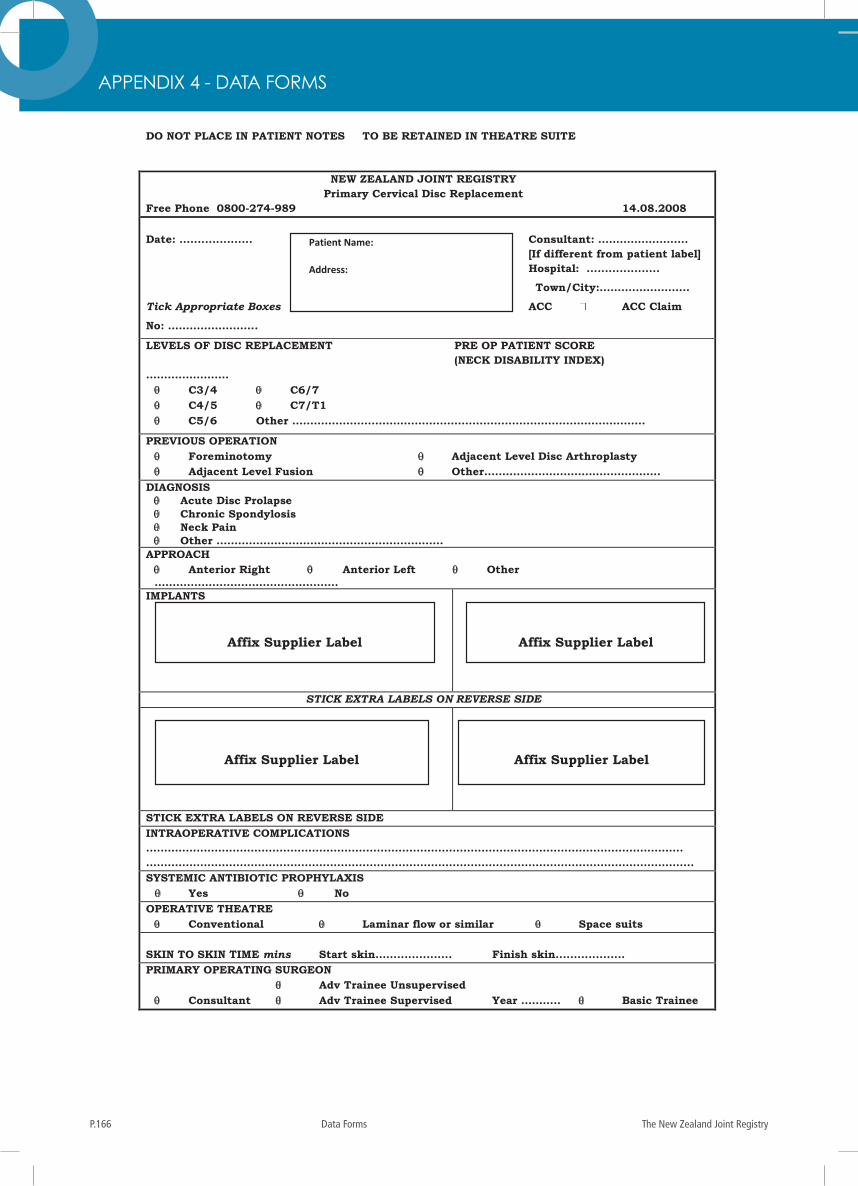
The New Zealand Joint RegistryP.166 Data Forms
215 of 228 Data Forms The New Zealand Joint Registry
DO NOT PLACE IN PATIENT NOTES TO BE RETAINED IN THEATRE SUITE
NEW ZEALAND JOINT REGISTRY
Primary Cervical Disc Replacement Free Phone 0800-274-989 14.08.2008 Date: .................... Consultant: ……………………. [If different from patient label] Hospital: .................... Town/City:……………………. Tick Appropriate Boxes ACC ACC Claim No: …………………….
LEVELS OF DISC REPLACEMENT PRE OP PATIENT SCORE (NECK DISABILITY INDEX) ………………….. C3/4 C6/7 C4/5 C7/T1 C5/6 Other ……………………………………………………………………………………..
PREVIOUS OPERATION Foreminotomy Adjacent Level Disc Arthroplasty Adjacent Level Fusion Other…………………………………………. DIAGNOSIS Acute Disc Prolapse Chronic Spondylosis Neck Pain Other ………………………………………………………
APPROACH Anterior Right Anterior Left Other ……………………………………………
IMPLANTS
STICK EXTRA LABELS ON REVERSE SIDE
STICK EXTRA LABELS ON REVERSE SIDE INTRAOPERATIVE COMPLICATIONS ………………………………………………………………………………………………………………………………….. …………………………………………………………………………………………………………………………………….. SYSTEMIC ANTIBIOTIC PROPHYLAXIS Yes No OPERATIVE THEATRE Conventional Laminar flow or similar Space suits SKIN TO SKIN TIME mins Start skin..................... Finish skin................... PRIMARY OPERATING SURGEON Adv Trainee Unsupervised Consultant Adv Trainee Supervised Year ……….. Basic Trainee
Patient Name:
Address:
DOB: NHI:
Attach Patient Label
Affix Supplier Label
Affix Supplier Label
Affix Supplier Label
Affix Supplier Label
APPENDIX 4 - DATA FORMS
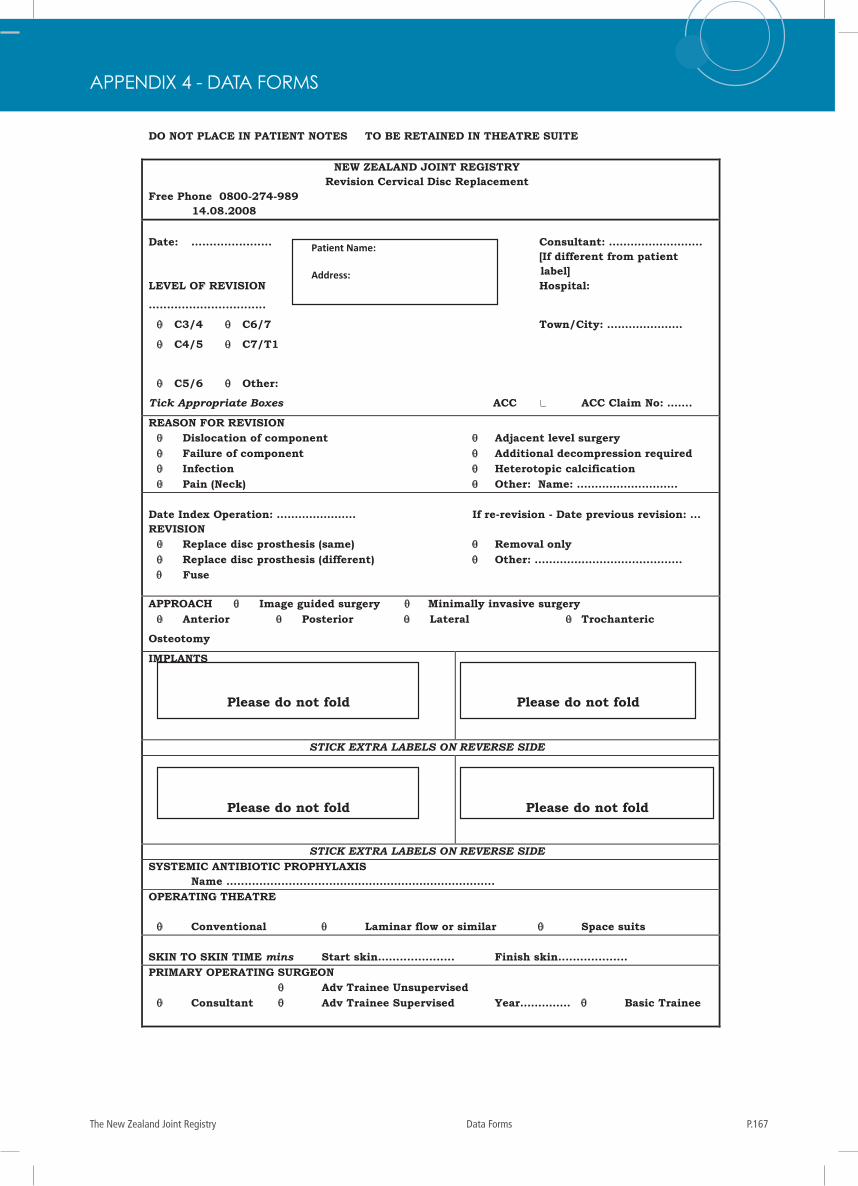
P.167The New Zealand Joint Registry Data Forms
_________________________________________________________________________________________________________________________ The New Zealand Joint Registry Data Forms 216 of 228
DO NOT PLACE IN PATIENT NOTES TO BE RETAINED IN THEATRE SUITE
NEW ZEALAND JOINT REGISTRY Revision Cervical Disc Replacement
Free Phone 0800-274-989 14.08.2008 Date: ...................... Consultant: …………………….. [If different from patient
label] LEVEL OF REVISION Hospital: ................................
C3/4 C6/7 Town/City: …………………
C4/5 C7/T1
C5/6 Other:
Tick Appropriate Boxes ACC ACC Claim No: …….
REASON FOR REVISION Dislocation of component Adjacent level surgery Failure of component Additional decompression required Infection Heterotopic calcification Pain (Neck) Other: Name: ………………………. Date Index Operation: …………………. If re-revision - Date previous revision: … REVISION Replace disc prosthesis (same) Removal only Replace disc prosthesis (different) Other: ………………………………….. Fuse
APPROACH Image guided surgery Minimally invasive surgery Anterior Posterior Lateral Trochanteric
Osteotomy
IMPLANTS
STICK EXTRA LABELS ON REVERSE SIDE
STICK EXTRA LABELS ON REVERSE SIDE SYSTEMIC ANTIBIOTIC PROPHYLAXIS Name ............................………………………………………. OPERATING THEATRE Conventional Laminar flow or similar Space suits SKIN TO SKIN TIME mins Start skin..................... Finish skin................... PRIMARY OPERATING SURGEON Adv Trainee Unsupervised Consultant Adv Trainee Supervised Year……..…… Basic Trainee
Patient Name:
Address:
DOB: NHI:
Attach Patient Label
Please do not fold
bar-coded label
Please do not fold
bar-coded label
Please do not fold
bar-coded label
Please do not fold
bar-coded label
APPENDIX 4 - DATA FORMS
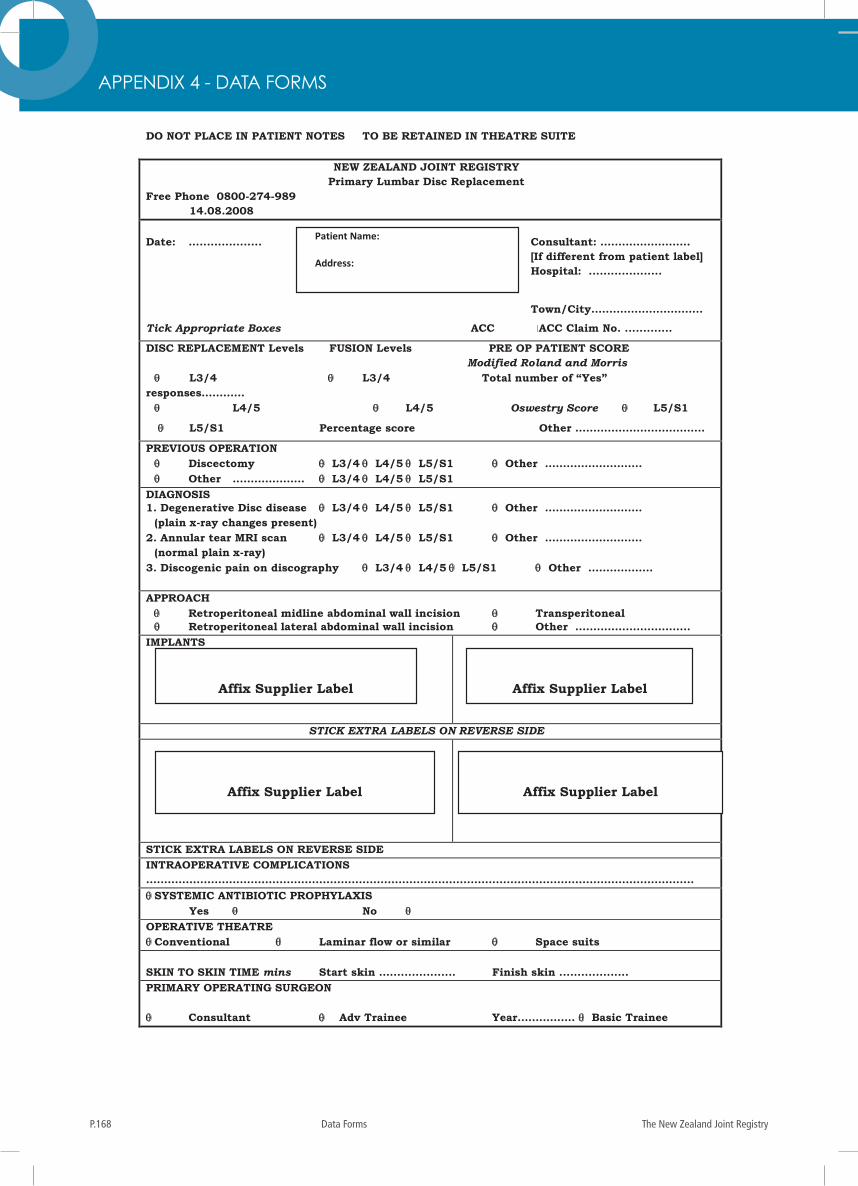
The New Zealand Joint RegistryP.168 Data Forms
217 of 228 Data Forms The New Zealand Joint Registry
DO NOT PLACE IN PATIENT NOTES TO BE RETAINED IN THEATRE SUITE
NEW ZEALAND JOINT REGISTRY Primary Lumbar Disc Replacement
Free Phone 0800-274-989 14.08.2008 Date: .................... Consultant: ……………………. [If different from patient label] Hospital: .................... Town/City…………………………. Tick Appropriate Boxes ACC ACC Claim No. .............
DISC REPLACEMENT Levels FUSION Levels PRE OP PATIENT SCORE Modified Roland and Morris L3/4 L3/4 Total number of “Yes” responses………… L4/5 L4/5 Oswestry Score L5/S1
L5/S1 Percentage score Other ………………………………
PREVIOUS OPERATION Discectomy L3/4 L4/5 L5/S1 Other ……………………… Other ……………….. L3/4 L4/5 L5/S1 DIAGNOSIS 1. Degenerative Disc disease L3/4 L4/5 L5/S1 Other ……………………… (plain x-ray changes present) 2. Annular tear MRI scan L3/4 L4/5 L5/S1 Other ……………………… (normal plain x-ray) 3. Discogenic pain on discography L3/4 L4/5 L5/S1 Other ……………… APPROACH Retroperitoneal midline abdominal wall incision Transperitoneal
Retroperitoneal lateral abdominal wall incision Other ………………………….. IMPLANTS
STICK EXTRA LABELS ON REVERSE SIDE
STICK EXTRA LABELS ON REVERSE SIDE INTRAOPERATIVE COMPLICATIONS …………………………………………………………………………………………………………………………………….. SYSTEMIC ANTIBIOTIC PROPHYLAXIS Yes No OPERATIVE THEATRE Conventional Laminar flow or similar Space suits SKIN TO SKIN TIME mins Start skin ..................... Finish skin ................... PRIMARY OPERATING SURGEON Consultant Adv Trainee Year………….… Basic Trainee
Patient Name:
Address:
d.o.b. NHI:
Attach Patient Label
Affix Supplier Label
Affix Supplier Label
Affix Supplier Label
Affix Supplier Label
APPENDIX 4 - DATA FORMS
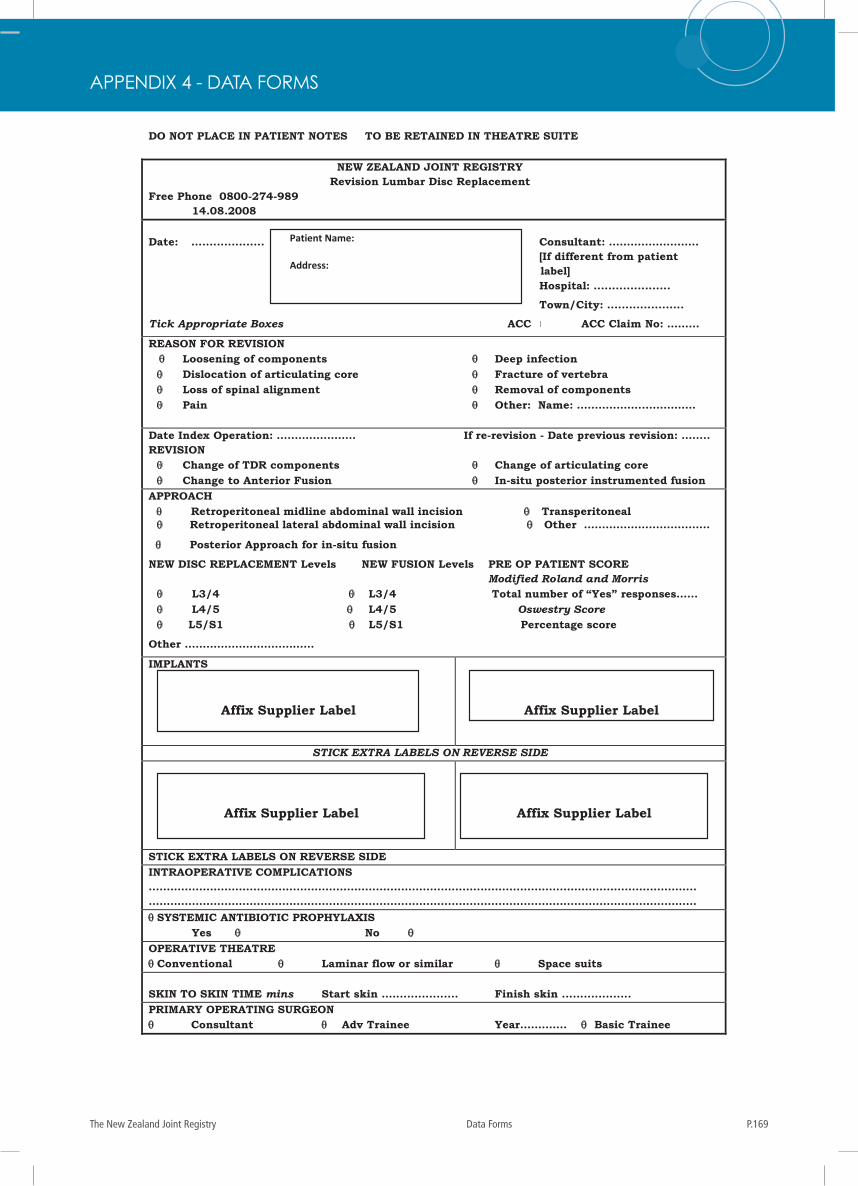
P.169The New Zealand Joint Registry Data Forms
_________________________________________________________________________________________________________________________ The New Zealand Joint Registry Data Forms 218 of 228
DO NOT PLACE IN PATIENT NOTES TO BE RETAINED IN THEATRE SUITE
NEW ZEALAND JOINT REGISTRY Revision Lumbar Disc Replacement
Free Phone 0800-274-989 14.08.2008 Date: .................... Consultant: ……………………. [If different from patient
label] Hospital: ..................... Town/City: ..................... Tick Appropriate Boxes ACC ACC Claim No: ………
REASON FOR REVISION Loosening of components Deep infection Dislocation of articulating core Fracture of vertebra Loss of spinal alignment Removal of components Pain Other: Name: …………………………… Date Index Operation: …………………. If re-revision - Date previous revision: …….. REVISION Change of TDR components Change of articulating core Change to Anterior Fusion In-situ posterior instrumented fusion APPROACH Retroperitoneal midline abdominal wall incision Transperitoneal
Retroperitoneal lateral abdominal wall incision Other ……………………………..
Posterior Approach for in-situ fusion
NEW DISC REPLACEMENT Levels NEW FUSION Levels PRE OP PATIENT SCORE Modified Roland and Morris L3/4 L3/4 Total number of “Yes” responses…… L4/5 L4/5 Oswestry Score L5/S1 L5/S1 Percentage score
Other ………………………………
IMPLANTS
STICK EXTRA LABELS ON REVERSE SIDE
STICK EXTRA LABELS ON REVERSE SIDE INTRAOPERATIVE COMPLICATIONS …………………………………………………………………………………………………………………………………….. …………………………………………………………………………………………………………………………………….. SYSTEMIC ANTIBIOTIC PROPHYLAXIS Yes No OPERATIVE THEATRE Conventional Laminar flow or similar Space suits SKIN TO SKIN TIME mins Start skin ..................... Finish skin ................... PRIMARY OPERATING SURGEON Consultant Adv Trainee Year…………. Basic Trainee
Patient Name:
Address:
d.o.b. NHI:
Attach Patient Label
Affix Supplier Label
Affix Supplier Label
Affix Supplier Label
Affix Supplier Label
APPENDIX 4 - DATA FORMS
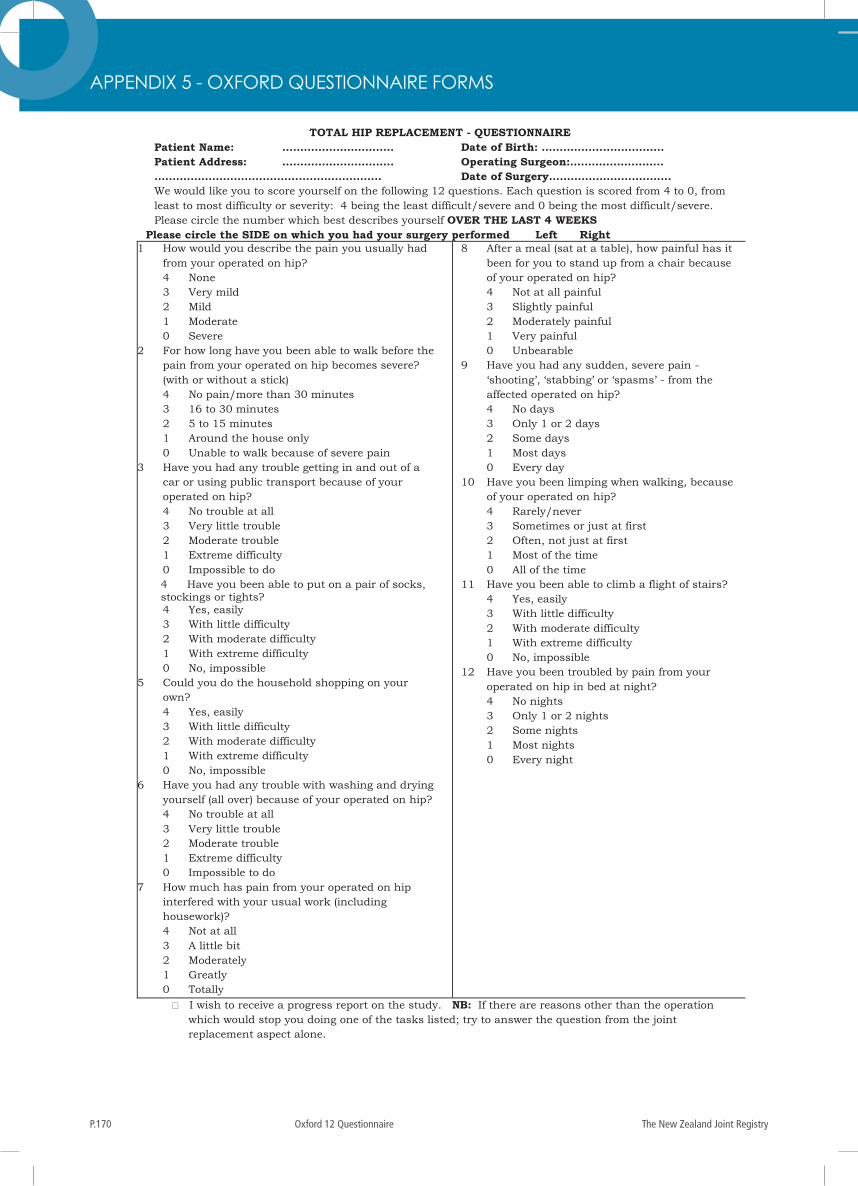
The New Zealand Joint RegistryP.170 Oxford 12 Questionnaire
APPENDIX 5 - OXFORD QUESTIONNAIRE FORMS
219 of 228 Oxford 12 Questionnaire The New Zealand Joint Registry
TOTAL HIP REPLACEMENT - QUESTIONNAIRE Patient Name: …………………………. Date of Birth: ..………………………….. Patient Address: …………………………. Operating Surgeon:…………………….. ………………………….………………………….. Date of Surgery……………………………. We would like you to score yourself on the following 12 questions. Each question is scored from 4 to 0, from least to most difficulty or severity: 4 being the least difficult/severe and 0 being the most difficult/severe. Please circle the number which best describes yourself OVER THE LAST 4 WEEKS
Please circle the SIDE on which you had your surgery performed Left Right 1 How would you describe the pain you usually had
from your operated on hip? 4 None 3 Very mild 2 Mild 1 Moderate 0 Severe 2 For how long have you been able to walk before the
pain from your operated on hip becomes severe? (with or without a stick)
4 No pain/more than 30 minutes 3 16 to 30 minutes 2 5 to 15 minutes 1 Around the house only 0 Unable to walk because of severe pain 3 Have you had any trouble getting in and out of a
car or using public transport because of your operated on hip?
4 No trouble at all 3 Very little trouble 2 Moderate trouble 1 Extreme difficulty 0 Impossible to do
4 Have you been able to put on a pair of socks, stockings or tights?
4 Yes, easily 3 With little difficulty 2 With moderate difficulty 1 With extreme difficulty 0 No, impossible 5 Could you do the household shopping on your
own? 4 Yes, easily 3 With little difficulty 2 With moderate difficulty 1 With extreme difficulty 0 No, impossible 6 Have you had any trouble with washing and drying
yourself (all over) because of your operated on hip? 4 No trouble at all 3 Very little trouble 2 Moderate trouble 1 Extreme difficulty 0 Impossible to do 7 How much has pain from your operated on hip
interfered with your usual work (including housework)?
4 Not at all 3 A little bit 2 Moderately 1 Greatly 0 Totally
8 After a meal (sat at a table), how painful has it been for you to stand up from a chair because of your operated on hip?
4 Not at all painful 3 Slightly painful 2 Moderately painful 1 Very painful 0 Unbearable 9 Have you had any sudden, severe pain -
‘shooting’, ‘stabbing’ or ‘spasms’ - from the affected operated on hip?
4 No days 3 Only 1 or 2 days 2 Some days 1 Most days 0 Every day 10 Have you been limping when walking, because
of your operated on hip? 4 Rarely/never 3 Sometimes or just at first 2 Often, not just at first 1 Most of the time 0 All of the time 11 Have you been able to climb a flight of stairs? 4 Yes, easily 3 With little difficulty 2 With moderate difficulty 1 With extreme difficulty 0 No, impossible 12 Have you been troubled by pain from your
operated on hip in bed at night? 4 No nights 3 Only 1 or 2 nights 2 Some nights 1 Most nights 0 Every night
I wish to receive a progress report on the study. NB: If there are reasons other than the operation which would stop you doing one of the tasks listed; try to answer the question from the joint replacement aspect alone.
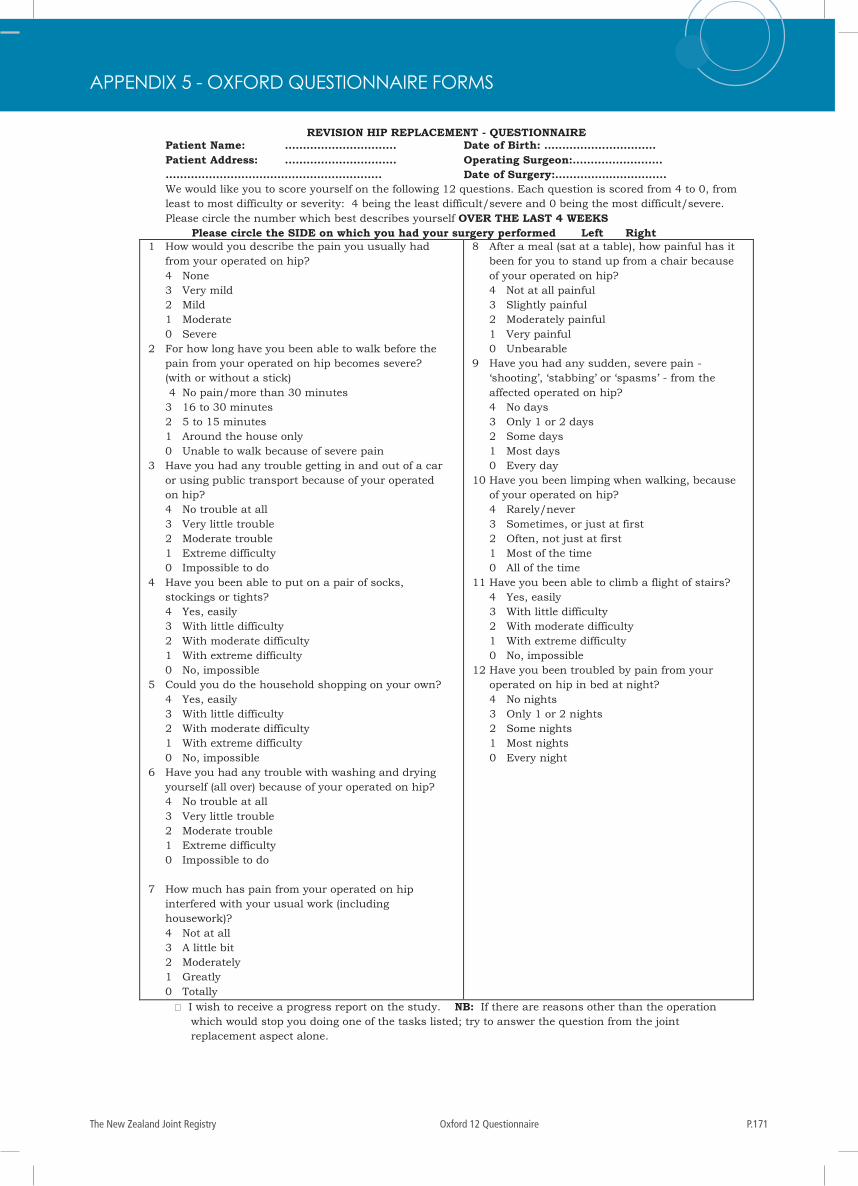
P.171The New Zealand Joint Registry Oxford 12 Questionnaire
APPENDIX 5 - OXFORD QUESTIONNAIRE FORMS
The New Zealand Joint Registry Oxford 12 Questionnaire 220 of 228
REVISION HIP REPLACEMENT - QUESTIONNAIRE Patient Name: …………………………. Date of Birth: ..……………………….. Patient Address: …………………………. Operating Surgeon:……………………. ………………………..…………………………. Date of Surgery:…………………………. We would like you to score yourself on the following 12 questions. Each question is scored from 4 to 0, from least to most difficulty or severity: 4 being the least difficult/severe and 0 being the most difficult/severe. Please circle the number which best describes yourself OVER THE LAST 4 WEEKS
Please circle the SIDE on which you had your surgery performed Left Right 1 How would you describe the pain you usually had
from your operated on hip? 4 None 3 Very mild 2 Mild 1 Moderate 0 Severe 2 For how long have you been able to walk before the
pain from your operated on hip becomes severe? (with or without a stick)
4 No pain/more than 30 minutes 3 16 to 30 minutes 2 5 to 15 minutes 1 Around the house only 0 Unable to walk because of severe pain 3 Have you had any trouble getting in and out of a car
or using public transport because of your operated on hip?
4 No trouble at all 3 Very little trouble 2 Moderate trouble 1 Extreme difficulty 0 Impossible to do 4 Have you been able to put on a pair of socks,
stockings or tights? 4 Yes, easily 3 With little difficulty 2 With moderate difficulty 1 With extreme difficulty 0 No, impossible 5 Could you do the household shopping on your own? 4 Yes, easily 3 With little difficulty 2 With moderate difficulty 1 With extreme difficulty 0 No, impossible 6 Have you had any trouble with washing and drying
yourself (all over) because of your operated on hip? 4 No trouble at all 3 Very little trouble 2 Moderate trouble 1 Extreme difficulty 0 Impossible to do 7 How much has pain from your operated on hip
interfered with your usual work (including housework)?
4 Not at all 3 A little bit 2 Moderately 1 Greatly 0 Totally
8 After a meal (sat at a table), how painful has it been for you to stand up from a chair because of your operated on hip?
4 Not at all painful 3 Slightly painful 2 Moderately painful 1 Very painful 0 Unbearable 9 Have you had any sudden, severe pain -
‘shooting’, ‘stabbing’ or ‘spasms’ - from the affected operated on hip?
4 No days 3 Only 1 or 2 days 2 Some days 1 Most days 0 Every day 10 Have you been limping when walking, because
of your operated on hip? 4 Rarely/never 3 Sometimes, or just at first 2 Often, not just at first 1 Most of the time 0 All of the time 11 Have you been able to climb a flight of stairs? 4 Yes, easily 3 With little difficulty 2 With moderate difficulty 1 With extreme difficulty 0 No, impossible 12 Have you been troubled by pain from your
operated on hip in bed at night? 4 No nights 3 Only 1 or 2 nights 2 Some nights 1 Most nights 0 Every night
I wish to receive a progress report on the study. NB: If there are reasons other than the operation which would stop you doing one of the tasks listed; try to answer the question from the joint replacement aspect alone.
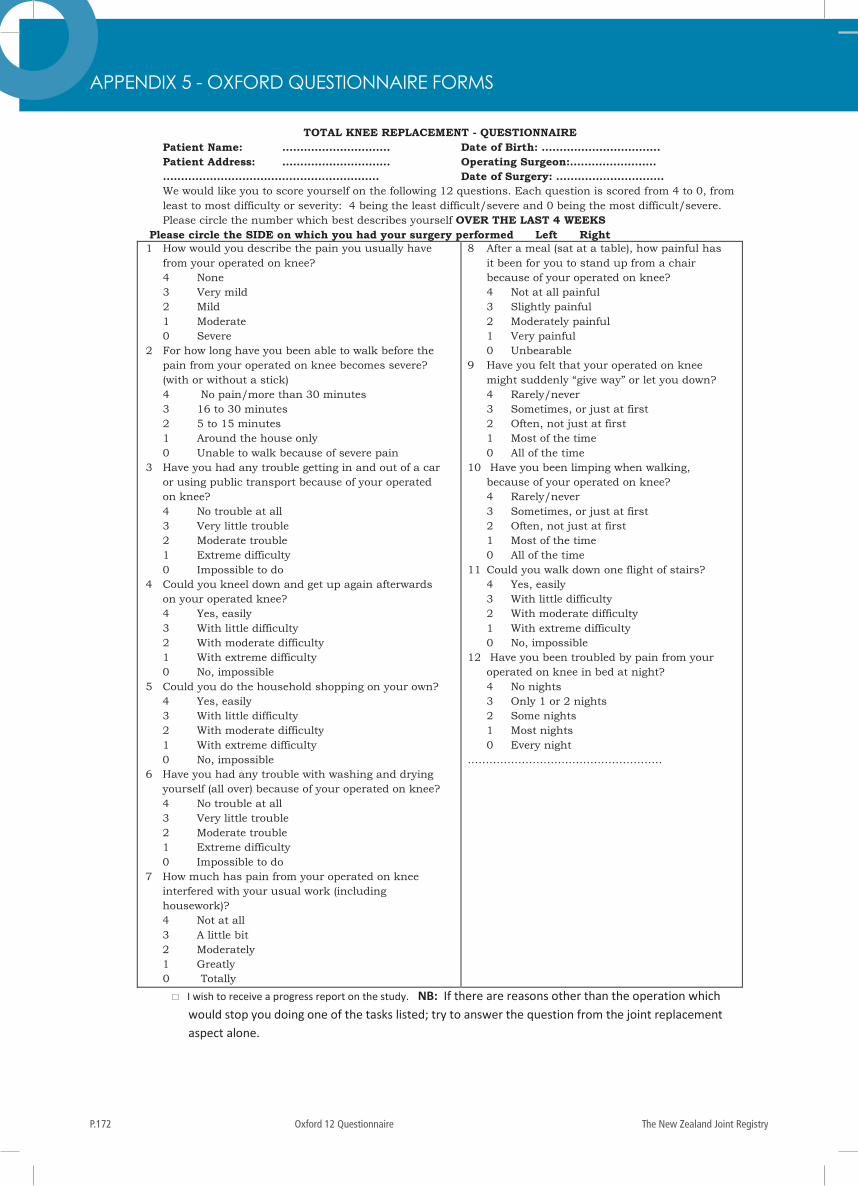
The New Zealand Joint RegistryP.172 Oxford 12 Questionnaire
221 of 228 Oxford 12 Questionnaire The New Zealand Joint Registry
TOTAL KNEE REPLACEMENT - QUESTIONNAIRE Patient Name: ………………………… Date of Birth: …………………………… Patient Address: ………………………… Operating Surgeon:…………………… ………………………..…………………………. Date of Surgery: ………………………… We would like you to score yourself on the following 12 questions. Each question is scored from 4 to 0, from least to most difficulty or severity: 4 being the least difficult/severe and 0 being the most difficult/severe. Please circle the number which best describes yourself OVER THE LAST 4 WEEKS
Please circle the SIDE on which you had your surgery performed Left Right 1 How would you describe the pain you usually have
from your operated on knee? 4 None 3 Very mild 2 Mild 1 Moderate 0 Severe 2 For how long have you been able to walk before the
pain from your operated on knee becomes severe? (with or without a stick)
4 No pain/more than 30 minutes 3 16 to 30 minutes 2 5 to 15 minutes 1 Around the house only 0 Unable to walk because of severe pain 3 Have you had any trouble getting in and out of a car
or using public transport because of your operated on knee?
4 No trouble at all 3 Very little trouble 2 Moderate trouble 1 Extreme difficulty 0 Impossible to do 4 Could you kneel down and get up again afterwards
on your operated knee? 4 Yes, easily 3 With little difficulty 2 With moderate difficulty 1 With extreme difficulty 0 No, impossible 5 Could you do the household shopping on your own? 4 Yes, easily 3 With little difficulty 2 With moderate difficulty 1 With extreme difficulty 0 No, impossible 6 Have you had any trouble with washing and drying
yourself (all over) because of your operated on knee? 4 No trouble at all 3 Very little trouble 2 Moderate trouble 1 Extreme difficulty 0 Impossible to do 7 How much has pain from your operated on knee
interfered with your usual work (including housework)?
4 Not at all 3 A little bit 2 Moderately 1 Greatly
0 Totally
8 After a meal (sat at a table), how painful has it been for you to stand up from a chair because of your operated on knee?
4 Not at all painful 3 Slightly painful 2 Moderately painful 1 Very painful 0 Unbearable 9 Have you felt that your operated on knee
might suddenly “give way” or let you down? 4 Rarely/never 3 Sometimes, or just at first 2 Often, not just at first 1 Most of the time 0 All of the time 10 Have you been limping when walking,
because of your operated on knee? 4 Rarely/never 3 Sometimes, or just at first 2 Often, not just at first 1 Most of the time 0 All of the time 11 Could you walk down one flight of stairs? 4 Yes, easily 3 With little difficulty 2 With moderate difficulty 1 With extreme difficulty 0 No, impossible 12 Have you been troubled by pain from your
operated on knee in bed at night? 4 No nights 3 Only 1 or 2 nights 2 Some nights 1 Most nights 0 Every night ………………………………………………
I wish to receive a progress report on the study. NB: If there are reasons other than the operation which would stop you doing one of the tasks listed; try to answer the question from the joint replacement aspect alone.
APPENDIX 5 - OXFORD QUESTIONNAIRE FORMS
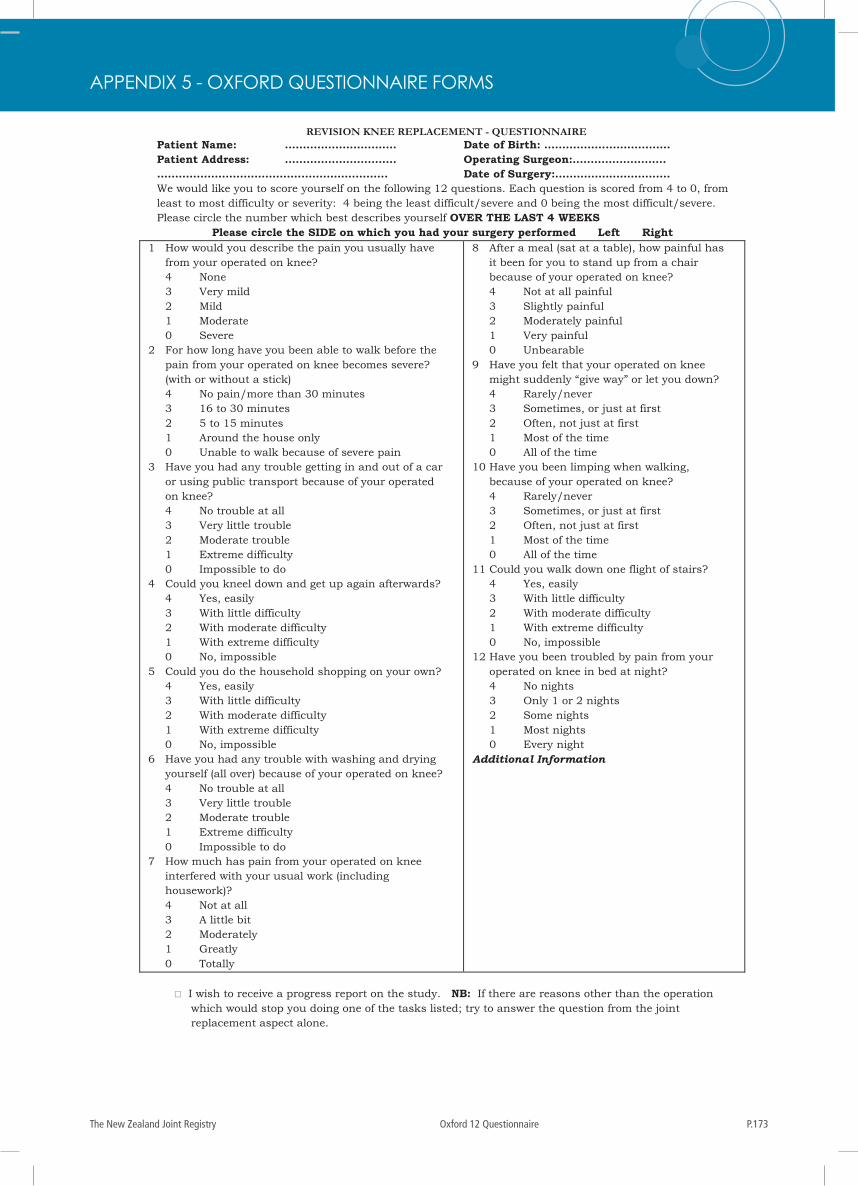
P.173The New Zealand Joint Registry Oxford 12 Questionnaire
The New Zealand Joint Registry Oxford 12 Questionnaire 222 of 228
REVISION KNEE REPLACEMENT - QUESTIONNAIRE Patient Name: …………………………. Date of Birth: ..…………………………… Patient Address: …………………………. Operating Surgeon:…………………….. ……………………….……………………………... Date of Surgery:………………………….. We would like you to score yourself on the following 12 questions. Each question is scored from 4 to 0, from least to most difficulty or severity: 4 being the least difficult/severe and 0 being the most difficult/severe. Please circle the number which best describes yourself OVER THE LAST 4 WEEKS
Please circle the SIDE on which you had your surgery performed Left Right 1 How would you describe the pain you usually have
from your operated on knee? 4 None 3 Very mild 2 Mild 1 Moderate 0 Severe 2 For how long have you been able to walk before the
pain from your operated on knee becomes severe? (with or without a stick)
4 No pain/more than 30 minutes 3 16 to 30 minutes 2 5 to 15 minutes 1 Around the house only 0 Unable to walk because of severe pain 3 Have you had any trouble getting in and out of a car
or using public transport because of your operated on knee?
4 No trouble at all 3 Very little trouble 2 Moderate trouble 1 Extreme difficulty 0 Impossible to do 4 Could you kneel down and get up again afterwards? 4 Yes, easily 3 With little difficulty 2 With moderate difficulty 1 With extreme difficulty 0 No, impossible 5 Could you do the household shopping on your own? 4 Yes, easily 3 With little difficulty 2 With moderate difficulty 1 With extreme difficulty 0 No, impossible 6 Have you had any trouble with washing and drying
yourself (all over) because of your operated on knee? 4 No trouble at all 3 Very little trouble 2 Moderate trouble 1 Extreme difficulty 0 Impossible to do 7 How much has pain from your operated on knee
interfered with your usual work (including housework)?
4 Not at all 3 A little bit 2 Moderately 1 Greatly 0 Totally
8 After a meal (sat at a table), how painful has it been for you to stand up from a chair because of your operated on knee?
4 Not at all painful 3 Slightly painful 2 Moderately painful 1 Very painful 0 Unbearable 9 Have you felt that your operated on knee
might suddenly “give way” or let you down? 4 Rarely/never 3 Sometimes, or just at first 2 Often, not just at first 1 Most of the time 0 All of the time 10 Have you been limping when walking,
because of your operated on knee? 4 Rarely/never 3 Sometimes, or just at first 2 Often, not just at first 1 Most of the time 0 All of the time 11 Could you walk down one flight of stairs? 4 Yes, easily 3 With little difficulty 2 With moderate difficulty 1 With extreme difficulty 0 No, impossible 12 Have you been troubled by pain from your
operated on knee in bed at night? 4 No nights 3 Only 1 or 2 nights 2 Some nights 1 Most nights 0 Every night Additional Information
I wish to receive a progress report on the study. NB: If there are reasons other than the operation
which would stop you doing one of the tasks listed; try to answer the question from the joint replacement aspect alone.
APPENDIX 5 - OXFORD QUESTIONNAIRE FORMS
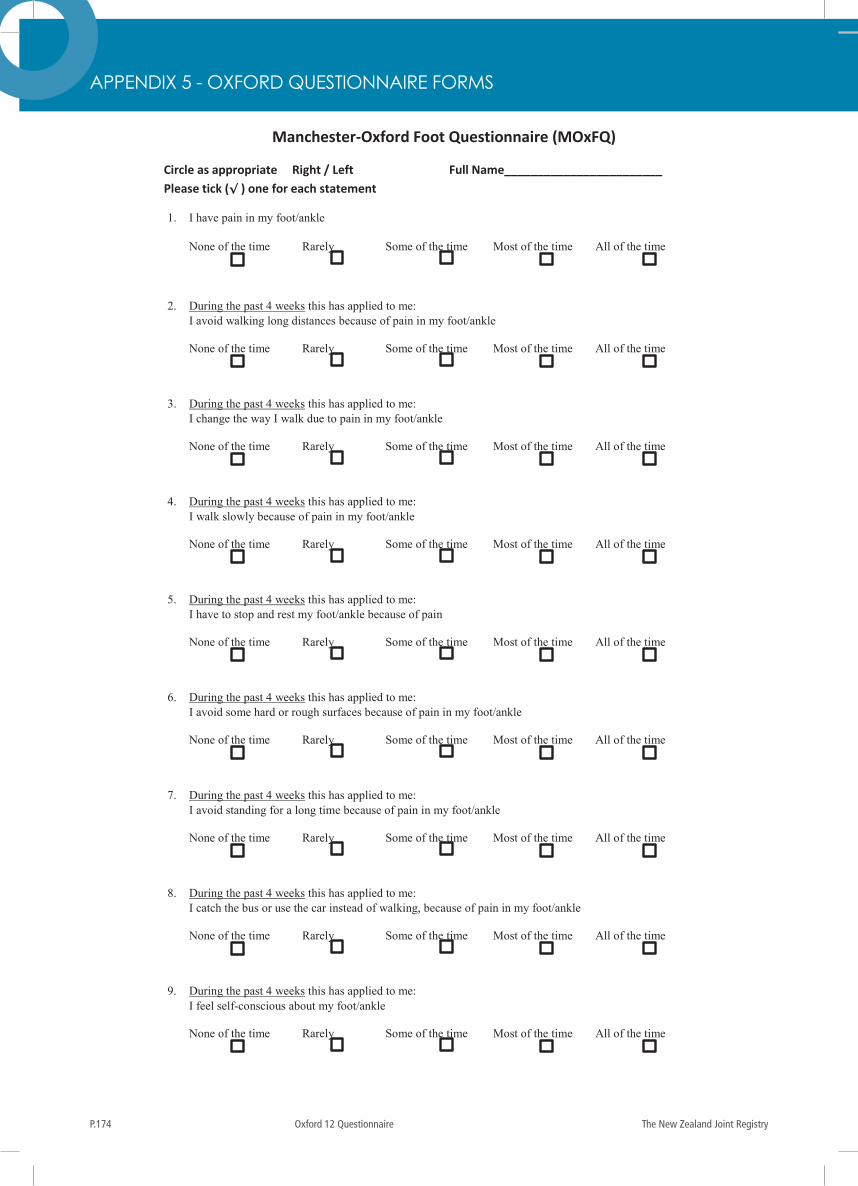
The New Zealand Joint RegistryP.174 Oxford 12 Questionnaire
223 of 228 Oxford 12 Questionnaire The New Zealand Joint Registry
Manchester-Oxford Foot Questionnaire (MOxFQ)
Circle as appropriate Right / Left Full Name________________________ Please tick (√ ) one for each statement
1. I have pain in my foot/ankle None of the time Rarely Some of the time Most of the time All of the time
2. During the past 4 weeks this has applied to me:
I avoid walking long distances because of pain in my foot/ankle None of the time Rarely Some of the time Most of the time All of the time
3. During the past 4 weeks this has applied to me: I change the way I walk due to pain in my foot/ankle None of the time Rarely Some of the time Most of the time All of the time
4. During the past 4 weeks this has applied to me: I walk slowly because of pain in my foot/ankle None of the time Rarely Some of the time Most of the time All of the time
5. During the past 4 weeks this has applied to me: I have to stop and rest my foot/ankle because of pain None of the time Rarely Some of the time Most of the time All of the time
6. During the past 4 weeks this has applied to me: I avoid some hard or rough surfaces because of pain in my foot/ankle None of the time Rarely Some of the time Most of the time All of the time
7. During the past 4 weeks this has applied to me: I avoid standing for a long time because of pain in my foot/ankle None of the time Rarely Some of the time Most of the time All of the time
8. During the past 4 weeks this has applied to me: I catch the bus or use the car instead of walking, because of pain in my foot/ankle None of the time Rarely Some of the time Most of the time All of the time
9. During the past 4 weeks this has applied to me: I feel self-conscious about my foot/ankle None of the time Rarely Some of the time Most of the time All of the time
APPENDIX 5 - OXFORD QUESTIONNAIRE FORMS
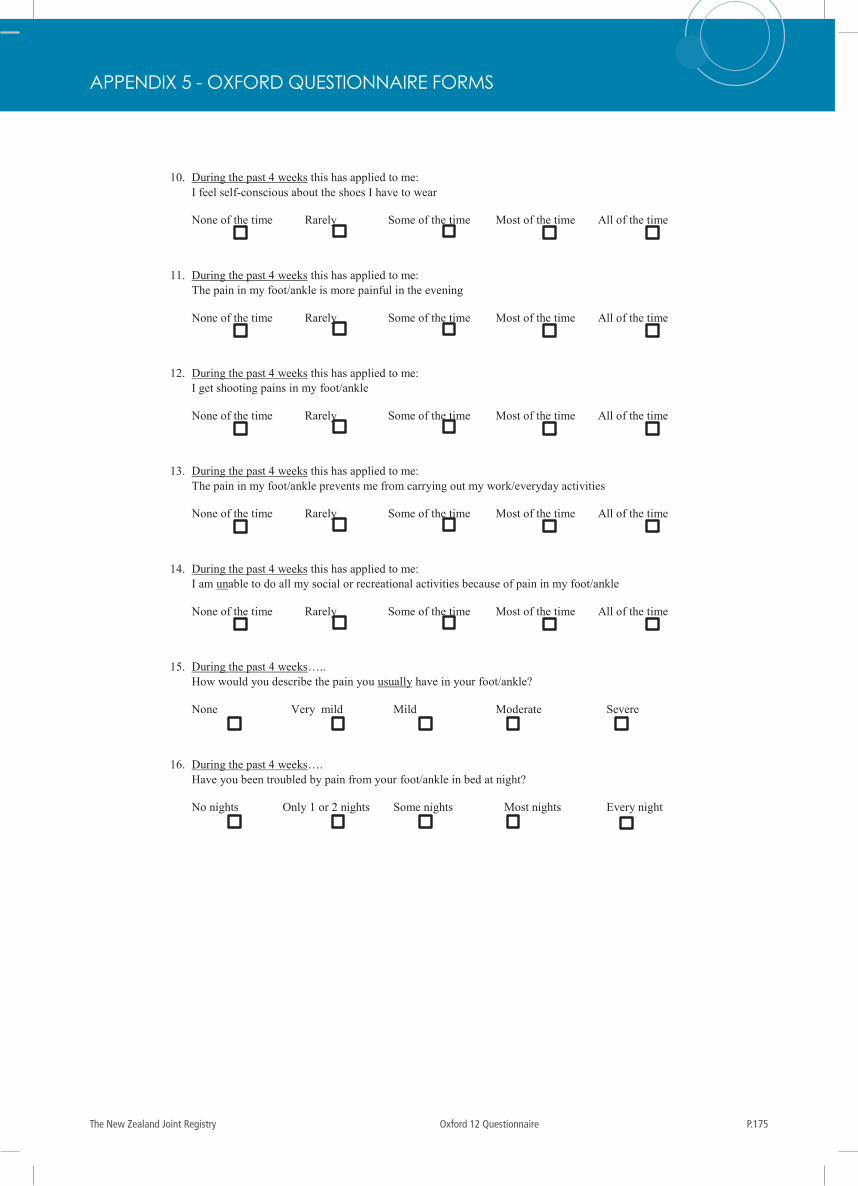
P.175The New Zealand Joint Registry Oxford 12 Questionnaire
The New Zealand Joint Registry Oxford 12 Questionnaire 224 of 228
10. During the past 4 weeks this has applied to me:
I feel self-conscious about the shoes I have to wear None of the time Rarely Some of the time Most of the time All of the time
11. During the past 4 weeks this has applied to me: The pain in my foot/ankle is more painful in the evening None of the time Rarely Some of the time Most of the time All of the time
12. During the past 4 weeks this has applied to me: I get shooting pains in my foot/ankle None of the time Rarely Some of the time Most of the time All of the time
13. During the past 4 weeks this has applied to me: The pain in my foot/ankle prevents me from carrying out my work/everyday activities None of the time Rarely Some of the time Most of the time All of the time
14. During the past 4 weeks this has applied to me: I am unable to do all my social or recreational activities because of pain in my foot/ankle None of the time Rarely Some of the time Most of the time All of the time
15. During the past 4 weeks….. How would you describe the pain you usually have in your foot/ankle? None Very mild Mild Moderate Severe
16. During the past 4 weeks…. Have you been troubled by pain from your foot/ankle in bed at night? No nights Only 1 or 2 nights Some nights Most nights Every night
APPENDIX 5 - OXFORD QUESTIONNAIRE FORMS
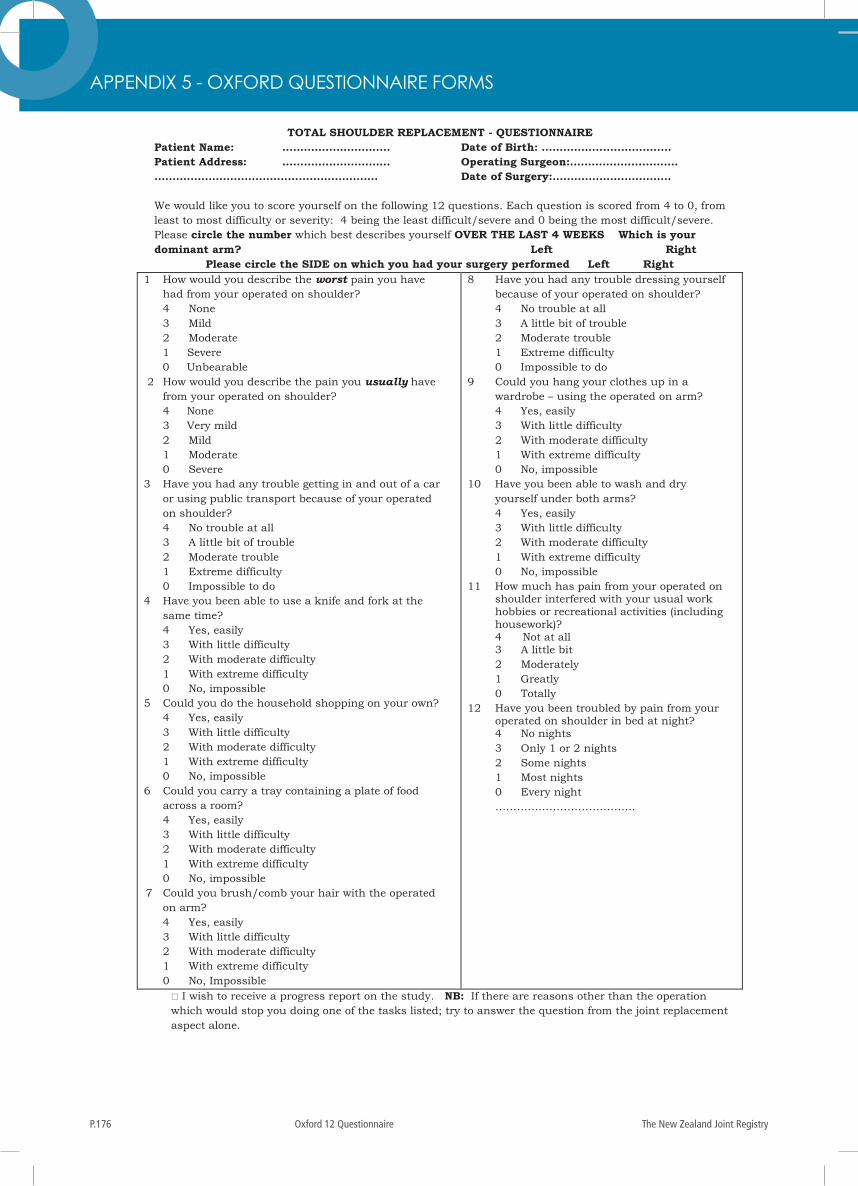
The New Zealand Joint RegistryP.176 Oxford 12 Questionnaire
225 of 228 Oxford 12 Questionnaire The New Zealand Joint Registry
TOTAL SHOULDER REPLACEMENT - QUESTIONNAIRE Patient Name: ………………………… Date of Birth: …..…………………………. Patient Address: ………………………… Operating Surgeon:………………………… ………………………….…………………………. Date of Surgery:…………………………… We would like you to score yourself on the following 12 questions. Each question is scored from 4 to 0, from least to most difficulty or severity: 4 being the least difficult/severe and 0 being the most difficult/severe. Please circle the number which best describes yourself OVER THE LAST 4 WEEKS Which is your dominant arm? Left Right
Please circle the SIDE on which you had your surgery performed Left Right 1 How would you describe the worst pain you have
had from your operated on shoulder? 4 None 3 Mild 2 Moderate
1 Severe 0 Unbearable
2 How would you describe the pain you usually have from your operated on shoulder?
4 None 3 Very mild 2 Mild 1 Moderate 0 Severe 3 Have you had any trouble getting in and out of a car
or using public transport because of your operated on shoulder?
4 No trouble at all 3 A little bit of trouble 2 Moderate trouble 1 Extreme difficulty 0 Impossible to do 4 Have you been able to use a knife and fork at the
same time? 4 Yes, easily 3 With little difficulty 2 With moderate difficulty 1 With extreme difficulty 0 No, impossible 5 Could you do the household shopping on your own? 4 Yes, easily 3 With little difficulty 2 With moderate difficulty 1 With extreme difficulty 0 No, impossible 6 Could you carry a tray containing a plate of food
across a room? 4 Yes, easily 3 With little difficulty 2 With moderate difficulty 1 With extreme difficulty 0 No, impossible 7 Could you brush/comb your hair with the operated
on arm? 4 Yes, easily 3 With little difficulty 2 With moderate difficulty 1 With extreme difficulty 0 No, Impossible
8 Have you had any trouble dressing yourself because of your operated on shoulder?
4 No trouble at all 3 A little bit of trouble 2 Moderate trouble 1 Extreme difficulty 0 Impossible to do 9 Could you hang your clothes up in a
wardrobe – using the operated on arm? 4 Yes, easily 3 With little difficulty 2 With moderate difficulty 1 With extreme difficulty 0 No, impossible 10 Have you been able to wash and dry
yourself under both arms? 4 Yes, easily 3 With little difficulty 2 With moderate difficulty 1 With extreme difficulty 0 No, impossible 11 How much has pain from your operated on
shoulder interfered with your usual work hobbies or recreational activities (including housework)? 4 Not at all
3 A little bit 2 Moderately 1 Greatly 0 Totally 12 Have you been troubled by pain from your
operated on shoulder in bed at night? 4 No nights 3 Only 1 or 2 nights 2 Some nights 1 Most nights 0 Every night ………….……………………..
I wish to receive a progress report on the study. NB: If there are reasons other than the operation which would stop you doing one of the tasks listed; try to answer the question from the joint replacement aspect alone.
APPENDIX 5 - OXFORD QUESTIONNAIRE FORMS
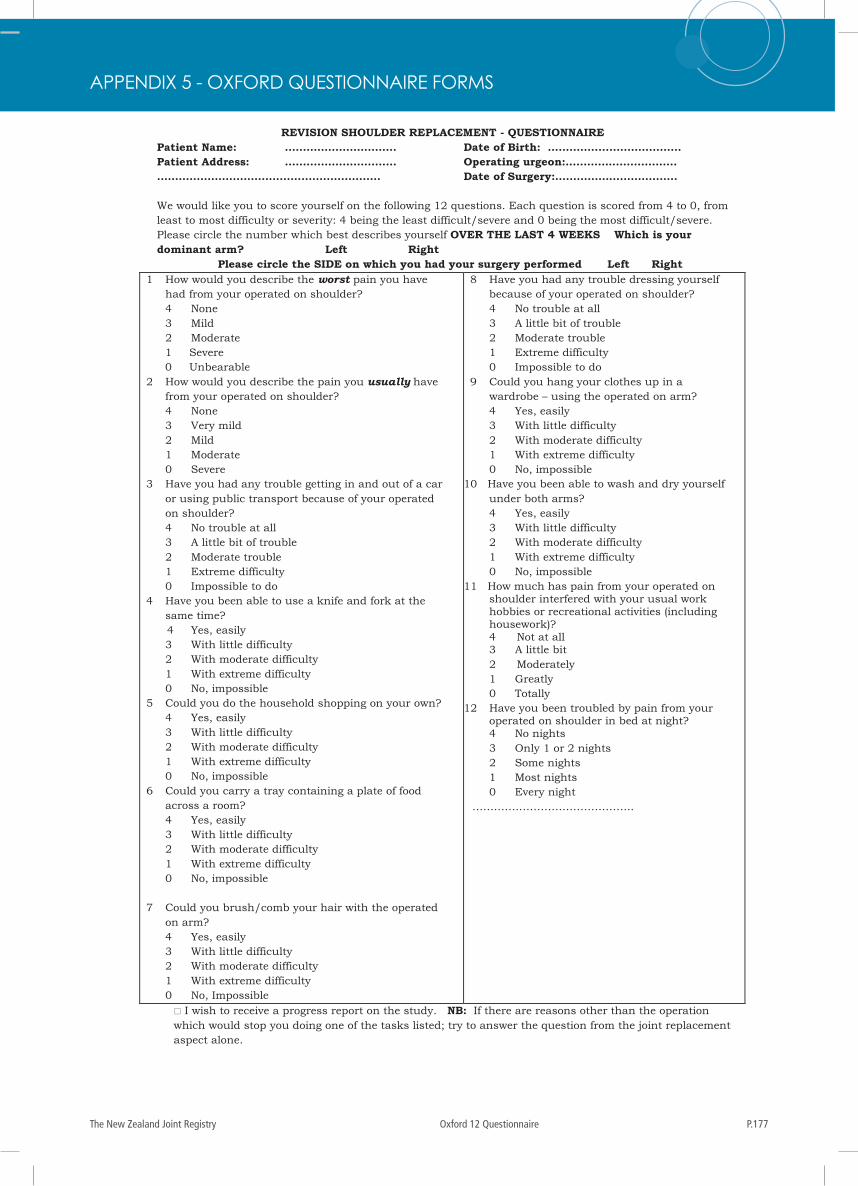
P.177The New Zealand Joint Registry Oxford 12 Questionnaire
The New Zealand Joint Registry Oxford 12 Questionnaire 226 of 228
REVISION SHOULDER REPLACEMENT - QUESTIONNAIRE Patient Name: …………………………. Date of Birth: …..………………………….. Patient Address: …………………………. Operating urgeon:…………………………. ………………………….…………………………. Date of Surgery:……………………………. We would like you to score yourself on the following 12 questions. Each question is scored from 4 to 0, from least to most difficulty or severity: 4 being the least difficult/severe and 0 being the most difficult/severe. Please circle the number which best describes yourself OVER THE LAST 4 WEEKS Which is your dominant arm? Left Right
Please circle the SIDE on which you had your surgery performed Left Right 1 How would you describe the worst pain you have
had from your operated on shoulder? 4 None 3 Mild 2 Moderate
1 Severe 0 Unbearable
2 How would you describe the pain you usually have from your operated on shoulder?
4 None 3 Very mild 2 Mild 1 Moderate 0 Severe 3 Have you had any trouble getting in and out of a car
or using public transport because of your operated on shoulder?
4 No trouble at all 3 A little bit of trouble 2 Moderate trouble 1 Extreme difficulty 0 Impossible to do 4 Have you been able to use a knife and fork at the
same time? 4 Yes, easily 3 With little difficulty 2 With moderate difficulty 1 With extreme difficulty 0 No, impossible 5 Could you do the household shopping on your own? 4 Yes, easily 3 With little difficulty 2 With moderate difficulty 1 With extreme difficulty 0 No, impossible 6 Could you carry a tray containing a plate of food
across a room? 4 Yes, easily 3 With little difficulty 2 With moderate difficulty 1 With extreme difficulty 0 No, impossible 7 Could you brush/comb your hair with the operated
on arm? 4 Yes, easily 3 With little difficulty 2 With moderate difficulty 1 With extreme difficulty 0 No, Impossible
8 Have you had any trouble dressing yourself because of your operated on shoulder?
4 No trouble at all 3 A little bit of trouble 2 Moderate trouble 1 Extreme difficulty 0 Impossible to do 9 Could you hang your clothes up in a
wardrobe – using the operated on arm? 4 Yes, easily 3 With little difficulty 2 With moderate difficulty 1 With extreme difficulty 0 No, impossible
10 Have you been able to wash and dry yourself under both arms?
4 Yes, easily 3 With little difficulty 2 With moderate difficulty 1 With extreme difficulty 0 No, impossible 11 How much has pain from your operated on
shoulder interfered with your usual work hobbies or recreational activities (including housework)? 4 Not at all
3 A little bit 2 Moderately 1 Greatly 0 Totally 12 Have you been troubled by pain from your
operated on shoulder in bed at night? 4 No nights 3 Only 1 or 2 nights 2 Some nights 1 Most nights 0 Every night
………….…………………………..
I wish to receive a progress report on the study. NB: If there are reasons other than the operation which would stop you doing one of the tasks listed; try to answer the question from the joint replacement aspect alone.
APPENDIX 5 - OXFORD QUESTIONNAIRE FORMS
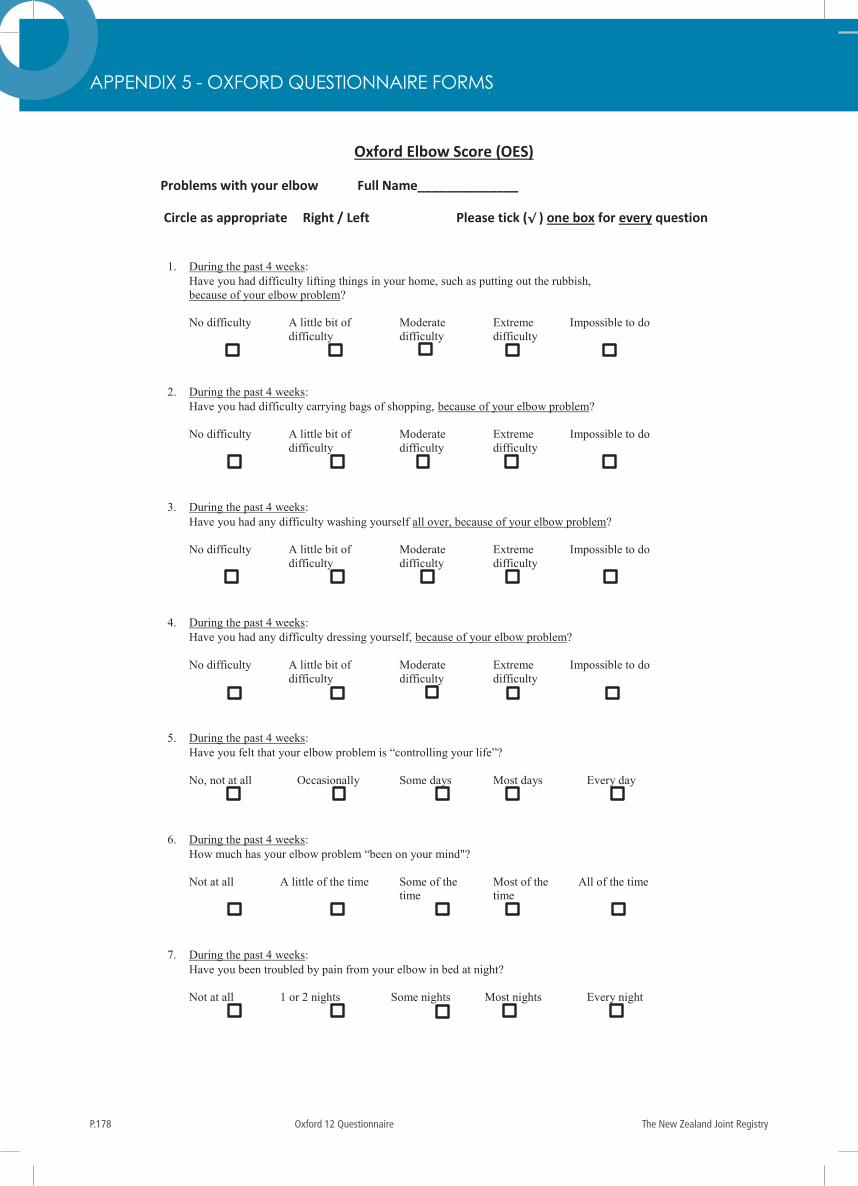
The New Zealand Joint RegistryP.178 Oxford 12 Questionnaire
227 of 228 Oxford 12 Questionnaire The New Zealand Joint Registry
Oxford Elbow Score (OES)
Problems with your elbow Full Name______________
Circle as appropriate Right / Left Please tick (√ ) one box for every question
1. During the past 4 weeks: Have you had difficulty lifting things in your home, such as putting out the rubbish, because of your elbow problem? No difficulty A little bit of
difficulty Moderate difficulty
Extreme difficulty
Impossible to do
2. During the past 4 weeks: Have you had difficulty carrying bags of shopping, because of your elbow problem? No difficulty A little bit of
difficulty Moderate difficulty
Extreme difficulty
Impossible to do
3. During the past 4 weeks:
Have you had any difficulty washing yourself all over, because of your elbow problem? No difficulty A little bit of
difficulty Moderate difficulty
Extreme difficulty
Impossible to do
4. During the past 4 weeks:
Have you had any difficulty dressing yourself, because of your elbow problem? No difficulty A little bit of
difficulty Moderate difficulty
Extreme difficulty
Impossible to do
5. During the past 4 weeks:
Have you felt that your elbow problem is “controlling your life”? No, not at all Occasionally Some days Most days Every day
6. During the past 4 weeks:
How much has your elbow problem “been on your mind"? Not at all A little of the time Some of the
time Most of the time
All of the time
7. During the past 4 weeks:
Have you been troubled by pain from your elbow in bed at night? Not at all 1 or 2 nights Some nights Most nights Every night
APPENDIX 5 - OXFORD QUESTIONNAIRE FORMS
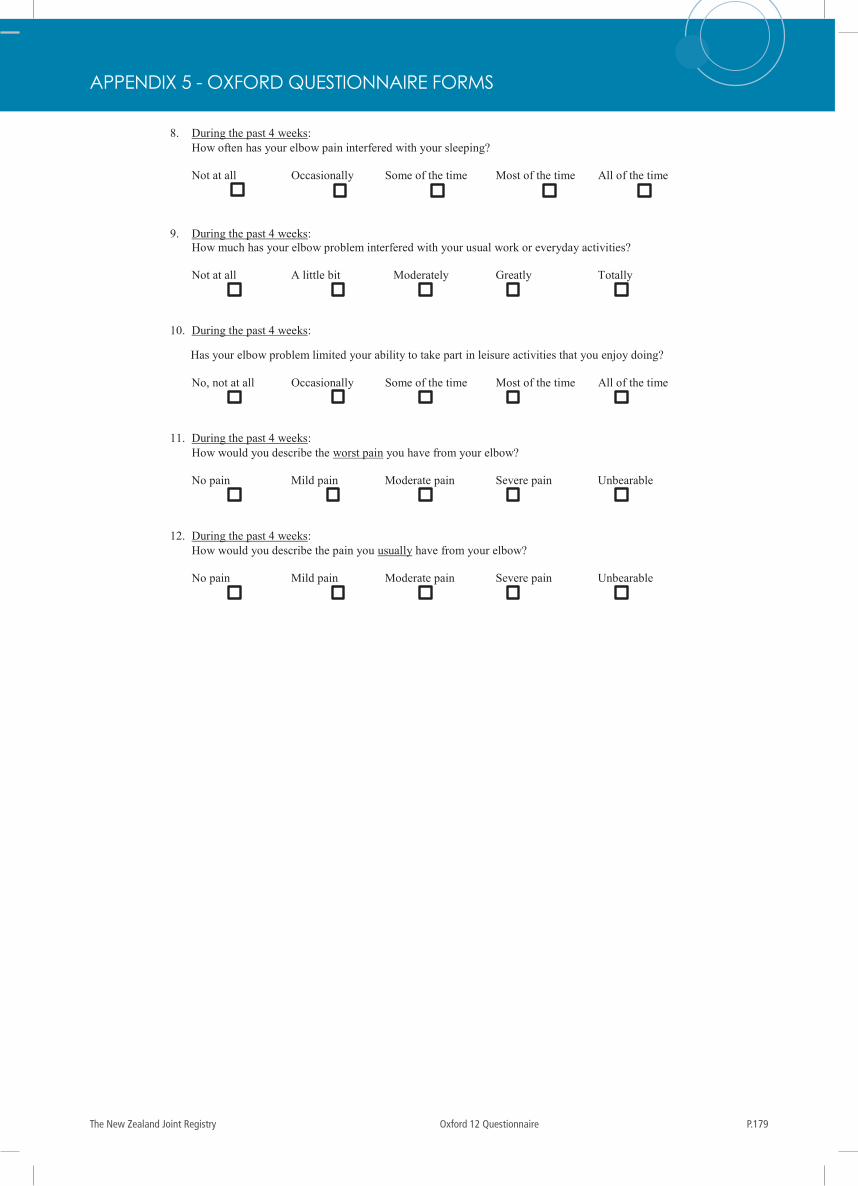
P.179The New Zealand Joint Registry Oxford 12 Questionnaire
The New Zealand Joint Registry Oxford 12 Questionnaire 228 of 228
8. During the past 4 weeks: How often has your elbow pain interfered with your sleeping? Not at all Occasionally Some of the time Most of the time All of the time
9. During the past 4 weeks:
How much has your elbow problem interfered with your usual work or everyday activities? Not at all A little bit Moderately Greatly Totally
10. During the past 4 weeks:
Has your elbow problem limited your ability to take part in leisure activities that you enjoy doing?
No, not at all Occasionally Some of the time Most of the time All of the time
11. During the past 4 weeks: How would you describe the worst pain you have from your elbow? No pain Mild pain Moderate pain Severe pain Unbearable
12. During the past 4 weeks: How would you describe the pain you usually have from your elbow? No pain Mild pain Moderate pain Severe pain Unbearable
APPENDIX 5 - OXFORD QUESTIONNAIRE FORMS

The New Zealand Joint Registry Seventeen Year Report (January 1999 - December 2015)
www.nzoa.org.nz