the next giant leap - dept.aoe.vt.edusdross/talks/heliopolis-presentation.pdf · from...
TRANSCRIPT

Chad Kessens, Ryan McDaniel, Melahn Parker, Shane Ross,
Luke Voss
The Next Giant Leap
28 May 2002 2
Heliopolis Mission
To build a profitable, self-sustaining foothold
forhumanity in space

28 May 2002 3
Heliopolis:Space Business Park / Community
Support several industriesSolar power satellites (SPS)*Communications satellitesZero-gravity manufacturingTourismAsteroid miningCapacity for growth
(self-replication)Lunar L1 halo orbit
Continuous sunlightMoon-viewing for tourists
Necessary for future space infrastructure
*Only revenue from SPS modeled

28 May 2002 4
a
Heliopolis Development Timeline
2015
2040
Research and Development
begins
First launch
2020
2025
2035
2030
Heliopolis construction begins; Lunar Mass Driver operational
Permanent Heliopolis habitation
begins
Launch Asteroid retrieval mission
Asteroid arrives at Heliopolis
Heliopolis construction
complete
Accounting Profit
Economic Profit
PHASES: -1 0 1 2 3 4

28 May 2002 5
Phase 0 (2020-2021)Shanty Town Construction
ISS-like modules to L1Mass driver to Moon3-month crew rotations Cost: 35 B$ (Y2K)People: 0-100
Shanty Town (Earth-Moon L1)
MoonResources
SunEnergy
EarthPeople and Resources

28 May 2002 6
Phase 1 (2021-2022)Begin Construction of Heliopolis
Build first permanent habitation modulesConstruction materials from Moon3-month crew rotationsCost: 27 B$People: 100-1150-5% complete
Heliopolis
Moon
Sun
Earth

28 May 2002 7
Intermediate Construction Stage
Permanent habitationManufacture of SPSs/CommsatsLaunch asteroid retrieverCost: 151 B$Revenue: 343 B$People: 115-3415-62% complete
Phase 2 (2022-2032)
Heliopolis
Moon
Asteroid
SunGEOProducts
Earth

28 May 2002 8
Phase 3 (2032-2039)Final Construction Stage
Asteroid returned Heliopolis essentially self-sufficientCost: 50 B$Revenue: 850 B$People: 1500-290062-100% complete
Heliopolis
Moon
Asteroid
SunGEO
Earth
28 May 2002 9
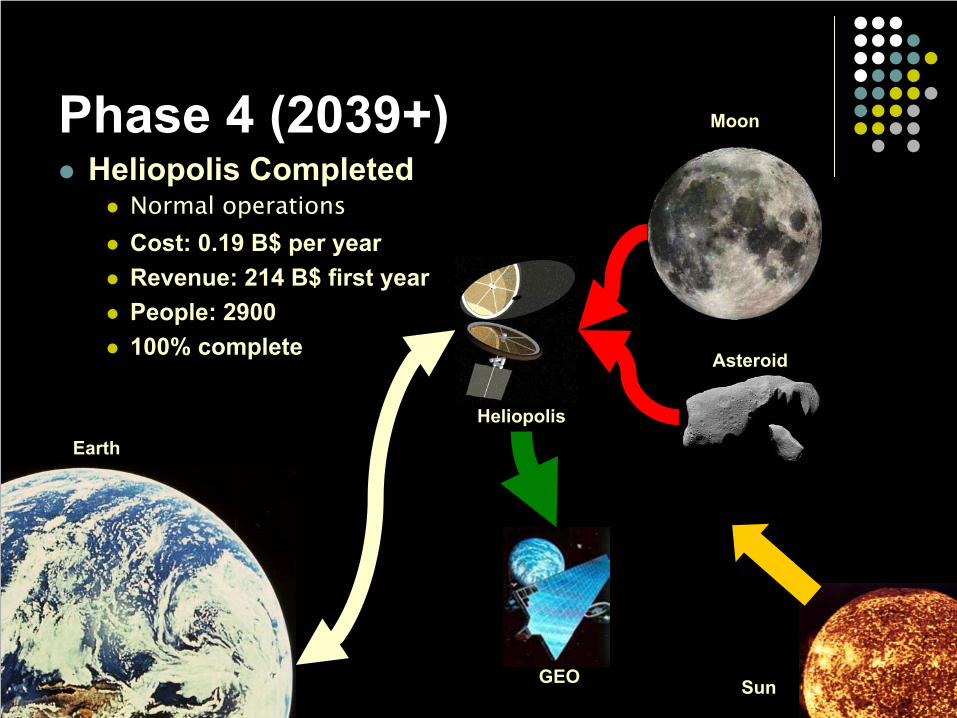
Phase 4 (2039+)Heliopolis Completed
Normal operationsCost: 0.19 B$ per yearRevenue: 214 B$ first yearPeople: 2900100% complete
Heliopolis
Moon
Asteroid
SunGEO
Earth
28 May 2002 10
Infrastructure RequirementsModule fabrication facilityHeavy-lift launch vehicle (HLLV) servicesLunar mass driverInter-orbital shuttleGround receiver arrays (rectennas)
28 May 2002 11
Technology RequirementsEnabling Technology
250-tonne-to-LEO class HLLVImproved automationNuclear reactor in spaceClosed-loop recycling
Enhancing Technology
SEP using O2Nuclear thermal propulsionImproved PowerSailefficiencyMass driver propulsionSelf-Replicating Machines

28 May 2002 12
Cash Flow Analysis (log scale)
Chad
1014
1012
1010
108
-108
-1010
-1012
0
$Y2K

28 May 2002 13
Alaska Pipeline Comparison
94.5 MBTUsdelivered
3 B$
10.3 B$
2.21 years
22.7 B$
Alaska Pipeline
233 MBTUsproduced1
Energy supplied per year2
214 B$1Avg. profit per year
7 B$Avg. cost per year before revenue
15 yearsTime to revenue
105 B$Cost before revenue
Heliopolis
1Beginning of Phase 42World demand of 612 QBTUs in 2020

28 May 2002 14
Three Gorges Dam Comparison
0.54 MBTUsdelivered
62.8 B$3
1.33 B$
20 years
26.6 B$
Three Gorges Dam
233 MBTUsproduced1
Energy supplied per year2
214 B$1Avg. profit per year
7 B$Avg. cost per year before revenue
15 yearsTime to revenue
105 B$Cost before revenue
Heliopolis
1Beginning of Phase 42World demand of 612 QBTUs in 20203Revenue; profit figures unavailable
28 May 2002 15
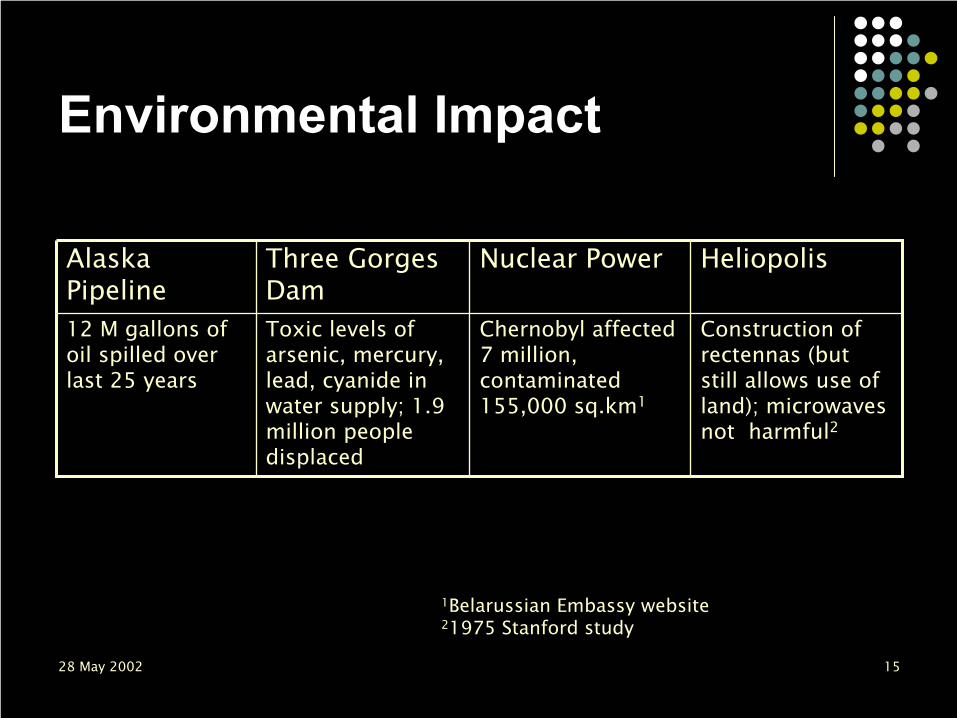
Environmental Impact
Chernobyl affected 7 million, contaminated 155,000 sq.km1
Nuclear Power
Construction of rectennas (but still allows use of land); microwaves not harmful2
Toxic levels of arsenic, mercury, lead, cyanide in water supply; 1.9 million people displaced
12 M gallons of oil spilled over last 25 years
HeliopolisThree Gorges Dam
Alaska Pipeline
1Belarussian Embassy website21975 Stanford study
28 May 2002 16
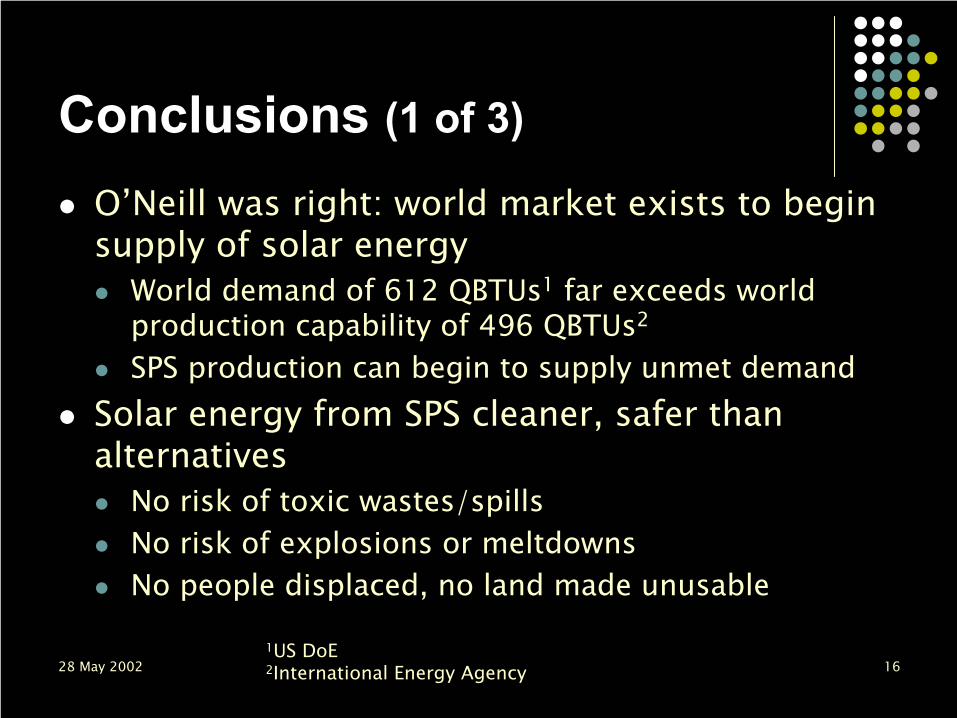
Conclusions (1 of 3)
O’Neill was right: world market exists to begin supply of solar energy
World demand of 612 QBTUs1 far exceeds world production capability of 496 QBTUs2
SPS production can begin to supply unmet demandSolar energy from SPS cleaner, safer than alternatives
No risk of toxic wastes/spillsNo risk of explosions or meltdownsNo people displaced, no land made unusable
1US DoE2International Energy Agency

28 May 2002 17
Conclusions (2 of 3)
LSMD study comparable to 1975 Stanford studyDifferences reflect 25 years of technological advances
However: LSMD study represents fundamentally new analysis
Integrated cost model demonstrates project’s economic feasibility
Technology exists or can be designed to begin project in the next 20 years
28 May 2002 18
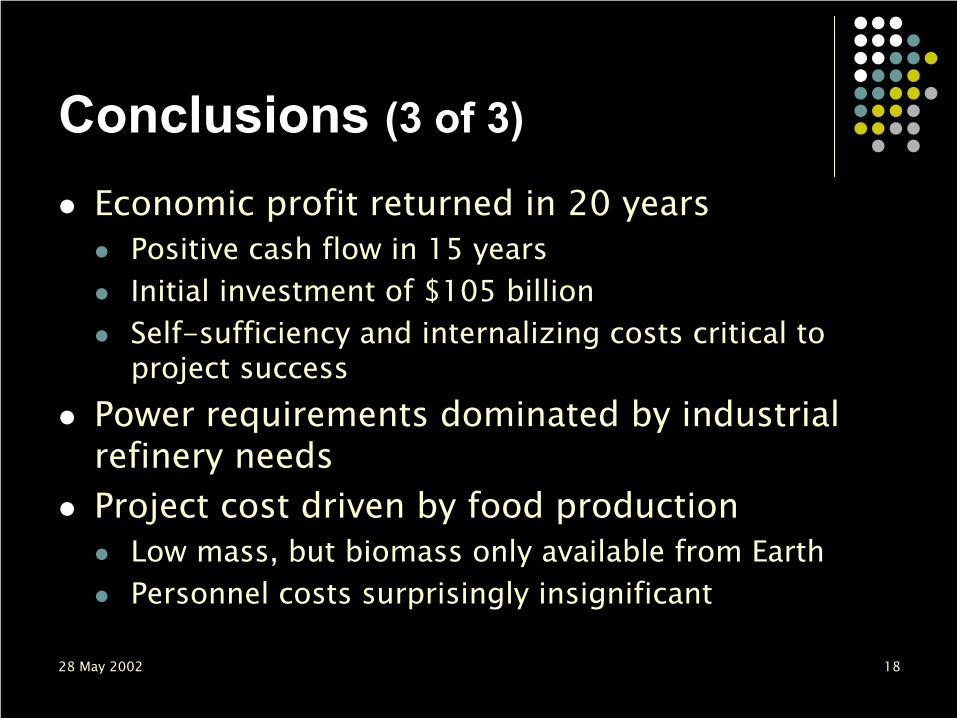
Conclusions (3 of 3)
Economic profit returned in 20 yearsPositive cash flow in 15 yearsInitial investment of $105 billionSelf-sufficiency and internalizing costs critical to project success
Power requirements dominated by industrial refinery needsProject cost driven by food production
Low mass, but biomass only available from EarthPersonnel costs surprisingly insignificant
28 May 2002 19
Technical Study: OverviewDesign Problems/Requirements & SolutionsShanty Town DescriptionHeliopolis DescriptionSystem-Level SummaryDiscussion of Economic ModelExplanation of Subsystem ModelsSummary

28 May 2002 20
Orbit Requirements & OptionsRequirementsRequirements
Fast and cheap access toEarth (employees, tourists)Resources (Moon, near-Earth asteroids) Market (geosynchronous orbit for SPSs)
Continuous sunlightDependent on solar energy
Favorable to touristsFavorable radiation environment
OptionsOptionsLow Earth Orbit (ISS-like, LEO)Sun-Synchronous OrbitHighly Elliptical Earth OrbitGeosynchronous orbit (GEO)EarthEarth--Moon L1 halo orbitMoon L1 halo orbit
28 May 2002 21
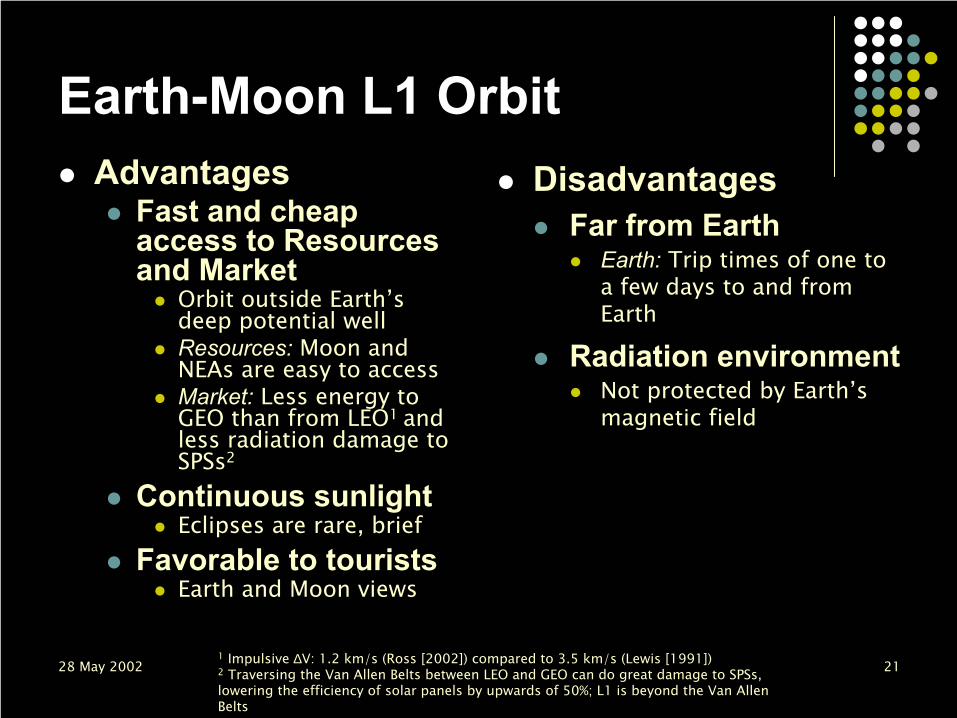
Earth-Moon L1 OrbitAdvantages
Fast and cheap access to Resources and Market
Orbit outside Earth’s deep potential wellResources: Moon and NEAs are easy to accessMarket: Less energy to GEO than from LEO1 and less radiation damage to SPSs2
Continuous sunlightEclipses are rare, brief
Favorable to touristsEarth and Moon views
DisadvantagesFar from Earth
Earth: Trip times of one to a few days to and from Earth
Radiation environmentNot protected by Earth’s magnetic field
1 Impulsive ∆V: 1.2 km/s (Ross [2002]) compared to 3.5 km/s (Lewis [1991]) 2 Traversing the Van Allen Belts between LEO and GEO can do great damage to SPSs, lowering the efficiency of solar panels by upwards of 50%; L1 is beyond the Van Allen Belts
28 May 2002 22
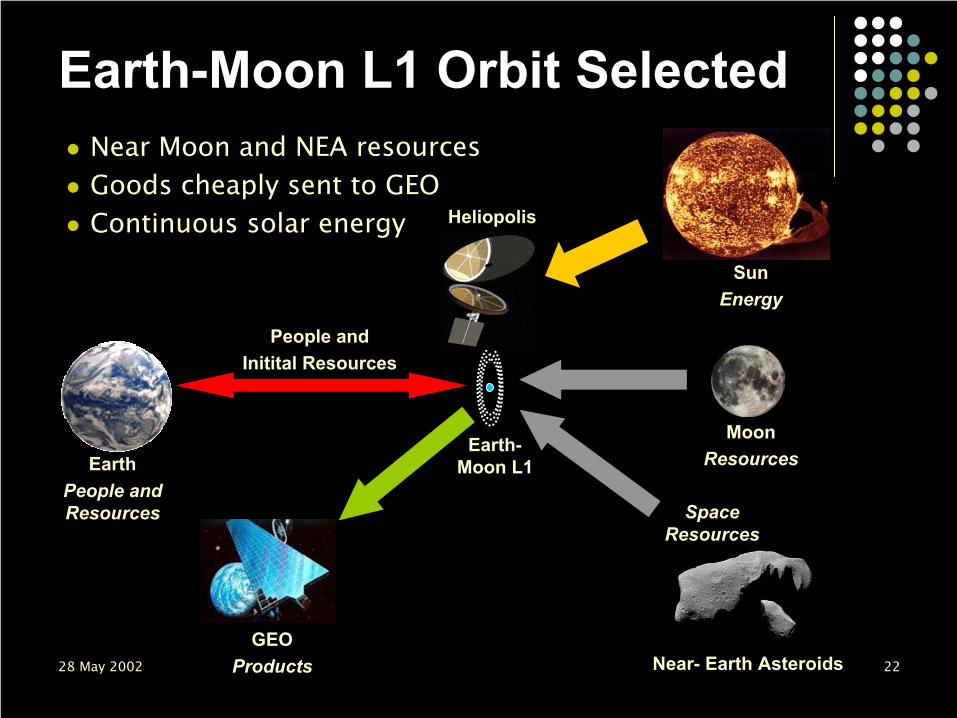
Earth-Moon L1 Orbit Selected
Earth-Moon L1
People and Initital Resources
MoonResources
Near- Earth Asteroids
SpaceResources
SunEnergy
GEOProducts
Heliopolis
Near Moon and NEA resources Goods cheaply sent to GEOContinuous solar energy
EarthPeople and Resources

28 May 2002 23
Space HighwaysFrom L1, can access the InterPlanetary Superhighway
Low fuel transfers to/from Earth-Moon spaceUses natural pathways connecting Lagrange points in Sun-Earth-Moon system
M.W. Lo and S.D. Ross [2001] The Lunar L1 Gateway: Portal to the Stars and Beyond. AIAA Space 2001 Conference, Albequerque, New Mexico, 2001 (after Farquhar [1977]).

28 May 2002 24
Space HighwaysEarth-Moon L1 Halo Orbit “Portal”
Low fuel access to lunar orbit, Earth orbit, and beyondNear-Earth asteroid retrieval
EARTH
MOON
LUNAR L1HALO ORBIT “PORTAL”
LUNAR L2HALO ORBIT
EARTH L2HALO ORBIT
M.W. Lo and S.D. Ross [2001] The Lunar L1 Gateway: Portal to the Stars and Beyond. AIAA Space 2001 Conference, Albequerque, New Mexico, 2001.

28 May 2002 25
Space HighwaysLEO to Earth-Moon L1
Expends 30% less on-board fuel than a Hohmanntransfer
Ross, S. D. [2002] Low energy transfers to the moon using resonance targeting, in preparation.

28 May 2002 26
Radiation EnvironmentEarth-Moon L1
Not protected by Earth’s magnetic fieldMostly unidirectional field of solar cosmic rays
High energy (1 GeV) protons, electrons, and heavy nuclei
Significant shielding necessary
12 cm Aluminum1
Slag from refining => thick shielding2 (~ 2 m)1 Adapted from Tascione [1994], assuming shielding proportional to exp(-t),
where t is shield thickness and keeping dose below 0.25 rem/year2 Assuming slag from refining has the same shielding ability as lunar regolith
28 May 2002 27
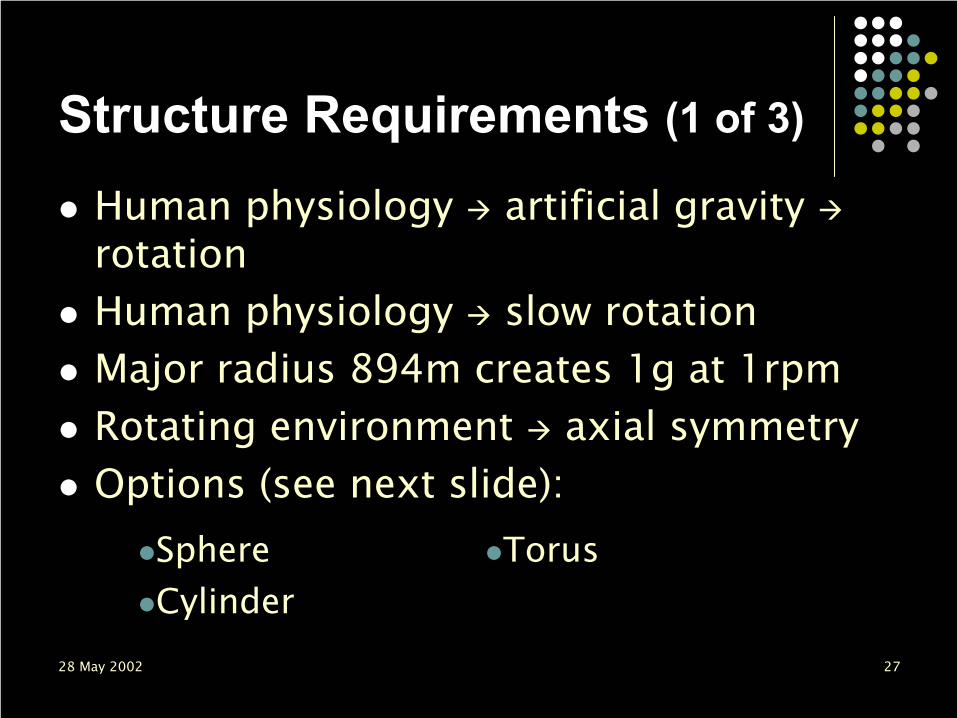
Structure Requirements (1 of 3)
Human physiology artificial gravity rotationHuman physiology slow rotationMajor radius 894m creates 1g at 1rpmRotating environment axial symmetryOptions (see next slide):
CylinderTorusSphere
28 May 2002 28
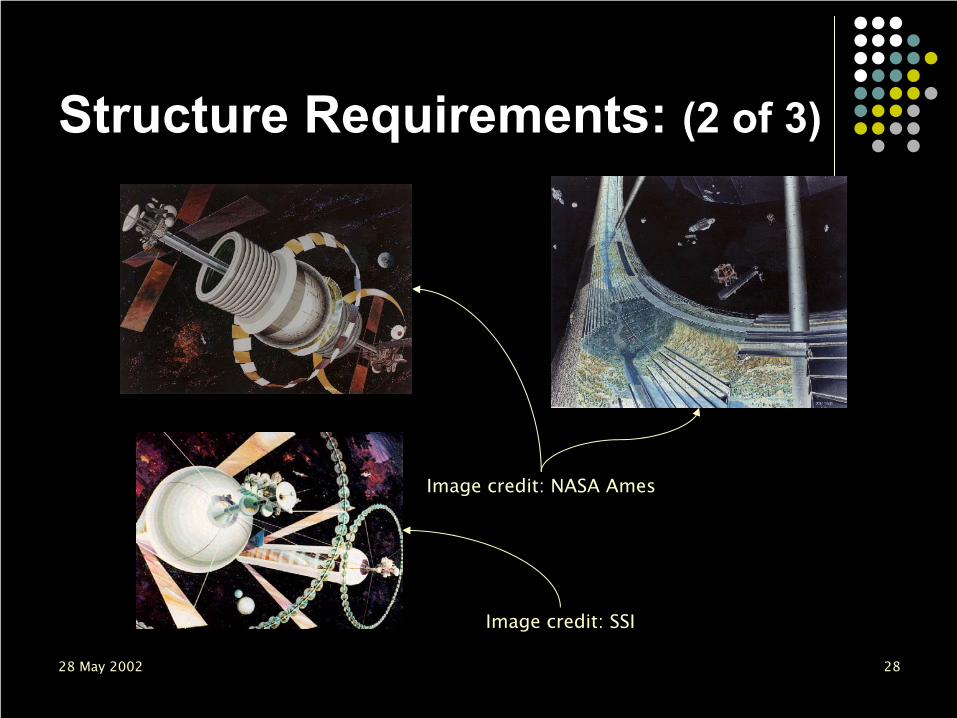
Structure Requirements: (2 of 3)
Image credit: NASA Ames
Image credit: SSI
28 May 2002 29
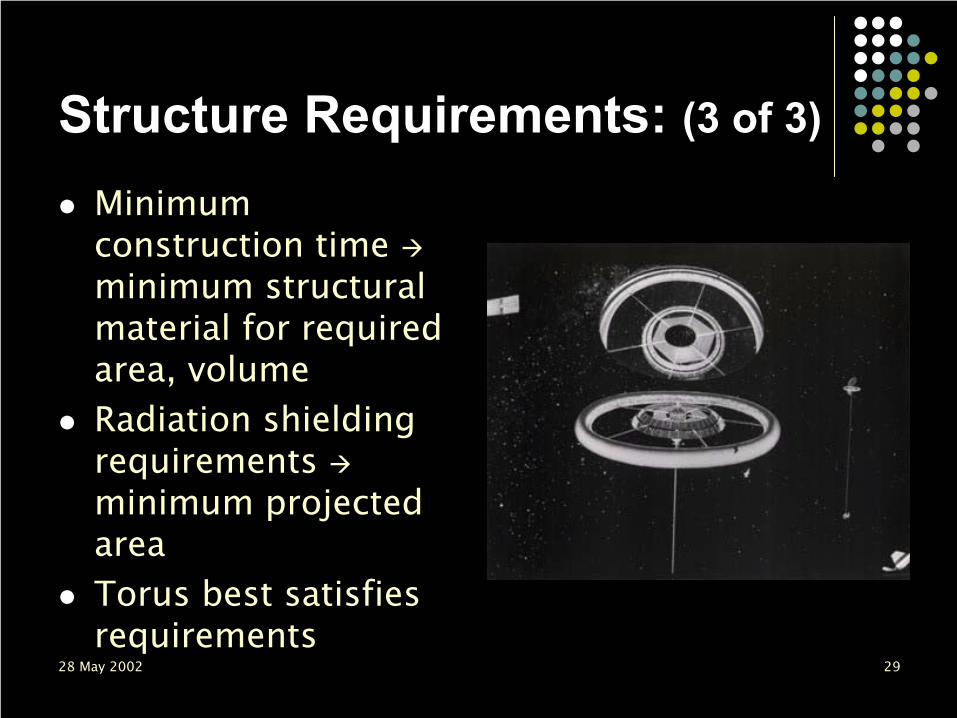
Structure Requirements: (3 of 3)
Minimum construction time minimum structural material for required area, volumeRadiation shielding requirements minimum projected areaTorus best satisfies requirements

28 May 2002 30
Technical Study: OverviewDesign Problems/Requirements & SolutionsShanty Town DescriptionHeliopolis DescriptionSystem-Level SummaryDiscussion of Economic ModelExplanation of Subsystem ModelsSummary

28 May 2002 31
Initial Construction Phase: Requirements
Earth-built, Earth-launched componentsMinimum time to first launchMinimum development costFacility must be at L1
Need a HLLV1 capable of launching to this altitude
Solution: “Shanty Town” (see next slide)
1Heavy-Lift Launch Vehicle

28 May 2002 32
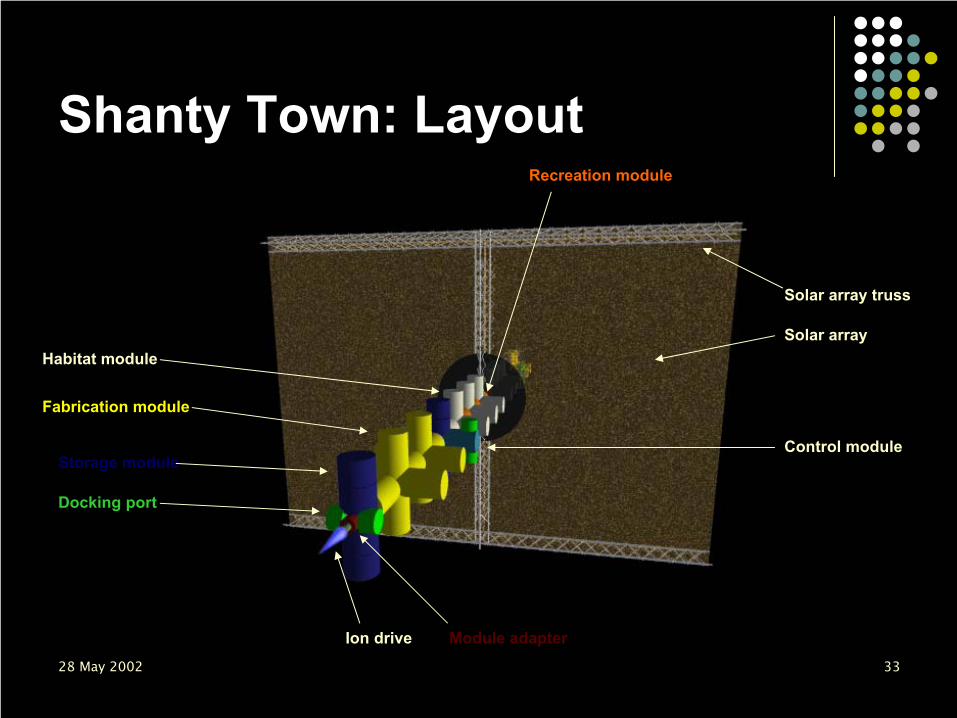
Shanty Town: OverviewAssembled primarily from build-to-print ISS modules~100 people inhabit 17 “Zvezda” style modules63 fabrication modules begin construction of Heliopolis25 connectors, 50 storage modules, 8 docking ports, and 3 “recreation” modules complete the station
Recreation0%
Storage1%
Fabrication93%
Solar Arrays2%
Docking Ports0%
Module Adapters
2%Habitat
2%
Shanty Town Mass Breakdown
Total Mass 16,760 tonnes
28 May 2002 33
Shanty Town: Layout
Solar array truss
Solar array
Ion drive
Habitat module
Fabrication module
Recreation module
Module adapter
Storage moduleControl module
Docking port
28 May 2002 34
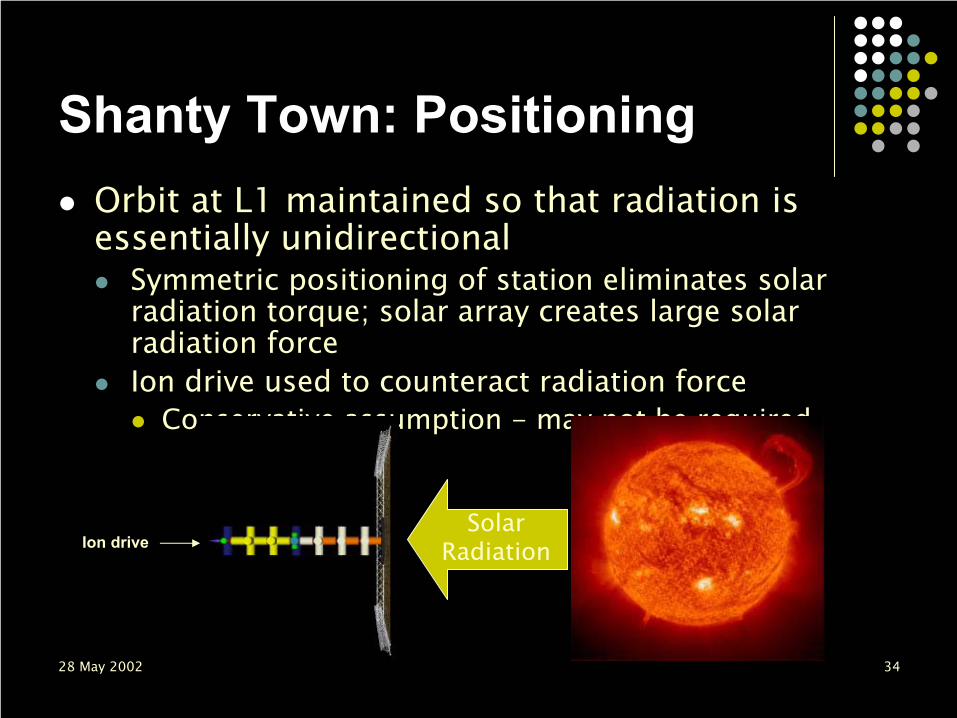
Shanty Town: PositioningOrbit at L1 maintained so that radiation is essentially unidirectional
Symmetric positioning of station eliminates solar radiation torque; solar array creates large solar radiation forceIon drive used to counteract radiation force
Conservative assumption - may not be required
SolarRadiationIon drive

28 May 2002 35
Technical Study: OverviewDesign Problems/Requirements & SolutionsShanty Town DescriptionHeliopolis DescriptionSystem-Level SummaryDiscussion of Economic ModelExplanation of Subsystem ModelsSummary

28 May 2002 36
HeliopolisToroid structure of double-walled aluminumMaterial largely extraterrestrial20 years to build894.3m (ro) x 36m (ri)4.1M m3 internal volume212,000 tonnes total mass
28 May 2002 37
Heliopolis (cont.)Self-sufficient (except for limited specific goods)Construction platform for Earth-orbit and extraterrestrial consumptionStaging post for deep space missions

28 May 2002 38
Industrial-Tourist ComplexThe industries were selected for their economic feasibility, usefulness, and ease of integration with the space colony’s goals and purposeAsteroid Mining – Provides raw materials for colony construction and space undertakings, and rare metals as cash crop for EarthManufacturing – Initially directed towards station construction; later produces consumer goods for use in space, or exotic goods for export to EarthSPS, Climate Control – Uses assembly bays and raw materials required for colony construction and returns power and productive climate to EarthTourism – Habitat for colony workers doubles as a recreational hotel with scenic excursions to the industry facilities and into space

28 May 2002 39
Industry Interdependencies
Tourism
Climate Control
Manufacturing
Mining
SPS
Rare elements
To Earth
Tame nature
Power
Goods
Raw materials
To Earth
To Earth
To Earth
28 May 2002 40
Technical Study: OverviewDesign Problems/Requirements & SolutionsShanty Town DescriptionHeliopolis DescriptionSystem-Level SummaryDiscussion of Economic ModelExplanation of Subsystem ModelsSummary

28 May 2002 41
Heliopolis
Personnel Life Support
Space Environment
Habitat Power Industrial
Transportation
Structures Systems
Atmosphere Recycling
FoodProduction
Attitude/Orbit
Radiation Shielding
Refining Milling & Primary
Manufacturing
Thermal
Functional/Work Decomposition
Luke
Melahn
Ryan
Shane
Cost &Revenue
Chad
Not represented as a model

28 May 2002 42
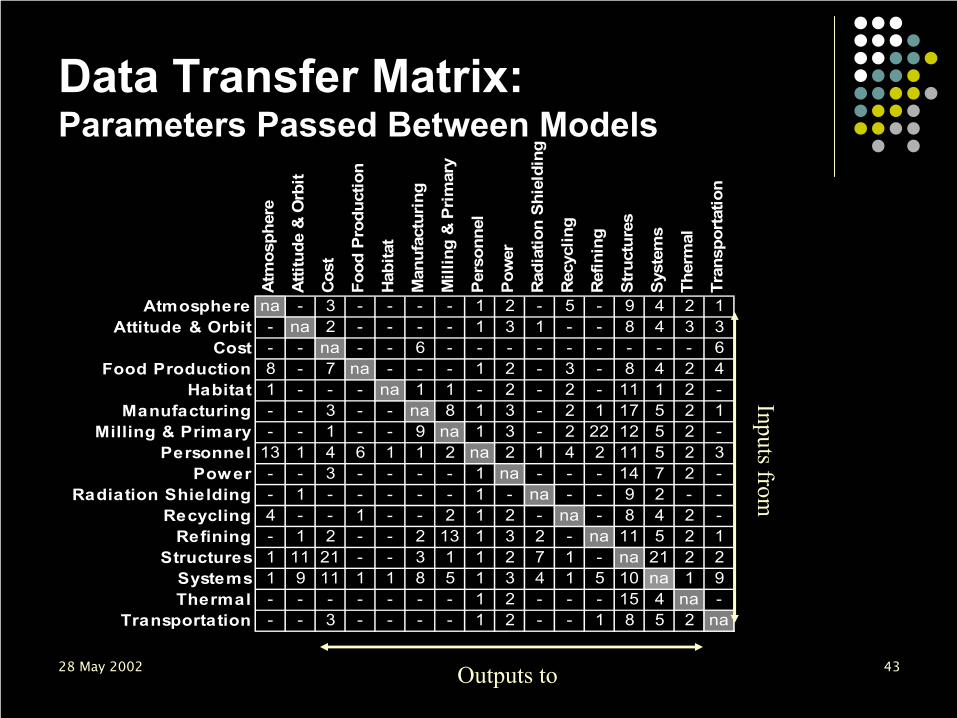
Model InterfaceModels exchange a set of parameters among themselvesRepresented graphically for rapid understandingApproximately 515 exchange parameters (see next chart)
28 May 2002 43
Data Transfer Matrix:Parameters Passed Between Models
Atm
osph
ere
Attit
ude
& O
rbit
Cost
Food
Pro
duct
ion
Habi
tat
Man
ufac
turin
g
Mill
ing
& Pr
imar
y
Pers
onne
l
Pow
er
Radi
atio
n Sh
ield
ing
Recy
clin
g
Refin
ing
Stru
ctur
es
Syst
ems
Ther
mal
Tran
spor
tatio
n
Atmosphere na - 3 - - - - 1 2 - 5 - 9 4 2 1Attitude & Orbit - na 2 - - - - 1 3 1 - - 8 4 3 3
Cost - - na - - 6 - - - - - - - - - 6Food Production 8 - 7 na - - - 1 2 - 3 - 8 4 2 4
Habitat 1 - - - na 1 1 - 2 - 2 - 11 1 2 -Manufacturing - - 3 - - na 8 1 3 - 2 1 17 5 2 1
Milling & Primary - - 1 - - 9 na 1 3 - 2 22 12 5 2 -Personnel 13 1 4 6 1 1 2 na 2 1 4 2 11 5 2 3
Power - - 3 - - - - 1 na - - - 14 7 2 -Radiation Shielding - 1 - - - - - 1 - na - - 9 2 - -
Recycling 4 - - 1 - - 2 1 2 - na - 8 4 2 -Refining - 1 2 - - 2 13 1 3 2 - na 11 5 2 1
Structures 1 11 21 - - 3 1 1 2 7 1 - na 21 2 2Systems 1 9 11 1 1 8 5 1 3 4 1 5 10 na 1 9Thermal - - - - - - - 1 2 - - - 15 4 na -
Transportation - - 3 - - - - 1 2 - - 1 8 5 2 na
Outputs to
Inputs from
28 May 2002 44
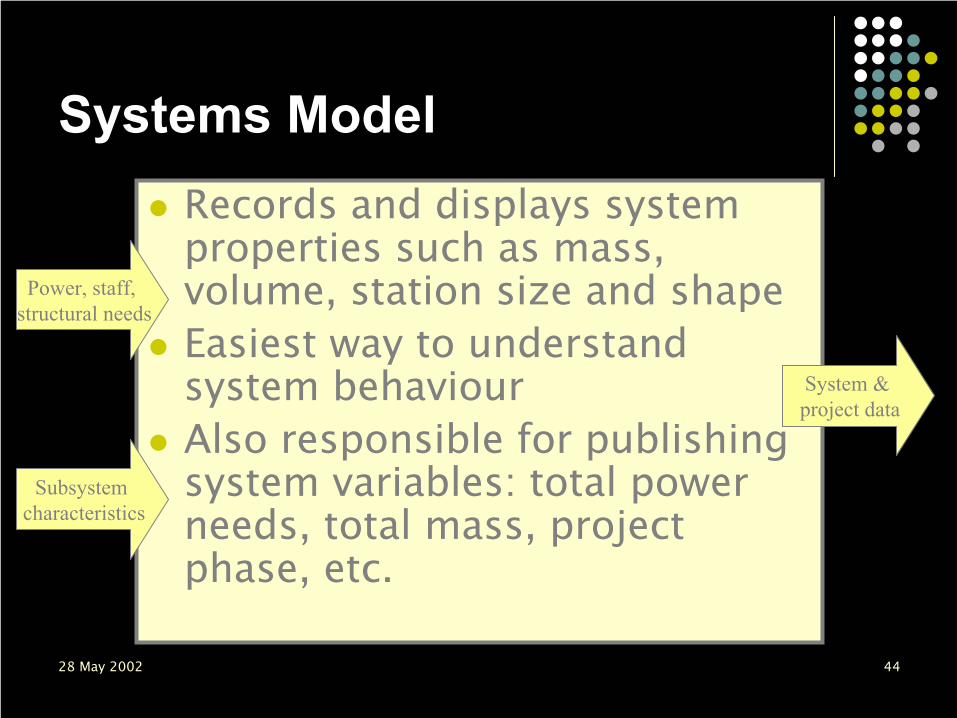
Systems ModelRecords and displays system properties such as mass, volume, station size and shapeEasiest way to understand system behaviourAlso responsible for publishing system variables: total power needs, total mass, project phase, etc.
Power, staff, structural needs
Subsystem characteristics
System & project data
28 May 2002 45
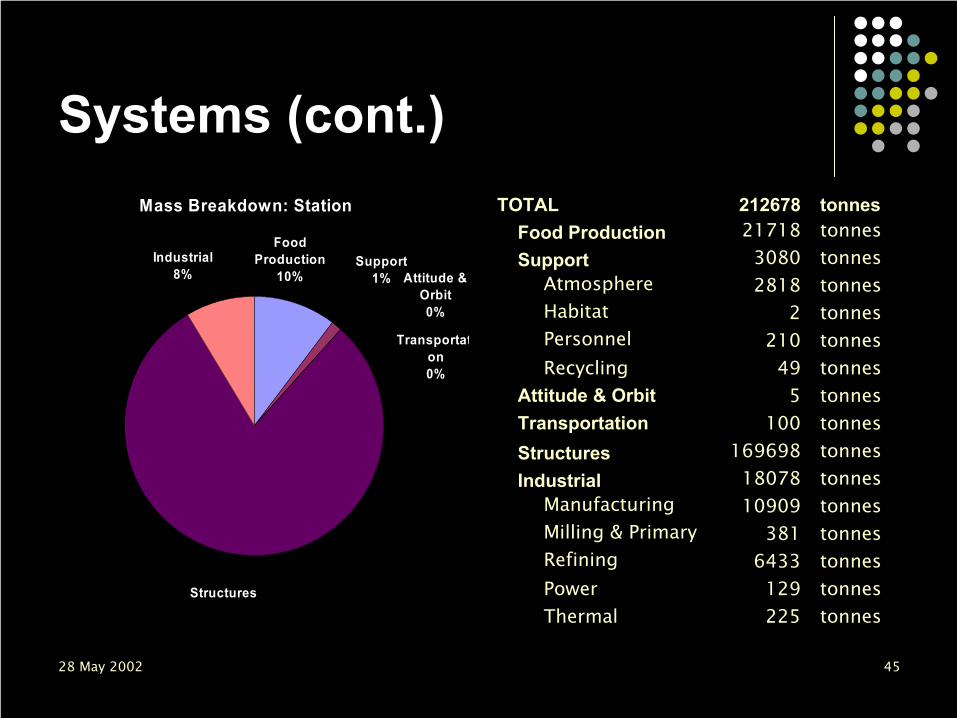
Systems (cont.)Mass Breakdown: Station
Industrial8%
Structures
Food Production
10%Support
1% Attitude & Orbit0%
Transportaton0%
tonnes225Thermaltonnes129Powertonnes6433Refiningtonnes381Milling & Primarytonnes10909Manufacturingtonnes18078Industrialtonnes169698Structurestonnes100Transportationtonnes5Attitude & Orbittonnes49Recyclingtonnes210Personneltonnes2Habitattonnes2818Atmospheretonnes3080Supporttonnes21718Food Productiontonnes212678TOTAL
28 May 2002 46
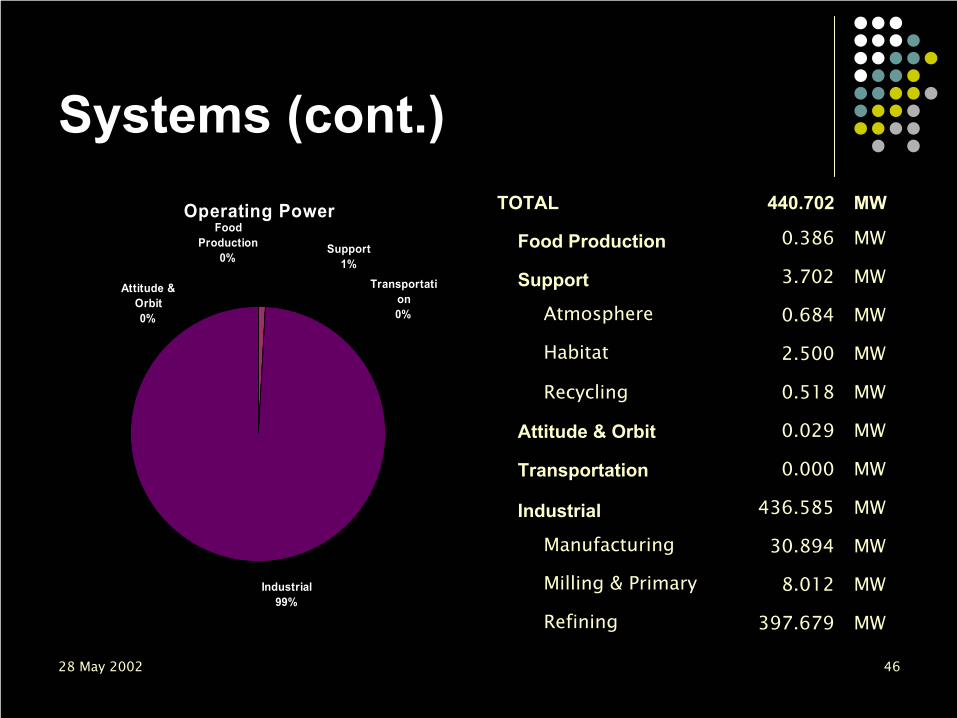
Systems (cont.)
MW397.679Refining
MW8.012Milling & Primary
MW30.894Manufacturing
MW436.585Industrial
MW0.000Transportation
MW0.029Attitude & Orbit
MW0.518Recycling
MW2.500Habitat
MW0.684Atmosphere
MW3.702Support
MW0.386Food Production
MW440.702TOTALOperating PowerFood
Production0%
Support1%
Attitude & Orbit0%
Industrial99%
Transportation0%
28 May 2002 47
Technical Study: OverviewDesign Problems/Requirements & SolutionsShanty Town DescriptionHeliopolis DescriptionSystem-Level SummaryDiscussion of Economic ModelExplanation of Subsystem ModelsSummary

28 May 2002 48
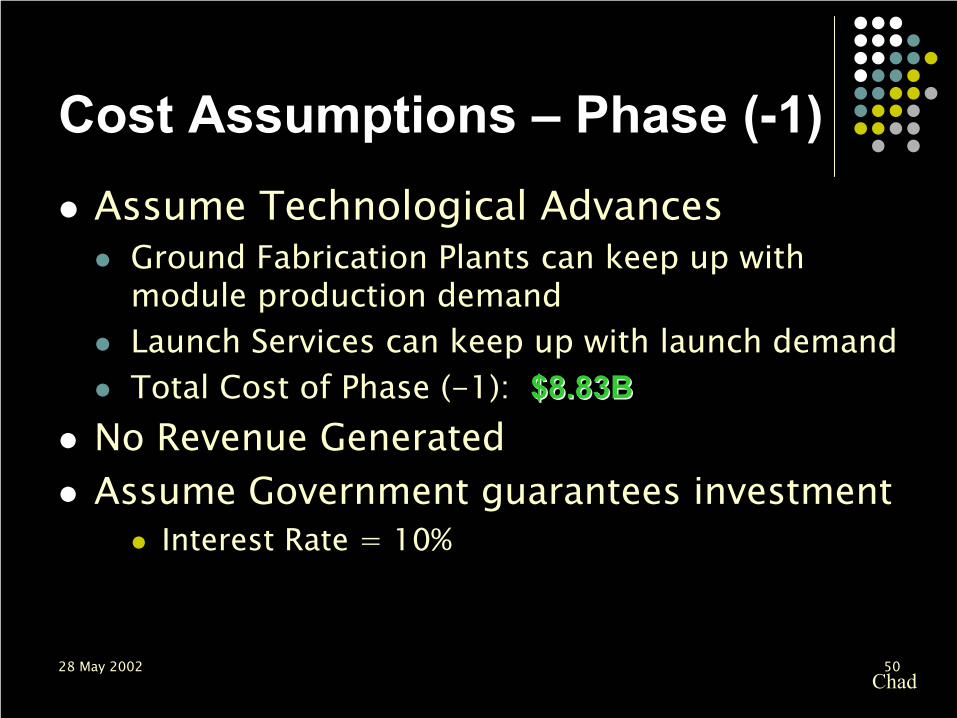
Cost Assumptions – Phase (-1)Phase (-1) – Research, Development, Design, and Testing
Start Date: 2015Duration: 5 yearsRDT&E = TFU * ICM * Launch Service Scalar
Assume most modules will be built to ISS specsHabitat, Adapter, Communications, Storage, DockingTheoretical First Unit (TFU) cost smallInitial Cost Multiplier (ICM) also small – using existing technology
Other modules scale as ratio of mass to ISS Habitat Module
Recreation, FabricationAssume TFU for Heliopolis is First Livable Section
Calculate TFU cost as cost of ISS scaled by mass ratioAssume development cost scales with launch cost
Reliability less important because easier to fix problemsMass less of a design concern
Chad
28 May 2002 49
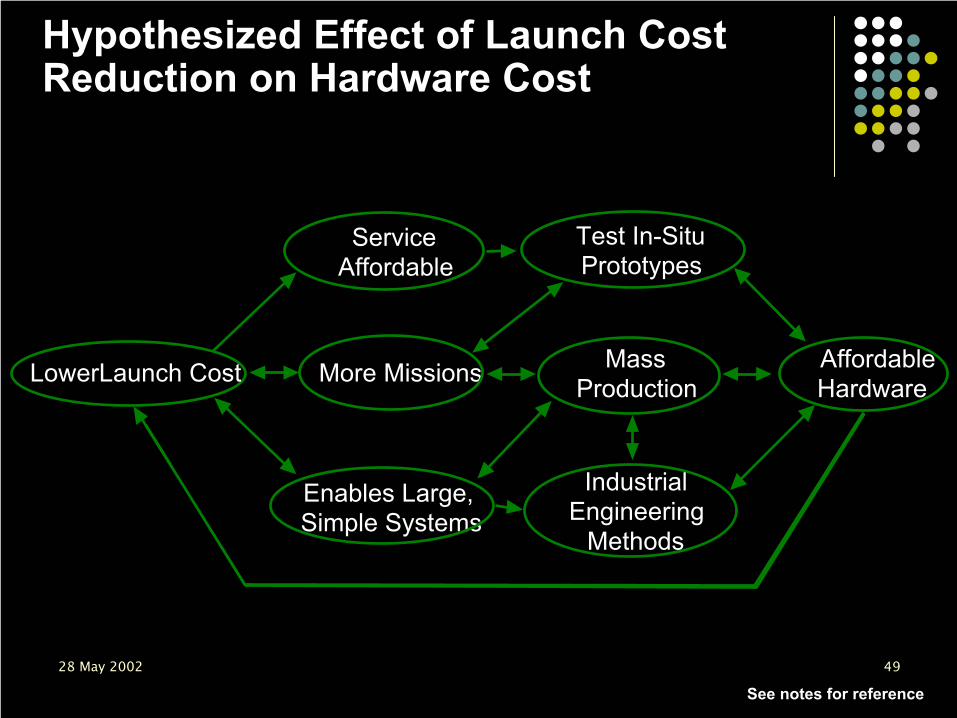
Hypothesized Effect of Launch Cost Reduction on Hardware Cost
LowerLaunch Cost
Enables Large, Simple Systems
ServiceAffordable
More Missions MassProduction
Test In-SituPrototypes
AffordableHardware
IndustrialEngineering
Methods
See notes for reference
28 May 2002 50
Cost Assumptions – Phase (-1)Assume Technological Advances
Ground Fabrication Plants can keep up with module production demandLaunch Services can keep up with launch demandTotal Cost of Phase (-1): $8.83B$8.83B
No Revenue GeneratedAssume Government guarantees investment
Interest Rate = 10%
Chad

28 May 2002 51
Cost – Phase (-1)
0.00
1,942.73
4,079.73
6,430.43
9,016.20
11,860.55
0.00
2,000.00
4,000.00
6,000.00
8,000.00
10,000.00
12,000.00
14,000.00
0 1 2 3 4 5
Year
M$Y
2K
Accumulated InterestBare Cost (excludes interest)Year's Total CostCumulative Cost
Assume total phase cost evenly distributed amongst years of phase
Chad
28 May 2002 52
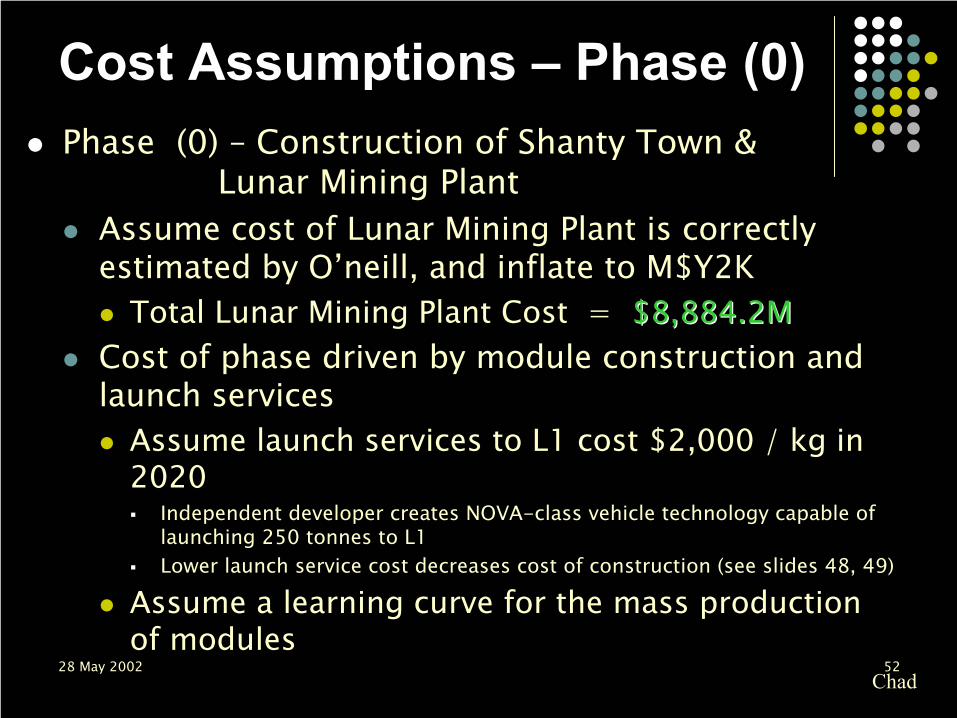
Cost Assumptions – Phase (0)Phase (0) – Construction of Shanty Town &
Lunar Mining PlantAssume cost of Lunar Mining Plant is correctly estimated by O’neill, and inflate to M$Y2K
Total Lunar Mining Plant Cost = $8,884.2M$8,884.2MCost of phase driven by module construction and launch services
Assume launch services to L1 cost $2,000 / kg in 2020
Independent developer creates NOVA-class vehicle technology capable of launching 250 tonnes to L1Lower launch service cost decreases cost of construction (see slides 48, 49)
Assume a learning curve for the mass production of modules
Chad
28 May 2002 53
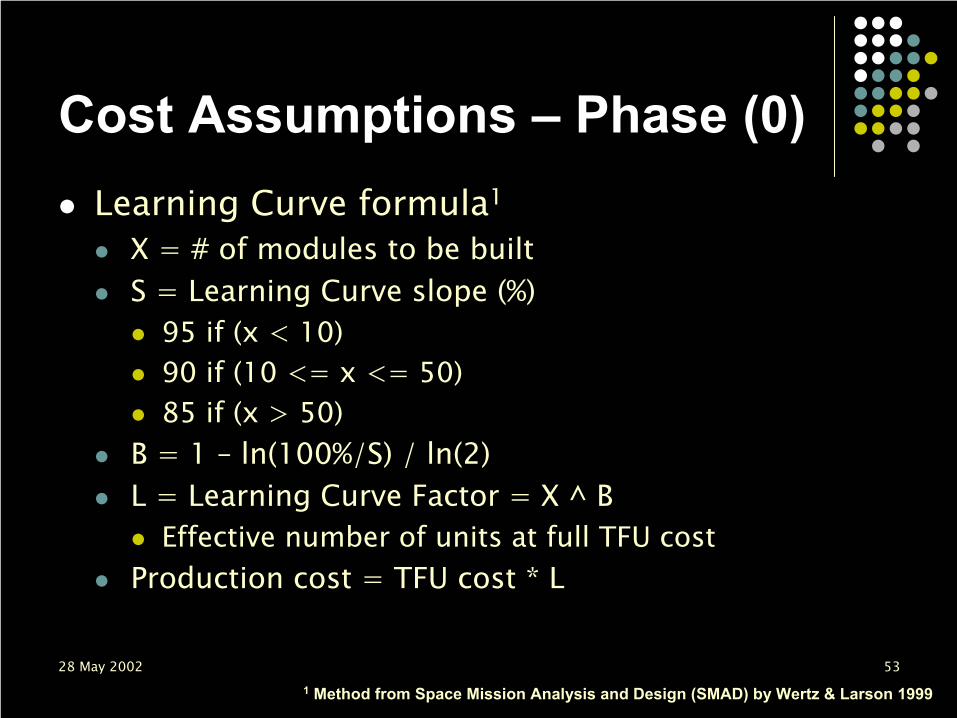
Cost Assumptions – Phase (0)Learning Curve formula1
X = # of modules to be builtS = Learning Curve slope (%)
95 if (x < 10)90 if (10 <= x <= 50)85 if (x > 50)
B = 1 – ln(100%/S) / ln(2)L = Learning Curve Factor = X ^ B
Effective number of units at full TFU costProduction cost = TFU cost * L
1 Method from Space Mission Analysis and Design (SMAD) by Wertz & Larson 1999
28 May 2002 54
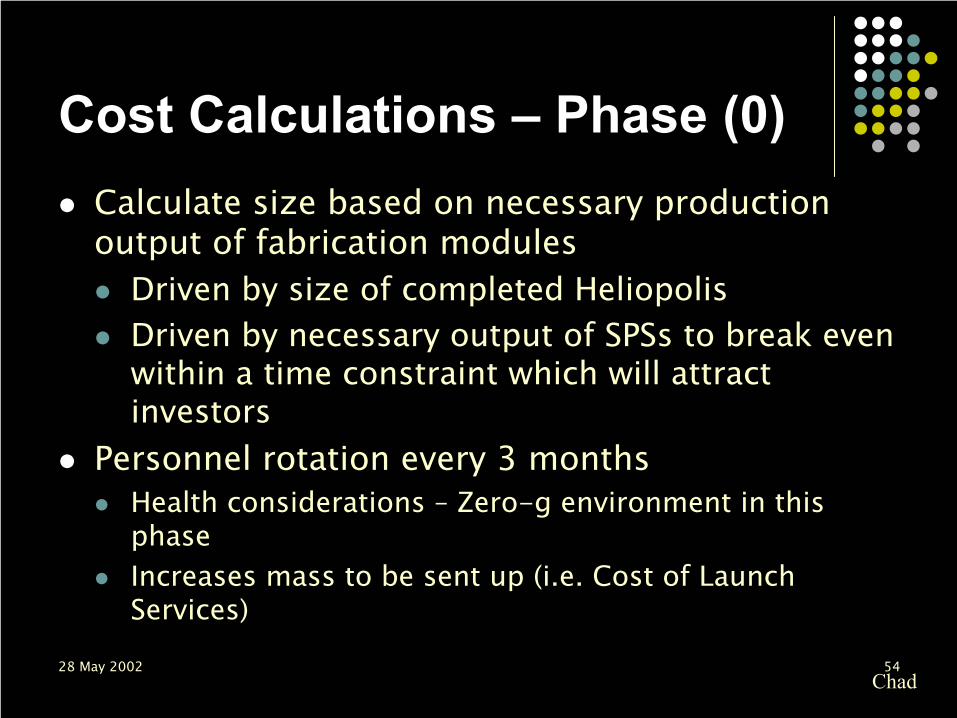
Cost Calculations – Phase (0)Calculate size based on necessary production output of fabrication modules
Driven by size of completed HeliopolisDriven by necessary output of SPSs to break even within a time constraint which will attract investors
Personnel rotation every 3 monthsHealth considerations – Zero-g environment in this phaseIncreases mass to be sent up (i.e. Cost of Launch Services)
Chad
28 May 2002 55
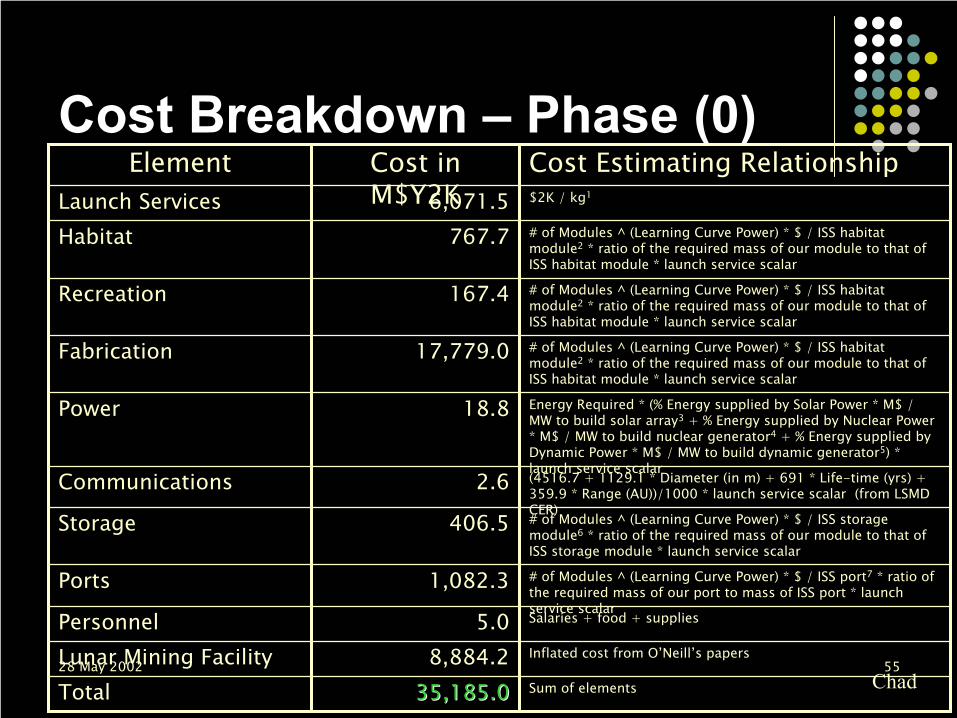
Cost Breakdown – Phase (0)
ChadTotalLunar Mining FacilityPersonnel
Ports
Storage
Communications
Power
Fabrication
Recreation
HabitatLaunch Services
Element
35,185.035,185.08,884.2
5.0
1,082.3
406.5
2.6
18.8
17,779.0
167.4
767.76,071.5
Cost in M$Y2K
Sum of elements
Inflated cost from O’Neill’s papers
Salaries + food + supplies
# of Modules ^ (Learning Curve Power) * $ / ISS port7 * ratio of the required mass of our port to mass of ISS port * launch service scalar
# of Modules ^ (Learning Curve Power) * $ / ISS storage module6 * ratio of the required mass of our module to that of ISS storage module * launch service scalar
(4516.7 + 1129.1 * Diameter (in m) + 691 * Life-time (yrs) + 359.9 * Range (AU))/1000 * launch service scalar (from LSMD CER)
Energy Required * (% Energy supplied by Solar Power * M$ / MW to build solar array3 + % Energy supplied by Nuclear Power * M$ / MW to build nuclear generator4 + % Energy supplied by Dynamic Power * M$ / MW to build dynamic generator5) * launch service scalar
# of Modules ^ (Learning Curve Power) * $ / ISS habitat module2 * ratio of the required mass of our module to that of ISS habitat module * launch service scalar
# of Modules ^ (Learning Curve Power) * $ / ISS habitat module2 * ratio of the required mass of our module to that of ISS habitat module * launch service scalar
# of Modules ^ (Learning Curve Power) * $ / ISS habitat module2 * ratio of the required mass of our module to that of ISS habitat module * launch service scalar
$2K / kg1
Cost Estimating Relationship
28 May 2002 56
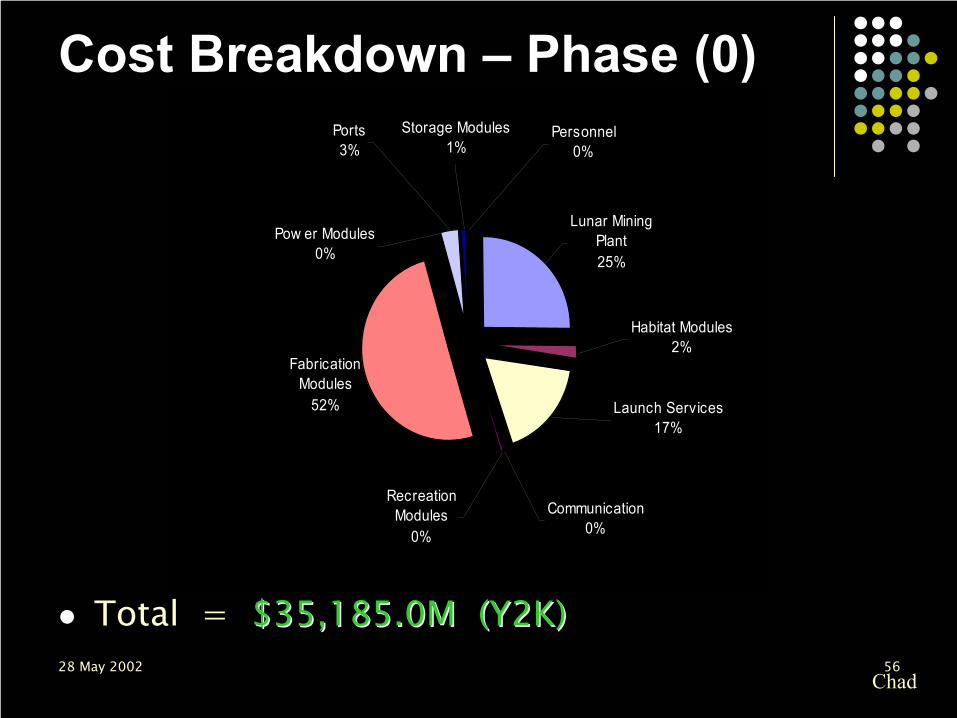
Cost Breakdown – Phase (0)
Total = $35,185.0M (Y2K)$35,185.0M (Y2K)
Chad
Fabrication Modules
52%
Recreation Modules
0%
Communication0%
Launch Services17%
Pow er Modules0%
Personnel0%
Storage Modules1%
Ports3%
Lunar Mining Plant25%
Habitat Modules2%

28 May 2002 57
Cost – Phases (1 - 4)Phases (1 - 4): Construction of Heliopolis
Internalize all costs possibleFood, Manufacturing, Power, Milling, Refining, etc.Only get from Earth what is absolutely necessary
Biomass, Soil, Water, Atmospheric GasesSome unavoidable recurring costs
Salaries, Carbon for Refining, Propellant, Launch Services
Duration of each phase determined by% of Heliopolis Complete Chad

28 May 2002 58
Cost – Phase (1)Duration = 0.9 yearsCost driven by Launch Services
Cost of component purchase minimal – raw materials
Biomass, Atmosphere, Simple SuppliesPersonnel cost is secondary driver
Assume # of personnel scales with % station completeEarth still supplies all food requirements for Phase 1
Chad

28 May 2002 59
Cost Breakdown – Phase (1)
Total Cost of Phase (1)
PersonnelThermalStructuresRefiningRecyclingRadiation ShieldingPowerMilling & PrimaryManufacturingLaunch ServicesHabitatFood ProductionAttitude & OrbitAtmosphere
Element
$27,319.10M$27,319.10M
11.6410.000.000.020.000.000.000.000.00
27,301.283.152.020.850.14
Cost (M$Y2K)
See notes for references
$7K / tonne of food11, $0.1M for laborer12, $0.16M for manager13
Internalized cost – material from moon, laborInternalized cost – material from moon, labor$425 / tonne of raw Carbon10
Internalized cost – material from moon, laborInternalized cost – material from moon, laborInternalized cost – material from moon, laborInternalized cost – material from moon, laborInternalized cost – material from moon, labor$1.588M / tonne to launch in during this phase9
0.1 tonnes of supplies / person7, $0.1M / tonne8
$128 / tonne biomass4, $20 / tonne soil5, $3 / tonne water6
$1M / tonne of propellant2, $0.2M / thruster3
$0.001M / tonne of gas1
Assumptions
Chad

28 May 2002 60
Cost – Phase (2)Duration = 10.0 yearsBegin producing SPSs and earning revenueCosts continue to be driven by launch services
Much higher than Phase (1) due to durationSecondary Costs:
PropellantTo initiate spin-upFor Asteroid Retrieval MissionFor Solar Power Satellites
BiomassPersonnel
Chad

28 May 2002 61
Cost – Phase (2)Personnel increases as % of station complete, but
now assume station economy only loses 22% of their salary
Personnel pays station for own food, lodging, etc.22% based on:
Avg. profit margin of American company1
Avg. % of salary savings of American household2
Guestimate on % external company’s cost not paid to station3
station now houses non-working personnel
Chad
28 May 2002 62
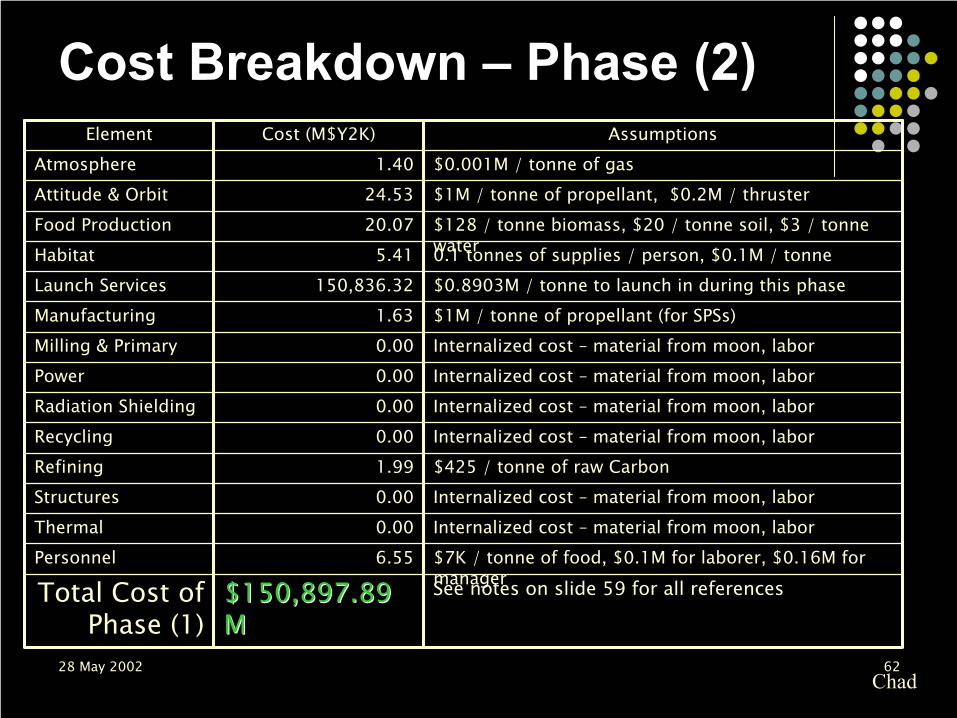
Cost Breakdown – Phase (2)
See notes on slide 59 for all references$150,897.89$150,897.89MM
Total Cost of Phase (1)
$7K / tonne of food, $0.1M for laborer, $0.16M for manager
6.55PersonnelInternalized cost – material from moon, labor0.00ThermalInternalized cost – material from moon, labor0.00Structures$425 / tonne of raw Carbon1.99RefiningInternalized cost – material from moon, labor0.00RecyclingInternalized cost – material from moon, labor0.00Radiation ShieldingInternalized cost – material from moon, labor0.00PowerInternalized cost – material from moon, labor0.00Milling & Primary$1M / tonne of propellant (for SPSs)1.63Manufacturing$0.8903M / tonne to launch in during this phase150,836.32Launch Services0.1 tonnes of supplies / person, $0.1M / tonne5.41Habitat$128 / tonne biomass, $20 / tonne soil, $3 / tonne water
20.07Food Production$1M / tonne of propellant, $0.2M / thruster24.53Attitude & Orbit$0.001M / tonne of gas1.40Atmosphere
AssumptionsCost (M$Y2K)Element
Chad
28 May 2002 63
Cost – Phase (3)Duration = 6.7 yearsAsteroid has been retrieved
No more Carbon needed from EarthPrecious Metal Revenue possible
Cost still driven by Launch Services
Chad

28 May 2002 64
Cost Breakdown – Phase (3)
See notes on slide 59 for references$50,299.57M$50,299.57MTotal Cost of Phase (1)
$0.1M for laborer, $0.16M for manager26.60PersonnelInternalized cost – material from moon, labor0.00ThermalInternalized cost – material from moon, labor0.00StructuresInternalized cost – material from moon & asteroid, labor
0.00RefiningInternalized cost – material from moon, labor0.00RecyclingInternalized cost – material from moon, labor0.00Radiation ShieldingInternalized cost – material from moon, labor0.00PowerInternalized cost – material from moon, labor0.00Milling & Primary$1M / tonne of propellant (for SPSs)47.01Manufacturing$0.3254M / tonne to launch in during this phase50,099.60Launch Services0.1 tonnes of supplies / person, $0.1M / tonne17.26Habitat$128 / tonne biomass, $20 / tonne soil, $3 / tonne water
18.21Food Production$1M / tonne of propellant, $0.2M / thruster89.62Attitude & Orbit$0.001M / tonne of gas1.27Atmosphere
AssumptionsCost (M$Y2K)Element
Chad

28 May 2002 65
Cost – Phase (4)Steady-stateCost Drivers
PropellantSPSsAttitude & Orbit
Launch ServicesAssume that by this time, cost is $200 / kgSignificantly less shipping
No additional Atmosphere, Biomass, etc. required
PersonnelSupplies
Still need small supplies from Earth (e.g. medical supplies)
Chad

28 May 2002 66
Cost Breakdown – Phase (4)
See notes on slide 59 for references$190.95M$190.95MTotal Cost of Phase (1)
$0.1M for laborer, $0.16M for manager43.55PersonnelInternalized cost – material from moon, labor0.00ThermalInternalized cost – material from moon, labor0.00StructuresInternalized cost – material from moon & asteroid, labor
0.00RefiningInternalized cost – material from moon, labor0.00RecyclingInternalized cost – material from moon, labor0.00Radiation ShieldingInternalized cost – material from moon, labor0.00PowerInternalized cost – material from moon, labor0.00Milling & Primary$1M / tonne of propellant (for SPSs)32.22Manufacturing$0.2M / tonne to launch in during this phase67.83Launch Services0.1 tonnes of supplies / person, $0.1M / tonne28.83Habitat$128 / tonne biomass, $20 / tonne soil, $3 / tonne water
0.00Food Production$1M / tonne of propellant, $0.2M / thruster18.62Attitude & Orbit$0.001M / tonne of gas0.00Atmosphere
AssumptionsCost (M$Y2K)Element
Chad

28 May 2002 67
Cost Breakdown by Phase
$272,532.2$272,532.2(Y2K)
Total50,299.63
150,897.9227,319.1135,185.00
8,830.6-1
Cost in M$Y2K (excluding interest)
Phase
Chad
Phase (0)13%
Phase (1)10%
Phase (2)56%
Phase (3)18%
Phase (-1)3%

28 May 2002 68
Cost / Year by Phase
Phase (0)29%
Phase (1)40%
Phase (2)19%
Phase (4)0% Phase (-1)
2%Phase (3)
10%
191.044
7,442.423
15,089.792
30,973.111
22,587.910
1,766.12-1
Cost / Year (in M$Y2K)
Phase
Chad

28 May 2002 69
Cost by Year
Chad
0.00
5,000.00
10,000.00
15,000.00
20,000.00
25,000.00
30,000.00
35,000.00
40,000.00
0 5 10 15 20 25 30 35 40Year
B$Y
2K
Year's Bare Cost (excludes interest)
Year's Cost of Interest
Year's Total Cost (includes interest)
0
5
10
15
20
25
30
35
40

28 May 2002 70
Revenue GeneratorsSolar Power Satellites
Assume construct 1 per monthSize and output scale with % station complete
First satellite produced generates 225 MWPhase (4), satellites produced generate 4500 MWLinear fit between these points
Assume SPS lifetime exceeds 30 yearsNo SPS production until beginning of Phase (2)
Assume station will sell energy at $.05 / kW*hr (Y2K)
Low end of current competitive pricesChad

28 May 2002 71
Revenue GeneratorsSuggested for inclusion in future studies
TourismGenerates revenue through all phases
Communications SatellitesOpportunity Cost of time to build SPSs
Precious MetalsGenerates revenue in phase (3) from asteroid refining
Zero-G ManufacturingOpportunity Cost of time to build SPSs
Chad

28 May 2002 72
Time to ProfitAccounting Profit in Year 15Economic Profit in Year 20Total Economic Profit at start of Phase 4 (Year 25)
$925,092,412,524$925,092,412,524(Y2K)
Chad

28 May 2002 73
0.00
1,000,000.00
2,000,000.00
3,000,000.00
4,000,000.00
5,000,000.00
6,000,000.00
7,000,000.00
8,000,000.00
0 5 10 15 20 25 30 35 40Year
Year's RevenueCumulative Revenue
Total Revenue
Chad
87
65
43
210
T$Y2
K

28 May 2002 74
Cash Flow Analysis by Year
-100,000.00
0.00
100,000.00
200,000.00
300,000.00
400,000.00
500,000.00
600,000.00
0 5 10 15 20 25 30 35 40
Year
B$Y
2K
Year's CostYear's RevenueYear's Profit
600
500
400
300
200
100
0
-100
Chad
28 May 2002 75
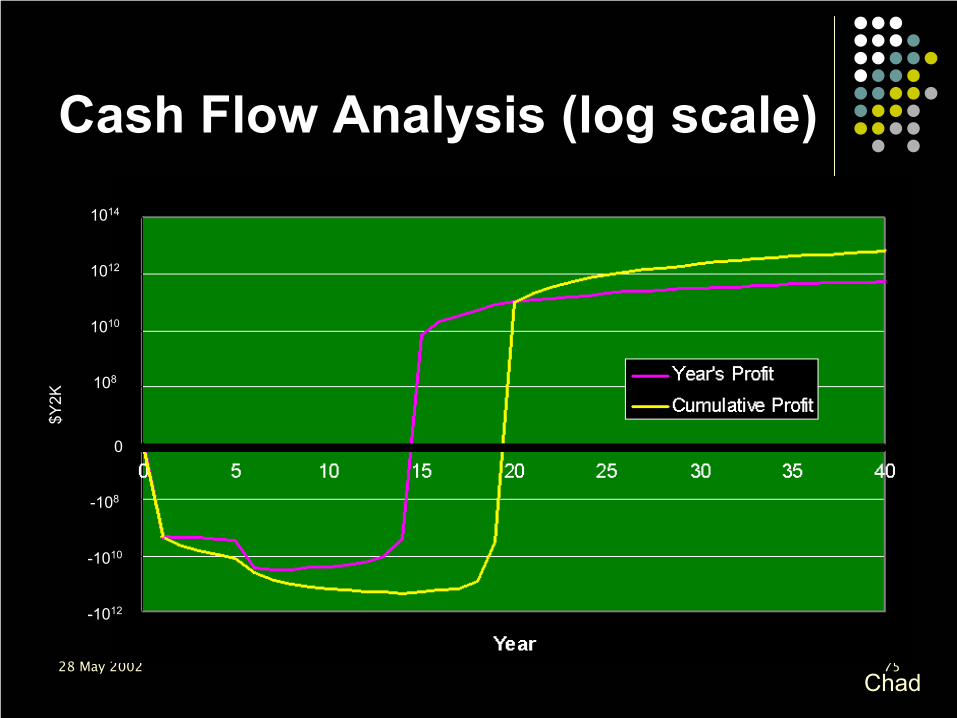
Cash Flow Analysis (log scale)
Chad
1014
1012
1010
108
-108
-1010
-1012
0
$Y2K

28 May 2002 76
-1,000,000.00
0.00
1,000,000.00
2,000,000.00
3,000,000.00
4,000,000.00
5,000,000.00
6,000,000.00
7,000,000.00
8,000,000.00
0 5 10 15 20 25 30 35 40
Year
Cumulative CostCumulative RevenueCumulative Profit
8
7
6
5
4
3
2
1
0
-1
Cumulative Cash Flow Analysis
Chad
T$Y2
K

28 May 2002 77
Financial ConclusionsVital assumptions
Launch Services can handle project requirements for $2K / kg.Construction and development costs scale with launch service Cost of some systems can be “internalized” as opportunity cost (time)Station can produce 1 SPS / month with output based on % of station complete
Requires $105B initial investment over first 11 yearsProfitability
15 years to accounting profitability20 years to economic profitability$6.9T profit by year 40
28 May 2002 78
Technical Study: OverviewDesign Problems/Requirements & SolutionsShanty Town DescriptionHeliopolis DescriptionSystem-Level SummaryDiscussion of Economic ModelExplanation of Subsystem ModelsSummary

28 May 2002 79
Discussion of Subsystem Models
Industrial ModelManufacturingMillingRefining
HabitatFood ProductionAtmosphereRecyclingPersonnel
PowerThermalStructuresAttitude ControlTransportationRadiation Shielding

28 May 2002 80
Industry Model OverviewTraces production from raw materials through to finished goods: solar power satellites, station components, etc.Models draw data from car manufacturing plants, aluminum production facilities, American industrial averages, etc.
Raw materials
Trade goods
Power, staff, structural needs
Waste

28 May 2002 81
Industry Model AssumptionsTime-Independent Assumptions:
20% waste heatAverage complexity is equivalent to car manufacturingLogarithmic scaling of time-dependent variables
Time-Dependent Assumptions:
991043353
1022
021
Percent Non-Terrestrial Materials
Productivity
Multiplier
Phase

28 May 2002 82
Industry Model Results (1 of 2)
Station Population
0
500
1000
1500
2000
2500
3000
1 2 3 4
Phase
Popu
latio
n
Other InhabitantsIndustrial Workers
Station Power Usage
0
100
200
300
400
500
1 2 3 4
Phase
Pow
er (M
W)
Other Power
Industrial Power
Personnel employed peaks at 360 in phase 2, settles to ~340 in phase 4Requires 18,000 tonnes, 27,000 m3 of facilities and machinery in phase 4Uses ~430 MW of power in phase 4

28 May 2002 83
Industry Model Results (2 of 2)
Imports ~750 tonnes/month of material from EarthExports 1 4.5 GW SPS and 2 Ansible1-class satellites/month by phase 4
1From 2000 LSMD study

28 May 2002 84
Industry ModelManufacturing Module
Inputs feedstocks and primary materials (electronics, e.g.)“Builds” finished goods as required for profit by Cost clientModel draws data from car manufacturing plants, aluminum production facilities, and O’Neill’s SSI report on space-based manufacturing
Feedstock
Trade goods
Power, staff, structural needs
Waste
28 May 2002 85
Industry ModelManufacturing: Process
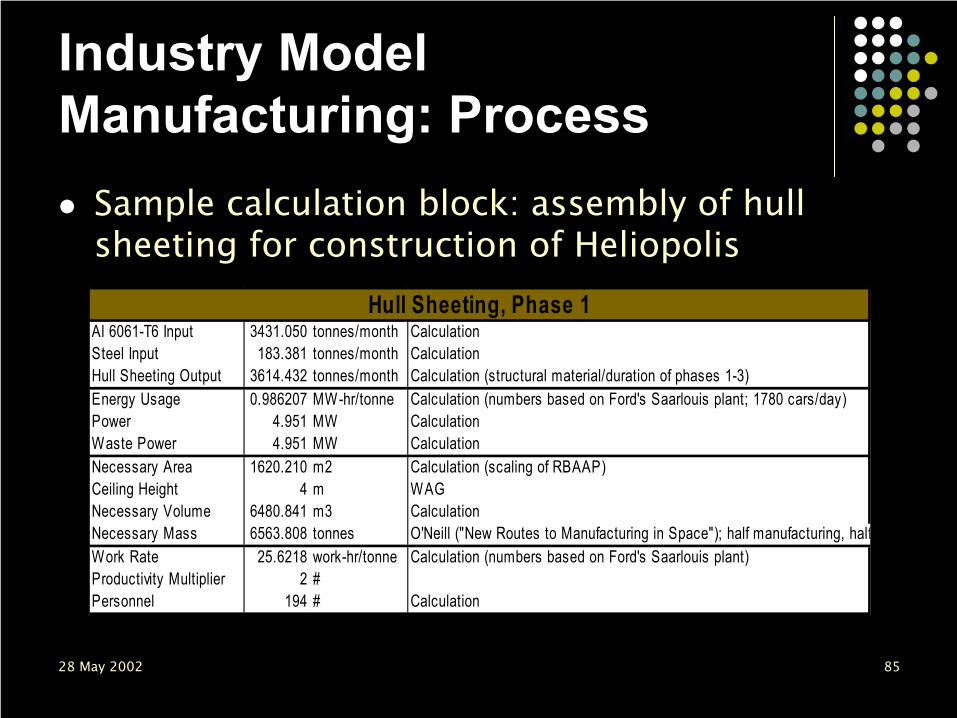
Sample calculation block: assembly of hull sheeting for construction of Heliopolis
Al 6061-T6 Input 3431.050 tonnes/month CalculationSteel Input 183.381 tonnes/month CalculationHull Sheeting Output 3614.432 tonnes/month Calculation (structural material/duration of phases 1-3)Energy Usage 0.986207 MW-hr/tonne Calculation (numbers based on Ford's Saarlouis plant; 1780 cars/day)Power 4.951 MW CalculationWaste Power 4.951 MW CalculationNecessary Area 1620.210 m2 Calculation (scaling of RBAAP)Ceiling Height 4 m WAGNecessary Volume 6480.841 m3 CalculationNecessary Mass 6563.808 tonnes O'Neill ("New Routes to Manufacturing in Space"); half manufacturing, halfWork Rate 25.6218 work-hr/tonne Calculation (numbers based on Ford's Saarlouis plant)Productivity Multiplier 2 #Personnel 194 # Calculation
Hull Sheeting, Phase 1
28 May 2002 86
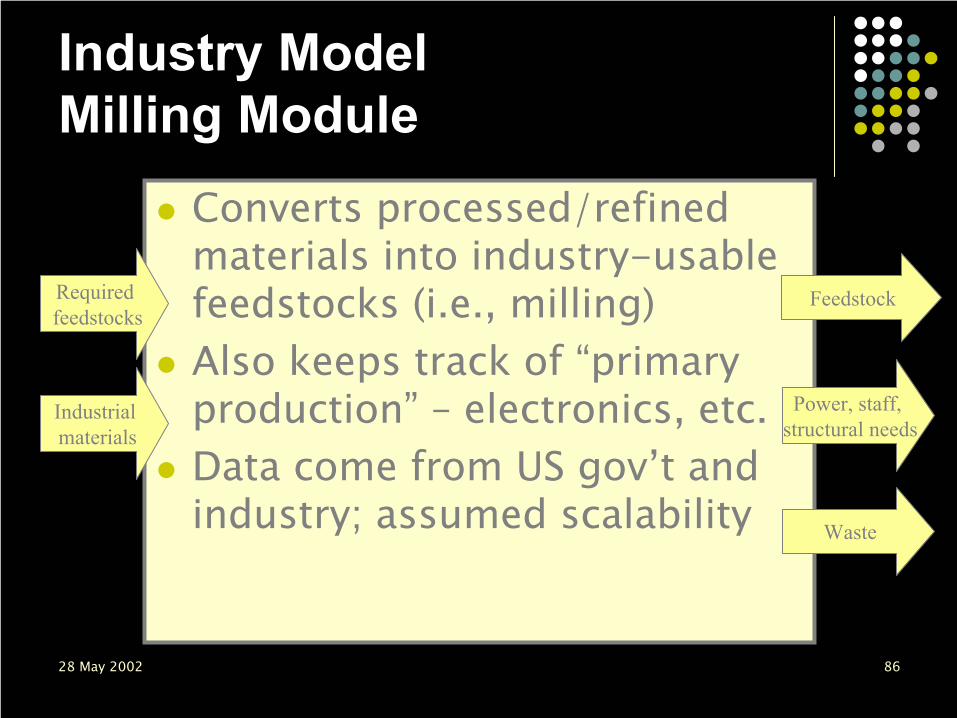
Industry ModelMilling Module
Converts processed/refined materials into industry-usable feedstocks (i.e., milling)Also keeps track of “primary production” – electronics, etc.Data come from US gov’t and industry; assumed scalability
Industrial materials
Feedstock
Power, staff, structural needs
Waste
Required feedstocks
28 May 2002 87
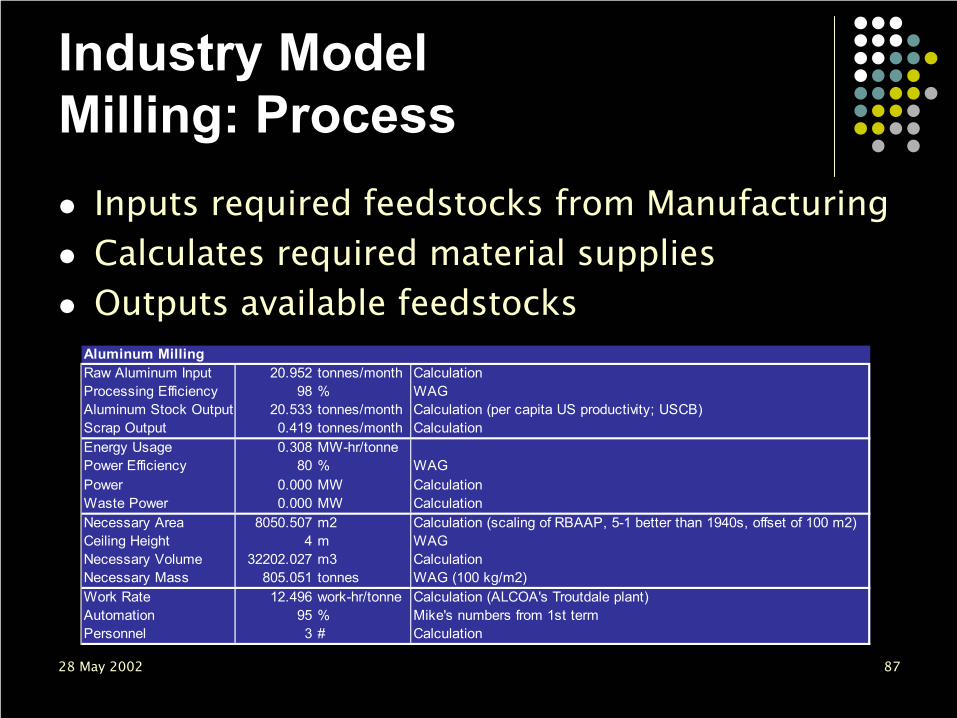
Industry ModelMilling: Process
Inputs required feedstocks from ManufacturingCalculates required material suppliesOutputs available feedstocks
Raw Aluminum Input 20.952 tonnes/month CalculationProcessing Efficiency 98 % WAGAluminum Stock Output 20.533 tonnes/month Calculation (per capita US productivity; USCB)Scrap Output 0.419 tonnes/month CalculationEnergy Usage 0.308 MW-hr/tonnePower Efficiency 80 % WAGPower 0.000 MW CalculationWaste Power 0.000 MW CalculationNecessary Area 8050.507 m2 Calculation (scaling of RBAAP, 5-1 better than 1940s, offset of 100 m2)Ceiling Height 4 m WAGNecessary Volume 32202.027 m3 CalculationNecessary Mass 805.051 tonnes WAG (100 kg/m2)Work Rate 12.496 work-hr/tonne Calculation (ALCOA's Troutdale plant)Automation 95 % Mike's numbers from 1st termPersonnel 3 # Calculation
Aluminum Milling
28 May 2002 88
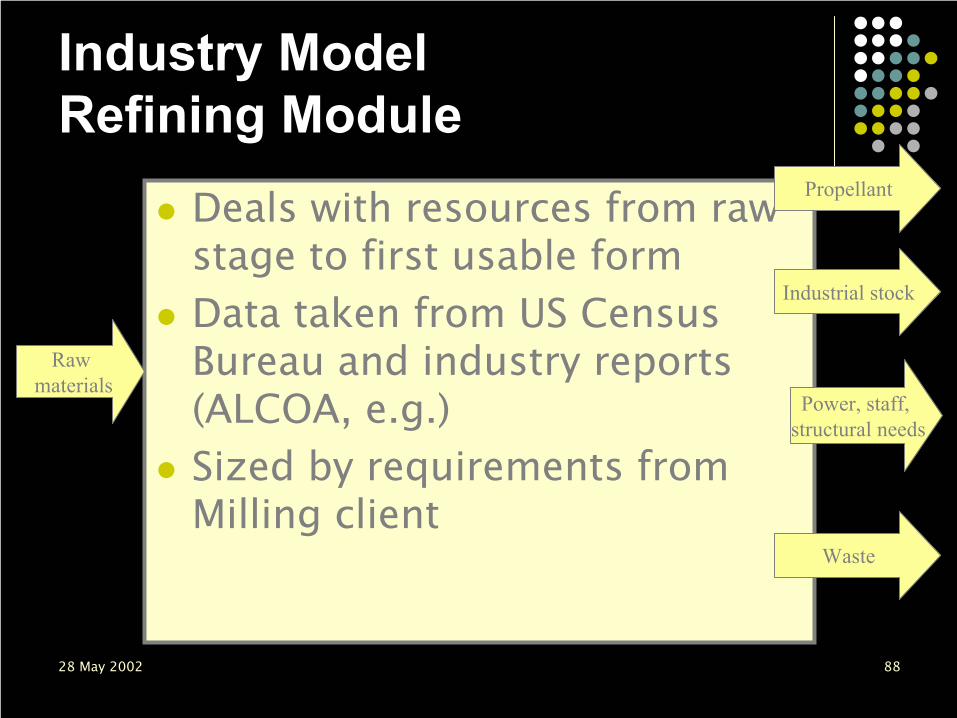
Industry ModelRefining Module
Deals with resources from raw stage to first usable formData taken from US Census Bureau and industry reports (ALCOA, e.g.)Sized by requirements from Milling client
Raw materials
Industrial stock
Propellant
Power, staff, structural needs
Waste

28 May 2002 89
Industry ModelRefining: Process
SiO2-2MgO Input 21659.081 tonnes/monthCaO Input 34528.926 tonnes/monthSi Input 4323.812 tonnes/monthMg Output 7483.935 tonnes/monthSiO2-2CaO Output 53027.884 tonnes/month
SiO2-2CaO Input 53027.884 tonnes/monthCaO Output 34528.926 tonnes/monthSiO2 Output 18498.958 tonnes/monthEnergy Usage 0.000 MW-hr/tonne From enthalpiesEfficiency 80 % WAGPower 0.000 MW CalculationWaste Power 0.000 MW Calculation
SiO2 Input 9249.479 tonnes/monthSi Output 4373.313 tonnes/monthO2 Output 4925.667 tonnes/monthEnergy Usage 4.204 MW-hr/tonne From enthalpiesEfficiency 80 % WAGPower 67.508 MW CalculationWaste Power 13.502 MW Calculation
MgO ProductionMg Input 31.425 tonnes/monthO2 Input 20.683 tonnes/monthMgO Output 52.108 tonnes/monthEnergy Usage -4.146 MW-hr/tonne From enthalpiesEfficiency 80 % WAGPower -0.375 MW CalculationWaste Power -0.075 MW Calculation
SiO2 Reduction
SiO2-2CaO Reduction
Olivine Reduction Sample calculation block: reduction of lunar olivineChecks for closed loops – flags net inputs or outputs (italics)

28 May 2002 90
Habitat ModelCharacterizes the living spaces of HeliopolisSpace per person (pps) increases ~33% with each phase to reflect the increasing standard of living within the colonySome components, such as public space, shops & services, are not present in initial shanty phasePhase 3 colony has spaces comparable to Stanford Torus study in 1976Completed colony has projected area per person comparable to New York City
VolumeSpace
requirements
PopulationArea
Mass
Melahn

28 May 2002 91
Habitat Model SpacesSpaces Considered
Living Quarters – bed, bath, kitchen, den, dining roomsEntertainment – cinema, theatre, video games, internetPublic space – parks, open fields, gardensRecreation – exercise equipment, track, swim poolShops – general & grocery storeService Industry – personal goodsOffices – government, trade, accountingHospital – telemedicine robotic facilitySchool – library, teleducation facilityCafeteria – food services away from homeWalk ways – escalators, moving floors, light rail
Work Decomposition Melahn

28 May 2002 92
Habitat Model NotesSpace requirements per person for each phase are presented in next 4 tablesCharacterization of Habitat for each phase presented in final chartNumbers give idea how habitat is expected to grow in size and comfort Melahn

28 May 2002 93
Habitat Phase 1 Assumptions
1.40.60.1180.672.5518.547.251.32Totals
0.00.00.0030.023391Walkways
0.00.00.0010.032.512.51School
0.10.10.10.12.50.51.251Hospital
0.00.00.0020.052.5251Offices
0.00.000.050000Service Industry
0.10.000.050000Shops
0.00.00.0030.13393Recreation
0.20.00.0030.12.537.51Cafeteria
0.00.000.020000Public Space
0.00.00.0010.13131Entertainment
1.00.50.0050.0525101Living Quarters
kg/monthppskg/monthppskW/ppskW/ppsmm2/ppsm3/ppskg/m2Section
plastic wastemetal waste
power emergency
power normalheightareavolumemass
Habitat Space per Person
Work Decomposition Melahn*Values for space requirements scaled down ~80% from 1975 Stanford Study
28 May 2002 94
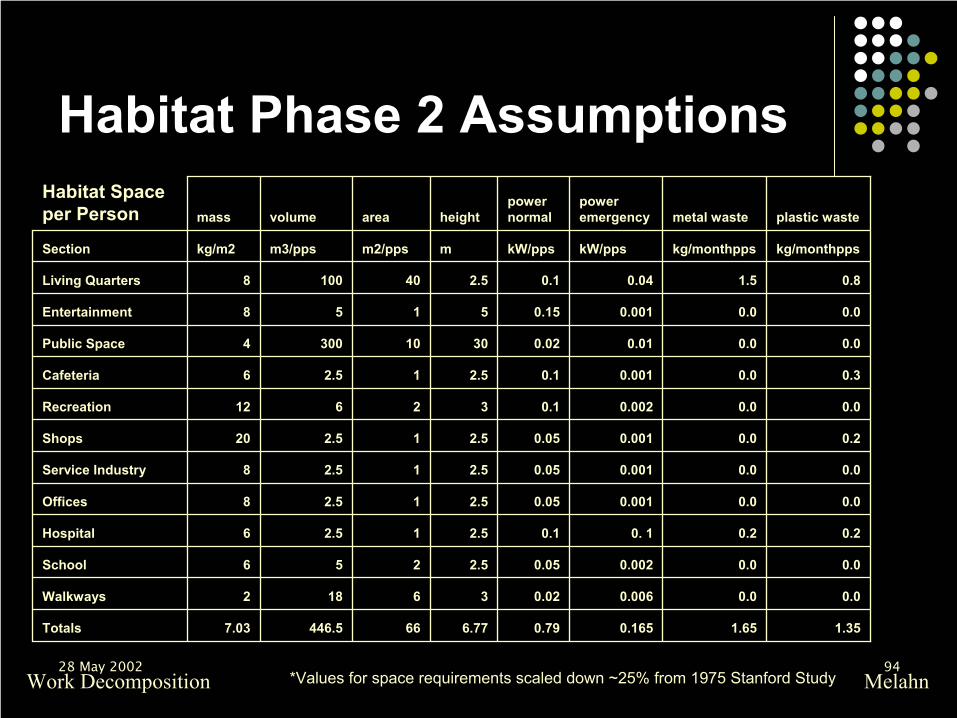
Habitat Phase 2 Assumptions
1.351.650.1650.796.7766446.57.03Totals
0.00.00.0060.0236182Walkways
0.00.00.0020.052.5256School
0.20.20. 10.12.512.56Hospital
0.00.00.0010.052.512.58Offices
0.00.00.0010.052.512.58Service Industry
0.20.00.0010.052.512.520Shops
0.00.00.0020.132612Recreation
0.30.00.0010.12.512.56Cafeteria
0.00.00.010.0230103004Public Space
0.00.00.0010.155158Entertainment
0.81.50.040.12.5401008Living Quarters
kg/monthppskg/monthppskW/ppskW/ppsmm2/ppsm3/ppskg/m2Section
plastic wastemetal wastepower emergency
power normalheightareavolumemass
Habitat Space per Person
Work Decomposition Melahn*Values for space requirements scaled down ~25% from 1975 Stanford Study
28 May 2002 95
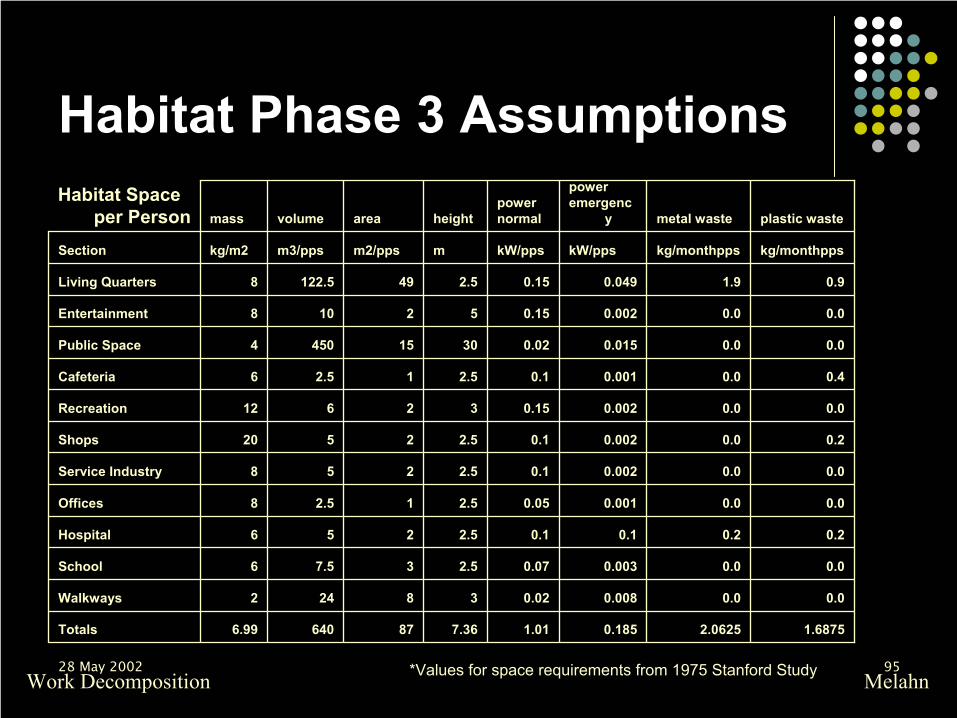
Habitat Phase 3 Assumptions
1.68752.06250.1851.017.36876406.99Totals
0.00.00.0080.0238242Walkways
0.00.00.0030.072.537.56School
0.20.20.10.12.5256Hospital
0.00.00.0010.052.512.58Offices
0.00.00.0020.12.5258Service Industry
0.20.00.0020.12.52520Shops
0.00.00.0020.1532612Recreation
0.40.00.0010.12.512.56Cafeteria
0.00.00.0150.0230154504Public Space
0.00.00.0020.1552108Entertainment
0.91.90.0490.152.549122.58Living Quarters
kg/monthppskg/monthppskW/ppskW/ppsmm2/ppsm3/ppskg/m2Section
plastic wastemetal waste
poweremergenc
ypowernormalheightareavolumemass
Habitat Space per Person
Work Decomposition Melahn*Values for space requirements from 1975 Stanford Study

28 May 2002 96
Habitat Phase 4 Assumptions
2.1093752.5781250.2133.048.551169926.88Totals
0.00.00.010.02310302Walkways
0.00.00.0040.12.54106School
0.20.20.10.13.5310.56Hospital
0.00.00.0020.12.5258Offices
0.00.00.0020.12.5258Service Industry
0.20.00.0030.12.537.520Shops
0.00.00.0030.233912Recreation
0.50.00.0020.12.5256Cafeteria
0.00.00.0250.0230257504Public Space
0.00.00.0020.252108Entertainment
1.22.30.0622.5601508Living Quarters
kg/monthppskg/monthppskW/ppskW/ppsmm2/ppsm3/ppskg/m2Section
plastic wastemetal waste
poweremergenc
ypowernormalheightareavolumemass
Habitat Space per Person
Work Decomposition Melahn*Values for space requirements scaled up ~33% from 1975 Stanford Study

28 May 2002 97
Habitat Model Results Summary
Work Decomposition Melahn
5,434
37 7
2
9 93
0.08
115
2,128
22,506
152,257
158341
0.3
132,762
976,640
9281,526
335,820
2,871,840
2,895 2,310
1.E-02
1.E-01
1.E+00
1.E+01
1.E+02
1.E+03
1.E+04
1.E+05
1.E+06
1.E+07
Phase 1Phase 2Phase 3Phase 4
People # Mass tonnes volume m3 Area m2 Height m Power MW

28 May 2002 98
Life Support ModelsSystem models for supporting humans in spaceIncludes:
Food ProductionAtmosphereRecycling
Work Decomposition Luke

28 May 2002 99
Food Production Model: Overview
Calculates the nutrition requirements to feed the station populationModels changes made by plant respiration to the atmospheric conditionsCalculates recyclable waste material and water for processing
Atmosphericchanges
Power, staff, structural needs
RecyclableWaste
StationPopulation
Work Decomposition Luke

28 May 2002 100
Food Production Model: Assumptions
Farming technologically stableCrop yields will increase (i.e. bioengineered plants) but not by more than 2x.Equipment will not undergo major technological changes over the current timetableStandard soil farming proven technology and less labor intensive than hydroponics or airponics
Work Decomposition Luke

28 May 2002 101
Food Production Model: Calculations
Work Decomposition Luke
Population Area needed per person for Agriculture
Inputs
Constants
* Total agriculturalarea
Calculated
Outputs
Bio waste per m2
CO2 change by plantrespiration per m2
O2 change by plantrespiration per m2
H2O change by plantrespiration per m2
Mass of equipmentneeded per m2
*****
=====
Total bio waste
Total CO2 change
Total O2 change
Total H2O change
Total mass ofequipment
Area
Area
Area
Area
Area
Key:
=
28 May 2002 102
Food Production Model: DescriptionConditions
Normal Earth gravity for cropsReflected light from station mirrors - no need for artificial lightClimate control optimizes atmospheric conditions for cropsProvides “visible green spaces” for people on the station
Work Decomposition Luke

28 May 2002 103
Food Production Model: Results
Phase 1No onboard food productionRegular re-supply neededSmall impact to station mass and volume
Mass of biomass
Mass of water
Mass of soil
Requested Sunlight, natural
Water Re- supply required from Earth (recycled)
Food Re- supply required from Earth
Water waste from Food Production
H20 vapor change by Food Production
CO2 change by Food Production
O2 change by Food Production
Waste power, Food Production
Staff, Food Production
0
0
0
0
0
2.5
0
0
0
0
0.01
0
tonnes
tonnes
tonnes
W/m2
tonnes/month
tonnes/month
kg/day
kg/day
kg/day
kg/day
MW
#
All values calculated in the model
Work Decomposition Luke

28 May 2002 104
Food Production Model: Results
Phase 4Onboard food production meets station needsNo regular re-supplyAdds significant mass and area requirements on the overall structureStaff accounts for about 10% of total population Mass of biomass
Mass of water
Mass of soil
Requested Sunlight, natural
Water Re- supply required from Earth (recycled)
Food Re- supply required from Earth
Water waste from Food Production
H20 vapor change by Food Production
CO2 change by Food Production
O2 change by Food Production
Waste power, Food Production
Staff, Food Production
311364
1297
21622
400
0
0
432
432450
- 8649
5766
0.3
361
tonnes
tonnes
tonnes
W/m2
tonnes/month
tonnes/month
kg/day
kg/day
kg/day
kg/day
MW
#
All values calculated in the model
Work Decomposition Luke

28 May 2002 105
Atmosphere Model: OverviewBook keeps the changes made to the atmosphereSums changes made by other subsystem modelsCalculates changes needed from Recycling model to maintain desired atmospheric conditionsOutputs air circulation equipment requirements
Changes fromRecycling
Fans requiredfor circulation
Atmospherechanges Power, staff,
structural needs
Work Decomposition Luke

28 May 2002 106
Atmosphere Model: Calculations
Work Decomposition Luke
Internalvolume
Circulation fansper m3
Inputs
Constants
* Total numberof fans
Calculated
Outputs
Key:
=
Mass per fan
Power requiredper fan
*
*
=
=
Total mass of fans
Total power requiredby fans
# fans
# fans
= O2 or CO2 or H2Ochange required
O2 or CO2 or H2Ochanges-S
Volume requiredper fan* = Total volume required
by fans# fans
Total massof fans + Total mass
of atmosphere = Total mass foratmosphere model

28 May 2002 107
Atmosphere Model: ResultsPhase 1
A significant quantity of atmospheric gas must be shipped up from Earth CO2 conversion to O2requiredCirculation fans not a significant driver for model output values
tonnes23.25Mass of Atmosphere (Gas only)
#58Number of fans
kg/day- 230H2O change to Recycling
kg/day98O2 change to Recycling
kg/day- 115CO2 change to Recycling
MW0.17Power, Atmosphere
m3345Necessary volume
tonnes23.8Necessary mass (total)
All values calculated in the model
Work Decomposition Luke
28 May 2002 108
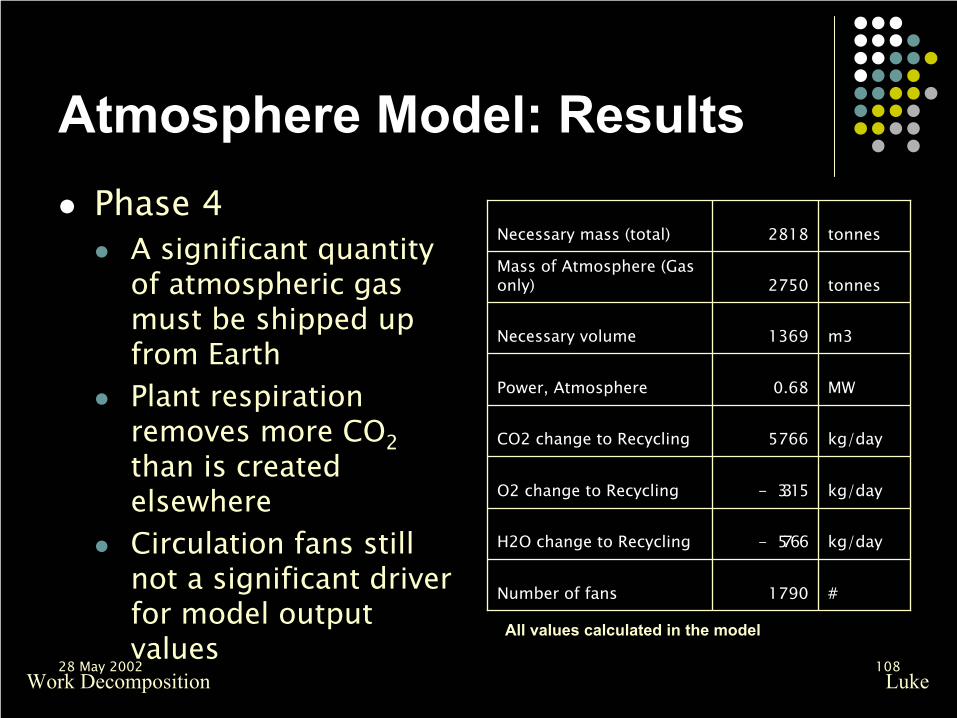
Atmosphere Model: ResultsPhase 4
A significant quantity of atmospheric gas must be shipped up from EarthPlant respiration removes more CO2than is created elsewhereCirculation fans still not a significant driver for model output values
tonnes2750Mass of Atmosphere (Gas only)
#1790Number of fans
kg/day- 5766H2O change to Recycling
kg/day- 3315O2 change to Recycling
kg/day5766CO2 change to Recycling
MW0.68Power, Atmosphere
m31369Necessary volume
tonnes2818Necessary mass (total)
All values calculated in the model
Work Decomposition Luke

28 May 2002 109
Recycling Model: OverviewModels conversion of waste to usable resources for the stationFocus on maintaining closed atmospheric and water cyclesReturns inedible biomass as fertilizer for Food ProductionReturns waste metal and plastic to industry for processing
Atmosphericbalancing
ProcessedBiomass/Water
Metal andplastic stock
Waste forprocessing
Power, staff, structural needs
Work Decomposition Luke

28 May 2002 110
Recycling Model: Assumptions
There will be an increase in efficiency for the various recycling processes due to technological improvements
Industry can make use of plastic and metal waste recovered from the modules
Work Decomposition Luke
241.53
1211
Productivity
Multiplier
Phase

28 May 2002 111
Recycling Model: Calculations
Work Decomposition Luke
Quantity of Xto recycle
Processing rate perX recycling unit* Number recycling
units needed
Mass ofeach unit* = Total mass
to recycle Xunits
Inputs
Constants
Calculated
Outputs
Key:
For a given recycled material X, these are the basic calculations for determining model requirements
* Productivitymultiplier =
Volume ofeach unit* = Total volume
to recycle Xunits
Power foreach unit* = Total power
to recycle Xunits

28 May 2002 112
Recycling Model: CalculationsA typical piece of recycling equipment:
Trace contaminant removal unit* –removes contaminants from the atmosphere
Can remove 15.4g/day of contaminants from air
Mass 100 kgVolume 0.3 m3Power 150 WProcessing 0.0154 kg/day
Work Decomposition Luke*From Spaceflight Life Support and Biospherics

28 May 2002 113
Recycling Model: Calculations
=Total massto recycle X
Inputs
Constants
Calculated
Outputs
Key:
The calculations for model totals are as follows
=Total volumeto recycle X
=Total powerto recycle X
Total massfor model
Total volumefor model
Total powerfor model
SxSxSx
The calculations for model totals are as follows:
Work Decomposition Luke
28 May 2002 114
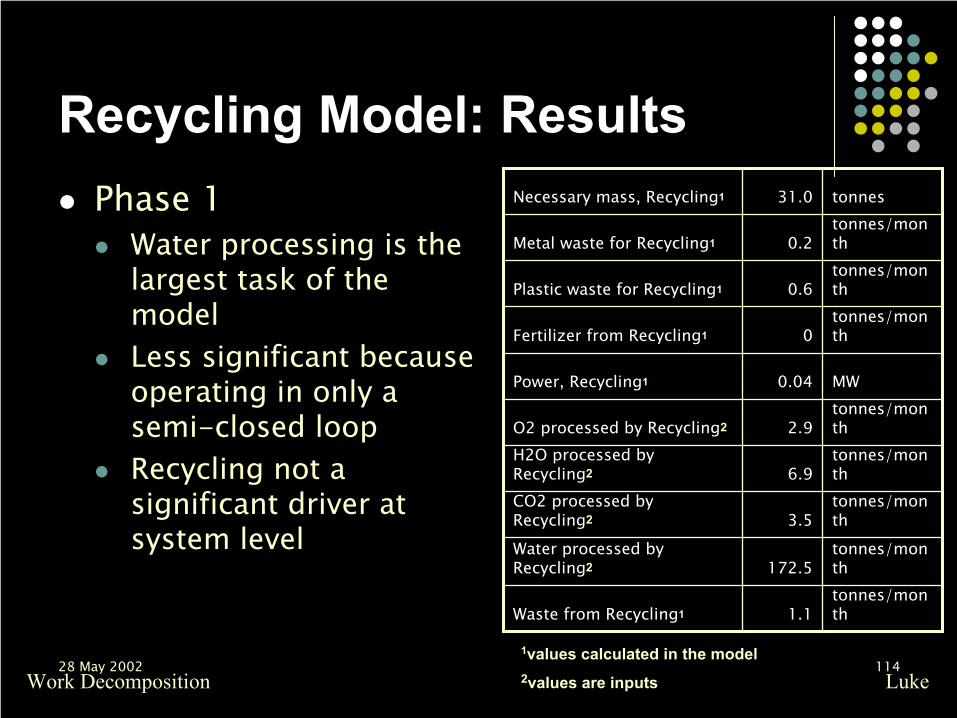
Recycling Model: ResultsPhase 1
Water processing is the largest task of the modelLess significant because operating in only a semi-closed loopRecycling not a significant driver at system level
Waste from Recycling1
Water processed by Recycling2
CO2 processed by Recycling2
H2O processed by Recycling2
O2 processed by Recycling2
Power, Recycling1
Fertilizer from Recycling1
Plastic waste for Recycling1
Metal waste for Recycling1
Necessary mass, Recycling1
1.1
172.5
3.5
6.9
2.9
0.04
0
0.6
0.2
31.0
tonnes/month
tonnes/month
tonnes/month
tonnes/month
tonnes/month
MW
tonnes/month
tonnes/month
tonnes/month
tonnes
1values calculated in the model2values are inputsWork Decomposition Luke

28 May 2002 115
Recycling Model: ResultsPhase 4
Water processing is still the largest task of the modelNear-closure of life support resource loopsRecycling not a significant driver at system level – smaller overall mass percentage
Waste from Recycling1
Water processed by Recycling2
CO2 processed by Recycling2
H2O processed by Recycling2
O2 processed by Recycling2
Power, Recycling1
Fertilizer from Recycling1
Plastic waste for Recycling1
Metal waste for Recycling1
Necessary mass, Recycling1
0.64
4337
167.9
12759
96.5
0.5
48.5
6.1
7.4
52.1
tonnes/month
tonnes/month
tonnes/month
tonnes/month
tonnes/month
MW
tonnes/month
tonnes/month
tonnes/month
tonnes
1values calculated in the model2values are inputsWork Decomposition Luke

28 May 2002 116
Life Support SummaryBiomass must come from Earth
Must pay launch cost for biomassRequires efficient recycling and closed resource loops to be economically feasible
Can be accomplished with current technology
Assumed technological improvements do not greatly reduce the overall mass of the models
Work Decomposition Luke
28 May 2002 117
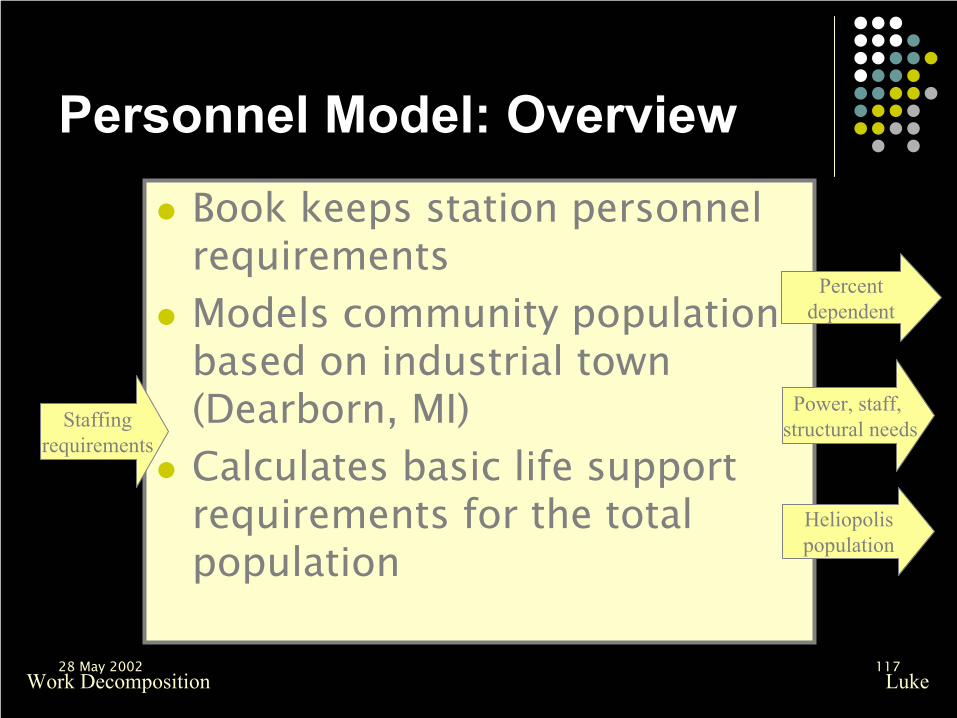
Personnel Model: OverviewBook keeps station personnel requirementsModels community population based on industrial town (Dearborn, MI)Calculates basic life support requirements for the total population
Percentdependent
Heliopolispopulation
Staffingrequirements
Power, staff, structural needs
Work Decomposition Luke

28 May 2002 118
Personnel Model: Assumptions
In phase 4, there will be a “support” population1
about 5 times the industrial population2
In phase 4, there non-working dependents will make up about 1/3 of the overall population3
In phase 1, only the necessary people are sent to work on the construction
Work Decomposition Luke
1Industrial population includes Manufacturing, Milling & Primary, Refining and Structures2Based on the Dearborn, MI population3Based on US statistics and adjusted to meet the productivity requirements of the station
52.75
1.51.01
Support population
fraction
0.5040.3030.1820.001
Dependent as fration of
working population
Phase

28 May 2002 119
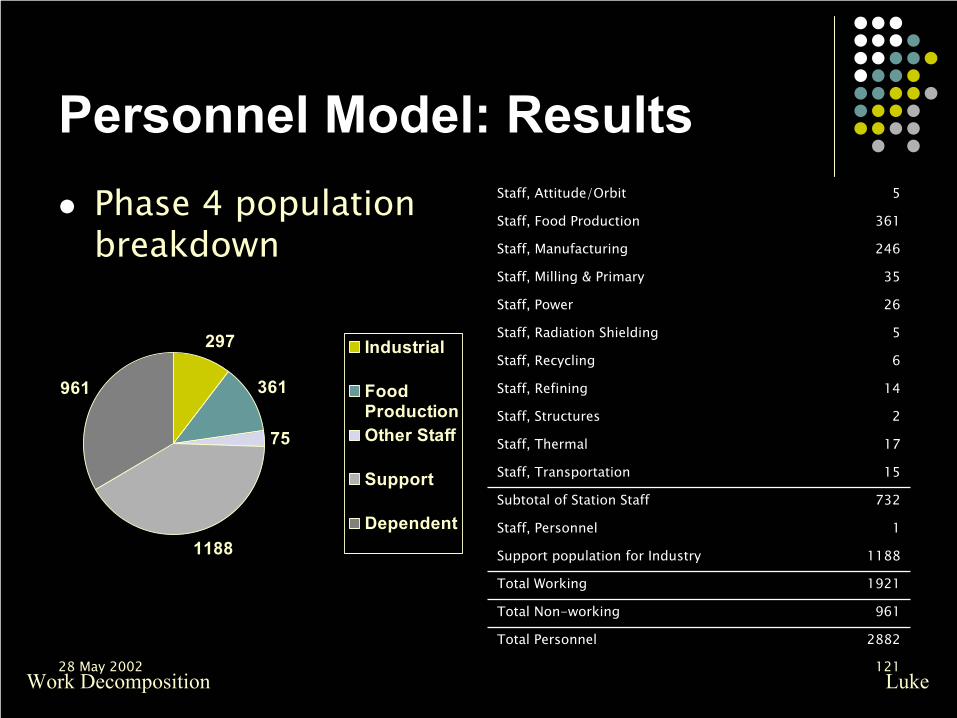
Personnel Model: ResultsA fully populated station
Majority work as support population for industryNon-working family next largest groupFood production third largestActual industry personnel fourth largestStation maintenance personnel smallest group
Work Decomposition Luke
28 May 2002 120
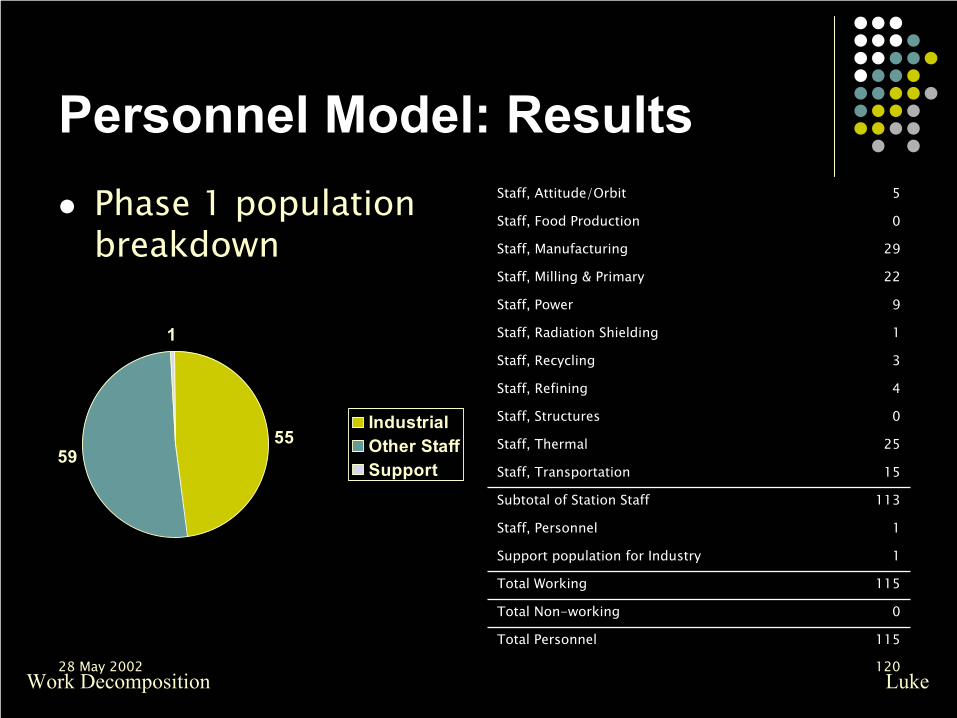
Personnel Model: ResultsPhase 1 population breakdown
115Total Personnel
0Total Non-working
115Total Working
1Support population for Industry
1Staff, Personnel
113Subtotal of Station Staff
15Staff, Transportation
25Staff, Thermal
0Staff, Structures
4Staff, Refining
3Staff, Recycling
1Staff, Radiation Shielding
9Staff, Power
22Staff, Milling & Primary
29Staff, Manufacturing
0Staff, Food Production
5Staff, Attitude/Orbit
Work Decomposition Luke
5559
1
IndustrialOther StaffSupport
28 May 2002 121
Personnel Model: Results
2882Total Personnel
961Total Non-working
1921Total Working
1188Support population for Industry
1Staff, Personnel
732Subtotal of Station Staff
15Staff, Transportation
17Staff, Thermal
2Staff, Structures
14Staff, Refining
6Staff, Recycling
5Staff, Radiation Shielding
26Staff, Power
35Staff, Milling & Primary
246Staff, Manufacturing
361Staff, Food Production
5Staff, Attitude/Orbit
Work Decomposition Luke
297
361
75
1188
961
Industrial
FoodProductionOther Staff
Support
Dependent
Phase 4 population breakdown

28 May 2002 122
Personnel Model: Results
0200400600800
100012001400160018002000
Phase 1 Phase 2 Phase 3 Phase 4
WorkingNon-Working
Work Decomposition Luke

28 May 2002 123
Power ModelCharacterizes Heliopolis’s power generation systemUtilizes Photovoltaic, Solar Thermal Dynamic, and Nuclear means of productionEmergency mode exists when no solar energy is incident upon station or all solar energy generation means are inoperableNuclear reactor is sized to meet emergency requirements
VolumeEmergency
Power
NormalPower
Array Area
Mass
Melahn
Staff

28 May 2002 124
Power AssumptionsSolar Photovoltaic
10 fold power/mass improvement by fourth phase75% power produced
Solar Thermal Dynamic6 fold power/mass improvement by fourth phase20% of power produced
Nuclear6 fold power/mass improvement by fourth phase5% of power producedSized to meet emergency power demandsWork Decomposition Melahn

28 May 2002 125
Power Model NotesFeatures of each phases power generation method are shown along with the power subsystems results summary for each phase in a table and chart to follow
Work Decomposition Melahn*Inflatable Solar Thermal Dynamic Example
28 May 2002 126
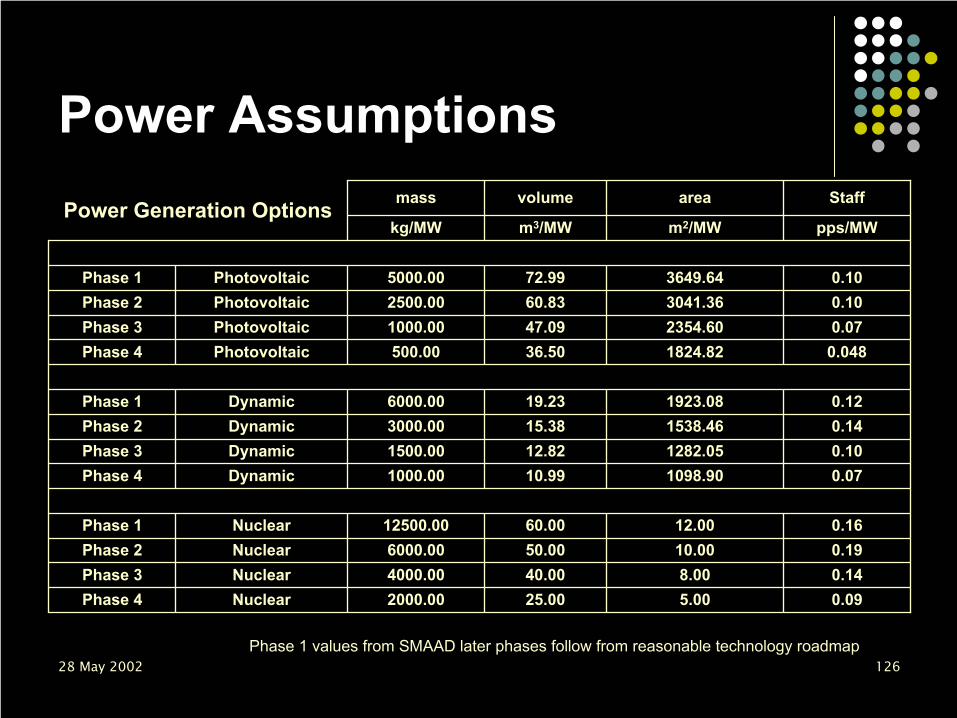
Power Assumptions
0.095.0025.002000.00NuclearPhase 40.148.0040.004000.00NuclearPhase 30.1910.0050.006000.00NuclearPhase 20.1612.0060.0012500.00NuclearPhase 1
0.071098.9010.991000.00DynamicPhase 40.101282.0512.821500.00DynamicPhase 30.141538.4615.383000.00DynamicPhase 20.121923.0819.236000.00DynamicPhase 1
0.0481824.8236.50500.00PhotovoltaicPhase 40.072354.6047.091000.00PhotovoltaicPhase 30.103041.3660.832500.00PhotovoltaicPhase 20.103649.6472.995000.00PhotovoltaicPhase 1
pps/MWm2/MWm3/MWkg/MW
StaffareavolumemassPower Generation Options
Phase 1 values from SMAAD later phases follow from reasonable technology roadmap

28 May 2002 127
Power Model Results Summary
Work Decomposition Melahn
8249
10
246556
224,464
83
281
11
209
42
157,624
21
252
503
101
567
405,345
442
604,612
26
552
110
694
1.E+00
1.E+01
1.E+02
1.E+03
1.E+04
1.E+05
1.E+06
Mass tonnes Array Aream2
Area m2 Volume m3 Power MW Staff #
Phase 1Phase 2Phase 3Phase 4
28 May 2002 128
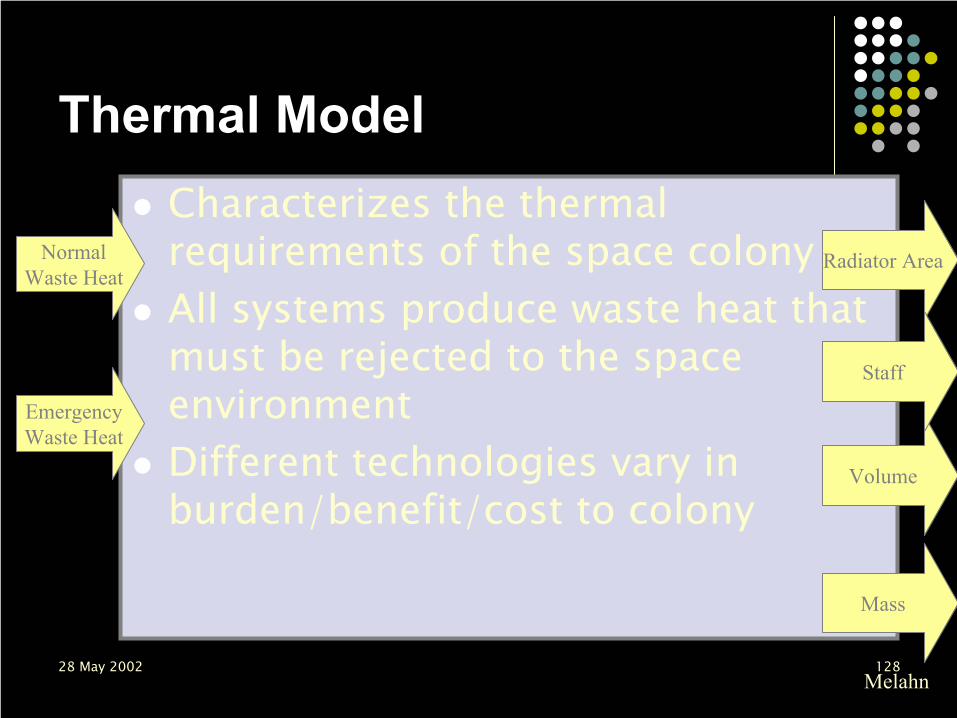
Thermal ModelCharacterizes the thermal requirements of the space colonyAll systems produce waste heat that must be rejected to the space environmentDifferent technologies vary in burden/benefit/cost to colony
Volume
EmergencyWaste Heat
NormalWaste Heat
Radiator Area
Mass
Melahn
Staff

28 May 2002 129
Thermal AssumptionsRadiator
100 fold improvement in heat rejected per mass by fourth phaseRemoves 60% of waste heatLarge area required for array
Heat Pipes10 fold improvement in heat rejected per mass by fourth phaseRemoves 20% of waste heatNo power required, but limited by available area
Regenerative10 fold improvement in heat rejected per mass by fourth phaseRemoves 20% of waste heatProduce power from high energy waste heat
Work Decomposition Melahn

28 May 2002 130
Thermal Model NotesFeatures of each phases thermal control method are shown along with the thermal subsystems results summary in a table and chart to follow
Work Decomposition Melahn

28 May 2002 131
Thermal Assumptions
0.05-0.2362000RegenerativePhase 40.1-0.2394000RegenerativePhase 30.2-0.231510000RegenerativePhase 20.12-0.233020000RegenerativePhase 1
0.00101500.015250Heat PipesPhase 40.00103000.03500Heat PipesPhase 30.00106000.061000Heat PipesPhase 20.001010000.12500Heat PipesPhase 1
0.030.01100250RadiatorPhase 40.050.012004300RadiatorPhase 30.080.0130061000RadiatorPhase 20.040.01500105000RadiatorPhase 1
pps/MWMW/MWm2/MWm3/MWkg/MWstaffpowerareavolumemassThermal Control Options
Melahn
Phase 1 values from SMAAD later phases follow from reasonable technology roadmap

28 May 2002 132
Thermal Model Results Summary
Work Decomposition Melahn
33,183
52
725524
101
7
260
53
20,008
263
102
11
106
14,234
56
169 109
7
70 86
10,899
172166
7
1.E+00
1.E+01
1.E+02
1.E+03
1.E+04
1.E+05
Mass tonnes Radiator Aream2
Area m2 Volume m3 W aste PowerMW
Staff #
Phase 1Phase 2Phase 3Phase 4

28 May 2002 133
Structures: OverviewAccommodates mass, area, and volume needs of other subsystemsAllows trades between primary materials for performance evaluationOptimizes size of Shanty Town for minimum combined time of Phases 0-1
Mass, area, volume persubsystem
Power, staff needs
28 May 2002 134
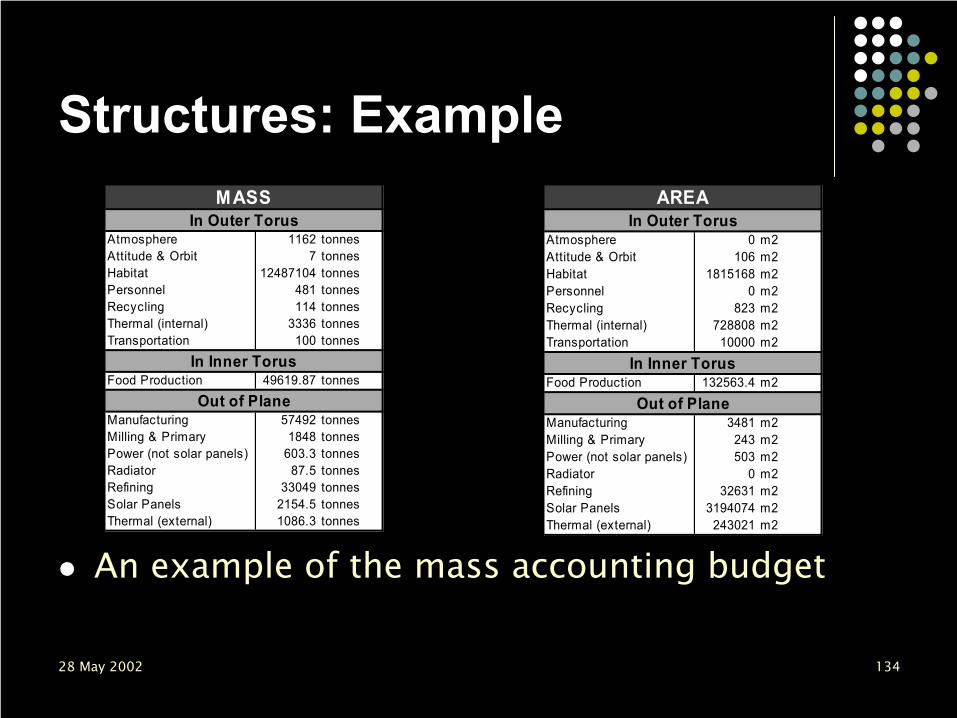
Structures: Example
Atmosphere 1162 tonnesAttitude & Orbit 7 tonnesHabitat 12487104 tonnesPersonnel 481 tonnesRecycling 114 tonnesThermal (internal) 3336 tonnesTransportation 100 tonnes
Food Production 49619.87 tonnes
Manufacturing 57492 tonnesMilling & Primary 1848 tonnesPower (not solar panels) 603.3 tonnesRadiator 87.5 tonnesRefining 33049 tonnesSolar Panels 2154.5 tonnesThermal (external) 1086.3 tonnes
In Outer Torus
In Inner Torus
Out of Plane
MASS
Atmosphere 0 m2Attitude & Orbit 106 m2Habitat 1815168 m2Personnel 0 m2Recycling 823 m2Thermal (internal) 728808 m2Transportation 10000 m2
Food Production 132563.4 m2
Manufacturing 3481 m2Milling & Primary 243 m2Power (not solar panels) 503 m2Radiator 0 m2Refining 32631 m2Solar Panels 3194074 m2Thermal (external) 243021 m2
In Inner Torus
Out of Plane
In Outer TorusAREA
An example of the mass accounting budget

28 May 2002 135
StructuresCalculations for structure size, amount of material neededUses a database of material propertiesPlausible comparison with 1975 Stanford study
Necessary major radius of torus 894.259 mNecessary area 404567.177 m2Necessary minor radius from area 36.001 mNecessary volume 4048492.983 m3Necessary minor radius from volume 15.144 mUsing minor radius 36.001 mUltimate factor of safety 2Material Al 6061-T62Skin thickness 0.019 mMass of structural material 84848.958 tonnesMass of aluminum 80252.954 tonnesMass of steel fasteners 4596.004 tonnesMass of glass 84848.958 tonnes
Structural Parameters

28 May 2002 136
Attitude & OrbitDetermine attitude and orbit from design requirement for sun-pointing platformMaintain attitude and orbitPropellant type may change as raw materials from Moon become availableCompute eclipse time
Designrequirements
Propellant type and needs
Spin stabilizationscheme
Maximumeclipse time
Spaceenvironment
Structures
28 May 2002 137
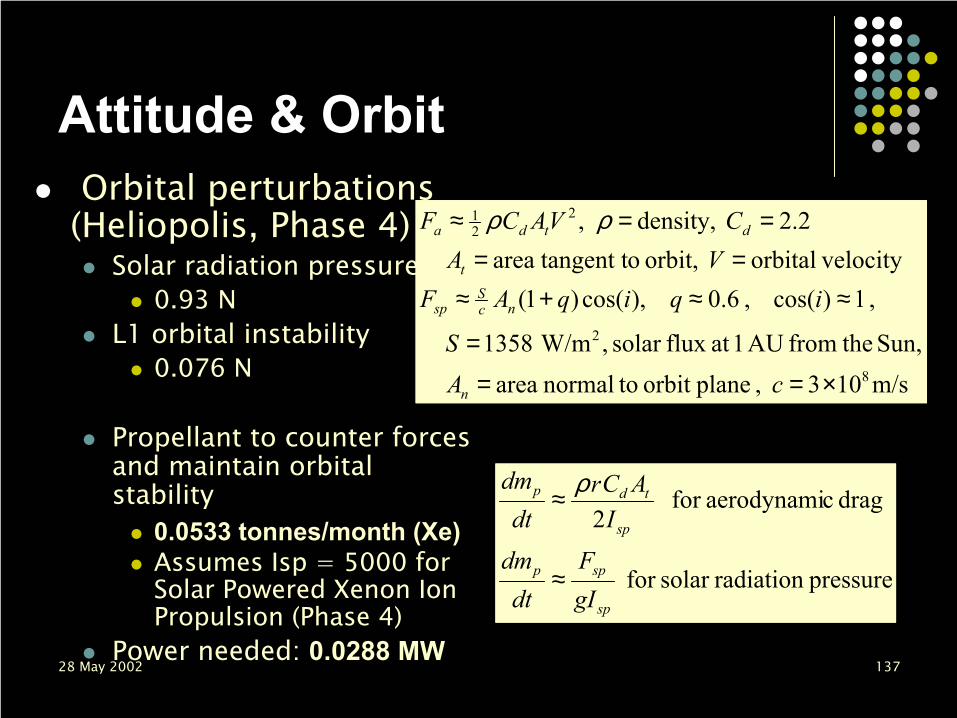
Attitude & OrbitOrbital perturbations
(Heliopolis, Phase 4)Solar radiation pressure
0.93 NL1 orbital instability
0.076 N
Propellant to counter forces and maintain orbital stability
0.0533 tonnes/month (Xe)Assumes Isp = 5000 for Solar Powered Xenon Ion Propulsion (Phase 4)
Power needed: 0.0288 MW
m/s103 ,planeorbit tonormal areaSun, thefrom AU 1at flux solar ,W/m1358
,1)cos(,6.0),cos()1( velocityorbital orbit, o tangent tarea
2.2 density,,
8
2
221
×===
≈≈+≈==
==≈
cAS
iqiqAFVA
CVACF
n
ncS
sp
t
dtda ρρ
pressureradiation solar for
drag caerodynamifor 2
sp
spp
sp
tdp
gIF
dtdm
IACr
dtdm
≈
≈ ρ

28 May 2002 138
Attitude & OrbitEuler angles
(pitch, yaw, roll) = (θ,φ,ψ)
Rotation ratesωz = 1 rpmωx = ωy = 0
zx
y
z
rotation ofcolony
spin axis (pointing roughly out of ecliptic)

28 May 2002 139
Attitude & OrbitMoments of inertia for an n concentric torus structure
3,2,1for ,
:sumsimply we,,,1 where, and ,, moments with toriconcentric For
when 2 :Notice torus.of mass ness,skin thick
radiusminor radius,major :where
)(
)(
1
321
212
221
45
31
223
2
==
=
<<≈==
==
+==
+=
∑=
iII
naIIIn
rstIIMtsr
MrstII
MrstI
n
a
aii
aaa La=1,…,n,

28 May 2002 140
Attitude & OrbitTorque
estimatesGravity gradient
Aerodynamic
Solar radiation pressure
Magnetic field 3152
E
233
m tesla1096.7,=
vehicle,ofmoment dipole residual,
m895,%1,
km6800orbit of radius,GM=
vertical,fromdeviation ,||
3
3
×=
=≈
≈
≈=≈
≈=
=−≈
MB
DDBT
cFT
LLc
cFT
R
IIT
RM
m
gspsp
ggaa
Rg
δ
δδ
µψψµ

28 May 2002 141
Attitude & OrbitTorque estimates for Heliopolis, Phase 4
~0Magnetic field8.34 Nm per 1% of δcgSolar radiation
pressure
~0Aerodynamic0.005 Nm per deg of ψGravity gradient
28 May 2002 142
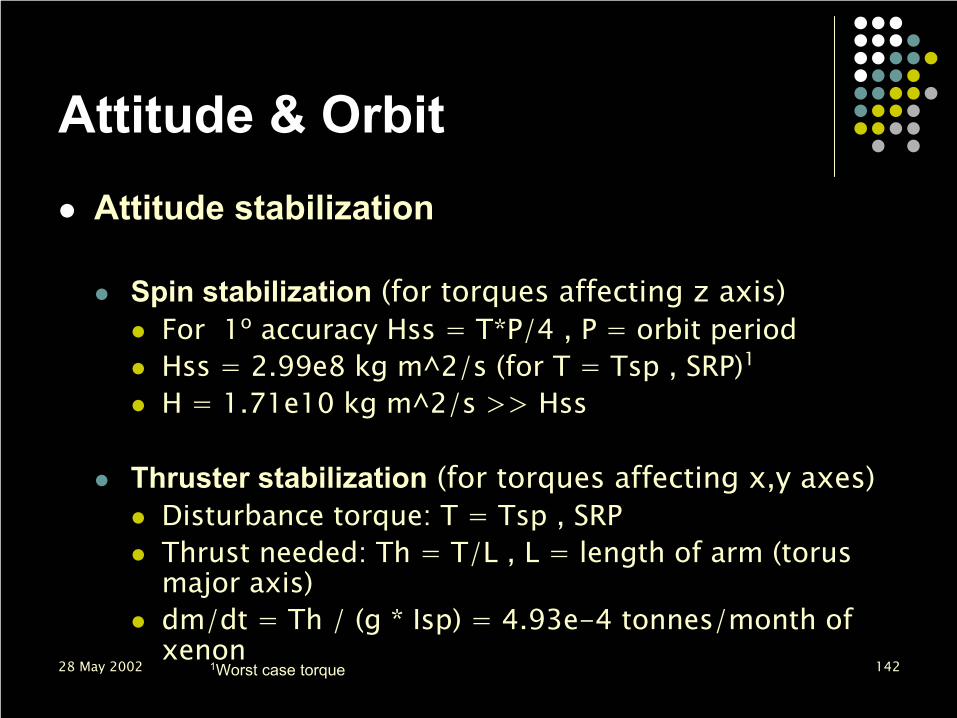
Attitude & OrbitAttitude stabilization
Spin stabilization (for torques affecting z axis)For 1o accuracy Hss = T*P/4 , P = orbit periodHss = 2.99e8 kg m^2/s (for T = Tsp , SRP)1H = 1.71e10 kg m^2/s >> Hss
Thruster stabilization (for torques affecting x,y axes)Disturbance torque: T = Tsp , SRPThrust needed: Th = T/L , L = length of arm (torusmajor axis)dm/dt = Th / (g * Isp) = 4.93e-4 tonnes/month of xenon
1Worst case torque
28 May 2002 143
Attitude & OrbitEclipses
Very rare in Lunar L1 halo orbit
ConclusionsConclusionsSolar radiation pressure is dominant perturbationSolar powered xenon ion propulsion is adequateFor attitude maintenance, spin stabilization with a few thrusters is adequate

28 May 2002 144
TransportationTransporting people and materials between Earth, L1 colony, & GEOPropellant requirements from astrodynamics calculations and rocket equationsMore advanced launch vehicles and space tugs for each phase, using advanced technology, extraterrestrial resources as they become available
Personnelneeds
Shuttle and Tugfrequency
Propellant needed
Raw materialsfrom Earth
Finished goodsfor exports

28 May 2002 145
SHANTY TOWN
SPS’sSPS’s AND AND COMMSATSCOMMSATS
GEO
L1
MOON’S SURFACE
~ 9 km/s
LEO
~ 4 km/s
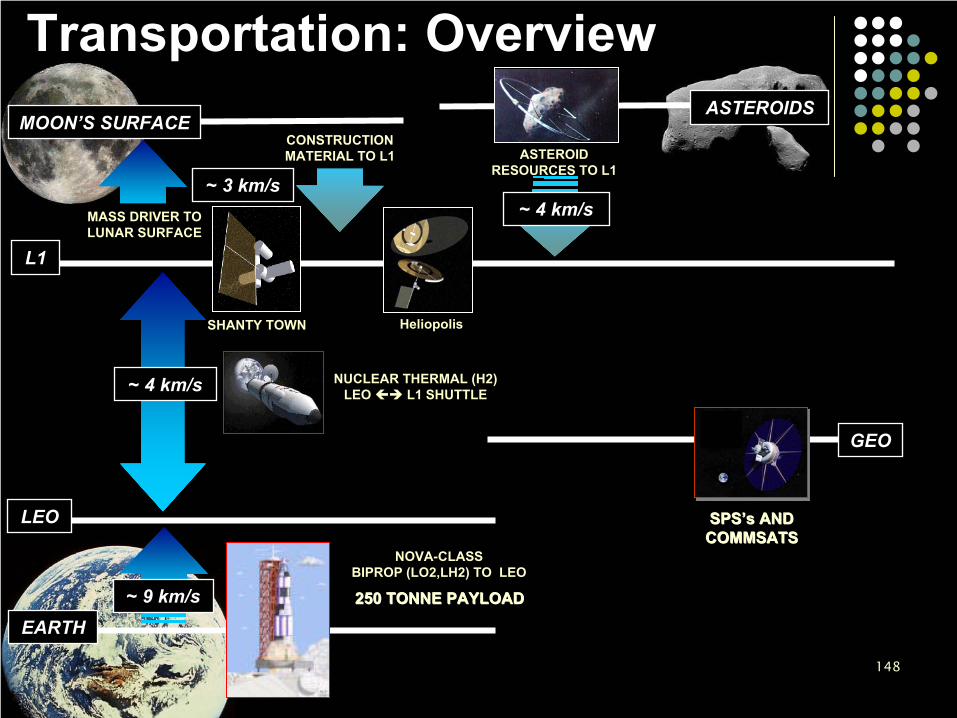
Transportation: Overview
EARTH

28 May 2002 146
SPS’sSPS’s AND AND COMMSATSCOMMSATS
SHANTY TOWN
GEO
L1
MOON’S SURFACE
~ 9 km/s
LEO
~ 4 km/s
Transportation: Overview
250 TONNE PAYLOAD250 TONNE PAYLOAD
NOVA-CLASSBIPROP (LO2,LH2) TO LEO
NUCLEAR THERMAL (H2)LEO L1 SHUTTLE
EARTH

28 May 2002 147
SPS’sSPS’s AND AND COMMSATSCOMMSATS
SHANTY TOWN
GEO
L1
MOON’S SURFACE
EARTH~ 9 km/s
LEO
~ 4 km/s
Transportation: Overview
250 TONNE PAYLOAD250 TONNE PAYLOAD
NOVA-CLASSBIPROP (LO2,LH2) TO LEO
NUCLEAR THERMAL (H2)LEO L1 SHUTTLE
Heliopolis
MASS DRIVER TO LUNAR SURFACE
CONSTRUCTION MATERIAL TO L1
~ 3 km/s
28 May 2002 148
SPS’sSPS’s AND AND COMMSATSCOMMSATS
SHANTY TOWN
GEO
L1
MOON’S SURFACE
EARTH~ 9 km/s
LEO
~ 4 km/s
Transportation: Overview
250 TONNE PAYLOAD250 TONNE PAYLOAD
NOVA-CLASSBIPROP (LO2,LH2) TO LEO
NUCLEAR THERMAL (H2)LEO L1 SHUTTLE
Heliopolis
MASS DRIVER TO LUNAR SURFACE
CONSTRUCTION MATERIAL TO L1 ASTEROID
RESOURCES TO L1
~ 4 km/s
ASTEROIDS
~ 3 km/s
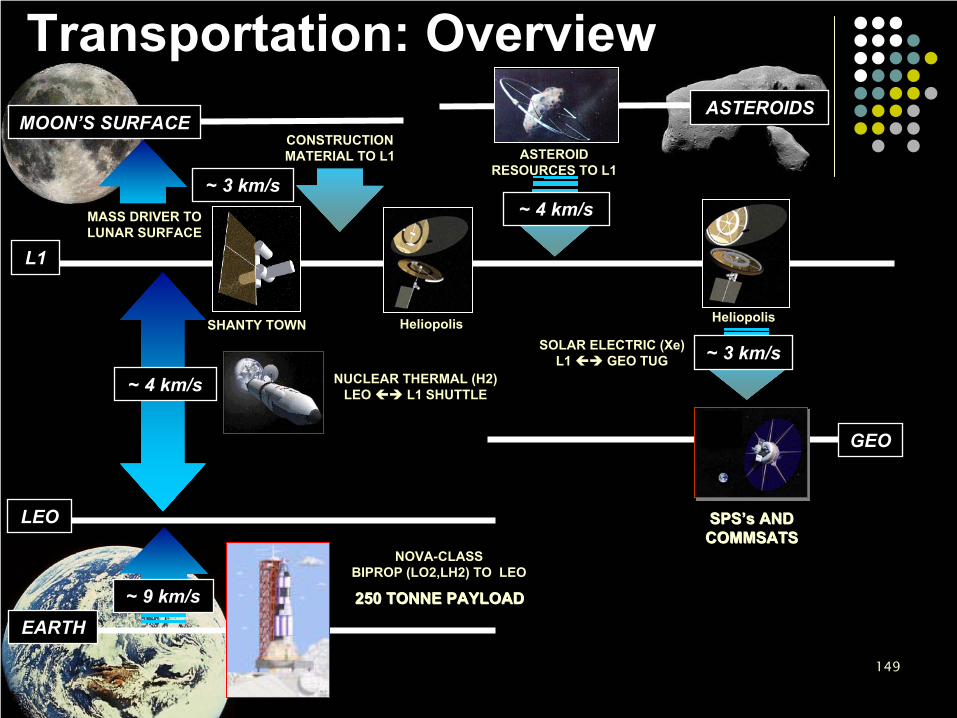
28 May 2002 149
SOLAR ELECTRIC (Xe)L1 GEO TUG
SPS’sSPS’s AND AND COMMSATSCOMMSATS
SHANTY TOWN
GEO
L1
MOON’S SURFACE
EARTH~ 9 km/s
LEO
~ 4 km/s
Transportation: Overview
250 TONNE PAYLOAD250 TONNE PAYLOAD
NOVA-CLASSBIPROP (LO2,LH2) TO LEO
NUCLEAR THERMAL (H2)LEO L1 SHUTTLE
Heliopolis
MASS DRIVER TO LUNAR SURFACE
CONSTRUCTION MATERIAL TO L1 ASTEROID
RESOURCES TO L1
~ 4 km/s
ASTEROIDS
Heliopolis
~ 3 km/s
~ 3 km/s

28 May 2002 150
Earth Parking Orbit to Earth-Moon L1 ∆V Cost vs. Flight Time
3000
4000
5000
6000
0 10 20 30 40 50 60 70 80 90 100 110 120 130 140 150
Flight Time (hours)
Tota
l ∆V
(m/s
)
E2LP-Based Data
Arrival at Lunar Perigee
Arrival at Lunar Apogee
Initial Circ. Earth Parking Orbit Altitude = 407 km Orbit Incl. Wrt Equator = 51.6o
Orbit Incl. wrt Earth-Moon Plane = 28.15o
Data from Condon and Pearson [2001]
From Low Earth OrbitImpulsive propulsion
Transportation: Delta V to L1

28 May 2002 151
Earth to L1 ColonyMaterial transport / trip frequency
LEO/L1: Inputs
Material to L1 Colony
0
500
1000
1500
2000
2500
Material to L1 Colony (tonnes/month)
tonn
es/m
onth
Phase 0Phase 1Phase 2Phase 3Phase 4
Launches to L1 Colony
0.0
1.0
2.0
3.0
4.0
5.0
6.0
7.0
8.0
9.0
10.0
Shuttle trip frequency (#/month)
#/m
onth
Phase 0Phase 1Phase 2Phase 3Phase 4

28 May 2002 152
#6050403020# of passengers
tonnes11210696.395.798.4Mprop
tonnes20.926.931.841.449.6Mstructure
tonnes382383378387398Mtotal
m/s65005300410039003900Delta-V
days11.52.533One-way TOF
%12%16%20%25%25%Tankage Factor
%3%4%5%7%10%Structure
Factor
sec12501125100010001000Isp
43210Phases
Launch Services: Earth to LEOLEO payload = 250 tonnes 250 tonnes (NOVA-class)biprop, LO2/LH2
LEO L1 Colony “Shuttle”Nuclear thermal, 250 tonnes250 tonnes of payload to L1Propellant: H2
Phases 0-2 : Purchased from Earth unless lunar source discoveredPhases 3+ : Available from retrieved asteroid
LEO/L1: Assumptions/Outputs
Assumptions
Outputs
Ross: Faster transit with time
Ross: 10 more each phase
Sercel: Technological progress
Sercel: Technological progress
Sercel: Technological progress
Assumption Source

28 May 2002 153
L1/GEO: InputsL1 Colony GEO “Tug”
L1 Colony to GEO Tug Frequency
0
0.1
0.2
0.3
0.4
0.5
0.6
Tug frequency to GEO (#/m onth)
#/m
onth
Phase 0Phase 1Phase 2Phase 3Phase 4

28 May 2002 154
L1/GEO: Assumptions/OutputsL1 Colony GEO “Tug”
Required for Phases 2 – 445,000 tonne SPS delivered to GEO in 14 daysSolar Electric PropulsionPropellant: Xenon, purchased from Earth-based supplier
m/s324132413241Delta-V
sec500040003500Isp
XenonXenonXenonType
tonnes450524505445064Mtotal
tonnes46.247.752.2Mstructure
tonnes1.012.527.20Msolararray
tonnes0.0660.1310.262Mthrusters
tonnes2.983.724.25Mprop
MW2.012.522.88Power
N120.7120.7120.7Thrust
tonnes/MW0.501.002.50Power Factor
%5%8%10%Tankage Factor
%0.10%0.10%0.10%Structure Factor
N/tonne1840.0920.0460.0Thrust per unit mass
N/MW59.947.941.9Thrust per unit power
days14.014.014.0Round-trip TOF
432Phases
Assumptions
Outputs
Parker
Ross:Technological progress
Ross
Ross: Twice each phase
Ross: Scaled with Isp
Ross: two weeks
Ross:Technological progress
Sercel/Ross: Existing technology
Assumption Source

28 May 2002 155
Propellant for tugPropellant for tugEdelbaum’s equation: ∆V2 = V0
2 + V12 – 2 V0V1cos(π i / 2)
where V0, V1 = circular orbital velocities, i = change in inclination in degrees∆V = 3.24 km/s from L1 to GEOSPS: mpl = 45,000 tonnesRoundtrip time: t = 14 days, Thrust: T = ∆V*m/t = 121 N Total thruster mass = 60.7 tonnesPropellant estimate: mp = T/(g Isp ) t
Tug: roundtrip to GEOmp = 4,660 tonnes/tripFor Isp = 3200 s in Phase 1
Image from Boeing website: www.hughespace.com/factsheets/xips/xips.html
Continuous Thrust Calculation
28 May 2002 156
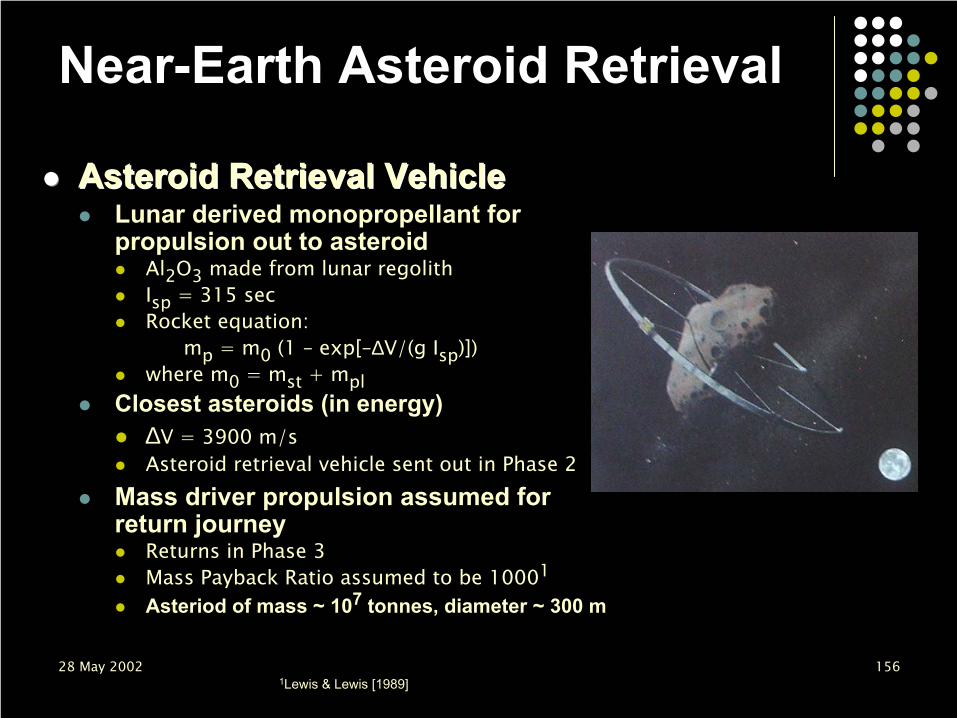
Asteroid Retrieval Vehicle Asteroid Retrieval Vehicle Lunar derived monopropellant for propulsion out to asteroid
Al2O3 made from lunar regolithIsp = 315 secRocket equation:
mp = m0 (1 – exp[–∆V/(g Isp)])where m0 = mst + mpl
Closest asteroids (in energy)∆V = 3900 m/sAsteroid retrieval vehicle sent out in Phase 2
Mass driver propulsion assumed for return journey
Returns in Phase 3Mass Payback Ratio assumed to be 10001
Asteriod of mass ~ 107 tonnes, diameter ~ 300 m
1Lewis & Lewis [1989]
Near-Earth Asteroid Retrieval
28 May 2002 157
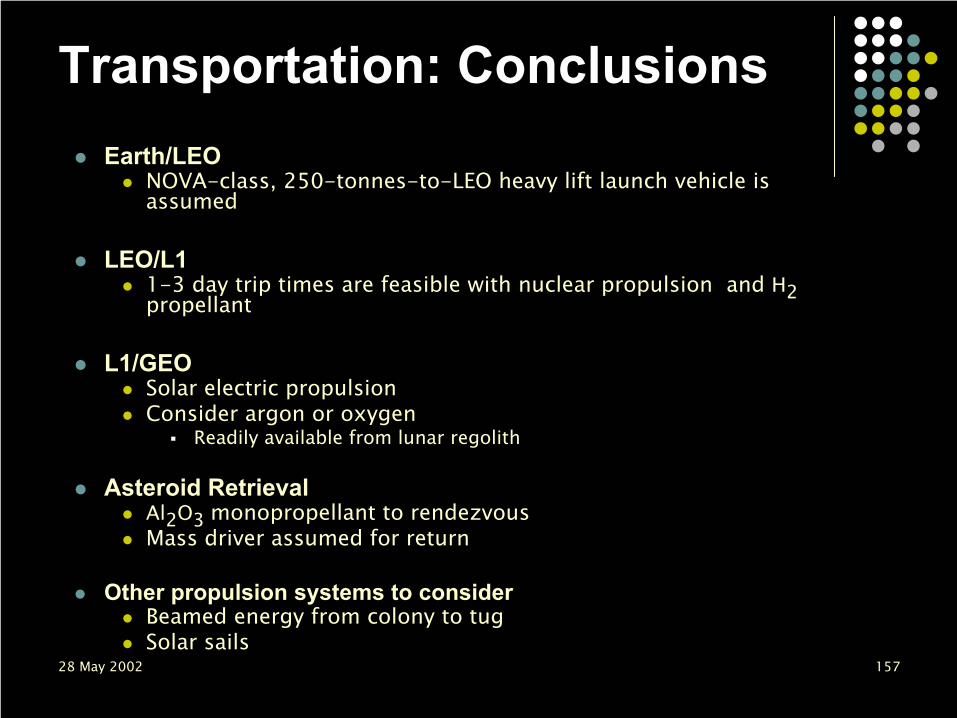
Earth/LEONOVA-class, 250-tonnes-to-LEO heavy lift launch vehicle is assumed
LEO/L1 1-3 day trip times are feasible with nuclear propulsion and H2propellant
L1/GEOSolar electric propulsionConsider argon or oxygen
Readily available from lunar regolith
Asteroid Retrieval Al2O3 monopropellant to rendezvousMass driver assumed for return
Other propulsion systems to considerBeamed energy from colony to tugSolar sails
Transportation: Conclusions

28 May 2002 158
Radiation ShieldingSpace environment near chosen orbit dictates radiation shielding necessaryData taken from spacecraft data and models of Earth’s magnetic fieldRadiation dose required to be lowStorm shelters for solar flares
Orbit
Mass shieldingnecessary
Storm shelters
Personnel
Slag fromRefining

28 May 2002 159
Requirement: Personnel dosage below 0.25 rem/yearL1 orbit requires radiation shielding
Solar cosmic particle radiation flux is uni-directional due to Earth’s magnetic field, and is the most harmful1Omni-directional shielding for galactic cosmic raysAllow for windows
Radiation Shielding
1 Thomas F. Tascione, Introduction to the Space Environment (2nd ed) [1994], p. 141.
28 May 2002 160
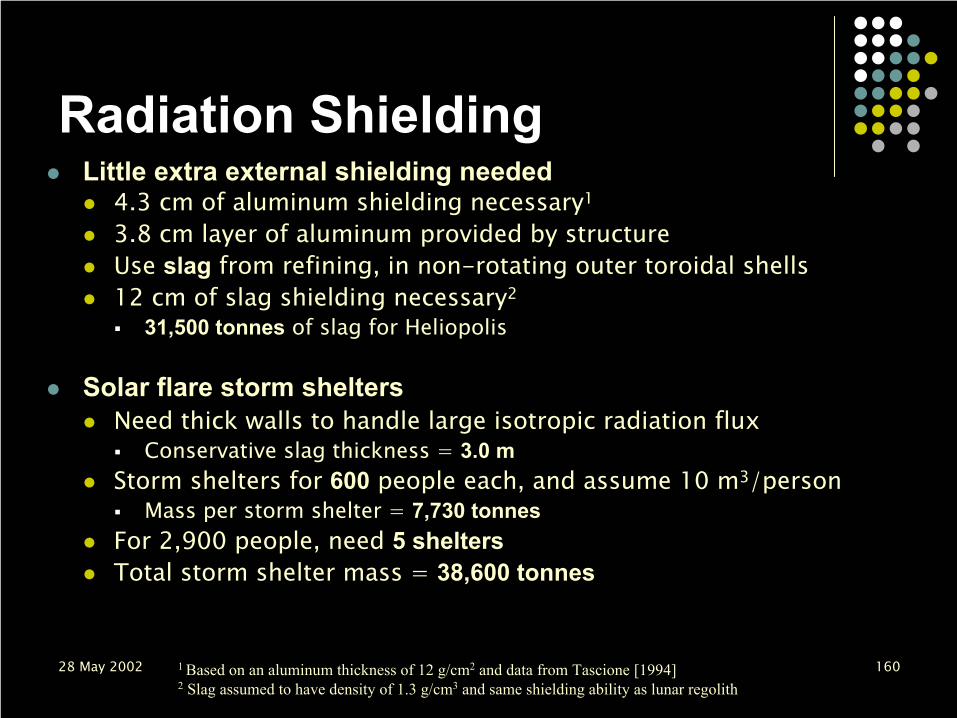
Radiation ShieldingLittle extra external shielding needed
4.3 cm of aluminum shielding necessary1
3.8 cm layer of aluminum provided by structure Use slag from refining, in non-rotating outer toroidal shells12 cm of slag shielding necessary2
31,500 tonnes of slag for Heliopolis
Solar flare storm sheltersNeed thick walls to handle large isotropic radiation flux
Conservative slag thickness = 3.0 mStorm shelters for 600 people each, and assume 10 m3/person
Mass per storm shelter = 7,730 tonnesFor 2,900 people, need 5 sheltersTotal storm shelter mass = 38,600 tonnes
1 Based on an aluminum thickness of 12 g/cm2 and data from Tascione [1994]2 Slag assumed to have density of 1.3 g/cm3 and same shielding ability as lunar regolith
28 May 2002 161
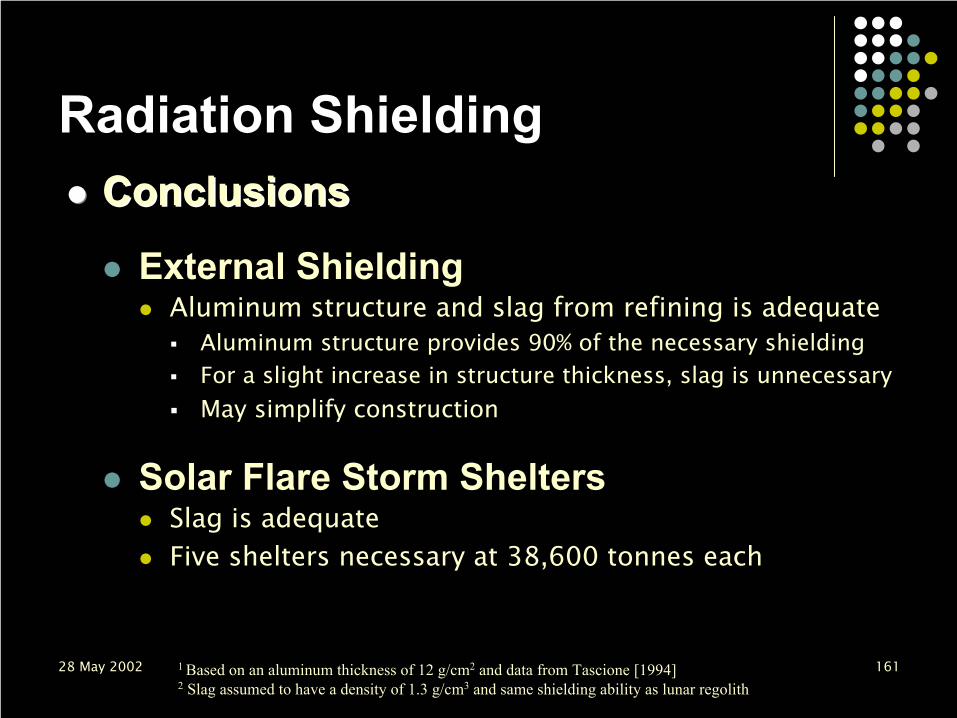
Radiation ShieldingConclusionsConclusions
External ShieldingAluminum structure and slag from refining is adequate
Aluminum structure provides 90% of the necessary shieldingFor a slight increase in structure thickness, slag is unnecessaryMay simplify construction
Solar Flare Storm SheltersSlag is adequateFive shelters necessary at 38,600 tonnes each
1 Based on an aluminum thickness of 12 g/cm2 and data from Tascione [1994]2 Slag assumed to have a density of 1.3 g/cm3 and same shielding ability as lunar regolith
28 May 2002 162
Technical Study: OverviewDesign Problems/Requirements & SolutionsShanty Town DescriptionHeliopolis DescriptionSystem-Level SummaryDiscussion of Economic ModelExplanation of Subsystem ModelsSummary
28 May 2002 163
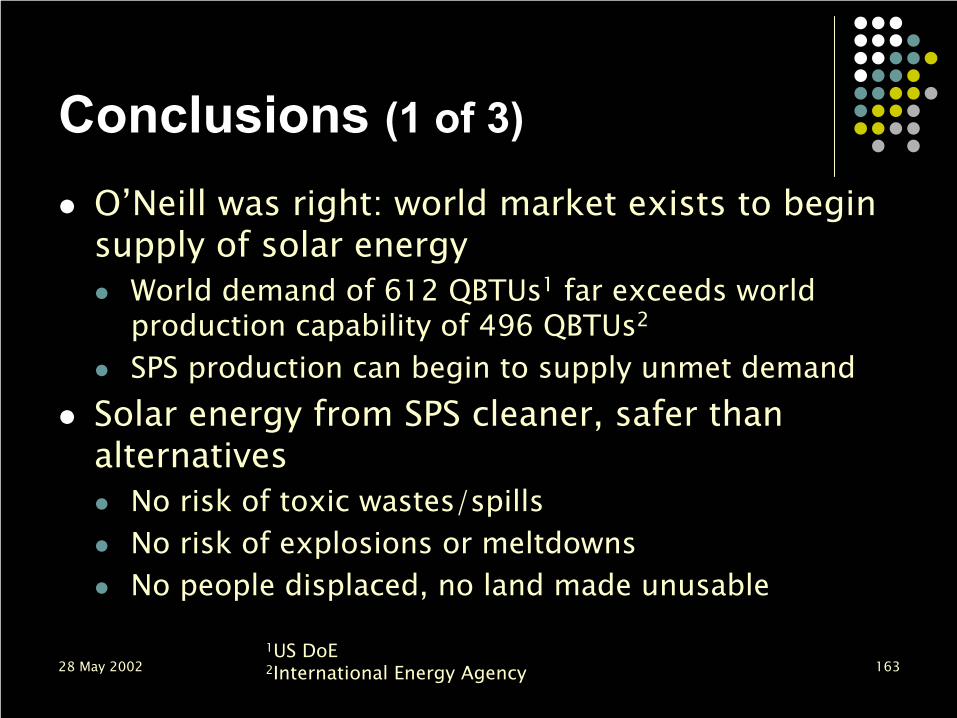
Conclusions (1 of 3)
O’Neill was right: world market exists to begin supply of solar energy
World demand of 612 QBTUs1 far exceeds world production capability of 496 QBTUs2
SPS production can begin to supply unmet demandSolar energy from SPS cleaner, safer than alternatives
No risk of toxic wastes/spillsNo risk of explosions or meltdownsNo people displaced, no land made unusable
1US DoE2International Energy Agency

28 May 2002 164
Conclusions (2 of 3)
LSMD study comparable to 1975 Stanford studyDifferences reflect 25 years of technological advances
However: LSMD study represents fundamentally new analysis
Integrated cost model demonstrates project’s economic feasibility
Technology exists or can be designed to begin project in the next 20 years

28 May 2002 165
Conclusions (3 of 3)
Economic profit returned in 20 yearsPositive cash flow in 15 yearsInitial investment of $106 billionSelf-sufficiency and internalizing costs critical to project success
Power requirements dominated by industrial refinery needsProject cost driven by food production
Low mass, but biomass only available from EarthPersonnel costs surprisingly insignificant