the next level - the straits trading company limited · house holdings plc (a company listed on the...
TRANSCRIPT

2008
The Straits Trading Company Limited
(A member of The Tecity Group)


The Next Level

The Straits Trading Company Limited
Annual Report 2008
Though the introduction of newleadership may call for a remapping ofdirection and strategies, it is the visionof a shared destination that guides theCompany in its journey towards furtherbreakthroughs.

7Corporate Information
16Business Review
31Key Executives
40Financial Calendar
4Board of Directors
10Chairman’s Statement
26Group Financial Highlights
33Corporate Governance
41Financial Report
139Shareholder Information 141
Notice of Meeting
Proxy Form
The Next Level : Taking To New Heights
2008

*pg
04
The Straits Trading Company Limited
Annual Report 2008
Ms Chew Gek Khim, ChairmanLLB (Hons)Non-Independent & Non-Executive Director
Ms Chew joined the Board on 20 March 2008 and was appointed Non-Executive and Non-Independent Chairman on 24 April 2008. Ms Chew is the Executive Chairman of the TecityGroup of private investment companies, the parent company of the Company. She also serveson the board of CapitaRetail China Trust Management Limited, a listed trust of the CapitaLandGroup with retail malls in China. Ms Chew is also the Deputy Chairman of the Tan Chin TuanFoundation in Singapore and the Tan Sri Tan Foundation in Malaysia. Active in communityand public service, Ms Chew is also chairman of the National Environment Agency Board andserves as member on the board of the Singapore Totalisator Board. She was a director of thelisted FJ Benjamin Holdings Ltd (2007 to 2008), a fashion retailer in Singapore; and served asmember on the board of National Heritage Board (2005 to 2008) and Advisory Board of theFaculty of Law at the National University of Singapore (2007 to 2008).
A lawyer by training, Ms Chew graduated from the National University of Singapore and practisedlaw with the local law firm, Drew & Napier, before she joined the Tecity Group in 1987.
Last Re-elected
2008
Mr Michael HwangPBM, MA, BCL
Independent & Non-Executive Director
Mr Hwang, a Senior Counsel and international arbitrator, was first appointed to the Board in1989. Upon his appointment as a Judicial Commissioner of the Supreme Court in 1991, heresigned from the Board, but rejoined the Board in 1993. Currently the President of the LawSociety of Singapore, he also sits on the board of YTL Pacific Star REIT Management Ltd, andchairs the Singapore Dance Theatre Limited. Mr Hwang also serves as Singapore’s Non-ResidentAmbassador to Switzerland, and as the deputy chief justice of the Dubai International FinancialCentre Court. A former partner of M/s Allen & Gledhill (now known as M/s Allen & GledhillLLP), Mr Hwang now heads his own law firm ‘Michael Hwang S.C.’ which services other lawfirms and specialises in arbitration matters. He is also a Fellow of the Singapore Institute ofDirectors, and a former board member of the Port of Singapore Authority and its successor PSACorporation Ltd (1995 to 2000), as well as Del Monte Pacific Limited (1999 to 2008) andLasalle Foundation Limited (2004 to 2008).
Last Re-elected
2007
Last Re-elected
2008
Tan Sri Dato’ Dr Lin See-YanPSM, DPMP, DSAP, JMN, JSM, AMN, BA (Hons), MPA, MA, PhD, C StatIndependent & Non-Executive Director
Tan Sri Lin, a London trained Chartered Statistician, is also banker and economist. He has beena Director since 1994 and presently sits on boards of the Great Eastern Holdings Ltd Group andSilverlake Axis Limited in Singapore, as well as Ancom Bhd, F&N Holdings Bhd, Genting Bhd,Resorts World Bhd, JobStreet Corporation Berhad, KrisAssets Holdings Berhad and Wah SeongCorporation Berhad in Malaysia. He continues to serve the public interest, including Member,Prime Minister’s Economic Council & National Innovation Council as well as the NationalCommittee to Transform Higher Education; and Economic Advisor, Associated ChineseChambers of Commerce and Industry of Malaysia. Dr Lin is Pro-Chancellor, Science UniversityMalaysia. Tan Sri is also Chairman Emeritus of the Harvard Graduate School of Arts & SciencesAlumni Council at Harvard University as well as its Harvard Alumni Association’s RegionalDirector for Asia, in addition to being President, Harvard Club of Malaysia. Prior to 1998, hewas Chairman and Chief Executive Officer of the Pacific Bank Group and for 14 years previously,Deputy Governor of Bank Negara Malaysia, having been a central banker for 34 years. Tan SriLin also served as director of Khazanah Nasional Malaysia (1994 to 2000) and was Chairmanof its Executive Board (1999 to 2000).

*pg
05
The Next Level : Taking To New Heights
Board of Directors / continued
Mr Norman Ip Ka Cheung, President & Group CEOB Sc (Econs), CPANon-Independent & Executive Director
Appointed to the Board in 2000, Mr Ip, a Chartered Accountant and a Fellow of the Instituteof Chartered Accountants in England and Wales, is the President & Group Chief ExecutiveOfficer. He was the former Chief Financial Officer and General Manager of the Group from1990 to 1999. Prior to joining the Group in 1983, he was with Ernst & Whinney (now knownas Ernst & Young LLP), specializing in audits of conglomerates. Mr Ip also serves as the Chairmanof Malaysia Smelting Corporation Berhad, the Group’s listed subsidiary in Malaysia, and sits onthe board of Australia Oriental Minerals NL, a public listed company in Australia, as well asother subsidiaries of the Group. Mr Ip is also a director of WBL Corporation Limited, a listedcompany in Singapore. He was formerly a director of Killinghall (Malaysia) Berhad (1993 to2006).
Last Re-elected
2008
Mr Razman AriffinB Sc (Eng), ARSM, MIME(M)
Independent & Non-Executive Director
Mr Ariffin was appointed to the Board in December 2006. He graduated from the ImperialCollege of Science and Technology at the University of London, England with first class honoursin mining engineering in 1972. Mr Ariffin’s rich involvement in the mining, metallurgical andenergy industries spans over 30 years, starting as production and planning engineer with Osborne& Chappel Sdn Bhd, then as petroleum engineer with Sarawak Shell Berhad. He was thenattached to the Malaysia Mining Corporation Berhad Group (now known as MMC CorporationBerhad Group) serving in various capacities over the years. In 1985, Mr Ariffin joined MalaysiaSmelting Corporation Berhad (MSC) as general manager and was its Chief Executive Officerwhen he left in 1994. Currently an independent strategic and corporate consultant, Mr Ariffinalso sits on the board of MSC and is Chairman of PT Koba Tin in Indonesia. He was the formerManaging Director of Trenergy (M) Berhad and Crest Petroleum Bhd, both companies listedon Bursa Malaysia.
Last Re-elected
2007
Mr Gerard Ee Hock KimFCPA (Singapore)Independent & Non-Executive Director
Appointed to the Board in December 2007, Mr Ee was a practising accountant from 1976 untilhe retired as an Audit Partner of Ernst & Young, Singapore (now known as Ernst & Young LLP)in June 2005. Mr Ee is actively involved in community services. Previously the Chairman of theNational Volunteer Centre and a Nominated Member of Parliament from 1997 to 2002, Mr Eecurrently chairs the National Kidney Foundation (NKF), Public Transport Council, Councilfor Third Age Limited and Medifund Advisory Council. He also sits on the board of FinancialIndustry Disputes Resolution Centre Limited. In 2007, Mr Ee was conferred the MeritoriousService Medal in Singapore in recognition of his steadfast leadership as Chairman of the NKFand President of the National Council of Social Services.Last Re-elected
2008

*pg
06
The Straits Trading Company Limited
Annual Report 2008
Mrs Elizabeth SamBA (Hons) EconomicsIndependent & Non-Executive Director
Mrs Sam brings with her more than 40 years of experience in the financial sector, having heldsenior positions in the Ministry of Finance, the Monetary Authority of Singapore, MercantileHouse Holdings PLC (a company listed on the London Stock Exchange) and Oversea-ChineseBanking Corporation Limited. Currently a director of Boardroom Limited, SC GlobalDevelopments Ltd, The Banyan Tree Holdings Ltd, AV Jennings Ltd, Kasikorn Bank and STAsset Management Pte Ltd; Mrs Sam was the Chairman of the Singapore International MonetaryExchange of Singapore (SIMEX) (1993 to 1996) and Investment Management Association ofSingapore (1997 to 1999). She was a member of the Trade Development Board (1989 to 1994).
In 1996, Mrs Sam was awarded the Public Service Star (BBM), Republic of Singapore for hercontributions to financial centre developments. Mrs Sam graduated from the University ofSingapore with BA (Hons) Economics.
Appointed
30 April 2008
Ms Chew Gek HiangB Acc (Hons), CPA
Non-Independent & Non-Executive Director
An accountant by training, Ms Chew has been with the Tecity Group of private investmentcompanies, the parent company of the Company, since 1991. As Executive Director and Headof Finance, she is actively involved in the investment activities of the Tecity Group and isresponsible for its securities trading portfolio. She also oversees the human resource andadministrative functions in the Tecity Group. Currently serving on the advisory panel of theGST Review Board, Ms Chew is also a Council Member of the Tan Chin Tuan Foundation inSingapore and the Tan Sri Tan Foundation in Malaysia. She is also President of Noah’s ArkCARES (Companion Animal Rescue and Education Society), a non-profit animal welfare societywhich champions responsible pet ownership and active sterilization and microchipping of straydogs and cats in Singapore and Johore.
Ms Chew graduated from the National University of Singapore in 1986. She joined Ernst &Young (London) in 1987 to pursue her chartered accountancy and was admitted to the Instituteof Chartered Accountants in England and Wales in October 1990.
Mr David Goh Kay YongBA (Hons), SM (MIT), CFANon-Independent & Non-Executive Director
Mr Goh is the Chief Investment Officer and Chief Strategist of the Tecity Group of privateinvestment companies, the parent company of the Company. In this position, he is responsiblefor providing strategic focus in the investment decision-making process and assists the ExecutiveChairman in developing the Tecity Group’s long-term investment policy and asset allocationstrategy. He also oversees a team of investment managers/analysts within the Tecity Group.Presently the non-executive chairman of Yeoman Capital Management Pte Ltd (an exempt fundmanager), Mr Goh also serves as non-executive director of Pastamatrix International Pte Ltd,Stewardship Capital Pte Ltd and Stewardship Equity Pte Ltd. Mr Goh started his investmentcareer as an Investment Analyst with Great Eastern Life in 1986, and went to teach at theNanyang Technological University in the Bachelor of Business Financial Analyst programme in1991 whilst continuing as Investment Research Consultant to DBS Securities, and InvestmentManagement Consultant to Great Eastern Life. In 1997, he was appointed as an Adjunct AssociateProfessor of Finance at the Nanyang Technological University, Singapore.
Mr Goh holds a Bachelor of Arts (Hons) degree in Economics from York University, Canada;a Master of Science in Management (System Dynamics, Finance and Strategy) from MassachusettsInstitute of Technology’s Sloan School of Management, as well as a CFA Charter.
Appointed
30 April 2008
Appointed
30 April 2008

*pg
07
The Next Level : Taking To New Heights
InformationCorporate
BOARD OF DIRECTORS
Ms Chew Gek Khim, Chairman
LLB (Hons)
Mr Michael Hwang
PBM, MA, BCL
Tan Sri Dato’ Dr Lin See-Yan
PSM, DPMP, DSAP, JMN, JSM, AMN,
BA (Hons), MPA, MA, PhD, C Stat
Mr Norman Ip Ka Cheung, President & Group CEO
B Sc (Econs), CPA
Mr Razman Ariffin
B Sc (Eng), ARSM, MIME(M)
Mr Gerard Ee Hock Kim
FCPA (Singapore)
Mrs Elizabeth Sam
BA (Hons) Economics
Ms Chew Gek Hiang
B Acc (Hons), CPA
Mr David Goh Kay Yong
BA (Hons), SM (MIT), CFA
SECRETARIES
Mrs Victoria Tse
MBA, LLB (Hons), B Sc, CPA
Ms Emily Teo
LLB (Hons)
REGISTERED OFFICE
18 Cross Street #15-01,
Singapore 048423
CORPORATE OFFICES
18 Cross Street #15-01,
Singapore 048423
Tel : (65) 6513 9288
Fax : (65) 6534 7202
E-mail : [email protected]
Website : http://www.stc.com.sg
2 Lebuh Pasar Besar,
5th Floor, Straits Trading Building,
50050 Kuala Lumpur
Tel : (03) 2698 7126
Fax : (03) 2693 7542
E-mail : [email protected]
SHARE REGISTRARS
Tricor Barbinder Share Registration Services
(A division of Tricor Singapore Pte. Ltd.)
8 Cross Street #11-00,
PWC Building,
Singapore 048424
AUDITORS
Ernst & Young LLP
One Raffles Quay,
North Tower, Level 18,
Singapore 048583
Partner-in-charge : Mr Tan Seng Choon(Appointed with effect from financial year
ended 31 December 2006)
PRINCIPAL BANKERS
DBS Bank Ltd
Oversea-Chinese Banking Corporation Limited
Malayan Banking Berhad
Standard Chartered Bank

StrategizingPerformance
As Straits Trading enters into a new era, the need
for strategic review arises. It is only through a
periodic reassessment, that a corporation is able
to continuously strive towards uncharted
fields of excellence.
*pg
08
The Straits Trading Company Limited
Annual Report 2008

*pg
09
The Next Level : Taking To New Heights

*pg
10
The Straits Trading Company Limited
Annual Report 2008
In STC, our businessphilosophy is to create andenhance shareholder valueby improving on theefficiency of capitalemployed in order tomaximise returns for theGroup. ”
“
Ms Chew Gek Khim
Chairman
The Straits Trading Company Limited

*pg
11
The Next Level : Taking To New Heights
The Straits Trading Company Limited (STC) was acquired by The
Cairns Pte Ltd, a member of the Tecity Group, in April 2008. On
behalf of the Board of Directors, it is now my pleasure to present
to you the Annual Report for the financial year ended 31 December
2008.
The Tecity Group was founded by my late grandfather, Tan Sri Tan
Chin Tuan, who was Chairman of STC for many years in the last
century. The chairmanship of STC was, to Tan Sri Tan Chin Tuan,
symbolic of the emergence of local professional expertise from the
stranglehold of British colonialism.
CAPITAL INVESTMENT PHILOSOPHY
Tan Sri was an indomitable champion of capital discipline in
business management. This legacy has been so well handed down
that all the companies in the Tecity Group now operate on the
philosophy that the allocation of capital for each business unit
should yield an appropriate return compatible with the risks taken
in doing the business. To this end, the same discipline will now be
steadfastly applied to the STC Group and strategic reviews are
presently underway to ensure that business units which do not meet
this requirement would be reorganised or divested accordingly.
This also implies that new or fresh capital will only be allocated to
business operations that can justify meaningful returns in proportion
to the risks taken to do the business.
FY 2008 HIGHLIGHTS
2008 is a year many investors would rather forget as it was fraught
with so many uncertainties and problems in the banking and
financial world that eventually led to the current global economic
downturn almost reminiscent of the Great Depression of the 1930s.
Our business units in the Group were not spared the agonies of
falling capital asset values and demand leading to lower profits all
round.
I am, however, happy to report that notwithstanding the tough
economic and business conditions prevailing in 2008, the Group
was able to generate a total turnover of $1.25 billion, 12.7% higher
than the previous year’s results of $1.11 billion. Group profit before
tax, however, fell by 86.2% from $536.8 million in 2007 to $73.9
million in 2008. The sharp fall in profit is partly due to the inclusion
of exceptional gains of $420 million arising from a revaluation of
the Company’s real estate assets in 2007.
Excluding exceptional gains and fair value adjustments, the Group’s
pre-tax profit fell 62.6% from $100.5 million in 2007 to $37.6
million in 2008. This represents 2.39% of average shareholders
equity during the 2008 year and compares with a return of 5.3% in
the previous year.
INVESTMENT PORTFOLIO
Singapore’s GDP growth in the first half of 2008 was a healthy
4.6% notwithstanding the problems related to the sub prime
mortgage crisis in the US. However, the collapse of Lehman Brothers
on 15 September 2008 triggered the ensuing downfall of many
other financial institutions in the US and Europe. This historic
event led to a global credit squeeze of unprecedented proportions
and the subsequent global economic slowdown. Stock markets
worldwide saw sharp falls in the weeks following and the local
bourse was certainly not spared either.
Fortunately for STC, a strategic review of the Company’s assets
and businesses immediately following the Takeover, led to a timely
divestment programme for its investment portfolio. This was
fortuitous as the action not only resulted in a gain of $76.9 million
arising from the sale of $222 million of investment and marketable
securities but actually helped avoid the incurrence of huge capital
losses in the investment portfolio.
Statement
Dear Shareholders

OTHER OUTCOMES OF STRA TEGIC REVIEW
One of the key outcomes of the abovementioned strategic review
is a long-term plan to develop and build on STC’s existing businesses
such that each unit should be an engine of growth. To justify the
capital given by the parent company, each business engine must be
capable of growing at rates that will, over the long-term, yield
returns appropriate to the risks taken. I shall now expand on the
conceptual plan for each of the units reviewed in the strategic study.
(i) Property
We do not believe that STC should remain as a passive property
owner collecting rent from tenants of our completed residential
properties since management would be adding little value to such
an investment. In this regard, our completed residential properties
have been deemed “non-core” and will be divested at the appropriate
time and at suitable prices. The Group accordingly continued with
its disposal of the condominium units in Gallop Gables at Farrer
Road during the year under review. Gallop Green is in the process
of being strata-titled and will be disposed of when favourable market
conditions return.
To accommodate this strategic change, management has decided
to split the property division into two parts - Marketing, Sales and
Leasing and Property Development.
With regard to our property development arm, we will capitalise
on our creditable track record and the experience of our property
development team whenever opportunities arise. Where there are
synergies to tap from third parties, we may also consider tie-ups
with partners of reputable standing and financial strength.
(ii) Hospitality
The hospitality business presently comprises the 80%-owned hotel
management company, Rendezvous Hotels International Private
Limited (RHI) and the three hotel properties separately owned by
the Group in Singapore and Australia.
Notwithstanding the current recession and the sharp fall in tourist
arrivals worldwide, we have faith in the long-term potential of the
hospitality business. We are also of the view that the Rendezvous
Brand of hotels, pitched at the 4-star level, is in the right growth
segment of this industry.
RHI has been growing its business by way of procuring management
contracts and we believe that it is a reasonable platform for future
growth if we can further capitalise on these contracts and grow our
brand. Further, we are exploring ways to enhance the yield on our
three hotel properties as we perceive that shareholder value will
invariably be enhanced by combining RHI and the three hotel
properties under one business unit. A review of STC’s “Hospitality”
business is currently being undertaken with a view to re-organise
the hospitality operations and to map out future expansionary
directions.
(iii) Mining
We also hold a positive long-term view of the mining business as
we are convinced that the world, and particularly developing
countries such as India and China, will again step up their demand
for mining resources for their domestic economic development
once economic recovery takes place.
Currently, the Group’s l isted subsidiar y, Malaysia Smelting
Corporation Berhad (MSC), is the fourth largest tin smelter in the
world. It has mines and refining interests in six countries across a
spectrum of commodities.
A strategic review is being conducted at MSC with a focus on
improving its capital structure, reducing its gearing and matching
its future funding requirements. A macro analysis of the resource
industry will also be carried out to assist MSC in mapping out its
resource management programme.
Chairman’s Statement / continued
*pg
12
The Straits Trading Company Limited
Annual Report 2008

LOOKING AHEAD
In STC, our business philosophy is to create and enhance shareholder
value by improving on the efficiency of capital employed in order
to maximise returns for the Group. To achieve this goal, we will, as
far as possible, pursue an “asset light” strateg y whereby assets will
continue to be held only if we can be convinced that they have a
justifiable long-term return.
Growing the businesses mentioned above will take time and patience
and it is our belief that the current recession is the ideal time to
make strategic modifications to the various business units. We know
that these changes are fundamentally sound and, if properly executed,
the Company will have built a strong foundation and platform for
growth in the future.
DIVIDENDS
On the basis of proposals made in the strategic review, the Board
has recommended special dividends amounting to $2.50 per share.
When added to the 1st interim dividend of $0.02, total dividends
amount to $2.52 (tax exempt (one tier)), releasing a total of $821.2
million to all shareholders.
BOARD CHANGES
2008 saw the retirement of Mr Bobby Chin Yoke Choong, Mr Tang
I-Fang, Mr Michael Wong Pakshong and Professor Lim Chong Yah.
I wish to take this opportunity to thank them all for their many
years of sterling service. Mr Michael Hwang, who has been with the
Company since 1993, has expressed his desire not to seek re-election
at the upcoming AGM. On behalf of the Board and the Group, I
thank him for his invaluable contributions and service to the Group.
Mrs Elizabeth Sam, Ms Chew Gek Hiang, and Mr David Goh Kay
Yong were appointed as Directors on 30th April 2008. I welcome
Mrs Sam, Ms Chew, and Mr Goh to the Board.
I also wish to thank long-standing Board members Tan Sri Dato’ Dr
Lin See-Yan, Mr Razman Ariffin, Mr Gerard Ee Hock Kim and Mr
Norman Ip Ka Cheung , for their ongoing commitment and
invaluable counsel.
My appreciation also goes to all the Company’s shareholders, business
associates, financiers and clients for their unwavering support, and
to the Company’s employees for their unstinting dedication and
professionalism.
The world is now engulfed in a severe economic and financial
meltdown and this poses great challenges to all of us in STC.
However, the Company has encountered and survived the Great
Depression of the 1930s and two World Wars since its inception in
1887. I am therefore confident that with the right strategy and mind
set, the dedication, commitment and support of everyone in the
Company, we will weather the current turmoil and emerge stronger
to take STC to the next level.
CHEW GEK KHIM
Chairman
25 March 2009
*pg
13
The Next Level : Taking To New Heights
Chairman’s Statement / continued

*pg
14
The Straits Trading Company Limited
Annual Report 2008
A partnership is not merely about change, but more
importantly, the sharing and propagation of valuable
skill sets, connections and business philosophy. With
the amalgamation of an established management board
and the introduction of new leadership, Straits Trading
is set on realizing greater potential that would take the
Company to greater heights.

*pg
15
The Next Level : Taking To New Heights

*pg
16
The Straits Trading Company Limited
Annual Report 2008
BusinessReview
Metals and Mineral Resources
US$ Per TonneUS$ Per Tonne
US$
US$
11,000
12,000
13,000
14,000
15,000
16,000
17,000
18,000
19,000
20,000
21,000
22,000
23,000
24,000
25,000
11,000
12,000
13,000
14,000
15,000
16,000
17,000
18,000
19,000
20,000
21,000
22,000
23,000
24,000
25,000
2 0 0 8
Jan Feb M a r A p r May Jun Jul Aug Sep O c t Nov D e c
2008 TIN MARKET PRICES
LME 3 Mths Buying
KLTM Average Prices
Revenue from MSC grew 19% year-on-year from RM1.91 billion
to RM2.28 billion. However, metal prices and sales volumes fell
drastically in Q4 2008 as global demand plunged abruptly amid the
worsening global recession.
As a result, MSC experienced a pre-tax loss of RM24.69 million for
2008. The subsidiary would have reported a pre-tax profit if
impairment adjustments and foreign exchange losses were excluded.
MSC made an impairment charge on one of its major investments,
Asian Mineral Resources Limited (AMR), and also wrote off some
operating mining assets including expenditure incurred on
exploration and development projects. These items totalled RM57
million. Also, since greenback has appreciated against ringgit, MSC
incurred a forex loss of RM28 million mainly due to the translation
loss of MSC’s US dollar borrowings.
MSC produced 38,745 tonnes of refined tin metal in 2008, higher
than the 33,195 tonnes produced in 2007 despite lower output from
PT Koba Tin. Production from the Butterworth’s smelting and
refining operations had also increased from 25,471 tonnes in 2007
to 31,638 tonnes in 2008. Its mining unit, Rahman Hydraulic Tin
Sdn Bhd (RHT) performed much better, with tin-in-concentrates
production increasing 31% year-on-year to 1,526 tonnes. The
production increases were largely attributable to upgrading and
improvement works initiated in 2007.
Operations in Indonesia, particularly PT Koba Tin, continued to
be adversely affected by disruptions and the clamp-down by the
authorities on the independent small-scale mining activities.
However, PT Koba Tin’s operations remained profitable in 2008.
The Group’s investments to diversify its resource income streams
include :
an 18.4% stake in AMR, a New Zealand company listed on
Toronto Stock Exchange which owns and operates a high
grade nickel sulphide project in Vietnam,
a 22.5% stake in Beaconsfield Gold NL, a listed gold
mining company in Australia that has just turned around
their operations in Tasmania, Australia, and
“MSC produced 38,745 tonnes of refined
tin metal in 2008, higher than the 33,195
tonnes produced in 2007 despite lower
output from PT Koba Tin. Production
from the Butterworth’s smelting and
refining operations had also increased
from 25,471 tonnes in 2007 to 31,638
tonnes in 2008.”

*pg
17
The Next Level : Taking To New Heights
Business Review / continued
a 30% stake in a polymetallic copper, gold, zinc and silver
project in the Philippines, pursuant to a strategic alliance
agreement with LG International Corp and Korea Resources
Corporation.
In addition, MSC and Australia Oriental Minerals NL (the Group’s
aggregate 58.5% interest-owned subsidiary, with 42.7% held by MSC)
has each acquired a 30% stake in a coal development project in
Kalimantan, Indonesia. The mine began production in January 2009
and we have been able to minimise capital and cash outlay through the
utilisation of contractors’ services and pre-shipment sales advances.
In H2 2008, MSC proposed a bonus and renounceable rights issue to
strengthen its capital base, reduce the overall gearing and help grow
the resource businesses. However the global financial turmoil, as well
as the collapse in the metal and equity markets amid market volatility,
has led MSC to reconsider this capital-raising exercise. MSC is currently
exploring other means of strengthening its capital base and reducing
its gearing.
Meanwhile, this subsidiary is committed to rationalising costs and
conserving cash in order to reduce borrowings. Low priority and non-
critical projects have either been suspended or deferred, while cost-
ineffective or unprofitable units have been closed down. These moves
will lower production volumes in the short-term. However, we are
optimistic that metal prices will eventually recover over the long-term,
and MSC would be able to deliver sustainable profitability and growth
when the current economic crisis recovers.
Coal excavationCoal pile

Operating profit of the Group’s hotel operations fell from $10.22
million in 2007 to $8.70 million in 2008. Our hotels performed
very well in H1 2008 as the business environment was still fairly
healthy then. However, in H2 2008, our hotel operations were
adversely affected by the deepening global financial and economic
crisis. The depreciation of Australian dollar against Singapore dollar
also materially affected our financial performance.
Nevertheless, the H1 2008 performance showed that Rendezvous
Hotels International Private Limited (RHI), the Group’s hotel
management arm, is well positioned to drive revenue growth over
the long-term. We have a solid portfolio of excellent hotels in good
locations, and our cost base is well managed by a highly competent
executive team. In fact, RHI proactively took steps to mitigate the
effects of the economic downturn well before the slowdown set in.
As a result, the Group has thus far been able to minimise the adverse
impact of the downturn.
In general, most hotels operated well and any reduction in revenue
and profitability was due to unfavourable market conditions or
refurbishment.
SINGAPORE
In 2008, the Rendezvous Hotel, Singapore improved its profitability
and also maintained a good market share. We refurbished the
executive floor guest rooms and the executive lounge. In 2008, room
rates were 30% higher than the 2007 rates. However, occupancy
rates fell from 86% in 2007 to 78% in 2008. Nevertheless, the higher
room rates resulted in a slight growth in profits.
AUSTRALIA
Rendezvous Sanctuary Resort, Broome
Although the resort’s 2008 performance improved considerably
over 2007, we are currently reviewing our long-term position. In
2008, the resort achieved 49% occupancy on the increased room
count, at a rate of A$245. Revenue increased by 12% year-on-year
with better operating result.
Rendezvous Observation City Hotel, Perth
Due to a potential redevelopment of the site, some areas of the hotel
were closed in 2008 and sales activities were undertaken on a short-
term basis. Consequently, occupancy fell to 72% in 2008 from 78%
in 2007. Although the average room rate went up by 10%,
profitability declined by 40%. The hotel will undergo some
refurbishment works while it continues to trade in the medium-
term.
*pg
18
Hotel Operations
Rendezvous Hotel, Singapore : catering event
The Straits Trading Company Limited
Annual Report 2008
Business Review / continued

*pg
19
The Next Level : Taking To New Heights
Business Review / continued
Rendezvous Allegra Hotel, Adelaide
This hotel achieved 83% occupancy in 2008, compared to 79% in
2007. In addition, average room rates increased by 8% over 2007.
As a result, the hotel’s profitability doubled during the year in
review. The Rendezvous Allegra Hotel remains one of the premier
hotels in Adelaide with an impressive list of AAA corporate accounts.
Market conditions remain strong in Adelaide and this city will be
less affected than others in this economic downturn.
Rendezvous Hotel, Melbourne
In 2008, occupancy inched up to 77% from 76% in 2007. For the
year under review, the average room rate of A$161 was 12% higher
than that in the previous year. Profit went up by 48% year-on-year.
Looking ahead, 2009 will be a difficult year due to a drop in demand
coupled with a substantial increase in the supply of hotel rooms.
Still, this hotel remains well placed to grow market share and
profitability.
Rendezvous Stafford Hotel, Sydney
The hotel’s 2008 performance reflects the difficult operating
conditions in Sydney. Upgrading works at the restaurant and pool
area also caused some disruptions. The 2008 occupancy rate of 76%
was slightly lower than the 79% achieved in 2007. Revenue declined
2% although average room rates improved slightly. Just like the rest
of Sydney, the hotel will see falling demand in 2009.
Rendezvous Hotel, Brisbane
Although occupancy was slightly down at 85%, average room rate
climbed by 10% to A$182. The hotel managed to maintain its profit
level. In 2009, the hotel market in Brisbane will remain healthy
notwithstanding a slight dip in line with the economic downturn.
Rendezvous Reef Resort, Port Douglas
The resort underwent major refurbishment from early 2008 to the
end of the year, which affected operating results substantially. Results
were down although room rates increased by 25% to A$130 and
occupancy rates were slightly lower. Things should revert to normal
in 2009 although we might see a fall in discretionary leisure spending
in tandem with the recession.
Rendezvous Hotels

The Straits Trading Company Limited
Annual Report 2008
*pg
20
*pg
Business Review / continued
Marque Hotel, Brisbane
Following a refurbishment in 2007, the hotel had an excellent
showing during its second full year of operation in 2008. The 78%
occupancy rate and A$145 average room rate were both up from
their 2007 levels, leading to a robust 60% year-on-year profit surge.
In 2009, this hotel will continue to contribute positively subject to
general market conditions.
Marque Hotel, Canberra
Occupancy dropped from 72% to 70% while room rates rose
marginally from A$139 to A$141. Profit declined mainly due to
reduced banquet sales. We expect 2009 to be a subdued year,
although profit levels should be similar to what we had in 2008.
Marque Hotel, Sydney
Refurbishment works, which affected the 2008 revenues and profits,
have been completed. Depending on market conditions, the hotel
will therefore be able to utilise all facilities and grow its income
streams this year. Still, Sydney remains one of the most challenging
markets for hotels in Australia.
Marque Hotel, Perth
We commenced managing this well-located hotel in 2008. Initial
signs have been encouraging, with revenue and profit figures in line
with expectations. The hotel will be refurbished, after which its
appeal for the corporate and leisure markets will be boosted
significantly. We expect 2009 to be a reasonably good year.
TH
E
Marque Hotels

*pg
21
The Next Level : Taking To New Heights
Business Review / continued
NEW ZEALAND
The performance for the Rendezvous Hotel, Auckland improved
despite the depressed market. Revenue grew by 6% and operating
results improved. Occupancy rates were up 3% to 69% while average
room rates were marginally lower at NZ$127. In 2008, we
refurbished the banquet areas and the mezzanine lounge, both of
which have since generated higher revenues.
CHINA
Occupancy at the Rendezvous Merry Hotel, Shanghai fell from 72%
to 55%, while average room rates fell from RMB621 to RMB600.
Gross operating profit dropped by 29% year-on-year. The
performance decline was partly attributable to fewer visitor arrivals
at Shanghai, caused by the Government’s visa restrictions
implemented during the build-up to the Beijing Olympics. However,
the hotel managed to increase its market share in 2008, a
commendable feat especially since the supply of hotel rooms in
Shanghai continued to grow rapidly. Business conditions will be
difficult in 2009.
While the long-term prospects remain bright, the short-term outlook
is clouded by the ongoing economic crisis. To mitigate the impact
of the recession, RHI has introduced numerous measures to protect
revenue streams and manage costs in this challenging environment.
Already, the early period of 2009 is down compared to the same
period in 2008. We expect our 2009 results to mirror the state of
the broader economy. Revenue streams from our growing marketing
efforts however, are impressive with database marketing being
particularly effective in this climate.
Our development activity continues unabated with opportunities
reviewed throughout the region. In late 2008, we commenced our
joint venture in India and the early signs have been very encouraging.
In the coming 12 months, we expect to open new hotels in
Christchurch and Kuala Lumpur. We also expect to sign new
management contracts in China, India and elsewhere in Asia this
year.
We have achieved our goal of establishing a strong regional hotel
presence with two brands – the Rendezvous portfolio of upscale 4-
and 5-star hotels with full facilities, and the Marque brand of
boutique hotels – of quality accommodation. We have also
established a leading-edge business model capable of sustainable
revenue growth and continual brand enhancement. Our long-term
strategic plans remain intact and we will continue to develop the
Group from the strong base that now exists.
However, the hotel managed to increase its
market share in 2008, a commendable feat
especially since the supply of hotel rooms in
Shanghai continued to grow rapidly.

The Straits Trading Company Limited
Annual Report 2008
*pg
22
*pg
Business Review / continued
Property Operations
In 2008, prices and rentals for all categories of properties fell due
to weak market demand amid the global financial turmoil.
Condominium units at the Group’s Gallop Gables development
along Farrer Road, Singapore were leased at market rents with an
average occupancy rate of 90% for the year. The condominium units
at our adjacent Gallop Green development along Woollerton Park
performed better, with a 95% average occupancy rate.
Gallop Green remains popular with expatriates due to the high
quality of the development, the central location and the professional
in-house management. However, some foreigners may relocate in
2009 and this may impact the rental income.
Additionally, there are four completed Good Class Bungalows
(GCBs) remaining under the first phase of the Group’s GCB
development along Cable Road and Nathan Road, Singapore.
Although these GCBs have been earmarked for sale, they were all
rented out in the meantime. Construction activities continue to
slow down as projects are deferred, and construction costs are
expected to slide further throughout 2009.
To take advantage of lower construction costs, the Group will
implement the next phase of the GCB development, tentatively
commencing around end-2009. Demand for this niche asset class is
expected to be more resilient against the prevailing downbeat market
sentiment.
In Malaysia, the Group’s joint venture with the Taiko Group to
develop bungalows in Ipoh has progressed satisfactorily, with nine
units sold in the first phase of this project.
The global economic slowdown has also dampened demand for
office space. Last year, companies that already operated in Singapore
were generally reluctant to upgrade or expand their premises. In
addition, fewer companies had established new operations in
Singapore (especially during H2 2008) compared to previous years.
Under this challenging environment, the Group’s office and retail
space at China Square Central maintained a reasonable occupancy
rate of 90% during 2008.
2008 was a good year for Straits Media Private Limited (Straits
Media), the Company’s media advertising subsidiary. Sales revenue
rose to $4.87 million, 5.6% higher than the sales revenue in 2007.
However, the increase in rental and overhead expenses resulted in
a decline of net profit by 77.6% to $0.21 million.
During the year, Straits Media ceased to operate billboards at
Orchard Emerald Shopping Centre and Market Street Car Park.
The changes were due to the re-development of Orchard Emerald
Shopping Centre and the construction of the Down Town Line.
However, Straits Media managed to develop new sites at Bugis
Junction and Arcade in Raffles Place, which will help to maintain
its position in the outdoor billboard market.
Straits Media is re-developing the mode of advertising display at
Tang Plaza Underpass. It is utilizing light emitting diode technology
to illuminate creative display seamlessly from wall to wall. Straits
Media expects this new advertising concept will create better revenue
in the coming years.
Good Class Bungalow at Cable/Nathan Road

*pg
23
The Next Level : Taking To New Heights
Business Review / continued
The Straits Trading Building, our flagship building at 9 Battery
Road, is scheduled for completion in Q4 2009 and will provide
approximately 15,000 sq m of office space. Given the building’s
iconic design and prime location in the heart of Singapore’s Central
Business District, we are confident in achieving a satisfactory
occupancy upon its completion. Furthermore, the building comes
with column-free floor plate and dedicated Variable Refrigerant
Volume air-conditioning system for each floor that is ideal for single
tenant occupancy and efficient air-conditioning usage after office
hours. A unique feature in the building is a glass meeting room amid
landscaped surroundings on one of the sky terraces for
tenants’ use. These features are well received by prospects in our
marketing campaigns and we are encouraged by the market interest
in the building despite the increasingly difficult leasing market.
Separately, efforts to redevelop the Group’s Rendezvous Observation
City Hotel site in Perth stalled when the authorities rejected the
submitted plans. We have lodged an appeal with the State
Administrative Tribunal as management firmly believes that our
plans offer an optimal balance of benefits for the community, the
authority, the Group and other stakeholders. We will continue
operating the hotel pending the outcome of the appeal.
In line with the asset-light strategy, the main focus will be on property
development locally as well as in the region by working with joint
venture partners, capitalising on the track record and experience of
our property team. The Group will also intensify its marketing
efforts to divest more non-core residential units at reasonable prices.
Straits Trading Building, Singapore : construction in progress
A unique feature in the building is a
glass meeting room amid landscaped
surroundings on one of the sky terraces for
tenants’ use. These features are well received
by prospects in our marketing campaigns...

*pg
24
PartneringFor Success
More than a century ago, Straits Trading originated from
a partnership of two men. Backed by more than 120 years
of rich history in prudent and astute business management,
Straits Trading is committed to continuously build on its
foundation of achievements, thereby marrying the grandeur
of the past with its hopes for the future.
The Straits Trading Company Limited
Annual Report 2008

*pg
25
The Next Level : Taking To New Heights

*pg
26
The Straits Trading Company Limited
Annual Report 2008
2008 2007 2006 2005 2004
$’000 $’000 $’000 $’000 $’000
Total Revenues 1,250,103 1,109,262 924,339 744,364 237,688
Profit Before Tax from Continuing Operations 73,915 536,805 224,535 91,179 60,347
Exceptional and Impairment Items 49,940 420,028 145,822 6,083 (8,551)
Fair Value Changes of Financial Assets (15,023) 16,326 10,445 3,950 -
Profit Attributable to Equity Holders
of the Company, net of tax 57,608 484,957 194,018 70,003 55,319
Shareholders’ Funds 1,196,781 1,831,487 1,289,322 1,229,443 1,021,554
Earnings per Share 17.7 cents 148.8 cents 57.9 cents 19.6 cents 15.5 cents
Return on Equity 4.8% 26.5% 15.0% 5.7% 5.4%
Gross Dividend per Share 2.0 cents* 7.5 cents 10.0 cents# 26.0 cents# 6.0 cents
Net Asset Value per Share $3.67 $5.62 $3.96 $3.45 $2.87
Net Gearing Ratio 17.6% - - 21.2% 24.3%
Share Price $4.26 $5.00 $3.50 $2.95 $2.12
* This does not take into account of the special dividend of $1.50 per share ($488.8 million) paid on 31 July 2008, following the approval by the Company’s shareholders at an extraordinary general meeting held on 13 June 2008, and the expiry of the 21-day statutory period on 7 July 2008.
# Included special dividend of 4 cents per share paid on 1 June 2007 (2005 : 20 cents per share paid on 1 June 2006).
Balance Sheet
ASSETS
Non-Current Assets
Property, plant and equipment 310,166 206,252 211,564 219,355 163,119
Investment properties 813,813 821,132 416,353 435,901 877,545
Goodwill 22,211 24,089 23,249 21,410 -
Other intangible assets 28,264 12,336 10,356 18,795 1,309
Investments in associates 75,967 11,516 18,908 14,210 67,058
Investments in joint ventures 313 317 204 161 1
Deferred tax assets 14,242 13,114 8,626 1,166 1,325
Investment securities 106,576 434,065 304,128 334,068 174,054
Derivative financial instruments - - - 45 20
Other non-current assets 19,489 4,922 1,321 1,338 -
Total Non-Current Assets 1,391,041 1,527,743 994,709 1,046,449 1,284,431
Current Assets
Current assets 537,706 723,572 656,298 491,986 184,070
Assets held for sale under FRS 105 2,078 - 7,020 367,479 -
Total Current Assets 539,784 723,572 663,318 859,465 184,070
Total Assets 1,930,825 2,251,315 1,658,027 1,905,914 1,468,501
Financial HighlightsGroup

*pg
27
The Next Level : Taking To New Heights
2008 2007 2006 2005 2004
$’000 $’000 $’000 $’000 $’000
EQUITY AND LIABILITIES
Equity
Share capital 265,928 265,928 265,928 356,400 356,400
Retained earnings 565,472 1,329,125 885,443 665,246 603,939
Other reserves 365,381* 236,434 137,951 207,797 61,215
Equity attributable to equity holders of the Company 1,196,781 1,831,487 1,289,322 1,229,443 1,021,554
Minority interests 52,349 62,669 51,648 56,420 (17,543)
Total Equity 1,249,130 1,894,156 1,340,970 1,285,863 1,004,011
Non-Current Liabilities
Provisions 6,572 5,244 6,056 5,999 -
Deferred tax liabilities 54,746 38,554 28,687 13,037 9,452
Borrowings 247,565 3,922 32 27,161 108,000
Derivative financial instruments 4,934 - - 1,611 -
Other non-current liabilities 26,915 40,165 44,514 26,462 30,067
Total Non-Current Liabilities 340,732 87,885 79,289 74,270 147,519
Current Liabilities
Current liabilities 340,963 269,274 237,768 325,781 316,971
Liabilities directly associated with assets
held for sale under FRS 105 - - - 220,000 -
Total Current Liabilities 340,963 269,274 237,768 545,781 316,971
Total Liabilities 681,695 357,159 317,057 620,051 464,490
Total Equity and Liabilities 1,930,825 2,251,315 1,658,027 1,905,914 1,468,501
* Included dividend reserve of $325.897 million which was transferred from retained earnings for the special dividend of $1.00 per share of which 80 cents
was paid on 6 March 2009 and 20 cents will be paid on 30 April 2009.
Group Financial Highlights / continued

Group Financial Highlights / continued
*pg
28
The Straits Trading Company Limited
Annual Report 2008
TOTAL REVENUES
Malaysia Smelting Corporation Berhad becamea subsidiary in March 2005 and its group’s
financials have since been consolidated.
1,400
1,200
1,000
800
600
400
200
0‘04 ‘05 ‘06 ‘07 ‘08
(S$ Million)
PROFIT BEFORE TAX FROM
CONTINUING OPERATIONS
There were substantial fair value changes of
investment properties and gains on disposal of
properties in 2006 and 2007.
600
500
400
300
200
100
0‘04 ‘05 ‘06 ‘07 ‘08
(S$ Million)
PROFIT ATTRIBUTABLE TO EQUITY
HOLDERS OF THE COMPANY, NET OF TAX
500
400
300
200
100
0‘04 ‘05 ‘06 ‘07 ‘08
(S$ Million)

Group Financial Highlights / continued
*pg
29
The Next Level : Taking To New Heights
EARNINGS PER SHARE
160
140
120
100
80
60
40
20
0‘04 ‘05 ‘06 ‘07 ‘08
(S$ Cents)
15.5 19.6
57.9
148.8
17.7
RETURN ON EQUITY
30
25
20
15
10
5
0‘04 ‘05 ‘06 ‘07 ‘08
(%)
5.4 5.7
15.0
26.5
4.8
SHAREHOLDERS’ FUNDS
2,000
1,800
1,600
1,400
1,200
1,000
800
600
400
200
0‘04 ‘05 ‘06 ‘07 ‘08
(S$ Million)

Group Financial Highlights / continued
*pg
30
The Straits Trading Company Limited
Annual Report 2008
NET ASSET VALUE PER SHARE
6
5
4
3
2
1
0‘04 ‘05 ‘06 ‘07 ‘08
(S$)
2.87
3.45
3.96
5.62
3.67
NET GEARING RATIO
25
20
15
10
5
0‘04 ‘05 ‘06 ‘07 ‘08
(%)
24.3 21.2
17.6
MARKET CAPITALISATION
2,000
1,800
1,600
1,400
1,200
1,000
800
600
400
200
0‘04 ‘05 ‘06 ‘07 ‘08
(S$ Million)

ExecutivesKey
Victoria joined the Group in July 1987 as an accountant. She has served as Executive Vice
President (EVP) and Group CFO since January 2000, before she was promoted to Senior EVP
in July 2006. She has overall responsibility for the financial and corporate affairs of the Group.
She also oversees the operations of various business units and sits on the boards of some of the
subsidiaries of the Group, including Malaysia Smelting Corporation Berhad, a company listed
on Bursa Malaysia Securities Berhad. Prior to joining the Group, Victoria worked as an auditor
and subsequently as a management consultant, with international professional accounting firms.
A Chartered Accountant with the Institute of Chartered Accountants in England and Wales,
Victoria graduated with a Bachelor of Science (Economics) from the London School of Economics.
She also holds a Master degree in Finance from City University as well as a Bachelor of Law
degree from the University of London.
Mrs Victoria Tse
Senior Executive Vice President& Group Chief Financial Officer(CFO)
YBhg. Dato’ Seri Dr Mohd Ajib Anuar has been the Chief Executive Officer (CEO) and executive
Director of the Group’s subsidiary, MSC, since June 1994. He also serves as the Managing
Director of the Group’s resource management unit, Straits Resource Management Private
Limited. He has more than three decades of experience and expertise in the global tin and
minerals resource industry. He is currently the Chairman of the Kuala Lumpur Tin Market, a
director of ITRI Innovation Ltd, United Kingdom, the tin industry’s international research and
development body, the President of the Malaysian Chamber of Mines and Chairman of the
Malaysian Tin Industry (Research and Development) Board. He is also a director of MSC’s
listed associates in Australia, Australia Oriental Minerals NL and Beaconsfield Gold NL. Prior
to his appointment as the CEO of MSC, he had spent more than 23 years within the MMC
Corporation Berhad (formerly known as Malaysia Mining Corporation Berhad) group of
companies (MMC), serving in various senior positions including General Manager of Finance
division, Director of Business Development and Managing Director of MMC’s International
Marketing Division. He also served as Deputy Chairman of the Kuala Lumpur Commodity
Exchange from 1988 to 1993 and as Chairman of the Malaysian Futures Clearing Corporation
from 1990 to 1993. He obtained the professional qualification of the Association of Chartered
Certified Accountants, United Kingdom in 1974.
YBhg. Dato’ Seri Dr Mohd Ajib
Anuar
Group Chief Executive Officer,
Malaysia Smelting Corporation Berhad
(MSC)
Alan has been with the RHI group since its inception in 1997. Prior to joining the RHI group,
he was the Deputy Managing Director for Radisson Hotels in Australia, overseeing six international
quality hotels. In 1995, he was the Chief Operating Officer (COO) for Radisson Hotels in
Indonesia and Malaysia. As COO for Indonesia and Malaysia, Alan was responsible for the
development and management of 11 upscale hotels and resorts. During that time, he was awarded
the prestigious “Esprit” award as top international hotelier for Radisson worldwide. Before that,
Alan was a Director of Hecron Limited, a public company in Australia, which subsequently took
over the Four Seasons Hotel group. Alan became Managing Director of the Four Seasons Hotel
group in Australia with over 20 hotels under his guidance. He graduated with a Bachelor of
Commerce from Melbourne University and qualified as a Chartered Accountant.
Mr Alan Donald Featherby
Chief Executive,
Rendezvous Hotels International
Private Limited (RHI)
*pg
31
The Next Level : Taking To New Heights

*pg
32
The Straits Trading Company Limited
Annual Report 2008
Choon Wong joined the Group in July 1993. As a director of the Company’s media advertising
subsidiary, Straits Media Private Limited, he is responsible for its operations and business
development. Choon Wong was the Assistant General Manager of Plastic And Metal Industries
before joining the Group. Under his leadership, the company obtained the ISO9002 manufacturing
quality certification in 1992. Before that, he served in various capacities as a Production Section
Manager of Hewlett Packard Pte Ltd, as the Operation Manager of Degussa Electronics Pte Ltd,
and as the Material Manager of Chartered Electronics Pte Ltd. He holds a Bachelor of Science
in Electronic Engineering (Honours) degree from North Staffordshire University and a Master
degree in Management from Birmingham University, United Kingdom.
Mr Tan Choon Wong
Senior Vice President
Aik Hong joined the Group in January 1993. Between 1994 to 1997, he was the Deputy General
Manager for the Group's hotel in Perth, Rendezvous Observation City Hotel. He was appointed
the General Manager for Rendezvous Hotel, Singapore from 1998 and returned to Perth as the
General Manager for Rendezvous Observation City Hotel in July 2005. Before Aik Hong joined
the Group, he served in various capacities in a number of industries including banking, property,
trading and manufacturing. Aik Hong is a B. Eng. (Industrial & Systems) graduate with first
class honours from the University of Singapore and began his career as a project analyst with
DBS Bank Ltd.
Mr Tan Aik Hong
Senior Vice President
Tai Soon joined the Group in September 1995. He is responsible for the development of the
Group’s properties; from acquisition of new sites to implementation of projects, such as the
Gallop Gables and Gallop Green condominiums and the mega complex at China Square Central.
He also oversees the Group’s development projects in Malaysia. Tai Soon has more than 20 years
of diverse experience in the property and construction industry, having held positions in the
three cornerstones of the industry : as a developer, consultant and contractor; including a stint
with the MRT Corporation. He holds a Bachelor of Science (Building) (Honours) degree from
the University of Singapore.
Mr Tan Tai Soon
Senior Vice President
Key Executives / continued

���
33
CorporateGovernance
REPORT ON CORPORATE GOVERNANCE
The Board is pleased to provide the following report, which outlines the corporate governance policies and practices adopted by the Company and which generally complies with the guidelines set out in the Code of Corporate Governance 2005 (Code), and unless otherwise stated.
BOARd MATTERs
1. The Board provides entrepreneurial leadership, and approves the development and implementation of corporate strategies, and ensures that the necessary financial and human resources are in place for the Company to meet its objectives. The Board also sets the Company’s values and standards, and ensures its obligations to all stakeholders are met and understood. While the Board remains responsible for providing oversight in the preparation and presentation of the financial statements, it has delegated to Management the task of ensuring that the financial statements are drawn up and presented in compliance with the relevant provisions of the Singapore Companies Act, Cap.50 and the Singapore Financial Reporting Standards. The Board has also delegated responsibility to the Group Chief Executive Officer to manage the business of the Company, and to its various Board Committees to deal with the specific areas described later.
2. The Board meets at regular intervals and as warranted by circumstances. Meetings by means of a conference telephone or similar communication equipment are permitted in the Company’s Articles of Association. The Directors’ attendance at the Board and various committee meetings during the year are as follows :
directors’ Meetings in 2008 The number of Directors’ meetings (including committee meetings) held and the number of meetings attended by each member of the respective
meetings during the year were :
Name of director BoardBoard Executive
CommitteeRemuneration
CommitteeAudit
CommitteeA B A B A B A B
Chew Gek Khim* 6 6 1 1Michael Hwang 6 10 1 1 2 4Tan Sri Dato’ Dr Lin See-Yan 10 10 1 1 4 4Norman Ip Ka Cheung 10 10 2 2Razman Ariffin 10 10Gerard Ee Hock Kim 9 10 3 3Elizabeth Sam# 5 6Chew Gek Hiang# 6 6 1 1 3 3David Goh Kay Yong# 6 6Bobby Chin Yoke Choong## 4 4 1 1 1 1Tang I-Fang## 4 4 2 2 1 1Michael Wong Pakshong## 4 4 2 2Lim Chong Yah## 4 4
A: Number of meetings attended during the period the Director was a member of the Board and/or committee.B: Number of meetings held during the period the Director was a member of the Board and/or committee.* Appointed as Director and Chairman of the Company on 20 March 2008 and 24 April 2008 respectively.# Appointed as Director on 30 April 2008.## Stepped down as Director of the Company on 24 April 2008.

��������������������������������
���
34
��������������������������������
���
3. Apart from those as specified in item 1 above, the Board also approves the Group’s appointment of Board members and senior management staff, key business initiatives, major investments and funding decisions, and interested person transactions. These functions are carried out by the Board directly and through its committees.
Nominating Committee (please refer to page 34 for a description of the Committee’s activities).
Remuneration Committee (please refer to page 35 for a description of the Committee’s activities).
Audit Committee (please refer to page 37 for a description of the Committee’s activities).
BOARd COMPOsiTiON
1. There were several Board changes arising from the change in ownership of the Company in the first half of 2008. Ms Chew Gek Khim was appointed to the Board on 20 March 2008 and elected as non-executive and non-independent Chairman of the Company on 24 April 2008. Mrs Elizabeth Sam was appointed to the Board as an independent and non-executive Director on 30 April 2008, together with Ms Chew Gek Hiang and Mr David Goh Kay Yong, who were appointed as non-independent and non-executive Directors. Mr Bobby Chin Yoke Choong, Mr Tang I-Fang, Mr Michael Wong Pakshong and Professor Lim Chong Yah all retired as Directors of the Company following the conclusion of the Annual General Meeting of the Company on 24 April 2008.
2. The Board now comprises nine Directors, of whom five are independent and non-executive Directors. The composition of the Board and key information pertaining to each Director are set out in pages 4 to 6. The Directors provide objective and independent judgment to the decision making of the Board. All members hail from diversified backgrounds and collectively bring with them a wide range of experience and expertise and participate fully in decisions on the key issues facing the Group.
3. Non-executive Directors of the Company participate constructively and review the Group’s operations, budget and strategies. They also assess the effectiveness of the Board’s processes and activities in meeting set objectives and corporate governance standards.
ChAiRMAN ANd ChiEf ExECuTiVE OffiCER
1. The Board is led by Ms Chew Gek Khim as the non-executive Chairman. Ms Chew, who assumed the Chair on 24 April 2008, succeeded Mr Bobby Chin Yoke Choong who retired from the Board on the same day. The executive management of the Company is led by Mr Norman Ip Ka Cheung, the President and Group Chief Executive Officer (Group CEO).
2. The Chairman’s duties include leading the Board, setting the Board agenda and ensuring that all Directors receive sufficient relevant information (both financial and non-financial) to enable them to participate and contribute effectively in Board discussions and decisions. The Chairman aims to promote constructive relations between the Board members, and between the Board and Management, and ensures effective communication with shareholders. She also advocates high standards of corporate governance. The Group CEO is responsible for the daily management of the businesses and implementation of the Board’s policies and decisions, as well as ensuring compliance with the corporate governance policies of the Company.
BOARd MEMBERshiP
1. The Company has adopted a formal and transparent process for the appointment of new directors through the Nominating Committee which reviews the background of all appointees and makes recommendations accordingly to the Board for approval.
2. Following the completion of the takeover of the Company in 2008, the Nominating Committee (NC) and the other Board Committees were reconstituted. The NC now comprises the following Directors, the majority of whom are independent, including the Chairman :
Mrs Elizabeth Sam (Chairman) (appointed : 8 May 2008)Ms Chew Gek Khim (appointed : 8 May 2008)Mr Gerard Ee Hock Kim (appointed : 8 May 2008)
(collectively the new NC).

��������������������������������
���
��������������������������������
���
35
Mr Michael Wong Pakshong (the former Chairman of the NC), Mr Bobby Chin Yoke Choong and Mr Tang I-Fang were members of the NC until 24 April 2008, and Mr Norman Ip Ka Cheung resigned as member of the NC effective 8 May 2008 (collectively the former NC).
In accordance with Guideline 4.1 of the Code, the Chairman of the NC is not directly associated with any substantial shareholder of the Company. The functions of the NC include the evaluation of the Board’s effectiveness, each Director’s contributions and independence, as well as making recommendations on the appointment and re-nomination of Directors for the Board and Board Committees. The role and functions of the NC are set out in the Terms of Reference for the NC.
3. The former Board considered the recommendations of the former NC to appoint Ms Chew Gek Khim as the new Chairman of the Company. The former Board noted that Ms Chew, the Executive Chairman of the Tecity Group of companies (the parent company of the Company), was the most suitable Director to assume the Chair, and appointed Ms Chew as the non-executive and non-independent Chairman of the Company effective 24 April 2008, to succeed Mr Bobby Chin Yoke Choong who retired as a Director on the same day.
The former Board also discussed and approved the appointments of the following new Directors : Mrs Elizabeth Sam as independent and non-executive Director; and both Ms Chew Gek Hiang and Mr David Goh Kay Yong, as non-independent and non-executive Directors. These Directors were appointed on 30 April 2008.
BOARd PERfORMANCE
1. The Company has in place a process to assess the Board’s effectiveness as a whole. The evaluation is carried out annually with each Director making his assessment by providing feedback to the NC in the form of completing a Board Assessment Questionnaire.
ACCEss TO iNfORMATiON 1. Information and data are important to the Board’s understanding of the Group’s businesses and essential to prepare the Board members for
effective meetings. Occasionally, Management also supplements the meeting papers with presentations on active operations and strategic issues, and site meeting are also arranged to provide Directors with a better understanding of the Group’s operations. If necessary, senior management may be invited to attend the meetings to answer any further enquiries from the Directors.
2. The Directors have separate and independent access to the services of the company secretaries, who are responsible for ensuring that Board procedures are followed and applicable rules and regulations are complied with. The company secretaries also assist the Chairman by ensuring good information flows within the Board and its committees, and between senior management and non-executive Directors. The company secretaries attend all board meetings and their appointments or removals are subject to the Board’s approval.
3. In the furtherance of their duties and if Management’s explanations are not satisfactory, Directors may seek independent professional advice at the Company’s expense after consultation with the Chairman.
PROCEduREs fOR dEVElOPiNG REMuNERATiON POliCiEs
1. The Board has a Remuneration Committee (RC) comprising the following non-executive Directors, the majority of whom are independent :
Mr Michael Hwang (Chairman)Tan Sri Dato’ Dr Lin See-Yan (appointed : 15 May 2008)Ms Chew Gek Hiang (appointed : 15 May 2008)
Mr Michael Wong Pakshong and Professor Lim Chong Yah were members of the RC until 24 April 2008 (the former RC).

��������������������������������
���
36
��������������������������������
���
The functions of the RC include the recommendation of a framework of remuneration for the Board and senior executives of the rank of senior vice president and above, and the recommendation of specific remuneration package for the executive Director, for the Board’s approval. The RC’s recommendations are submitted for the Board’s consideration and if thought fit, approval. The role and functions are set out in the Terms of Reference for the RC, which has been approved by the Board.
lEVEl ANd Mix Of REMuNERATiON
1. The Company’s remuneration policy is to provide compensation packages at market rates which reward good performance and attract, retain and motivate directors and managers.
2. Taking into account the performance of the Group and the responsibilities and performance of the Directors, directors’ fees (for the Board and the various Board Committees) were set in accordance with a remuneration framework comprising responsibility fees and attendance fees. The executive Director does not receive directors’ fees. Non-executive Directors are paid directors’ fees, subject to approval at the annual general meeting. The non-executive Directors have no service contracts. No individual Director fixes his own remuneration.
3. The remuneration for senior executives is set at a level that is fair and reasonable for the responsibilities involved and sufficiently dependent upon performance to attract, retain and motivate individuals of the required calibre. Remuneration is determined according to the following general components: salary, contractual bonus and incentive bonus. The Group CEO’s service contract does not contain any onerous removal clause. The former RC also considered and agreed that it is not necessary to implement a fixed term tenure in the Group CEO’s service contract as there is already an annual review of the Group CEO’s compensation and performance. During the year under review, the newly reconstituted RC met, discussed and approved the compensation for the senior executives of the Group. The Board also accepted and approved the RC’s recommendations in respect of the compensation for the Group CEO. Presently, the Company does not have any share option scheme.
disClOsuRE ON REMuNERATiON
1. Summary compensation table for the Directors of the Company in all capacities for the year ended 31 December 2008 :
Name of directorRemuneration
band salaryBonus/share
Based PaymentBenefits in kind
directors’ fees
Total
Chew Gek Khim Below S$250,000 - - - 100% 100%Michael Hwang Below S$250,000 - - - 100% 100%Tan Sri Dato’ Dr Lin See-Yan Below S$250,000 - - - 100% 100%Norman Ip Ka Cheung# S$2,000,000 to
S$2,250,00047% 50% 3% - 100%
Razman Ariffin Below S$250,000 - - - 100% 100%Gerard Ee Hock Kim Below S$250,000 - - - 100% 100%Elizabeth Sam Below S$250,000 - - - 100% 100%Chew Gek Hiang Below S$250,000 - - - 100% 100%David Goh Kay Yong Below S$250,000 - - - 100% 100%Bobby Chin Yoke Choong* Below S$250,000 - - 25% 75% 100%Tang I-Fang* Below S$250,000 - - - 100% 100%Michael Wong Pakshong* Below S$250,000 - - - 100% 100%Professor Lim Chong Yah* Below S$250,000 - - - 100% 100%
* Retired as Director of the Company on 24 April 2008. # Group CEO not entitled to fees.

��������������������������������
���
��������������������������������
���
37
2. There are no employees of the Group who are immediate family members of a Director or CEO earning more than S$150,000 a year.
The five most highly compensated senior executives within each band of remuneration were as follows :
2008 2007S$750,000 to S$1,000,000 2 -S$500,000 to S$749,999 - 2S$250,000 to S$499,999 3 3Total 5 5
ACCOuNTABiliTy
1. In presenting the annual financial statements and quarterly announcements to shareholders, it is the aim of the Board to provide shareholders with detailed analysis, explanations and assessment of the Company’s financial position and prospects.
2. Management currently provides the Board with balanced and understandable accounts of the Company’s performance, financial position and business prospects on a regular basis.
AudiT COMMiTTEE
1. The Audit Committee (Committee) comprises the following non-executive Directors :
Mr Gerard Ee Hock Kim (Chairman) (appointed : 24 April 2008)Mr Michael HwangTan Sri Dato’ Dr Lin See-YanMs Chew Gek Hiang (appointed : 15 May 2008)
All members are financially literate and have accounting or related financial management expertise or experience. Mr Tang I-Fang and Mr Bobby Chin Yoke Choong were Chairman and member of the Committee respectively until 24 April 2008.
2. The role of the Committee is documented in a Charter (Terms of Reference) approved by the Board. The Charter defines the purpose, authority and responsibilities of the Committee. The Charter was amended by the Board in 2005 to facilitate the Company’s compliance with the Code. A whistle-blowing procedure is in place for staff to raise matters of impropriety in confidence and for appropriate follow-up action to be taken, where necessary. The Committee is authorised to investigate any matters specified in the Charter.
3. In performing its functions, the Committee reviews the overall scope of both internal and external audits and the assistance given by the Company’s officers to the auditors. It meets with the Company’s internal and external auditors to discuss the results of their respective examinations and their evaluation of the Company’s system of internal accounting and financial controls. The Committee reviews interested person transactions to ensure that they are carried out on normal commercial terms and are not prejudicial to the interests of the Company and its minority shareholders. The Committee also reviews the consolidated financial statements and the auditors’ report, as well as announcements to shareholders and the SGX before submission to the Board.
iNTERNAl CONTROls
1. The Board recognises its role in ensuring that Management maintains a sound system of internal controls to safeguard shareholders’ investments and the group assets.

��������������������������������
���
38
��������������������������������
���
iNTERNAl AudiT
1. The Company has its own in-house internal audit department that is independent of the activities it audits. The internal auditors report directly to the Chairman of the Committee on audit matters and reports to the Group CEO on administrative matters.
The Committee meets with the external and internal auditors, without the presence of Management, at least once a year.
In discharging its functions, the Committee is provided with adequate resources, has full access to and co-operation by Management and the internal auditors, and has full discretion to invite any Director or executive officer to attend its meetings. All major findings and recommendations are brought to the attention of the Board of Directors.
The Committee reviewed all non-audit services provided by the firm of external auditors to the Company and was satisfied that the nature and extent of such services will not prejudice the independence and objectivity of the external auditors. The Committee annually reviews the independence of the external auditors.
The Committee recommended that Ernst & Young LLP be nominated for re-appointment as auditors at the forthcoming annual general meeting (AGM) to be held on 28 April 2009. Ernst & Young LLP have indicated their willingness to accept re-appointment.
2. During the year, the Committee reviewed the effectiveness of the Group’s material internal controls, including financial, operational and compliance controls, and risk management. The processes used by the Committee to review the effectiveness of the system of internal control and risk management included discussions with Management, external and internal auditors on the risks identified and the review of significant issues arising from internal and external audits.
The Directors understand that they have responsibility for the Group’s system of internal control that covers all aspects of the business. In recognition of this responsibility, the Directors set policies and seek regular assurance that the system of internal controls is operating effectively. However, the Directors are also aware that such a system can only provide reasonable assurance against material misstatement or loss. The Directors are of the opinion that, based on the results of the internal and external audits, the system of internal controls is operating satisfactorily. The Directors are also satisfied that problems are identified on a timely basis and there is in place a process for follow-up actions to be taken promptly to minimise unnecessary lapses. Nothing has come to the attention of the Directors to indicate that any material breakdown in the controls has occurred during the year under review.
3. The Committee reviews and approves the annual internal audit plans and ensures that the internal audit functions are adequately resourced with competence, and has appropriate standing within the Group to carry out its duties effectively.
COMMuNiCATiON wiTh shAREhOldERs
1. The Company takes a serious view of maintaining full and adequate disclosure, in a timely manner, of material events and matters concerning its businesses through SGXNET, public announcements, press releases, circulars to shareholders and Annual Reports.
GREATER shAREhOldER PARTiCiPATiON
1. While the Company endeavours to provide as much and as prompt information as is possible to its shareholders, it is also concerned of the legal and regulatory framework governing the release of material and price-sensitive information. The Company releases all price-sensitive information through SGXNET.
2. At the AGM, shareholders are encouraged to ask questions both about the resolutions being proposed and about the Group’s operations in general. The Articles of Association of the Company permit a member of the Company to appoint one or two proxies to attend and vote instead of the member. As there is still a major concern on the security of information transmitted over the Internet, the Board has decided that it is not appropriate, for the time being, to amend its Articles of Association to allow for in absentia voting methods.

��������������������������������
���
��������������������������������
���
39
3. The Company ensures separate resolutions are proposed at general meetings on each distinct issue. The external auditors, the chairpersons of the various Board Committees and (where necessary), the legal advisers are present to assist the Directors in addressing any relevant queries by shareholders.
Risk MANAGEMENT
1. The Company does not have a Risk Management Committee. However, the Audit Committee and senior operational managers assume the responsibility and set the risk management policy and strategy. The Group’s subsidiary, Malaysia Smelting Corporation Berhad, has established a risk management structure. The structure depicts the lines of reporting and responsibility at its Board, Audit Committee and Management levels.
2. The Group adopts a group-wide risk assessment process, which identifies the key risks facing each major business unit, the potential impact and likelihood of those risks occurring, the control effectiveness and action plans being taken to manage those risks to the desired level.
3. The senior management and the operational managers continuously evaluate and monitor the significant risks. The internal audit department regularly reviews all significant control policies and procedures and highlights all significant matters to the senior management and the Audit Committee. The Audit Committee has reviewed the Group’s risk management process and is satisfied that there are adequate internal controls in place to manage the significant risks identified.
sECuRiTiEs TRANsACTiONs
1. The Group has issued internal guidelines on dealings in the securities of the Company to the Directors and employees of the Company and its subsidiaries, advising them, among others, not to deal in the securities of the Company on short-term considerations. On a quarterly basis, Directors and employees are advised of the prohibitions in dealings in the securities of the Company during the period commencing two weeks before the announcement of the Group’s first and third quarter financial statements, and one month before the Group’s half year and full year financial statements, and ending on the respective announcement date, and while they are in possession of material price-sensitive information which is generally not available.

*pg
40
CalendarFinancial
Financial Year Ended 31 December 2008
Announcement of results for the fourth quarterand the full year ended 31 December 2007 andsecond interim dividend for 2007
2007 Annual General Meeting
Payment of second interim dividend for 2007
Announcement of results for the quarter ended31 March 2008 and special dividend of $1.50per share
Extraordinary General Meeting
Payment of special dividend of $1.50 per share
Announcement of results for the second quarterand the half year ended 30 June 2008 and firstinterim dividend for 2008
Payment of first interim dividend for 2008
Announcement of results for the third quarterand the nine months ended 30 September 2008and special dividend of $1.00 per share
Extraordinary General Meeting
Announcement of results for the fourth quarterand the full year ended 31 December 2008
Payment of special dividend of $1.00 per share(first instalment)
2008 Annual General Meeting
Payment of special dividend of $1.00 per share(second instalment)
Financial Year Ending 31 December 2009
Announcement of first quarter results
Announcement of second quarter and half yearresults
Announcement of third quarter results
Announcement of fourth quarter and full yearresults
16 February 2008
24 April 2008
6 May 2008
15 May 2008
13 June 2008
31 July 2008
12 August 2008
11 September 2008
11 November 2008
19 December 2008
24 February 2009
6 March 2009
28 April 2009
30 April 2009
13 May 2009
13 August 2009
12 November 2009
To be announced in due course
The Straits Trading Company Limited
Annual Report 2008

�������������������������������������������������������
��� ���
������������������
41
Directors’ Report
Statement by the Directors
Independent Auditors’ Report
Balance Sheets
Consolidated Cash Flow Statement
Additional Information Required under the SGX Listing Manual
Consolidated Income Statement
Consolidated Statement ofof Changes in Equity
Notes to the Financial Statements
4245
47
49
54
46
48
50
56
FINANCIAL REPORT

�������������������������������������������������������
��� ���
������������������
42DIRECTORS’ REPORT
�������������������������������������������������������
��� ���
������������������
The Directors have pleasure in submitting their report together with the audited financial statements of The Straits Trading Company Limited (the Company) and consolidated financial statements of the Group for the year ended 31 December 2008.
Directorate
The Directors in office at the date of this report are :
Ms Chew Gek Khim (Chairman) (Appointed on 20 March 2008)Mr Michael HwangTan Sri Dato’ Dr Lin See-YanMr Norman Ip Ka CheungMr Razman AriffinMr Gerard Ee Hock KimMrs Elizabeth Sam (Appointed on 30 April 2008)Ms Chew Gek Hiang (Appointed on 30 April 2008)Mr David Goh Kay Yong (Appointed on 30 April 2008)
Mr Razman Ariffin retires pursuant to Article 99 of the Articles of Association and being eligible, offers himself for re-election.
Ms Chew Gek Hiang and Mr David Goh Kay Yong, who both were appointed as Director with effect from 30 April 2008, retire pursuant to Article 103 of the Articles of Association and being eligible, offer themselves for re-election.
Mrs Elizabeth Sam retires pursuant to Section 153(2) of the Companies Act, Cap.50. A resolution will be proposed for her re-appointment as Director under Section 153(6) of the said Act to hold office until the next Annual General Meeting of the Company.
Mr Michael Hwang retires pursuant to Article 99 of the Articles of Association, and will not seek re-election under the said Article.
arrangements to enable Directors to acquire shares anD Debentures
Neither at the end of nor at any time during the financial year was the Company a party to any arrangement whose objects are, or one of whose objects is, to enable the Directors of the Company to acquire benefits by means of the acquisition of shares in, or debentures of, the Company or any other body corporate. Directors’ interest in shares anD Debentures
According to the register kept under Section 164 of the Companies Act, Cap.50, the Directors who held office at the end of the financial year had an interest in the shares of the Company and its related corporation as stated below :
Company
(Issued ordinary shares) Shareholdings in whichShareholdings in the Directors are deemednames of Directors to have an interest
1.1.08 / Date 31.12.08 1.1.08 / Date 31.12.08of Appointment of Appointment
Ms Chew Gek Khim 41,200 41,200 - -Mr Michael Hwang 55,200 - 86,400 -Mr Norman Ip Ka Cheung 23,640 23,640 25,644 25,644Mr Razman Ariffin 1,200 - - -Ms Chew Gek Hiang 23,000 23,000 - -

�������������������������������������������������������
��� ���
�������������������������������������������������������������������������
��� ���
������������������
43DIRECTORS’ REPORT
Directors’ interest in shares anD Debentures (cont’D)
Subsidiary
Malaysia Smelting Corporation Berhad
(ordinary shares of RM1 each) Shareholdings in whichShareholdings in the Directors are deemednames of Directors to have an interest
1.1.08 31.12.08 1.1.08 31.12.08
Mr Norman Ip Ka Cheung 250,000 250,000 - -Mr Razman Ariffin 67,000 67,000 - -
There was no change in any of the above-mentioned interests between the end of the financial year and 21 January 2009.
Except as disclosed above, no Director who held office at the end of the financial year had an interest in any shares or debentures of the Company, or of related corporations, either at the beginning of the financial year, or date of appointment if later, or at the end of the financial year.
Directors’ contractual benefits
Except as disclosed in the financial statements, since the end of the previous financial year, no Director has received or become entitled to receive benefits by reason of a contract made by the Company or a related corporation with the Director, or with a firm of which the Director is a member, or with a company in which the Director has a substantial financial interest.
options
Australia Oriental Minerals NL (AOM), a subsidiary, granted a total of 43,000,000 options to its directors and company secretary in 2008, after the approval of its shareholders were obtained at an extraordinary general meeting convened on 31 October 2008. The 43,000,000 options comprised of 35,000,000 Director Options and 8,000,000 Secretary Options.
The issue price of each Director Option and each Secretary Option is nil and the Option entitles the holder to subscribe for 1 new share in AOM and is exercisable at any time during the period commencing from the time AOM issued the Options and ending on 31 December 2013. The exercise price for each Option (which is payable immediately on exercise) is A$0.03. The basis upon which these Options may be exercised is by giving notice in writing to the board of directors of AOM.
During the year under review AOM did not issue any shares arising from the exercise of the options granted before or during the financial year under review.
The number and class of options over shares of AOM outstanding as at 31 December 2008 is :
Number of Options Exercise Price Expiry Date Class of Shares43,000,000 A$0.03 31/12/2013 Ordinary
The holders of the above-mentioned options do not have any rights, by virtue of the said options, to participate in any share issue of any other company.

�������������������������������������������������������
��� ���
������������������
44DIRECTORS’ REPORT
�������������������������������������������������������
��� ���
������������������
auDit committee
The Audit Committee performs the functions specified in Section 201B(5) of the Companies Act, Cap.50. The Audit Committee reviews the overall scope of both internal and external audits and the assistance given by the Company’s officers to the auditors. It meets with the Company’s internal and external auditors to discuss the results of their respective examinations and the internal auditors’ evaluation of the Company’s system of internal accounting and financial controls. The Audit Committee reviews interested person transactions to ensure that they are carried out on normal commercial terms and are not prejudicial to the interests of the Company and its minority shareholders. The Audit Committee also reviews the consolidated financial statements and the auditors’ report, as well as announcements to shareholders and the SGX before submission to the Board. The Audit Committee meets with the external and internal auditors, without the presence of Management, at least once a year. The Audit Committee annually reviews the independence of the external auditors and recommends to the Board, the external auditors to be appointed. Further details on the Audit Committee are disclosed in the Report of Corporate Governance.
auDitors
Ernst & Young LLP have expressed their willingness to accept re-appointment as auditors.
On behalf of the Board
Norman Ip Ka Cheung Gerard Ee Hock KimDirector Director
Singapore25 March 2009

�������������������������������������������������������
��� ���
�������������������������������������������������������������������������
��� ���
������������������
45STATEMENT BY THE DIRECTORSPURSUANT TO SECTION 201(15)
We, Norman Ip Ka Cheung and Gerard Ee Hock Kim, being two of the Directors of The Straits Trading Company Limited, do hereby state that, in the opinion of the Directors :
(i) the accompanying balance sheets, consolidated income statement, consolidated statement of changes in equity and consolidated cash flow statement together with notes thereto are drawn up so as to give a true and fair view of the state of affairs of the Group and of the Company as at 31 December 2008 and the results of the business, changes in equity and cash flows of the Group, for the year then ended;
(ii) at the date of this statement, there are reasonable grounds to believe that the Company will be able to pay its debts as and when they
fall due.
On behalf of the Board
Norman Ip Ka Cheung Gerard Ee Hock KimDirector Director
Singapore25 March 2009

�������������������������������������������������������
��� ���
������������������
46ADDITIONAL INFORMATION REQUIRED
UNDER THE SGX LISTING MANUAL
�������������������������������������������������������
��� ���
������������������
material contracts
No material contract involving the interests of any director or controlling shareholder of the Company has been entered into by the Company or any of its subsidiaries since the end of the previous financial year and no such contract subsisted at the end of the financial year.
interesteD person transactions
The aggregate value of interested person transactions entered into during the financial year pursuant to Rule 907 of the SGX Listing Manual is NIL.

�������������������������������������������������������
��� ���
�������������������������������������������������������������������������
��� ���
������������������
47INDEPENDENT AUDITORS’ REPORT
TO THE MEMBERS OF THE STRAITS TRADING COMPANY LIMITED
We have audited the accompanying financial statements of The Straits Trading Company Limited (the Company) and its subsidiaries (collectively the Group) set out on pages 48 to 138, which comprise the balance sheets of the Group and the Company as at 31 December 2008, the income statement, the statement of changes in equity and cash flow statement of the Group for the year then ended, and a summary of significant accounting policies and other explanatory notes.
Management’s responsibility for the financial statements
Management is responsible for the preparation and fair presentation of these financial statements in accordance with the provisions of the Singapore Companies Act, Cap.50 (the Act) and Singapore Financial Reporting Standards. This responsibility includes devising and maintaining a system of internal accounting controls sufficient to provide a reasonable assurance that assets are safeguarded against loss from unauthorised use or disposition; and transactions are properly authorised and that they are recorded as necessary to permit the preparation of true and fair profit and loss account and balance sheet and to maintain accountability of assets; selecting and applying appropriate accounting policies; and making accounting estimates that are reasonable in the circumstances.
Auditors’ responsibility
Our responsibility is to express an opinion on these financial statements based on our audit. We conducted our audit in accordance with Singapore Standards on Auditing. Those standards require that we comply with ethical requirements and plan and perform the audit to obtain reasonable assurance whether the financial statements are free from material misstatement.
An audit involves performing procedures to obtain audit evidence about the amounts and disclosures in the financial statements. The procedures selected depend on the auditor’s judgment, including the assessment of the risks of material misstatement of the financial statements, whether due to fraud or error. In making those risk assessments, the auditor considers internal control relevant to the entity’s preparation and fair presentation of the financial statements in order to design audit procedures that are appropriate in the circumstances, but not for the purpose of expressing an opinion on the effectiveness of the entity’s internal control. An audit also includes evaluating the appropriateness of accounting policies used and the reasonableness of accounting estimates made by management, as well as evaluating the overall presentation of the financial statements.
We believe that the audit evidence we have obtained is sufficient and appropriate to provide a basis for our audit opinion.
Opinion
In our opinion,
(i) the consolidated financial statements of the Group, and the balance sheet of the Company are properly drawn up in accordance with the provisions of the Act and Singapore Financial Reporting Standards so as to give a true and fair view of the state of affairs of the Group and of the Company as at 31 December 2008 and the results, changes in equity and cash flows of the Group for the year ended on that date; and
(ii) the accounting and other records required by the Act to be kept by the Company and by those subsidiaries incorporated in Singapore of which we are the auditors have been properly kept in accordance with the provisions of the Act.
ERNST & YOUNG LLPPublic Accountants andCertified Public Accountants
Singapore25 March 2009

�������������������������������������������������������
��� ���
������������������
48CONSOLIDATED INCOME STATEMENT
For the year ended 31 December 2008
�������������������������������������������������������
��� ���
������������������
Group
Note 2008 2007 $’000 $’000
revenueTin mining and smelting revenue 963,384 836,273Hotel revenue 155,488 156,474Property revenue 60,265 69,563Proceeds from sale of trading securities 66,728 5,002
1,245,865 1,067,312other items of incomeDividend income 3 8,956 12,727Interest income 4 8,496 9,505Other (loss)/income 5 (13,214) 19,718
Total Revenues 1,250,103 1,109,262
Exceptional gains, net 6 51,363 420,028
other items of expenseEmployee benefits expense 7 (89,122) (87,937)Depreciation expense 13 (16,908) (15,351)Amortisation expense 15 (4,141) (3,669)Impairment loss 6 (1,423) -Costs of tin mining and smelting (882,602) (730,622)Costs of trading securities sold (64,918) (4,595)Finance costs 8 (13,368) (7,532)Other expenses 9 (150,790) (143,411)Share of (loss)/profit from equity-accounted associates (4,356) 530Share of profit from equity-accounted joint ventures 77 102
profit before tax from continuing operations 10 73,915 536,805Income tax expense 11 (20,095) (39,569)
profit from continuing operations, net of tax 53,820 497,236
profit attributable to equity holders of the company, net of tax 57,608 484,957(loss)/profit attributable to minority interests, net of tax (3,788) 12,279
53,820 497,236
earnings per share (cents) 12
Earnings per Share (Basic) 17.7 148.8Earnings per Share (Diluted) 17.7 148.8
The accompanying accounting policies and explanatory notes form an integral part of the financial statements.

�������������������������������������������������������
��� ���
�������������������������������������������������������������������������
��� ���
������������������
49BALANCE SHEETS
As at 31 December 2008
Group CompanyNote 2008 2007 2008 2007
assets $’000 $’000 $’000 $’000
non-current assetsProperty, plant and equipment 13 310,166 206,252 295 164Investment properties 14 813,813 821,132 105,424 108,005Goodwill 15 22,211 24,089 - -Other intangible assets 15 28,264 12,336 - -Investments in subsidiaries 16 - - 121,034 120,470Investments in associates 17 75,967 11,516 3,585 3,585Investments in joint ventures 18 313 317 - -Deferred tax assets 19 14,242 13,114 - -Other non-current receivables 20 - - 121,817 79,445Investment securities 21 106,576 434,065 75,015 301,776Other non-current assets 23 19,489 4,922 - -total non-current assets 1,391,041 1,527,743 427,170 613,445
current assetsAssets held for sale under FRS 105 24 2,078 - 212 -Properties held for sale 25 7,814 12,806 - -Inventories 26 111,044 136,271 - -Income tax receivables 27 7,031 4,061 164 23Prepayments 4,651 2,021 398 6Trade receivables 20 80,178 93,910 139 324Other receivables 20 103,093 35,797 449,793 381,487Marketable securities 21 6,073 92,328 - -Derivative financial instruments 22 1,980 170 - -Cash and cash equivalents 28 215,842 346,208 165,142 123,432total current assets 539,784 723,572 615,848 505,272
total assets 1,930,825 2,251,315 1,043,018 1,118,717
equitY anD liabilities
equityShare capital 29 265,928 265,928 265,928 265,928Retained earnings 30 565,472 1,329,125 87,760 525,041Dividend reserve 30 325,897 16,295 325,897 16,295Other reserves 30 39,484 220,139 2,575 182,873
Equity attributable to equity holders of the Company 1,196,781 1,831,487 682,160 990,137Minority interests 52,349 62,669 - -total equity 1,249,130 1,894,156 682,160 990,137
non-current liabilitiesProvisions 31 6,572 5,244 - -Deferred tax liabilities 19 54,746 38,554 1,682 458Other non-current payables 34 - - 106,382 -Borrowings 32 247,565 3,922 180,545 -Derivative financial instruments 22 4,934 - 2,218 -Other non-current liabilities 33 26,915 40,165 - -total non-current liabilities 340,732 87,885 290,827 458
current liabilitiesProvisions 31 30 38 - -Income tax payable 14,326 24,251 - 2,160Trade payables 34 19,804 20,855 436 288Other payables 34 70,546 49,900 42,595 125,597Borrowings 32 235,752 171,345 27,000 -Derivative financial instruments 22 505 2,885 - 77total current liabilities 340,963 269,274 70,031 128,122
total liabilities 681,695 357,159 360,858 128,580
total equity and liabilities 1,930,825 2,251,315 1,043,018 1,118,717
The accompanying accounting policies and explanatory notes form an integral part of the financial statements.

�������������������������������������������������������
��� ���
������������������
50CONSOLIDATED STATEMENT
OF CHANGES IN EQUITYFor the financial year ended 31 December 2008
�������������������������������������������������������
��� ���
������������������
totalequity
equityattributable
to equityholders of the
companysharecapital
Retainedearnings
Dividendreserve
AFSreserve
Hedgingreserve
Revaluationreserve
Shareoptionreserve
Translationreserve
Minorityinterests
$’000 $’000 $’000 $’000 $’000 $’000 $’000 $’000 $’000 $’000 $’000
Opening balance at 1 January 2008 1,894,156 1,831,487 265,928 1,329,125 16,295 229,320 (515) 927 33 (9,626) 62,669
Exchange adjustment (33,782) (28,999) - - - - - - - (28,999) (4,783)
Exchange loss transferred to income statement 169 169 - - - - - - - 169 -
Net fair value changes on available-for-sale investment securities (154,512) (152,904) - - - (152,904) - - - - (1,608)
Net fair value changes transferred to income statement (73,420) (73,420) - - - (73,420) - - - - -
Reversal of fair value changes on investment securities which became an associate 8,802 6,442 - - - 6,442 - - - - 2,360
Net fair value changes on cash flow hedges (2,245) (2,214) - - - - (2,214) - - - (31)
Impairment transferred to income statement 588 588 - - - 588 - - - - -
Net revaluation surplus on properties due to change in accounting policy 70,113 69,566 - - - - - 69,566 - - 547
Net (deficit)/ income recognised directly in equity (184,287) (180,772) - - - (219,294) (2,214) 69,566 - (28,830) (3,515)
Profit for the year 53,820 57,608 - 57,608 - - - - - - (3,788)

�������������������������������������������������������
��� ���
�������������������������������������������������������������������������
��� ���
������������������
51CONSOLIDATED STATEMENT
OF CHANGES IN EQUITYFor the financial year ended 31 December 2008
(cont’d)
totalequity
equityattributable
to equityholders of the
companysharecapital
Retainedearnings
Dividendreserve
AFSreserve
Hedgingreserve
Revaluationreserve
Shareoptionreserve
Translationreserve
Minorityinterests
$’000 $’000 $’000 $’000 $’000 $’000 $’000 $’000 $’000 $’000 $’000
Total recognised income and expenses for the year (130,467) (123,164) - 57,608 - (219,294) (2,214) 69,566 - (28,830) (7,303)
Dividend on ordinary shares (note 30(a), 30(b) and 35) (511,659) (511,659) - (821,261) 309,602 - - - - - -
Dividends to minority shareholders of subsidiaries (4,274) - - - - - - - - - (4,274)
Minority interests arising from acquisition of a subsidiary 76 - - - - - - - - - 76
Shares issued to a minority shareholder by a subsidiary 2 - - - - - - - - - 2
Net increase arising from placement of shares to a minority shareholder 1,047 - - - - - - - - - 1,047
Fair value of options issued by a subsidiary 249 117 - - - - - - 117 - 132
closing balance at 31 December 2008 1,249,130 1,196,781 265,928 565,472 325,897 10,026 (2,729) 70,493 150 (38,456) 52,349
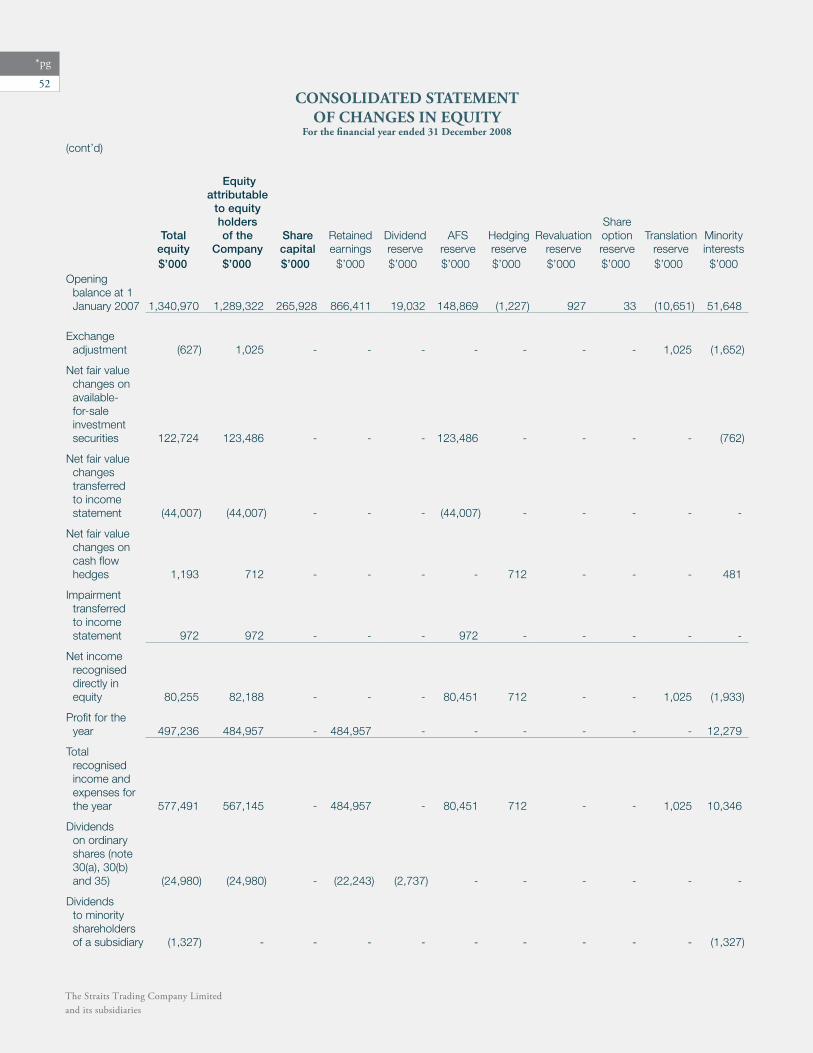
�������������������������������������������������������
��� ���
������������������
52CONSOLIDATED STATEMENT
OF CHANGES IN EQUITYFor the financial year ended 31 December 2008
�������������������������������������������������������
��� ���
������������������
(cont’d)
totalequity
equityattributable
to equityholders of the
companysharecapital
Retainedearnings
Dividendreserve
AFSreserve
Hedgingreserve
Revaluationreserve
Shareoptionreserve
Translationreserve
Minorityinterests
$’000 $’000 $’000 $’000 $’000 $’000 $’000 $’000 $’000 $’000 $’000Opening
balance at 1 January 2007 1,340,970 1,289,322 265,928 866,411 19,032 148,869 (1,227) 927 33 (10,651) 51,648
Exchange adjustment (627) 1,025 - - - - - - - 1,025 (1,652)
Net fair value changes on available-for-sale investment securities 122,724 123,486 - - - 123,486 - - - - (762)
Net fair value changes transferred to income statement (44,007) (44,007) - - - (44,007) - - - - -
Net fair value changes on cash flow hedges 1,193 712 - - - - 712 - - - 481
Impairment transferred to income statement 972 972 - - - 972 - - - - -
Net income recognised directly in equity 80,255 82,188 - - - 80,451 712 - - 1,025 (1,933)
Profit for the year 497,236 484,957 - 484,957 - - - - - - 12,279
Total recognised income and expenses for the year 577,491 567,145 - 484,957 - 80,451 712 - - 1,025 10,346
Dividends on ordinary shares (note 30(a), 30(b) and 35) (24,980) (24,980) - (22,243) (2,737) - - - - - -
Dividends to minority shareholders of a subsidiary (1,327) - - - - - - - - - (1,327)

�������������������������������������������������������
��� ���
�������������������������������������������������������������������������
��� ���
������������������
53CONSOLIDATED STATEMENT
OF CHANGES IN EQUITYFor the financial year ended 31 December 2008
(cont’d)
totalequity
equityattributable
to equityholders of the
companysharecapital
Retainedearnings
Dividendreserve
AFSreserve
Hedgingreserve
Revaluationreserve
Shareoptionreserve
Translationreserve
Minorityinterests
$’000 $’000 $’000 $’000 $’000 $’000 $’000 $’000 $’000 $’000 $’000
Minority interests arising from acquisition of a subsidiary (note 16(b)) 122 - - - - - - - - - 122
Shares issued to a minority shareholder by a subsidiary 49 - - - - - - - - - 49
Net increase arising from subscription of rights issue by minority shareholders 1,831 - - - - - - - - - 1,831
Closing balance at 31 December 2007 1,894,156 1,831,487 265,928 1,329,125 16,295 229,320 (515) 927 33 (9,626) 62,669
The accompanying accounting policies and explanatory notes form an integral part of the financial statements.

�������������������������������������������������������
��� ���
������������������
54CONSOLIDATED CASH FLOW STATEMENT
For the financial year ended 31 December 2008
�������������������������������������������������������
��� ���
������������������
2008 2007$’000 $’000
cash flows from operating activitiesProfit before tax 73,915 536,805Adjustments
Depreciation of property, plant and equipment 16,908 15,351Interest income (8,496) (9,505)Finance costs 13,368 7,532Dividend income (8,956) (12,727)Loss/(Gain) on disposal of property, plant and equipment 17 (55)Property, plant and equipment written off 221 372Amortisation of mining rights 1,302 1,353Amortisation of management rights 186 195Amortisation of club membership 9 9Amortisation of exploration and development cost 2,644 2,112Amortisation of deferred income (3,625) (3,625)Changes in fair value of financial assets 15,023 (16,326)Provision for mine rehabilitation 1,354 110Provision for severance benefit 1,705 2,393Impairment/(Reversal) of doubtful receivables 169 (4,025)Bad debt directly written off 19 15Exploration costs written off 288 586Share of loss/(profit) from equity-accounted associates 4,356 (530)Share of profit from equity-accounted joint ventures (77) (102)Net surplus on disposal of investment securities (75,066) (29,247)Net gain on dilution of a subsidiary (73) -Net fair value changes of investment properties 12,458 (383,586)Write back of development cost provision (992) -Net gain on disposal of properties (3,909) (2,159)Revaluation deficit of hotel property 1,040 -Impairment of investment in an associate 14,530 -Net tax refund from prior years’ assessments - (6,008)Impairment of investment securities 649 972Impairment of plant and equipment 726 -Impairment of goodwill 697 -
operating cash flows before changes in working capital 60,390 99,910Decrease in properties held for sale 4,992 10,875Decrease/(Increase) in inventories 25,381 (2,503)Decrease/(Increase) in marketable securities 62,537 (3,963)Increase in trade and other receivables (53,017) (37,567)Increase/(Decrease) in trade and other payables 18,473 (4,035)cash flows from operations 118,756 62,717Income taxes paid (23,832) (22,884)Payment of finance costs (14,391) (8,020)Dividend income 8,956 12,727Dividends from associates 15 8,005Interest received 8,185 10,035net cash flows from operating activities 97,689 62,580

�������������������������������������������������������
��� ���
�������������������������������������������������������������������������
��� ���
������������������
55CONSOLIDATED CASH FLOW STATEMENT
For the financial year ended 31 December 2008
(cont’d)
2008 2007$’000 $’000
cash flows from investing activitiesProceeds from disposal of properties, plant and equipment 203 10,186Cost incurred on property, plant and equipment (64,156) (20,897)Deposit paid on property, plant and equipment (159) (2,534)Proceeds from disposal of investment securities 155,199 8,128Purchase of investment securities (675) (29,894)Net cash outflow on acquisition of a subsidiary - (182)Payment of deferred exploration and mine development expenditure (21,615) (5,582)Cost incurred on investment properties (10,792) (9,089)Purchase of mining rights (79) (871)Purchase of shares in associates (74,276) -Net tax refund from prior years’ assessments - 6,008Payment for insurance scheme (1,784) (3,450)Minority interests arising from acquisition of a subsidiary 76 -net cash flows used in investing activities (18,058) (48,177)
cash flows from financing activitiesDividends paid to shareholders (511,659) (24,980)Dividends paid to minority shareholders of subsidiaries (4,274) (1,327)Increase in borrowings 308,850 26,404Decrease in amount due from a joint venture 134 155Proceeds from right issue by a subsidiary - 1,187Proceeds from share placement by a subsidiary 1,227 -net cash flows (used in)/from financing activities (205,722) 1,439
net (decrease)/increase in cash and cash equivalents (126,091) 15,842Effect of exchange rate changes on cash and cash equivalents (4,275) (4,833)Cash and cash equivalents, beginning balance 346,208 335,199cash and cash equivalents, ending balance (note 28) 215,842 346,208
The accompanying accounting policies and explanatory notes form an integral part of the financial statements.

�������������������������������������������������������
��� ���
������������������
56NOTES TO THE FINANCIAL STATEMENTS
For the financial year ended 31 December 2008
�������������������������������������������������������
��� ���
������������������
1 corporate information
The financial statements of The Straits Trading Company Limited (the Company) for the year ended 31 December 2008 were authorised for issue in accordance with a resolution of the Directors on 25 March 2009.
The Straits Trading Company Limited is a limited liability company incorporated and domiciled in Singapore. The registered office of the Company is located at 18 Cross Street, #15-01, Singapore 048423. The Company is listed on the Singapore Exchange Securities Trading Limited.
The immediate and ultimate holding company is The Cairns Private Limited, a company incorporated in Singapore.
The principal activity of the Company is that of an investment holding company. The subsidiaries, associates and joint ventures of the Group are primarily engaged in tin mining and smelting, investments in other metals and mineral resources, hotel investment and management, property operations as well as financial investments. Following a strategic review of the businesses, the Group has disposed of most of its financial investments during the year. Apart from the substantial divestment of financial investments, there have been no significant changes in the nature of these activities during the financial year.
The consolidated financial statements relate to the Company and its subsidiaries (referred to as the Group) and the Group’s interests in associates and joint ventures.
2 summarY of significant accounting policies
2.1 BASIS OF PREPARATION
The financial statements have been prepared in accordance with Singapore Financial Reporting Standards (FRS).
The financial statements have been prepared on a historical cost basis except as disclosed in the accounting policies below.
The financial statements are presented in Singapore dollars (SGD or $) and all values are rounded to the nearest thousand ($’000) except when otherwise indicated.
The accounting policies applied by the Group and the Company are consistent with those used in the previous year, except for the changes in accounting policies discussed below.
2.2 CHANGES IN ACCOUNTING STANDARDS AND ACCOUNTING POLICIES
Certain new FRS and interpretations to FRS (INT FRS) have been published that are mandatory for accounting periods beginning on or after 1 January 2008.
effective onAmendments to FRS 39 and FRS 107 Reclassification of Financial Assets 1 July 2008
effective for annualperiods beginning
on or afterINT FRS 112 Service Concession Arrangements 1 January 2008INT FRS 114 FRS 19 – The Limit on a Defined Benefit Asset, Minimum Funding Requirements and their Interaction 1 January 2008
The adoption of the above pronouncements in the current financial year has no material impact on the financial statements.

�������������������������������������������������������
��� ���
�������������������������������������������������������������������������
��� ���
������������������
57NOTES TO THE FINANCIAL STATEMENTS
For the financial year ended 31 December 2008
2 summarY of significant accounting policies (cont’D)
2.2 CHANGES IN ACCOUNTING STANDARDS AND ACCOUNTING POLICIES (CONT’D)
Change in accounting policy on 31 December 2008
The Group has adopted the revaluation model under FRS 16 – Property, Plant and Equipment, to better reflect the Group’s financial position for properties to be carried at valuation instead of at cost. This has resulted in an increase in equity as at 31 December 2008 of $70,113,000 at Group. This is after adjusting for the related deferred taxes. In accordance with FRS 16, the change in accounting policy has been applied prospectively with no impact to the 2008 income statement.
Early adoption of the amendments to FRS 40 – Investment Property on 31 December 2008
Land under development for future use as investment property has been reclassified from Property, Plant and Equipment previously carried at cost to Investment Property at fair value. This has resulted in a $68,891,000 fair value gain included in the income statement at Group level. After adjusting for the related deferred tax of $12,400,000, this has increased the Group’s 2008 earnings per share by 17.3 cents.
2.3 FUTURE CHANGES IN ACCOUNTING STANDARDS
The Group has not adopted the following FRS and INT FRS that have been issued but not yet effective :
effective for annualperiods beginning
on or afterImprovements to FRSs* 1 January 2009
(unless otherwise stated)Revised FRS 1 Presentation of Financial Statements 1 January 2009Amendments to FRS 23 Borrowing Costs 1 January 2009Amendments to FRS 32 and FRS 1 Puttable Financial Instruments and Obligations Arising from Liquidation 1 January 2009
Amendments to FRS 39 Eligible Hedged Items 1 July 2009Amendments to FRS 101 and FRS 27 Cost of an Investment in a Subsidiary, Jointly Controlled Entity or Associates 1 January 2009
Amendments to FRS 102 Vesting Conditions and Cancellations 1 January 2009FRS 108 Operating Segments 1 January 2009INT FRS 113 Customer Loyalty Programmes 1 July 2008INT FRS 116 Hedges of a Net Investment in a Foreign Operation 1 October 2008INT FRS 117 Distributions of Non-cash Assets to Owners 1 July 2009
* The Group has early adopted the amendments to FRS 40 – Investment Property on 31 December 2008. Refer to note 2.2 for effect of adoption.
FRS 1 Presentation of Financial Statements – Revised presentation
The revised FRS 1 requires owner and non-owner changes in equity to be presented separately. The statement of changes in equity will include only details of transactions with owners, with all non-owner changes in equity presented as a single line item. In addition, the revised standard introduces the statement of comprehensive income: it presents all items of income and expense recognised in profit or loss, together with all other items of recognised income and expense, either in one single statement, or in two linked statements. The Group is currently evaluating the format to adopt.

�������������������������������������������������������
��� ���
������������������
58NOTES TO THE FINANCIAL STATEMENTS
For the financial year ended 31 December 2008
�������������������������������������������������������
��� ���
������������������
2 summarY of significant accounting policies (cont’D)
2.3 FUTURE CHANGES IN ACCOUNTING STANDARDS (CONT’D)
FRS 108 Operating Segments
FRS 108 supersedes FRS 14 Segment Reporting and requires entities to disclose segment information based on the information reviewed by the entity’s chief operating decision maker. The impact of this standard on the other segment disclosures is still to be determined.
Improvements to FRSs will become effective for the Group’s financial statements for the year ending 31 December 2009, except for the amendment to FRS 105 Non-current Assets Held for Sale and Discontinued Operations which will become effective for the year ending 31 December 2010. Improvements to FRSs contain amendments to numerous accounting standards that result in accounting changes for presentation, recognition or measurement purposes and terminology or editorial amendments. The Group is in the process of assessing the impact of these amendments.
The initial application of these pronouncements are not expected to have any material impact on the Group’s financial statements.
2.4 SIGNIFICANT ACCOUNTING ESTIMATES AND JUDGEMENTS
The preparation of financial statements in conformity with FRS requires management to make judgements, estimates and assumptions that affect the application of the Group’s accounting policies and reported amounts of assets, liabilities, income and expenses, and disclosures made. The estimates and associated assumptions are assessed on an on-going basis and are based on historical experience and various other factors that are believed to be reasonable under the circumstances, the results of which form the basis for making the judgements about carrying amounts of assets and liabilities that are not readily apparent from other sources.
Judgements made by management in the application of FRS that have a significant effect on the financial statements and in arriving at estimates with a significant risk of material adjustment in the following year are discussed in note 42.
2.5 BASIS OF CONSOLIDATION
(a) SUBSIDIARIES Subsidiaries are entities controlled by the Company. Control exists when the Company has the power, directly or indirectly, to
govern the financial and operating policies of an entity so as to obtain benefits from its activities. The Group generally has such power when it, directly or indirectly, holds more than 50% of the issued share capital, or controls more than half of the voting power, or controls the composition of the board of directors.
In the Company’s balance sheet, investments in subsidiaries are stated at costs less accumulated impairment losses. At each balance sheet date, the Company assesses whether there is any indication of impairment. If any such indication exists, the recoverable amount is estimated and allowance for impairment is made.
The financial statements of the Group consolidate the financial statements of the Company and its subsidiaries as at 31 December. The financial statements of the subsidiaries are prepared for the same reporting year as the parent company. Consistent accounting policies are applied for like transactions and events in similar circumstances.
All intra-group balances, transactions, income and expenses and profits and losses resulting from intra-group transactions that are recognised in assets, are eliminated in full.
Subsidiaries are fully consolidated from the date of acquisition, being the date on which the Group obtains control, and continue to be consolidated until the date that such control ceases.

�������������������������������������������������������
��� ���
�������������������������������������������������������������������������
��� ���
������������������
59NOTES TO THE FINANCIAL STATEMENTS
For the financial year ended 31 December 2008
2 summarY of significant accounting policies (cont’D)
2.5 BASIS OF CONSOLIDATION (CONT’D)
(b) BUSINESS COMBINATIONS The purchase method of accounting is used to account for the acquisition of subsidiaries by the Group. The cost of an
acquisition is measured as the fair value of the assets given, equity instruments issued or liabilities incurred or assumed at the date of exchange, plus costs directly attributable to the acquisition. Identifiable assets acquired and liabilities and contingent liabilities assumed in a business combination are measured initially at their fair value on the date of acquisition, irrespective of the extent of any minority interest.
Assets, liabilities and results of overseas subsidiaries are translated into Singapore dollars on the basis outlined in note 2.8 to the financial statements.
Minority interests represent the portion of profit or loss and net assets in subsidiaries not held by the Group. They are presented in the consolidated balance sheet within equity, separately from the parent shareholders’ equity, and are separately disclosed in the consolidated income statement.
The Group applies a policy of treating transactions with minority interests as transactions with parties external to the Group. Disposals to minority interests, which result in gains and losses for the Group, are recorded in the income statement. The difference between any consideration paid to minority interests for purchases of additional equity interest in a subsidiary and the incremental share of the carrying value of the net assets of the subsidiary is recognised as goodwill.
2.6 ASSOCIATES
Associates are entities, not being a subsidiary or a joint venture, in which the Group has significant influence. Significant influence is the power to participate in the financial and operating policy decisions of the investee but is not control or joint control over those policies.
The Group’s investments in associates are accounted for using the equity method. Under the equity method, the investment in associates is carried in the balance sheet at cost plus post-acquisition changes in the Group’s share of net assets of the associates. The Group’s share of the profit or loss of the associates is recognised in the consolidated income statement. Where there has been a change recognised directly in the equity of the associates, the Group recognises its share of such changes. After application of the equity method, the Group determines whether it is necessary to recognise any impairment loss with respect to the Group’s net investment in the associates. The associates are equity accounted for from the date the Group obtains significant influence until the date the Group ceases to have significant influence over the associates. Unrealised gains on transactions between the Group and the associates are eliminated to the extent of the Group’s interest in the associates. Unrealised losses are also eliminated unless the transaction provides evidence of an impairment of the assets transferred.
Goodwill relating to an associate is included in the carrying amount of the investment.
Any excess of the Group’s share of the net fair value of the associate’s identifiable assets, liabilities and contingent liabilities over the cost of the investment is excluded from the carrying amount of the investment and is instead included as income in the determination of the Group’s share of the associate’s profit or loss in the period in which the investment is acquired.
When the Group’s share of losses in an associate equals or exceeds its interest in the associate, including any other unsecured receivables, the Group does not recognise further losses, unless it has incurred obligations or made payments on behalf of the associate.
The most recent available audited financial statements of the associates are used by the Group in applying the equity method. Where the dates of the audited financial statements used are not co-terminous with those of the Group, the share of results is arrived at from the last audited financial statements available and un-audited management financial statements to the end of the accounting period.
Consistent accounting policies are applied for like transactions and events in similar circumstances.

�������������������������������������������������������
��� ���
������������������
60NOTES TO THE FINANCIAL STATEMENTS
For the financial year ended 31 December 2008
�������������������������������������������������������
��� ���
������������������
2 summarY of significant accounting policies (cont’D)
2.6 ASSOCIATES (CONT’D)
In the Company’s separate financial statements, investments in associates are accounted for at cost less accumulated impairment losses.
2.7 JOINT VENTURES
Joint ventures are entities not being subsidiaries in which the Group holds not more than 50% of the equity and has joint control in the companies’ board management.
The Group’s investments in joint ventures are accounted for using the equity method. Under the equity method, the investments in joint ventures are carried in the balance sheet at cost plus post-acquisition changes in the Group’s share of net assets of the joint venture. The Group’s share of the profit or loss of the joint ventures is recognised in the consolidated income statement. Where there has been a change recognised directly in the equity of the joint ventures, the Group recognises its share of such changes. After application of the equity method, the Group determines whether it is necessary to recognise any impairment loss with respect to the Group’s net investment in the joint ventures. The joint ventures are equity accounted for from the date the Group obtains significant influence until the date the Group ceases to have joint control over the joint ventures.
2.8 FUNCTIONAL AND FOREIGN CURRENCIES
(a) FUNCTIONAL CURRENCY Management has determined the currency of the primary economic environment in which the Company operates, i.e., functional
currency, to be SGD.
(b) FOREIGN CURRENCY TRANSACTIONS Transactions in foreign currencies are measured in the respective functional currencies of the Company and its subsidiaries and
are recorded on initial recognition in the functional currencies at exchange rates approximating those ruling at the transaction dates. Monetary assets and liabilities denominated in foreign currencies are translated at the rate of exchange ruling at the balance sheet date. Non-monetary items that are measured in terms of historical cost in a foreign currency are translated using the exchange rates as at the dates of the initial transactions. Non-monetary items measured at fair value in a foreign currency are translated using the exchange rates at the date when the fair value was determined.
Exchange differences arising on the settlement of monetary items or on translating monetary items at the balance sheet date are recognised in the income statement except for exchange differences arising on monetary items that form part of the Group’s net investment in foreign subsidiaries, which are recognised initially in a separate component of equity as translation reserve in the consolidated balance sheet and recognised in the consolidated income statement on disposal of the subsidiary.
(c) FOREIGN CURRENCY TRANSLATION The results and financial position of foreign operations are translated into SGD, presentation currency of the Group, using the
following procedures :
• Assetsand liabilities foreachbalancesheetpresentedare translatedat the rate rulingat thatbalancesheetdate;and
• Income and expenses for each income statement are translated at periodical average exchange rates whichapproximates the exchange rates at the dates of the transactions.
All resulting exchange differences are recognised in a separate component of equity as translation reserve.

�������������������������������������������������������
��� ���
�������������������������������������������������������������������������
��� ���
������������������
61NOTES TO THE FINANCIAL STATEMENTS
For the financial year ended 31 December 2008
2 summarY of significant accounting policies (cont’D)
2.8 FUNCTIONAL AND FOREIGN CURRENCIES (CONT’D)
(c) FOREIGN CURRENCY TRANSLATION (CONT’D) Goodwill and fair value adjustments arising on the acquisition of foreign operations on or after 1 January 2005 are treated as
assets and liabilities of the foreign operations and translated at the closing rates at the date of the balance sheet.
On disposal of a foreign operation, the cumulative amount of exchange differences deferred in equity relating to that foreign operation is recognised in the income statement as a component of the gain or loss on disposal.
2.9 PROPERTY, PLANT AND EQUIPMENT
All items of property, plant and equipment are initially recorded at cost. The cost of an item of property, plant and equipment is recognised as an asset if, and only if, it is probable that future economic benefits associated with the item will flow to the Group and the cost of the item can be measured reliably.
Subsequent to recognition, plant and equipment and furniture and fixtures are measured at cost less accumulated depreciation and accumulated impairment losses.
Following the Group’s decision to adopt the revaluation model on 31 December 2008, all land and buildings are carried at valuation instead of at cost effective from this date.
Land and buildings are measured at fair value less accumulated depreciation and impairment losses recognised after the date of the revaluation. Valuations are performed with sufficient regularity to ensure that the carrying amount does not differ materially from the fair value of the land and buildings at the balance sheet date.
Any revaluation surplus is credited directly to the asset revaluation reserve in equity, except to the extent that it reverses a revaluation decrease of the same asset previously recognised in the income statement, in which case the increase is recognised in the income statement. A revaluation deficit is recognised in income statement, except to the extent that it offsets an existing surplus on the same asset carried in the asset revaluation reserve.
Any accumulated depreciation as at the revaluation date is eliminated against the gross carrying amount of the asset and the net amount is restated to the revalued amount of the asset. The whole of the revaluation surplus included in the asset revaluation reserve in respect of an asset is transferred directly to retained earnings on retirement or disposal of the asset.
An item of property, plant and equipment is derecognised upon disposal or when no future economic benefits are expected from its use or disposal. Any gain or loss on derecognition of the asset is included in the income statement in the year the asset is derecognised.
In note 13 to the financial statements, land described as freehold land includes land held under 999 years leasehold which is regarded as equivalent to freehold.
2.10 DEPRECIATION AND RESIDUAL VALUES
In the tin mining subsidiary, plant and equipment used in mining are depreciated using the units-of-production method based on economically recoverable ore reserves over the estimated useful lives of the assets. Changes in estimated ore reserves and the useful lives of plant and equipment are accounted for on a prospective basis from the beginning of the year in which the change arises. Earthmoving vehicles are depreciated on hour-worked basis over the estimated useful life of each asset.

�������������������������������������������������������
��� ���
������������������
62NOTES TO THE FINANCIAL STATEMENTS
For the financial year ended 31 December 2008
�������������������������������������������������������
��� ���
������������������
2 summarY of significant accounting policies (cont’D)
2.10 DEPRECIATION AND RESIDUAL VALUES (CONT’D)
Depreciation for the remaining assets of the Group is provided on the straight-line method to write off the cost or valuation of relevant assets to its residual value, if any, over their estimated useful lives or life of the mine where appropriate, whichever is shorter. No depreciation is provided on freehold or equivalent land. The estimated useful lives for these remaining assets are as follows :
Leasehold land - remaining lease term of up to 84 yearsBuildings - 8 to 40 years or the unexpired lease period or life of the mine, whichever is shorterPlant, equipment and vehicles - 3 to 40 yearsFurniture - 3 to 10 years
The residual value, useful life and depreciation method are reviewed at each financial year end to ensure that the amount, method and period of depreciation are consistent with previous estimates and the expected pattern of consumption of the future economic benefits embodied in the items of property, plant and equipment.
Capital work-in-progress included in Property, Plant and Equipment are not depreciated as these assets are not available for use.
The carrying values of Property, Plant and Equipment are reviewed for impairment when events or changes in circumstances indicate that the carrying value may not be recoverable.
2.11 PROPERTIES UNDER DEVELOPMENT
Properties under development include land cost, development expenditures and, where applicable, finance costs and other related expenditures.
Properties under development which are intended for sale in the ordinary course of business are stated at the lower of cost and net realisable value.
Development is considered complete upon the issue of Temporary Occupation Permit or Certificate of Statutory Completion, whichever is relevant. Upon completion, property developed for sale is shown under current asset as property held for sale.
Properties that are being constructed or developed for future use as investment properties are included in Property, Plant and Equipment and carried at cost, less accumulated impairment losses until construction or development is completed, at which time they are accounted for as investment properties. Following the Group’s decision to early adopt the amendments to FRS 40 on 31 December 2008, such properties are included in Investment Properties and carried at fair value effective from this date.
2.12 INVESTMENT PROPERTIES
Investment properties are properties held either to earn rental income or for capital appreciation or both. Following the Group’s decision to early adopt the amendments to FRS 40 on 31 December 2008, this also include property that is being constructed or developed for future use as investment property. Investment properties are measured initially at cost, including transaction costs. The carrying amount includes the cost of replacing part of an existing investment property at the time that cost is incurred if the recognition criteria are met and excludes the costs of day-to-day servicing of an investment property. Subsequent to initial recognition, investment properties are stated at fair value, which reflects market conditions at the balance sheet date. Gains or losses arising from changes in the fair values of investment properties are included in the income statement in the year in which they arise.
Investment properties are derecognised when either they have been disposed of or when the investment property is permanently withdrawn from use and no future economic benefit is expected from its disposal. Any gains or losses on the retirement or disposal of an investment property are recognised in the income statement in the year of retirement or disposal.

�������������������������������������������������������
��� ���
�������������������������������������������������������������������������
��� ���
������������������
63NOTES TO THE FINANCIAL STATEMENTS
For the financial year ended 31 December 2008
2 summarY of significant accounting policies (cont’D)
2.12 INVESTMENT PROPERTIES (CONT’D)
For properties that are being developed/redeveloped for continued future use, they are stated at fair values and the associated redevelopment expenditures are stated at cost.
2.13 INTANGIBLE ASSETS
(a) GOODWILL Goodwill represents the excess of the cost of the acquisition over the Group’s interest in the net fair value of the identifiable
assets, liabilities and contingent liabilities of the acquiree.
Goodwill arising on the acquisition of subsidiaries is presented in intangible assets. Goodwill arising on the acquisition of associates and joint ventures is presented together with investments in associates and joint ventures.
Goodwill is measured at cost less accumulated impairment losses. Goodwill is tested for impairment as described in note 2.21. Negative goodwill is recognised immediately in the income statement.
Gains and losses on the disposal of the subsidiaries, associates and joint ventures include the carrying amount of goodwill relating to the entity sold.
(b) MINING RIGHTS Mining rights acquired in a business combination are stated at their fair values as at the date of acquisition. Following initial
recognition, mining rights are carried at cost less accumulated amortisation and impairment losses, if any. Mining rights are amortised based on the unit-of-production method so as to write off the mining rights in proportion to the depletion of the estimated economically recoverable ore reserves. The amortisation period and the amortisation method are reviewed at least at each financial year end.
(c) MANAGEMENT RIGHTS Payments made to acquire management rights of hotels and properties of similar nature are capitalised and amortised over
their estimated useful lives of up to 12 years on a straight-line method. The amortisation period and amortisation method are reviewed at least at each financial year end.
(d) MINE EXPLORATION AND EVALUATION EXPENDITURE Exploration and evaluation expenditure is stated at cost less accumulated amortisation and impairment losses, if any.
Exploration and evaluation expenditure incurred in an area of interest for which the Group has current rights to explore is accumulated in respect of each identifiable area of interest. These costs are only carried forward to the extent that they are expected to be recouped through the successful development of the area or where activities in the area have not yet reached a stage that permit reasonable assessment of the existence of economically recoverable ore reserves.
Accumulated costs in relation to an abandoned area are written off in full to the income statement in the year in which the decision to abandon the area is made.
When production commences, the accumulated cost for the relevant area of interest is amortised based on the unit-of-production method so as to write off the expenditure in proportion to the depletion of the estimated economically recoverable ore reserves.
A review is carried out annually on the carrying amount of deferred exploration and evaluation expenditure to determine whether there is any indication of impairment. Any impairment loss is recognised as an expense in the income statement.

�������������������������������������������������������
��� ���
������������������
64NOTES TO THE FINANCIAL STATEMENTS
For the financial year ended 31 December 2008
�������������������������������������������������������
��� ���
������������������
2 summarY of significant accounting policies (cont’D)
2.13 INTANGIBLE ASSETS (CONT’D)
(e) MINE DEVELOPMENT EXPENDITURE Mine development expenditure is stated at cost less accumulated amortisation and impairment losses, if any.
Mine development expenditure incurred in connection with development activities in respect of each area of interest, which includes all activities conducted in the preparation of economically recoverable ore reserves until production, is accumulated in respect of each identifiable area of interest. These costs are only deferred to the extent that they are expected to be recouped through the successful development of the area. Mine development expenditure which is considered to provide minimal benefit to future periods is charged to the income statement.
When production in an area of interest commences, the accumulated cost for the relevant area of interest is amortised based on the unit-of-production method so as to write off the expenditure in proportion to the depletion of the estimated economically recoverable ore reserves.
A review is carried out annually on the carrying amount of deferred development expenditure to determine whether there is any indication of impairment. Any impairment loss is recognised as an expense in the income statement.
(f) MINE ENVIRONMENTAL EXPENDITURE Restoration, rehabilitation and environmental expenditure incurred during the production phase of operations is recognised in
the income statement as part of the cost of production of the mine property concerned.
Significant restoration, rehabilitation and environmental expenditure to be incurred subsequent to the cessation of production of each mine property is provided based on the present value of the estimated expenditure to be incurred.
(g) OTHER INTANGIBLE ASSET Other intangible asset with finite life is amortised over the estimated economic useful life of up to 15 years and assessed
for impairment whenever there is an indication that the intangible asset may be impaired. The amortisation period and the amortisation method for an intangible asset with a finite useful life are reviewed at each financial year end.
2.14 INVESTMENTS IN DEBT AND EQUITY SECURITIES
When investment securities are recognised initially, they are measured at fair value, plus, in the case of investment securities not at fair value through profit or loss, directly attributable transaction costs.
After initial recognition, investment securities classified as held-for-trading are measured at fair value with the gain or loss arising from the changes in fair value recognised in the income statement. Investment securities are classified as held-for-trading if they are acquired principally for the purpose of selling in the near term.
Where the Group has the positive intent and ability to hold debt securities to maturity, they are subsequently measured at amortised cost. Amortised cost is computed as the amount initially recognised minus principal repayments, plus or minus the cumulative amortisation using the effective interest method of any difference between the initially recognised amount and the maturity amount and minus any reduction for impairment or uncollectibility. For investment securities carried at amortised cost, gains or losses are recognised in the income statement when the investment securities are derecognised or impaired as well as through the amortisation process.
Other investment securities held by the Group, only if they are non-derivatives, are classified as available-for-sale (AFS) and are subsequently measured at fair value with the gain or loss arising from the changes in fair value recognised directly in equity, except for impairment losses and foreign exchange gains and losses on AFS that are monetary items which are recognised in the income statement. When these AFS are derecognised, the cumulative gain or loss previously recognised in equity is recognised in the income statement.
All regular way purchases and sales of investment securities are recognised on trade date.

�������������������������������������������������������
��� ���
�������������������������������������������������������������������������
��� ���
������������������
65NOTES TO THE FINANCIAL STATEMENTS
For the financial year ended 31 December 2008
2 summarY of significant accounting policies (cont’D)
2.14 INVESTMENTS IN DEBT AND EQUITY SECURITIES (CONT’D)
The fair value of investment securities that are actively traded in organised financial markets is determined by reference to quoted market bid prices at the close of business on the balance sheet date. For investment securities where there is no active market, fair value is estimated using a valuation technique based on certain assumptions that are not supported by observable market prices or rates. Management believes the estimated fair values resulting from the valuation technique which are recorded in the balance sheet are reasonable and the most appropriate at the balance sheet date. These investment securities shall, however, be measured at cost less impairment losses if their fair values cannot be reliably estimated.
2.15 BASE INVENTORY
Base inventory is the fixed recirculating inventory in the smelting process. The value of this inventory, which comprises a metallic tin content of 381 tonnes, is reviewed at each balance sheet date and stated in the balance sheet at lower of estimated recoverable amounts and cost.
2.16 ASSETS CLASSIFIED AS HELD FOR SALE
Non-current assets that are expected to be recovered primarily through sale rather than through continuing use are classified as held for sale.
Upon classification as held for sale, non-current assets are not depreciated and are measured at the lower of carrying amount and fair value less costs to sell. Any differences are recognised in the income statement.
2.17 PROPERTIES HELD FOR SALE
Properties held for sale are those completed properties which are intended for sale in the ordinary course of business. They are stated at the lower of cost and net realisable value.
2.18 INVENTORIES
Inventories are stated at the lower of cost and net realisable value. Cost is generally determined on a weighted average basis. Net realisable value represents the estimated selling price in the ordinary course of business less anticipated cost of completion, disposal and after making allowance for damaged, obsolete and slow-moving items.
Cost of trading inventory of refined tin metal is determined on a first-in first-out basis. Inventories of tin-in-concentrates and tin-in-process which have matching sales contracts for refined tin metal from tin smelting operations, are stated at the value of such contracts less allowance for conversion. This value is consistent with cost, as it is the practice of the tin smelting subsidiary to buy tin-in-concentrates and sell refined tin metal on a back to back price basis.
Absorption costing is used in the mining operation to assign costs to tin inventories using the weighted average cost method which includes both variable and fixed overhead cost components. The cost of purchased tin-in-concentrates prior to processing comprises cost of purchase.
Cost of other inventories comprising stores, spares, fuels and saleable by-products is determined on the weighted average cost basis. Production cost is not allocated to by-products as it is not material.

�������������������������������������������������������
��� ���
������������������
66NOTES TO THE FINANCIAL STATEMENTS
For the financial year ended 31 December 2008
�������������������������������������������������������
��� ���
������������������
2 summarY of significant accounting policies (cont’D)
2.19 TRADE AND OTHER RECEIVABLES
Trade and other receivables, including amounts due from subsidiaries, associates, related companies and loans to related companies are classified and accounted for as loans and receivables.
Trade and other receivables are recognised and carried at original invoice amount less an allowance for any uncollectible amounts. Allowance is made when there is objective evidence that the Group will not be able to collect the debts. Bad debts are written off when identified.
Receivables from related parties are carried at cost, less an allowance for any uncollectible amount.
The carrying amount of trade receivables impaired by credit losses is reduced through the use of an allowance account unless on the date the impairment loss is recognised, the Group ascertains the amount to be uncollectible whereby it would be reduced directly. In subsequent periods when a trade receivable is ascertained to be uncollectible, it is written off against the allowance account.
Significant financial difficulties of the debtor, probability that the debtor will enter bankruptcy, and default or significant delay in payments are objective evidence that the trade receivable is impaired.
2.20 CASH AND CASH EQUIVALENTS
Cash and cash equivalents comprise cash on hand and on deposit which are readily convertible to cash and which are not subject to a significant risk of changes in value, net of bank overdrafts which are repayable on demand.
Cash and short-term deposits carried in the balance sheets are classified and accounted for as loans and receivables.
2.21 IMPAIRMENT OF ASSETS
(a) NON-FINANCIAL ASSETS An assessment is made at each balance sheet date to determine whether there is an indication of impairment. If any such
indication exists, or when annual impairment testing for an asset is required, the estimated recoverable amount of that asset is determined.
Where the carrying amount of an asset exceeds its recoverable amount, the asset is considered impaired and is written down to its recoverable amount. Impairment losses of continuing operations are recognised in the income statement as ‘impairment losses’ or treated as a revaluation decrease for assets carried at revalued amount to the extent that the impairment loss does not exceed the amount held in the asset revaluation reserve for that same asset.
An assessment is made at each reporting date as to whether there is any indication that previously recognised impairment losses recognised for an asset other than goodwill may no longer exist or may have decreased. If such indication exists, the recoverable amount is estimated.
Calculation of recoverable amount An asset’s recoverable amount is the higher of an asset’s or cash-generating unit’s fair value less costs to sell and its value in
use and is determined on an individual asset basis. If the asset does not generate cash inflows that are largely independent of those from other assets or groups of assets, the recoverable amount is determined for the cash-generating unit to which the asset belongs to. In assessing value in use, the estimated future cash flows are discounted to their present value using a pre-tax discount rate that reflects current market assessments of the time value of money and the risks specific to the asset.
Reversal of impairment An impairment loss for an asset other than goodwill is reversed if, and only if, there has been a change in the estimates used
to determine the recoverable amount since the last impairment loss was recognised.

�������������������������������������������������������
��� ���
�������������������������������������������������������������������������
��� ���
������������������
67NOTES TO THE FINANCIAL STATEMENTS
For the financial year ended 31 December 2008
2 summarY of significant accounting policies (cont’D)
2.21 IMPAIRMENT OF ASSETS (CONT’D)
(a) NON-FINANCIAL ASSETS (CONT’D) The carrying amount of the asset other than goodwill is increased to its revised recoverable amount since the last impairment
loss was recognised. That increased amount cannot exceed the carrying amount that would have been determined, net of depreciation or amortisation, had no impairment loss been recognised for the asset in prior years.
Reversal of an impairment loss for an asset other than goodwill is recognised in the income statement unless the asset is carried at revalued amount, in which case the reversal in excess of impairment loss previously recognised through the income statement is treated as a revaluation increase. After such a reversal, the depreciation charge is adjusted in future periods to allocate the asset’s revised carrying amount, less any residual value, on a systematic basis over its remaining useful life.
Goodwill Goodwill is tested for impairment annually and as and when indicators of impairment are identified.
For the purpose of impairment testing of goodwill, goodwill is allocated to each of the Group’s cash-generating units expected to benefit from synergies of the business combination.
An impairment loss is recognised in the income statement when the carrying amount of cash-generating unit, including the goodwill exceeds the recoverable amount of the cash-generating unit. Recoverable amount of the cash-generating unit is the higher of the cash-generating unit’s fair value less cost to sell and value in use.
Impairment losses recognised in respect of cash-generating units are allocated first to reduce the carrying amount of any goodwill allocated to cash-generating units (group of units) and then to reduce the carrying amount of the other assets in the unit (group of units) on a pro-rata basis. The Group does not reverse in a subsequent period, any impairment loss recognised for goodwill.
(b) FINANCIAL ASSETS The Group assesses at each balance sheet date whether there is any objective evidence that a financial asset or group of
financial assets is impaired.
i) Assets carried at amortised cost If there is objective evidence that an impairment loss on loans and receivables or held-to-maturity investments carried
at amortised cost has been incurred, the amount of the loss is measured as the difference between the asset’s carrying amount and the present value of estimated future cash flows discounted at the financial asset’s original effective interest rate. The carrying amount of the asset is reduced through the use of an allowance account. The amount of the loss is recognised in the income statement.
Reversal of impairment If, in a subsequent period, the amount of the impairment loss decreases and the decrease can be related objectively
to an event occurring after the impairment was recognised, the previously recognised impairment loss is reversed. Any subsequent reversal of an impairment loss is recognised in the income statement, to the extent that the carrying value of the asset does not exceed its amortised cost at the reversal date.
ii) Assets carried at cost If there is objective evidence that an impairment loss on an unquoted equity instrument that is not carried at fair value
because its fair value cannot be reliably measured, or on a derivative asset that is linked to and must be settled by delivery of such an unquoted equity instrument has been incurred, the amount of the loss is measured as the difference between the asset’s carrying amount and the present value of estimated future cash flows discounted at the current market rate of return for a similar financial asset.

�������������������������������������������������������
��� ���
������������������
68NOTES TO THE FINANCIAL STATEMENTS
For the financial year ended 31 December 2008
�������������������������������������������������������
��� ���
������������������
2 summarY of significant accounting policies (cont’D)
2.21 IMPAIRMENT OF ASSETS (CONT’D)
(b) FINANCIAL ASSETS (CONT’D)ii) Assets carried at cost (cont’d) Reversal of impairment Such impairment losses are not reversed in subsequent periods.
iii) Available-for-sale financial assets Significant or prolonged decline in fair value below cost, significant financial difficulties of the issuer or obligor, and the
disappearance of an active trading market are considerations to determine whether there is objective evidence that investment securities classified as available-for-sale financial assets are impaired.
If an available-for-sale financial asset is impaired, an amount comprising the difference between its cost (net of any principal payment and amortisation) and its current fair value, less any impairment loss previously recognised in the income statement, is transferred from equity to the income statement.
Reversal of impairment Reversals in respect of equity instruments classified as available-for-sale are not recognised in the income statement.
Reversals of impairment losses on debt instruments are reversed through the income statement, if the increase in fair value of the instrument can be objectively related to an event occurring after the impairment loss was recognised in the income statement.
2.22 INTEREST-BEARING LOANS AND BORROWINGS
All loans and borrowings are initially recognised at the fair value of the consideration received less directly attributable transaction costs.
After initial recognition, interest-bearing loans and borrowings are subsequently measured at amortised cost using the effective interest method.
Gains and losses are recognised in the income statement when the liabilities are derecognised as well as through the amortisation process.
2.23 BORROWING COSTS
Borrowing costs are generally expensed as incurred. Borrowing costs are capitalised if they are directly attributable to the acquisition, construction or production of a qualifying asset. Capitalisation of borrowing costs commences when the activities to prepare the asset for its intended use or sale are in progress and the expenditures and borrowing costs are being incurred. Borrowing costs are capitalised until the assets are ready for their intended use. If the resulting carrying amount of the asset exceeds its recoverable amount, an impairment loss is recorded.
2.24 TRADE AND OTHER PAYABLES
Trade and other payables are carried at cost which is the fair value of the consideration to be paid in the future for goods and services received, whether or not these are billed.
Payables to related parties are carried at cost.
Gains and losses are recognised in the income statement when the liabilities are derecognised as well as through the amortisation process.

�������������������������������������������������������
��� ���
�������������������������������������������������������������������������
��� ���
������������������
69NOTES TO THE FINANCIAL STATEMENTS
For the financial year ended 31 December 2008
2 summarY of significant accounting policies (cont’D)
2.25 PROVISIONS
Provisions are recognised when the Group has a present obligation (legal or constructive) where, as a result of a past event, it is probable that an outflow of resources embodying economic benefits will be required to settle the obligations and a reliable estimate can be made of the amount of obligation.
Provisions are reviewed at each balance sheet date and adjusted to reflect the current best estimate. If it is no longer probable that an outflow of resources embodying economic benefits will be required to settle the obligation, the provision is reversed.
Where the effect of the time value of money is material, provisions are discounted using a current pre-tax rate that reflects, where appropriate, the risks specific to the liability. Where discounting is used, the increase in the provision due to the passage of time is recognised as finance costs.
Provision for restructuring costs is recognised when a detailed and formal restructuring plan has been approved, and the restructuring has either commenced or has been announced publicly. Costs relating to ongoing activities are not provided for.
2.26 SHARE-BASED PAYMENT TRANSACTIONS
(a) PHANTOM SHARE PLAN Under the Phantom Share Plan (PSP), Group Executives who have attained the age of twenty-one (21) years and who hold the
rank of manager and above or such rank as may be designated from time to time, shall be eligible to participate in the Plan. Grantees are granted a notional number of Shares (Phantom Shares) calculated by dividing the Non-Cash Bonus with the Value of a Share which is measured initially at fair value at the Grant Date pursuant to the Plan taking into account the terms and conditions upon which the Phantom Shares were granted. No Shares will be allotted and issued and Grantees of the plan are not entitled to, and have no voting rights or interest in the Shares of the Company.
A Grantee shall be entitled to redeem, and shall redeem, one-third (and not less) of each Grant of Phantom Shares on the
First Redemption Date, Second Redemption Date and Final Redemption Date of the Grant Date relating to that Grant. If the Phantom Shares which a Grantee is entitled to redeem on a Redemption Date is not redeemed, such Phantom Shares which are not redeemed shall be carried forward and added to the number of Phantom Shares redeemable on the next Redemption Date. Until the liability is settled, it is remeasured at each reporting date and fair value is expensed over the period till vesting with recognition of a corresponding liability. Any Phantom Shares relating to a Grant which are not redeemed on the Final Redemption Date shall be forfeited and the Grantee shall have no claim whatsoever against the Group in respect of the Phantom Shares so forfeited.
Upon redemption, the Group shall pay to the Grantee an amount in cash equal to the Value of the Share on the relevant Redemption Date which is based on the volume-weighted average price of a Share of its share listed on the Singapore Exchange Securities Trading Limited (SGX-ST) over the five (5) immediately preceding Trading Days on the Redemption Date, provided always that the Group shall not pay, in respect of each redemption more than three times the Value of a Share or less than 80 per cent of the Value of the Share on the Grant Date of that Phantom Share which is the subject of redemption. Details of outstanding Phantom Shares granted and not redeemed are disclosed in Note 7.
(b) A SUBSIDIARY IN AUSTRALIA HAS PROVIDED SHARE-BASED COMPENSATION BENEFITS TO ITS DIRECTORS AND COMPANY SECRETARY
When the subsidiary issues share options for the provision of services received, an expense is recognised in the income statement for the cost of the options, with a corresponding increase recognised in equity in the share option reserve, over the vesting period of the options. Where the options issued vest immediately upon grant (and hence there is no vesting period), the expense and corresponding increase in equity are recognised immediately.

�������������������������������������������������������
��� ���
������������������
70NOTES TO THE FINANCIAL STATEMENTS
For the financial year ended 31 December 2008
�������������������������������������������������������
��� ���
������������������
2 summarY of significant accounting policies (cont’D)
2.26 SHARE-BASED PAYMENT TRANSACTIONS (CONT’D)
(b) A SUBSIDIARY IN AUSTRALIA HAS PROVIDED SHARE-BASED COMPENSATION BENEFITS TO ITS DIRECTORS AND COMPANY SECRETARY (CONT’D)
Cost is measured with reference to the fair value of the options issued at the date of grant. In valuing options, no account is taken of any performance conditions, other than conditions linked to the price of the share of the subsidiary (market conditions), if applicable. At each balance sheet date, the subsidiary revises its estimate of the number of options that are expected to become exercisable. The expense recognised each period takes into account the most recent estimate.
Upon the exercise of options, the balance of the share option reserve relating to those options is transferred to share capital.
The market value of shares issued to certain directors as a component of remuneration for no cash consideration is recognised as an expense, with a corresponding increase in equity when these directors become entitled to the shares.
2.27 EMPLOYEE BENEFITS
(a) DEFINED CONTRIBUTION PLAN The Group participates in the national pension schemes as defined by the laws of the countries in which it has operations. In
particular, the Singapore companies in the Group make contributions to the Central Provident Fund Scheme in Singapore, a defined contribution pension scheme. Contributions to national pension schemes are recognised as expenses in the same period as the employment that give rise to the contribution.
(b) EMPLOYEE LEAVE ENTITLEMENT Employee entitlements to annual leave are recognised when they accrue to employees. A provision is made for the estimated
liability for leave as a result of services rendered by employees up to balance sheet date.
(c) SEVERANCE BENEFITS The subsidiaries in Indonesia operate an unfunded, defined Severance Benefits Scheme (the Scheme) for their eligible
employees. The subsidiaries’ obligations under the Scheme, calculated using the Projected Unit Credit Method, are determined based on actuarial computations by independent actuaries, through which the amount of benefits that employees have earned in return for their services in the current and prior years is estimated. That benefit is discounted in order to determine its present value.
Actuarial gains and losses are recognised as income or expense over the expected average remaining working lives of eligible employees when the cumulative unrecognised actuarial gains or losses for the Scheme exceed 10% of the present value of the defined benefit obligation. Past service costs are recognised immediately to the extent that the benefits are already vested, and otherwise are amortised on a straight-line basis over the average period until the amended benefits become vested. The amount recognised in the balance sheet represents the present value of the defined benefit obligations adjusted for unrecognised actuarial gains and losses and unrecognised past service cost. Any asset resulting from this calculation is limited to the net total of any unrecognised actuarial losses and past service cost.
(d) TERMINATION BENEFITS Termination benefits payable in cases of termination of employment within the framework of a restructuring are recognised as
a liability and are expensed or charged against provision when there is a detailed formal plan for the termination and is without possibility of withdrawal.

�������������������������������������������������������
��� ���
�������������������������������������������������������������������������
��� ���
������������������
71NOTES TO THE FINANCIAL STATEMENTS
For the financial year ended 31 December 2008
2 summarY of significant accounting policies (cont’D)
2.28 LEASES
(a) WHERE THE GROUP IS THE LESSEE Leases where the lessor effectively retains substantially all the risks and benefits of ownership of the leased item are classified
as operating leases. Operating lease payments (net of any incentives received from the lessor) are recognised as an expense in the income statement on a straight-line basis over the lease term. Contingent rents are recognised as an expense in the income statement in the financial year in which they are incurred.
Profit or loss on sale and leaseback transactions which constitute operating leases are recognised immediately in the income statement when such sale and leaseback transactions are established at fair value. If the sale price is below fair value, any profit or loss shall be recognised immediately except that, if the loss is compensated for by future lease payments at below market price, it shall be deferred and amortised in proportion to the lease payments over the period for which the asset is expected to be used. If the sale price is above fair value, the excess over fair value shall be deferred and amortised over the period for which the asset is expected to be used.
(b) WHERE THE GROUP IS THE LESSOR Assets leased out under operating leases are included in property, plant and equipment, investment properties and properties
held for sale.
Rental income from operating leases (net of any incentives given to lessees) is recognised in the income statement on a straight-line basis over the lease term.
Initial direct costs incurred by the Group in negotiating and arranging an operating lease are added to the carrying amount of the leased asset and recognised as an expense in the income statement over the lease term on the same basis as the lease income.
Contingent rents are recognised as income in the income statement in the financial year in which they are earned.
(c) WHERE THE GROUP IS THE LESSOR FOR SUB-LEASE AGREEMENT Rental income from operating leases (net of any incentives given to lessees) is recognised in the income statement on a
straight-line-basis over the lease term.
Contingent rents are recognised as income in the income statement in the financial year in which they are earned.
2.29 INCOME RECOGNITION
Revenue is recognised to the extent that it is probable that the economic benefits will flow to the Group and the revenue can be reliably measured.
Interest income is recognised as interest accrues (using the effective interest method) unless collectibility is in doubt.
Revenue from sale and delivery of refined tin metal and by-products is recognised upon transfer of significant risks and rewards of ownership to the buyer. Revenue is not recognised to the extent where there is significant uncertainties regarding recovery of the consideration due, associated costs or the possible return of goods.
Revenue from tin warrant and other charges are recognised upon performance of services.
Rental and room income as well as management fee are recognised on an accrual basis.
Food and beverage income is recognised upon sale.

�������������������������������������������������������
��� ���
������������������
72NOTES TO THE FINANCIAL STATEMENTS
For the financial year ended 31 December 2008
�������������������������������������������������������
��� ���
������������������
2 summarY of significant accounting policies (cont’D)
2.29 INCOME RECOGNITION (CONT’D)
Profits from sale of completed properties and marketable securities are recognised upon conclusion of the contract for sale. Profits from sale of investment properties under development are recognised on completion, upon the issue of Temporary Occupation Permit or Certificate of Statutory Completion, whichever is relevant.
Dividend income from investments is recognised when the Group’s right to receive payment is established.
2.30 INCOME TAXES
(a) CURRENT TAX Current tax assets and liabilities are measured at the amount expected to be recovered from or paid to the taxation authorities.
The tax rates and tax laws used to compute the amount are those that are enacted or substantively enacted by the balance sheet date.
(b) DEFERRED TAX Deferred income tax is provided using the liability method on temporary differences at the balance sheet date between the tax
bases of assets and liabilities and their carrying amounts for financial reporting purposes.
Deferred tax liabilities are recognised for all temporary differences, except :
• Wherethedeferredtaxarisesfromtheinitialrecognitionofanassetorliabilityinatransactionthatisnotabusinesscombination and, at the time of the transaction, affects neither the accounting profit nor taxable profit or loss; and
• In respect of temporary differences associated with investments in subsidiaries, associates and interests in jointventures, where the timing of the reversal of the temporary differences can be controlled by the Group and it is probable that the temporary differences will not reverse in the foreseeable future.
Deferred income tax assets are recognised for all deductible temporary differences (other than those mentioned above), carry-forward of unused tax credits and unused tax losses, to the extent that it is probable that taxable profit will be available against which the deductible temporary differences and the carry-forward of unused tax credits and unused tax losses can be utilised.
The carrying amount of deferred income tax assets is reviewed at each balance sheet date and reduced to the extent that it is no longer probable that sufficient taxable profit will be available to allow all or part of the deferred income tax asset to be utilised. Unrecognised deferred income tax assets are reassessed at each balance sheet date and are recognised to the extent that it has become probable that future taxable profit will allow the deferred tax asset to be recovered.
Deferred income tax assets and liabilities are measured at the tax rates that are expected to apply to the year when the asset is realised or the liability is settled, based on tax rates (and tax laws) that have been enacted or substantively enacted at the balance sheet date.
Income tax relating to items recognised directly in equity is recognised directly in equity.
Deferred tax assets and deferred tax liabilities are offset if a legally enforceable right exists to set off current tax assets against current tax liabilities and the deferred taxes relate to the same taxable entity and the same taxation authority.

�������������������������������������������������������
��� ���
�������������������������������������������������������������������������
��� ���
������������������
73NOTES TO THE FINANCIAL STATEMENTS
For the financial year ended 31 December 2008
2 summarY of significant accounting policies (cont’D)
2.30 INCOME TAXES (CONT’D)
(c) GOODS AND SERVICES TAX Revenues, expenses and assets are recognised net of the amount of goods and services tax except :
• Wherethegoodsandservicestaxincurredonapurchaseofassetsorservicesisnotrecoverablefromthetaxationauthority, in which case the goods and services tax is recognised as part of the cost of acquisition of the asset or as part of the expense item as applicable; and
• Receivablesandpayablesthatarestatedwiththeamountofgoodsandservicestaxincluded.
The net amount of goods and services tax recoverable from, or payable to, the taxation authority is included as part of receivables or payables in the balance sheet.
2.31 DERIVATIVE FINANCIAL INSTRUMENTS AND HEDGING
The Group uses derivative financial instruments such as forward currency contracts, forward tin sales contracts, interest rate swaps and interest rate cap agreements to hedge its risks associated with foreign currency, tin price and interest rate fluctuations. It is not the Group’s policy to trade in derivative financial instruments. Details of the Group’s financial risk management objectives and policies are set out separately in note 40 to the financial statements.
These derivative financial instruments are initially recognised at fair value on the date on which the derivative contract is entered into and are subsequently remeasured at fair value. Such derivative financial instruments are carried as assets when the fair value is positive and as liabilities when the fair value is negative. Any gain or loss arising from the changes in fair value on derivative financial instruments that do not qualify for hedge accounting are taken directly to the income statement.
The fair value of forward currency and forward tin sales contracts are calculated by reference to current forward exchange rates and forward tin price respectively for contracts with similar maturity profiles. The fair value of interest rate swap contracts and interest rate cap agreements is determined by reference to market values for similar instruments.
Hedges which qualify for hedge accounting are accounted for as follows :
(a) FAIR VALUE HEDGES Fair value hedges are hedges of the Group’s exposure to changes in fair value of a recognised asset or liability or an unrecognised
firm commitment, or an identified portion of such an asset, liability or firm commitment, that is attributable to a particular risk and could affect profit or loss. For fair value hedges, the carrying amount of the hedged item is adjusted for gains and losses attributable to the risk being hedged, the derivative is remeasured at fair value and gains and losses from both are taken to the income statement.
The Group discontinues fair value hedge accounting if the hedging instrument expires or is sold, terminated or exercised, the hedge no longer qualifies for hedge accounting or the Group revokes the designation.
(b) CASH FLOW HEDGES Cash flow hedges are hedges of the Group’s exposure to variability in cash flows that is attributable to a particular risk
associated with a recognised asset or liability or a highly probable forecast transaction and could affect profit or loss. The portion of the gain or loss on the hedging instrument that is determined to be an effective hedge is recognised directly in equity, while the ineffective portion is recognised in the income statement.
Amounts taken to equity are transferred to the income statement when the hedged transaction affects profit or loss such as when hedged financial income or financial expense is recognised or when a forecast sale or purchase occurs. When the hedged item is the cost of a non-financial asset or liability, the amounts taken to equity are transferred to the initial carrying amount of the non-financial asset or liability.

�������������������������������������������������������
��� ���
������������������
74NOTES TO THE FINANCIAL STATEMENTS
For the financial year ended 31 December 2008
�������������������������������������������������������
��� ���
������������������
2 summarY of significant accounting policies (cont’D)
2.31 DERIVATIVE FINANCIAL INSTRUMENTS AND HEDGING (CONT’D)
(b) CASH FLOW HEDGES (CONT’D) If the forecast transaction is no longer expected to occur, amounts previously recognised in equity are transferred to the income
statement. If the hedging instrument expires or is sold, terminated or exercised, or if its designation as a hedge is revoked, amounts previously recognised in equity shall remain in equity until the forecast transaction occurs or is no longer expected to occur.
(c) HEDGES OF A NET INVESTMENT Hedges of a net investment in a foreign operation, including a hedge of a monetary item that is accounted for as part of the net
investment, are accounted for in a way similar to cash flow hedges. On disposal of the foreign operation, the cumulative gain or loss previously recognised in equity is recognised in income statement.
2.32 FINANCIAL GUARANTEES
A financial guarantee contract is a contract that requires the issuer to make specified payments to reimburse the holder for a loss it incurs because a specified debtor fails to make payment when due in accordance with the original or modified terms of a debt instrument.
Financial guarantees are initially recognised at fair value. Subsequent to initial measurement, the financial guarantees are stated at the higher of the initial fair value less cumulative amortisation and the amount that would be recognised if they were accounted for as contingent liabilities. The amortisation of the financial guarantee contracts to the Company’s income statement is based on the period of the guarantee.
2.33 DERECOGNITION OF FINANCIAL ASSETS AND LIABILITIES
(a) FINANCIAL ASSETS A financial asset (or, where applicable a part of a financial asset or part of a group of similar financial assets) is derecognised
where :
• Thecontractualrightstoreceivecashflowsfromtheassethaveexpired;• TheGroupretainsthecontractualrightstoreceivecashflowsfromtheasset,buthasassumedanobligationtopay
them in full without material delay to a third party under a ‘pass-through’ arrangement; or• TheGrouphastransferreditsrightstoreceivecashflowsfromtheassetandeither(i)hastransferredsubstantiallyall
the risks and rewards of the asset, or (ii) has neither transferred nor retained substantially all the risks and rewards of the asset, but has transferred control of the asset.
Where the Group has transferred its rights to receive cash flows from an asset and has neither transferred nor retained substantially all the risks and rewards of the asset nor transferred control of the asset, the asset is recognised to the extent of the Group’s continuing involvement in the asset. Continuing involvement that takes the form of a guarantee over the transferred asset is measured at the lower of the original carrying amount of the asset and the maximum amount of consideration that the Group could be required to repay. Where continuing involvement takes the form of a written and/or purchased option on the transferred asset, the extent of the Group’s continuing involvement is the amount of the transferred asset that the Group may repurchase, except that in the case of a written put option on an asset measured at fair value, the extent of the Group’s continuing involvement is limited to the lower of the fair value of the transferred asset and the option exercise price.
On derecognition of a financial asset in its entirety, the difference between the carrying amount and the sum of (i) the consideration received (including any new asset obtained less any new liability assumed) and (ii) any cumulative gain or loss that has been recognised directly in equity is recognised in the income statement.

�������������������������������������������������������
��� ���
�������������������������������������������������������������������������
��� ���
������������������
75NOTES TO THE FINANCIAL STATEMENTS
For the financial year ended 31 December 2008
2 summarY of significant accounting policies (cont’D)
2.33 DERECOGNITION OF FINANCIAL ASSETS AND LIABILITIES (CONT’D)
(b) FINANCIAL LIABILITIES A financial liability is derecognised when the obligation under the liability is discharged or cancelled or expired.
Where an existing financial liability is replaced by another from the same lender on substantially different terms, or the terms of an existing liability are substantially modified, such an exchange or modification is treated as a derecognition of the original liability and the recognition of a new liability, and the difference in the respective carrying amounts is recognised in the income statement.
2.34 SEGMENT REPORTING
The Group’s operating businesses are organised and managed in separate strategic business units according to the nature of products and services provided.
Revenues attributable to geographic areas are based on the location for which the revenue is earned or the business is transacted. Geographical segment assets are based on the location or operation of the Group’s assets.
Segment accounting policies are the same as the policies described above. Inter-segment sales and transfers are determined on an arm’s length basis.
3 DiviDenD income
Group2008 2007
$’000 $’000Dividend from :- Available-for-sale investment securities 7,754 10,145- Held-for-trading marketable securities 1,202 2,582
8,956 12,727
4 interest income
Group2008 2007
$’000 $’000Interest income from :Held-for-trading marketable securities 80 80Deposits 5,120 8,838Tin sales 3,295 583Others 1 4
8,496 9,505

�������������������������������������������������������
��� ���
������������������
76NOTES TO THE FINANCIAL STATEMENTS
For the financial year ended 31 December 2008
�������������������������������������������������������
��� ���
������������������
5 other (loss)/income
Group2008 2007
$’000 $’000
Amortisation of deferred income 3,625 3,625Share of loss from tin business in Indonesia (3,080) (1,062)Other operating income 1,264 829Fair value changes of financial assets :- Held-for-trading marketable securities (16,547) 17,519- Held-for-trading derivatives - (140)- Ineffective portion of derivatives designated as hedging instruments in cash flow hedge 1,524 (1,053)
(13,214) 19,718
6 exceptional anD impairment items
(a) Exceptional Gains, net
Group2008 2007
$’000 $’000
Net surplus on disposal of investment securities 75,066 29,247Impairment of investment securities (649) (972)Net fair value changes of investment properties (12,458) 383,586Write back of development cost provision 992 -Net gain on disposal of properties 3,909 2,159Net tax refund from prior years’ assessments - 6,008Net gain on dilution of a subsidiary 73 -Revaluation deficit of hotel property (1,040) -Impairment of investment in an associate (note 17) (14,530) -
51,363 420,028
(b) Impairment Loss
Group2008 2007
$’000 $’000
Impairment of goodwill (note 15) 697 -Impairment of plant and equipment (note 13) 726 -
1,423 -

�������������������������������������������������������
��� ���
�������������������������������������������������������������������������
��� ���
������������������
77NOTES TO THE FINANCIAL STATEMENTS
For the financial year ended 31 December 2008
7 emploYee benefits expense
Group2008 2007
$’000 $’000
Wages, salaries and other allowances 83,104 82,189Severance benefit (note 34) 1,705 2,393Defined contribution plans 2,819 2,897Share-based payments 1,494 458Total 89,122 87,937
Phantom Share Plan (PSP)
Under the PSP, the share-based payments are calculated by dividing the Non-Cash Bonus with the Value of a Share which is measured initially at fair value at the Grant Date and remeasured at each reporting date, taking into account the terms and conditions upon which the Phantom Shares were granted. Phantom Shares can only be settled in cash. No Shares will be allotted and issued and participants of the plan are not entitled to, and have no voting rights or interest in the Shares of the Company. The contractual life of the Phantom Shares is 3 years.
If the Phantom Shares which a Grantee is entitled to redeem on a Redemption Date is not redeemed, such Phantom Shares which
are not redeemed shall be carried forward and added to the number of Phantom Shares redeemable on the next Redemption Date. Any Phantom Shares relating to a Grant which are not redeemed on the Final Redemption Date shall be forfeited and the Grantee shall have no claim whatsoever against the Group in respect of the Phantom Shares so forfeited.
The number of Phantom Shares granted is as follows :
Grant DateBalance at 1.1.2008/
Date of Grant
No of Phantom Shares
RedeemedBalance at 31.12.2008
Redemption Price/Fair Value Redemption Date
4.7.2007 150,000 (150,000) Nil $6.70 4.3.200815.7.2008 50,000 - 50,000 $4.64 15.7.2009*15.7.2008 50,000 - 50,000 $4.64 15.7.2010*15.7.2008 50,000 - 50,000 $4.64 15.7.2011*
* Final redemption date 15.7.2011
150,000 Phantom Shares granted on 4 July 2007 were fully redeemed in 2008 at $6.70 per share in accordance to the terms and conditions of the PSP where the Phantom Shares were eligible for redemption when the take-over offer by The Cairns Private Limited was declared unconditional on 4 March 2008.
Share-based payments expense recognised in the income statement comprise :
(a) Under the PSP of $1,244,000 (2007 : $458,000). The carrying amount of liability recognised in the Group’s balance sheet relating to such Phantom Shares at 31 December 2008 is $653,000 (2007 : $458,000).
(b) Equity-settled share options of $250,000 (2007 : Nil) granted by a partly-owned subsidiary to its directors and company secretary (note 30(f)).
The assessed fair value at grant date of options granted during the 12 months ended 31 December 2008 was A$0.00584 per option. The fair value at grant date is independently determined using a modified Binomial option pricing model. The modified Binomial model is adjusted for the inability to exercise the options prior to vesting and the ability to exercise the options after vesting.

�������������������������������������������������������
��� ���
������������������
78NOTES TO THE FINANCIAL STATEMENTS
For the financial year ended 31 December 2008
�������������������������������������������������������
��� ���
������������������
7 emploYee benefits expense (cont’D)
The model inputs for options granted during the year ended 31 December 2008 included :
(i) options are granted for no consideration, have a five-year life, and 50% of each tranche vests and is exercisable after each of the first two anniversaries of the date of grant.
(ii) exercise price : A$0.03(iii) grant date : 28 November 2008(iv) expiry date : 31 December 2013(v) share price at grant date : A$0.011(vi) expected price volatility of the company’s shares : 50% to 100%(vii) expected dividend yield : 0%(viii) risk-free interest rate : 6.5%
8 finance costs
Group2008 2007
$’000 $’000
Interest on bank loans 12,958 7,532Interest cost from interest rate swap 167 -Fees incurred for credit facilities 243 -
13,368 7,532
During the year, interest cost of $252,000 (2007 : Nil) relating to redevelopment property was capitalised.
9 other expenses
Group2008 2007
$’000 $’000
Costs of properties sold and incidental cost 5,951 11,319Upkeep and maintenance expenses of properties 15,619 15,696Accommodation, food and beverage expenses 28,972 30,510Operating lease expenses 46,791 46,834Properties’ related taxes 7,061 4,780Marketing and distribution expenses 9,034 14,690Administrative expenses 17,643 15,090Deferred exploration and evaluation expenditure written off (note 15(b)(ii)) 288 586Impairment/(Reversal) of doubtful receivables 169 (4,025)Bad debt directly written off 19 15Exchange losses 13,287 1,987Other expenses 5,956 5,929
150,790 143,411

�������������������������������������������������������
��� ���
�������������������������������������������������������������������������
��� ���
������������������
79NOTES TO THE FINANCIAL STATEMENTS
For the financial year ended 31 December 2008
10 profit before tax from continuing operations
Profit before tax from continuing operations is stated after charging/(crediting) the following :
Group2008 2007
$’000 $’000Non-audit fees paid to- Auditors of the Company 383 377- Other auditors 432 417Loss/(Gain) on disposal of property, plant and equipment 17 (55)Property, plant and equipment written off 221 372
11 income tax expense
(a) Major components of income tax expense
The major components of income tax expense for the years ended 31 December 2008 and 2007 are :
Group2008 2007
$’000 $’000(i) Income statement : Current income tax
Current income taxation 12,734 37,305 Overprovision in respect of prior years (1,841) (963) Benefits from previously unrecognised tax losses (12) (2,012)
10,881 34,330
Deferred income tax
Movement in temporary differences 10,321 13,939 Reduction in tax rate - (1,685) Under/(Over)provision in respect of prior years 303 (7,015) Deferred tax recognised on prior years’ tax losses (1,410) -
9,214 5,239
Income tax expense recognised in the income statement 20,095 39,569
(ii) Statement of changes in equity :
Deferred income tax related to items charged/(credited) directly to equity
Net change in revaluation surplus of property, plant and equipment 11,934 - Net change in AFS reserve for available-for-sale investment securities (6,289) 2,219
Net change in hedging reserve for derivatives designated as hedging instruments in cash flow hedges (18) 496
Reduction in tax rate - (404) Income tax expense recognised in equity 5,627 2,311

�������������������������������������������������������
��� ���
������������������
80NOTES TO THE FINANCIAL STATEMENTS
For the financial year ended 31 December 2008
�������������������������������������������������������
��� ���
������������������
11 income tax expense (cont’D)
(b) Relationship between tax expense and accounting profit
A reconciliation between tax expense and the product of accounting profit multiplied by the applicable statutory tax rate for the years ended 31 December 2008 and 2007 is as follows :
Group2008 2007
$’000 $’000
Profit before tax from Continuing Operations 73,915 536,805Less: Share of loss/(profit) from equity-accounted associates * 4,356 (530) Share of profit from equity-accounted joint ventures * (77) (102) Net tax refund from prior years’ assessments - (6,008)
78,194 530,165
Tax at statutory rate of 18% (2007 : 18%) 14,075 95,430Effect of different tax rates in other countries 27 8,713Overprovision in respect of prior years (1,841) (963)Under/(Over)provision of deferred tax in respect of prior years 303 (7,015)Deferred tax asset recognised on prior years’ tax losses (1,410) -Expenses/Losses not claimable 27,910 8,489Income not subject to tax (19,567) (61,482)Effect of reduction in tax rate - (1,685)Deferred tax asset not recognised 602 466Utilisation of previously unrecognised tax losses (12) (2,012)Others 8 (372)
20,095 39,569
* These are presented net of tax in the income statement.
A subsidiary has transferred its current year unabsorbed trade losses to be deducted against the assessable income of the Company and another subsidiary belonging to the same group as defined under the loss transfer system of group relief.
12 earnings per share (cents)
The calculations of basic and diluted earnings per share are based on the profit attributable to equity holders of the Company, net of tax of $57,608,000 (2007 : $484,957,000) and on 325,897,000 ordinary shares in issue.
There is no potential dilutive shares of the Company.

�������������������������������������������������������
��� ���
�������������������������������������������������������������������������
��� ���
������������������
81NOTES TO THE FINANCIAL STATEMENTS
For the financial year ended 31 December 2008
13 propertY, plant anD equipment
FreeholdLand
LeaseholdLand Buildings
PlantEquipment
VehiclesFurniture
FreeholdProperties
UnderDevelopment
CapitalWork-In-Progress Total
$’000 $’000 $’000 $’000 $’000 $’000 $’000GROUP At valuationat cost or valuationAt 1 January 2008 11,645 54,629 117,551 212,759 2,360 11,395 410,339Additions 20,765 - 13,623 18,585 149 12,183 65,305Disposals - - (31) (2,391) - - (2,422)Transfer - - 236 17,327 - (17,563) -Reclassified to investment properties (note 14) - - - - (2,509) - (2,509)
Revaluation surplus, net 35,606 43,917 1,484 - - - 81,007Elimination of accumulated depreciation on revaluation - (3,566) (37,139) - - - (40,705)
Exchange adjustment (6,257) (23) (12,560) (14,184) - (2,300) (35,324)At 31 December 2008 61,759 94,957 83,164 232,096 - 3,715 475,691
accumulated depreciation
and impairmentAt 1 January 2008 - 2,936 37,318 163,833 - - 204,087Charge for the year - 640 3,321 12,947 - - 16,908Impairment charge (c) - - - 404 - 322 726Charge to inventories - - - 113 - - 113Disposals - - (31) (2,082) - - (2,113)Elimination of accumulated depreciation on revaluation - (3,566) (37,139) - - - (40,705)
Exchange adjustment - (10) (3,469) (10,012) - - (13,491)At 31 December 2008 - - - 165,203 - 322 165,525
net carrying amount
at 31 December 2008 61,759 94,957 83,164 66,893 - 3,393 310,166

�������������������������������������������������������
��� ���
������������������
82NOTES TO THE FINANCIAL STATEMENTS
For the financial year ended 31 December 2008
�������������������������������������������������������
��� ���
������������������
13 propertY, plant anD equipment (cont’D)
Plant FreeholdEquipment Properties Capital
Freehold Leasehold Vehicles Under Work-In-Land Land Buildings Furniture Development Progress Total
$’000 $’000 $’000 $’000 $’000 $’000 $’000GROUP At valuationat cost or valuationAt 1 January 2007 11,333 54,614 114,378 213,899 11,629 2,112 407,965Additions 46 18 865 7,645 1,678 9,883 20,135Disposals - (4) - (4,977) - - (4,981)Acquisition of a subsidiary (note 16(b)) - - - - - 2,279 2,279
Transfer - 20 461 564 - (2,546) (1,501)*Reclassified to investment properties (note 14) - - - - (10,947) - (10,947)
Exchange adjustment 266 (19) 1,847 (4,372) - (333) (2,611)At 31 December 2007 11,645 54,629 117,551 212,759 2,360 11,395 410,339
accumulated depreciation and impairmentAt 1 January 2007 - 2,270 33,849 160,282 - - 196,401Charge for the year - 669 2,916 11,766 - - 15,351Disposals - (1) - (4,492) - - (4,493)Exchange adjustment - (2) 553 (3,723) - - (3,172)At 31 December 2007 - 2,936 37,318 163,833 - - 204,087
net carrying amount
at 31 December 2007 11,645 51,693 80,233 48,926 2,360 11,395 206,252
* Reclassified to inventories.

�������������������������������������������������������
��� ���
�������������������������������������������������������������������������
��� ���
������������������
83NOTES TO THE FINANCIAL STATEMENTS
For the financial year ended 31 December 2008
13 propertY, plant anD equipment (cont’D)
Building
Plant Equipment
Vehicles Furniture Total
$’000 $’000 $’000At valuation
COMPANYat cost or valuationAt 1 January 2008 11 374 385Additions - 2 2Revaluation surplus 172 - 172Elimination of accumulated depreciation on revaluation (9) - (9)Exchange adjustment - (18) (18)At 31 December 2008 174 358 532
accumulated depreciationAt 1 January 2008 9 212 221Charge for the year - 36 36Elimination of accumulated depreciation on revaluation (9) - (9)Exchange adjustment - (11) (11)At 31 December 2008 - 237 237
net carrying amount
at 31 December 2008 174 121 295
COMPANYat cost At 1 January 2007 11 326 337Additions - 94 94Disposals - (45) (45)Exchange adjustment - (1) (1)At 31 December 2007 11 374 385
accumulated depreciationAt 1 January 2007 9 223 232Charge for the year - 34 34Disposals - (45) (45)Exchange adjustment - - -At 31 December 2007 9 212 221
net carrying amount
At 31 December 2007 2 162 164
(a) Land and buildings are stated at fair value, which has been determined based on valuations at or approximate the balance sheet date. Valuations are performed by accredited independent valuer with recent experience in the location and category of the properties being valued. The valuations are based on the following methods considering the nature of the property and/or the lack of comparable data :
(i) The comparison method that considers the sales of similar properties that have been transacted in the open market with adjustments made for differences in factors that affect value.

�������������������������������������������������������
��� ���
������������������
84NOTES TO THE FINANCIAL STATEMENTS
For the financial year ended 31 December 2008
�������������������������������������������������������
��� ���
������������������
13 propertY, plant anD equipment (cont’D)
(ii) The depreciated replacement cost method that is based on an estimate of the current market value of the land, plus the current gross replacement of improvements, less allowances for physical deterioration, obsolescence and optimisation.
(iii) The discounted cash flow method that projects occupancy, average room rate and indicative cashflow, based on knowledge and understanding of the market and experience of the operating performance of properties of similar type and standard.
At 31 December 2007, the gross carrying amount at Group based on Directors’ valuation on or before 1974 was $36,000.
(b) If the land and buildings stated at valuation were included in the financial statements at cost less accumulated depreciation, their net book values would be :
Group Company2008 2008
$’000 $’000
Freehold land 26,153 -Leasehold land 51,040 -Buildings 81,680 2
The Group adopted the valuation model on 31 December 2008 on a prospective basis. As such, comparative figures have not been shown.
(c) The impairment charge was related to the write down of plant and equipment in resource operation.
(d) Details of properties included in Property, plant and equipment as at 31 December 2008 are as follows :
Description of Properties Tenure
UnexpiredLease Term
(year)Existing
UseProfessional
ValuersValuation
Method
singaporeRendezvous Hotel with 298 rooms at No. 9 Bras Basah Road
Leasehold 84 Hotel DTZ Debenham Tie Leung (SEA)
Pte Ltd
Comparison method
australiaRendezvous Observation City Hotel, Perth with 333 rooms at No. 148 The Esplanade, Scarborough, WA 6019
Freehold Hotel Jones Lang LaSalle Hotels
(NSW) Pty Limited
Discounted cash flow
method
The Marque Hotel, Perth with 103 rooms at 24 Mount Street, Perth, WA 6000
Freehold Hotel SG&R Singapore
Pte Ltd
Discounted cash flow
method
No. 255 Ann Street, Anzac Square, Brisbane, QLD 4000 :
(i) Restaurant at Lot 1 Freehold Retail #
(ii) Manager unit at Lot 7 Freehold Residential #

�������������������������������������������������������
��� ���
�������������������������������������������������������������������������
��� ���
������������������
85NOTES TO THE FINANCIAL STATEMENTS
For the financial year ended 31 December 2008
13 propertY, plant anD equipment (cont’D)
(d) Details of properties included in Property, plant and equipment as at 31 December 2008 are as follows (cont’d) :
Description of Properties Tenure
UnexpiredLease Term
(year)Existing
UseProfessional
ValuersValuation
Method
Restaurant at Lot 177, Lullfitz Drive, Cable Beach, Broome, WA 6726
Freehold Retail #
Central facilities at Lot 145 and 146 Port Douglas Road, QLD 4877
Freehold Retail and office
#
Land at Lot 1, Marlborough Road, Mount Gardiner, QLD 4705
Freehold Storage yard #
malaysiaWavertree Bungalow at Jalan Lady Maxwell, 49000 Bukit Fraser, Pahang
Leasehold 15 Holiday bungalow
C H Williams Talhar & Wong
Sdn Bhd
Comparison method
No. 27 Jalan Pantai, 12000 Butterworth :(i) Offices and factory buildings at Lot 142 –
187 and 362Freehold Office and
factoryKnight Frank
(Ooi & Zaharin Sdn Bhd)
Depreciated replacement cost method
(ii) Carpark shed at Lot 268 Leasehold 20 Carpark shed Knight Frank(Ooi & Zaharin
Sdn Bhd)
Depreciated replacement cost method
(iii) Seabed leases with main wharf at Lot 263
Leasehold 58 Main wharf Knight Frank(Ooi & Zaharin
Sdn Bhd)
Depreciated replacement cost method
Offices at unit No. B-15-6, B-15-7, B-15-11, Megan Avenue II, 12 Jalan Yap Kwan Seng, 50450 Kuala Lumpur
Freehold Office Knight Frank(Ooi & Zaharin
Sdn Bhd)
Comparison method
80 units of flats at Taman Desa Palma, Alma, 14000 Bukit Mertajam
Freehold Residential Knight Frank(Ooi & Zaharin
Sdn Bhd)
Comparison method
Land at Lot 1203, Mukim 12, Daerah Seberang Perai Tengah
Freehold Agricultural Knight Frank(Ooi & Zaharin
Sdn Bhd)
Comparison method
Mukim Belukar Semang and Mukim Pengkalan Hulu, Daerah Hulu Perak :
(i) Land and buildings at Lot 344 and 348 Freehold Dam and residential
Knight Frank(Ooi & Zaharin
Sdn Bhd)
Depreciated replacement cost method
(ii) Land at Lot 1886 Freehold Agricultural Knight Frank(Ooi & Zaharin
Sdn Bhd)
Depreciated replacement cost method
(iii) Land and buildings at Lot 1868, 2071, 2163, 879, 880, PT3375*
Leasehold up to 54 Dam, residential and power station
Knight Frank(Ooi & Zaharin
Sdn Bhd)
Depreciated replacement cost method

�������������������������������������������������������
��� ���
������������������
86NOTES TO THE FINANCIAL STATEMENTS
For the financial year ended 31 December 2008
�������������������������������������������������������
��� ���
������������������
13 propertY, plant anD equipment (cont’D)
(d) Details of properties included in Property, plant and equipment as at 31 December 2008 are as follows (cont’d) :
Description of Properties Tenure
UnexpiredLease Term
(year)Existing
UseProfessional
ValuersValuation
Method
indonesiaOffices, factory buildings and houses at Bangka Island
Mining lease 5 Office, factory and residential
PT Ujatek Baru
Depreciated replacement cost method
Land and buildings at Bangka Island Leasehold (land rights)
11 to 26 Office and warehouse
PT Ujatek Baru
Depreciated replacement cost method
# These are minor pieces of properties and no professional valuations are done.* Application for renewal of this lease had been submitted and awaiting for approval.
14 investment properties
Group Company2008 2007 2008 2007
$’000 $’000 $’000 $’000balance sheets :At fair value :Balance as at 1 January 821,132 416,353 108,005 76,575Reclassified from Property, plant and equipment (note 13) 2,509 10,947 - -Fair value changes recognised in the income statement (12,458) 383,586 105 31,935Additions :- Redevelopment expenditure 14,800 10,511 - -- Replacement of fittings and fixtures 46 229 - -Disposal during the year (7,498) - - -Reclassified to assets held for sale (note 24) (2,078) (662) (212) (662)Exchange adjustment (2,640) 168 (2,474) 157
813,813 821,132 105,424 108,005
Group2008 2007
$’000 $’000income statement :Rental income from investment properties :- Minimum lease payments 15,981 13,022- Contingent rent based on tenant’s turnover 19 11
16,000 13,033Direct operating expenses (including repairs and maintenance) arising from :- Rental generating properties (4,672) (4,151)- Non-rental generating properties (119) 128#
(4,791) (4,023)
# Due mainly to property tax refund for prior years.

�������������������������������������������������������
��� ���
�������������������������������������������������������������������������
��� ���
������������������
87NOTES TO THE FINANCIAL STATEMENTS
For the financial year ended 31 December 2008
14 investment properties (cont’D)
(a) Investment properties are stated at fair value. Valuation of significant investment properties has been determined based on valuations at the balance sheet date. Valuations are performed by accredited independent valuer with recent experience in the location and category of the properties being valued. The valuations are based on the comparison method that considers the sales of similar properties that have been transacted in the open market with adjustments made for differences in factors that affect value.
(b) During the year, the land and building to be erected on No. 9 Battery Road, Singapore, which are owned by the Company and a subsidiary are mortgaged to secure bank loans (note 32).
(c) Details of investment properties as at 31 December 2008 are as follows :
Description of Properties Tenure
UnexpiredLease Term
(year)Site Area
sq.m.
Net FloorArea
sq.m.Existing
UseProfessional
ValuersValuation
Method
singaporeGourmet Gallery, a 3-storey commercial building at No. 9 Bras Basah Road
Leasehold 84 610 1,826 Retail DTZ Debenham Tie Leung
(SEA) Pte Ltd
Comparison method
36 residential units and 1 shop unit at Gallop Gables condominium
Freehold - 9,680 Residential DTZ Debenham Tie Leung
(SEA) Pte Ltd
Comparison method
53 residential units at Gallop Green condominium
Freehold 13,309 17,633 Residential DTZ Debenham Tie Leung
(SEA) Pte Ltd
Comparison method
6A/6B/8/8A at Cable Road Freehold 5,972 3,307 (gross)
Residential DTZ Debenham Tie Leung
(SEA) Pte Ltd
Comparison method

�������������������������������������������������������
��� ���
������������������
88NOTES TO THE FINANCIAL STATEMENTS
For the financial year ended 31 December 2008
�������������������������������������������������������
��� ���
������������������
14 investment properties (cont’D)
(c) Details of investment properties as at 31 December 2008 are as follows (cont’d) :
Description of Properties Tenure
UnexpiredLease Term
(year)Site Area
sq.m.
Net FloorArea
sq.m.Existing
UseProfessional
ValuersValuation
Method
malaysiaStraits Trading Building, a 7-storey commercial building at No. 2 Lebuh Pasar Besar, Kuala Lumpur
999 years Leasehold /Freehold
874 and 876
2,224 9,996 Office Ravindra Dass
Property Services Sdn Bhd
Comparison method
5 contiguous units of double-storey pre-war terraced shophouses, No. 127, 129 and 131 Jalan Gopeng, Kampar, Perak
Freehold 1,115 1,473 Retail C H Williams Talhar &
Wong Sdn Bhd *
Comparison method
6 contiguous units of double-storey pre-war terraced shophouses and a parcel of commercial land, No. 1-3 Jalan Sultan Yusuf, Ipoh, Perak
Freehold 1,612 1,424 Retail C H Williams Talhar &
Wong Sdn Bhd *
Comparison method
7 contiguous parcels of terraced commercial plots and a parcel of commercial land, Lot Nos. 1669S to 1675S and 14491, Town of Ipoh, District of Kinta, Perak
Freehold 2,359 - Storage yard C H Williams Talhar &
Wong Sdn Bhd *
Comparison method
A parcel of residential land Lot No. 11260, Mukim of Hulu Kinta, District of Kinta, Perak
999 years Leasehold
886 11,255 - Residential C H Williams Talhar &
Wong Sdn Bhd *
Comparison method
2 contiguous units of double-storey pre-war terraced shophouses No. 24, Jalan High, Gopeng, Perak
Freehold 465 465 Retail C H Williams Talhar &
Wong Sdn Bhd *
Comparison method
A parcel of residential land, Lot No. 34612 Jalan Gopeng, Ipoh, Perak
999 years Leasehold
885 12,892 - Residential C H Williams Talhar &
Wong Sdn Bhd *
Comparison method
A double-storey pre-war terraced shophouse No. 105 Jalan Besar, Chemor, Perak
Freehold 223 85 Retail C H Williams Talhar &
Wong Sdn Bhd *
Comparison method

�������������������������������������������������������
��� ���
�������������������������������������������������������������������������
��� ���
������������������
89NOTES TO THE FINANCIAL STATEMENTS
For the financial year ended 31 December 2008
14 investment properties (cont’D)
(c) Details of investment properties as at 31 December 2008 are as follows : (cont’d)
Description of Properties Tenure
UnexpiredLease Term
(year)Site Area
sq.m.
Net FloorArea
sq.m.Existing
UseProfessional
ValuersValuation
Method
malaysia (cont’d)Commercial land with a few shophouses, Lot Nos. 1105 to 1110, 2122 and 2123 Town of Seremban, District of Seremban, Negeri Sembilan
Freehold 3,826 478 Retail C H Williams Talhar &
Wong Sdn Bhd *
Comparison method
Lot Nos. 197 and 199, Section 4 Town of Butterworth, Pulau Pinang
Freehold 7,949 - Retail C H Williams Talhar &
Wong Sdn Bhd
Comparison method
Lot Nos. 2569 and 2626, Section 4 Town of Butterworth, Pulau Pinang
Freehold 6,535 - Carpark C H Williams Talhar &
Wong Sdn Bhd
Comparison method
Lot Nos. 2499, 189, 190 and 270, Section 4 Town of Butterworth, Pulau Pinang; accommodating 6 residential units, a single-storey bungalow with 2 annex buildings, a single-storey club house and 1½ storey squash court and vacant plots
Freehold with two minor Leasehold
plots
18 and 22 37,200 3,185 Residential/ Retail/
Carpark
C H Williams Talhar &
Wong Sdn Bhd
Comparison method
Lot Nos. 195, 2502 and 2570, Section 4 Town of Butterworth, Pulau Pinang; accommodating a 3-storey club house with a guard house, three single-storey bungalows with/without annex building and vacant plots
Freehold 55,928 3,513 Office/ Residential/ Club house/
Storage yard/ Car
showroom
C H Williams Talhar &
Wong Sdn Bhd
Comparison method
8 units of 3-storey shophouses, No. 4819 to 4826 Jalan Pantai,
Taman Selat, Butterworth, Pulau Pinang
Freehold 1,322 2,883 Commercial C H Williams Talhar &
Wong Sdn Bhd *
Comparison method
* Based on valuations done at 31 December 2007 as there were no material changes in value between the last valuations and 31 December 2008.

�������������������������������������������������������
��� ���
������������������
90NOTES TO THE FINANCIAL STATEMENTS
For the financial year ended 31 December 2008
�������������������������������������������������������
��� ���
������������������
14 investment properties (cont’D)
Investment properties undergoing development as at 31 December 2008 are as follows :
Descriptionof Properties Tenure
UnexpiredLease Term
(year) Stage of
Completion
ExpectedDate of
Completion
Site Area /Gross Floor
Area sq.m.
Group’sEffectiveInterest
in PropertyProfessional
ValuersValuation
Method
(i) Straits Trading Building, a
28-storey commercial building at No. 9
Battery Road, Singapore
(redevelopment)
999 years Leasehold
816 to 853 Super-structure works in progress
4th Quarter 2009
1,340 / 18,565
100% DTZ Debenham Tie Leung
(SEA) Pte Ltd
Comparison method
(ii) Residential development at Cable/Nathan
Road, Singapore (new development)
Freehold Phase development
in progress
2011 9,141 / 4,577
(estimated)
100% DTZ Debenham Tie Leung
(SEA) Pte Ltd
Comparison method
15 gooDwill/other intangible assets
(a) Goodwill arising on consolidation
Group2008 2007
$’000 $’000At costAt 1 January 24,753 23,913On dilution of interest (107) -Goodwill arising from subscription of rights issue - 804Exchange adjustment (1,243) 36At 31 December 23,403 24,753
Accumulated impairment chargeAt 1 January 664 664Impairment charge (note 6(b)) 697 -Exchange adjustment (169) -At 31 December 1,192 664
Net Carrying Amount 22,211 24,089
Goodwill acquired through business combinations has been allocated to the Group’s ‘resources’ segment, being one of the Group’s cash-generating units for impairment testing.
The recoverable amount of the Australian tin exploration subsidiary is determined based on fair value less cost to sell. Fair value of the subsidiary listed on the Australian Stock Exchange Ltd is based on market bid prices traded in this active market. For goodwill impairment review, management also reviews other economic factors and market conditions to assess whether the recoverable amounts as determined using this method are sustainable. As a result of the goodwill impairment review to determine whether there was an impairment in the carrying amount of goodwill, an impairment loss of $697,000 related to the Australian tin exploration subsidiary in the ‘resources’ segment was recognised as a charge to the income statement.

�������������������������������������������������������
��� ���
�������������������������������������������������������������������������
��� ���
������������������
91NOTES TO THE FINANCIAL STATEMENTS
For the financial year ended 31 December 2008
15 gooDwill/other intangible assets (cont’D)
(a) Goodwill arising on consolidation (cont’d)
The recoverable amount of the Malaysian resource subsidiary is determined based on value in use. In prior years, this was determined based on fair value less cost to sell. The 5-year cash flow projections are based on financial budgets approved by management. In light of the volatile and highly uncertain short and medium term market environments, for purpose of goodwill impairment testing, management has made conservative downward adjustment to the cash flow projections for year 2 and projected no growth from year 3 to year 5. Management has considered and determined the factors applied in these financial budgets, which include tin prices, exchange rates and fuel costs. The key assumptions made reflect past experience.The pre-tax discount rate applied to the cash flow projections at 6.15%, was based on the estimated weighted average cost of capital. There is no impairment in the carrying amount of goodwill arising from this review.
(b) Other intangible assets
Group2008 2007
$’000 $’000
(i) - Mining rights 1,164 2,462 - Management rights 467 788 - Corporate club membership 108 123
1,739 3,373
(ii) - Deferred exploration and evaluation expenditure 14,213 4,388 - Deferred mine development expenditure 12,312 4,575
26,525 8,963
28,264 12,336
(b) (i) Mining Rights, Management Rights and Corporate Club Membership
CorporateMining Management clubrights rights membership Total$’000 $’000 $’000 $’000
GROUPAt CostAt 1 January 2008 6,182 1,969 139 8,290Additions 79 - - 79Exchange adjustment (56) (413) (7) (476)At 31 December 2008 6,205 1,556 132 7,893
Accumulated amortisationAt 1 January 2008 3,720 1,181 16 4,917Charge for the year 1,302 186 9 1,497Exchange adjustment 19 (278) (1) (260)At 31 December 2008 5,041 1,089 24 6,154
net carrying amount 1,164 467 108 1,739

�������������������������������������������������������
��� ���
������������������
92NOTES TO THE FINANCIAL STATEMENTS
For the financial year ended 31 December 2008
�������������������������������������������������������
��� ���
������������������
15 gooDwill/other intangible assets (cont’D)
(b) (i) Mining Rights, Management Rights and Corporate Club Membership (cont’d)
CorporateMining Management clubrights rights membership Total$’000 $’000 $’000 $’000
At CostAt 1 January 2007 5,633 1,882 139 7,654Additions 871 - - 871Exchange adjustment (322) 87 - (235)At 31 December 2007 6,182 1,969 139 8,290
Accumulated amortisationAt 1 January 2007 2,557 942 7 3,506Charge for the year 1,353 195 9 1,557Exchange adjustment (190) 44 - (146)At 31 December 2007 3,720 1,181 16 4,917
Net Carrying Amount 2,462 788 123 3,373
(b) (ii) Deferred Exploration and Evaluation Expenditure and Deferred Mine Development Expenditure
Deferred exploration Deferred mine
and evaluation developmentexpenditure expenditure Total
$’000 $’000 $’000GROUPAt 1 January 2008 4,388 4,575 8,963Additions 10,980 10,635 21,615Written off to income statement (note 9) (288) - (288)Amortisation to income statement (16) (2,628) (2,644)Transfer to inventory (42) - (42)Exchange adjustment (809) (270) (1,079)at 31 December 2008 14,213 12,312 26,525
At 1 January 2007 2,190 4,018 6,208Additions 2,791 2,791 5,582Written off to income statement (note 9) (586) - (586)Amortisation to income statement (30) (2,082) (2,112)Transfer to security deposit (87) - (87)Exchange adjustment 110 (152) (42)At 31 December 2007 4,388 4,575 8,963
Note 15(b)(ii) represents exploration and evaluation as well as mine development expenditure for several areas of interest. The costs are carried forward to the extent that they are expected to be recouped through the successful development of the areas or activities of the areas which have not reached a stage that permit reasonable assessment of the existence of economically recoverable reserves.

�������������������������������������������������������
��� ���
�������������������������������������������������������������������������
��� ���
������������������
93NOTES TO THE FINANCIAL STATEMENTS
For the financial year ended 31 December 2008
15 gooDwill/other intangible assets (cont’D)
The remaining amortisation periods are as follows :
GroupNumber of years
2008 2007
Mining rights 1 to 5 2 to 5Management rights 1 to 9 2 to 10Corporate club membership 12 13Deferred exploration and evaluation expenditure 2 to 8 3 to 5Deferred mine development expenditure 1 to 5 2 to 3
16 investments in subsiDiaries
Company2008 2007
$’000 $’000
Quoted shares, at cost 25,966 25,402Unquoted shares, at cost 140,838 110,838
166,804 136,240Impairment losses (45,770) (15,770)
121,034 120,470
Details of subsidiaries are included in note 46.
During the year, the Company subscribed for additional shares issued by a subsidiary for cash consideration of $30,000,000.That subsidiary, in turn, subscribed for additional shares issued by its immediate subsidiary. The Company provides impairment loss of $30,000,000 on the investment in that subsidiary as the carrying amount exceeds the fair value based on the net asset value of that subsidiary.
On 28 November 2008, a subsidiary, Australia Oriental Minerals NL (AOM) issued 5,000,000 unquoted options to the Company, due 31 December 2013 and to be exercised at a price of A$0.03 each. The fair value of these options cannot be measured reliably and they are therefore carried at cost, that is nil.
Analysis of Acquisitions and Disposals of Subsidiaries and Minority Interests :
(a) acquisitions in 2008
(i) Net cash effect arising from the acquisition of Rendezvous India Hospitality Private Limited on 16 December 2008 by Rendezvous Hotels International Private Limited (RHI), a subsidiary of the Group, is nil. Rendezvous India Hospitality Private Limited was a newly incorporated company with capital of $3,000 before the acquisition by RHI.
(b) acquisitions and Disposals in 2007
Acquisitions and Incorporation of Subsidiaries
(i) On 5 March 2007, a subsidiary of the Group, PT MSC Indonesia, acquired 60% of the paid up capital of PT Tenaga Anugerah (PT TA), a company incorporated in Indonesia for a cash consideration of $182,000 (US$120,000).

�������������������������������������������������������
��� ���
������������������
94NOTES TO THE FINANCIAL STATEMENTS
For the financial year ended 31 December 2008
�������������������������������������������������������
��� ���
������������������
16 investments in subsiDiaries (cont’D)
(b) acquisitions and Disposals in 2007 (cont’d)
Acquisitions and Incorporation of Subsidiaries (cont’d)
The fair values of the identifiable assets and liabilities of PT TA as at the date of acquisition were :
Recognised onacquisition
Carrying amount before
combination$’000 $’000
Property, plant and equipment (note 13) 2,279 2,279Other payable (1,975) (1,975)
304 304
Net identifiable asset 304 304Minority interests (122)Total purchase consideration 182
Cash outflow on acquisition :Cash paid (182)Net cash and cash equivalents -Net cash outflow on acquisition (182)
(ii) PT SRM Indonesia was incorporated on 14 August 2007 by the Group.
(iii) Net cash effect arising from the acquisition of Straits Trading Private Limited on 13 November 2007 by Merevale Holdings Private Limited, a subsidiary of the Group, was nil.
17 investments in associates
Group Company2008 2007 2008 2007
$’000 $’000 $’000 $’000
Quoted shares, at cost 76,631 - - -Share of post-acquisition reserves (5,001) - - -Exchange adjustment (1,267) - - -
70,363 - - -Impairment loss (note 17.1) (14,530) - - -
55,833 - - -
Unquoted shares, at cost 16,740 6,919 3,585 3,585Share of post-acquisition reserves 5,493 4,863 - -Exchange adjustment (2,099) (266) - -
20,134 11,516 3,585 3,585
75,967 11,516 3,585 3,585
Market value of quoted shares 13,566 - - -
(a) Details of associates are included in note 46.

�������������������������������������������������������
��� ���
�������������������������������������������������������������������������
��� ���
������������������
95NOTES TO THE FINANCIAL STATEMENTS
For the financial year ended 31 December 2008
17 investments in associates (cont’D)
(b) (i) Malaysia Smelting Corporation Berhad (MSC), the Group’s listed subsidiary subscribed for 6,799,999 common shares of Asian Mineral Resources Limited (AMR) arising from the exercise of the 6,799,999 warrants at an exercise price of C$2.10 per Warrant for a total cash consideration of approximately $19.1 million (C$14.3 million). The Subscription was completed on 7 May 2008. The Group’s shareholding in AMR ncreased from approximately 12.8% in 2007 to approximately 18.4% of AMR’s enlarged issued and paid-up share capital.
(ii) On 1 July 2008, MSC and AOM entered into a share sale agreement with Taurus Capital Incorporated for the acquisition of 30% interest each in Asiatic Coal Pte Ltd (Asiatic Coal) for cash consideration of $16.3 million (US$13.5 million), shown as mining assets in note 23. The Group effective shareholding in Asiatic Coal is 36%.
The purchase consideration for the share sale was based on a valuation of US$15 per tonne for 1.5 million tonnes of coal resources for the entire existing equity interest in Asiatic Coal. In the event of discovery of measured and indicated coal resources, determined in accordance with the Code for Reporting of Mineral Resources and Ore Reserves of the Australian Joint Ore Reserves Committee, which exceeds a value of 1.5 million tonnes and up to a maximum of 10.0 million tonnes (Additional Resources), Asiatic Coal shall issue additional new ordinary shares in Asiatic Coal to Taurus Capital Incorporated, equivalent to the value of the Additional Resources (Additional New Shares). The partly-owned subsidiaries have the option of acquiring up to an aggregate of 60% of the Additional New Shares. On 1 November 2008, the Group subscribed 870,000 new ordinary shares, being 60% of the total new ordinary share issued by Asiatic Coal for a cash consideration of approximately $0.9 million (US$0.6 million).
(iii) On 12 February 2008, MSC entered into a conditional Subscription Agreement with Beaconsfield Gold NL (BCD), a company listed on the Australian Securities Exchange, to subscribe for 70,000,000 common shares representing approximately 18.9% of the enlarged issued and paid-up share capital of BCD for a total cash consideration of approximately $24.6 million (A$19.6 million). The subscription was completed on 3 March 2008. MSC also subscribed for 20,000,000 new ordinary shares amounting to approximately $3.8 million (A$3.0 million) in a renounceable rights issue in BCD. The subscriptions were completed on 2 September 2008. MSC’s direct shareholding in BCD increased from 18.9% to 22.5%.
(iv) On 28 October 2007, MSC entered into a Joint Venture Contract with Guangxi Guilin Jinwei Realty Co Ltd and Vertex Metals Incorporation to establish a joint venture company named Guilin Hinwei Tin Co. Ltd (Guilin Hinwei), for the smelting and refining of tin, and the production and sale of tin and tin-based products in the People’s Republic of China. In May 2008, MSC has contributed cash capital of approximately $7.3 million (RMB39.07 million), representing 35.3% registered capital of Guilin Hinwei.
(c) The summarised financial information of the associates, not adjusted for the proportion of ownership interest held by the Group, are as follows :
Group2008 2007
$’000 $’000Assets and liabilitiesTotal assets 194,776 44,247
Total liabilities (54,126) (14,240)
Net assets 140,650 30,007
ResultsRevenues 122,732 22,987
Net (loss)/profit for the year (25,305) 1,288

�������������������������������������������������������
��� ���
������������������
96NOTES TO THE FINANCIAL STATEMENTS
For the financial year ended 31 December 2008
�������������������������������������������������������
��� ���
������������������
17 investments in associates (cont’D)
17.1 Impairment Loss
Included herein is an impairment loss of $14.5 million (RM35.0 million) for investment in Asian Mineral Resources Limited provided by MSC.
The impairment loss was assessed based on discounted cash flow on the estimated quantity of recoverable reserves and resources of Nickel over six-year period. Key assumptions are as follows :
(i) RM/US$ exchange rate : 3.50
(ii) Discount rate : 14.50%
(iii) Nickel price : Year US$/tonne
2010 15,0002011 22,0002012 25,0002013 28,0002014 30,0002015 32,000
(iv) Commencement of commercial production : 1 July 2010
With other variable held constant, the sensitivity to impairment loss on change in key assumptions is estimated to be as follows :
increase/(Decrease)
Key assumptions changein impairment
lossRM’000
Nickel price + 1% (1,300)- 1% 1,300
Discount rate + 0.5% 1,800- 0.5% (1,800)
RM against US$ exchange rate + 1% (900)- 1% 900
Commencement of commercial productionDelay by 6
months 5,000

�������������������������������������������������������
��� ���
�������������������������������������������������������������������������
��� ���
������������������
97NOTES TO THE FINANCIAL STATEMENTS
For the financial year ended 31 December 2008
18 investments in Joint ventures
Group2008 2007
$’000 $’000
Unquoted share, at cost -* -*Share of post-acquisition reserves 383 306Exchange adjustment (70) 11
313 317
* Cost of investment of A$1.
(a) Details of joint ventures are included in note 46.
(b) The aggregate amounts of each of the non-current assets, current assets, non-current liabilities, current liabilities, income and expenses related to the joint venture, adjusted for the proportion of ownership interest held by the Group, are as follows :
Group
2008 2007$’000 $’000
Assets and liabilitiesNon-current assets 299 403Current assets 158 125Total assets 457 528
Non-current liabilities - (93)Current liabilities (144) (118)Total liabilities (144) (211)
Net assets 313 317
ResultsRevenues 993 1,043Expenses (882) (891)Income tax (34) (50)Net profit for the year 77 102
19 DeferreD tax assets anD liabilitiesGroup Company
2008 2007 2008 2007$’000 $’000 $’000 $’000
Deferred tax assets :Unutilised tax losses 1,796 160 - -Provisions 11,328 13,285 - -Difference in depreciation 51 (677) - -Fair value changes on available-for-sale investments 479 - - -Fair value changes on foreign currency forward contracts and forward sales contracts 959 832 - -
Exchange adjustment (371) (486) - -14,242 13,114 - -

�������������������������������������������������������
��� ���
������������������
98NOTES TO THE FINANCIAL STATEMENTS
For the financial year ended 31 December 2008
�������������������������������������������������������
��� ���
������������������
19 DeferreD tax assets anD liabilities (cont’D)Group Company
2008 2007 2008 2007$’000 $’000 $’000 $’000
Deferred tax liabilities :Unutilised tax losses (2,317) - - -Difference in depreciation 4,595 3,828 521 318Unremitted foreign income and profits 7,942 9,336 - -Fair value changes on available-for-sale investments 45 5,855 - -Fair value changes on foreign currency forward contracts and forward sales contracts 594 43 - -Fair value adjustments arising from a subsidiary acquired 66 101 - -Fair value changes and revaluation of properties 43,582 19,070 1,185 121Others 289 296 - -Exchange adjustment (50) 25 (24) 19
54,746 38,554 1,682 458
Deferred tax assets are recognised for tax losses of certain subsidiaries on the basis that taxable profits will be generated to utilise these tax losses. Management has determined the future taxable profits based on cash flow projections in the foreseeable future.
As at 31 December 2008, certain subsidiaries have unutilised tax losses amounting to $29,728,000 (2007 : $36,769,000) and capital
allowances amounting to $2,000 (2007 : $67,000) available for set off against future taxable income, subject to the provisions of the Income Tax Act and agreement by the relevant authorities, for which deferred tax assets have not been recognised. Included in these unutilised tax losses, $17,009,000 (2007 : $10,486,000) arose in Indonesia which may be carried forward for up to five years following the year in which the tax losses occurred.
20 traDe anD other receivables
Group Company2008 2007 2008 2007
$’000 $’000 $’000 $’000current :Trade receivables 81,618 94,162 139 324Amount due from associate - 1,137 - -Impairment of doubtful receivables (1,440) (1,389) - -
80,178 93,910 139 324
Other receivablesBalance receivable from sale of properties 6,077 - - -Deposits 1,727 3,923 82 86Non-trade receivables * 94,502 31,837 70 496Amounts due from subsidiaries - - 448,852 380,076Amount due from associates 1,288 829 789 829Amount due from joint venture - 90 - -
103,594 36,679 449,793 381,487Impairment of doubtful receivables (501) (882) - -
103,093 35,797 449,793 381,487
non-current :Loans to subsidiaries - - 121,817 79,445
Total 183,271 129,707 571,749 461,256

�������������������������������������������������������
��� ���
�������������������������������������������������������������������������
��� ���
������������������
99NOTES TO THE FINANCIAL STATEMENTS
For the financial year ended 31 December 2008
20 traDe anD other receivables (cont’D)
* Included in the Group’s non-trade receivables are :
(i) $19,558,000 (2007 : Nil) being amount paid by MSC for investment in Philippines.(ii) An amount of $10,028,000 (2007 : $4,366,000) being advances paid before delivery of tin.(iii) $37,991,000 (2007: $1,644,000) relating to a development project.
Trade receivables
Trade receivables are non-interest bearing and are generally on cash to 90 days’ terms. They are recognised at their original invoice amounts which represents their fair values on initial recognition.
At the balance sheet date, trade receivables arising from export sales amounting to $2,012,000 (2007 : $11,338,000) are arranged to be settled via letters of credits issued by reputable banks in countries where customers are based.
Amounts due from subsidiaries
The amounts due from subsidiaries are non-trade related, unsecured and repayable on demand in cash. No interest is charged except for amounts receivable of $256,008,000 (2007 : $21,723,000) which bears interest ranging from 2.0% to 3.0% per annum (2007 : 3.0% to 4.0%).
Loans to subsidiaries Loans to subsidiaries (except for the loans described below) are non-trade related, unsecured, bear interest based on prevailing
market rate ranging from 5.1% to 7.8% per annum (2007 : 6.4% to 7.1%), have no fixed terms of repayment and are not expected to be repaid within 1 year. The loans are expected to mature in less than 10 years and to be settled in cash.
Loans to a subsidiary of $41,383,000 (2007 : Nil) bear interest ranging from 3.7% to 4.0% per annum to the extent of the interest incurred by the Company in obtaining bank borrowings to advance loans to the subsidiary are expected to mature in less than 3 years and to be settled in cash.
The carrying amount of the loans receivable approximates its fair value as the implicit interest rates are based on prevailing market rates.
Amounts due from associates
At 31 December 2007, the amount due from associates under trade receivables, was unsecured, non-interest bearing and subject to the Group’s normal credit terms which range from cash to 90 days.
The amount due from associates under other receivables is non-trade related, unsecured, non-interest bearing and repayable on demand except for a secured short term loan of $499,000 (2007 : Nil) which is secured by second ranking fixed and floating charge and bears interest at 10% per annum (2007 : Nil).
These amounts are repayable in cash.
Amount due from joint venture
The amount due from joint venture under other receivables is non-trade related, unsecured, non-interest bearing and repayable on demand in cash.

�������������������������������������������������������
��� ���
������������������
100NOTES TO THE FINANCIAL STATEMENTS
For the financial year ended 31 December 2008
�������������������������������������������������������
��� ���
������������������
20 traDe anD other receivables (cont’D)
Amount due from joint venture (cont’d)
The age analysis of trade and other receivables is as follows :
Group Company2008 2007 2008 2007$’000 $’000 $’000 $’000
grossimpairment
losses net GrossImpairment
losses Net gross Gross
• Notpastdue 112,498 - 112,498 88,079 - 88,079 571,666 461,153• Pastdue:
Less than 30 days 7,388 - 7,388 17,133 - 17,133 40 4730 to 60 days 12,631 - 12,631 5,445 - 5,445 23 1961 to 90 days 3,230 - 3,230 1,722 - 1,722 18 2091 days to 120 days 9,889 (10) 9,879 573 - 573 2 17More than 120 days 39,576 (1,931) 37,645 19,026 (2,271) 16,755 - -
Total 185,212 (1,941) 183,271 131,978 (2,271) 129,707 571,749 461,256
Trade receivables that are individually determined to be impaired at the balance sheet date relate to debtors that are in significant financial difficulties and have defaulted on payments. Included in the net carrying amount of trade receivables of $3,868,000 (2007 : $3,616,000), the Group has a charge over the share of production of a tin mining concession.
The movements in the allowance for impairment of doubtful receivables are as follows :
Group Company2008 2007 2008 2007
$’000 $’000 $’000 $’000
At 1 January 2,271 6,301 - -Impairment for the year 201 568 - -Amounts written-off (407) - - -Reversal of impairment (32) (4,593) - -Exchange adjustment (92) (5) - -At 31 December 1,941 2,271 - -
Included in current and non-current trade and other receivables are the following balances denominated in foreign currencies which are mainly in :
Group Company2008 2007 2008 2007
$’000 $’000 $’000 $’000
Malaysian Ringgit 20,362 22,809 950 1,445Indonesian Rupiah 2,033 10,088 - -United States Dollar 95,602 66,561 - -Australian Dollar 11,376 17,212 80,433 79,445New Zealand Dollar 1,787 2,102 - -Chinese Renminbi 755 583 - -

�������������������������������������������������������
��� ���
�������������������������������������������������������������������������
��� ���
������������������
101NOTES TO THE FINANCIAL STATEMENTS
For the financial year ended 31 December 2008
21 investment securities / marKetable securities
Group Company2008 2007 2008 2007
$’000 $’000 $’000 $’000investment securities :Available-for-saleShares - quoted, at fair value 106,572 433,222 75,011 301,772 - unquoted, at cost 4 843 4 4
106,576 434,065 75,015 301,776
At 31 December 2007, included in the Group’s investment securities were some unquoted detachable warrants, associated with certain quoted shares acquired in 2007. The fair value of these warrants cannot be measured reliably and they were therefore carried at cost, that was nil. These warrants have been exercised (note 17(b)(i)) and the entire investment in the quoted shares has been reclassified to investment in associates.
In 2007, the Company recognised a gain of $13,000 in the income statement due to sale of some unquoted shares and their carrying amount at the time of sale was $28,000.
The Group has no intention to dispose of its other unquoted shares in the foreseeable future.
Information on the Group’s investment/marketable securities by country can be found in note 40(e).
Group2008 2007
$’000 $’000marketable securities :Held-for-trading, at fair value :Quoted shares in corporations 4,999 82,350Other quoted investments 1,074 1,084Other unquoted investments - 1,723
6,073 85,157Available-for-sale, at fair value :Quoted shares in corporations - 7,171
6,073 92,328
At 31 December 2007, other unquoted investments represent options associated with certain quoted shares acquired in 2007, due 31 August 2009 and to be exercised at a price of A$0.15 each. The fair value of the options was determined by reference to a publicly published price that was offered by a third party for these options. These options are sold during the year.
Other quoted investments for 2008 and 2007 are secured bonds with fixed interest rate of 8% per annum. The bonds will mature on 20 November 2012.

�������������������������������������������������������
��� ���
������������������
102NOTES TO THE FINANCIAL STATEMENTS
For the financial year ended 31 December 2008
�������������������������������������������������������
��� ���
������������������
22 Derivative financial instruments
Derivative financial instruments included in the balance sheets as at 31 December are as follows :
Group Company2008 2008 2007 2007 2008 2008 2007 2007
assets liabilities Assets Liabilities assets liabilities Assets Liabilities$’000 $’000 $’000 $’000 $’000 $’000 $’000 $’000
Interest rate swap contracts - (2,218) - - - (2,218) - -
Forward sales contracts 1,980 - - (2,579) - - - -Foreign currency forward contracts - (3,221) 170 (306) - - - -Financial guarantee contract - - - - - - - (77)
1,980 (5,439) 170 (2,885) - (2,218) - (77)
Current 1,980 (505) 170 (2,885) - - - (77)
Non-current - (4,934) - - - (2,218) - -
These represent the fair values of :
(a) interest rate swap contracts, entered into for the purpose of hedging against interest rate risks. The fair value changes of such contracts are recognised in the hedging reserve to the extent that the hedges are effective.
(b) forward sales contracts entered into for the purpose of hedging against market fluctuations in tin prices. The fair value changes of such contracts are recognised in the hedging reserve to the extent that the hedges are effective.
(c) foreign currency forward contracts entered into for the purpose of hedging against foreign exchange risk. The fair value
changes are recognised in the hedging reserve to the extent that the hedges are effective. (d) financial guarantee contract issued by the Company to the provider of a term loan facility for a subsidiary, less cumulative
amortisation.
Further details of the above derivative financial instruments (a) to (c) are disclosed in note 41 to the financial statements.
23 other non-current assets
Group2008 2007
$’000 $’000
Base inventory (a) 1,244 1,307Security deposit 115 146Insurance scheme (b) - 3,469Rental prepayment 1,787 -Mining assets 16,343 -
19,489 4,922
(a) Base inventory is used in the smelting process and comprises a metallic tin content of 381 tonnes (2007 : 381 tonnes). It is stated at lower of estimated recoverable amounts and cost.

�������������������������������������������������������
��� ���
�������������������������������������������������������������������������
��� ���
������������������
103NOTES TO THE FINANCIAL STATEMENTS
For the financial year ended 31 December 2008
23 other non-current assets (cont’D)
(b) The insurance scheme is a severance pay product based on an agreement between a subsidiary in Indonesia and an insurance company in Indonesia.
The subsidiary will pay the funding for the future benefit payments to the insurer, and the insurer will accumulate the subsidiary’s funding in a managed pooled fund. The calculation for the benefits refers to the Collective Labor Agreement and in certain circumstances to Indonesian Labor Law. Annually, the subsidiary has the right to review the managed pooled fund arrangement, which earns interest at the rate of 9.5% per annum.
24 assets helD for sale unDer frs 105
Group Company2008 2007 2008 2007
$’000 $’000 $’000 $’000Assets held for sale under FRS 105
(a) Reclassified from investment properties (note 14) 2,078 662 212 662 Exchange adjustment - (7) - (7)
2,078 655 212 655(b) Disposal during the year - (655) - (655)
2,078 - 212 -
During the financial year, the Group entered into the following Sale and Purchase Agreements (SPA) for :
(i) The sale of the freehold property, No. 38 Persiaran Persekutuan, Kuala Lumpur, for a total consideration of $1,908,000 (RM4,600,000) by a subsidiary. The carrying amount of the property is $1,866,000 (RM4,500,000).
(ii) The sale of two parcels of freehold land, Lot Nos. 11 and 12, Town of Pusing, District of Kinta, Perak, together with a single storey shophouse erected thereon on each lot, for a total consideration of $97,000 (RM235,000) by the Company. The carrying amount of these properties is $87,000 (RM210,000).
(iii) The sale of two parcels of freehold land, Lot Nos. 407 and 408, Town of Menglembu, District of Kinta, Perak, for a total consideration of $141,000 (RM340,000) by the Company. The carrying amount of these properties is $125,000 (RM300,000).
Completion of the sale is subject to completion of the terms and conditions stated in the SPA.
25 properties helD for sale
Group2008 2007
$’000 $’000
At lower of cost or net realisable value 7,814 12,806

�������������������������������������������������������
��� ���
������������������
104NOTES TO THE FINANCIAL STATEMENTS
For the financial year ended 31 December 2008
�������������������������������������������������������
��� ���
������������������
25 properties helD for sale (cont’D)
Details of the properties as at 31 December 2008 are as follows :
Description of Properties
Net FloorArea
sq.m.
Group’sEffective
Interest inProperty
ExistingUse
10 (2007 : 17) residential units at Gallop Gables Condominium, Singapore 1,838 100% Residential
4 units of 3-storey shophouses and 5 units of 4-storey shophouses at Jalan Selat, Taman Selat, Butterworth # 4,016 100% Commercial
# There was no sale during the year.
26 inventories
Group2008 2007
$’000 $’000
At lower of cost or net realisable value :Inventories of tin-in-concentrates, tin-in-process and refined tin metal 97,011 121,554Other tin inventories (stores, spares, fuels and by-products) 12,455 12,860Food and beverage inventories 1,578 1,857
111,044 136,271
Cost of inventories sold during the year amounted to $894,801,000 (2007 : $745,072,000).
The net reversal of write-down of inventories recognised as a reduction of expense amounted to $8,725,000. The reversal was for write-down no longer required. In 2007, the write-down of inventories recognised as an expense amounted to $14,055,000. These expenses were included in the cost of tin mining and smelting in the income statement.
27 income tax receivables
Group Company2008 2007 2008 2007
$’000 $’000 $’000 $’000
Income tax receivables 7,031 4,061 164 23
28 cash anD cash equivalents
Group Company2008 2007 2008 2007
$’000 $’000 $’000 $’000
Cash at bank and in hand 29,474 29,417 5,142 349Short term deposits 186,368 316,791 160,000 123,083
215,842 346,208 165,142 123,432
Cash at bank earns interest at floating rates based on daily bank deposit rates. Short-term deposits are placed for varying periods of between one day to one year depending on the immediate cash requirements of the Group, and earn interests at the respective short-term deposit rates.

�������������������������������������������������������
��� ���
�������������������������������������������������������������������������
��� ���
������������������
105NOTES TO THE FINANCIAL STATEMENTS
For the financial year ended 31 December 2008
28 cash anD cash equivalents (cont’D)
Included in cash at bank and deposits of the Group are short term deposit of $2,000,000 (2007 : $2,000,000) relating to Advertising and Promotion (A&P) Reserve Sum maintained with a financial institution by a subsidiary for A&P expenses on No. 18, 20, 22 Cross Street, Singapore, in accordance with the master lease agreement executed by this subsidiary, more details are given in note 33.
Included in cash at bank and deposits are the following balances denominated in foreign currencies which are mainly in :
Group Company2008 2007 2008 2007
$’000 $’000 $’000 $’000
Malaysian Ringgit 15,537 26,181 135 10,014Indonesian Rupiah 1,085 3,038 - -United States Dollar 15,259 9,076 3 3Australian Dollar 11,302 16,540 37 34New Zealand Dollar 513 826 - -Chinese Renminbi 1,115 1,042 - -
29 share capital
Group and Company2008 2008 2007 2007
number ofshares
sharecapital
Number ofshares
Sharecapital
’000 $’000 ’000 $’000Ordinary shares issued and fully paid :At 1 January and 31 December 325,897 265,928 325,897 265,928
The holders of ordinary shares are entitled to receive dividends as and when declared by the Company. All ordinary shares carry one vote per share without restriction.
30 reserves
Group Company2008 2007 2008 2007
$’000 $’000 $’000 $’000
Retained earnings (a) 565,472 1,329,125 87,760 525,041
Dividend reserve (b) 325,897 16,295 325,897 16,295
AFS reserve (c) 10,026 229,320 8,050 183,925Hedging reserve (d) (2,729) (515) (2,213) -Revaluation reserve (e) 70,493 927 129 -Share option reserve (f) 150 33 - -Translation reserve (g) (38,456) (9,626) (3,391) (1,052)
39,484 220,139 2,575 182,873

�������������������������������������������������������
��� ���
������������������
106NOTES TO THE FINANCIAL STATEMENTS
For the financial year ended 31 December 2008
�������������������������������������������������������
��� ���
������������������
30 reserves (cont’D)
(a) Retained earnings
Group Company2008 2007 2008 2007
$’000 $’000 $’000 $’000
At 1 January 1,329,125 866,411 525,041 447,638Profit for the year 57,608 484,957 383,980 99,646Transfer to dividend reserve (821,261) (22,243) (821,261) (22,243)At 31 December 565,472 1,329,125 87,760 525,041
(b) Dividend Reserve
Group and Company2008 2007
$’000 $’000
At 1 January 16,295 19,032
Transfer from retained earnings 821,261 22,243Dividend payments (note 35) (511,659) (24,980)
309,602 (2,737)At 31 December 325,897 16,295
(c) AFS Reserve
AFS reserve records the cumulative fair value changes of available-for-sale financial assets until they are derecognised or impaired.
Group Company2008 2007 2008 2007
$’000 $’000 $’000 $’000
At 1 January 229,320 148,869 183,925 107,839Net changes in the reserve (219,294) 80,451 (175,875) 76,086At 31 December 10,026 229,320 8,050 183,925
Net changes in the reserve :- Net fair value changes during the year (152,904) 123,486 (130,997) 104,557- Investment securities reclassified to associates 6,442 - - -- Recognised in the income statement : - on disposal of investment securities (73,420) (44,007) (44,878) (29,443) - on impairment of investment securities 588 972 - 972
(219,294) 80,451 (175,875) 76,086

�������������������������������������������������������
��� ���
�������������������������������������������������������������������������
��� ���
������������������
107NOTES TO THE FINANCIAL STATEMENTS
For the financial year ended 31 December 2008
30 reserves (cont’D)
(d) Hedging Reserve
Hedging reserve records the portion of the fair value changes on derivative financial instruments designated as hedging instruments in cash flow hedges that is determined to be an effective hedge.
Group Company2008 2007 2008 2007
$’000 $’000 $’000 $’000
At 1 January (515) (1,227) - -Net changes in the reserve (2,214) 712 (2,213) -At 31 December (2,729) (515) (2,213) -
Net changes in the reserve :- Net loss on fair value changes during the year (857) (341) (2,380) -- Recognised in the income statement : - Loss on interest rate swap recognised in ‘Finance Costs’ 167 - 167 - - Ineffective cash flow hedge (1,524) 1,053 - -
(2,214) 712 (2,213) -
(e) Revaluation Reserve
The revaluation reserve is used to record increases in the fair value of land and buildings and decreases to the extent that such decrease relates to an increase on the same asset previously recognised in equity.
Group Company2008 2007 2008 2007
$’000 $’000 $’000 $’000
At 1 January 927 927 - -Net changes in the reserve 69,566 - 129 -At 31 December 70,493 927 129 -
Net changes in the reserve :- Surplus on revaluation of land and buildings 69,566 - 129 -
(f) Share Option Reserve
Share option reserve of a subsidiary represents the equity-settled share options granted to its directors and company secretary as a component of remuneration. The reserve is made up of the cumulative value of equity-settled share options granted for services received.
Group2008 2007
$’000 $’000
At 1 January 33 33
Equity-settled share options granted (note 7(b)) 250 -Exchange adjustment (1) -Less: Minority interest’s share (132) -
117 -At 31 December 150 33

�������������������������������������������������������
��� ���
������������������
108NOTES TO THE FINANCIAL STATEMENTS
For the financial year ended 31 December 2008
�������������������������������������������������������
��� ���
������������������
30 reserves (cont’D)
(g) Translation Reserve
The exchange translation reserve is used to record exchange differences arising from the translation of the financial statements of foreign operations whose functional currencies are different from that of the Group’s and Company’s presentation currency. It is also used to record the effect of hedging net investments in foreign operations.
Group Company2008 2007 2008 2007
$’000 $’000 $’000 $’000
At 1 January (9,626) (10,651) (1,052) (1,232)Net effect of exchange adjustments (28,830) 1,025 (2,339) 180At 31 December (38,456) (9,626) (3,391) (1,052)
Net effect of exchange adjustments :- Translation of foreign operations (43,497) 6,190 (2,339) 180- Hedging net investments in foreign operations 14,498 (5,165) - -- Transfer to income statement on goodwill impairment 169 - - -
(28,830) 1,025 (2,339) 180
31 provisions
Group2008 2007
$’000 $’000Mine rehabilitation provision
At 1 January 5,282 6,092Provision made during the year 1,354 110Paid/Utilised during the year (30) (573)Exchange adjustment (4) (347)At 31 December 6,602 5,282
Non-current 6,572 5,244Current 30 38
6,602 5,282
The provision of $6,522,000 (2007 : $5,143,000) is made by subsidiaries in respect of mine rehabilitation expenditure to be incurred subsequent to the cessation of production of each mine property. It is provided based on the present value of the estimated expenditure to be incurred.
The provision of $80,000 (2007 : $139,000) is made by a subsidiary in Australia based on agreements with the relevant authorities to provide financial assistance to the ongoing upgrading, maintenance and monitoring of basic rehabilitation of mine sites.

�������������������������������������������������������
��� ���
�������������������������������������������������������������������������
��� ���
������������������
109NOTES TO THE FINANCIAL STATEMENTS
For the financial year ended 31 December 2008
32 borrowings
Group Company2008 2007 2008 2007
$’000 $’000 $’000 $’000Non-current Secured :Revolving credit facilities 21,278 - 21,278 -Term loan 159,267 - 159,267 -
180,545 - 180,545 -Unsecured :Term Loan 1 2,489 3,922 - -Term Loan 2 24,595 - - -Term Loan 3 4,254 - - -Term Loan 4 35,682 - - -
67,020 3,922 - -
Non-current 247,565 3,922 180,545 -
Current Unsecured :Short-term trade finance 109,099 126,033 - -Banker’s acceptance 47,522 14,415 - -Revolving credit facilities 1 43,317 3,753 - -Revolving credit facilities 2 27,000 - 27,000 -Term Loan 1 1,245 1,307 - -Term Loan 2 - 25,837 - -Term Loan 3 2,163 - - -Term Loan 4 5,406 - - -Current 235,752 171,345 27,000 -
Total borrowings 483,317 175,267 207,545 -
Secured
The term loan and revolving credit facilities are part of a 3-year secured loan facility due in September 2011. The facility is secured by, inter alia, legal mortgages over the land and building to be erected on No. 9 Battery Road, Singapore, which are owned by the Company and a subsidiary.
Unsecured
The unsecured term loan 1 is denominated in Malaysian Ringgit and is repayable by 8 semi-annual principal repayments of RM1.5 million each commencing on 1 May 2008.
The unsecured term loan 2 is a 1-year term loan facility due in April 2008 and has been extended to 12 April 2010, and is denominated in Malaysian Ringgit. The term loan is guaranteed by the Company.
The unsecured term loan 3 is denominated in US Dollar and is repayable by 16-quarterly principal repayments commencing in May 2009.
The unsecured term loan 4 is denominated in US Dollar and is repayable by 20 quarterly principal repayments commencing on 20 September 2008.

�������������������������������������������������������
��� ���
������������������
110NOTES TO THE FINANCIAL STATEMENTS
For the financial year ended 31 December 2008
�������������������������������������������������������
��� ���
������������������
32 borrowings (cont’D)
Unsecured (cont’d)
Trade finance and revolving credit facilities 1 are denominated in Malaysian Ringgit or US Dollar. Banker’s acceptance is denominated in Malaysian Ringgit. All these facilities are utilised for working capital requirements involving purchases and sales of tin concentrates and tin metal.
The unsecured revolving credit facilities 2 is utilised for working capital requirements.
The interest rates of the term loans are repriced at intervals of 1 month or 3 months (2007 : 1 month or 3 months).
The range of interest rates incurred during the year for the borrowings are as follows :
Group Company2008 2007 2008 2007
% per annum % per annum % per annum % per annumSecuredRevolving credit facilities 2.3 to 2.4 - 2.3 to 2.4 -Term loan 2.7 to 3.1 - 2.7 to 3.1 -
UnsecuredTerm loan 1 4.9 4.9 - -Term loan 2 4.2 to 4.6 4.2 to 4.6 - -Term loan 3 3.8 to 6.0 - - -Term loan 4 6.1 to 7.6 - - -Trade finance 2.3 to 6.3 4.9 to 5.9 - -Banker’s acceptance 3.3 to 4.8 3.7 to 4.0 - -Revolving credit facilities 1 3.6 to 6.2 5.2 to 5.7 - -Revolving credit facilities 2 1.4 to 3.1 - 1.4 to 3.1 -
Included in borrowings are the following balances denominated in foreign currencies :
Group2008 2007
$’000 $’000
Malaysian Ringgit 99,950 45,481United States Dollar 175,822 129,786
33 other non-current liabilities
Group2008 2007
$’000 $’000
Deferred income on sale of No. 18, 20 and 22 Cross Street # 11,781 15,406Unrealised profit on sale of properties to associates 2,218 8,069Severance benefit obligations (note 34(a)) 3,879 6,700Other liabilities * 9,037 9,990
26,915 40,165

�������������������������������������������������������
��� ���
�������������������������������������������������������������������������
��� ���
������������������
111NOTES TO THE FINANCIAL STATEMENTS
For the financial year ended 31 December 2008
33 other non-current liabilities (cont’D)
# During the financial year, the Group amortised $3,625,000 (2007 : $3,625,000) from deferred income to the income statement.
* Included in other liabilities are provisions totalling $8,726,000 (2007 : $9,550,000) which relate to contribution towards upgrade works cost and sum reserved for advertising and promotional expenses in accordance with the master lease agreement executed on 30 March 2006 by a subsidiary on No. 18, 20 and 22 Cross Street, Singapore (Property) when the sale and leaseback arrangement of the Property were completed with the purchaser of the Property, where rental of $17,550,000 per annum is payable for a lease term of six years with an option to renew for a further term of six years on terms to be mutually agreed upon by the parties. The Company has executed a deed of undertaking in favour of the purchaser of the Property, to procure the performance and observance by this subsidiary of its obligations as tenant under the said master lease agreement.
Any unutilised provision for upgrade works cost shall be added to the advertising and promotional reserve sum to be utilised
not later than four years after the master lease agreement is executed. Any unused amount shall then be shared equally between the subsidiary and the purchaser of the Property.
Included in severance benefit obligations and other liabilities are the following balances denominated in foreign currencies :
Group2008 2007
$’000 $’000
Indonesian Rupiah 3,879 6,700Australian Dollar 311 421New Zealand Dollar - 19
34 traDe/other paYables
Group Company2008 2007 2008 2007
$’000 $’000 $’000 $’000
current :Trade payables 19,783 20,855 436 288Amount due to associate 21 - - -
19,804 20,855 436 288Other payablesAmounts due to subsidiaries - - 37,369 122,198Accrual for development cost 6,086 3,724 - -Accrual for other charges* 31,987 27,802 1,139 744Net deposits received on sale of properties 70 - 51 -Other deposits 7,358 6,667 352 330Severance benefit obligations 147 999 - -Amount due to associate 207 218 - -Amount due to joint venture 44 - - -Others# 24,647 10,490 3,684 2,325
70,546 49,900 42,595 125,597
non-current :Loan from subsidiary - - 106,382 -

�������������������������������������������������������
��� ���
������������������
112NOTES TO THE FINANCIAL STATEMENTS
For the financial year ended 31 December 2008
�������������������������������������������������������
��� ���
������������������
34 traDe/other paYables (cont’D)
Trade payables
The Group’s normal trade credit range from cash term to 90 days.
Other payables
* Included $12,988,000 (2007 : $448,000) relating to a development project.
# Included :
(i) $5,205,000 (2007 : Nil) relating to advances from minority shareholder of a subsidiary for it to purchase assets.
(ii) $4,385,000 (2007 : $1,376,000) relating to provision for joint operation loss in Indonesia.
Amounts due to subsidiaries
The amounts payable to subsidiaries are non-trade related, unsecured, non-interest bearing and repayable on demand in cash.
Loan from subsidiary
Loan from subsidiary is non-trade related, unsecured, bear interest based on prevailing market rate at 7.0% per annum, has no fixed term of repayment, not expected to be paid within 1 year and repayable in cash.
Amount due to associate
The amount due to associate under trade payables, is unsecured, interest free and subject to the Group’s normal trade credit range from cash term to 90 days.
The amount due to associate under other payables represents security deposit amounting to $207,000 (2007 : $218,000) received for its purchase of refined tin metal. The amount is placed in fixed deposit with a licensed bank and earns interest at an average rate of 3.7% per annum (2007 : 4.0%). The fixed deposit interest earned on the security deposit is payable to the associate. The amount due is repayable in cash.
Amount due to joint venture
The amount payable to joint venture is non-trade related, non-interest bearing and repayable on demand in cash.
Severance benefit obligations
The subsidiaries in Indonesia operate an unfunded, defined Severance Benefits Scheme (the Scheme) for their eligible employees. Under the Scheme, eligible permanent employees confirmed in service are entitled to severance benefits due to reduction or termination of operations, termination due to ill-health or death and on attainment of the normal retirement age of 55 or early retirement age of 50 due to ill-health. The obligations under the Scheme are determined based on actuarial valuation.
The following table summarised the components of the Scheme in the financial statements :-
(a) The amounts recognised in the balance sheet are determined as follows :
Group2008 2007
$’000 $’000
Present value of unfunded defined benefit obligations 10,645 10,863Fair value of plan assets (3,779) -Unrecognised actuarial losses (2,000) (2,024)Unrecognised past service costs (840) (1,140)Net liability 4,026 7,699
Analysed as :Current 147 999

�������������������������������������������������������
��� ���
�������������������������������������������������������������������������
��� ���
������������������
113NOTES TO THE FINANCIAL STATEMENTS
For the financial year ended 31 December 2008
34 traDe/other paYables (cont’D)
Group2008 2007
$’000 $’000
Non-current
Later than 1 year but not later than 2 years 400 1,058Later than 2 years but not later than 5 years 2,792 537Later than 5 years 687 5,105 (note 33) 3,879 6,700
4,026 7,699
(b) The amounts recognised in the income statement are as follows :
Group2008 2007
$’000 $’000
Current service cost 616 644Interest cost 1,004 1,262Net actuarial losses 219 201Past service costs 247 286Expected return on plan asset (381) -Total, included in employee benefits expenses (note 7) 1,705 2,393
(c) Movement in the net liability in the current year are as follows :
Group2008 2007
$’000 $’000
At 1 January 7,699 8,710Amounts recognised in the income statement (note 7) 1,705 2,393Paid during the year (215) (2,445)Plan asset (note 34.1) (5,220) -Exchange adjustment 57 (959)At 31 December 4,026 7,699
(d) Principal actuarial assumptions used :
2008 2007% per annum % per annum
Discount rate 12.0 10.0Expected rate of salary increases 10.0 8.0 - 10.0
34.1 Plan asset
This is in respect of insurance scheme for a severance pay product based on an agreement between a subsidiary in Indonesia and an insurance company in Indonesia.
The subsidiary will pay the funding for the future benefit payment to the insurer, and the insurer will accumulate the subsidiary’s funding in a managed pooled fund. The calculation for the benefits refers to the Collective Labor Agreement and in certain circumstances to Indonesian Labor Law. The fund earns interest at the rate of 9.5% per annum.

�������������������������������������������������������
��� ���
������������������
114NOTES TO THE FINANCIAL STATEMENTS
For the financial year ended 31 December 2008
�������������������������������������������������������
��� ���
������������������
34 traDe/other paYables (cont’D)
Included in trade and other payables are the following balances denominated in foreign currencies which are mainly in :
Group Company2008 2007 2008 2007
$’000 $’000 $’000 $’000
Malaysian Ringgit 15,604 9,675 12,602 13,240Indonesian Rupiah 5,397 12,241 - -United States Dollar 12,938 4,942 - -Australian Dollar 8,694 13,448 106,382 -New Zealand Dollar 2,598 3,132 - -
35 DiviDenDs
Group and Company2008 2007
$’000 $’000Declared and paid during the year :
Dividends on ordinary shares :
• Secondinterimdividendfor2007:5centspersharetaxexempt(one-tiertax) 16,295 9,516 [4 cents per share less Malaysian income tax at 27% for 2006]
• Specialdividendpaidin2008:$1.50persharetaxexempt(one-tiertax) 488,846 -
• Specialdividendfor2006paidin2007:4centspersharelessMalaysianincometaxat27% - 9,516
• Firstinterimdividendfor2008:2centspersharetaxexempt(one-tiertax) 6,518 5,948 [2.5 cents per share less Malaysian income tax at 27% for 2007]
511,659 24,980Declared/became payable after 31 December year end :
Dividends on ordinary shares :
• Secondinterimdividendfor2008:Nil - 16,295 [5 cents per share tax exempt (one-tier tax) for 2007]
• Specialdividendpayablein2009:$1.00persharetaxexempt(one-tiertax)# 325,897 -325,897 16,295
# This was approved by the Company’s shareholders at an extraordinary general meeting held on 19 December 2008 and subject to the 21-day statutory period required under the provisions of Section 76(10) of the Singapore Companies Act, which ended on 12 January 2009. Payments will be made in two instalments, 80 cents per share in March 2009 and 20 cents per share in April 2009.
There is no taxation consequence arising from the dividend declared on the Company.

�������������������������������������������������������
��� ���
�������������������������������������������������������������������������
��� ���
������������������
115NOTES TO THE FINANCIAL STATEMENTS
For the financial year ended 31 December 2008
36 future capital expenDiture
(a) Capital expenditure committed but not provided for in the financial statements are analysed as follows :
Group2008 2007
$’000 $’000
Property, plant and equipment 770 15,950Investment property * 31,962 43,047
32,732 58,997
* This arises from contracts totalling $58,798,000 (2007 : $55,336,000) entered into by the Group for the redevelopment of an investment property.
(b) Capital expenditure authorised but not committed are analysed as follows :
Group2008 2007
$’000 $’000
Property, plant and equipment 1,080 1,732Investment property 10,441 4,664Mine development expenditure - 9,593
11,521 15,989
37 lease commitments
Operating Lease Commitments
(a) For Lessor The Group and Company has entered into property lease agreements on its property, plant and equipment, investment
properties and properties held for sale. These non-cancellable leases have remaining non-cancellable lease terms of up to 3 years. Contingent lease receipts are subject to the revenue exceeding a level stated in the respective agreements.
Contingent lease receipts recognised in the income statement at Group level amounted to $19,000 (2007 : $11,000).
Future minimum lease receivable under non-cancellable operating leases are as follows :
Group Company2008 2007 2008 2007
$’000 $’000 $’000 $’000
Not later than 1 year 13,451 14,087 1,647 1,621Later than 1 year but not later than 5 years 4,792 8,858 987 1,749
18,243 22,945 2,634 3,370

�������������������������������������������������������
��� ���
������������������
116NOTES TO THE FINANCIAL STATEMENTS
For the financial year ended 31 December 2008
�������������������������������������������������������
��� ���
������������������
37 lease commitments (cont’D)
(b) For Lessee The Group has entered into operating lease agreements for properties and office equipment. These non-cancellable operating
leases have remaining non-cancellable lease terms of up to 9 years. Contingent rents are payable subject to the related revenue exceeding a level stated in the respective agreements.
Operating lease payments recognised in the income statement are as follows :
Group2008 2007
$’000 $’000
Minimum lease payments 40,129 41,100Contingent lease payments 6,662 5,734
46,791 46,834
Future minimum lease payable under non-cancellable operating leases are as follows :
Group2008 2007
$’000 $’000
Not later than 1 year 36,453 40,202Later than 1 year but not later than 5 years 115,881 145,832Later than 5 years 59,956 100,880
212,290 286,914
For Sub-Lease Commitments as Lessor
The Group has entered into property lease agreements on the property at No. 18, 20 and 22 Cross Street. These non-cancellable operating leases have remaining non-cancellable lease terms of up to 3 years. Contingent lease receipts are subject to the revenue exceeding a level stated in the respective agreements.
Contingent lease receipts recognised in the income statement amounted to $68,000 (2007 : $77,000).
Future minimum lease receivable under non-cancellable operating leases are as follows :
Group2008 2007
$’000 $’000
Not later than 1 year 11,489 12,258Later than 1 year but not later than 5 years 8,966 7,539
20,455 19,797

�������������������������������������������������������
��� ���
�������������������������������������������������������������������������
��� ���
������������������
117NOTES TO THE FINANCIAL STATEMENTS
For the financial year ended 31 December 2008
38 relateD partY Disclosures
(a) Sale and Purchase of Goods and Services
In addition to related party information disclosed elsewhere in the financial statements, significant transactions with related parties on terms agreed between the parties are as follows :
Group Company2008 2007 2008 2007
$’000 $’000 $’000 $’000Subsidiaries
Rendering of services - - 130 120Receiving of services - - 121 66Purchase of investment securities - - 565 -Interest income received - - 8,545 5,861Interest expense paid - - 1,751 -Settlement of liabilities by the Company on behalf of subsidiaries - - 179 145
Settlement of liabilities by subsidiary on behalf of Company - - 43 -
Associates
Sales of goods 23,956 17,864 - -
Directors
Sales of property - 2,359 - -
Other related parties
Rendering of services - 4 - -
Please refer to notes 20 and 34 for information on amount due from/to subsidiaries, associates and joint ventures.
(b) Key Management Personnel Compensation
The key management personnel compensation are as follows :
Group2008 2007
$’000 $’000
Directors’ fees 911 852Short-term employee benefits 4,660 3,874Share based payments 570 -Defined contribution plans 160 124
6,301 4,850Comprise amounts paid to :- Directors of the Company 3,009 2,372- Other key management personnel 3,292 2,478
6,301 4,850

�������������������������������������������������������
��� ���
������������������
118NOTES TO THE FINANCIAL STATEMENTS
For the financial year ended 31 December 2008
�������������������������������������������������������
��� ���
������������������
39 contingent liabilities anD commitments
Group Company2008 2007 2008 2007
$’000 $’000 $’000 $’000(a) Financial support given to those subsidiaries having deficiencies in shareholders’ funds - - 43,069 62,146
(b) Undertaking for indemnity in respect of bank guarantee facilities utilised by subsidiaries 20,956 36,715 20,458 23,730
(c) In addition to the above, the Company has also undertaken to provide certain subsidiaries with adequate funding to meet their net current liability positions.
(d) A standby letter of credit for $69.2 million (US$48.0 million) issued by Malaysia Smelting Corporation Berhad (MSC) as guarantee for bank facilities amounting to $47.3 million (US$32.8 million) utilised by one of its subsidiaries.
(e) At 31 December 2008, material outstanding litigations against MSC as follows :
(i) A claim from a party against MSC and three others, seeking a declaration that the award for the sale of 100% issued shares of Rahman Hydraulic Tin Sdn. Bhd. (RHT) to MSC pursuant to an open tender process, be declared null and void. The party also filed an injunction to restrain the Administrator of RHT from proceeding with the sale. Both the claim and the injunction were dismissed by the High Court with costs. The party has filed an appeal and no date has been fixed for hearing. There was no further development.
(ii) A Writ of Claim for $18.67 million (RM45 million) plus interest at 8% per annum and legal costs was filed against MSC for an alleged breach of a Share Subscription Agreement made between the Plaintiff and MSC. The breach was in fact committed by the Plaintiff, entitling MSC to terminate the agreement. On 7 March 2006, MSC has filed its Statement of Defence disputing liability. MSC’s solicitors have filed an application to strike out Plaintiff’s suit. Plaintiff filed an application to amend the Writ of Claims and Writ of Summons and wishes to consolidate this matter with another suit which was filed by MSC against one of the directors of the Plantiff. The matter was fixed for mention on 9 March 2009, but hearing has been postponed.
(iii) A Writ of Claim was filed against MSC by a system provider for $0.53 million (RM1.28 million) plus interest at 8% per annum and legal costs for alleged cost overruns in the implementation of an Enterprise Resource Planning System. The Claim came after more than a year following the completion of the implementation. MSC has filed its Statement of Defence disputing liability. The case has been fixed for Case Management on 27 April 2009.
(iv) On 23 January 2008, the Bangka Tengah Police began an investigation on PT Koba Tin following allegation on illegal collection of tin concentrate from subcontractors believed to have come from outside PT Koba Tin’s Contract of Work area. In the course of the investigation the Police stopped the smelter operation and police-lined the warehouse containing 528 tonnes of tin ingots and 218 tonnes of tin concentrate. The Police detained four employees and one retiree for investigations. Following Court hearings between October and December 2008, the defendants were found not guilty and were freed of all charges.
(v) In 2007, a subsidiary in Indonesia received various assessments for taxes and penalties for fiscal year 2005 from the Tax Office indicating a total net underpayment amounting to $21.89 million (US$15.17 million). The subsidiary has filed objections to the Tax Office on 21 March 2007 and paid a portion of the net assessed underpayment in the amount of $12.23 million (US$8.48 million).

�������������������������������������������������������
��� ���
�������������������������������������������������������������������������
��� ���
������������������
119NOTES TO THE FINANCIAL STATEMENTS
For the financial year ended 31 December 2008
39 contingent liabilities anD commitments (cont’D)
(e) At 31 December 2008, material outstanding litigations against MSC as follows : (cont’d)
Based on independent professional advice received by the subsidiary in 2007, the basis for the determination of the above taxes and penalties are still open for revision, therefore, as of 31 December 2007 and 2008, the subsidiary has not recognised any provision for underpayments of taxes and penalties in its financial statements except for an amount of $0.56 million (US$0.39 million) involving withholding tax and related penalties.
(vi) On 24 September 2008, the Directorate for Forest Protection and Investigation, commenced an investigation on PT Koba Tin following allegations on violation of Indonesian Forestry Law 1999 - Article 50, section 3 regarding occupying and operating in a protected forest. This was in relation to PT Koba Tin’s Merapin dredge which ceased operation in 2002 and was occupying an area later gazetted as protected forest, though it is within the subsidiary’s Contract of Work area. The case is still ongoing and the incumbent President Director has been named a suspect, with prosecution and court hearing to follow. PT Koba Tin is confident that the case will be resolved since the dredge had already ceased operation long before the area was gazetted as protected forest and that the President Director only joined PT Koba Tin in 2007.
(vii) In May 2008, the Minister of Energy and Mineral Resources, Indonesia issued a new regulation regarding mine reclamation and closure as detailed in the Minister Regulation No. 18 year 2008, which requires a company to provide a mine closure guarantee in the form of a time deposit placed in a state owned bank in Indonesia. The subsidiary in Indonesia does not believe that a deposit is required under the terms of its Contract of Work but it is working with the Indonesian Mining Association to review these requirements with the Indonesian government and discuss other options for the mine closure guarantee.
As of the date of this report, the Directors are of the opinion that there will be no material loss to the Group arising from the above claims.
40 financial risK management
The Group’s activities expose it to a variety of financial risks. Apart from those risks generated from operations such as extending credits and cash flow management, other risks include the effects of changes in debt and equity market prices, foreign currency exchange rates, interest rates and commodity prices.
The Group’s management monitors its financial position closely with an objective to minimise potential adverse effects on the financial performance of the Group. The Group uses derivative financial instruments, where appropriate, for its risk management activities but does not hold or issue derivative financial instruments for trading purposes.
The policies for managing these risks are summarised below.
(a) Foreign exchange risk
The Group operates mainly in Asia Pacific and has exposure to foreign exchange risk as a result of transactions denominated in foreign currencies, arising from normal trading and investment activities. The Group also has similar exposure from subsidiaries operating in foreign countries, which generate revenue and incur costs denominated in foreign currencies. These foreign exchange risk exposures are mainly in Malaysian Ringgit, Australian Dollar, United States Dollar and Indonesian Rupiah. The Group uses foreign currency forward contracts to manage these exposures which are relatively certain in their timing and extent. In particular, a foreign subsidiary uses such contracts to hedge approximately 20% (2007 : 20%) of its monthly anticipated purchases in Indonesian Rupiah. The Group also uses term loans in foreign currency to hedge its exposure to foreign exchange risk on investments in foreign operations.

�������������������������������������������������������
��� ���
������������������
120NOTES TO THE FINANCIAL STATEMENTS
For the financial year ended 31 December 2008
�������������������������������������������������������
��� ���
������������������
40 financial risK management (cont’D)
(a) Foreign exchange risk (cont’d)
The following table demonstrates the sensitivity of the Group’s profit net of tax and equity at the balance sheet date to a reasonably possible change in the United States Dollar, Malaysian Ringgit, Australian Dollar and Indonesian Rupiah exchange rates against the respective functional currencies of the Group entities, with all other variables held constant.
Group2008 2007
profit net Profit netof tax equity of tax Equity$’000 $’000 $’000 $’000
United States Dollar strengthened 5% (2007 : 5%) (1,290) (1,584) (2,799) 586weakened 5% (2007 : 5%) 1,290 1,584 2,799 (586)
Malaysian Ringgit strengthened 5% (2007 : 5%) (9) (3,956) 65 (371)weakened 5% (2007 : 5%) 9 3,956 (65) 371
Australian Dollar strengthened 5% (2007 : 5%) 258 367 181 836weakened 5% (2007 : 5%) (258) (367) (181) (836)
Indonesian Rupiah strengthened 5% (2007 : 5%) 33 146 90 (117)weakened 5% (2007 : 5%) (33) (146) (90) 117
(b) Interest rate risk
The Group’s exposure to market risk for changes in interest rates relates primarily to its cash deposits and debt obligations.
The Group’s policy is to manage its interest cost using a combination of fixed and floating rate debts and also derivative financial instruments such as interest rate swaps and cross currency swaps to hedge interest rate risks.
Surplus funds are placed with reputable banks to generate interest income for the Group.
The table below demonstrates the sensitivity to a reasonably possible change in interest rates with all other variables held constant, of the Group’s profit net of tax through the impact on interest income from short term deposits and interest expense on floating rate borrowings :
Increase/decrease
in basis point
GroupEffect on
profitnet of tax
$’00031 December 2008
- Singapore Dollar + 50 141- 50 (141)
- Malaysian Ringgit + 25 (159)- 25 159

�������������������������������������������������������
��� ���
�������������������������������������������������������������������������
��� ���
������������������
121NOTES TO THE FINANCIAL STATEMENTS
For the financial year ended 31 December 2008
40 financial risK management (cont’D)
(b) Interest rate risk (cont’d)
Increase/decrease
in basis point
GroupEffect on
profitnet of tax
$’000
- Australian Dollar + 50 24- 50 (24)
- United States Dollar + 25 (317)- 25 317
31 December 2007
- Singapore Dollar + 50 1,180- 50 (1,180)
- Malaysian Ringgit + 25 (38)- 25 38
- Australian Dollar + 50 14- 50 (14)
- United States Dollar + 50 (474)- 50 474
At the balance sheet date, for the increase/decrease in the various basis points on interest rates for the various currencies, the effects associated with such changes are on the Group’s profit net of tax as illustrated above.
(c) Credit risk
The Group has no significant concentrations of credit risk due to its diverse customer base. The credit risk arising from the Group’s normal commercial operations is controlled by individual operating units within strict credit control and guidelines. Policies are in place to ensure on-going credit evaluation and active account monitoring.
At the balance sheet date, the Group’s and the Company’s maximum exposure to credit risk is represented by the carrying amount of each class of financial assets recognised on the balance sheet.
Financial assets that are neither past due nor impaired
Trade and other receivables that are neither past due nor impaired are creditworthy debtors with good payment record with the Group. Cash and cash equivalents, investment/marketable securities and derivatives that are neither past due nor impaired are placed with or entered into with reputable financial institutions or companies with high credit ratings and no history of default.
Information regarding credit enhancements for trade and other receivables is disclosed in note 20.

�������������������������������������������������������
��� ���
������������������
122NOTES TO THE FINANCIAL STATEMENTS
For the financial year ended 31 December 2008
�������������������������������������������������������
��� ���
������������������
40 financial risK management (cont’D)
(c) Credit risk (cont’d)
Credit risk concentration profile
The Group determines concentrations of credit risk by monitoring the country profile of its trade and other receivables on an on-going basis. The credit risk concentration profile of the Group’s trade and other receivables at the balance sheet date is as follows :
Group Company2008 2007 2008 2007
$’000 % of total $’000 % of total $’000 % of total $’000 % of totalBy country :
Singapore 68,211 37 19,258 15 553,118 97 459,803 100Malaysia 4,050 2 9,434 7 960 - 1,453 -Indonesia 38,712 21 45,750 35 - - - -United States 14,962 8 8,125 6 - - - -Australia 15,574 8 19,564 15 17,671 3 - -New Zealand 1,411 1 2,102 2 - - - -China, including Hong Kong and Taiwan 4,203 2 9,921 8 - - - -
United Kingdom 1,293 1 8,123 6 - - - -India 10,522 6 - - - - - -Philippines 19,617 11 - - - - - -Other countries 4,716 3 7,430 6 - - - -
183,271 100 129,707 100 571,749 100 461,256 100
At the balance sheet date, approximately 28 per cent of the Group’s trade and other receivables were due from 2 major customers who deal in tin, located in Indonesia and Singapore, and amount paid by MSC for an investment in Philippines.
At 31 December 2007, approximately 13 per cent of th Group’s trade and other receivables were due from 2 major customers who deal in tin, located in Indonesia, and value added tax receivable from the Indonesia tax authority.
(d) Liquidity risk
The Group manages its debt maturity profile, operating cash flows and the availability of fundings so as to ensure that all refinancing, repayment and funding needs are met in a timely and cost-effective manner. Procedures have been established to monitor and control liquidity on a daily basis by adopting a cash flow management approach.

�������������������������������������������������������
��� ���
�������������������������������������������������������������������������
��� ���
������������������
123NOTES TO THE FINANCIAL STATEMENTS
For the financial year ended 31 December 2008
40 financial risK management (cont’D)
(d) Liquidity risk (cont’d)
The following summarises the maturity profile of the Group’s and Company’s financial liabilities at the balance sheet date based on contractual undiscounted payments :
GROUPWithin 1 year
1 to 5 years
More than 5 years Total
$’000 $’000 $’000 $’00031 December 2008
Borrowings 235,752 248,403 - 484,155Trade and other payables 90,350 12,159 757 103,266Derivative financial instruments 1,459 4,362 - 5,821
31 December 2007
Borrowings 171,345 3,922 - 175,267Trade and other payables 74,530 7,370 5,545 87,445Derivative financial instruments 306 - - 306
COMPANYWithin 1 year
1 to 5 years
More than 5 years Total
$’000 $’000 $’000 $’00031 December 2008
Borrowings 27,000 181,383 - 208,383Trade and other payables 43,031 - 106,382 149,413Derivative financial instruments 954 1,646 - 2,600
31 December 2007
Trade and other payables 125,885 - - 125,885
(e) Equity Price risk
Changes in the market value of investment securities can affect the net income and financial position of the Group. The Group diversifies its investments by business sector and by country. It manages the risk of unfavourable changes by cautious review of the investments before investing and continuous monitoring of their performance and risk profiles.
The investment securities are classified as held-for-trading or available-for-sale (AFS).
At the balance sheet date, 71 per cent (2007 : 38 per cent) of the Group’s held-for-trading equity portfolio consist of shares of companies in Singapore, 11 per cent (2007 : 27 per cent) in Malaysia and the remaining portion in shares of companies in other foreign countries or fixed income securities. If the Singapore and Malaysia equity prices had been 5 per cent (2007 : 2 per cent) higher/lower with all other variables held constant, the Group’s profit net of tax would have been $207,000 (2007 : $1,104,000) higher/lower, arising as a result of higher/lower fair value gains.
At the balance sheet date, 96 per cent (2007 : 59 per cent) of the Group’s AFS equity portfolio consist of shares of companies in Singapore, 4 per cent (2007 : 33 per cent) in Malaysia and the remaining portion in shares of companies in other foreign countries. If the Singapore and Malaysia equity prices had been 5 per cent (2007 : 2 per cent) higher/lower with all other variables held constant, the Group’s AFS reserve in equity would have been $5,314,000 (2007: $7,992,000) higher/lower, arising as a result of higher/lower fair value gains.

�������������������������������������������������������
��� ���
������������������
124NOTES TO THE FINANCIAL STATEMENTS
For the financial year ended 31 December 2008
�������������������������������������������������������
��� ���
������������������
40 financial risK management (cont’D)
(f) Commodity price risk
Commodity price risk is the risk of financial loss resulting from movements in the price of the Group’s commodity inputs and outputs. The Group is exposed to commodity price risk arising from revenue derived from sales of tin as well as to the impact of crude oil prices on the cost of fuel consumed in the mining and processing of tin.
The tin price risk is managed through contractual arrangements with customers and derivative instruments such as forward sales contracts.
Fuel is purchased at the spot rate available at time of purchase, which exposes the Group to the impact of changes to world prices for crude oil. However, the Group continues to assess the potential financial risk associated with rising crude oil prices and whether the risk requires the use of derivative instruments.
At the balance sheet date, in relation to the forward tin sales contracts, if the forward tin price had increased by 5 per cent, with all other variables held constant, profit net of tax for the year would have been the same (2007 : $196,000 lower), and other components of equity would have been $153,000 (2007 : $1,165,000) lower. Conversely, if the forward tin prices had decreased by 5 per cent with all other variables held constant, profit net of tax would have been the same (2007 : $1,027,000 higher), and other components of equity would have been $153,000 (2007 : $334,000) higher.
(g) Capital Management
The Group’s objective is to provide a reasonable return to shareholders by investing and developing into businesses commensurate with the level of risks. This also take into account synergies with other operations and activities, the availability of management and other resources, and the fit of the activities with the Group’s longer strategic objectives.
The Group’s policy is to maintain a strong capital base so as to maintain investor, creditor and market confidence and to sustain future development of the various core businesses. The Group allocate the amount of capital in proportion to risk, manages the capital structure and makes adjustments to it in the light of changes in economic conditions and the risk characteristic of the underlying assets. In order to maintain or adjust the capital structure, the Group may adjust the amount of dividends paid to shareholders, return capital to shareholders, issue new shares, sell assets or increase borrowings. The Group monitors the return of capital, which is defined as total shareholders’ equity (excluding minority interests), gearing ratio, which is defined as net borrowings over the aggregate of total equity and net borrowings and the level of dividends to shareholders.
The Group seeks to maintain a balance between the higher returns that might be possible with higher level of borrowings and the advantages and security afforded by a sound capital position. In 2008 the return on shareholders’ equity was 4.8 per cent (2007 : 26.5 per cent). Gearing ratio was 17.6 per cent (2007 : Nil). In comparison the weighted average interest expense on interest-bearing borrowings was 3.7 per cent (2007 : 5.2 per cent).
During the year, the Group has drawn on new borrowings for corporate funding purposes, acquisitions and working capital requirements.
Neither the Company nor any of its subsidiaries are subject to externally imposed capital requirement.

�������������������������������������������������������
��� ���
�������������������������������������������������������������������������
��� ���
������������������
125NOTES TO THE FINANCIAL STATEMENTS
For the financial year ended 31 December 2008
40 financial risK management (cont’D)
(g) Capital Management (cont’d)
Group2008 2007
$’000 $’000
Share capital 265,928 265,928Retained earnings 565,472 1,329,125Dividend reserve 325,897 16,295Other reserves 39,484 220,139Total shareholders’ equity 1,196,781 1,831,487Minority interest 52,349 62,669Total equity 1,249,130 1,894,156
Net borrowings/(net cash) 267,475 (170,941)
41 Derivative financial instruments anD heDging activities
The Group has the following derivative financial instruments accounted as:
(i) Cash flow hedges
At 31 December 2008 :
(a) Foreign currency forward contracts designated as hedges against expected future purchases in Indonesian Rupiah (IDR) and United States Dollar (USD) :
Buy IDR Range of Maturity PeriodAverage
Exchange Rate(In Million) IDR/USD
70,305.0 From January 2009 to March 2010 10,900
Buy USD Maturity PeriodAverage
Exchange Rate(In Million) RM/USD
0.6 January 2009 3.4740
The cash flow hedges of the expected future purchases were assessed to be highly effective and as at 31 December 2008, a fair value loss of $3,084,000 with a deferred tax credit of $925,000 relating to the hedging instruments was included in the hedging reserve (note 30(d)) in respect of the contracts.

�������������������������������������������������������
��� ���
������������������
126NOTES TO THE FINANCIAL STATEMENTS
For the financial year ended 31 December 2008
�������������������������������������������������������
��� ���
������������������
41 Derivative financial instruments anD heDging activities (cont’D)
(i) Cash flow hedges (cont’d)
(b) Foreign currency forward contracts designated as hedges against expected future sales in United States Dollar (USD):
Sell USD Maturity PeriodAverage
Exchange Rate(In Million) RM/USD
4.9 January 2009 3.3924
The cash flow hedges of the expected future sales were assessed to be highly effective and as at 31 December 2008, a net fair value loss of $137,000 with a deferred tax credit of $34,000 relating to the hedging instruments was included in the hedging reserve (note 30(d)) in respect of the contracts.
(c) Forward sales contracts of tin designated as hedges against market fluctuations in tin prices :
Contract Amount Maturity Period Average Price(US$’000)
4,405 January 2009 US$14.683 per tonne
The cash flow hedges of the future sale contracts of tin were assessed to be highly effective and as at 31 December 2008, a fair value gain of $1,980,000 with a deferred tax charge of $594,000 relating to the hedging instruments was included in the hedging reserve (note 30(d)) in respect of the contracts.
(d) Interest rate swap contracts designated as hedges against interest rate risk arising from floating rate borrowings :
NotionalAmount Maturity Period
Receive FloatingInterest Rate
Pay FixedInterest Rate
(S$’000)
40,000 September 2011 3 month 2.87%Swap Offer Rate
40,000 September 2011 3 month 2.575%Swap Offer Rate
The cash flow hedges of the interest rate risk were assessed to be highly effective and as at 31 December 2008, a fair value loss of $2,213,000 relating to the hedging instruments was included in the hedging reserve (note 30(d)) in respect of the contracts.

�������������������������������������������������������
��� ���
�������������������������������������������������������������������������
��� ���
������������������
127NOTES TO THE FINANCIAL STATEMENTS
For the financial year ended 31 December 2008
41 Derivative financial instruments anD heDging activities (cont’D)
(i) Cash flow hedges (cont’d)
At 31 December 2007 :
(a) Foreign currency forward contracts designated as hedges against expected future purchases in Indonesian Rupiah (IDR) and United States Dollar (USD) :
Buy IDR Range of Maturity PeriodAverage
Exchange Rate(In Million) IDR/USD
79,773.0 From January 2008 to August 2008 9,385
Buy USD Maturity PeriodAverage
Exchange Rate(In Million) RM/USD
3.1 January 2008 3.3311
The cash flow hedges of the expected future purchases were assessed to be highly effective and as at 31 December 2007, a net fair value loss of $306,000 with a deferred tax credit of $90,000 relating to the hedging instruments was included in the hedging reserve (note 30(d)) in respect of the contracts.
(b) Foreign currency forward contracts designated as hedges against expected future sales in United States Dollar (USD) :
Sell USD Range of Maturity PeriodAverage
Exchange Rate(In Million) RM/USD
7.8 From January 2008 to February 2008 3.3541
The cash flow hedges of the expected future sales were assessed to be highly effective and as at 31 December 2007, a fair value gain of $170,000 with a deferred tax charge of $44,000 relating to the hedging instruments was included in the hedging reserve (note 30(d)) in respect of the contracts.
(c) Forward sales contracts of tin designated as hedges against market fluctuations in tin prices :
ContractAmount Range of Maturity Period Average Price(US$’000)
26,016 From January 2008 to June 2008 US$15,440 per tonne
The cash flow hedges of certain future sale contracts of tin were assessed to be ineffective. Accordingly, the fair value loss of $1,524,000 on these contracts was recognised in the income statement. The fair value loss of $1,054,000 with a deferred tax credit of $300,000 on such contracts that relate to effective hedges was included in the hedging reserve (note 30(d)).

�������������������������������������������������������
��� ���
������������������
128NOTES TO THE FINANCIAL STATEMENTS
For the financial year ended 31 December 2008
�������������������������������������������������������
��� ���
������������������
42 significant accounting estimates anD JuDgement
(a) Estimation Uncertainty
The key assumptions concerning the future and other key sources of estimation uncertainty at the balance sheet date, that have a significant risk of causing a material adjustment to the carrying amounts of assets and liabilities within the next financial year, are discussed below :
(i) Impairment of goodwill
The Group determines whether goodwill is impaired at least on an annual basis. The recoverable amounts of the cash-generating unit is determined based on fair value less cost to sell and value in use. Management also reviews other economic factors and market conditions to assess whether the recovered amount as determined using this method is sustainable. Changes in the market value of the cash-generating unit could affect the recoverable amount. The carrying amount of goodwill at 31 December 2008 was $22,211,000 (2007 : $24,089,000). More details are given in note 15.
(ii) Depreciation of property, plant and equipment
Property, plant and equipment are depreciated using the appropriate basis as outlined in note 2.10 over the estimated useful lives of these assets. The carrying amount of the Group’s property, plant and equipment at 31 December 2008 was $310,166,000 (2007 : $206,252,000). Changes in the expected level of usage and technological developments could impact the economic useful lives and the residual values of these assets, therefore, future depreciation charges could be revised.
(iii) Impairment and amortisation for mine exploration and evaluation expenditure, mine development expenditure and mining rights
These require estimates and assumptions on the quantity of recoverable ore reserves, expected future costs and expenses to produce the recoverable ore, effective interest rates, expected future prices used in the impairment test for deferred mine development, mine exploration expenditures and mining rights. The estimate on quantity of recoverable ore reserves is also used for the amortisation of deferred development and exploration expenditures and mining rights. Actual outcomes could differ from these estimates and assumptions.
The carrying amounts are as follows :
Group2008 2007
$’000 $’000
Deferred exploration and evaluation expenditure 14,213 4,388
Deferred mine development expenditure 12,312 4,575
Mining rights 1,164 2,462
(iv) Fair value of properties
Properties are stated at fair value, which has been determined based on valuations as at 31 December 2008. Valuations for significant properties are performed by registered independent professionally qualified valuers, based on the open market value for existing use. The fair value of the Group’s investment properties at 31 December 2008 was $813,813,000 (2007 : $821,132,000), and Land and buildings was $239,880,000. Comparative figures are not relevant as the valuation model was adopted on 31 December 2008 on a prospective basis. The basis and assumptions and methods used are outlined in notes 13 and 14.

�������������������������������������������������������
��� ���
�������������������������������������������������������������������������
��� ���
������������������
129NOTES TO THE FINANCIAL STATEMENTS
For the financial year ended 31 December 2008
42 significant accounting estimates anD JuDgement (cont’D)
(a) Estimation Uncertainty (cont’d)
(v) Impairment loss on investments in associates
MSC acquired new associates which principally involve in exploration and mining of various minerals and metals. The impairment assessment was based on projected value of the estimated quantity of recoverable reserves and resources. These require estimates and assumptions on the quantity of recoverable reserves and resources, expected future costs and expenses to produce the minerals and metals, effective interest rates, expected commencement date for commercial production and future prices used. Actual outcomes could defer from these estimates and assumptions. The carrying amount of the Group’s investments in associates at 31 December 2008 was $75,967,000 (2007 : $11,516,000).
(vi) Write-down of obsolete or slow moving inventories to net realisable value
The write down of obsolete or slow moving inventories is based on assessment of its ageing. Inventories are written down when events or changes in circumstances indicate that the carrying amounts may not be recoverable. Management specifically analyses sales trend and current economic trends when making a judgement to evaluate the adequacy of the write down for obsolete or slow moving inventories. Where expectations differ from the original estimates, the differences will impact the carrying amount of inventories.
(vii) Provision for mine rehabilitation and restoration costs
Provision for restoration costs is provided based on the present value of the estimated expenditure to be incurred. Significant management judgement and estimation is required in determining the expenditure to be incurred subsequent to the cessation of production of each mine property. Where expectations differ from the original estimates, the differences will impact the carrying amount of provision for mine rehabilitation and restoration costs.
(b) Judgement
In the process of applying the Group’s accounting policies, Management has made the following judgement, apart from those involving estimations, which has the most significant effect on the amounts recognised in the financial statements :
(i) Income taxes
The Group has exposure to income taxes in various jurisdictions. Significant judgement is involved in determining the group-wide provision for income taxes. There are certain transactions and computations for which the ultimate tax determination is uncertain during the ordinary course of business. The Group recognises liabilities for expected tax issues based on estimates of whether additional taxes will be due. Where the final tax outcome of these matters is different from the amounts that were initially recognised, such differences will impact the income tax and deferred tax provisions in the period in which such determination is made.
The carrying amounts are as follows :
Group2008 2007
$’000 $’000
Income tax receivables 7,031 4,061
Income tax payable 14,326 24,251

�������������������������������������������������������
��� ���
������������������
130NOTES TO THE FINANCIAL STATEMENTS
For the financial year ended 31 December 2008
�������������������������������������������������������
��� ���
������������������
42 significant accounting estimates anD JuDgement (cont’D)
(b) Judgement (cont’d)
(i) Income taxes (cont’d)
Group2008 2007
$’000 $’000
Deferred tax assets 14,242 13,114
Deferred tax liabilities 54,746 38,554
(ii) Operating Lease Commitments – as Lessor
The Group has entered into commercial property leases on its investment property portfolio. The Group has determined that it retains all the significant risks and rewards of ownership of these properties which are leased out on operating lease.
43 financial instruments
The carrying amounts of financial instruments in each of the following categories as defined in FRS 39 are as follows :
Group Company2008 2007 2008 2007
$’000 $’000 $’000 $’000financial assets at fair value through profit or lossHeld-for-trading marketable securities 6,073 85,157 - -
loans and receivablesTrade and other receivables 183,271 129,707 571,749 461,256Cash and cash equivalents 215,842 346,208 165,142 123,432
available-for-sale financial assetsInvestments in quoted shares 106,572 440,393 75,011 301,772Investments in unquoted shares 4 843 4 4
financial liabilities at fair value through profit or lossHeld-for-trading financial derivatives - (1,524) - -
financial liabilities measured at amortised costTrade and other payables (90,350) (70,755) (149,413) (125,885)Borrowings (483,317) (175,267) (207,545) -

�������������������������������������������������������
��� ���
�������������������������������������������������������������������������
��� ���
������������������
131NOTES TO THE FINANCIAL STATEMENTS
For the financial year ended 31 December 2008
43 financial instruments (cont’D)
The fair value of financial assets and liabilities by classes that are not carried at fair value and whose carrying amounts are not reasonable approximation of fair value are as follows :
Group Company2008 2007 2008 2007
$’000 $’000 $’000 $’000carrying amount
Carrying Amount
carrying amount
Carrying Amount
Available-for-sale investment securities, at cost (note 21) 4 843 4 4
Fair value information has not been disclosed for the Group’s investment securities that are carried at cost because fair value cannot be measured reliably. These investment securities represent shares in some companies that are not quoted on any market.
44 subsequent events
(a) On 22 January 2009, the Singapore Finance Minister announced the revision in the Singapore corporate income tax rate (rate) from 18% to 17%.
The revised rate will apply for the financial year ending 31 December 2009. The resulting provision for deferred tax assets and liabilities for the Group would amount to $14,216,000 and $51,943,000 respectively.
(b) The President Director of PT Koba Tin has been remanded by the local police on 16 February 2009 to assist in the investigation on PT Koba Tin following allegations on violation of Indonesian Forestry Law 1999 Article 50 regarding occupying and operating in a protected forest. This was in relation to PT Koba Tin’s Merapin dredge which ceased operation in 2002 and was occupying an area later gazetted as protected forests, though it is within PT Koba Tin’s Contract of Work area.
The dredge in question operated on eastern side of PT Koba Tin’s Contract of Work (CoW) area in Lubuk Besar, Bangka from 1985 and had ceased operation in October 2002 due to exhaustion of reserves. It had since been kept under care and maintenance basis with the approval of the Directorate General of Energy and Mineral Resources. MSC acquired the 75% shareholding in PT Koba Tin and took over the management from Iluka Resources Limited in 2002.
Further, the Minister of Forestry only issued the declaration on 1 October 2004, regarding designation of forest areas covering about 657,510 hectares in the Province of Bangka Belitung, which included part of the CoW area. By this time, PT Koba Tin’s dredge has ceased operations for almost two years.
The case is still ongoing and the incumbent President Director has been named a suspect with prosecution and court hearing to follow. PT Koba Tin is confident that the case will be resolved since the dredge had already ceased operation long before the area was gazetted as protected forest and that the President Director only joined PT Koba Tin in 2007. There have been no disruptions to PT Koba Tin’s operations.
(c) MSC together with its 40% partner, Tenaga Anugerah Sdn. Bhd., has entered into a number of agreements to facilitate the restructuring of its 60% subsidiary, PT Tenaga Anugerah (PT TA). With the signing of these Agreements on 23 February 2009, the ultimate shareholding structure of PT TA held via Diversified Minerals Private Limited, a company incorporated in Singapore is as follows:
MSC : 40% Tenaga Anugerah Sdn. Bhd. : 30% PT Sarana Marindo : 30%

�������������������������������������������������������
��� ���
������������������
132NOTES TO THE FINANCIAL STATEMENTS
For the financial year ended 31 December 2008
�������������������������������������������������������
��� ���
������������������
44 subsequent events (cont’D)
The main aim of the restructuring is to allow for the participation by the local firm, PT Sarana Marindo (PT SM), who has strong local management and experienced personnel.
For its 30% interest, among others PT SM will inject into PT TA its newly built cutter suction dredge and an offshore drill barge as well as a mining concession located in Tg Penyusuk, Kabupaten Bangka Induk, Indonesia with measured tin resources of 1,115 tonnes.
(d) The Company entered into a 3-year $180 million loan facility due in March 2012, secured by, inter alias, legal mortgages over the Gallop Green condominium, Gourmet Gallery and Rendezvous Hotel in Singapore owned by the subsidiaries. $150 million has since been drawn on 5 March 2009.
45 segment information
2008 business segments
Resources Hotel PropertySecurities
TradingInvestment
HoldingCorporate/
Others Elimination Consolidated$’000 $’000 $’000 $’000 $’000 $’000 $’000 $’000
Segment Revenue Revenue from external 963,384 155,488 60,265 66,728 - - - 1,245,865 Inter-segment revenue - - 1,010 - - - (1,010) - Other items of income 3,748 - 3,625 (15,265) 7,754 4,376 - 4,238Total Revenues 967,132 155,488 64,900 51,463 7,754 4,376 (1,010) 1,250,103
Segment result 25,254 8,698 14,931 (15,841) 7,528 4,441 - 45,011Unallocated expenses (3,389)Profit from operations 41,622Exceptional (losses)/gains, net (14,457) (1,040) (7,557) 74,417 51,363Impairment loss (1,423) (1,423)Finance costs (11,580) (50) (1,738) (13,368)Share of profit from equity-accounted associates (5,437) 1,081 (4,356)
Share of profit from equity-accounted joint ventures 77 77
Profit Before Tax from Continuing Operations 73,915
Income tax expense (20,095)Profit from Continuing Operations, net of tax 53,820
Attributable to Equity Holders of the Company, net of tax 57,608
Attributable to Minority Interests, net of tax (3,788)
53,820

�������������������������������������������������������
��� ���
�������������������������������������������������������������������������
��� ���
������������������
133NOTES TO THE FINANCIAL STATEMENTS
For the financial year ended 31 December 2008
45 segment information (cont’D)
2008 business segments (cont’d)
Resources Hotel PropertySecurities
TradingInvestment
HoldingCorporate/
Others Elimination Consolidated$’000 $’000 $’000 $’000 $’000 $’000 $’000 $’000
Segment Assets 378,545 288,590 881,407 6,881 107,073 170,776 - 1,833,272Investments in associates 69,706 - 6,261 - - - - 75,967Investments in joint ventures - 313 - - - - - 313
448,251 288,903 887,668 6,881 107,073 170,776 - 1,909,552Unallocated assets 21,273Total assets 1,930,825
Segment Liabilities 323,477 13,640 87,127 86 458 169,517 - 594,305Unallocated liabilities 87,390Total liabilities 681,695
Other segment information :Capital expenditures 33,947 52,581 15,317 - - - - 101,845Depreciation 5,913 10,283 712 - - - - 16,908Amortisation 3,955 186 - - - - - 4,141Impairment of goodwill 697 - - - - - - 697Impairment of plant and equipment 726 - - - - - - 726
Singapore Malaysia Indonesia AustraliaCorporate/
Others Elimination Consolidated$’000 $’000 $’000 $’000 $’000 $’000 $’000
Segment Revenue Revenue and income from external 147,415 970,891 50 109,833 21,914 - 1,250,103 Inter-segment revenue 772 339 164,480 - - (165,591) -Total Revenues 148,187 971,230 164,530 109,833 21,914 (165,591) 1,250,103
Other geographical information :Segment assets 1,260,811 269,779 167,536 126,383 8,763 - 1,833,272Investments in associates - 12,482 871 25,239 37,375 - 75,967Investments in joint ventures - - - 313 - - 313
1,260,811 282,261 168,407 151,935 46,138 - 1,909,552Unallocated assets 21,273Total assets 1,930,825
Capital expenditures 23,348 3,696 30,102 41,283 3,416 - 101,845

�������������������������������������������������������
��� ���
������������������
134NOTES TO THE FINANCIAL STATEMENTS
For the financial year ended 31 December 2008
�������������������������������������������������������
��� ���
������������������
45 segment information (cont’D)
2007 business segments
Resources Hotel PropertySecurities
TradingInvestment
HoldingCorporate/
Others Elimination Consolidated$’000 $’000 $’000 $’000 $’000 $’000 $’000 $’000
Segment Revenue Revenue from external 836,273 156,474 69,563 5,002 - - - 1,067,312 Inter-segment revenue - - 953 - - - (953) - Other items of income (41) - 3,625 20,181 10,145 8,040 - 41,950Total Revenues 836,232 156,474 74,141 25,183 10,145 8,040 (953) 1,109,262
Segment result 56,573 10,223 21,388 19,788 9,802 8,011 - 125,785Unallocated expenses (2,108)Profit from operations 123,677Exceptional gains, net 1,084 384,661 34,283 420,028Finance costs (7,532) (7,532)Share of profit from equity-accounted associates 493 37 530
Share of profit from equity-accounted joint ventures 102 102
Profit Before Tax from Continuing Operations 536,805
Income tax expense (39,569)Profit from Continuing Operations, net of tax 497,236
Attributable to Equity Holders of the Company, net of tax 484,957
Attributable to Minority Interests, net of tax 12,279
497,236
Segment Assets 367,417 195,791 852,165 97,104 409,081 300,749 - 2,222,307Investments in associates 6,067 - 5,449 - - - - 11,516Investments in joint ventures - 317 - - - - - 317
373,484 196,108 857,614 97,104 409,081 300,749 - 2,234,140Unallocated assets 17,175Total assets 2,251,315
Segment Liabilities 216,700 18,409 31,220 107 738 607 - 267,781Unallocated liabilities 89,378Total liabilities 357,159
Other segment information :Capital expenditures 12,909 11,362 13,057 - - - - 37,328Depreciation 6,097 8,493 761 - - - - 15,351Amortisation 3,474 195 - - - - - 3,669

�������������������������������������������������������
��� ���
�������������������������������������������������������������������������
��� ���
������������������
135NOTES TO THE FINANCIAL STATEMENTS
For the financial year ended 31 December 2008
45 segment information (cont’D)
2007 business segments (cont’d)
Singapore Malaysia Indonesia AustraliaCorporate/
Others Elimination Consolidated$’000 $’000 $’000 $’000 $’000 $’000 $’000
Segment Revenue Revenue and income from external 135,189 834,089 6,587 110,464 22,933 - 1,109,262 Inter-segment revenue 1,200 245 161,012 - - (162,457) -Total Revenues 136,389 834,334 167,599 110,464 22,933 (162,457) 1,109,262
Other geographical information :Segment assets 1,544,880 399,850 156,203 89,671 31,703 - 2,222,307Investments in associates - 11,516 - - - - 11,516Investments in joint ventures - - - 317 - - 317
1,544,880 411,366 156,203 89,988 31,703 - 2,234,140Unallocated assets 17,175Total assets 2,251,315
Capital expenditures 13,273 4,716 8,188 10,693 458 - 37,328

�������������������������������������������������������
��� ���
������������������
136NOTES TO THE FINANCIAL STATEMENTS
For the financial year ended 31 December 2008
�������������������������������������������������������
��� ���
������������������
46 subsiDiaries, associates anD Joint ventures
Country ofIncorporation Business
Effectiveshareholding %
Cost of investment
2008%
2007%
2008$’000
2007$’000
subsidiariesheld by the company :Australia Oriental Minerals NL** ˆ/ ˆˆ Australia Tin exploration 16 (a) - (a) 564 -Malaysia Smelting Corporation Berhad* Malaysia Tin mining & smelting 37 (b) 37 (b) 25,402 25,402Alimento Sendirian BerhadØ Malaysia Property 100 100 - -Atbara Holdings Private Limited Singapore Property 100 100 1,000 1,000Baxterley Holdings Private Limited Singapore Investment 100 100 20,000 20,000Bushey Park Private Limited Singapore Investment 100 100 29,992 29,992Glade Holdings Sendirian BerhadØ Malaysia Property 100 100 - -Malayan Securities Private Limited Singapore Investment 100 100 5,500 5,500Malayan Tin Smelting Company Sendirian Berhad*
Malaysia Investment 100 100 702 702
Merevale Holdings Private Limited Singapore Investment 100 100 40,000 10,000Rendezvous Hotels International Private Limited
Singapore Hotels & resorts management
80 80 80 80
STC International Private Limited Singapore Restaurant 100 100 - -STC Realty (Butterworth) Sendirian Berhad* Malaysia Property 100 100 10,979 10,979Straits Developments Private Limited Singapore Property 100 100 5,988 5,988Straits Equities Private Limited Singapore Investment 100 100 1,000 1,000Straits Holdings Private LimitedØ Singapore Investment 100 100 5,000 5,000Straits Media Private Limited Singapore Media Advertising 100 100 10,000 10,000Straits Trading Amalgamated Resources Private Limited
Singapore Investment 100 100 597 597
Straits Resource Management Private Limited Singapore Resource management 100 100 - -Sword Investments Private Limited Singapore Investment 100 100 5,000 5,000Sword Private Limited Singapore Investment 100 100 - -Walthamston Private LimitedØ Singapore Investment 100 100 5,000 5,000Wavertree Holdings Private Limited Singapore Investment 100 100 - -
166,804 136,240held through subsidiaries :Allegra Hotel Pty Ltd* Australia Hotel management 80 80Hotel Rendezvous Private Limited Singapore Hotel owning &
management100 100
Marque Hotels International Pty Limited * Australia Hotel management 80 80Rendezvous Hotels (Australia) Pty Ltd* Australia Hotels & resorts
management80 80
Rendezvous Hotels (NZ) Limited** New Zealand Hotel management 80 80Rendezvous Hotels Management Pty Ltd* Australia Hotel management 100 100Rendezvous India Hospitality Private Limited# India Hotel management 41 (c) -Rendezvous Properties Private Limited Singapore Property 100 100Straits Securities Private LimitedØ Singapore Investment 100 100Straits Tinfields Private Limited Singapore Tin Mining 100 100Straits Trading Private Limited Singapore Property 100 100Straits Trading Amalgamated Resources Sendirian Berhad*
Malaysia Investment 100 100
Straits Unit Trust* Australia Property Trust 100 100Sword Properties Pty Ltd* Australia Trustee Company 100 100Sword Unit Trust* Australia Property Trust 100 100Unicorn Square Limited Singapore Property 100 100Rendezvous Hotels Asia Private Limited Singapore Hotels & resorts
management80 80

�������������������������������������������������������
��� ���
�������������������������������������������������������������������������
��� ���
������������������
137NOTES TO THE FINANCIAL STATEMENTS
For the financial year ended 31 December 2008
46 subsiDiaries, associates anD Joint ventures (cont’D)
Country ofIncorporation Business
Effectiveshareholding %
Cost of investment
2008%
2007%
2008$’000
2007$’000
subsidiariesheld through subsidiaries :Shanghai Rendezvous Hotels Management Co Ltd **
People’s Republic of China
Hotels & resorts management
80 80
Malaysia Smelting Corporation (Warehousing) Sdn. Bhd. * ˆ ˆ
Malaysia Tin warehousing 73 73
MSC Properties Sdn. Bhd. * ˆ ˆ Malaysia Property holding and rental
73 73
Rahman Hydraulic Tin Sdn. Bhd. ** ˆ ˆ Malaysia Tin mining 73 73Bemban Corporation Ltd. * ˆ ˆ British Virgin
IslandsInvestment holding 73 73
Kajuara Mining Corporation Pty. Ltd.* ˆ ˆ Australia Investment holding 73 73PT Bangka Resources** ˆ ˆ Indonesia Dormant 73 73PT MSC Indonesia* ˆ ˆ Indonesia Tin exploration and
mining73 73
PT Koba Tin* ˆ ˆ Indonesia Tin mining and smelting 55 55PT SRM Indonesia** Indonesia Resource management 100 (e) 100 (e)PT Tenaga Anugerah** ˆ ˆ Indonesia Off-shore tin mining 44 (f) 44(f)
associatesheld by the company :Johan Kekal Sendirian Berhad ** Malaysia Property development 45 45 1,123 1,123Taiko-Straits Developments Sdn. Bhd.* Malaysia Property development 30 30 2,462 2,462
3,585 3,585held through subsidiaries :Asiatic Coal Pte Ltd ˆ ˆ Singapore Investment holding 36 (d) -Asian Mineral Resources Limited** ˆ ˆ New Zealand (i) Exploration and
development of mineral property interests (ii)
13 (g) -
Beaconsfield Gold NL** ˆ ˆ Australia Mining and refining of gold, and exploration of base metals
16 (h) -
Guilin Hinwei Tin Co Ltd** ˆ ˆ China Smelting, refining and sales of tin and tin products
26 -
Redring Solder (M) Sdn. Bhd.* ˆ ˆ Malaysia Manufacture and sale of solder products
29 29
Joint venturesheld through subsidiaries :Coastal Coffees Pty Ltd ** Australia Restaurant 50 50
The subsidiaries and associates are audited by Ernst & Young LLP, Singapore unless stated otherwise. * Audited by member firms of Ernst & Young Global in the respective countries. ** These subsidiaries, associates and joint ventures are audited by other firms of auditors. ˆ A company listed on Australian Stock Exchange Ltd. ˆ ˆ Subsidiaries/Associates of Malaysia Smelting Corporation Berhad (MSC), a company listed on the Main Board of Bursa Malaysia
Securities Berhad. Ø These subsidiaries are in voluntary liquidation.

�������������������������������������������������������
��� ���
������������������
138NOTES TO THE FINANCIAL STATEMENTS
For the financial year ended 31 December 2008
�������������������������������������������������������
��� ���
������������������
46 subsiDiaries, associates anD Joint ventures (cont’D)
# The company is incorporated in October 2008 and hence the accounts are not audited.
(i) Asian Mineral Resources Limited was orginally incorporated in New Zealand in year 1988 and was subsequently incorporated under the laws of the Province of British Columbia, Canada by a certificate of continuance as of December 2004.
(ii) Its principal mineral property interest, held through a joint venture is in Ban Bhuc Project area located in Son La Province, in northwestern Vietnam.
(a) Direct interest held jointly with other subsidiaries is 58% (2007 : 67% - Held through subsidiaries). (b) Combined interest held jointly with other subsidiaries and an associate is 73% (2007 : 73%). (c) Direct interest held by Rendezvous Hotels International Private Limited is 51%. (d) Direct interest held by Australia Oriental Minerals NL and MSC is 30% each. (e) The effective shareholding includes 1% interest held in trust by an individual. (f ) Direct interest held by MSC Group is 60% (2007 : 60%). (g) Direct interest held by MSC is 18%. MSC exercises significant influence by virtue of its contractual right to appoint director to the
Board of this associate. (h) Direct interest held by MSC is 22%.

�������������������������������������������������������
��� ���
�������������������������������������������������������������������������
��� ���
������������������
139SHAREHOLDER INFORMATION
voting rights
Shareholders’ voting rights are set out in Article 72 of the Company’s Articles of Association :
On a show of hands, every member present in person or by proxy shall have one vote and upon a poll, every member present in person or by proxy shall have one vote for every share which he holds.
orDinarY shares anD shareholDers as at 11 march 2009
size of holdingsno. of
shareholders %no. of
shares held %
1 - 999 1,041 27.79 330,066 0.101,000 - 10,000 2,230 59.53 7,057,762 2.1710,001 - 1,000,000 470 12.55 21,001,913 6.441,000,001 and above 5 0.13 297,507,259 91.29
3,746 100.00 325,897,000 100.00
twentY largest shareholDers as at 11 march 2009
registered shareholders no. of shares %
1. Raffles Nominees Private Limited 290,014,044 88.992. Loke Wan Yat Realty Sendirian Berhad 2,519,632 0.773. University of Malaya 1,999,992 0.614. Citibank Nominees Singapore Private Limited 1,816,292 0.565. HSBC (Singapore) Nominees Private Limited 1,157,299 0.366. United Overseas Bank Nominees Private Limited 864,844 0.277. DBS Nominees Private Limited 627,464 0.198. UOB Nominees (2006) Private Limited 599,608 0.189. Mayban Nominees (Singapore) Private Limited 597,768 0.1810. Loke Yuen Kin Ruby 424,841 0.1311. Choo Meileen 414,432 0.1312. Hoo Yan Meng 410,184 0.1313. Royston Holmes 410,000 0.1314. Au Yong Ah Ngoh 396,984 0.1215. Teo Soo Chuan (Private) Limited 345,300 0.1116. Lim & Tan Securities Private Limited 238,636 0.0717. Choo Yuen Theng 236,393 0.0718. Cheah Siew Hoon Rosie 234,127 0.0719. Estate of Lim Koon Ee @ Eileen Khoo, Deceased 227,436 0.0720. Sungei Pertang Estate Sendirian Berhad 207,600 0.06
303,742,876 93.20

�������������������������������������������������������
��� ���
������������������
140SHAREHOLDER INFORMATION
�������������������������������������������������������
��� ���
������������������
substantial shareholDers
no. of sharesDirect interest Deemed interest %
The Cairns Private Limited 289,839,552 - 88.94Raffles Investments Limited - 289,839,552 * 88.94Aequitas Private Limited - 289,839,552 * 88.94Siong Lim Private Limited - 289,839,552 * 88.94Tecity Private Limited - 289,839,552 * 88.94Dr Tan Kheng Lian 4,860 289,839,552 * 88.94
* Deemed to have an interest in the shares held by The Cairns Private Limited.
percentage of shareholDing helD bY the public as at 11 march 2009
As at 11 March 2009,10.99% of the issued share capital of the Company was held by the public and thus, Rule 723 of the SGX Listing Manual has been complied with.

�������������������������������������������������������
��� ���
�������������������������������������������������������������������������
��� ���
������������������
141NOTICE OF MEETING
NOTICE IS HEREBY GIVEN that the Annual General Meeting of members of The Straits Trading Company Limited will be held at Straits Ballroom, Level 2, Rendezvous Hotel, Singapore, 9 Bras Basah Road, Singapore 189559 on Tuesday, 28 April 2009 at 10.00 a.m. for the following business :
1 To receive and consider the report of the Directors and the financial statements for the year ended 31 December 2008.
2 To re-elect the following Directors :
(a) Mr Razman Ariffin who retires by rotation pursuant to Article 99 of the Articles of Association of the Company.(b) Ms Chew Gek Hiang who retires pursuant to Article 103 of the Articles of Association of the Company.(c) Mr David Goh Kay Yong who retires pursuant to Article 103 of the Articles of Association of the Company.
Note: Ms Chew Gek Hiang, if re-appointed, will continue as a member of the Audit Committee and will be considered as a non-independent director.
3 To consider and, if thought fit, pass resolution pursuant to Section 153(6) of the Companies Act, Cap.50, to re-appoint Mrs Elizabeth Sam as Director of the Company to hold office until the next Annual General Meeting of the Company.
4 To approve the payment of Directors’ fees of S$911,313 for the year ended 31 December 2008 (2007 : S$852,169).
5 To appoint auditors and to authorise the Board to fix the remuneration of the auditors.
6 As Special Business :
To consider and, if thought fit, pass the following resolution as an Ordinary Resolution :
“That authority be and is hereby given to the Directors of the Company to :
(a) (i) issue shares in the capital of the Company (“shares”) whether by way of rights, bonus or otherwise; and/or
(ii) make or grant offers, agreements or options (collectively, “instruments”) that might or would require shares to be issued, including but not limited to the creation and issue of (as well as adjustments to) warrants, debentures or other instruments convertible into shares,
at any time and upon such terms and conditions and for such purposes and to such persons as the Directors may in their absolute discretion deem fit; and
(b) (notwithstanding the authority conferred by this Resolution may have ceased to be in force) issue shares in pursuance of any Instrument made or granted by the Directors while this Resolution was in force,
provided that :
(1) the aggregate number of shares to be issued pursuant to this Resolution (including shares to be issued in pursuance of Instruments made or granted pursuant to this Resolution) does not exceed 50% of the issued shares in the capital of the Company (as calculated in accordance with sub-paragraph (2) below), of which the aggregate number of shares to be issued other than on a pro-rata basis to shareholders of the Company (including shares to be issued in pursuance of Instruments made or granted pursuant to this Resolution) does not exceed 20% of the issued shares in the capital of the Company (as calculated in accordance with sub-paragraph (2) below);

�������������������������������������������������������
��� ���
������������������
142NOTICE OF MEETING
(2) (subject to such manner of calculation as may be prescribed by the Singapore Exchange Securities Trading Limited) for the purpose of determining the aggregate number of shares that may be issued under sub-paragraph (1) above, the percentage of issued shares shall be based on the number of issued shares in the capital of the Company at the time of the passing of this Resolution, after adjusting for :
(a) new shares arising from the conversion or exercise of any convertible securities or share options or vesting of share awards which are outstanding or subsisting at the time of the passing of this Resolution; and
(b) any subsequent consolidation or subdivision of shares;
(3) in exercising the authority conferred by this Resolution, the Company shall comply with the provisions of the Listing Manual of the Singapore Exchange Securities Trading Limited for the time being in force (unless such compliance has been waived by the Singapore Exchange Securities Trading Limited) and the Articles of Association for the time being of the Company; and
(4) (unless revoked or varied by the Company in general meeting) the authority conferred by this Resolution shall continue in force until the conclusion of the next Annual General Meeting of the Company or the date by which the next Annual General Meeting of the Company is required by law to be held, whichever is the earlier.”
7 To transact any other ordinary business of the Company.
By Order of the Board
emily teo (ms)secretary
Singapore11 April 2009
notes :
A member of the Company is entitled to appoint a proxy to attend the meeting and vote in his stead. A proxy need not be a member of the Company. Proxy forms must be deposited at the Company’s registered office not less than 48 hours before the time for holding the meeting or any adjournment thereof.
additional information relating to notice of annual general meeting :
The Ordinary Resolution in item 6 above, if passed, will renew the authority for the Directors, effective until the next Annual General Meeting, to issue shares, make or grant instruments convertible into shares and to issue shares pursuant to such instruments, up to an amount not exceeding, in total, 50% of the issued shares in the capital of the Company, of which up to 20% may be issued other than on a pro-rata basis to shareholders. For determining the aggregate number of shares that may be issued, the percentage of issued shares in the capital will be calculated based on the number of issued shares in the capital of the Company at the time that this Resolution is passed, after adjusting for new shares arising from the conversion or exercise of any convertible securities or share options or vesting of share awards which are outstanding or subsisting at the time that this Resolution is passed, and any subsequent consolidation or subdivision of shares.

�������������������������������������������������������
��� ���
������������������
I/We, (Name) of
(Address)
being a member/members of THE STRAITS TRADING COMPANY LIMITED hereby appoint :
name address nric/passport number
proportion ofshareholdings (%)
and/or (delete as appropriate)
name address nric/passport number
proportion ofshareholdings (%)
as my/our proxy/proxies to vote for me/us on my/our behalf, at the Annual General Meeting of the Company, to be held at Straits Ballroom, Level 2, Rendezvous Hotel, Singapore, 9 Bras Basah Road, Singapore 189559, on Tuesday, 28 April 2009 at 10.00 a.m., and at any adjournment thereof. I/We direct my/our proxy/proxies to vote for or against the Resolutions to be proposed at the Meeting as indicated hereunder. If no specific direction as to voting is given, the proxy/proxies will vote or abstain from voting at his/their discretion, as he/they will on any other matter arising at the Meeting.
no. resolutions for against
1. To adopt Directors’ Report and Audited Financial Statements.2. To re-elect Directors retiring under the Articles of Association :
(a) Mr Razman Ariffin(b) Ms Chew Gek Hiang(c) Mr David Goh Kay Yong
3. To re-appoint Mrs Elizabeth Sam pursuant to Section 153(6) of Companies Act, Cap.50.4. To approve Directors’ fees.5. To appoint Auditors and to authorise Directors to fix their remuneration.6. To empower Directors to issue shares pursuant to Section 161 of the Companies Act, Cap.50.7. Any other business.
Dated this ____________ day of __________________ 2009
Total Numberof Shares
_______________________________________Signature(s) of Member(s)/Common Seal
important : please read notes overleaf
the straits traDing companY limiteD(A member of The Tecity Group)(Company Registration No.: 188700008D)Incorporated in Singapore in 1887
proxY form important :1. For investors who have used their CPF monies to buy THE STRAITS
TRADING COMPANY LIMITED shares, this Annual Report is sent solely FOR INFORMATION ONLY.
2. This Proxy Form is not valid for use by CPF investors and shall be ineffective for all intents and purposes if used or purported to be used by them.

notes
1. A member entitled to attend and vote at the Meeting is entitled to appoint one or two proxies to attend and vote in his stead. Such proxy need not be a member of the Company.
2. Where a member appoints two proxies, the appointments shall be invalid unless he specifies the proportion of his holding (expressed as a percentage of the whole) to be represented by each proxy.
3. A member should insert the total number of shares held. If the member has shares entered against his name in the Depository Register (as defined in Section 130A of the Companies Act, Cap.50 of Singapore), he should insert that number. If the member has shares registered in his name in the Register of Members of the Company, he should insert that number. If the member has shares entered against his name in the Depository Register and registered in his name in the Register of Members, he should insert the aggregate number. If no number is inserted, the instrument appointing a proxy or proxies will be deemed to relate to all the shares held by the member.
4. The instrument appointing a proxy or proxies must be deposited at the registered office of the Company at 18 Cross Street, #15-01, Singapore 048423 not less than 48 hours before the time set for holding the Meeting.
5. The instrument appointing a proxy or proxies must be under the hand of the appointor or of his attorney duly authorised in writing. Where the instrument appointing a proxy or proxies is executed by a corporation, it must be executed under its common seal or under the hand of an attorney duly authorised in writing.
6. Where an instrument appointing a proxy or proxies is signed on behalf of the appointor by an attorney, the letter or power of attorney or a duly certified copy thereof must (failing previous registration with the Company) be lodged with the instrument of proxy, failing which the instrument may be treated as invalid.
general
The Company shall be entitled to reject the instrument appointing a proxy or proxies if it is incomplete, improperly completed, illegible or where the true intentions of the appointor are not ascertainable from the instructions of the appointor specified in the instrument appointing a proxy or proxies. In addition, in the case of shares entered in the Depository Register, the Company may reject any instrument appointing a proxy or proxies if the member, being the appointor, is not shown to have shares entered against his name in the Depository Register as at 48 hours before the time appointed for holding the Meeting, as certified by The Central Depository (Pte) Limited to the Company.

Designed & produced by Credence Partnership

Address 18 Cross Street, #15-01, Singapore 048423Telephone (65) 6513 9288Facsimile (65) 6534 7202Website http://www.stc.com.sgEmail [email protected]
Company Registration No: 188700008D
The Straits Trading Company Limited(A member of The Tecity Group)