the nexus between climate negotiations and low-carbon ... · a geopolitics of renewable energy...
TRANSCRIPT

WorkingPaper2019‐1
The nexus between climate negotiations and low-carbon innovation:
AGEOPOLITICSOFRENEWABLEENERGYPATENTS
BY Clément BONNET, Samuel CARCANAGUE,
Emmanuel HACHE, Gondia Sokhna SECK, Marine SIMOËN
AGEOPOLITICSOFRENEWABLEENERGYPATENTS/ 2019-1
2
This article received the financial support of the French National Research Agency (ANR) and is part of the GENERATE (Renewable Energies Geopolitics and Future Studies on Energy Transition) Project.
Authors
Dr Clément Bonnet, IFP Energies nouvelles (Corresponding author) : [email protected] Samuel Carcanague, IRIS : [email protected] Dr Emmanuel Hache, IFP Energies nouvelles (Project Leader) : [email protected] Dr Gondia Sokhna Seck, IFP Energies nouvelles : [email protected] Marine Simoën, IFP Énergies nouvelles : [email protected]
The authors are very grateful to François Kalaydjian and Jérôme Sabathier for insightful comments and suggestions. Of course, any remaining errors are ours. The views expressed herein are strictly those of the authors and are not to be construed as representing those of IFP Énergies Nouvelles and IRIS.

AGEOPOLITICSOFRENEWABLEENERGYPATENTS/ 2019-1
3
ABSTRACT
Intellectual property is a central issue in the climate negotiations.On the one hand, it
shapes and encourages innovation in low‐carbon technologies. On the other hand, it
reducesaccess tothesetechnologiesbygivingpatentholdersmarketpower.Weanalyze
theinteractionsbetweenclimatenegotiationsandtheacquisitionofpatentsonrenewable
energy technologies.First,we recall thegeopoliticalnatureof intellectualpropertyand
explainhowitismodifiedbytheparticularitiesoflow‐carboninnovation.Thesecondpart
of this article is devoted to an inventory of the production of inventions in renewable
energy technologies (RETs). In particular, we focus on the relative technological
advantagesofcountriesandthevalueofpatentedinventions.Majorchangesareobserved
in the geographical distribution of low‐carbon innovation during the 2000s and they
foreshadow a reorganization of the geopolitical balances of innovation in renewable
energies.
Keywords:Patentdata,energytransition,renewableenergytechnology,innovation,international
relations.
JELClassification:Q42,Q55,O31,O38.

AGEOPOLITICSOFRENEWABLEENERGYPATENTS/ 2019-1
4
INTRODUCTION
The consequences of global warming will affect all countries (Stern et al., 2006). And
because atmospheric temperature has the characteristics of a public good, its protection
requires countries to commit to reducing their Greenhouse Gas (GHG) emissions. This
way of thinking about climate change is well known and places international climate
negotiations, conducted within the framework of the UNFCC,1 at the core of all hopes in
the fight against climate change. However, the willingness shown by most States to make
each Conference of Parties (COP) a success contributes to partially conceal the
geopolitical mechanisms that drive these negotiations. Thus, after the failure of COP 15
in Copenhagen in 2009, US President Obama welcomed a significant agreement, "one
thattakesusfartherthanwehaveevergonebeforeasaninternationalcommunity", and
welcomed the fact that the United States (US) had renewed their leadership in the
international climate negotiations.2 More recently, COP 21 was almost unanimously
hailed as a success by both governments and most media (Bodansky, 2016).
However, facts are stubborn and there remain significant doubts about the achievement
of the objectives of the Paris Agreement. The national contributions pledged by States at
COP 21 would lead to an average global warming between 2.6°C and 3.1°C above pre-
industrial levels (Rogelj et al., 2016). More, their revisions following ratification of the
agreement by a significant proportion of the countries concerned would likely limit
global warming below 3.5°C.3 Three major risks compromise the achievement of the
objectives of COP 21 (Peters et al., 2017): the low level of emission reduction
commitments made so far, the low deployment rate of low-carbon technologies and the
centrality of the so-called negative emission technologies, which are crucial in most
scenarios but remain largely hypothetical at the moment.4 It is also worth mentioning
the non-linearity of the GHG emission reduction costs which considerably increases
1 United Nations Framework Convention on Climate Change 2 By way of comparison, the President was greeted on his arrival on the last day of the negotiations by Hilary Clinton with the words "Mr. President, this is the worst meeting I've been to since the eight-grade student council" (Meilstrup, 2010). 3 https://climateactiontracker.org/global/temperatures/ 4 On this point, simulation exercises show that if these technologies cannot be deployed on a large scale, short-term actions must be significantly more ambitious than those announced so far (Larkin et al., 2018). Some authors speak of a bet made on the future, given the great uncertainties about negative-emitting technologies (Fuss et al., 2014).

AGEOPOLITICSOFRENEWABLEENERGYPATENTS/ 2019-1
5
financing needs after 2030; the commitments made at COP 21 do not go beyond that
date (Rose et al., 2017).
In many cases, these risks are related to low-carbon technology and its widespread
diffusion. It results that a limited diffusion of low-carbon technology may contribute to
considerably increase mitigation costs of limiting global warming (Iyer et al., 2015). This
is not surprising since the energy transition to combat global warming can be described
as a technological revolution (Criekemans, 2018). To understand the gap between the
objectives of the international community and the concrete actions of governments, it is
necessary to understand the geopolitical issues related to low-carbon technologies and
how they can influence the evolution of climate negotiations. In this article, we will focus
more particularly on renewable energy technologies (RETs) because they are both at the
core of policies to reduce energy production-related GHG emissions and perceived as
very dynamic sectors in terms of innovation. Our analysis of the geopolitics of RETs
highlights the role of intellectual property. On the one hand, the history of intellectual
property systems shows that they have created major geopolitical issues between
countries since they determine the exclusivity rights that shape production and access to
technology. On the other hand, intellectual property on low-carbon technologies is
subject to additional geopolitical tensions as it is intrinsically linked to international
negotiations. In the first part of this article, we analyze in detail the geopolitical nature of
intellectual property, the interactions of low-carbon innovation with climate
negotiations and emphasize the importance of the role of public authorities. Indeed,
innovation in RETs is very largely dependent on public authorities that have historically
played a key role in the energy sector and in financing innovation, and for which
innovation in RETs crosses energy security issues. In the second part of this article, we
present an overview of the dynamics of innovation in the RETs sectors and the
positioning of leading countries in these technologies. Based on the analysis of patent
data, we observe that innovation in RETs has quickened steeply and is linked to oil price
movements. This acceleration has been particularly strong in several Asian countries
and it questions the future evolution of the competitiveness of Western countries.
Historically, some have been the main innovators in these technologies. Our analyses
conclude that while these countries still maintain their leading positions in the creation
of high-value innovations, countries such as China, South Korea and Taiwan seem to be

AGEOPOLITICSOFRENEWABLEENERGYPATENTS/ 2019-1
6
on the way to catch up in these technologies and are showing a desire to become key
players in innovation in the RETs.
The article is structured as follows. Section 2 explains the place of low-carbon
innovation in the global economy. It starts with emphasizing the importance of
technology in the energy transition (Subsection 2.1.) and then explains why low-carbon
innovation support can be interpreted as a manifestation of States strategies (Subsection
2.2.). Drawing on this, Section 3 examines the geopolitics of intellectual property by
discussing the geopolitical dimension of patents in Subsection 3.1. The co-evolution of
the low-carbon innovation and the international negotiations on climate is the subject of
the Subsection 3.2. Then, how it is related to energy security issues is analyzed in
Subsection 3.3. Section 4 presents an empirical analysis of renewable energy patents.
The methodology and the data are described in Subsection 4.1. The general trends of
low-carbon innovation are discussed in Subsection 4.2. Subsection 4.3. analyzes the
revealed technical advantages of several major countries while the value of RETs patents
are investigated in Subsection 4.4. Section 5 discusses our results and concludes.
LOW‐CARBONINNOVATIONINTHEINTERNATIONALECONOMY
Energy transition: will access to technology outweighacesstoresources?
While the low-carbon energy transition requires major changes in consumption habits
and a deep transformation in the economic organization of energy production and
distribution, the decarbonization process remains conditional on a radical change in the
technological base of the energy system. In 2015, 67% of the world’s total final energy
consumption was of fossil origin5 (IEA, 2018). This share must drastically decrease in
order to limit the global warming of the average temperature to 2 degrees Celsius with a
5 Link toward data : https://www.iea.org/statistics/?country=WORLD&year=2015&category=Key%20indicators&indicator=TPESbySource&mode=chart&categoryBrowse=false&dataTable=BALANCES&showDataTable=true

AGEOPOLITICSOFRENEWABLEENERGYPATENTS/ 2019-1
7
probability of 66-100% by 2100. In this scenario,6 emissions from the overall energy
supply sector must be reduced by 90% or more between 2040 and 2070 compared to
their 2010 levels (IPCC, 2014). These figures remind us that the fight against global
warming requires a wide diffusion of RETs.
Atechnologicallyintensivetransition
As Criekemans (2018) points out, the energy transition from fossil to RETs reinforces
the role of technology. This is due to the fact that solar, wind or hydraulic are flow
energies that are almost freely available but need to be converted into useful energy
with help of technology (Criekemans, 2018). At the contrary, fossil fuel must be
extracted from the ground before being transformed. Hence the cost structures of these
two technological families are very different. This difference between the two
technological families is illustrated by the work carried out by the IEA in the 'Projected
Cost of Generating Electricity 2015' report. The average cost of electricity7 produced by
a combined cycle power plant using natural gas as the primary energy source increases
by about 35% when the cost of fuel increases by 50%. At the contrary, the average cost
of electricity from solar or wind installations depends only on the cost of the power
plant, its lifetime, the quality of the resource and the efficiency of its conversion into
electricity; the two latter determinants being synthesized by the capacity factor. The
main challenge is no longer the access to energy resources, but their conversion at a
competitive cost into energy that can be exploited by humans, thanks to technology.
It is this difference that leads Criekemans (2018) to consider the transition to RETs as a
technological revolution. This technological nature of the low-carbon transition places
Research and Development policies and intellectual property rights (IPR) at the core of
climate policies. Indeed, the former is at the forefront of the innovation process and the
latter constitutes the institutional framework that determines the incentives for the
players to innovate and the ease of access to new technologies. We detail here the
dynamics of R&D expenditure, before analyzing in more details the issues specific to IPR
6 The IPCC names this scenario the RCP2.6. 7 Computations made using a 7% discount rate.

AGEOPOLITICSOFRENEWABLEENERGYPATENTS/ 2019-1
8
in the next section. Figure 1 shows the evolution of the share of RD&D (Research,
Development and Demonstration) expenditures allocated to RETs in total RD&D for the
energy sector in four countries.8 These countries are chosen for their innovation
performances and for the quality of available data, which many countries do not
communicate because of the strategic nature of RD&D, and for its collection difficulties.
Figure1:ChangesintheshareofRD&Dexpenditureintheenergysectorthatare
dedicatedtorenewableenergies,in%.
Source:IEA,RD&Dbudgetsstatistics.
Before global warming became a serious concern for governments, the first oil shock
triggered support for innovation in RETs and energy efficiency technologies in several
countries. This was the case in the US in particular, as shown by the increase in the share
of expenditure allocated to RETs which began in 1974, before decreasing after 1981.
Canada, absent from the graph for the sake of readability, has followed a very similar
path by massively supporting innovation in RETs in response to the first oil shock. This
reaction was only short-lived: the share of RD&D expenditure for RETs decreased from
17.4% in 1981 to 4% in 1986, before increasing again at the end of the 1990s in
8 Data presented in Figure 1 are drawn from the IEA ‘Detailed country RD&D budgets’. The energy sector includes seven technology groups: energy efficiency, fossil fuels, RETs, nuclear energy, hydrogen and fuel cells, the conversion, transmission and storage of energy and transversal technologies (related to the analysis of energy systems for instance). Solar energy, wind energy, ocean energy, biofuels, geothermic energy and hydraulic energy are included in the RETs group.
0
10
20
30
40
50
60
1974
1976
1978
1980
1982
1984
1986
1988
1990
1992
1994
1996
1998
2000
2002
2004
2006
2008
2010
2012
2014
2016
UnitedStates
Germany
France
Denmark

AGEOPOLITICSOFRENEWABLEENERGYPATENTS/ 2019-1
9
response to climate concerns. The importance given to RETs in the national R&D
strategy also seems to be related to nuclear power. In Denmark for instance, the decision
to ban the production of nuclear energy has been taken in 1985 by the Danish
Parliament (OECD, 2015). Following this decision, a major increase in the share of R&D
allocated to RETs was observed. Similarly, the Chernobyl accident has had a major
impact on the German R&D strategy in the energy sector. Indeed, it happened in the
context of an intense debate on the place of nuclear power in the energy mix. Following
the accident, opposition from the public opinion dramatically increased and R&D for
RETs was raised (Jacobsson and Lauber, 2006). Other countries, such as France, started
later to redirect their RD&D expenditures towards RE. This is also the case in the United-
Kingdom, where this share rose from 9% in 2000 to 15.9% in 2016.
Low‐carboninnovationasamanifestationofStatesstrategies
Geo-economics, now considered as a branch of international relations analysis, has its
origins in the thesis defended by Edward Luttwak in his book "From Geopolitics to Geo-
Economics. Logics of Conflict, Grammar of Commerce" (1990). In this controversial book
written after the short "unipolar moment" of international relations, the author defends
the idea that at the end of the Cold War, the economic weapon would replace the
military weapon. As a result, States' strategies to expand and strengthen their power
would be translated into the terms of international trade. In particular, Luttwak
considered that the weapon of choice for geo-economics is the technological superiority
that states can acquire by providing R&D funding. As Lorot points out, if geo-economics
suffers from several methodological limitations,9 it makes it possible to account for the
role played by economic forces in global geopolitics (Lorot, 2008). However, a careful
analysis should avoid the pitfalls of simplifying geopolitical phenomena solely to the
economic policies of States. Regarding low-carbon innovation, it is tightly linked to
public support for several reasons.
9 In his book, Luttwak takes a clear-cut position on geo-economics. For example, he considers that if the State intervenes, it is no longer "pure sugar" economics but geo-economics (Luttwark, 1990, p. 34). In addition, there is the constantly renewed analogy in these writings between war and economics. This has contributed to geo-economics being considered as a simplified version of the doctrine of realism in international relations. For a discussion of the criticisms and strengths of geo-economics, see Vihma, (2018).

AGEOPOLITICSOFRENEWABLEENERGYPATENTS/ 2019-1
10
Innovation,energy,low‐carbontransitionandtheState
The production of low-carbon innovation is a phenomenon that lies at the intersection of
technological change and energy production. For this reason, it is largely influenced by
States strategies. Indeed, despite the wave of liberalization that began during the
Thatcher-Reagan period in the 1980s, the energy sectors remained strongly linked to the
public authorities (Pollitt, 2012). Based on the interviews submitted by the OECD to
multiple governments,10 we can observe that in 2013, 38 countries out of 46 interviewed
stated that the largest firm in the national electricity generation sector was partly owned
by the government. In 92% of cases, the public authorities held more than 50% of the
firm in question, in 42% of cases the firm was wholly owned by the public authorities.
More generally, major technological transformations are directly linked to fundamental
research and public funding. Mazzucato's work has thus shown the importance of the
State in the dynamics of innovation and its long-term impact (Mazzucato, 2013). Finally
innovation in low-carbon technologies is, compared to other sectors, more dependent on
public intervention as there is no powerful enough price signal in the economy for
private innovation projects to be driven by market logic. In Europe, the implementation
of the EU Emission Trading Scheme (ETS) was intended to provide a price signal strong
enough to stimulate low-carbon innovation. An ex-post analysis of this instrument finds
that regulated firms did innovate more after the implementation of the scheme (Calel
and Dechezleprêtre, 2015). Supports for innovation in low-carbon technologies are
therefore crucial and can be achieved by combining demand-pull policies (e.g. feed-in
tariffs for electricity from RE) and supply-push policies (e.g. competitiveness clusters,
R&D subsidies) (Nemet, 2009). The support provided by these instruments greatly
varies in intensity depending on the type of technology supported. Thus, the history of
innovation support in RETs shows that States are not technologically neutral.
For these three reasons: (1) the weight of the State in the energy sectors, (2) the decisive
role of public authorities in financing innovation and (3) the lack of technological
10 See Koske et al, (2015). Databases containing responses to surveys are freely accessible: http://www.oecd.org/eco/growth/indicatorsofproductmarketregulationhomepage.htm

AGEOPOLITICSOFRENEWABLEENERGYPATENTS/ 2019-1
11
neutrality in the support provided to low-carbon technologies, low-carbon innovation
can be seen as a manifestation of the geo-economic strategies put in place by the States.
In this context, we conduct an empirical analysis of these strategies using patent data
statistics in Section IV.
INTELLECTUAL PROPERTY AT THE CORE OF RENEWABLE ENERGYGEOPOLITICS
1. Thegeopoliticaldimensionofpatents
The notion of intellectual property refers on the one hand to literary or artistic property
and on the other hand to industrial property. It is the latter that frames the inventions
made in the RETs sectors. Industrial property is a legal framework that confers a
temporary monopoly on the exploitation of an invention, model or trademark. Its
principle follows a trade-off logic: the temporary monopoly right allows the inventor to
benefit from a dominant position and thus to generate an economic rent by being able to
fix higher prices than in a competitive situation. In return, the property right is granted
only if the invention is described in sufficient details so that the novelty it contains is
accessible to society as a whole.
Earlypatentsystemsandeconomicprotectionism
The first form of patent was introduced in the Maritime Republic of Venice and the first
patent law was passed in 1474 (Lapointe, 2000). The patent system was then seen as a
mean to encourage innovation, but also as a protectionist instrument to stimulate
inventors to develop their activities within the borders of the republic. In the rest of
Europe, similar systems were emerging to attract inventors and localize the production
of new technologies in the country. Several historical examples illustrate this
geopolitical dimension of industrial property. For example, the US refused in the 19th
century to recognize the validity of European patents before they could compete
technologically (Dulong de Rosnay and Le Crosnier, 2013). Japan implemented its first
patent law in 1885 which, in its original form, excluded foreigner inventors (Galvez-

AGEOPOLITICSOFRENEWABLEENERGYPATENTS/ 2019-1
12
Behar, 2016); which shows that a patent system is closely linked to a country’s economic
strategy.
Theinternationalconvergenceofnationalpatentsystems
It was in 1883 that an international regulation emerged with the signature of the Paris
Convention for the Protection of Intellectual Property. It coincides with a strong
acceleration of the implementation of patent legislation. As Galvez-Behar (2016) said,
half of the countries with patent laws in 1901 introduced them between 1880 and 1900.
This trend is explained in particular by the dissemination of these legislations by the
colonial powers within their empires. The Convention was initially signed by eleven
countries which undertook, on the one hand, to strengthen their industrial property
systems and, on the other, to harmonize their national standards.11 The second aspect is
decisive since it established the priority right that guarantees any inventor who files a
patent in one of the signatory countries a period of twelve months during which she or
he can take the necessary steps to obtain protection in any of the other countries of the
Union of Paris. Inventors therefore did not need to file their applications simultaneously
in all patent offices since they were assured that no other individual could file an
application in those countries for the same invention during the granted period. By
September 2014, 174 countries had signed the Convention. During the 20th century, the
internationalization and harmonization of intellectual property rules increased with the
creation of an international patent classification (1954), the signature of the
International Patent Cooperation Union Treaty (1970), the establishment of the
European Patent Organization (1973), and the entry into force of the Agreement on
Trade-Related Aspects of Intellectual Property Rights (1995).
While in the early stages of industrial property, geopolitical tensions between States
were reflected in the heterogeneity of their national legislations, internationalization
and homogenization of rules have contributed to the accumulation of patents with high
economic and/or technological value becoming a way for States to establish their
11 These countries are Belgium, Brazil, Spain, France, Guatemala, Italy, Netherland, Portugal, Salvador, Serbia and Swiss.

AGEOPOLITICSOFRENEWABLEENERGYPATENTS/ 2019-1
13
political and economic powers. These tensions are particularly acute when the issue of
developing countries' access to key technologies, such as health, arises.
Tensions over the role of Intellectual Property Rights (IPR) in thetransferoftechnology
The assessment of the impact of intellectual property on development was the subject of
a commission led by Professor John Barton and was convened at the request of the
United-Kingdom in 2001. The commission concluded that "describing [industrial
property rights] as “rights” should not be allowed to conceal the very real dilemmas
raised by their application in developing countries, where the extra costs they impose
may be at the expense of the essential prerequisites of life for poor people". (reported in
Dulong de Rosnay and Le Crosnier, 2013). An episode revealing the geopolitical issues
related to the rules of industrial property was the one registered during the meeting of
the members of the WHO (World Health Organization) in 2012, which followed the
publication of the Organization’s report putting forward a number of ideas on the
definition of a joint R&D programme on so-called neglected diseases. The Organisation
has concluded that research projects carried out by major pharmaceutical companies,
guided by profit-seeking, strive to meet the needs identified in Western countries where
the willingness to pay will be stronger. Other diseases that affect a significant proportion
of the population in poorer countries are not well researched and are therefore
neglected.12 To address this requirement the WHO report recommended the creation of
a global R&D convention on neglected diseases. Many disputes arose during the
negotiations and the draft comprehensive convention was abandoned, despite the
enthusiasm of countries affected by neglected diseases. The delegations of the European
Union and the US were the most recalcitrant to the idea of a comprehensive
convention.13 While the US delegation refused to formally comment on its refusal,
various sources confirmed that their main fear was that the convention would promote
technology transfer and access to medicines.
12 According to the WHO, more than 70% of countries and territories in which tropical and neglected diseases are prevalent are low or middle incomes countries (http://www.who.int/features/qa/58/fr/). 13 http://www.ip-watch.org/2012/11/29/who-members-agree-on-strategic-work-plan-on-health-rd-but-no-convention/

AGEOPOLITICSOFRENEWABLEENERGYPATENTS/ 2019-1
14
The parallel between health and climate issues is relevant since intellectual property
and technology transfer issues have also constituted barriers in climate negotiations, as
we recall in the next subsection. Moreover, we can anticipate the emergence of an even
more complex geopolitics of low-carbon energy in the fight against global warming,
compared to the geopolitics of fossil energy, since the development of these technologies
is dependent on the implementation of ambitious international agreements on GHG
mitigation. This last point is investigated in the following subsection.
2. Climatenegotiationsandintellectualproperty
Intellectual property on low-carbon inventions is an important issue for climate
negotiations as they deal, among other things, with technology transfer challenges.14
Since the adoption in 1992 of the United Nations Framework Convention on Climate
Change (UNFCCC) and its entry into force in 1994, "developed country Parties and other
developed Parties included in Annex II shall take all practical steps to promote, facilitate
and finance, as appropriate, the transfer of, or access to environmentally sound
technologies and know-how to other Parties, and particularly developing countries
Parties" (Article 4, paragraph 5 of the UNFCCC, 1992). Technology is therefore initially
perceived as a factor of inequality between developed and developing countries that
needs to be corrected through the transfer and financing of low-carbon technologies in
developing countries. Since the first Conference of the Parties (COP) in 1995 in Berlin,
the development and transfer of low-carbon technologies have been the subject of
extensive negotiations at each meeting. These negotiations have gone through several
successive phases.
Abriefhistoryoftechnologytransferinclimatenegotiations
From the first COP held in Berlin in 1995 to COP 4 (1998), the Parties confined
themselves to assess annually the commitments made in the Article 4 of the UNFCCC
(inventory of projects, construction of networks, definition of technologies). At COP 4 in
14 The United Nations adopts a broad definition of technology as part of a piece of equipment, technique, practical knowledge or skill to carry out a particular activity.

AGEOPOLITICSOFRENEWABLEENERGYPATENTS/ 2019-1
15
Buenos Aires, the decision was taken to initiate a consultation process preparing a
framework agreement on technology transfer for adoption. These consultations, in
particular with developing countries, were to last until 2001. The third phase begins
with the adoption and implementation at COP 7 in Marrakech in 2001 as part of the
Technology Transfer Framework. It endorsed five practices: (1) the publication of
reports to identify and assess technological needs to reduce GHG emissions, (2) the
creation and maintenance of a platform to facilitate the circulation of information on the
implementation of the Technology Transfer Framework, (3) the facilitation of
technology transfer through the coordination of public policies and the removal of
technical barriers, (5) the creation of technology transfer mechanisms that entrust the
Expert Group on Technology Transfer (EGTT) with the responsibility of facilitating the
implementation of the agreement. During COP 13 in Bali in 2007, parties agreed to
strengthen the framework on technology transfer and added to the study themes of the
EGTT the funding of innovation, the strengthening of international cooperation, the
development of endogenous innovation and collaborative R&D projects. A further step
has been taken with the creation in 2010 at COP 16 (Cancun) of the "Technology
mechanism" which ends the mandate of the EGTT and entrusts two entities, the
Executive Committee on Technology (ETC) and the Climate Technology Centre and
Network (CRTC), with missions to assess countries' technological needs, formulate
public policy recommendations and create and expand a network of low-carbon
technology actors. However, these two entities have limited authority. The ETC is
composed of about twenty experts and its main activity is to formulate proposals to
States at each new COP aimed at accelerating technology transfer. The CRTC has limited
capacity with a budget of $14 million in 2015 (Glachant and Dechezleprêtre, 2017). After
implementation, the "Technology mechanism" was reinforced at COP 21 in Paris.
Although the Paris Agreement is often presented as a success and a major step forward
in international climate negotiations, the position on technology transfer has remained
the same. The Parties confined themselves to reaffirming their shared "long-term vision
on the importance of fully realizing technology development and transfer" (Article 10 of
the Paris Agreement).

AGEOPOLITICSOFRENEWABLEENERGYPATENTS/ 2019-1
16
TwoirreconcilableviewsabouttheroleofIPRinthetransferofclimatetechnologies?
Technology transfer can take place in different ways and potentially outside the
framework of international climate negotiations. The first mode of transfer is to supply
goods incorporating the technology in question. The second is to license one or more
patents to allow a foreign firm to exploit the protected technology. Finally, technology
transfer in its strongest version consists in strengthening the research and production
capacities of firms in the requesting country that wish to produce or use the technology
(Barton, 2007). Whatever the mode of transfer, it is linked to intellectual property and
while States reaffirm at each COP their willingness to promote the transfer of low-
carbon technology, intellectual property remains a major point of disagreement. Ockwell
et al. (2010) explained the opposition between developed and developing countries by a
disagreement about the impact of intellectual property on technology transfer. For
developed countries, intellectual property rules allow firms to secure their investments
and thus develop their activities in developing countries. The main obstacle to
technology transfer therefore becomes the absence of intellectual property rules or their
excessive flexibility, which encourage firms to keep their innovations secret or even to
refuse to sell them in some countries. For developing countries, the market power
conferred by a patent allows a firm to set prices too high for them to acquire it, thus also
preventing them from improving it. The existence of patents also makes imitation, even
partial, more difficult. This is a major issue to the extent that imitation is also a powerful
vector for learning, improvement and therefore technical progress.
These opposite views denote the ambiguity of the effects of intellectual property on
technology transfer. Nevertheless, it conceals the economic stakes that push States that
have significant assets in the low-carbon energy sectors to promote IPRs. Moreover, it is
part of the continuity of international negotiations which, because of the inertia of the
process, continue to make a strict distinction between developed and developing
countries. Yet, while many developed countries have been slow to invest in
strengthening their inventive capacity in low-carbon technologies, several developing
countries are now among the leaders in some of these technologies. It therefore seems
that the absence of an ambitious international mechanism for technology transfer has
AGEOPOLITICSOFRENEWABLEENERGYPATENTS/ 2019-1
17
not prevented the start of a race for low-carbon innovation. However, the success of
climate negotiations is intrinsically linked to the accumulation of low-carbon patents by
stakeholders, as we show in the following subsection.
Aparticulargeopoliticstolow‐carbonpatents
Low-carbon technologies differ from conventional technologies in that their economic
value is determined by climate policies. Innovation in mobile communication
technologies, for instance, has been stimulated by the existence of fast-growing demand.
Low-carbon technologies, on the contrary, face a demand determined by the intensity
and the credibility of climate policies implemented by the international community.
Thus the economic valuation of a patent filed in a RETs technology will depend as much
on the policy implemented at the national level as on those implemented by other
countries. This 'political' character of the economic value of a low-carbon innovation
creates a form of coevolution between low-carbon innovation and internationally
adopted climate agreements. A country's willingness to ratify an ambitious international
agreement to reduce GHG emissions will then depend on its level of technological assets
in the low-carbon transition sectors. Similarly, the incentive to invest in R&D projects to
acquire such assets is directly linked to the benefits expected by economic actors, and
therefore to the existence of ambitious climate policies and the most widely adopted by
emitting countries. For this reason, low-carbon innovation and the adoption of
international climate agreements are intrinsically linked.
3. Theplaceoflow‐carboninnovationinenergysecurityissues.
The concept of energy security is of a polysemic nature that involves several dimensions
and has specificities according to the geographical entity, energy or time horizon
considered (Chester, 2010). As Cherp explained, the traditional definition of energy
security is initially linked to the availability of energy and its affordability, (Cherp, 2014).
Even now, Cherp recalls that the International Energy Agency (IEA) defines energy
security as the uninterrupted availability of energy resources at affordable prices (IEA,
2014). Over time, many other dimensions will merge into the concept of energy security
such as the accessibility and the acceptability. If we confine ourselves to the dimensions
AGEOPOLITICSOFRENEWABLEENERGYPATENTS/ 2019-1
18
of energy availability and affordability alone, what roles do the production and
appropriation of new low-carbon technologies play?
Low‐carbonenergypatentsandtheavailabilityofenergy
The link between energy availability and low-carbon innovation is ambiguous. In an
energy system based on the exploitation of fossil fuels, assessing the availability of
energy consists in geologically assessing the quantity of this resource still available. This
definition of the concept is less appropriate when applied to flow energies such as solar,
hydro or wind energy. Indeed, they are much more available albeit the location of the
production site has a major impact on its productivity. However, the conversion of these
energies into usable energy is based on low-carbon energy technologies. Nevertheless,
important mineral resources are necessary to produce these technologies (Vidal et al.,
2013). In the context of the energy transition, the availability of energy is therefore
being extended to include minerals. Thus low-carbon innovation, and its appropriation
through patents, may or may not increase dependence on minerals. On the one hand, the
technical change has contributed to increasing the quantity of metals consumed, but also
the diversity of these metals. While copper and iron have been used for 7000 years and
3000 years respectively, “technological metals” such as rare earths have only been used
for about 30 years. On the other hand, innovation can help to find substitutes for
expensive resources or to reduce the quantity of a raw material needed to provide an
equivalent energy service. Indeed, the effect of low-carbon innovation on energy
availability is difficult to forecast even if the low-carbon transition should increase the
amount of energy available.
Low‐carbonenergypatentsandtheaffordabilityofenergy
Of the two classic dimensions of energy security, it is certainly affordability that will be
most affected by low-carbon innovation. The cost of generating electricity from
renewable sources has decreased in recent decades due to feedbacks from the
deployment and use of RETs ("learning-by-using" and "learning-by-doing") (for a
discussion of these concepts see Jaffe et al., 2005; for recent figures see IRENA, 2018).
Learning through research has also made a significant contribution to reducing

AGEOPOLITICSOFRENEWABLEENERGYPATENTS/ 2019-1
19
equipment production costs and improving efficiency in low-carbon electricity
generation (e.g. Klaassen et al., 2005; Kobos et al., 2006). It is therefore in the interest of
a State to implement policies to support innovation in RETs in order to reduce the costs
of producing renewable electricity and to reduce its dependence on foreign technologies.
The definition of energy security has expanded over time. It has taken two additional
dimensions: accessibility and acceptability. This energy security paradigm is known as
the fourAs paradigm and has been popularized by the Asian Pacific Research Centre
(APERC, 2007). It is a questionable approach insofar as it does not respond to strictly
security issues (Cherp, 2014). These weaknesses have contributed to a multitude of
analyses adding new dimensions to energy security, making it impossible to compare
studies (ibid.). It should be noted however that of the 104 studies on empirical
estimation of energy security reviewed by Ang et al. (2015), the only one that explicitly
recognizes the role of low-carbon innovation is Sovacool et al. (2011). According to their
study, it allows a State to have a more diversified energy system and be therefore less
sensitive to shortages. They therefore choose to include technological development
among the five dimensions they take into account when considering energy security.
We have shown that intellectual property is a field in which geopolitical tensions are
exercised and that the low-carbon nature of an innovation adds a level of complexity to
the analysis of these power relations by linking intellectual property to climate
negotiations. However, figures are lacking to assess the technological advantages
accumulated by countries in the field of low-carbon technologies, and thus infer their
positions in climate negotiations.
WHAT GEOPOLITICS OF RENEWABLE ENERGIES ? MAKING PATENTDATASPEAKS
1. Methodologyanddata
The analysis we develop in this section uses patent data from the PATSTAT database.
This database contains bibliographic information extracted from the European Patent
Office (EPO) database and provides a reference point for the statistical analysis of patent

AGEOPOLITICSOFRENEWABLEENERGYPATENTS/ 2019-1
20
data. It gives information on more than 100 million patent documents from both
industrialized and developing countries. Our analysis will focus in particular on patents
protecting inventions in RETs. To do this, we consider patents classified according to the
Cooperative Patent Classification (CPC) scheme in the following technologies: wind
power (onshore and offshore), solar photovoltaics, bio-fuels, fuel from waste,
geothermal, solar thermal and hydropower. In the latter category we only consider
inventions related to the use of marine energy and small hydropower installations; we
exclude patents filed in hydropower dam technologies.
We consider patents granted between 1980 and 2014 to set the most complete coverage
possible. Indeed the last year of our sample is 2014, because this is the last full year in
the 'Spring 2018' edition of the PATSTAT database from which our data are extracted.15
Moreover, depending on the objective of the analysis, we can study both inventions and
patents. The distinction is that several patents can protect the same invention. Indeed,
an agent seeking to patent its invention can choose to protect it in several geographical
areas and will potentially obtain as many patents. To focus on the invention itself, it is
then relevant to take into account only its so-called priority filing patent, which qualifies
the first granted patent that protected the invention in question.
Finally, a central issue in the analysis of patent data is to determine the nationality of the
inventor(s). In the next subsection, we will focus on RETs patent filings in the main
patent offices, regardless of the nationality of the applicant. But to be carried out, other
analyses will require knowledge of the inventor’s nationality. We consider that the
nationality of a priority patent is that of the residence address of the inventor registered
at the time of patent filing, used for correspondence with the patent office. When the
information is not known, we consider that the invention is of the nationality of the
Office in which it is protected for the first time. Indeed, there is a strong domestic bias
among inventors in the sense that they will generally prefer to file the first patent on
15 https://forums.epo.org/latest-full-year-in-patstat-7117

AGEOPOLITICSOFRENEWABLEENERGYPATENTS/ 2019-1
21
their invention directly within their country of residence, before considering an
extension of protection to other countries.16
2. Accelerating innovation in renewable energy technologies: aglobaldynamic
For all the reasons discussed in the first part of this article, innovation in RETs has
become a global challenge in recent decades. No geographical area seems to have
escaped the acceleration of the acquisition of intellectual property rights on new
technologies in the RETs sectors, reflecting the expectation that these technologies are
or will become key assets. The analysis of patent data from the five largest intellectual
property offices in the world, namely the United States Patent and Trademark Office
(USPTO) in the US, the European Patent Office (EPO), the State Intellectual Property
Office (SIPO) in China, the Japan Patent Office (JPO) and the Korean Intellectual Property
Office (KIPO) in South Korea, allows monitoring global trends. Figure 2 shows the
evolution of the share of RETs patents in the total patents granted by the five offices.
Patents are not classified by their year of grant, but according to the year in which the
patent application was filed at the Office.17
16 To illustrate this domestic bias, we have extracted all the priority patents filed between 1980 and 2014 for which the inventor's country of residence is known. In 91% of cases it corresponds to the country of the office that granted the priority patent. 17 Classifying inventions according to the year in which the application was filed makes it possible to better reflect the temporality of innovators' decisions. Indeed, the duration of the examination of applications is likely to vary from one office to another and a classification by year of patent grant can bias the results.

AGEOPOLITICSOFRENEWABLEENERGYPATENTS/ 2019-1
22
Figure2:EvolutionoftheshareofRETspatentsinthetotalpatentsgrantedbythefivemainintellectualpropertyoffices(leftaxis)andrealoilprice(rightaxis)
Source:PATSTAT
The weights of RETs in the total patent granted by the five offices are shown on the left
axis of Figure 2. To illustrate the importance of price signals, the evolution of the price of
a barrel of Brent crude oil (2014 US dollars constant price) is plotted on the right axis
and represented by the dotted line. The share of RETs patents in total patents granted by
an IP office is not a measure of a country's inventive performance. It is an indicator of
innovation efforts directed towards RETs compared to other sectors and therefore of the
profitability, achieved or anticipated, of these technologies. First of all, the dynamism of
the Chinese, Korean and Japanese patent offices, in comparison with the European and
American offices, must be underlined. During the period analyzed, RETs patents
generally have higher weights within the JPO, SIPO and KIPO, compared to EPO and
USPTO. This gap is all the more marked since the 2000s. The JPO differs from its Asian
neighbors in that the weight of RETs patents has historically been higher than in the
other offices, but will not experience the same acceleration intensity since the 2000s.
This difference is explained by the high ambition of the policies implemented by the
government to support the development of solar PV technology. Indeed, the fact that the
1990s have been a “lost decade” for the Japanese economy did not reduce the
government’s willingness to develop alternative energies. As explained by Chowdhury et
0
20
40
60
80
100
120
0
0,5
1
1,5
2
2,5
3
3,5
4
4,5
SIPO (China)
EPO(Europe)
USPTO (US)
JPO (Japan)
KIPO (SouthKorea)
Real OilPrice(2014$/bbl)
%2014US$/bbl

AGEOPOLITICSOFRENEWABLEENERGYPATENTS/ 2019-1
23
al. (2014), the two oil shocks have urged the government to increase the share of RETs
in the energy mix. The largest share of support was granted to solar PV technology
through the Sunshine program and its expansion, and it has allowed the solar PV sector
to benefit from an abundant and stable budget for its development (Chowdhury et al.,
2014). Regarding South Korea, the country also has started to develop new energy
technologies in response to the two oil shocks. Nonetheless, the political support
dedicated to RETs became more aggressively and strategically promoted in the early
2000s (Chen et al., 2014). At the end of 2008, the government chose to go further in the
energy transition by releasing the “Low-Carbon Green Growth” plan that provides the
new national vision for South Korea for the next fifty years. This plan explicitly targets
the development of RETs as a mean to achieve economic growth and strengthen
competitiveness.
For the five offices, the acceleration of innovation in RETs began at the turn of the 2000s
and is strongly correlated to the price of a barrel of oil. It also points to the lack of a long-
term vision for low-carbon innovation as a drop in oil price deters the innovative effort
toward these technologies. The correlation thus illustrates John Hicks' hypothesis of
induced technical change, according to which the direction taken by technical progress
depends on investments made by economic actors in response to market conditions
(Hicks, 1932, pp. 124-125). This correlation underlines the importance of a price signal
to stimulate low-carbon innovation and thus the relevance of GHG taxation instruments.
Indeed, several empirical studies support the idea that low-carbon innovation positively
reacts to energy prices (Newell et al., 1999; Popp, 2002; Crabb and Johson, 2010;
Verdolini and Galeotti, 2011). Nonetheless, pricing emissions is not the only instrument
able to cause a reaction from innovation players. Lanjouw and Mody (1996) have shown
that the implementation of air quality standards has positively impacted patented
environmental innovations in the US, Japan and Germany. A more recent study by
Johnstone et al. (2010) assesses and compares the effects of different environmental
policy instruments implemented in 25 countries on low-carbon patent filed in RETs at
the European Patent Office (EPO) between 1978-2003. They conclude that the
instruments are complementary: the most flexible instruments such as green certificate

AGEOPOLITICSOFRENEWABLEENERGYPATENTS/ 2019-1
24
markets18 allow the most competitive technologies to enter the market, while targeted
subsidies such as feed-in tariffs for green electricity stimulate innovation in the most
expensive technologies. The EU ETS has been evaluated by Calel and Dechezleprêtre
(2016) and its causal impact on low-carbon innovation is estimated on a sample of 5,500
firms from 18 European countries. The authors conclude that about 1% of the increase
of the number of patents filled at the EPO in environmental technologies is attributable
to the emissions trading scheme. More generally, the main lessons of empirical literature
studying low-carbon innovation are summarized by Popp (2005); we summarize two of
them. The first one is that low-carbon innovation not only reacts to economic incentives,
but does so quickly. Indeed, Popp estimates that more than half of the impact of a price
increase on R&D expenditures occurs in the five years following that increase. The
second lesson from the literature is that R&D shows signs of decreasing returns within
the same technology. This analysis is based on patent citation data: it appears that
within the same technology, the propensity of a patent to be cited decreases with patent
accumulation in that technology. This suggests that the marginal contribution of new
inventions to the improvement of a technology is decreasing.
On the geopolitical level, the responsiveness of low-carbon innovation to the price of oil
underlines the importance of countries producing fossil resources. The link between oil
price and low-carbon innovation can be analyzed in the broader context of the "green
paradox". This paradox reflects the idea that the implementation of a GHG pricing policy
can paradoxically lead to an increase in emissions. It is developed by Sinn (2008) and is
based on the fact that emission pricing policies are generally implemented gradually to
smooth the transition to a low-carbon system. Pricing is then increasing over time and
fossil fuel producers, anticipating the drop in demand for their products, will choose to
maximize their immediate gains by reducing their selling prices. Sinn bases his
demonstration on a Hotelling model in which the introduction of a cash-flow tax that
increases over time pushes producers to increase the extraction rate of their fossil
resources. A vast theoretical literature exists on the green paradox and tends to
18 A green certificate market is an instrument for promoting RE. Electricity generators are required to comply with a certain quota of low-carbon electricity. To this quota corresponds a number of certificates that must be submitted to the regulator. In some systems the flexibility is higher because the certificates are tradable by the generators.

AGEOPOLITICSOFRENEWABLEENERGYPATENTS/ 2019-1
25
demonstrate that it can be valid in different contexts, depending on the discount rates,
the speed of tax increases, or consumer reaction (e.g. Edenhofer and Kalkhul, 2011;
Smulders et al., 2012; Michielsen, 2014). A first empirical study on the existence of the
green paradox is conducted by Di Maria et al. (2014) who evaluate the effects on coal
price of the implementation of the Acid Rain Program in 1995 in the US and of its
announcement in 1990. Their results indicate that not all firms are necessarily looking to
sell their reserves more quickly. A decline in coal price is well observed. The authors
conclude, however, that coal-buying power plants have not favored highly polluting coal
despite its low price, even if the Acid Rain Program was not effective yet. Thus, the
institutional arrangements made upstream with coal consumers were crucial to avoid
the green paradox. This analysis of acid rain regulation offers us several lessons about
the risk that a green paradox could annihilate the effects of climate policies. Regulators
should seek to build agreements with fossil energy consumers prior to the
implementation of the pricing policies. This will be much more complex for oil, which
has more consuming sectors, than for coal, which is used mainly by electricity producers.
The risks of increased fossil energy consumption can also be reduced by developing
more attractive technical substitutes. Another important lever is the rapid increase in
emissions pricing, which reduces the period during which a green paradox can develop.
Finally, it is important that policies to support low-carbon innovation succeed in
decoupling it from fossil fuel prices; in this respect, public funding must be maintained at
a high level regardless of fluctuations on the fossil fuel markets. It thus underlines the
need for a long-term political vision. On the international political level, one solution to
counteract the green paradox is to agree with countries with high reserves of fossil fuels
that they will respect a certain production quota. This quota would reduce the amount of
fossil fuels that is available. To compensate for the decline in fossil fuel sales, consumer
and producer countries can agree on a high sale price that would allow to value the part
of their reserves they can sell, in accordance with the quota. To this extent, the green
paradox is another reason to include these countries in international climate
negotiations.

AGEOPOLITICSOFRENEWABLEENERGYPATENTS/ 2019-1
26
3. LeadersinRETs
The dynamics of patent acquisition within the five main offices do not make it possible
to distinguish between countries’ knowledge in low-carbon technologies since patents
can be filed by foreign inventors.As explained in the Methodology and data section, we
can sort RETs patents according to inventor’s nationality.This allows us to analyze the
specialization of the main innovative countries19 in four technologies: (1) onshore and
offshore wind, (2) solar photovoltaics, (3) bio-fuels and (4) hydropower (as defined
above). A widely used indicator in the literature to measure a country's relative degree
of specialization in a technological field is the Revealed Technical Advantage (RTA),
originally proposed in an article by Soete (1987).This indicator is defined as the ratio
between the share of inventions held by a country in a specific technology and the share
of inventions held by this country, all technologies taken together. This indicator is
particularly useful for international comparisons because the propensity to patent can
vary from country to country, regardless of innovation performance. Finally, we
normalize the RTA indices so that the same weight is given to negative and positive
changes (Thoma, 2017). Although RTA indices are very effective in quantifying a
country's relative specialization in a technology sector, they have two limitations
identified by Cantwell and Jeanne (1999). First, the construction of these indices for
countries producing few inventions creates potentially large variations in the index from
one period to another and makes more difficult a comparison with other countries
(among the countries included in our sample, this limit applies mainly to India). Second,
the calculation of RTAs for small countries easily leads to consider them to be highly
specialized as their limited resources force them to focus on a limited number of
technology sectors (this criticism applies mainly to Denmark among the countries we
analyze). The analysis of complementary indicators in the next section will enable us to
overcome these two limitations. A strictly positive normalized RTA index indicates a
relative specialization of the country in the sense that it produces a larger share of
19 We focus on the main innovators, defined as the countries that obtained the most patents between 1992 and 2014, namely the United States of America, Japan, South Korea, China, Germany, France, Taiwan, United Kingdom, Canada and the Netherlands. We add to this group a second group of countries that we select on the basis of their weight in global emissions (Australia, which has the highest level of emissions per capita and India, which is the largest emitter of GHGs in the world) or on the basis of their expertise in RETs (Denmark and Spain).
AGEOPOLITICSOFRENEWABLEENERGYPATENTS/ 2019-1
27
inventions in this technological sector than in all sectors; a strictly negative index
indicates a relative lack of specialization in the sector.
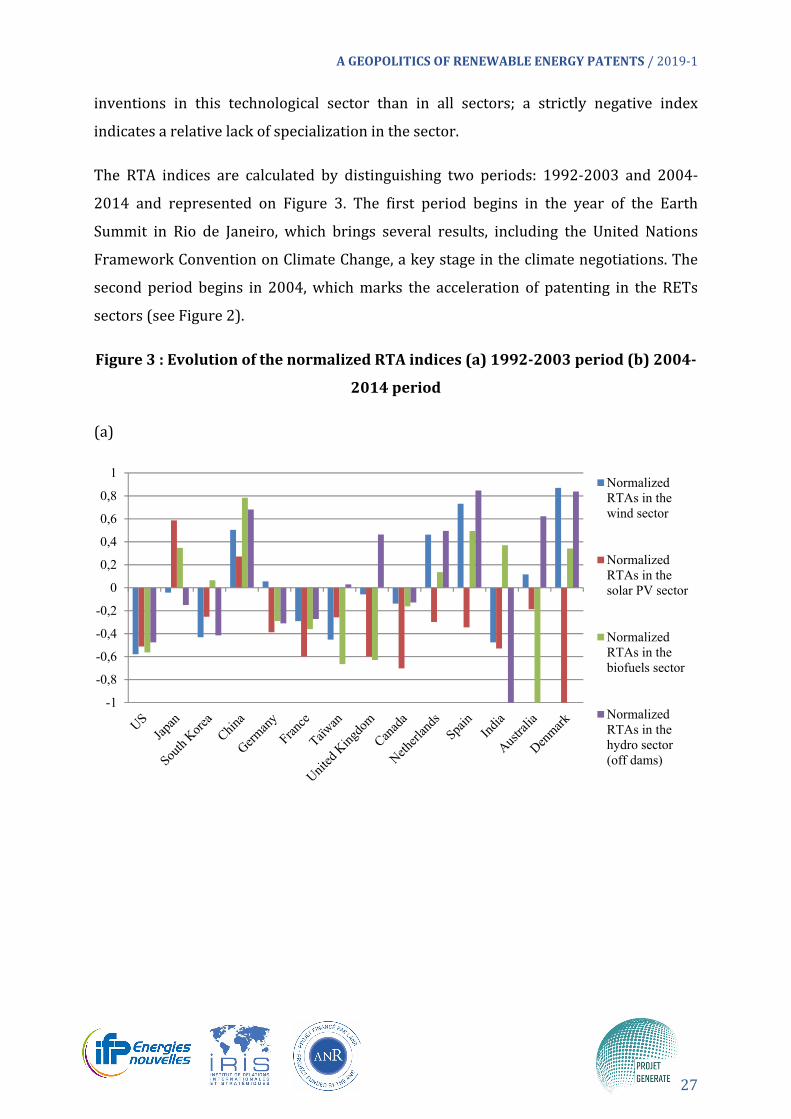
The RTA indices are calculated by distinguishing two periods: 1992-2003 and 2004-
2014 and represented on Figure 3. The first period begins in the year of the Earth
Summit in Rio de Janeiro, which brings several results, including the United Nations
Framework Convention on Climate Change, a key stage in the climate negotiations. The
second period begins in 2004, which marks the acceleration of patenting in the RETs
sectors (see Figure 2).
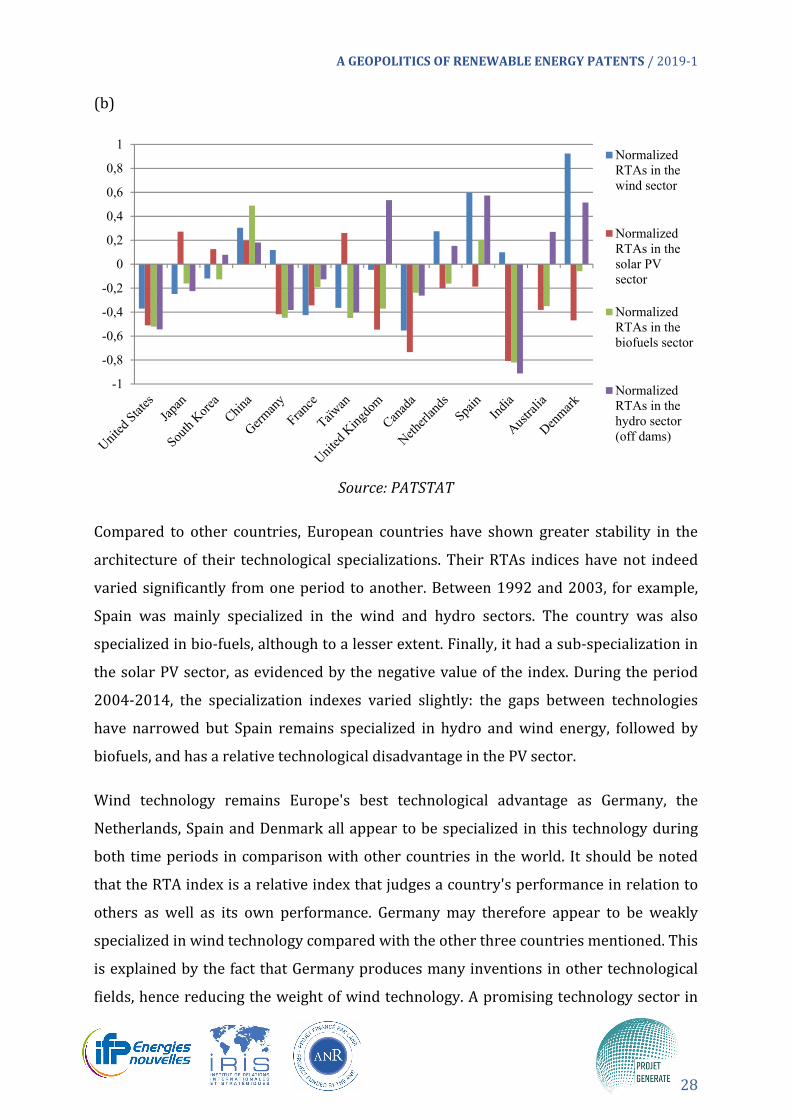
Figure3:EvolutionofthenormalizedRTAindices(a)1992‐2003period(b)2004‐
2014period
(a)
-1
-0,8
-0,6
-0,4
-0,2
0
0,2
0,4
0,6
0,8
1NormalizedRTAs in thewind sector
NormalizedRTAs in thesolar PV sector
NormalizedRTAs in thebiofuels sector
NormalizedRTAs in thehydro sector(off dams)
AGEOPOLITICSOFRENEWABLEENERGYPATENTS/ 2019-1
28
(b)
Source:PATSTAT
Compared to other countries, European countries have shown greater stability in the
architecture of their technological specializations. Their RTAs indices have not indeed
varied significantly from one period to another. Between 1992 and 2003, for example,
Spain was mainly specialized in the wind and hydro sectors. The country was also
specialized in bio-fuels, although to a lesser extent. Finally, it had a sub-specialization in
the solar PV sector, as evidenced by the negative value of the index. During the period
2004-2014, the specialization indexes varied slightly: the gaps between technologies
have narrowed but Spain remains specialized in hydro and wind energy, followed by
biofuels, and has a relative technological disadvantage in the PV sector.
Wind technology remains Europe's best technological advantage as Germany, the
Netherlands, Spain and Denmark all appear to be specialized in this technology during
both time periods in comparison with other countries in the world. It should be noted
that the RTA index is a relative index that judges a country's performance in relation to
others as well as its own performance. Germany may therefore appear to be weakly
specialized in wind technology compared with the other three countries mentioned. This
is explained by the fact that Germany produces many inventions in other technological
fields, hence reducing the weight of wind technology. A promising technology sector in
-1
-0,8
-0,6
-0,4
-0,2
0
0,2
0,4
0,6
0,8
1NormalizedRTAs in thewind sector
NormalizedRTAs in thesolar PVsector
NormalizedRTAs in thebiofuels sector
NormalizedRTAs in thehydro sector(off dams)
AGEOPOLITICSOFRENEWABLEENERGYPATENTS/ 2019-1
29
Europe is hydropower, in which United-Kingdom, Spain, the Netherlands and Denmark
are specialized. Of all the European countries, France seems to be lagging behind in the
four technology sectors analyzed, even if stronger RTAs have been observed in the last
period in the solar PV, bio-fuels and hydropower sectors (excluding dams).
The US, Canada and Australia all have a high per capita GHG emission rate and are
therefore highly dependent on fossil fuels. The comparison between the two periods
indicates that these countries did not became highly specialized in one or more sectors
of RES. The US has maintained a similar situation from one period to another, without
seeking to favor a technology. The negative values of the RTAs indices show that RETs
are still far from having reached the most dynamic innovation sectors in the US. From
one period to the next, Canada's RTA indices decreased for all four technologies. In the
case of Australia, only one technology stands out from the others since the country
maintains a high degree of specialization in the marine and current energy sector during
both periods.
The most significant upheavals in countries’ relative technological specializations have
occurred in Asia, although countries have very different profiles and Japan stands out as
an exception. South Korea and Taiwan have the common characteristic of having
succeeded in developing a strong specialization in the field of solar PV. This is explained
by the specialization that these countries had developed upstream in the semiconductor
sector; the latter being intrinsically linked to solar PV technology (Wu, 2014). It should
also be noted that Taiwan has favored the development of crystalline silicon cells while
Korean innovators have focused on improving new generations of solar photovoltaic
technologies (ibid.). However, while Taiwan has specialized exclusively in solar PV,
South Korea has also strengthened its skills in wind, ocean and current energies. Japan
stands out from other Asian countries by recording a reduction in its RTA indices on all
four technologies, although a strong specialization in solar PV is maintained during the
second period.
Finally, the comparison of degrees of specialization in RETs from one period to the next
highlights China's particularity. It was mainly from the early years of 2010 that

AGEOPOLITICSOFRENEWABLEENERGYPATENTS/ 2019-1
30
questions arose about the increase in the number of Chinese patents.20 Our results
provide two additional dimensions.
First, China was already highly specialized in RETs between 1992 and 2004, while the
trigger for China's energy transition is generally associated with the 2005 Renewable
Energy Law (2005 LER). It therefore seems that before implementing policies
supporting the deployment of RE, as did the 2005 LER, the Chinese economy already
launched a specialization process in these sectors during the 1990s. This is not
surprising given that China has long maintained a desire to deploy RETs, even if it has
remained discreet in comparison with the increase in Chinese GHG emissions. According
to World Bank, China was already the world's leading producer of wind turbines in 1996
(World Bank, 1996). Because of its good wind resources, particularly in Inner Mongolia,
China began a rural electrification program in the 1970s based on the use of wind
energy, but also on other RETs sources (Lew, 2000). In parallel, central and local
governments set up a set of mechanisms at the end of the 1950s to support the
development of a domestic wind energy sector. More generally, the electrification of
rural areas in China has been a powerful vector for the development of small renewable
installations.21 For example, China alone had 15 GW of small hydro installed capacity
(<10MW) out of the 40GW installed worldwide in 2001 (Paish, 2002).
Second, China's relative specialization in the RETs sectors analyzed here continued
during the period 2004-2014, despite the arrival of new players. China therefore
appears to be specialized in wind, bio-fuels, marine and current energy technologies
and, to a lesser extent, solar PV technology. The main strengths of the Chinese economy
in this latter sector are economies of scale, low production costs and the export of ready-
to-install systems (Wu, 2014).
The RTAs indexes make it possible to quantify the relative specialization of countries in
the RETs sectors and to understand the technological paths of national economies. On
20 “Patents, yes ; ideas, maybe. Chinese firms are filing a lots of patents. How many represent good ideas?” The Economist, October 14th 2010. 21 99.26% of the urban Chinese population had access to electricity in 1990 while this share was equal to 89.7% for rural population. In 2015, this gap has narrowed as these rates were both equal to 100 for urban and rural populations (numbers are from the World Bank).

AGEOPOLITICSOFRENEWABLEENERGYPATENTS/ 2019-1
31
the other hand, they do not allow taking into account the economic value of patents,
which requires the analysis of complementary indicators such as those developed below.
4. Patent families: a measure of the geographical scope ofinventions
As we explained at the beginning of the previous subsection, the same invention is
protected first by a priority patent and then, if necessary, by a family of patents granted
by different patent offices. Because each new patent application has a cost for the
applicant, it is considered that the size of the patent family, i.e. the number of patent
offices in which the invention is protected, is a relevant approximation of the economic
value of a patent (Fischer and Leidinger, 2014). This hypothesis is empirically validated
by several papers that highlight the positive correlation between the size of an
invention's patent family and its economic valuation (e.g. Putnam, 1997; Harhoff and
Wagner, 2003). In a more strategic approach, the size of the family, by indicating the
breadth of the geographical coverage of the monopoly rights over an invention, makes it
possible to understand a country’s influence on the accessibility of RETs. Nonetheless, it
should be kept in mind that depending in its geographic location a country may have a
higher propensity to patent abroad, compare to other countries, independently of the
value of an invention. Hence, a cross-country comparison of the size of patent families
can be misleading. A relevant approach is to examine how the average size of inventions’
patent families have evolved over time for each country. It should be made by focusing
on a particular technology in order to capture the dynamism of the sector in terms of
inventive activity. Because wind and solar PV technologies are now supported by
numerous countries through public policies since several years and sometimes decades,
we are focusing on these two.
We represent the evolution of the average size of patent families protecting inventions
in the wind power technology sector on Figure 4. The period we analyze is divided into
four sub-periods in order to assess the evolution over time of the average family size.
AGEOPOLITICSOFRENEWABLEENERGYPATENTS/ 2019-1
32
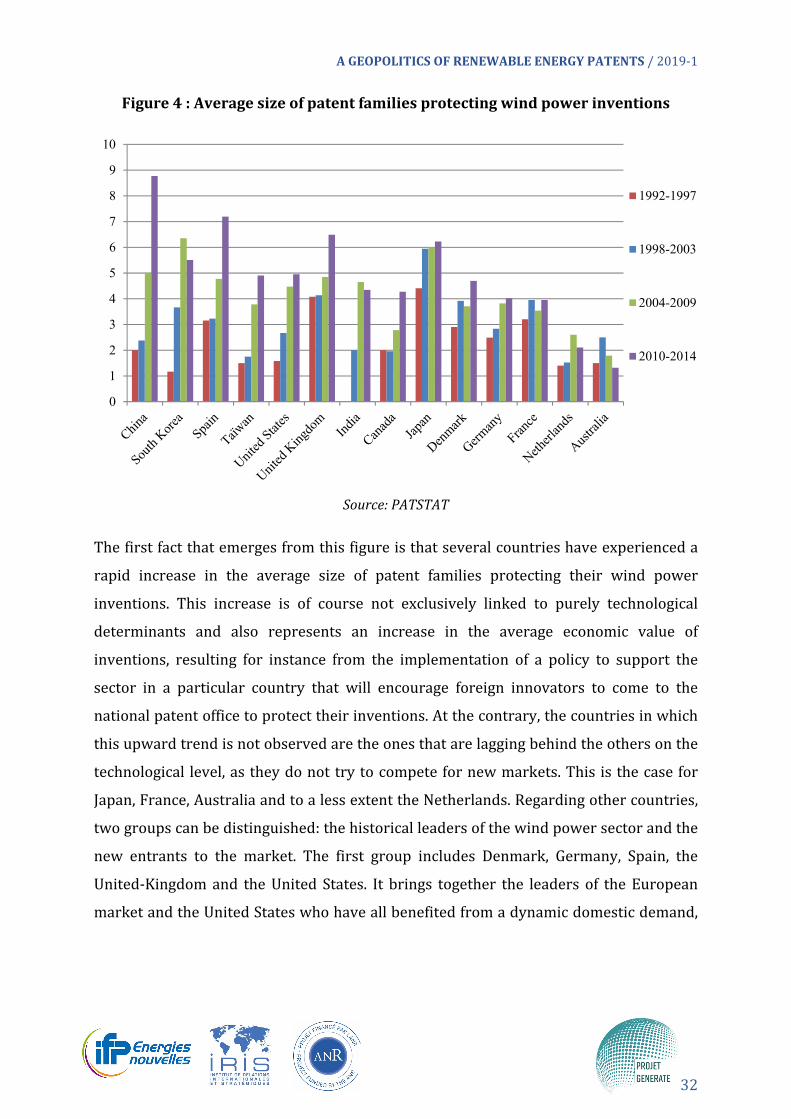
Figure4:Averagesizeofpatentfamiliesprotectingwindpowerinventions
Source:PATSTAT
The first fact that emerges from this figure is that several countries have experienced a
rapid increase in the average size of patent families protecting their wind power
inventions. This increase is of course not exclusively linked to purely technological
determinants and also represents an increase in the average economic value of
inventions, resulting for instance from the implementation of a policy to support the
sector in a particular country that will encourage foreign innovators to come to the
national patent office to protect their inventions. At the contrary, the countries in which
this upward trend is not observed are the ones that are lagging behind the others on the
technological level, as they do not try to compete for new markets. This is the case for
Japan, France, Australia and to a less extent the Netherlands. Regarding other countries,
two groups can be distinguished: the historical leaders of the wind power sector and the
new entrants to the market. The first group includes Denmark, Germany, Spain, the
United-Kingdom and the United States. It brings together the leaders of the European
market and the United States who have all benefited from a dynamic domestic demand,
0
1
2
3
4
5
6
7
8
9
10
1992-1997
1998-2003
2004-2009
2010-2014

AGEOPOLITICSOFRENEWABLEENERGYPATENTS/ 2019-1
33
as well as an important demand from neighbor countries.22 The second group includes
China, Taiwan and South Korea. In South Korea, the average size of patent families
protecting wind power inventions has steadily increased over the first three time
periods we consider, before it decreased during the 2010-2014 period. In China and
Taiwan, major efforts have been made to increase the average geographical scope of
intellectual property over wind power technology, hence demonstrating the
improvement of the innovative capacity in these two countries. It is also demonstrative
of the fact that there has been a major growth of the Asian demand for wind turbine
functioning at low wind speed. Such wind turbines generally use permanent magnet and
most have been manufactured by the Chinese firm Goldwind (Serrano-González and
Lacal-Arántegui, 2016).
The contrast between Asian and European countries is even more striking in the solar
PV sector. The evolutions over four time periods of the average size of patent families
protecting solar PV inventions are represented on Figure 5.
Figure5:AveragesizeofpatentfamiliesprotectingsolarPVinventions
Source:PATSTAT
22 For instance in 2008, seven firms from Denmark, Germany and Spain have provided the turbines for 94 and 93% of the cumulative installed capacities in Italy and Portugal, respectively (Baudry and Bonnet, 2018).
0123456789
10
1992-1997
1998-2003
2004-2009
2010-2014

AGEOPOLITICSOFRENEWABLEENERGYPATENTS/ 2019-1
34
As show on Figure 5, there has been a strong increase of the geographical scope of the
intellectual property of Asian inventions in the solar PV technology. This increase has
occurred mostly during the last two time periods and is correlated with the
implementation of demand-pull policies for solar power on Asian markets and the
penetration of Asian firms on the European and the American markets. It should be
noted that the United States have also followed this dynamics by increasing the average
size of its solar PV patents families. At the contrary, a slowdown of the growth of average
solar PV patents families is observed in Europe. The case of Japan must be highlighted.
Although this country is a major innovator in the solar PV technology, no sign of
improvement in the average value of its inventions in this field is observed.
These results on patent families can be refined by narrowing the analysis to very high-
value inventions. This can be done by counting only inventions that have been patented
in the most innovative patent offices, i.e. those that receive the most of patent
applications. To do so, we count only the number of triadic families. They are the
families of patents that protect the inventions at least in the US Office (USPTO), the
Japanese Office (JPO) and the European Office (EPO); the three main patent offices in the
world. The advantage of counting triadic families is that they reduce the influence of
geographic location and thus facilitate international comparisons (OECD, 2009). Figure 6
shows the distributions of triadic inventions related to RETs and produced during two
periods by nationalities. During the first period, from 1992 to 2003, the number of
triadic families in the RETs sector was 771. Between 2004 and 2014 this number
increased considerably to 1,849. This increase is a sign that the acceleration of patent
filings in RETs also coincides with an increase in the economic value generated by these
inventions.

AGEOPOLITICSOFRENEWABLEENERGYPATENTS/ 2019-1
35
Figure6DistributionoftriadicfamiliesofRETsinventionsaccordingtonationality
Source:PATSTAT
During the first period, the production of high-value inventions in the RETs sectors is
heavily concentrated between Germany, the US and Japan, which respectively represent
26.4%, 16.7% and 25.8% of triadic families. During the period 2004-2014, Japan and the
US maintained their shares while the weight of Germany decreased to 17%. At the same
time, new countries have taken a more important place in the production of high-value
inventions, as in the case of France, which has succeeded in increasing its share from
3.9% to 6.4%. The weights of the United-Kingdom and the Netherlands remained
relatively stable, while those of Denmark and Spain increased by 1.3 and 0.6 points
respectively. The most striking fact is most certainly the entry of South Korea in the
production of triadic inventions since it held only 0.8% between 1992 and 2004 and
increased this share to 5.2% during the period 2004-2014.
1992-2003
26.4%16.7%
25.8%12%
JapanGermanyUSFranceUnited KingdomSouth KoreaDenmarkNetherlandsChinaSpainCanadaAustraliaTaïwanIndiaRoW2004-2014
17.1%17.41%
25.1%12.7%

AGEOPOLITICSOFRENEWABLEENERGYPATENTS/ 2019-1
36
CONCLUSION
The diffusion of RETs and their improvement are crucial issues for the energy transition.
In this article we explain why there is a geopolitics that is specific to the intellectual
property rights on these technologies. Indeed, intellectual property rules shape the
production and diffusion of innovation and in the context of climate negotiations, there
are two opposing discourses about their effects. For developed countries, the existence
of intellectual property rules is a necessary condition for the diffusion of new
technologies that innovators would keep secret in the absence of protection. For
developing countries intellectual property allows the exercise of monopoly power that,
by increasing the price of new technologies hinders access to them. This opposition is
exacerbated in the case of RETs since innovation in these sectors is highly dependent on
government intervention (implementation of climate policies, financing of innovation,
historical weight in the energy sectors) and overlaps with energy security issues. These
different elements make it possible to understand the geopolitical tensions linked to
technology that drive international climate negotiations. In this article, we have stressed
that low-carbon innovation and international climate negotiations are unique in that
they are co-evolving. On the one hand, countries with the best technological assets in
RETs will perceive the adoption by other countries of GHG mitigation commitments as
an opportunity to gain market shares. On the other hand, countries lagging behind these
technologies will see the adoption of such commitments as a threat to their economies
and energy security if they are not accompanied by technology transfer agreements. In
this context, the use of patent data makes it possible to produce an overview of
innovation in RETs and to assess which countries are leaders in low-carbon innovation
and to what extent the situation has changed over time. Low-carbon innovation is
concentrated in the hands of only a few countries. However, India and Australia, which
are major emitters of GHG, do not stand out among the main low-carbon patent
producing countries. This delay casts doubt on the international community's ability to
get these countries to join the energy transition project. The dynamics of low-carbon
innovation in the five largest patent office show that a strong acceleration took place
during the 2000s. However, when we compare the relative specializations of countries
using the RTA indexes, we observe that significant changes have occurred. The relative

AGEOPOLITICSOFRENEWABLEENERGYPATENTS/ 2019-1
37
specializations of several countries in four RETs remained relatively stable between
1992-2003 and 2004-2014; this is the case for the US, Germany, France, the United-
Kingdom and Spain. The main upheavals observed come from Asia. Japan has lost its
relative specialization in bio-fuels but maintains a relative advantage in solar PV. South
Korea has made a major effort to specialize in this technology and has also developed a
specialization in marine energy and small hydropower. The most important gain in
specialization between the two periods that can be observed is Taiwan's in solar PV
technology. Finally, China seems to have always devoted significant efforts to the
production of inventions in RETs. The evolution of countries' relative technical
advantages shows that progress trajectories are not homogeneous between countries
and that major changes can be anticipated in the positioning of new leaders in climate
negotiations. However, these results can be refined by an analysis of the value of patents,
which we approximate using two indicators. The average size of patent families
protecting inventions, on the one hand, and the number of triadic patents held by a
country that represent very high value inventions, on the other. The analysis of patent
families shows that Western countries continue to produce inventions in the wind
power sector that are, on average, protected in a large number of countries. Nonetheless,
a major change has occurred since 2004 in this sector as China and Taiwan, and to a less
extent South Korea, became major players in this field. This illustrates the weights these
countries have taken in this sector. This shift in the geographical distribution of patent
rights on RETs is even more striking for the solar PV technology. China, Taiwan and
South Korea have experienced a major increase in the average size of their solar PV
patents families. This trend is also observed for the United States but it seems that the
growth of the average size of solar PV patents families is now slowing down in most
European countries. The evolution of the distribution of triadic families of patents
between different countries informs us of the changes that are taking place in the
production of very high value innovation. In RETs, it seems to have been and continues
to be dominated by the US, Germany and Japan. However, Germany's weight in triadic
families concerning RETs decreased between 1992-2003 and 2004-2014, while that of
Japan and the US remained almost identical. Among Asian countries, South Korea has
managed to improve its production of triadic families in RETs the most.

AGEOPOLITICSOFRENEWABLEENERGYPATENTS/ 2019-1
38
The issue of sharing energy transition technologies will become increasingly important
in climate negotiations. On the one hand, the commitments made by countries to reduce
their GHG emissions under the Paris agreement will increase demand for these
technologies; these commitments will also have to be revised upwards in 2025. On the
other hand, the acquisition of intellectual property rights over these technologies has
accelerated considerably, widening countries' inequalities in the face of transition.
Future research must focus on the opportunities that exist to make technology sharing a
vehicle for the inclusion of the largest number of countries. For this purpose, policy
instruments must be designed to target explicitly technology transfer. Clean
Development Mechanisms have indeed promoted technology transfer but only as a side-
effect of the instrument. To this extent, the double dividend from the taxation of GHG
emissions can be used to foster the transfer of RETs. The use of this (environmental) tax
revenue to fund the transfer of RETs technology, for example, can be a promising option
to strengthen North-South cooperation. On the one hand, developing countries could
acquire efficient technology at a lower cost and thus reduce the cost of their energy
transition. On the other hand, incentives to innovate would be maintained with respect
to private parties since their investment would be compensated by the transfer of the
tax revenue from GHG emissions taxation. Moreover, the implementation of such a
system will maintain a strong price signal, that would be necessary to redirect economic
investments towards low-carbon practices but also to generate a tax revenue. Such a
redistribution system could be applied within the framework of the climate clubs
proposed by Nordhaus (2015). Climate clubs were initially analyzed through the prism
of trade tariffs, but many other modalities are possible. Indeed, technology transfer
could prove to be a less socially costly option than increasing tariff barriers and would
satisfy the principle of common but differentiated responsibility that is formalized in the
UNFCC.

AGEOPOLITICSOFRENEWABLEENERGYPATENTS/ 2019-1
39
REFERENCES
Ang, B. W., Choong, W. L., & Ng, T. S. (2015). Energy security: Definitions, dimensions and indexes. Renewable and Sustainable Energy Reviews, 42, pp. 1077-1093.
Barton, J., H., (2007). Intellectual Property and Access to Clean Energy Technologies in Developing Countries. An Analysis of Solar Photovoltaic, Biofuel and Wind Technologies. Trade and Sustainable Energie Series, ICTSD Programme on Trade and Environment, December 2007.
Baudry, M., & Bonnet, C. (2017). Demand-pull instruments and the development of wind power in Europe: a counterfactual analysis. Environmental and Resource Economics, pp. 1-45.
Bodansky, D. (2016). The Paris climate change agreement: a new hope?. American Journal of International Law, 110(2), pp. 288-319.
Bolinger, M., Wiser, R., (2012). Understanding wind turbine price trends in the U.S. over the past decade. Energy Policy, Vol. 42, pp. 628-641.
Calel, R., Dechezleprêtre, (2016). Environmental Policy and Directed Technological Change: Evidence from the European Carbon Market. The review of economics and statistics, Vol. 98, No. 1, pp. 173-191.
Cantwell, J., Janne, O., (1999). Technological globalization and innovative centres: the role of corporate technological leadership and locational hierarchy. Research Policy, Vol. 28, pp. 119-144.
Chen, W. M., Kim, H., & Yamaguchi, H. (2014). Renewable energy in eastern Asia: Renewable energy policy review and comparative SWOT analysis for promoting renewable energy in Japan, South Korea, and Taiwan. Energy Policy, 74, pp. 319-329.
Cherp, A., & Jewell, J. (2014). The concept of energy security: Beyond the four As. Energy Policy, 75, pp. 415-421.
Chester, L. (2010). Conceptualising energy security and making explicit its polysemic nature. Energy policy, 38(2), pp. 887-895.
Chowdhury, S., Sumita, U., Islam, A., & Bedja, I. (2014). Importance of policy for energy system transformation: Diffusion of PV technology in Japan and Germany. Energy policy, 68, pp. 285-293.
Crabb, J., M., Johnson, D., K.N., (2010). Fueling innovation: the impact of oil prices and CAFE standards on energy-efficient automotive technology. The Energy Journal, Vol. 31, n°1, pp. 199-216.
Criekemans, D., (2018). Geopolitics of Renewable Energy Game and Its Potential Impact upon Global Power Relations. The Geopolitics of Renewables. Scholten, Daniel (Ed.), pp. 37-73.

AGEOPOLITICSOFRENEWABLEENERGYPATENTS/ 2019-1
40
Dang, J., Motohashi, K., (2015). Patent statistics: A good indicator for innovation in China? Patent subsidy program impacts on patent quality. China Economic Review, Vol. 35, 137-155.
Dewulf, J., Blengini, G., A., Pennington, D., Nuss, P., Nassar, N., T., (2016). Criticality on the international scene: Quo vadis? Resources Policy, Vol. 50, pp. 169-176.
Di Maria, C., Lange, I., & Van der Werf, E. (2014). Should we be worried about the green paradox? Announcement effects of the Acid Rain Program. European Economic Review, 69, pp. 143-162.
Dulong de Rosnier, M., Le Crosnier, H. (dir.), (2013). Propriété intellectuelle. Géopolitique et mondialisation. Paris, CNRS Editions, Coll. « Les Essentiels d’Hermès ».
Edenhofer, O., & Kalkuhl, M. (2011). When do increasing carbon taxes accelerate global warming? A note on the green paradox. Energy Policy, 39(4), pp. 2208-2212.
Fischer, T., Leiding, J., (2014). Testing patent value indicators on directly observed patent value – An empirical analysis of Ocean Tomo patent actions. Research Policy, Vol. 43, issue 3, pp. 519-529.
Fuss, S., Canadell, J. G., Peters, G. P., Tavoni, M., Andrew, R. M., Ciais, P., ... & Le Quéré, C. (2014). Betting on negative emissions. Nature Climate Change, 4(10), pp. 850.
Galvez-Behar, G., (2016). Les Empires et leurs brevets. Les techniques et la globalisation au XXe siècle. Hilaire-Pérez, L., Zakharova, L., Presses Universitaires de Rennes, pp. 281-296.
Glachant, M., Dechezleprêtre, A., (2017). What role of climate negotiations on technology transfer? Climate Policy, Vol. 17, n°8, pp. 962-981.
Goe, M., Gaustad, G., (2014). Identifying critical materials for photovoltaics in the US: A multi-metric approach. Applied Energy, Vol. 123, pp. 387-396.
Gupeng, Z., Xiangdong, C., (2012). The value of invention patents in China: Country origin and technology field differences. China Economic Review, Vol. 23, pp. 357-370.
Harhoff, D., Scherer, F. M., & Vopel, K. (2003). Citations, family size, opposition and the value of patent rights. Research policy, 32(8), pp. 1343-1363.
Hicks John, R. (1932). The theory of wages.
Hu, A., Zhang, P., Zhao, L., (2017). China as number one? Evidence from China’s most recent patenting surge. Journal of Development Economics, Vol. 124, pp. 107-119.
International Energy Agency and Nuclear Energy Agency (AIE-AIEA), (2015). Projected Costs of Generating Electricity, 2015 Edition.
IRENA, (2018). Renewable Power Generation Costs in 2017, International Renewable Energy Agency, Abu Dhabi.

AGEOPOLITICSOFRENEWABLEENERGYPATENTS/ 2019-1
41
Iyer, G., Hultman, N., Eom, J., McJeon, H., Patel, P., & Clarke, L. (2015). Diffusion of low-carbon technologies and the feasibility of long-term climate targets. Technological Forecasting and Social Change, 90, pp. 103-118.
Jacobsson, S., & Lauber, V. (2006). The politics and policy of energy system transformation—explaining the German diffusion of renewable energy technology. Energy policy, 34(3), pp. 256-276.
Jaffe, A. B., Newell, R. G., & Stavins, R. N. (2005). A tale of two market failures: Technology and environmental policy. Ecological economics, 54(2-3), pp. 164-174.
Johnstone, N., Haščič, I., Popp, D., (2010). Renewable Energy Policies and Technological Innovation: Evidence Based on Patent Counts. Environmental and Resource Economics, Vol. 45, pp. 133-155.
Klaassen, G., Miketa, A., Larsen, K., & Sundqvist, T. (2005). The impact of R&D on innovation for wind energy in Denmark, Germany and the United Kingdom. Ecological economics, 54(2-3), pp. 227-240.
Kobos, P. H., Erickson, J. D., & Drennen, T. E. (2006). Technological learning and renewable energy costs: implications for US renewable energy policy. Energy policy, 34(13), 1645-1658.
Koske, L., Wanner, I., Bitetti, R., Barbiero, O., 2015. The 2013 update of the OECD product market regulation indicators: policy insights for OECD and non-OECD countries. OECD Economics Department Working Papers, No., 1200.
Lanjouw, J., O., Mody, A., (1996). Innovation and the international diffusion of environmental responsive technologies. Research Policy, Vol. 2, pp. 549-571.
Lapointe, S., (2000). L’histoire des brevets. Les Cahiers de la Propriété Intellectuelle, Vol. 12, n°3.
Larkin, A., Kuriakose, J., Sharmina, M., Anderson, K. (2018). What if negative emission technologies fail at scale? Implications of the Paris Agreement for big emitting nations. Climate Policy, 18(6), pp. 690-714.
Lew, D., J., (2000). Alternatives to coal and candles: wind power in China. Energy Policy, Vol. 28, pp. 271-286.
Lorot, P., 2009. De la géopolitique à la géoconomie. Géoéconomie, No. 50, pp. 9-19.
Luttwak, E., 1990. From Geopolitics to Geo-economics. Logics of Conflict, Grammar of Commerce. The National Interest, No. 20, Summer 1990, pp. 17-23.
Mazzucato, M. (2013). The Entrepreneurial State: debunking public vs. private sector myths. Anthem, 2013.
AGEOPOLITICSOFRENEWABLEENERGYPATENTS/ 2019-1
42
Meilstrup, P. (2010). The runaway summit: the background story of the Danish presidency of COP15, the UN Climate Change Conference. Danish foreign policy yearbook 2010, pp. 113-135.
Michielsen, T. O. (2014). Brown backstops versus the green paradox. Journal of Environmental Economics and Management, 68(1), pp. 87-110.
Nemet, G. F. (2009). Demand-pull, technology-push, and government-led incentives for non-incremental technical change. Research Policy, 38(5), pp. 700-709.
Newell, R., G., Jaffe, A., B., Stavins, R., N., (1999). The induced innovation hypothesis and energy-saving technological change. The quarterly journal of economics, Vol. 114, Issue 3, pp. 941-975.
Nordhaus, W., (2015). Climate clubs: overcoming free-riding in international climate policy. American Economic Review, Vol. 105, n°4, pp. 1339-1370.
Ockwell, D., Haum, R., Mallett, A., Watson, J., (2010). Intellectual property rights and low-carbon technology transfer: Conflicting discourses of diffusion and development. Global Environmental Change, Vol. 20, pp. 729-738.
OECD. (2009). OECD Patent Statistics Manual. OECD (Ed), Paris.
OECD. (2015). Nuclear Legislation in OECD and NEA countries. Regulatory and Institutional Framework for Nuclear Activities: Denmark. OECD (Ed), Paris.
Paish, O., (2002). Small hydro power: technology and current status. Renewable and Sustainable Energy Reviews, Vol. 6, pp. 537-556.
Park, W., G., (2008). International patent protection: 1960-2005. Research Policy, Vol. 37, pp. 761-766.
Peters, G. P., Andrew, R. M., Canadell, J. G., Fuss, S., Jackson, R. B., Korsbakken, J. I., ... & Nakicenovic, N. (2017). Key indicators to track current progress and future ambition of the Paris Agreement. Nature Climate Change, 7(2), pp. 118.
Pollitt, M., 2012. The role of policy in energy transitions: Lessons from the energy liberalization era. Energy policy, Vol. 50, pp. 128-137.
Popp, D., (2002). Induced innovation and energy prices. American Economic Review, Vol. 92, n° 1, pp. 160-180.
Popp, D., (2005). Lessons from patents: Using patents to measure technological change in environmental models. Ecological Economics, Vol. 54, pp. 209-226.
Putnam, J., (1997). The Value of International Patent Rights. UMI Dissertation Services.
Rogelj, J., Meinshausen, M., & Knutti, R. (2012). Global warming under old and new scenarios using IPCC climate sensitivity range estimates. Nature climate change, 2(4), pp. 248.

AGEOPOLITICSOFRENEWABLEENERGYPATENTS/ 2019-1
43
Rose, S. K., Richels, R., Blanford, G., & Rutherford, T. (2017). The Paris Agreement and next steps in limiting global warming. Climatic Change, 142(1-2), 255-270.
Serrano-González, J., & Lacal-Arántegui, R. (2016). Technological evolution of onshore wind turbines—a market-based analysis. Wind Energy, 19(12), pp. 2171-2187.
Sinn, H. W. (2008). Public policies against global warming: a supply side approach. International Tax and Public Finance, 15(4), pp. 360-394.
Smulders, S., Tsur, Y., & Zemel, A. (2012). Announcing climate policy: Can a green paradox arise without scarcity?. Journal of Environmental Economics and Management, 64(3), pp. 364-376.
Soete, L., (1987). The impact of technological innovation on international trade patters: The evidence reconsidered. Research Policy, Vol. 16, pp. 101-130.
Sovacool, B. K., Mukherjee, I., Drupady, I. M., & D’Agostino, A. L. (2011). Evaluating energy security performance from 1990 to 2010 for eighteen countries. Energy, 36(10), pp. 5846-5853.
Stern, N., Peters, S., Bakhshi, V., Bowen, A., Cameron, C., Catovsky, S., ... & Edmonson, N. (2006). Stern Review: The economics of climate change (Vol. 30, p. 2006). London: HM treasury.
Thoma, G., (2013). Quality and Value of Chinese Patenting: An International Perspective. Seoul Journal of Economics, Vol. 26, no. 1, pp. 33-71.
Thoma, G., (2017). The Value of Chinese Patenting. Patent Management and Valuation: The Strategic and Geographical Dimension. Thoma, Grid (ed.), Routledge studies in technology, work and organizations, pp. 252-279.
UNFCC, (2017). The Paris Agreement. Available at: https://unfccc.int/sites/default/files/english_paris_agreement.pdf
Verdolini, E., Galeotti, M., (2011). At home and abroad: An empirical analysis of innovation and diffusion in energy policy. Journal of Environmental Economics and Management, Vol. 61, Issue 2, pp. 119-134.
Vidal, O., Goffé, B., & Arndt, N. (2013). Metals for a low-carbon society. Nature Geoscience, 6(11), pp. 894.
Vihma, 2018. Geoeconomic analysis and the limits of critical geopolitics: a new engagement with Edward Luttwak. Geopolitics, Issue 1, Volume 23, pp. 1-21.
Weischer, L., Morgan, J., Patel, M., (2012). Climate clubs: can small groups of countries make a big difference in addressing climate change. Review of European Community and International Environmental Law, Vol. 21, n° 3, pp. 177-192.
World Bank, (1996). China: Renewable energy for electric power, 15592-CHA, World Bank, Washington, DC, 11 September.

AGEOPOLITICSOFRENEWABLEENERGYPATENTS/ 2019-1
44
Wu, C., (2014). Comparisons of technological innovation capabilities in the solar photovoltaic industries of Taiwan, China, and Korea. Scientometrics, Vol. 98, pp. 429-446.
Yueh, L., (2009). Patent laws and innovation in China. International Review of Law and Economics, Vol. 29, pp. 304-313.

AGEOPOLITICSOFRENEWABLEENERGYPATENTS/ 2019-1
45
WorkingPaper2019‐1
Thenexusbetweenclimatenegotiationsandlow‐carbon innovation: A GEOPOLITICS OFRENEWABLEENERGYPATENTS
BY Clément BONNET, Samuel CARCANAGUE, Emmanuel HACHE, Gondia Sokhna SECK,
Marine SIMOËN
ThisarticleispartoftheGENERATE(RenewableEnergiesGeopoliticsandFutureStudiesonEnergyTransition)Project.
GENERATE(RenewableEnergiesGeopoliticsandFutureStudiesonEnergyTransition)isatwoyearsresearchproject(2018‐2020)ontheGeopoliticsofRenewableEnergy,onbehalfof the FrenchNational Research Agency, in a consortiumwith IFP EnergiesNouvelles.The purpose of the project GENERATE is to analyse the geopolitical consequences of aspreadofrenewableenergiesworldwide.Thisprojectwillfocusparticularlyonthreemajorissues, namely (1) the criticality of energy transitionmaterials for energy technologies(electricvehicle,solarpanel,windturbine,etc.).(2)thenewgeographyofpatentsfortherenewable energy technologies and (3) the oil producing countries developmentmodel,andtheirplacesontheinternationalenergyscene.
CONTACT:EmmanuelHache(ProjectLeader) [email protected] - +33 (0)1 47 52 67 49 SamuelCarcanague [email protected] - +33 (0)1 53 27 60 63 www.iris-france.org/projet-generate
#ProjetGenerate