the non-invasive monitoring of blood oxygen and carbon dioxide
TRANSCRIPT

51A. Hasan, Handbook of Blood Gas/Acid-Base Interpretation, DOI 10.1007/978-1-4471-4315-4_2, © Springer-Verlag London 2013
2 Chapter 2 The Non-Invasive Monitoring of Blood Oxygen and Carbon Dioxide Levels
Contents
2.1 The Structure and Function of Haemoglobin .................................................................. 532.2 Co-operativity ................................................................................................................. 542.3 The Bohr Effect and the Haldane Effect ......................................................................... 552.4 Oxygenated and Non-oxygenated Hemoglobin .............................................................. 562.5 PaO
2 and the Oxy-hemoglobin Dissociation Curve ........................................................ 57
2.6 Monitoring of Blood Gases ............................................................................................. 582.6.1 Invasive O
2 Monitoring ..................................................................................... 58
2.6.2 The Non-invasive Monitoring of Blood Gases ................................................. 582.7 Principles of Pulse Oximetry .......................................................................................... 592.8 Spectrophotometry .......................................................................................................... 602.9 Optical Plethysmography ................................................................................................ 612.10 Types of Pulse Oximeters ................................................................................................ 622.11 Pulse Oximetry and PaO
2 ................................................................................................ 63
2.12 P50
.................................................................................................................................... 642.13 Shifts in the Oxy-hemoglobin Dissociation Curve ......................................................... 652.14 Oxygen Saturation (SpO
2) in Anemia and Skin Pigmentation ....................................... 66
2.15 Oxygen Saturation (SpO2) in Abnormal Forms of Hemoglobin ..................................... 67
2.16 Mechanisms of Hypoxemia in Methemoglobinemia ...................................................... 682.17 Methemoglobinemias: Classification .............................................................................. 692.18 Sulfhemoglobinemia ....................................................................................................... 702.19 Carbon Monoxide (CO) Poisoning ................................................................................. 712.20 Saturation Gap ................................................................................................................. 722.21 Sources of Error While Measuring SpO
2 ........................................................................ 73
2.22 Point of Care (POC) Cartridges ...................................................................................... 752.23 Capnography and Capnometry ........................................................................................ 762.24 The Capnographic Waveform ......................................................................................... 772.25 Main-Stream and Side-Stream Capnometers .................................................................. 782.26 P
EtCO
2 (E
tCO
2): A Surrogate for PaCO
2 ......................................................................... 79
2.27 Factors Affecting PEt
CO2 ................................................................................................. 80
2.28 Causes of Increased PaCO2-P
EtCO
2 Difference ............................................................... 81
2.29 Bohr’s Equation ............................................................................................................... 822.30 Application of Bohr’s Equation ...................................................................................... 83

52 2 The Non-Invasive Monitoring of Blood Oxygen and Carbon Dioxide Levels
22.31 Variations in E
tCO
2 .......................................................................................................... 84
2.32 False-Positive and False-Negative Capnography ............................................................ 852.33 Capnography and Cardiac Output ................................................................................... 862.34 Capnography as a Guide to Successful Resuscitation..................................................... 872.35 Capnography in Respiratory Disease .............................................................................. 882.36 Esophageal Intubation ..................................................................................................... 902.37 Capnography in Tube Disconnection and Cuff Rupture ................................................. 91
2.37.1 Biphasic Capnograph ........................................................................................ 91
References ................................................................................................................................. 93

532.1 The Structure and Function of Haemoglobin
2 2.1 The Structure and Function of Haemoglobin
The special ability of hemoglobin (Hb) to imbibe O 2 from the pulmonary capillaries
and release it to the tissues derives from its unique quartenary structure.
Structure
GlobinThe Hb molecule consists of four globin chains (two alpha chains, each of 141 amino acids; two beta chains each of 146 amino acids.
HemeOne heme group binds each globin chain. Each heme group consists of:
One ferrous ion (Fe++)In order to carry O2, it is necessary for heme’s ferrous iron to remain in the ferrous state.
One protoporphyrin IX ringThis protoporphyrin ring is covalently bound to the ferrous ion.
FUNCTION: O2 carriage is the most important function of Hb (Sect. 2.4), but Hb serves several other important functions as well:
CO2 carriageAlthough only about 5 % of all the CO2 transported in the blood is in the form of carbamino compounds (viz, bound to Hb, the latter account for 30 % of the CO2 that evolves in the lungs from the red blood cells circulating within the pulmonary capliiaries. Another 5 % of CO2 is carried dissolved in plasma. The bulk of the CO2, however, iscarried in the form of bicarbonate.
Regulation of vasomotor toneNitric oxide (NO) is capable of reacting with a cysteine residue at position 93 of the ß chain of Hb. The resultingnitrosothiol, S-nitrosylated Hb is a vasodilator. The unique and recently recognized vasodilator property of Hb isdependent on its complex and ill-understood reactions with NO.
Bunn HF, Forget BG. Hemoglobin: molecular, genetic and clinical aspects. Philadelphia: WB Saunders; 1986.
McMahon TJ, Moon RE, Luschinger BP, Carraway MS, Stone AE, Stolp BW, Gow AJ, Pawloski JR, Watke P, Singel DJ, et al. Nitric oxide in the human respiratory cycle. Nat Med. 2002;8:711–7.
Perutz MF. Molecular anatomy, physiology, and pathology of hemoglobin. In: Stamatoyannopoulos G, Nienhuis AW, et al., editors. The molecular basis of blood disorders. Philadelphia: WB Saunders; 1987.
Stamler JS, Jia L, Eu JP, McMahon TJ, Demchenko IT, Bonaventura J, Gernert K, Piantadosi CA. Blood fl ow regulation by S-nitrosohemoglobin in the physiological oxygen gradient. Science. 1997;276:2034–7.

54 2 The Non-Invasive Monitoring of Blood Oxygen and Carbon Dioxide Levels
2 2.2 Co-operativity
Deoxygenated hemoglobin exists in a tense (taut) configuration because of electrostatic bonds between its beta globin chains. The hemoglobin molecule has helical twists. In the non-helical sections the polypeptide chain folds upon itself, creating clefts within which the four heme groups lie at equidistant intervals.
Deoxygenated Hemoglobin
The attachment of the first O2 molecule
In its taut state, deoxygenated hemoglobin has little affinity for O2. The attachment of the first O2 molecule to one of the globin chains generates chemical and mechanical stresses resulting in the severing of electrostatic bonds.This allows the hemoglobin molecule to unfold slightly.
The attachment of the second O2 moleculeAs the hemoglobin molecule relaxes and unfolds it exposes the other O2 binding sites within its clefts; this facilitates the addition of another molecule of O2 to the hemoglobin, more rapidly than the first.
The attachment of the third and fourth O2 moleculesThe binding of the second molecule of O2 results in further relaxation of the coils of the hemoglobin molecule, accelerating the uptake of the third and the fourth O2 molecules.
The co-operativity among its binding sites that results in the accelerated uptake of O
2 gives the oxy-hemoglobin dissociation curve its characteristic sigmoid
shape.
Bunn HF, Forget BG. Hemoglobin: molecular, genetic and clinical aspects. Philadelphia: WB Saunders; 1986.
Perutz MF. Molecular anatomy, physiology, and pathology of hemoglobin. In: Stamatoyannopoulos G, Nienhuis AW, et al. editors. The molecular basis of blood disorders. Philadelphia: WB Saunders; 1987.

552.3 The Bohr Effect and the Haldane Effect
2 2.3 The Bohr Effect and the Haldane Effect
Tissue capillaries
The CO2 exiting the tissues enters the red blood corpuscles
CO2 binding to globin and itstransport as carbamino-Hb
CO2 binds to an amino terminus of globin chain forming carbamino-Hb; 10 % of all CO2 is transported in this form.
CO2 transport as bicarbonate
80 % of CO2 is transported as bicarbonate. At the peripheral tissues oxygen is already being unloaded from hemoglobin. The deoxy-Hb (which is a superior to oxy-Hb as a proton acceptor) binds the H+ generated in the above reaction to its globin chains
Hemoglobin becomes stabilized in T-state: the CO2-Bohr effect
Hemoglobin becomes stabilized inT-(state): the acid-Bohr effect
The Bohr effect
The Bohr effect is the CO2– produced rightward shift of the ODC. This facilitates O 2 unloading to the tissues. The effect of CO 2 on the ODC is mostly on account of the decrease in pH that CO2
The Haldane effectO2 unloading favors CO2 uptake by hemoglobin by the Haldane effect. The CO 2 can then be transported to the lungs.
CO2 + H2O H2CO3 HCO3– + H+
Bohr C, Hasselbalch K, Krogh A. Ueber einen in biologischer Beziehung wichtigen Ein fl uss. den die Kohlen- sauerespannung des Blutes auf dessen Sauerstoffbinding ubt. Skand Arch Physiol. 1904;16:402.
Klocke RA. Mechanism and kinetics of the Haldane effect in human erythrocytes. J Appl Physiol. 1973;35:673–81.

56 2 The Non-Invasive Monitoring of Blood Oxygen and Carbon Dioxide Levels
2 2.4 Oxygenated and Non-oxygenated Hemoglobin
OxygenatedHb (syn: OxyHb)
Each Hb molecule has four heme sites to each of which an O2 molecule can bind. The percentage of O2 binding heme sites that bind to O2 is the O2 saturation (SpO2) of the blood. In other words SpO2 is the number of heme sites occupied by O2 of every 100 heme sites.
The SpO2 (as read out on the pulse oximeter (represents) the Oxy-Hb
NonoxygenatedHb
The percentage of heme sites that are not bound to O2 molecules.Non-oxygenated Hb includes:
Dexoxy-Hb (syn:reduced) HbThe percentage of heme groups that are not bound to O2.Reduced Hb % = 100 %– [SPO2 + MetHb + COHb] %∗
Met-HbThe percentage of heme groupsin the form of Met-Hb
Carboxy-HbThe percentage of heme groupsin the form of Carboxy-Hb
*See Co-oximetry (Sect. 2.10 )

57
2
Canham EM, Beuther DA. Interpreting arterial blood gases. Chest. 2007. PCCSU Article. 2 Jan 2007.
2.5 PaO2 and the Oxy-hemoglobin Dissociation Curve
2.5 PaO 2 and the Oxy-hemoglobin Dissociation Curve
Below a PaO2 of20 mmHg, the Oxy-
hemoglobindissociation curve isalmost flat; until the
PaO2 reaches20 mmHg, any
increase in PaO2that occurs on thissegment does nottranslate into an
increase in SpO2.
Once the PaO2 risesto about 20 mmHg
(at a PaO2 ofbetween20 mmHgand 60 mmHg), arelatively small
increase in PaO2 results in a
dramatic rise in SpO2.
Above a PaO2 of60 mmHg, the oxy-
hemoglobindissociation curve isagain flat, and the SpO2 is in the high
90s; from here on, anyfurther rise in SpO2
will result in littlefurther rise in SpO2.
Above ~ 60 mmHgBetween ~ 20 and60 mmHg
PaO2 below~ 20 mmHg
100
Left-shifted
Right-shifted
80
60
40
20
00 20 40
Partial pressure ofoxygen (mmHg)
oxyg
en s
atur
atio
n of
hem
oglo
bin
(%)
60 80 100
100
Left-shifted
Right-shifted
80
60
40
20
00 20 40
Partial pressure ofoxygen (mmHg)
oxyg
en s
atur
atio
n of
hem
oglo
bin
(%)
60 80 100
100
Left-shifted
Right-shifted
80
60
40
20
00 20 40 60 80 100
oxyg
en s
atur
atio
n of
hem
oglo
bin
(%)
Partial pressure ofoxygen (mmHg)
The following co-ordination points should be expected for an ODC that lies in its normal position:
PaO2 40 mmHg∗
Corresponds to SpO2 of 75 %
PaO2 of 70 mmHg
Corresponds to SpO2 of 92 % Corresponds to SpO2 of 97 %
PaO2 of 100 mmHg
(*As in mixed venous blood)

58 2 The Non-Invasive Monitoring of Blood Oxygen and Carbon Dioxide Levels
2 2.6 Monitoring of Blood Gases
2.6.1 Invasive O 2 Monitoring
Although direct measurement of arterial O 2 tension by arterial blood gas
(ABG) sampling is a very accurate way of assessing oxygenation, it has its disadvantages.
Intermittent ABG sampling Continous ABG sampling
Obviates the need for frequent arterial PuncturesGenerally used unstable clinical Situations where real time monitoring is required. Can also produce the complications that intermittent sampling is associated with.
Inconvenient Painful BlendingInfection Arterial thrombosisRarely, gangrene of extremity
2.6.2 The Non-invasive Monitoring of Blood Gases
Oxygenation
Real-timemonitoring bypulse oximetry
Ventilation
Real-timemonitoring bycapnography
Though it offers a convenient way of monitoring oxygenation in real time, pulse oximetry has its own disadvantages (Sect. 2.21 ).
Bongard F, Sue D. Pulse oximetry and capnography in intensive and transitional care units. West J Med. 1992;156:57.
Pierson DJ. Pulse oximetry versus arterial blood gas specimens in long-term oxygen therapy. Lung. 1990;168 Suppl:782.

592.7 Principles of Pulse Oximetry
2 2.7 Principles of Pulse Oximetry
Cyanosis is the clinical hallmark of hemoglobin desaturation.
Cyanosis is not always easy to assess at the
bedside
In an anemic patient cyanosis may be notoriously difficult to recognize.
•
Cyanosis requiresdeoxygenated Hb to fall
to 5 g/dl.
In severe anemia, not enough Hb may be available for deoxy-Hb to reach this level.
•
Severe hypoxia can therefore manifest without apparent cyanosis. Pulse oximetry, which does not suffer from these limitations, has been described
as “…the greatest advance in patient monitoring since electrography” and is today regarded as the “ fi fth vital sign”.
Older oximeters calculated the SpO 2 from the values of PaO
2 and pH, deriving
values through nomograms and the Severinghaus slide rule. Modern pulse oximetry is based upon two fundamental principles:
The principle ofspectro-photometry
• Used for measuring the percentages of oxyhemoglobin and deoxyhemoglobin in the blood
The principle of opticalplethysmography
• Used to display the amplitude of pulse and the heart rate
Comroe JH Jr, Botelho S. The unreliability of cyanosis in the recognition of arterial hpoxemia. Am J Med Sci. 1947;214:1.
Hanning CD, Alexander-Williams JM. Fortnightly review: pulse oximetry: a practical review. BMJ. 1995;311:367–70.
Neff TA. Routine oximetry: a fi fth vital sign? Chest. 1988;94:227.

60 2 The Non-Invasive Monitoring of Blood Oxygen and Carbon Dioxide Levels
2 2.8 Spectrophotometry
The principle of spectrophotometry is based upon on the Beer-Lambert law which states that “ …the concentration of light-absorbing species within a sample is a log-arithmic function of the amount of light absorbed by that sample .”
In respect of blood, the light-absorbing species are oxy-hemoglobin and deoxy-hemoglobin.
Two photodiodes emit light phasically at several hundred times per second, one at 660 nm (in the red band of the spectrum) and the other at 940 nm (in the infra-red band of the spectrum).
Oxyhemoglobin
Light emitted at 660 nm is better absorbed by saturated (oxygenated) haemoglobin.Oxygenated (red blood) absorbs light maximally in the infrared band.
Light emitted at 940 nm is better absorbed by reduced (deoxygenated) haemoglobin.Deoxygenated (blue blood) absorbs light maximally in the red band.
Deoxyhemoglobin
By making the diodes blink rapidly, it is possible to make about 600 measure-ments each second. The relative amount of light transmitted through the interposed tissue at these two wavelengths is compared to an algorithm of oxygen saturation derived from healthy human volunteers, and a microprocessor computes the patient’s SpO
2 based on this.
The phasic emission of light differentiates the light absorbance of the arterial blood from that of the light absorbance of venous blood and the surrounding tissue.
Hanning CD, Alexander-Williams JM. Fortnightly review: pulse oximetry: a practical review. BMJ. 1995;311:367–70.
Jubran A. Pulse oximetry. Intensive Care Med. 2004;30:2017–20.
Mendelson Y. Pulse oximetry: theory and applications for noninvasive monitoring. Clin Chem. 1992;38:1601.

612.9 Optical Plethysmography
2 2.9 Optical Plethysmography
Light transmitted through tissue is absorbed by static elements (muscle, bone, venous blood, and the static components of arterial blood), as well as the pulse added volume of arterial blood. The pulsatile arterial signal typically comprises 0.5–5 % of the total transmitted light.
The principle of optical plethysmography is made use of to display the amplitude of pulse and the heart rate. Each peak of the arterial waveform corresponds to one cardiac cycle. Occasionally a smaller secondary peak due to the venous pressure pulse can be distinguished. The phasic signal presented to the sensor, calculates the pulse amplitude according to the relative light absorbencies during systole and diastole.
Ventricular systole Ventricular diastole
Phasic increase of blood volume in perfused organs.
Phasic decrease of blood volume in perfused organs.
Light has to travel a longer distance through the distended subcutaneous tissue (of thefinger or ear lobe).
Light has to travel a shorter distance through the contracted subcutaneous tissue (of thefinger or ear lobe).
Light transmission through the sampling site decreases.
Light transmission through the sampling site increases.
This difference is made use of to generate a waveform which is displayed on the monitor.
Mendelson Y. Pulse oximetry: theory and applications for noninvasive monitoring. Clin Chem. 1992;38:1601.
62 2 The Non-Invasive Monitoring of Blood Oxygen and Carbon Dioxide Levels
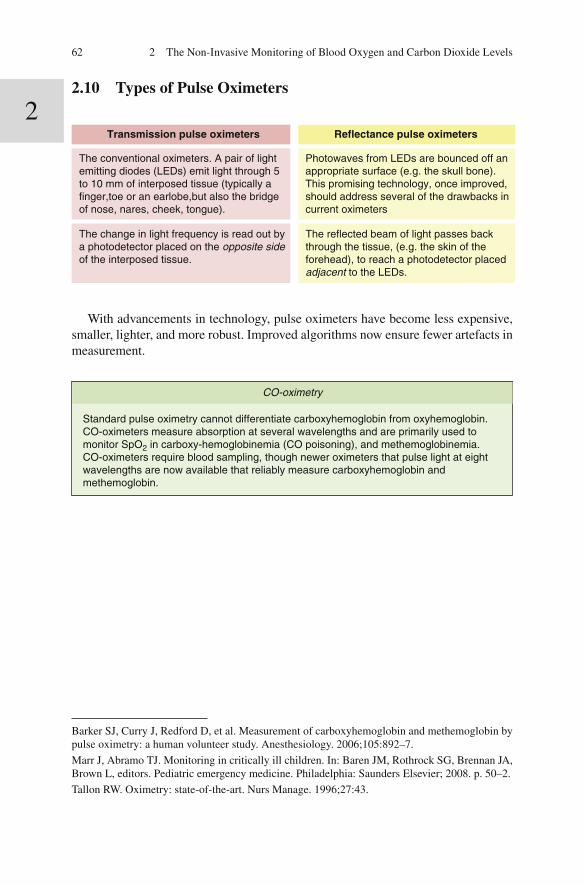
2 2.10 Types of Pulse Oximeters
Transmission pulse oximeters Reflectance pulse oximeters
The conventional oximeters. A pair of light emitting diodes (LEDs) emit light through 5 to 10 mm of interposed tissue (typically a finger,toe or an earlobe,but also the bridge of nose, nares, cheek, tongue).
Photowaves from LEDs are bounced off an appropriate surface (e.g. the skull bone).This promising technology, once improved, should address several of the drawbacks incurrent oximeters
The change in light frequency is read out by a photodetector placed on the opposite side of the interposed tissue.
The reflected beam of light passes back through the tissue, (e.g. the skin of the forehead), to reach a photodetector placedadjacent to the LEDs.
With advancements in technology, pulse oximeters have become less expensive, smaller, lighter, and more robust. Improved algorithms now ensure fewer artefacts in measurement.
CO-oximetry
Standard pulse oximetry cannot differentiate carboxyhemoglobin from oxyhemoglobin. CO-oximeters measure absorption at several wavelengths and are primarily used to monitor SpO2 in carboxy-hemoglobinemia (CO poisoning), and methemoglobinemia.CO-oximeters require blood sampling, though newer oximeters that pulse light at eight wavelengths are now available that reliably measure carboxyhemoglobin and methemoglobin.
Barker SJ, Curry J, Redford D, et al. Measurement of carboxyhemoglobin and methemoglobin by pulse oximetry: a human volunteer study. Anesthesiology. 2006;105:892–7.
Marr J, Abramo TJ. Monitoring in critically ill children. In: Baren JM, Rothrock SG, Brennan JA, Brown L, editors. Pediatric emergency medicine. Philadelphia: Saunders Elsevier; 2008. p. 50–2.
Tallon RW. Oximetry: state-of-the-art. Nurs Manage. 1996;27:43.

63
2
2.11 Pulse Oximetry and PaO2
2.11 Pulse Oximetry and PaO 2
One of the main disadvantages of oximetry is that it monitors oxygen saturation (SpO
2 ) and not the PaO
2 .
SpO2 can miss a drop in PaO2.
Major changes in PaO2 on the flat upper segment of the ODC can occur without appreciable changes in SpO2.
SpO2 is unreliable in severe hypoxemia.
Below an SpO2 of 80 %, oximetry is not dependable
SpO2 can be influenced by a shift of the oxy-hemoglobin dissociation curve.
Leftward shift of the oxy-hemoglobindissociation curve (as in alkalemia orhypothermia).
Hemoglobin is moresaturated relative to the PaO2. SpO2 canoverestimate the PaO2.
Rightward shift of the oxy-hemoglobindissociation curve (as in acidemia orfever).
Hemoglobin is less saturated relative to the PaO2. SpO2 canunderestimate the PaO2.
Lastly, stating the obvious, oximetry measures oxygenation but gives no infor-mation about ventilation ; for the latter, capnography or PaCO
2 measurements (by
arterial blood gas sampling) are required.
Ralston AC, Webb RK, Runciman WB. Potential errors in pulse oximetry. III: Effects of interfer-ence, dyes, dyshaemoglobins and other pigments. Anaesthesia 1991;46:291–295.
Stoneham MD. Uses and limitations of pulse oximetry. Br J Hosp Med. 1995;54:35.

64 2 The Non-Invasive Monitoring of Blood Oxygen and Carbon Dioxide Levels
2 2.12 P 50
100
80
60
Left-shifted
Right-shifted
40
Oxi
gen
satu
ratio
n of
hem
oglo
bin
(%)
20
0
0 20 40 60 80 100Partial pressure of oxygen (mmHg)
P50 < 26.6 mmHg
A lower than normal P50 means a leftward shifted ODC.
P50 > 26.6 mmHg
A higher than normal P50 means a rightward shifted ODC.
The position of the oxy-Hb dissociation curve (ODC) can be assessed from the P50,which is the PaO2 at which the Hb is 50 % saturated.
The normal P50 is 26.6 mmHg
P50

652.13 Shifts in the Oxy-hemoglobin Dissociation Curve
2 2.13 Shifts in the Oxy-hemoglobin Dissociation Curve
Leftward shift of the ODC occurs in thefollowing conditions:
Alkalemia Hypothermia Abnormal hemoglobins, e.g: Carboxy-hemoglobin Met-hemoglobin Fetal hemoglobinMyxedema Low inorganic phosphates Acute pancreatitis∗
Implications of a leftward shifted ODC:
The PaO2 is low relative to the SpO2.
With a left-shifted ODC the SpO2 may be falsely reassuring, and the PaO2 may be lower than expected.
SpO2 overestimates the oxygenation(i.e. PaO2).
Rightward shift of the ODC occurs in thefollowing conditions:
Acidemia Fever Abnormal hemoglobins,e.g.: Hb KansasThyrotoxicosis Raised inorganic phosphateAnemia Steroid therapy
Implications of a rightward shifted ODC:
The PaO2 is high relative to the SpO2.
The right shifted ODC facilitates oxygen delivery to the peripheraltissues.
SpO2 underestimates the PaO2.
Within the blood: “Looser” binding of O2 to Hb.At the peripheral tissues:
With a right shifted ODC, although the SpO2 is lower, more of the O2 (which is relatively loosely bound to the Hb) is released to the tissues.
Within the blood: Tighter binding of O2 to Hb.At the peripheral tissues: With a left shifted ODC, SpO2 is higher,
but less of the O2 (which is tightly boundto the Hb) is released to the tissues.
*Linolenic acid, Linoleic acid and Oleic acid, the fatty acids released into the circulation as a result of pancreatic cell destruction, bind to hemoglobin and increase its af fi nity for O
2 .
Greenberg AG, Terlizzi L, Peskin G. Oxyhemoglobin af fi nity in acute pancreatitis. J Surg Res. 1977;22:561–5.

66 2 The Non-Invasive Monitoring of Blood Oxygen and Carbon Dioxide Levels
2 2.14 Oxygen Saturation (SpO 2 ) in Anemia and Skin
Pigmentation
Anemia unless it is very severe (Hb < 5 g/dl) does not influence
the SpO2.
Since SpO2 is expressed as a percentage of the available binding sites for O2, anemia can
critically affect the O2 content of theblood (CaO2), but has virtually no impact
on SpO2.
The amount of Hb in theblood determines the O2
content of the blood, not theSpO2.
The colour of the interposed tissue can in fl uence the SpO 2 .
Skin pigmentation
Minor and inconsistent effect on SpO2. However some studieshave shown that racial pigmentation may cause as much as 4 % difference in measuredSpO2.
Hyper-bilirubin-
emia
Minimal effect on SpO2.
Nail polish
Red nail polishMay have a trivial effect on SpO2.
Other shades of nail polish May produce a spurious fall in SpO2 of as muchas 3–6 %.
Schnapp LM, Cohen NH. Pulse oximetry: uses and abuses. Chest. 1990;98:1244.

67
2
2.15 Oxygen Saturation (SpO2) in Abnormal Forms of Hemoglobin
2.15 Oxygen Saturation (SpO 2 ) in Abnormal Forms of Hemoglobin
Abnormal forms of hemoglobin can have very different absorption spectra, and oximetric readings (SpO
2 ) can overestimate the true oxygen saturation of Hb (see
Sect. 2.20 )
CO-Hb* SpO2 over-estimates SaO2
CO-Hb has an almost identical absorption spectrum (660 ηm) to oxy-Hb.
Fetal Hb Has no special impact on SpO2
Hb-S*** Variably affects SpO2
Hb-S has a similar absorption spectrum to oxy-Hb.
Hb-S can lead to spuriously high or low SpO2 values.
Met-Hb**SpO2 over-estimates SaO2
Met-Hb absorbs light at both wavelengths 660 ηm and 940 ηm) that standardoximeters emit. Becauseof this property, Met-Hbhas a complex effect onSpO2.
At low levels of Met-Hb, SaO2overestimates the SpO2. When Met-Hb levels increase to over 30 %, SpO2 tends to drift towards 85 %, which is a gross overestimation of SaO2. Presumptive diagnosis is by CO-oximetry; it is confirmed by the Evelyn-Malloy method (Sect. 2.26 and 2.27).
Because the oximeter interprets CO-Hb asnormal Hb, normal SpO2 can be displayedeven in severe hypoxia. Diagnosis is by CO-oximetry (Sect. 2.19).
*Carboxy-hemoglobin **Met-hemoglobin *** in Sickle-cell disease
Barker SJ, Curry J, Redford D, et al. Measurement of carboxyhemoglobin and methemoglobin by pulse oximetry: a human volunteer study. Anesthesiology. 2006;105:892–7.
Eisenkraft JI, Pulse oximeter desaturation due to methemoglobinemia. Anesthesiology. 1988;68:279.
Ernst A, Zibrak JD. Carbon monoxide poisoning. New Engl J Med. 1998;339:1603–8.
Evelyn K, Malloy H. Microdetermination of oxyhemoglobin, methemoglobin, and sulfhemoglo-bin in a single sample of blood. J Biol Chem. 1938;126:655.
Ortiz FO, Aldrich TK, Nagel RL, Benjamin LJ. Accuracy of pulse oximetry in sickle cell disease. Am J Respir Crit Care Med. 1999;159:447.

68 2 The Non-Invasive Monitoring of Blood Oxygen and Carbon Dioxide Levels
2 2.16 Mechanisms of Hypoxemia in Methemoglobinemia
Normal hemoglobin
Normal hemoglobin carries its iron as ferrous ions.Hb is capable of binding O2 provided the ferrous iron remains in its reduced state. The special configuration of the hemoglobin chains appears to protect the ferrous ions from oxidation to the ferric state. Pulmonary capillariesIn the pulmonary capillaries each ferrous iron moiety binds an O2 atom, in the process briefly donating an electron to the latter.Tissue capillariesAt the tissue capillary level the O2 atom cleaves awayfrom the Hb molecule, in the process reacquiring its electron. The reduction of the iron back to its ferrous form makes it free to bind and transport O2 again.
Met-Hb carries its iron as ferric ions.Met-Hb, as opposed to deoxy-Hb carries its iron in the ferric form, in which state it is unable to bind O2. That amount of Hb that exists as Met-Hb cannot participate in O2 transport. Also, the ferrous iron that is present in the adjacent hemoglobin chains binds more strongly to O2 than usual. The oxygen dissociation curve is shifted to the left leaving little O2 for the tissues.
Methemoglobin
Methemoglobin has peak absorbance at 631 h m. CO-oximeters use a fi xed wave-length to screen for methemoglobin: all readings in the 630 h m range are reported as methemoglobin. Several pigments (including sulfhemoglobin and methylene blue) can evoke false positive results.
Curry S. Methemoglobinemia. Ann Emerg Med. 1982;11:214–21.
Wright RO, Lewander WJ, Woolf AD. Methemoglobinemia: etiology, pharmacology, and clinical management. Ann Emerg Med. 1999;34:646–56.

692.17 Methemoglobinemias: Classification
2 2.17 Methemoglobinemias: Classi fi cation
Methemoglobinemias can be classi fi ed into the hereditary methemoglobinemias and the acquired methemoglobinemias.
e.g.:
The acquiredmethemoglobinemias aredue to extrinsic agents,which result in increased formation of Met-Hb.
• p-Amino salicylic acid• Aniline dyes • Benzene derivatives• Clofazimine • Chlorates• Chloroquine• Dapsone• Local anesthetic agents• Metoclopramide • Nitrites (eg Amyl nitrite, Nitroglycerin) • Nitric oxide• Phenacetin • Primaquine • Sulfonamides
In the hereditary methemoglobinemias, faultypathways result in decreased reduction of Met-Hb,which consequently accumulates.
Cytochrome b5reductase deficiency: Normally about 0.5–3 %of Hb is converted toMet-Hb daily by auto-oxidation.Some of this Met-Hbgets reduced back Hb (by a NADH dependent, cytochrome b5reductase catalysedreaction 0. As a result, Met-Hbcomprises about 1 % of total Hb in the blood. Cytochrome b5reductase deficiencycan result in increased methemoglobin levels.
Hemoglobin-M disease: As a result of amutation in the alpha or beta globinchain, tyrosinereplaces one of thehistidine residues. Ferric phenolatecomplex formed: Fe+++ cannot beeffectively reduced to the ferrous state.Persistent lifelongmethemoglobinemiaoccurs.
Curry S. Methemoglobinemia. Ann Emerg Med. 1982;11:214–21.
Jaffe ER. Enzymopenic hereditary methemoglobinemia: a clinical/biochemical classi fi cation. Blood Cells. 1986;12:81–90.
Prchal JT. Clinical features, diagnosis and treatment of methemoglobinemia. In: Basow DS, edi-tors. UpToDate. Waltham: UpToDate; 2012. Last updated 22 Mar 2012. Last accessed 13 May 2012.

70 2 The Non-Invasive Monitoring of Blood Oxygen and Carbon Dioxide Levels
2 2.18 Sulfhemoglobinemia
STEP 1: Oxidation of Hb to methemoglobin
First, the oxidation of the ferrous to ferric iron results in the formation of methemoglobin.
STEP 2: Formation of sulfhemoglobin
Next, the exposure to specific agents results in covalent binding of the sulfur atom to heme, resulting in the formation of sulfhemoglobin.
Sulfhemoglobin, likemethemoglobin, can neither transport O2 nor CO2.
Similarities withmethemoglobinemia
Differences with methemoglobinemiaRight shift of ODCUnlike Met-Hb, Sulf-Hb causes a right shiftof ODC and so relatively more oxygen is released to the tissues.
Severity of hypoxiaHypoxia in sulfhemoglobinemia is not as severe as that in methemoglobinemia.
Sulfhemoglobinemia is irreversibleUnlike methemoglobinemia, sulfhemoglobinemia is irreversible.
Oximeters that measure Met-Hb can erroneously read Sulf-Hb as Met-Hb
Park CM, Nagel RL. Sulfhemoglobinemia. N Engl J Med. 1984;310:1579–84.

712.19 Carbon Monoxide (CO) Poisoning
2 2.19 Carbon Monoxide (CO) Poisoning
The incomplete combustion of hydrocarbons leads to the formation of CO, a colour-less, odourless gas. Normally, the levels of carboxy-hemoglobin (CO-Hb) are <3 % of total Hb in the urban population; smokers have a CO-Hb level of 5–10 % of total Hb in their blood. At levels above 50 %, CO-Hb is capable of causing death.
Mechanism of hypoxemia in CO poisoning
Compared to O2, COcombines 150–550 times as
avidly with Hb.
O2 is displaced from the Hbmolecule by CO.
This decreases the O2carrying capacity of the
blood.
Less O2 is unloaded at thetissues resulting in tissue
hypoxia.
Much of the remaining O2is tightly bound to
the Hb.
CO shifts the oxyhemoglobindissociation curve to the left.
Absorbancespectrum ofCO is verysimilar to
Hb.
CO is thereforereported by
standard pulseoximeters as
oxy-Hb.
This results infalsely high
(overestimation)of O2
saturations).
CO-oximetry (multi-wavelength spectrophotometry that separately measures CO-Hb, Oxy-Hb, and reduced Hb) reliably measures CO levels and should be used when CO poisoning is suspected (Sect. 2.10 ).
Caughey WS. Carbon monoxide bonding in hemeproteins. Ann N Y Acad Sci. 1970;174:148.
Weaver LK. Carbon monoxide poisoning. Crit Care Clin. 1999;15:297.

72 2 The Non-Invasive Monitoring of Blood Oxygen and Carbon Dioxide Levels
2 2.20 Saturation Gap
The O2 analyses by the pulse oximeter and the ABG are based upon the premise that only two forms of Hb are possible: Oxyhemoglobin and deoxyhemoglobin; and that no abnormal forms of hemoglobin are present.
SpO2 (low)
The Hb saturation of O2 asmeasured by pulse oximetry.
SaO2 (normal)
The Hb saturation of O2 as calculated by the ABG machine.
The pulse oximeter measures light absorbance at two wavelengths (2.08). With significant levels ofmethemoglobin in the blood,the SpO2 drifts towards85 % (2.16).
The saturation gapWhen the difference in SaO2 and SpO2 is >5 %, a saturation gap is said to exist. A saturation gap is a clue to significant levels of certain abnormal hemoglobins in the blood (Sect. 2.15, 2.16, 2.17, 2.18 and 2.19).
The ABG machine first measures the PaO2 and then calculates the expected SaO2 from this, based on the position of the oxyhemoglobin dissociation curve. Inthe absence of cardiopulmonary disease, the SaO2 (not being dependent on oxy-Hb concentration) will be normal even though abnormal hemoglobins be present.
Eisenkraft JI. Pulse oximeter desaturation due to methemoglobinemia. Anesthesiology. 1988;68:279.
Haymond S, Cariappa R, Eby CS, Scott MG. Laboratory assessment of oxygenation in methemo-globinemia. Clin Chem. 2005;51(2):434–44.
Mokhlesi B, Leiken JB, Murray P, Corbridge TC. Adult toxicology in critical care, part I: general approach to the intoxicated patient. Chest . 2003;123:577–92.
Oesenberg B. Pulse oximetry in methaemoglobinemia. Anaesthesia. 1990;45:56.

73
2
2.21 Sources of Error While Measuring SpO2
2.21 Sources of Error While Measuring SpO 2
Time lag
Output stabilization:There is often a time lag between a change in O2 saturation and its detection by the oximeter. The signal averaging by the oximeter may take several seconds. This can be disadvantageous in a rapidly changing clinical situation. Modern pulse oximeters take less than a minute for output stabilisation to occur. Subsequent SpO2 changes usually take less than ten seconds to register. Response time: toe>finger>earlobe.
Weak signal
Hypoperfusion of the interposed part: SpO2 falsely lowVasoconstrictionBP < 80 mmHgInflation of a BP cuffEdema of an extremity
Noise amplification:When the pulse is weak, the pulse oximeter boosts its amplitude. In doing so it may amplify the background noise and lead to errors. Most current devices warn of weak pulse strength may simply not display the saturation.
Proximity toinstruments
MRI scannersCell-phonesElectrical interference Power outlets and cords, cardiac monitors, cautery devices etc.
Motionartifact
ShiveringConvulsionsMovement
Arrythmias Irregular rhythms such as atrial fibrillation can unpredictably affect displayed values.
Opticalissues
Optical shunt: underestimation of the SpO2Light from the photodiode reaches the photodetector without passing through the interposed part (penumbra effect). A calculated SpO2 (usually in the low eighties) will result in underestimation of the actual SpO2. Light interference: underestimation of the SpO2 Light interference may occur by extraneous light directly impinging on the photodetector especially if the probe is too large or improperly placed. Ambient light, direct sunlight, fluorescent, infrared, and xenon lamps may cause interference. The calculated SpO2 tends towards 85 % and is therefore underestimated. Execptionally (strong ambient light, completely displaced probe), the SpO2 may be falsely high.

74 2 The Non-Invasive Monitoring of Blood Oxygen and Carbon Dioxide Levels
2 To avoid errors, the amplitude of the pulse waveform should be routinely checked.
In the presence of a satisfactory waveform with an observable dicrotic notch, the SpO
2 readings are likely to be correct. A close agreement between the displayed
pulse rate on the oximeter and the manually counted pulse rate suggests that the SpO
2 reading is likely to be correct. When the pulse signal is strong, pulse oximeters
are accurate provided saturations range above 80 %. At lower saturations however, they lose some of their reliability. When the stroke output fl uctuates synchronously with the respiratory cycle (such as in a ventilated patient who develops auto-PEEP), the tracing will oscillate noticeably about the baseline.
Rarely, pulse oximetry has been associated with complications. Prolonged use on hypoperfused digits can potentially cause digital injury. Metal components of oximeter probes will heat up in strong electromagnetic fi elds, and the use of non-MRI compatible oximeter probes during MRI scanning has been associated with thermal injury.
Cannesson M, Attof Y, Rosamel P, et al. Respiratory variations in pulse oximetry plethysmo-graphic waveform amplitude to predict fl uid responsiveness in the operating room. Anesthesiology. 2007;44(4):273–9.
Costarino AT, Davis DA, Keon TP. Falsely normal saturation reading with the pulse oximeter. Anesthesiology. 1987;67:830–1.
Dempsey MF, Condon B. Thermal injuries associated with MRI. Clin Radiol 2001;56:457–65.
Gehring H, Hornberger C, Matz H, et al. The effects of motion artifact and low perfusion on the performance of a new generation of pulse oximeters in volunteers undergoing hypoxemia. Respir Care. 2002;47:48.
Hinkelbein J, Genzwuerker HV, Fielder F. Detection of a systolic pressure threshold for reliable readings in pulse oximetry. Resuscitation. 2005;64:315.
Kelleher JF, Ruff RH. The penumbra effect: vasomotion–dependent pulse oximeter artifact due to probe malposition. Anesthesiology. 1989;71:787–91.
Lee WW, Mayberry K, Crapo R, Jensen RL. The accuracy of pulse oximetry in the emergency department. Am J Emerg Med. 2000;18:427.
Poets CF, Seidenberg J, von der Hardt H. Failure of a pulse oximeter to detect sensor displacement. Lancet. 1993;341:244.
Ralston AC, Webb RK, Runciman WB. Potential errors in pulse oximetry. III: Effects of interfer-ence, dyes, dyshaemoglobins and other pigments. Anaesthesia 1991;46:291–295.
Van de Louw A, Cracco C, Cerf C, et al. Accuracy of pulse oximetry in the intensive care unit. Intensive Care Med. 2001;27:1606.
Wille J, Braams R, van Haren WH, et al. Pulse oximeter–induced digital injury: frequency rate and possible causative factors. Crit Care Med. 2000;28:3555–7.

752.22 Point of Care (POC) Cartridges
2 2.22 Point of Care (POC) Cartridges
Point of Care (POC) cartridges are now in use for the bedside measurement of the pH, PaCO
2 and PaO
2 .
Heparinized blood is drawninto the POC cartridge
pH PaCO2 O2
Measured by direct
potentiometry
Measured bydirect
potentiometry
Measured byamperometry
Values derived:
SpO2 HCO3 tCO2 Base excess
Advantages: Disadvantages:
Reports are quickly obtained
High cost, inconsistent accuracy; does not
incorporate co-oximetry
Canham EM. Interpretation of arterial blood gases. In: Parsons PE, Weiner-Kronish JP, editors. Critical care secrets. 3rd ed. Philadelphia: Hanley and Belfus, Inc, 2003; p. 21–4.

76 2 The Non-Invasive Monitoring of Blood Oxygen and Carbon Dioxide Levels
2 2.23 Capnography and Capnometry
Capnography Capnometry
Capnography is the real time monitoring of the exhaled CO2 over time (or sometimes, over volume): it is displayed as a waveform.
Capnometry is the non-invasive measurement of exhaled CO2, which is displayed as an end expiratory (end-tidal) value.The inspiratory and expiratory levels of CO2 are shown as a partial pressure or percentage on a digital or analog display. However, the terms capnography and capnometry are often used interchangeably.
TimeCapnography:The CO2 levelsdisplayed against time on the x axis.
VolumeCapnography:
The CO2 levelsdisplayed against expired volume on the x axis.
Waveform analysis can provide valuable information regarding the adequacy of gas sampling, and leaks in tubing, and can identify certain prevailing disorders.
Capnograph waveform analysis provides information on CO2 production, alveolar ventilation, perfusion, breathing pattern, status of the ventilator circuit and endotracheal tube position.
Height (EtCO2) Frequency Shape Height
EtCO2 is the maximum partial pressure of CO2 achieved at end-exhalation (Sect. 2.24).
Frequencyrepresents the respiratory rate.
Can provide informationabout specific abnormalities (Sects. 2.35, 2.36 and 2.37).
See (Sect. 2.35)
*CO 2 measurements techniques use Raman spectrography, mass spectrography, photoacoustic
spectrography and chemical colorimetric analysis and infrared spectrography. The last is the most widely used. Single-use qualitative colorimetric end-tidal CO
2 detectors use indicator discs that
change color when the CO 2 concentration of exhaled gas exceeds 2 %: from purple (EtCO
2 < 3 mmHg)
to yellow (EtCO 2 > 15 mmHg).
Sullivan KJ, Kissoon N, Goodwin SR. End–tidal carbon dioxide monitoring in pediatric emergen-cies. Pediatr Emerg Care. 2005;21(5):327–32.

772.24 The Capnographic Waveform
2
Stock MC. Capnogrophy for adults. Crit Care Clinics. 1995;11:219.
2.24 The Capnographic Waveform
The capnographic wave form is divided into six distinct parts.
A–B: dead-spaceexhalation
The first part of exhalation contains air from the proximal airway (the conductive zone of the lung).
This air is devoid of CO2, (providedthere is no rebreathing) and so the CO2 waveform is a flat line that hugsthe baseline.
Alveolar air contains CO2. B: the onsetof alveolarexhalation
As alveolar air begins to arrive atthe sampling site, the capnograph shows a sudden upturn.
B–C: the continuanceof alveolar exhalation
The CO2 rises rapidly as alveolargas mixed with dead-space gasarrives at the sensor.
C–D: thealveolarplateau
Most of the gas received at the sensor is now alveolar gas.
D: End-tidalCO2 (EtCO2)
The peak at the end of the plateau represents the averagingof alveolar CO2 levels.
D–E: inspiratorywashout
The graph then falls rapidly to thebaseline.
The nadir represents the negligible CO2 (0.003 % or 0.02 mmHg) that reaches the alveoli from the ambient air.
The peak representsthe end-tidal CO2.
The gradually upsloping plateau represents the constant emptyingof viable alveoli.
The capnograph showsa steep upslope.
A–B
B–C
C–D
D–E
D
B

78 2 The Non-Invasive Monitoring of Blood Oxygen and Carbon Dioxide Levels
2 2.25 Main-Stream and Side-Stream Capnometers
Mainstream capnometers
A CO2 sensor (infrareddetector) mounted on acuvette (T- adapter) isinterposed between the ET and the patient-circuit. CO2 analysis is performed within the airway,obviating the need for need forgas sampling
There is no sampling tube. Sensor windows are prone to clogging by secretions, aerosols or water droplets.
No time lag owing to the centrally located processor.
Unaffected by changes in water vapour pressure. The temperature within is maintained at around 39°C to prevent condensation (which can spuriously elevate EtCO2).
Cannot be used in the absenceof an artificial airway.
Difficult to use in patients undergoing prone ventilation.
Sterilization is difficult.
Can increase circuit dead-space & so elevate PaCO2
Side-stream capnometers
A relatively long sampling tube connected to the piece draws away the gas sample to a CO2 sensor located in a central unit. The sampling flow rate can be as high as 150 ml/min. This can result in substantial deformation of the waveform when low tidal volumes are used as in neonates and infants.
Side stream capnometers using micro-streamtechnology have been developed. Usingsampling flow rates of as low as 50 ml/min∗∗. The emitted wavelength is within a narrowerIR band (4.2–4.35 µm) which more closelymatches the absorption spectrum for CO2.
Easy to sterilize.
Relatively easy to connect in unusual positions (such as prone position).
Since exhaled gas is sampled from the nasal cavity using nasal adaptors, measurement ispossible in the absence of an artificial airway.
Affected by changes in water vapour pressure. By slightly modifying the standard nasal cannulae, it is possible to make fairly precise measurements even in patients breathing supplemental oxygen through nasal cannulae.
Time lag in display (CO2 flight time) owing to the distance of the sensor from the airway.
Sampling tube prone to becoming obstructed as secretion can be sucked in by the rapid aspiration rate. Leakages from the circuit are possible (Sect. 2.27)
*Burns may occur if the heated sensing head lies in contact with the patient’s skin. **The rate of gas sampling ranges from 50 to 2,000 ml/min (usually 50–200 ml/min). When the sampling fl ow rate exceeds the expired gas fl ow, contamination from the base gas fl ow source is inevitable.
Kalenda Z. Mastering infrared capnography. Utrecht, The Netherlands: Kerckebosch-Zeist, 1989, p101.
Moon RE, Camporesi EM. Respiratory monitoring. In: Miller RD, editor. Miller’s anesthesia. 6th ed. Philadelphia: Elsevier/Churchill Livingstone; 2005.

79
2
2.26 PEt
CO2 (E
tCO
2): A Surrogate for PaCO
2
2.26 P Et CO 2 (E t CO 2 ): A Surrogate for PaCO 2
CO 2 diffuses rapidly across all biological membranes including the alveolo- capillary
membrane. Arterial CO 2 (PaCO
2 ) equilibrates rapidly with alveolar CO
2 (PACO
2 ),
and is effectively identical with it. P Et
CO 2 offers a non-invasive means of monitoring
PaCO 2 , given that:
In health: In disease:
The value of PEtCO2 is close to the value of PACO2; and therefore to that of PaCO2. PaCO2 and PACO2 differ by such a small amount (generally < 5 mm) such as usually makes no clinical difference.The trends in PEtCO2 closely match the trends in PaCO2.
In disease, physiological dead-space is often increased because of patent but under-perfused alveoli. Due to the lack of an effective pulmonarycirculation CO2 cannot effectively diffuse into alveoli. Under such circumstances, PaCO2 can substantially exceed PEtCO2. In spite of this, in the absence of major changes in dead-spaceventilation, the PEtCO2 trends still match those of PaCO2.
CO2 values cannot be used as an absolute surrogate for PaCO2. However the EtCO2 may be expected to parallel the changes in PaCO2 (i.e, the [A-a]CO2 gradient remains constant)
provided that:
Stable cardiaccondition
Stable pulmonarycondition
Stable bodytemperature
Fletcher R, Jonson B. Deadspace and the single breath test for carbon dioxide during anaesthesia and arti fi cial ventilation. Br J Anaeasth. 1984;56:109–19.
Nunn JF, Hill DW. Respiratory dead space and arterial to end-tidal CO 2 tension difference in anes-
thetized man. J Appl Physiol. 1960;15:383–9.
Shankar KB, Moseley H, Kumar Y, Vemula V. Arterial to end-tidal carbon dioxide tension differ-ence during cesarean section anaesthesia. Anaesthesia. 1986;41:698–702.

80 2 The Non-Invasive Monitoring of Blood Oxygen and Carbon Dioxide Levels
2 2.27 Factors Affecting P Et CO 2
Factors that increase PEtCO2 Factors that decrease PEtCO2
Increase in CO2 production*:Fever, shivering, convulsions; infusion of NaHCO3, blood, glucose or parenteral nutrients Release of a tourniquet CO2 insufflation or embolism
Increase in pulmonary perfusion:Increase in cardiac output Increase in blood pressure
Decrease in alveolar ventilation:Hypoventilation (see Sect. 1.35)
Airway related problemsBronchial intubation Partial airway obstruction
Machine-related factors:CO2 scrubber used up Insufficient inflow of fresh gas Leaks in circuit Malfunctioning ventilator valves
Machine-related factors:Circuit disconnection Leakage of gas during sampling: gas pump, flow regulator, sampling system (connector to the sampling port, water trap) Malfunction of ventilator
Airway related problemsAccidental extubation Partial or complete airway obstruction Apnea
Increase in alveolar ventilationHyperventilation
Decrease in pulmonary perfusion:Decreased cardiac output Fall in BP, hypovolemia Pulmonary embolism Wedged PA catheter
Decreased CO2 production:Hypothermia
*Unlike in paralyzed mechanically ventilated patients, an increase in CO 2 production will not lead
to a rise in P Et
CO 2 in spontaneously breathing individuals (owing to the re fl ex hyperventilation that
a high CO 2 level evokes in these persons).
(Modi fi ed from: Kodali BS. Factors in fl uencing P Et
CO 2 . 2007. Welcome to capnography.com . Last
accessed 6 June 2012.)
Shankar KB, Moseley H, Kumar AY, Delph Y. Capnometry and anaesthesia. Review article. Can J Anaesth. 1992;39(6):617–32.

81
2
2.28 Causes of Increased PaCO2-P
EtCO
2 Difference
2.28 Causes of Increased PaCO 2 -P Et CO 2 Difference
Increased PaCO2-PEtCO2 difference, (a-A)CO2
Increased physiological dead-space:
Regional decrease in pulmonaryperfusion
Decreased pulmonary perfusion Increased CO2production
As a cause of increased A-aCO2, increased PaCO2is distinctly uncommon. In such cases, the increase in A-aO2is usually transient.
Increased a-ACO2 difference implies increased dead-space.Very rarely is a sharp increase in CO2 production
responsible for a widened a-ACO2.
Global decreasein pulmonary
perfusion
Decrease in LVoutput Pulmonary
embolism
Phan CQ, Tremper KK, Lee SE, Barker SJ. Noninvasive monitoring of carbon dioxide: a compari-son of the partial pressure of transcutaneous and end-tidal carbon dioxide with the partial pressure of arterial carbon dioxide. J Clin Monit. 1987;3:149–54.

82 2 The Non-Invasive Monitoring of Blood Oxygen and Carbon Dioxide Levels
2 2.29 Bohr’s Equation
It is possible to estimate the dead space, utilizing Bohr’s equation.
All the exhaled CO2 comes from the alveolar gas. None of the exhaled CO2 comes from the dead-space air. Therefore,
Or, tidal volume (VT) = Alveolar gas volume (VA) + dead-space gas(VD) Rearranging,
VT = VA + VD
VA = VT-VD ...(Eq 2.1)
VT × FECO2 = VA × FACO2 ...(Eq 2.2)Where,VT = tidal volumeFECO2 = Fractional concentration of CO2 in exhaled gasVA = Alveolar gas volumeFACO2 = Fractional concentration of CO2 in alveolar gas
VT × FECO2 = (VT-VD) × FACO2
VD/VT = (FACO2−FECO2) / FACO2
Substituting the value of VA (Eq 2.1) within Eq 2.2
Therefore,
VD/VT = (PACO2 − PECO2)/PACO2
VD/VT = (PaCO2 − PECO2)/PaCO2
Since the partial pressure of a gas is proportional to itsconcentration, the equation can be rewritten as “Bohr's equation”:
And since the PCO2 of alveolar gas (PACO 2) very nearly equals thePCO2 of arterial gas (PaCO2),
Thus, by simultaneously measuring the end-expiratory CO 2 (P
Et CO
2 ) and the
PaCO 2 , the dead-space to tidal volume ratio can be calculated (see Sect. 2.30 ).
Criner GJ, D’Alonzo G, editors. Pulmonary pathophysiology. Lyndell: Fence Creek Publishing Co.; 1998.
Shankar KB, Moseley H, Kumar AY, Delph Y. Capnometry and anaesthesia. Review article. Can J Anaesth. 1992;39(6):617-32.

832.30 Application of Bohr’s Equation
2 2.30 Application of Bohr’s Equation
Consider the following data in a patient:
Tidal volume (VT) = 500 mLBreaths per minute (f) = 12Minute ventilation = 6,000 mL/minPaCO2 = 40 mmHgEtCO2 = 30 mmHg
VD/VT = (PaCO2−PECO2)/PaCO2VD/VT = (40−30)/40VD/VT = 10/40 = 0.25(The normal VD/VT is 0.20–0.35 at rest)
With a VD/VT of 0.25 and a tidal volume of 500 mL,VD = 0.25 × 500 = 125 mLWe know that alveolar ventilation = (VT−VD) × fAlveolar ventilation = (500 − 125) × 12 = 4,500 mL
Criner GJ, D’Alonzo G, editors. Pulmonary pathophysiology. Lyndell: Fence Creek Publishing Co.; 1998.

84 2 The Non-Invasive Monitoring of Blood Oxygen and Carbon Dioxide Levels
2 2.31 Variations in E t CO 2
Discrepancy between the PaCO2 and the PEtCO2 can occur when there is anincrease in the dead-space, or if
a significant V/Q mismatch occurs. The impact of pulmonary disease on PEtCO2
is unpredictable and widening of the gradient often occurs.
On rare occasions, when largetidal volumes are used toinflate lungs with low-V/Q
ratios, the PEtCO2 may actuallyexceed the PaCO2
Since CO2 is an easily diffusible gas with respect to biological membranes,the drop in the end-tidal CO2 tension relative to arterial CO2 is only about
2–5 mmHg. However, this is at best a rough approximation and in diseasethe end-tidal CO2 may be prone to substantial variation.
High concentrations of either oxygen or nitrous oxide may cause variations in thecapnogram as both these gases have
similar infrared spectra to CO2 and correctionfactors should be applied when mixtures of
these gases are breathed.
Thus, in health, trends in arterial CO 2 are matched by the end-tidal CO
2 . With
unstable or evolving lung pathology, the end-tidal CO 2 may neither re fl ect nor paral-
lel changes in PaCO 2 .
Moorthy SS, Losasso AM, Wilcox J. End-tidal PCO 2 greater than PaCO
2 . Chest. 1984;12:534.

852.32 False-Positive and False-Negative Capnography
2 2.32 False-Positive and False-Negative Capnography
FALSE NEGATIVE (a flat wave form in spite of a properly sited endotracheal tube)
Cardiac arrest The sluggish pulmonary blood flow delivers little CO2 to the alveoli for excretion.
Large air leak(e.g. rupturedET cuff)
A large amount of atmospheric air dilutes the exhaled air the CO2-concentration of which resultantly falls.
An obstructedET tube
CO2 from the exhaled air has no access to the capnograph sensor.
FALSE POSITIVE (CO2 detected on the capnograph in spite of a improperly sited endotracheal)
Endotracheal tipresides with in thepharynx
In spite of this effective (or partially compromised) ventilation may still be possible.
Aggressive‘bagging’
Aggressive bag-and-mask ventilation has resulted in gastric distension with CO2 containing air.
Carbonatedbevereges
In animal studies, ingestion of carbonated beverages has also resulted in false positive capnographic measurements.
When capnography is false positive, the E t CO
2 values will inevitably decline
over successive breaths. It has therefore been suggested that E t CO
2 levels be closely
monitored for a minimum of six successive breaths. The shape of the capnograph remains remarkably similar in all healthy humans.
This of course means that any deviation from the typical shape must be inquired into (see following sections).
Hasan A. Esophageal intubation. In: Understanding Mechanical Ventilation: a Practical Handbook. London: Springer; 2010. p.183, 309–10.
Puntervoll SA, Soreide E, Jacewicz W, et al. Rapid detection of oesophageal intubation: take care when using colorimetric capnometry. Acta Anaesthesiol Scand. 2002;46(4):455–7.
Qureshi S, Park K, Sturmann K, et al. The effect of carbonated beverages on colorimetric end–tidal CO(2) determination. Acad Emerg Med. 2000;7(10):1169.

86 2 The Non-Invasive Monitoring of Blood Oxygen and Carbon Dioxide Levels
2 2.33 Capnography and Cardiac Output
When alveolar ventilation is constant, the P Et
CO 2 re fl ects pulmonary perfusion,
which itself is dependent upon the cardiac output.
Fall in cardiac output
A sudden fall in cardiac output can decrease the PEtCO2by the following mechanisms
Decrease in venous returnDecreased perfusion
of the lungs
Less CO2 is delivered tothe lungs
Increase in dead-space
Fall in PEtCO2: The fall inPEtCO2 parallels the fall in
cardiac output
Fall in PEtCO2: This is moreobvious in relation to the
PaCO2 which rises
Real-time capnograph showing fall in cardiac output due to cardiac arrest
Isserles S, Breen PH. Can changes in end-tidal PCO 2 measure changes in cardiac output? Anesth
Analg. 1991;73:808.
Shibutani K, Shirasaki S, Braaz T, et al. Changes in cardiac output affect P Et
CO 2 , CO
2 transport,
and O2 uptake during unsteady state in humans. J Clin Monit. 1992;8:175–6.

872.34 Capnography as a Guide to Successful Resuscitation
2 2.34 Capnography as a Guide to Successful Resuscitation
Using capnography, it is possible to differentiate asphyxic cardiac arrest (very high P
Et CO
2 ) from primary cardiac arrest (increase in P
Et CO
2 is not as high). P
Et CO
2 can
provide a valuable guide to CPR.
Successful CPR CPRresumption
CPRtermination
A sudden rise in PEtCO2is often the earliestindicator of the revivalof the hemodynamics.It is more sensitivethan the ECG, pulse, or blood pressure, and isunaffected by theartefacts produced bychest compression.The transient rise inPEtCO2 reflects theelimination of the CO2built up within tissues.
Conversely, a drop in PEtCO2 in apatient whohas just beensuccessfullyrevived mayindicate theneed forresumptionof CPR.
In a patient with pulselesselectrical activity, the PEtCO2 measured at 20 min after the commencement of CPR can provide a valuable guide of outcome.
PEtCO2 after20 min CPR:<10 mmHgFurther continuation of CPR is unlikely to be fruitful*.
PEtCO2after 20min CPR:>18 mmHgHeralds asuccessfulout come tothe CPR*.
*No speci fi c number can assigned as a cut off value in distinguishing survivors from non-survivors: it is believed that the chances for survival increase by 16 % for every 1 mmHg that the P
Et CO
2 rises.
The return of spontaneous circulation following successful CPR
Callaham M, Barton C. Prediction of outcome of cardiopulmonary resuscitation from end-tidal carbon dioxide concentration. Crit Care Med. 1990;18:358.
Falk JL, Rackow ED, Weil MH. End-tidal carbon dioxide concentration during cardiopulmonary resuscitation. N Engl J Med. 1988;318(10):607–11.
Grmec S, Klemen P. Does the end-tidal carbon dioxide (ETCO 2 ) concentration have prognostic
value during out-of-hospital cardiac arrest? J Emerg Med. 2001;8:263–9.
Sanders AB, Kern KB, Otto CW, et al. End-tidal carbon dioxide monitoring during cardiopulmo-nary resuscitation: a prognostic indicator for survival. JAMA. 1989;262:1347–51.

88 2 The Non-Invasive Monitoring of Blood Oxygen and Carbon Dioxide Levels
2 2.35 Capnography in Respiratory Disease
Pulse oximetry which measures oxygenation cannot serve as a replacement for cap-nography, which monitors ventilation . Capnography will diagnose hypoventilation long before the latter results in hypoxia, and this is especially the case in patients on supplemental oxygen. In hypoventilation, tall (high P
Et CO
2 ) low-frequency waves
are manifest with a well-de fi ned alveolar plateau (a similar waveform can occur when the dead space is increased). In hyperventilation , short (low P
Et CO
2 ) high-
frequency waves with a well-de fi ned alveolar plateau are seen.
Hypoventilation
The capnograph shows:
slow respiratory rate (low frequency)
High CO2 levels (tall waves)
Hypoventilation
The capnograph shows:
High respiratory rate (low frequency)
Low CO2 levels (relatively short waves)
Simple pneumothorax (doesn’t affect cardiac output: P Et
CO 2 rises) can be dif-
ferentiated from tension pneumothorax (cardiac output falls: P Et
CO 2 falls).
It is also possible to differentiate congestive cardiac failure (CCF) from broncho-spasm on the basis of the shape of the capnographic waveform: in CCF, the wave-form is relatively upright.

892.35 Capnography in Respiratory Disease
2
It is possible to distinguish CHF bronchospasm on the basis of capnography.
Upright waveform Upsloping plateau gives a ‘sharkfin’ appearance to the waveform
CCF Bronchospasm
In airways obstruction (severe bronchoconstriction in an acute attack of asthma, or airway narrowing due to loss of elastic recoil in COPD), slow exhalation leads to slow CO
2 -elimination results in a steeply upsloping alveolar plateau, giving a ‘shark
fi n’ appearance to the waveform. This slope correlates closely with spirometric indices of airway obstruction, making it possible to monitor bronchodilator ther-apy—and potentially, to estimate bronchospasm in those who cannot perform spirometry (such as patients at the extremes of age). The length of the alveolar pla-teau divided by the respiratory rate (the ‘E
t CO
2 ratio’), closely correlates with the
airway resistance.
Soto RG, Fu ES, Vila H Jr, et al. Capnography accurately detects apnea during monitored anesthe-sia care. Anesth Analg 2004;99(2):379–82.
Grmec S, Lah K, Tusek-Bunc K. Difference in end-tidal CO 2 between asphyxia cardiac arrest and
ventricular fi brillation/pulseless ventricular tachycardia cardiac arrest in the prehospital setting. Crit Care. 2003;7:R139–44.
Kodali BS. Factors infl uencing P Et
CO 2 . 2007. Welcome to capnography.com. Last accessed 6 June
2012.
Krauss B, Deykin A, Lam A, et al. Capnogram shape in obstructive lung disease. Anesth Analg 2005;100(3):884–8.
Kunkov S, Pinedo V, Silver EJ, et al. Predicting the need for hospitalization in acute childhood asthma using end–tidal capnography. Pediatr Emerg Care 2005;21(9):574–7.
Yaron M, Padyk P, Hutsinpiller M, et al. Utility of the expiratory capnogram in the assessment of bronchospasm. Ann Emerg Med 1996;28(4):403–7.

90 2 The Non-Invasive Monitoring of Blood Oxygen and Carbon Dioxide Levels
2 2.36 Esophageal Intubation
Unrecognized placement of the endotracheal tube (ETT) into the esophagus can prove catastrophic. None of the checks that are routinely performed to ascertain correct placement of the tube are infallible. For example, conduction of breath sounds to the chest wall is possible even though the tube may reside in the esopha-gus (in fact, the chest wall can still move on bagging the patient because gastric in fl ation can transmit some movement to the chest wall; gas exchange may even be sustained for a while because of the diaphragmatic movement so produced; a fall in the SpO
2 is often a late sign).
Conversely, the absence of breath sounds over the epigastrium does not rule out esophageal intubation.
Capnograph in esophageal intubation
Carbon dioxide has its origins in the lungs. Measurable CO 2 in the ETT can only
mean that the ETT resides in the tracheobronchial tree. Capnometry may be the most reliable of the available indices—short of bronchoscopic con fi rmation of tra-cheal intubation—that distinguish tracheal from esophageal intubation (Note that if the patient had initially been manually ventilated with bag and mask, some of the exhaled gas that was forced into the esophagus during bagging can be measured during the fi rst few exhalations. On the other hand, occlusion of the tip of the ETT by cricoid pressure, applied PEEP and bronchospasm can result in failure to detect CO
2 ).
EtCO
2 can help guide the ETT during a blind oral (or nasal) intubation. In a spon-
taneously breathing patient, a capnometer hooked to the ETT will register increase in amplitude of the EtCO
2 as the tube approaches the larynx, displaying the classical
capnographic waveform as the ETT passes between the vocal cords.
Hasan A. Esophageal intubation. In: Understanding Mechanical Ventilation: a Practical Handbook. London: Springer; 2010. p.183, 309–10.
Ionescu T. Signs of endotracheal intubation. Anaesthesia. 1981;36:422.
Linko K, Paloheimo M and Tammisto T: Capnography for detection of accidental oesophageal intubation. Acta Anaesthesiol Scand. 1983;27:199–202.
Murry IP, Modell JH. Early detection of endotracheal tube accidents by monitoring carbon dioxide concentration in respiratory gas. Anesthesiology. 1986;59:344–6.

912.37 Capnography in Tube Disconnection and Cuff Rupture
2 2.37 Capnography in Tube Disconnection and Cuff Rupture
Normal capnograph
Capnograph in self-extubation or disconnection
Ruptured ET cuff showing a gradual descent
2.37.1 Biphasic Capnograph
A biphasic pattern on the capnogram may be obtained under some circumstances, eg when there are air leaks in the sampling system.
In severe kyphoscoliosis , lung volumes and lung mechanics may considerably differ on both sides. The phases of lung emptying can therefore be out of synchrony on the two sides. Consequently, the plateau of the capnogram shows a late hump (see fi g below).

92 2 The Non-Invasive Monitoring of Blood Oxygen and Carbon Dioxide Levels
2
The pulsation of the heart and great vessels, by gently compressing the lungs, can produce minor changes in air fl ow. These cardiac oscillations can sometimes be recognized on the waveform, especially when the respiratory rate is low. They appear as diminutive serrations towards the end of expiration, and their frequency correlates with the heart rate (see fi g below).
Kodali BS. Factors in fl uencing P Et
CO 2 . 2007. Welcome to capnography.com . Last accessed 6 June
2012.

93References
2 References
Birmingham PK, Cheney FW, Ward RJ. Esophageal intubation: a review of detection techniques. Anesth Analg. 1986;65:886–91.
Brand TM, Brand ME, Jay GD. Enamel nail polish does not interfere with pulse oximetry. J Clin Monit Comput. 2002;17:93.
Busch MR, Mace JE, Ho NT, Ho C. Roles of the beta 146 histidine residue in the molecular basis of the Bohr effect of hemoglobin: a proton nuclear magnetic resonance study. Biochemistry. 1991;30:1865.
ECRI Health Devices Program. Carbon dioxide monitors. Health Devices. 1986;15:255–85. Fluck Jr RR, Schroeder C, Frani G, et al. Does ambient light affect the accuracy of pulse oximetry?
Respir Care. 2003;48:677. Greene GE, Hassel KT, Mahutte CK. Comparison of arterial blood gas with continuous intraarte-
rial and transcutaneous PO2 sensor in adult critically ill patients. Crit Care Med. 1987;15:491. Inman KJ, Sibbald WJ, Rutledge FS. Does implementing pulse oximetry in a critical care unit
result in substantial arterial blood gas savings? Chest. 1993;104:543. Kalenda Z. Mastering infrared capnography. Utrecht, The Netherlands: Kerckebosch-Zeist,
1989:p101. Linlo K, Paloheimo M, Tammisto T. Capnography for detection of accidental oesophageal intuba-
tion. Acta Anaesthesiol Scand. 1983;27:199–202. Martin L, Khalil H. How much reduced hemoglobin is necessary to generate central cyanosis?
Chest. 1990;97:182. O’Flaherty D, Adams AP. The end-tidal carbon dioxide detector. Assessment of new method to
distinguish oesophageal from tracheal intubation. Anaesthesia. 1990;45:653–5. Sanders AB, Kern KB, Otto CW, et al. End-tidal carbon dioxide monitoring during cardiopulmo-
nary resuscitation: a prognostic indicator for survival. JAMA. 1989;262:1347. Veyckemans F, Baele P, Guillaume JE, et al. Hyperbilirubinemia does not interfere with hemoglo-
bin saturation measured by pulse oximetry. Anesthesiology. 1989;70:118. Zeballos RJ, Weisman IM. Reliability of noninvasive oximetry in black subjects during exercise
and hypoxia. Am Rev Respir Dis. 1991;144:1240.

http://www.springer.com/978-1-4471-4314-7