the northwest fisheries science center’s west coast ...€¦ · the northwest fisheries science ....
TRANSCRIPT
NOAA Technical Memorandum NMFS-NWFSC-136
The Northwest Fisheries Science Center’s West Coast Groundfish Bottom Trawl Survey: History, Design, and Description DOI: 10.7289/V5/TM-NWFSC-136
January 2017
U.S. DEPARTMENT OF COMMERCENational Oceanic and Atmospheric AdministrationNational Marine Fisheries ServiceNorthwest Fisheries Science Center
NOAA Technical Memorandum NMFS-NWFSC-136
The Northwest Fisheries Science Center’s West Coast Groundfish Bottom Trawl Survey: History, Design, and DescriptionDOI: 10.7289/V5/TM-NWFSC-136
Aimee A. Keller, John R. Wallace, and Richard D. Methot
Fishery Resource Analysis and Monitoring DivisionNorthwest Fisheries Science Center2725 Montlake Boulevard EastSeattle, Washington 98112
January 2017
U.S. DEPARTMENT OF COMMERCENational Oceanic and Atmospheric AdministrationNational Marine Fisheries ServiceNorthwest Fisheries Science Centerhttps://www.nwfsc.noaa.gov/index.cfm

NOAA Technical Memorandum NMFS-NWFSC SeriesThe Northwest Fisheries Science Center of NOAA’s National Marine Fisheries Service uses the NOAA Technical Memorandum NMFS-NWFSC series to issue scientific and technical publications. Manuscripts have been peer-reviewed and edited. Publications in this series can be cited in the scientific and technical literature.
The Northwest Fisheries Science Center’s NOAA Technical Memorandum NMFS-NWFSC series continues the NMFS-F/NWC series established in 1970 by the Northwest and Alaska Fisheries Science Center, which subsequently was divided into the Northwest Fisheries Science Center and the Alaska Fisheries Science Center. The latter uses the NOAA Technical Memorandum NMFS-AFSC series.
NOAA Technical Memorandums NMFS-NWFSC are available at the Northwest Fisheries Science Center website, https://www.nwfsc.noaa.gov/index.cfm.
Mention throughout this document to trade names or commercial companies is for identification purposes only and does not imply endorsement by the National Marine Fisheries Service, NOAA.
Reference this document as follows:Keller, A. A., J. R. Wallace, and R. D. Methot. 2017. The Northwest Fisheries Science Center’s West Coast Groundfish Bottom Trawl Survey: History, Design, and Description. U.S. Department of Commerce, NOAA Technical Memorandum NMFS-NWFSC-136. DOI: 10.7289/V5/TM-NWFSC-136.
ii

Contents
List of Figures ...............................................................................................................................................................v
List of Tables ................................................................................................................................................................vi
Abstract .......................................................................................................................................................................vii
Acknowledgments ................................................................................................................................................... viii
Introduction ................................................................................................................................................................. 1
Historical Background ................................................................................................................................................3
AFSC Triennial Surveys (1977–2001) ...................................................................................................................3
NWFSC Triennial Survey (2004) .........................................................................................................................4
AFSC Slope Surveys (1984–2001) .........................................................................................................................4
Transition to NWFSC ............................................................................................................................................5
NWFSC West Coast Groundfish Bottom Trawl Surveys (1998–2002) ............................................................6
Survey development ..........................................................................................................................................6
Multivessel rationale (from Methot et al. 2000) ............................................................................................7
Standardization ..................................................................................................................................................9
NWFSC Slope Surveys (1998–2002) ....................................................................................................................9
NWFSC West Coast Groundfish Bottom Trawl Surveys (2003–Present) .................................................... 10
Random stratified design ................................................................................................................................ 10
Survey cell pool ................................................................................................................................................ 12
Strata selection and trawl station allocation ................................................................................................ 13
Primary and alternate station selection (Wallace, unpublished) ............................................................... 18
Tow procedures ................................................................................................................................................ 19
Vessels ............................................................................................................................................................... 19
Gear description ..............................................................................................................................................20
Trawling protocol ............................................................................................................................................20
Sensors and trawl monitoring ........................................................................................................................ 21
Sensor data and point estimation .................................................................................................................. 21
Sensor data quality ..........................................................................................................................................22
Biological data collection ................................................................................................................................23
Calibration between AFSC and NWFSC Surveys .......................................................................................24
References ...................................................................................................................................................................26
iii

Appendix ....................................................................................................................................................................28
Evaluation of West Coast Slope Survey Methodology .........................................................................................29 by Charles W. West, Donald R. Gunderson, and Richard D. Methot
Abstract ..................................................................................................................................................................30
Introduction ..........................................................................................................................................................30
Objectives ...............................................................................................................................................................31
Materials and Methods ........................................................................................................................................ 32
Results ....................................................................................................................................................................34
Trawl performance ..........................................................................................................................................34
Catching performance .................................................................................................................................... 35
Size composition of catches ............................................................................................................................ 35
Discussion .............................................................................................................................................................37
iv

FiguresFigure 1. Schematic fishing profiles of the trawls evaluated in the 1997 pilot study ...........................................7
Figure 2. Areal extent of the West Coast Groundfish Bottom Trawl Survey (2003–2012) ............................... 11
Figure 3. A power analysis based on net mensuration data from 1997 .............................................................. 17
Figure 4. Distribution of dates of operation for the Triennial Survey (1980–2004) .........................................24
v

TablesTable 1. Aggregation of 40 abundant groundfish species collected during the 1999–2002 West Coast slope surveys into nine categories ...................................................................................................... 15
Table 2. List of charter vessels, West Coast Groundfish Bottom Trawl Survey (1998–2014) ...........................20
Table A-1. Summary of cruise and vessel information ......................................................................................... 33
Table A-2. Summary of factors affecting trawl performance ...............................................................................34
Table A-3. Ratios of average catches ........................................................................................................................36
vi

Abstract
Information on the abundance and distribution of most Pacific Coast groundfish is obtained principally by bottom trawl surveys. The annual bottom trawl survey in this region is conducted by the NMFS Northwest Fisheries Science Center from four chartered fishing vessels that each conduct over 150 trawls during early summer to early autumn, and cover trawlable habitats from the U.S.–Canada to the U.S.–Mexico borders, at depths of 55 m to 1,280 m. This document covers the history of this survey, including descriptions of predecessor surveys in the region, statistical design, and survey protocols.
vii

Acknowledgments
We thank the captains and crew of the chartered West Coast fishing vessels for their efforts during the 1998–2015 Northwest Fisheries Science Center’s West Coast Groundfish Bottom Trawl Surveys. We also thank the survey teams and volunteer biologists who participated in the surveys, and also express our appreciation to the administrative staff for their shore-side logistical support.
viii
Introduction
Assessment of the status and potential yield of fish and shellfish stocks is required for species managed under the Magnuson–Stevens Fishery Conservation and Management Act, to ensure long-term sustainability of marine resources. High-quality assessments rely on time series of catch, time series of fish abundance, and biological data—including the age composition of the stock—to estimate current stock status, describe its past dynamics, and forecast future trajectories under management alternatives. For stocks that primarily occur in habitats that can be fished with commercial bottom trawls, a standardized version of such trawls can be used in research surveys to collect the needed abundance data on these stocks. These research trawl surveys can simultaneously provide data on the abundance, distribution, and biology of multiple managed species and their associated ecosystems. Such surveys have been conducted for decades in European waters (Bertrand et al. 2002b), Alaska (Stark 1997, Goddard and Walters 2000), and the northeastern U.S. (Sissenwine and Bowman 1978, Byrne et al. 1981, Byrne and Fogarty 1985).
Research trawl surveys began off the U.S. West Coast in 1977 with a continental shelf survey (Dark and Wilkins 1994). In the mid-1980s, a deep slope survey began to provide coverage out to nearly 1,300 m of bottom depth to provide data for valuable stocks such as sablefish, Dover sole, and the emerging fishery for thornyheads. Those surveys were conducted by the then Northwest and Alaska Fisheries Science Center of NMFS. Development of a full groundfish assessment program at the Northwest Fisheries Science Center (NWFSC) began in 1995, following the split into NWFSC and the Alaska Fisheries Science Center (AFSC).
The timing and spatial extent (both longitudinal and by depth) of AFSC’s West Coast shelf and slope surveys varied over time. Temporal coverage varied between years as the focus of the surveys shifted among different groundfish species (Lauth et al. 1997). Spatial coverage varied between years due to constraints imposed by annual budget levels and/or availability of NOAA ship time (Lauth 2001). The various configurations of these surveys are described herein, since they provide insights into the design of NWFSC’s current annual groundfish survey. Prior to 1998, surveys conducted by AFSC were the principal source for fishery-independent data on groundfish resources along the upper continental slope and shelf of the U.S. West Coast (Methot et al. 2000). West Coast survey responsibility transferred to NWFSC in 2001, and by 2003, the current spatial and temporal coverage of the NWFSC bottom trawl survey had been established. The NWFSC survey has utilized a consistent survey extent and design since 2003, except for the changes to geographic strata and station allocations in 2004 and 2013 (see page 10).
Here we describe some of the early history of bottom trawl surveys in this region, the steps that led to the development of the West Coast Groundfish Bottom Trawl Survey (WCGBTS), and a description of the current survey, which is conducted annually by scientists from the NWFSC Fishery Resource Analysis and Monitoring (FRAM) division.
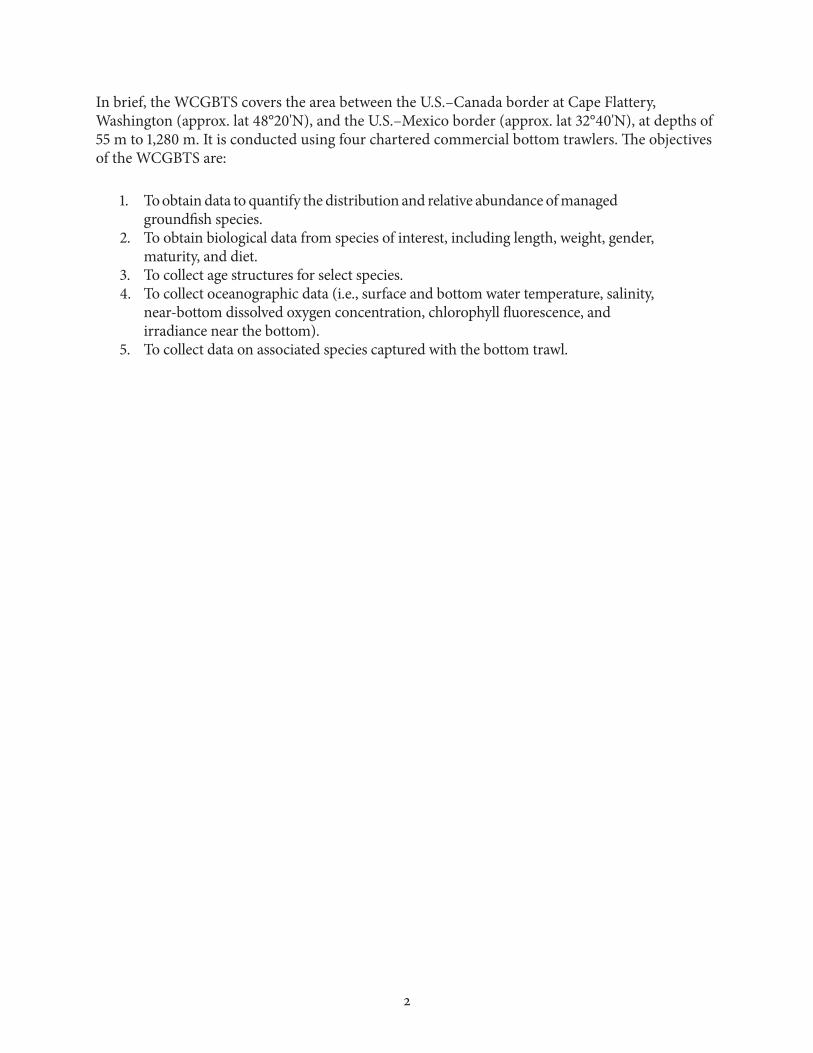
In brief, the WCGBTS covers the area between the U.S.–Canada border at Cape Flattery, Washington (approx. lat 48°20'N), and the U.S.–Mexico border (approx. lat 32°40'N), at depths of 55 m to 1,280 m. It is conducted using four chartered commercial bottom trawlers. The objectives of the WCGBTS are:
1. To obtain data to quantify the distribution and relative abundance of managed groundfish species.
2. To obtain biological data from species of interest, including length, weight, gender, maturity, and diet.
3. To collect age structures for select species.4. To collect oceanographic data (i.e., surface and bottom water temperature, salinity,
near-bottom dissolved oxygen concentration, chlorophyll fluorescence, and irradiance near the bottom).
5. To collect data on associated species captured with the bottom trawl.
2
Historical Background
The NWFSC West Coast Groundfish Bottom Trawl Survey was initiated in 1998, just three years after the NWFSC created the Fishery Resource Analysis and Monitoring Division (FRAM). Richard Methot (FRAM Division Director), Herb Sanborn, and Bill West played key roles in designing and implementing the survey in collaboration with AFSC and the local fishing industry. Planning for the survey was initiated with a two-day groundfish assessment workshop in December 1996, with the common theme of improving communication and cooperation with the fishing industry and other constituents. There were 60 attendees, including 13 from the groundfish industry. During this meeting, planning for the new NWFSC survey was discussed, and Bill West concluded his presentation by describing the pros and cons for a high level of gear standardization. Fishing industry leaders Joe Easley and Barry Fisher were influential in anchoring support for the new survey, and vessel owners Gerald Gunnari and Donna Leach were pivotal in focusing initial momentum.
AFSC Triennial Surveys (1977–2001)Historically, AFSC1
1 Prior to 1995, surveys were by the combined Northwest and Alaska Fisheries Science Center.
conducted a shelf survey on a three-year cycle (the Triennial Survey). Since the survey was designed primarily to assess various rockfish species, the Triennial Survey utilized a Poly Nor’Eastern trawl with a footrope equipped with roller bobbins to allow fishing in rough habitat. From 1977 through 1992, sampling for the Triennial Survey occurred from mid-July through September or early October. From 1995–2001, sampling occurred from June through mid-August (Dark and Wilkins 1994, Shaw et al. 2000). Sampling typically took place on two chartered Alaskan-class commercial trawlers (19.8–52.1 m) using a transect-based design; however, four vessels were deployed in 1977 (Dark and Wilkins 1994). Transects were roughly perpendicular to the coast and occurred at variable intervals over the years: 3.7 km, 5.6 km, 7.4 km, 9.3 km, 11.1 km, 18.5 km and 22.2 km. Within any given year, multiple transect intervals (one to three) were designated. For example, in 1977, transects were spaced either 9.3 or 18.5 km apart. The depth zone sampled during the Triennial Survey also varied over time. In 1977, depths sampled ranged from 91–457 m, but shifted to 55–366 m from 1980 through 1992. During this period there were multiple depth strata, with a range of three to six strata occurring each year, typically with variable depth designations per stratum but generally with a subdivision at 183 m. For example, in 1977, four depth strata were designated (91–183 m, 184–274 m, 275–366 m, and 367–457 m), while in 1986, there were four somewhat different depth strata: 55–91 m, 92–183 m, 184–274 m, and 275–366 m. From 1995 to 2001, sampling depth increased to 500 m, and three depth strata were designated: 55–183 m, 184–366 m, and 367–500 m. The rationale(s) for the varied transect intervals and depth strata were not recorded, but presumably they were chosen to focus on key species of interest each year.
The initial Triennial Survey, conducted in 1977, sampled from Point Hueneme, California (lat 34°00'N), to the U.S.–Canada border. In 1980, sampling occurred from Monterey Bay, California (lat 36°48'N), to Vancouver Island, British Columbia (lat 50°00'N). In 1983, sampling was slightly
3
truncated at the northern extent, ending in the vicinity of south Vancouver Island (lat 49°15'N). In 1986, sampling was truncated further at the northern extent, ending at the U.S.–Canada border. The 1989–1995 surveys sampled from Point Conception, California (lat 34°30'N), to central Vancouver Island (lat 49°40'N), while the 1998 survey sampled from Point Conception to Vancouver Island (lat 49°15'N). The final AFSC Triennial Survey sampled from Point Conception to Vancouver Island at lat 49°06'N (Dark and Wilkins 1994, Weinberg et al. 1994, Zimmermann et al. 1994, Wilkins et al. 1998, Shaw et al. 2000, Weinberg et al. 2002).
NWFSC Triennial Survey (2004)In 2004, the NWFSC continued the Triennial Survey extending from Point Conception (lat 34°30'N) to the U.S.–Canada border (lat 48°20'N) based on the experimental design of AFSC’s 1995–2001 Triennial Survey, a period characterized by less variable transect intervals and standardized depth strata. Track lines were spaced at intervals of 10 nm (nautical miles; 18.5 km), with sampling densities for the three depth strata (55–183 m, 184–366 m, and 367–500 m) similar to those established during the 1995–2001 AFSC surveys. AFSC’s protocols called for “stations to be located randomly along the track lines at the rate of one station per 4 nm of linear distance in the shallow stratum, and one station every 5 nm of linear distance in the two deeper strata.” NWFSC allocated the same number of stations per depth stratum per transect as AFSC did in 2001, but because of improved information on bathymetry, this resulted in 84 transects and 505 potential sampling stations. Each vessel was allocated a set of alternating transect lines and worked from the southernmost transect north. Two Alaskan-class chartered fishing vessels were used for the survey, equipped with the same sampling gear as earlier AFSC Triennial Surveys. The 2004 Triennial Survey extended from May 25 through July 23, beginning and ending somewhat earlier than the Triennial Surveys conducted from 1995–2001. Although the original intent was to continue the Triennial Survey, at a reduced interval, into the future for comparison with the newly established West Coast survey design, NWFSC has not had sufficient resources (neither funds nor staff) to repeat this survey again.
AFSC Slope Surveys (1984–2001)AFSC’s West Coast slope surveys began in 1984 and occurred annually from 1988–2001, with the exceptions of 1994 and 1998, when no surveys were conducted. Limited portions of the coast were covered in all years prior to 1997. In 1988 and after 1990, the slope survey consistently used the 65.5-m NOAA Ship Miller Freeman, but used the FV Half Moon in 1984 and the 31.1-m FV Golden Fleece in 1989. Standardized hauls were targeted for 30-minute durations, with sampling occurring throughout the 24-hour day–night cycle using a Poly Nor’Eastern trawl. Although the net was the same as that used in the Triennial Surveys, a different footrope was used to improve bottom contact. Gear studies conducted in 1994 (Lauth et al. 1998) resulted in modifications to the rigging and towing protocols when the survey resumed in 1995. The sampling design was transect-based, with track lines at 16.7-km intervals from 1989–1996 and at 50-km intervals from 1997–2001. Density decreased in 1997, when the survey area was expanded to encompass the coast from Point Conception to the U.S.–Canada border. One station was allocated per 13.0 km
4

of linear track line length throughout the 1989–2001 period. The survey typically occurred from mid-October to late November from 1990–2001, but was held mid-September to mid-October in 1989. Although AFSC’s slope survey targeted a consistent depth range (184–1,280 m) throughout its history, the geographic coverage was highly variable until the later years of the survey (1997–2001). Very little information is available for the 1984 survey, except that the geographic extent was restricted to a small area within the Columbia International North Pacific Fisheries Commission (INPFC) area extending from lat 43°00'N to lat 45°45'N. In 1988, a similarly small section of the Columbia INPFC area was sampled from lat 44°06'N to lat 45°22'N. In 1989, sampling occurred in the central Columbia INPFC area from Heceta Head, Oregon, to Cape Lookout, Oregon (lat 44°09'N–45°21'N). In 1990, sampling moved to the Eureka INPFC area (lat 40°30'N–43°00'N), and in 1991, to the Northern Monterey INPFC area (lat 38°20'N–40°30'N). In 1993, sampling occurred from Cape Blanco, Oregon (lat 43°00'N), to near Cape Lookout (lat 45°30'N) within the Columbia INPFC area. In 1995, sampling again took place in the Eureka INPFC area (lat 40°30'N–43°00'N), and in 1996, from Cape Blanco (43°00'N) to the U.S.–Canada border. In 1997 and 1999–2001, sampling took place from Point Conception (lat 34°30'N) to the U.S.–Canada border.
Transition to NWFSCThe transition to groundfish surveys conducted by NWFSC began in the late 1990s as an effort to augment the sparse coverage of AFSC’s slope survey (which had begun sampling these deeper regions in 1984). During the earlier years of the AFSC slope survey (1988–1996), only limited portions of the West Coast were sampled each year (Lauth 1997a, 1997b, Lauth et al. 1997). A more extensive (Point Conception to the U.S.–Canada border) AFSC slope survey occurred in 1997, and again in 1999, 2000, and 2001 (Lauth 1999, 2000, 2001). When NWFSC conducted the slope survey in 1998, we initially adopted the transect-based sampling design established during the earlier AFSC slope surveys (1984–2001). From 1998 through 2001, both AFSC and NWFSC conducted West Coast slope surveys, providing data that overlapped during this transition period. In 2002, NWFSC expanded the geographic coverage of the survey to include the area south of Point Conception (lat 34°30'N). Then in 2003, NWFSC expanded the depth coverage to include the continental shelf (55–183 m) as well as the previously sampled continental slope region (184–1,280 m), and switched to a stratified random sampling design. This design switch was based on consensus from assessment scientists as the best possible survey design for management purposes. The shallower depth range had historically been sampled by AFSC on a triennial basis from 1977 through 2001 using a transect-based survey design. Consequently, in the current sampling configuration, the WCGBTS now encompasses the area historically monitored by both AFSC’s continental shelf survey, conducted triennially, and the annual AFSC slope survey.
5
NWFSC West Coast Groundfish Bottom Trawl Surveys (1998–2002)
Survey developmentThe West Coast fishing industry has been a strong proponent of cooperative survey work. Their interest in a cooperative survey, the limited budget available to expand West Coast surveys, and the new cooperative research provisions of the Magnuson–Stevens Fishery Conservation and Management Act provided the impetus to develop a new survey methodology and vessel compensation strategy, one that would take advantage of the skills of captains familiar with the unique challenges of fishing the deep waters off the West Coast (Methot et al. 2000). Since 1998, NWFSC has conducted the WCGBTS onboard four chartered West Coast commercial fishing vessels using an Aberdeen trawl. The move to West Coast fishing vessels was also dictated by the expense and lack of availability of NOAA ship time. Since AFSC’s slope survey was ending, the decision was made to initiate a slope survey using multiple chartered West Coast fishing vessels.
As noted by Methot et al. (2000), working with a new class of vessels presented some challenges when designing the survey. These primarily stemmed from the small size (~23 m) of the trawlers available in this fleet relative to the NOAA Ship Miller Freeman (~66 m) and the larger trawlers (~35 m) chartered for the AFSC triennial shelf survey, which ordinarily fish in Alaskan waters. Coastal groundfish trawlers typically are not sufficiently powerful to tow the standard sampling trawl used by both the Miller Freeman and the Triennial Survey vessels, so it was necessary to designate new standard sampling gear for these smaller vessels, and this in turn created a difference in absolute catch rates in comparison to the historical trawl surveys on the slope (Methot et al. 2000). Further, most West Coast vessels do not have accommodations for as many scientific personnel as typical Alaska trawlers, so it was necessary to adapt the sampling objectives and methodology to the constraints imposed by smaller field parties. Finally, the smaller vessels are more weather-limited, so the timing of the survey is restricted to late spring through mid-fall. A major advantage of employing these vessels was the ability to exploit the knowledge and skills of the captains working along the coast within the commercial fishing industry. Using chartered U.S. West Coast fishing vessels, exploratory work was conducted in 1997, followed by a pilot survey in 1998, then full-scale slope surveys from 1999 through 2002.
Methot et al. (2000) noted that preliminary experiments were carried out in the summer of 1997 (C. W. West, D. R. Gunderson, and R. D. Methot, NWFSC and University of Washington, unpublished data; the Appendix contains an abridged version of this manuscript, without figures and with minor editorial changes) to assess whether or not the approach was sound, and to develop methodologies appropriate to both the needs of the survey and the capabilities of West Coast sampling vessels. Using trawl instrumentation, two types of trawls commonly used in West Coast commercial groundfish fisheries were tested across a representative range of vessel sizes, fishing depths, and other operational factors, to identify which gear offered the most stable physical and fishing performance and would thus be most suitable for use as a standard sampling trawl (Figure 1). In addition to facilitating the choice of optimal sampling gear, this work also demonstrated the range of variation in gear performance likely to be seen under typical survey
6

conditions, and verified the need to observe and control sampling trawl performance by means of trawl instrumentation and other aids. These experiments also provided insight into the challenges associated with using small scientific parties to acquire and record the required biological data from the catches. The preliminary work in 1997, and the first survey in 1998, were conducted with two scientists on board, plus the vessel’s skipper and crew of two. From this experience it was possible to set realistic expectations of what kinds of biological parameters could be recorded and at what level of detail, to spot potential bottlenecks in the catch analysis process, and to identify promising technological and methodological solutions to such bottlenecks. In 1999 and 2000, the scientific staff was increased to three per vessel to optimize biological sampling.
Figure 1. Schematic fishing profiles of the trawls evaluated in the 1997 pilot study.
The experiments demonstrated that acceptable results could be obtained at acceptable levels of scientific rigor. However, they also showed that survey operations under these conditions suffer from some inherent limitations, especially in the realms of collecting and storing large volumes of tissue samples and other specimens, conducting oceanographic sampling or other detailed biological examinations on board, providing quarters for scientific staff, and carrying out specialized, technically demanding operations.
Multivessel rationale (from Methot et al. 2000)NWFSC’s survey was initially designed a) to increase the sampling density of survey effort within the slope zone, and b) to obtain information on fish distribution and biomass during the sampling season utilized during the AFSC shelf survey. Multiple vessels were consequently needed to obtain a sufficient number of samples over the large geographic area in a sufficiently short period of time. The use of multiple vessels and the impracticality of side-by-side comparisons between them meant that the statistical design of the survey and its analysis needed to take into account the between-vessel component of variance, so that the benefits of increased sample number could be realized. Standardization of methodology and gear mensuration can greatly reduce the magnitude of between-vessel variance and allow the use of multiple vessels to conduct extensive surveys. Such an approach had successfully been used to conduct multivessel surveys in the Bering Sea (Goddard and Walters 2000), the Gulf of Alaska (Stark 1997), the U.S. West Coast (Wilkins et al. 1998), and the Gulf of Saint Lawrence, Canada (Frechet 1997). However, subtle differences in vessel noise or other poorly understood factors can cause differences in
7
vessels’ catching efficiency, which leaves some residual differences between vessels in these multivessel surveys (Sissenwine and Bowman 1978, Byrne and Fogarty 1985), and probably introduces some interannual differences in the results of surveys conducted even with the same vessel. A traditional approach to dealing with vessel differences is to conduct calibration studies. Such studies are especially important when a new vessel is introduced to a single-vessel survey. Comparative fishing experiments using identical gear on similar vessels have shown that intervessel catch rates can vary by as much as a factor of two for some species (Sissenwine and Bowman 1978, Byrne and Fogarty 1985). The power of calibration studies is very low due to high inherent haul-to-haul variability (McAllister and Pikitch 1997, Wilderbuer et al. 1998), so a survey design that requires frequent calibration studies would be prohibitively expensive.
An alternative approach to dealing with between-vessel catching efficiency is to establish a design that subsumes these differences into the overall survey variance without allowing the differences to introduce bias in the ultimate goal: a time series of relative abundance data. Such an approach was adopted for the AFSC Triennial Survey, which used two closely matched vessels to conduct essentially replicate surveys on alternating track lines (Wilkins et al. 1998). Because of the strong emphasis on towing standardization and gear mensuration, the results from the two vessels were pooled without any explicit adjustment for possible differences in catching efficiency. Any residual difference between vessels simply contributed to the overall survey variance. If there is moderate-to-large variability in catching efficiency between vessels, then the use of only one or two randomly selected vessels will introduce an interannual vessel signal that will confound attempts to track the relative abundance of the survey’s target species. As shown in McAllister and Pikitch’s (1997) analysis, as the number of participating vessels increases, the combined results dilute the contribution of each individual vessel to provide a less-biased index of fish abundance. In the Bering Sea case evaluated by McAllister and Pikitch (1997), the results suggested that the use of replicate vessels would provide the best trade-off between reduction in bias and introduction of variance. Preliminary results from a similar modeling exercise using data from the 1998 survey showed the same patterns: 1) that year-to-year overall variance in survey biomass estimates was reduced as the number of participating vessels increased; 2) that the incremental gains in precision with additional vessels were greatest when going from one vessel to two, still strong but not as strong when going from two to three, three to four, etc., with little benefit to be realized beyond six or so vessels; and 3) that vessel-to-vessel variability was at levels comparable to those found in McAllister and Pikitch’s (1997) study (Methot et al. 2000).
When multiple vessels are used in a survey, it is likely that some vessels will be used repeatedly over time. To some degree, this is contrary to the statistical design of the analysis, which assumes that each year’s selection of vessels represents a random collection from a large universe of potential vessels. However, other factors (weather, crew, vessel equipment, etc.) can add to the variability between vessels even when the vessels remain the same. As a time series of survey results accumulates, subsequent statistical analyses are able to use general linear modeling to explore the degree of variability between vessels and the degree to which the vessel effect for repeat vessels is stable over time.
The four chartered fishing vessels operate in pairs, with two vessels conducting their cruises between late May and July, and the second pair starting in mid-August and concluding in late October.
8

Ideally, all four vessels would operate simultaneously, but staffing and logistical concerns preclude that possibility. The time periods were chosen for several reasons, including 1) that most of the survey’s target species do not undergo any substantial migratory or other movements during this period, 2) that this season offers the highest likelihood of weather conducive to survey operations, 3) that this is the time period of the historical trawl survey on the continental shelf, and 4) that towing only during daylight hours may help reduce seasonal differences in the amount of daylight over the long survey season. This differs from some of the past surveys, which also towed at night.
StandardizationThe NWFSC West Coast survey was initially designed to cover the same range as the AFSC slope survey: from Point Conception to the U.S.–Canada border, at depths of 184–1,280 m (1998–2001). As noted in Transition to NWFSC, the survey area was expanded to include the entire coast (from the U.S.–Mexico to the U.S.–Canada borders) in 2002. Then in 2003, the decision was made to add the shelf region (55–183 m) to the survey, and to switch from a fixed, transect-based design to a stratified random grid-based design. In 2003, NOAA Fisheries headquarters directed all Science Centers to standardize protocols for surveys that estimate catch per unit effort (CPUE), area swept indices, and catchability using dynamic trawls. The goal was to ensure consistency among surveys and over time. The following sections describe the survey from 1998–present, including the rationale for establishment of the current depth and geographic strata and the switch from transect-based to stratified random sampling design in 2003.
NWFSC Slope Surveys (1998–2002)From 1998 through 2000, the NWFSC slope survey was conducted from Morro Bay, California (lat 35°00'N), to the U.S.–Canada border. The survey occurred from mid-August to mid-October in 1998, but somewhat earlier in 1999 and 2000 (late June to late September). The survey sampled 80 fixed east–west track lines separated by 10 minutes of latitude (10 nm). There were two depth strata (184–549 m and 550–1,280 m), with three randomly selected stations in the depth category with the greatest linear distance along the transect and two randomly selected stations in the other depth category. There were a total of 400 possible stations, with 302–327 successful tows. The survey area was expanded in 2001 to include the area from Point Conception (lat 34°30'N) to Morro Bay, thus encompassing Point Conception to the U.S.–Canada border, and occurred from 21 June–28 September. This expanded survey included 84 fixed east–west transects separated by 10 minutes of latitude (10 nm). The depth strata remained the same as in prior years. There were a total of 420 stations, with 334 successful tows completed. In 2002, the survey was extended to the U.S.–Mexico border by adding transects within the Southern California Bight area south of Point Conception, for a total of 94 fixed east–west transects separated by 10 minutes of latitude (10 nm), and the same two depth strata as previously described. Randomly selected stations were allocated along each transect, as previously described, by depth category, giving a total of 470 stations. The 10 additional transect lines added 50 stations in the area from Point Conception to the U.S.–Mexico border. The number of stations in this new geographic area was dictated by the existing
9
experimental design—i.e., 10 minutes of latitude between transects and five tows per transect. Prior to 2002, a small number of tows (<50) had occurred in the Conception INPFC area north of Point Conception. Given the very large size of the Southern California Bight, this was a decrease in sampling intensity within the Conception INPFC area relative to earlier years: i.e., from ~3.0 tows per 1,000 km2 to ~2.0 tows per 1,000 km2.
NWFSC West Coast Groundfish Bottom Trawl Surveys (2003–Present)
In 2003, NWFSC’s WCGBTS was expanded to add the shelf region (55–183 m) to the annual survey. These depths had previously been sampled as part of the AFSC Triennial Survey. Since 2003, the surveys have utilized a random stratified sampling design (see Random stratified design). The entire U.S. West Coast (55–1,280 m water depth) has been subdivided into ~12,000 adjacent cells of equal area (2.0 nm latitude by 1.5 nm longitude, Albers equal-area conic projection; Figure 2). In 2003, 620 sites were randomly selected for sampling within 15 depth/latitudinal strata, with 155 sites per vessel. Since 2004, a primary subset of 188 randomly selected cells (within six depth/latitudinal strata) has been assigned to each of four chartered West Coast fishing vessels. The total number of sites targeted for the survey year is apportioned across geographic area and depth categories (see Survey cell pool), then primary stations are drawn from the survey cell pool, by strata, using a pseudorandom number generator. Each cell is sequentially assigned to an individual vessel. The process is repeated to identify two alternate sampling sites per location; additional constraints are imposed to ensure alternate sites are neither so close to an untrawlable primary site that they exhibit the same untrawlable features, nor at an impractical transit distance. In 2003, a total of 574 successful tows were completed out of 643 attempts. In 2004, a total of 564 stations were selected (for only three vessels), and 505 sites successfully sampled. From 2005 to 2012, a total of 752 primary cells with two alternate stations per site were assigned, with the number of successful tows ranging from 573–722. In 2013, 564 stations were selected for the three-vessel survey; however, sampling was discontinued on 30 September due to the government shutdown, and the numbers of stations sampled by the third vessel were reduced. Because of the government furlough, we lost 18 sampling days and about 65 stations, all south of Monterey Bay.
Random stratified designFrom 1998 through 2002, the selection of sample sites for the groundfish survey was based on a transect-based design inherited from AFSC. Following an evaluation of the transect-based survey design by assessment and survey scientists in 2003, a stratified random grid-based sampling design was adopted for all future surveys. The reasons for switching from a combined systematic and random transect design to a stratified random grid-based design are:
1. The grid-based design reduces transect-based geographic banding and avoids missing important habitat that falls between established transect lines. This banding was somewhat reduced previously by instructing scientists to not always begin searching for a good tow at the center of the “box” defined by the north–south limits of the transect line and the assigned
10

Figure 2. Areal extent of the West Coast Groundfish Bottom Trawl Survey showing the ~12,000 cells incorporated in the sample design, and the number of samples per cell from 2003 to 2012.
11

depth limits. Although the banding may have been further reduced over years by aggressive latitudinal jittering of the equally spaced transect lines, the banding problem was entirely eliminated by using a grid-based design.
2. The grid-based design reduces the statistical difficulty of subdividing an area for a particular species’ geographical propensity. With the banding problem noted above, there is a sinusoidal wave of higher and lower species-specific fish density areas north to south. Hence, when picking a latitudinal break, one has to decide where to put the break on the wave. There is no such problem with the flat grid system.
3. The grid-based design was implemented at the same time that the survey was expanded from 184–1,280 m to 55–1,280 m, and resolved the problem of allocating sample sites in the 55–183 m depth stratum.
4. The transect approach did not work well with the complex bathymetry of the Southern California Bight area.
5. The grid-based design was implemented with the long-range goal of assigning each cell in the grid a habitat type and basing the survey strata on combinations of these habitat types. Cells would then be randomly selected within these habitat-based strata.
By 2003, the stratified random sampling design had gained recognition as the most acceptable statistical design for multispecies bottom trawl surveys conducted over a large area (Bertrand et al. 2002a). Stratified sampling is applied to reduce the variance of survey catch rate resulting from the underlying heterogeneous distribution of the fish. Strata are designed so that fish distribution would be less variable within a stratum than between strata. Additionally, emphasis was placed on maintaining a similar level of sampling effort within depth strata to that of past surveys. Further details describing the allocation schemes for 2003 and the current allocation scheme (2004–present) are provided in Strata selection and trawl station allocation.
Survey cell poolThe survey pool of cells was selected to comply with the following criteria:
1. Within U.S. waters.2. Within the Pacific Ocean—no straits or inlets.3. From 55–1,280 m deep.4. Only within the natural fathom contours (i.e., seamounts outside the 1,280 m contour line
were not included). In the Southern California Bight, a small, extremely western seamount was excluded, but all other larger areas ≤1,280 m depth were included.
5. Outside the Cowcod Conservation Area.6. Outside the three-mile limit of the Channel Islands Marine Protected Areas.7. At least 50% of the cell area is within the political and geographical borders defined above.
Each cell was assigned a unique INPFC area and depth designation. For area, cells spanning more than one INPFC area were assigned the INPFC area that was greater by surface area. Note that cells south of the Conception area boundary of lat 32°30'N to the border between the U.S. and Mexico exclusive economic zones are assigned the Conception area designation.
12
Each cell was given a single classifying depth designation from the following list:
< 55 m 55–183 m 184–549 m 550–1,280 m 1,281–1,829 m >1,830 m
Cells spanning two depth zones are assigned the zone with the greatest surface area. Cells spanning three depth zones are assigned the zone with the largest area, regardless of whether it is less than 50% of the total. However, cells on any border must still first qualify under item seven, above. For example, if 25% of the area of a cell is deeper than 1,830 m, 35% of its area in the 1,281–1,829 m range, and 40% of its area from 550–1,280 m, then the cell would not be included in the pool. Even though the 550–1,280 depth stratum is the largest, 60% of the area is deeper than 1,280 m. Such cells—that span three depth strata, but have no single depth stratum greater than 50%—represent only 0.2% of the 2003 survey pool of cells.
Strata selection and trawl station allocationThe 2003 survey had five geographic strata, defined by the north–south boundaries of the five INPFC statistical areas along the West Coast. From 2004 onward there have been only two geographic strata with a simple north–south division at lat 34°30'N (Point Conception). The goal of both the 2003 and current strata and station allocation schemes has been to maintain the number of sites sampled north of Point Conception at levels similar to those sampled prior to 2003 using the transect-based design, while reducing the variance of survey catch rates within a stratum. Sampling allocation among strata was constrained by the cost of the survey, the desire to maintain sampling north of Point Conception at historical levels while adding sufficient sampling south of Point Conception to inform stock assessments, and the timing of the survey (i.e., staying within the dates previously established as the survey period). The number of stations added south of Point Conception resulted in a lower sampling density for the deepest stratum (549–1,280 m) than in the stations north of Point Conception, because of the large size of the Southern California Bight and the constraints noted above. Adding sufficient sites to maintain the density at levels previously established for the area north of Point Conception would have added time and costs to the survey that were not available.
In 2003, sampling locations were allocated by assigning 16–25% of the effort within each INPFC area. This allocation scheme was adopted to maintain a level of sampling effort in the slope area (184–1,280 m) comparable to prior years, and to account for the bathymetric disparity between surveys caused by adding the shelf region (55–183 m) in 2003. From 2004 onward, 80% of sampling effort was allocated to the north of Point Conception and 20% to the south. Because the abundance of groundfish is known to vary over the depths surveyed, the survey area is further divided into three depth strata (55–183 m, 184–549 m, and 550–1,280 m). The percentage of sampling stations allocated to each depth range in the northern and southern geographic areas is
13

based on the proportion of the area within each depth stratum. North of Point Conception, 40% of the area is located within the shallow depth stratum (55–183 m) and 30% within each of the two remaining strata (mid-depth and deep). For this region, 32% of the entire set of tows are allocated in the 55–183 m depth stratum (i.e., 80% north of Point Conception × 40% in the shallow depth stratum = 32% of all tows), 24% within the 184–549 m depth stratum, and 24% within the 550–1,280 m depth stratum. South of Point Conception, 25% of the area is located within the shallow depth stratum (i.e., 20% south of Point Conception × 25% in the shallow depth stratum = 5% of all tows), 45% within the mid-depth stratum and the remaining 30% within the deep stratum. The depth strata chosen when the stratified random sampling design was implemented took into account both the catch within oceanographic provinces along the coast (the shelf, upper slope, and lower slope regions), and the historical strata used by NWFSC’s 1999–2002 and AFSC’s 1984–1998 West Coast slope surveys (two strata: 184–549 m and 550–1,280 m) as well as AFSC’s 1977–1998 Triennial Surveys.
The percent strata allocation for the stratified random survey design adopted in 2003 was selected to improve the precision of groundfish abundance estimates using catch data from the earlier NWFSC slope surveys (1999–2002) and the AFSC shelf and slope surveys, as well as to maintain the sampling intensity north of Point Conception at levels comparable to historical surveys. The criteria for selection of an optimum stratification were minimization of within-stratum variation of CPUE for multiple groundfish species (grouped into nine categories), and maximization of between-strata variation. The following steps were used to arrive at the strata tow percentages in 2003 (J. R. Wallace, unpublished data):
1. The standard deviations (SD) of the log of the catch weights for nine categories of groundfish (Table 1) were calculated by INPFC area (Vancouver, Columbia, Eureka, Monterey, and Conception) and depth stratum (184–549 m or 550–1,280 m). These categories were aggregated from the 40 most abundant groundfish species captured during NWFSC’s slope surveys from 1999–2002. The 1998 data were excluded from the analysis, since these data were collected during the initial year of the survey prior to the establishment of the fixed survey time period and adoption of strict sampling protocols. Also, in 1998, rockfishes were not identified to species.
2. The standard deviations (SD) of the log of the catch weights for nine categories of groundfish (Table 1) were similarly calculated by INPFC area (Vancouver, Columbia, Eureka, Monterey, and Conception) and depth stratum (55–183 m or 184–500 m) for AFSC’s Triennial Survey. The analysis used data from the years 1977, 1980, 1983, 1986, 1989, 1992, 1995, 1998, and 2001.
3. The catch within the shallowest depth stratum (55–183 m) from the AFSC Triennial Survey was adjusted to the NWFSC slope survey, by species category, using the overlapping middle depth stratum of the two surveys. The depth stratum shared by both surveys was 184–500 m. The proportions by strata for each species category were obtained by dividing each species category by the sum of the catch.
4. The species category matrices were multiplied together, and species category components examined for unreasonable results. One final adjustment was necessary because of missing values. The Grenadier and Shark and Skate categories were removed to obtain matrix a). Note that surveys prior to 2003 within the Conception INPFC area were truncated at lat 34°30'N, with the exception of AFSC’s 1977 Triennial Survey and NWFSC’s 2002 slope survey.
14

Table 1. Aggregation of 40 abundant groundfish species collected during the 1999–2002 West Coast slope surveys into nine categories for use in determining strata allocations for the 2003 survey.
15
Species Category Scientific Name Common NameShark and Skate Apristurus brunneus brown cat shark
Squalus acanthias spiny dogfishBathyraja interrupta Bering skate
Raja rhina longnose skate
Flatfish Citharichthys sordidus Pacific sanddabAtheresthes stomias arrowtooth flounder
Hippoglossus stenolepis Pacific halibutEopsetta jordani petrale sole
Parophrys vetulus English soleEmbassichthys bathybius deepsea soleGlyptocephalus zachirus rex sole
Dover Microstomus pacificus Dover sole
Sablefish Anoplopoma fimbria sablefish
Grenadier Coryphaenoides acrolepis Pacific grenadierAlbatrossia pectoralis giant grenadier
Shortspine Thornyhead Sebastolobus alascanus shortspine thornyhead
Longspine Thornyhead Sebastolobus altivelis longspine thornyhead
Rockfish Sebastes alutus Pacific ocean perchSebastes crameri darkblotched rockfish
Sebastes diploproa splitnose rockfishSebastes entomelas widow rockfishSebastes flavidus yellowtail rockfishSebastes goodei chilipepperSebastes jordani shortbelly rockfish
Sebastes paucispinis bocaccioSebastes pinniger canary rockfishSebastes saxicola stripetail rockfish
Other Alepocephalus tenebrosus California slickheadBathylagidae sp. deepsea smelt (unidentified)
Trachurus symmetricus jack mackerelClupea pallasii Pacific herring
Antimora microlepis Pacific flatnoseOphiodon elongatus lingcod
Careproctus melanurus blacktail snailfishMerluccius productus Pacific hakeGenyonemus lineatus white croakerBothrocara brunneum twoline eelpout
Embryx crotalina snakehead eelpoutLycodes cortezianus bigfin eelpoutLycodes diapterus black eelpout

a) Depth (m) Vancouver Columbia Eureka Monterey Conception55–183 6.60 13.49 13.90 12.23 39.43184–549 0.43 0.77 0.74 2.08 4.13550–1,280 0.04 3.26 0.18 0.08 2.63
The above results compared favorably to a similar matrix obtained by using the square root of the coefficient of variation (CV) on the unlogged data:
b) Depth (m) Vancouver Columbia Eureka Monterey Conception55–183 6.72 22.69 19.18 5.82 33.27184–549 0.21 1.16 0.56 2.40 0.60550–1,280 0.08 4.51 0.28 0.04 2.50
5. A matrix for total hectares (in millions) within strata is given in c). The Conception INPFC area is not truncated and includes the area south of lat 32°30'N to the U.S.–Mexico border. However, the Cowcod Conservation Area has been removed, along with the Channel Islands Marine Protected Areas (MPAs). Since the cells within the sampling grid are equal in area, using hectares within strata is equivalent to using numbers of cells within strata, ignoring edge effects.
c) Depth (m) Vancouver Columbia Eureka Monterey Conception55–183 0.2318 1.4415 0.4067 0.8607 0.4250184–549 0.2852 0.8622 0.2033 0.3651 0.9088550–1,280 0.2289 0.9801 0.6364 0.8644 3.6846
6. Following the basic premise of optimum allocation for stratified random sampling (Thompson 2002), matrices a) and c) were multiplied and normalized by dividing the overall sum. The results, on a percentage basis, were:
d) Depth (m) Vancouver Columbia Eureka Monterey Conception55–183 2.11 26.85 7.80 14.53 23.13184–549 0.17 0.92 0.21 1.05 5.18550–1,280 0.01 4.41 0.16 0.10 13.37
7. Next, net mensuration data from 1997 were used to complete a power analysis (Figure 3). This analysis looked at the difference in power based on number of tows (20 to 50) and the proportion difference observed with a two-level bottom-type factor. The bottom was characterized as either: 1) flat and without obstructions or deep mud, or 2) having some combination of sloping, irregular, and/or muddy conditions. In this context, the bottom-type factor with two levels can be thought of as the difference between two areas. The other factors adjusted for are depth (55–183 m, 184–549 m, and 550–1,280 m) and vessel (three vessels were used). Note that Figure 3 shows a substantial increase in power when increasing from 20 to 30 tows. Additionally, not all tows attempted during a survey are successful; therefore, the minimum number of tows allowed within a stratum was set at 30 tows.
16

Figure 3. A power analysis based on net mensuration data from 1997, used to examine the difference in power by number of tows and the proportion difference observed in a bottom-type factor with two levels (see Materials and Methods in the Appendix).
8. The new allocation (with a minimum of 30 tows per stratum as based on variation in species catch) was combined with the original station allocation (which was area-based), in an attempt to retain the historical coverage within the area north of Point Conception. This resulted in the following number (or percentage) of tows assigned per stratum in 2003, based on a total of 620 stations.
e) Depth (m) Vancouver Columbia Eureka Monterey Conception55–183 30 (4.84%) 40 (6.45%) 30 (4.84%) 30 (4.84%) 40 (6.45%)184–549 40 (6.45%) 40 (6.45%) 40 (6.45%) 40 (6.45%) 75 (12.1%)550–1,280 30 (4.84%) 75 (12.1%) 40 (6.45%) 40 (6.45%) 30 (4.84%)
9. Further consideration of the geographic strata suggested that a major zoogeographic boundary occurred at Point Conception (lat 34°30'N), and it was decided to include only two geographic strata in the survey from 2004 onwards. After excluding the Conception INPFC area (~23% of the total survey area), the sum of the station allocations for the remaining four INPFC areas was equal to ~77%. But since a proportion of the Conception INPFC area is located north of Point Conception, it was decided that 80% of the stations would be allocated north of
17

Point Conception and 20% south. Within this latitudinal split, the proportion of area roughly determines the percent of tows within a depth stratum for the shallow and mid-depth strata, with proportionally less effort in the deep stratum (especially south of Point Conception).
f) Depth (m) North of Point Conception South of Point Conception55–183 40% 25%184–549 30% 45%550–1,280 30% 30%
Total: 100% 100%
The final allocation, after accounting for the geographic split (with 80% of the stations allocated north of Point Conception and 20% south), was:
g) Depth (m) North of Point Conception South of Point Conception55–183 32% 5%184–549 24% 9%550–1,280 24% 6%
Total: 80% 20%
These geographic and depth allocations retain the historical sampling levels observed north of Point Conception in earlier AFSC slope and Triennial Surveys and the NWFSC slope survey, while adding sampling south of Point Conception, minimizing within-stratum variation, and maximizing between-strata variation. Given sufficient resources, the survey design and sample allocation could be reevaluated and/or reviewed to be sure that it remains an efficient, up-to-date statistical design that provides the best available data for stock assessors. However, the long timeline for the current design argues in favor of maintaining the status quo.
Primary and alternate station selection (Wallace, unpublished)For 2003, 620 cells were apportioned to the strata by multiplying 620 times the strata proportions found in matrix e). Rounding to the nearest whole number did not sum to 620, so unary adjustments were made to the strata numbers to obtain a grand total of 620. The primary stations were then picked from the survey cell pool, by stratum, using a pseudorandom number generator. These 620 selected primary station cells were each assigned a vessel number from one to four, using a simple sequence (1, 2, 3, 4, 1, 2, 3, 4, …). From 2005 to 2012, 752 cells were apportioned to the strata by multiplying 752 times the strata proportions described in matrix g). In 2004 and 2013, since only three vessels were included in the survey design, a smaller total number of cells were selected (564) using the same proportions from matrix g).
For each primary station, two alternative stations were chosen as follows. First, a secondary random selection of the nonprimary cells was performed. Using a great-circle distance measurement, the closest site of the available alternative site pool was matched to a primary site within a stratum.
18
These were then removed from the secondary pool for that stratum, and the process was repeated for the second alternative site. This was done for each of the strata, in turn. The number of secondary cells selected was greater than the number of primary cells, and hence more densely distributed geographically. This density was selected, by stratum, to achieve a good balance between travel distance between sites (distance from primary to first alternative and from first alternative to second alternative), and to ensure to a 20–30% chance that the alternative sites would not be positioned directly adjacent to the primary sites. Note that with this selection procedure, there is a greater overall chance that the first alternative is the one closest to the primary. When nearby alternative sites are rare, such as in the shallow Conception INPFC area, a few alternative sites are over 20 nm away from their primary stations. In the event this proves to be a problem, the following rule was developed: If the primary station is deemed untrawlable, and the secondary station is more than 2 hours “out of the way” (i.e., in the wrong direction in relation to the next primary station), then it is up to the chief scientist’s discretion to postpone or skip that secondary station.
Cells located on major shipping lanes, munition dump sites, low-level nuclear waste dump sites, and marine conservation areas were excluded from the survey design. In addition, in consultation with the vessel’s captain, cells can be documented as untrawlable by survey personnel. When a cell cannot be successfully trawled because of rough bottom, shipwrecks, or other obstacles, it is designated untrawlable. A cell that has been designated untrawlable three times and has never been trawled successfully is excluded from future selection pools.
Tow proceduresAs is customary in most bottom trawl surveys, there is strong emphasis on strict adherence to standardized gear and rigging specifications, compliance with standardized operational protocols while conducting the sampling tows, and rigorous catch sampling and analytical procedures. Efforts are made to measure and record those aspects of each sampling operation and its surrounding circumstances that cannot be controlled through standardization.
After the vessel arrives at each primary cell, the captain commences the search for trawlable ground. If no trawlable ground is found within an hour, the cell is recorded as untrawlable and the vessel proceeds to the secondary cell site. If the secondary cell is also untrawlable, the vessel proceeds to the tertiary cell. When the primary and alternate cells have been searched for one hour each and all recorded as untrawlable, the vessel proceeds to the next primary cell. If a tow is attempted but aborted or judged unsatisfactory, a reasonable attempt is made to redo the tow within the primary cell before proceeding to alternate cells. Once an acceptable site is found, a standard tow is made with a target of 15 minutes of bottom time from net touchdown to the start of haulback.
VesselsAs a cooperative research effort, the WCGBTS charters commercial trawlers to conduct survey operations (Table 2). Chartered fishing vessels range in size from 65 to 92 feet (19.8 to 28 m) and in power from 450 to 1,200 hp (horsepower). Each vessel is rigged as a stern trawler, with a
19

Table 2. List of charter vessels utilized during the 1998–2014 West Coast Groundfish Bottom Trawl Survey.
Vessel Year(s) of Participation Vessel Year(s) of ParticipationFV Amy Lynn 1998 FV Miss Leona 1999FV Blue Horizon 1998, 1999, 2003 FV Ms. Julie 2002–2012, 2014FV Captain Jack 1999–2003 FV Noah’s Ark 2005–2014FV Coast Pride 2000 FV Pacific Sun IV 1998FV Excalibur 2000–2014 FV Raven 2005–2011FV Last Straw 2013, 2014 FV Sea Eagle 1998–2002FV Limit Stalker 2001 FV BJ Thomas 2004
rear gantry housing one or two net reels to set and retrieve trawl gear. Vessels are outfitted with split trawl winches and equipped with modern electronics, including global positioning systems (GPS), multiple depth sounders, and radar. Prior to the start of the survey, NWFSC provides each vessel with two 0.625-inch (1.5875-cm) steel core trawl cables, each 1,250 fathoms (2,288 m) in length. Cables are measured side by side and marked at 25-fathom (45.72 m) increments while being spooled onto the vessel’s winches. The markings provide real-time verification of the release of equal warp length from both winches while setting a tow.
Gear descriptionWCGBTS vessels are equipped with a standard four-panel, single-bridle, Aberdeen-type trawl spread by 5 × 7-ft (1.5 × 2.1-m) steel V doors weighing 590 kg. The headrope and footrope measure 85 and 25.9 and 31.7 m, respectively. Each net has an additional liner (1.5-inch/3.81-cm stretched measure, #24 twisted polypropylene) extending from the middle of the intermediate, through the codend, to retain smaller fish and invertebrates. The 85/104 Aberdeen trawl nets are manufactured by Nor’Eastern Trawl Systems (Bainbridge Island, Washington) and certified by NWFSC personnel. Each vessel is outfitted with a primary and secondary net, and NWFSC provides additional nets to vessels during the survey if severe net damage occurs. To ensure continuity, fishing operations are conducted in compliance with national and regional protocols detailed in Stauffer (2004).
Trawling protocolStandard trawl operations are followed to minimize differences in sampling (fishing) efficiency across the range of conditions encountered during the survey. Trawling protocols are described in detail in Stauffer (2004). Trawling operations are limited to the daylight period. The initial tow each day begins (net on seafloor) after official sunrise, and the last tow of the day ends (net off seafloor) before official sunset.
Vessel speed varies between 2.2 and 5 kn (knots) while the gear is set. When the net contacts the seafloor, the target towing speed is 2.2 ± 0.5 kn (nm/hr) over ground. Two Wide Area Augmentation System (WAAS) GPS units (Garmin 152, Garmin International, Olathe, Kansas)
20

display speed instantaneously during a tow. Position, course over ground, and speed over ground are logged continuously. The captain, with oversight from the chief scientist, is responsible for maintaining the target speed during the tow. Tows are declared unsatisfactory and repeated if the target speed is not maintained throughout the tow.
The target tow duration is 15 minutes (15 minutes at 1.13 m/sec = 0.55 km). Tows begin when the footrope contacts the seafloor, and end when the footrope lifts off the seafloor during retrieval. Initial bottom contact is determined in real time by a headrope height sensor, which detects the bottom as the net approaches. Once the footrope touches down, the vessel starts towing at the target speed.
Sensors and trawl monitoringInstrumentation played an important role in monitoring trawl performance, with mensuration data used to facilitate detection and correction of gear malfunction and identify deviation from standardized fishing procedures. The performance and geometry of trawls are measured with a pair of bottom contact sensors (BCSs, AFSC or NWFSC, Seattle, Washington), Simrad Integrated Trawl Instrumentation Systems (ITI), and Simrad PI44 Catch Monitoring Systems (Simrad Fisheries, Lynnwood, Washington). The BCS is a tilt meter housed in a heavy steel case that is vertical when the net is off the bottom and horizontal when the net is in contact with the bottom. BCSs are attached four feet from the center point of the footrope, on either side of the net. Data from the BCSs are downloaded after the completion of each haul to verify actual bottom contact duration.
The Simrad ITI and PI44 systems are used to monitor and record net position and performance for each haul. Sensors mounted on the center of the headrope provide information on the vertical opening of the trawl, distance from the headrope to the seafloor, footrope clearance above the seafloor, ambient temperature, and depth. Paired spread sensors are attached on port and starboard wings to measure net width. The Simrad trawl instruments display gear performance in real time and provide georeferenced trawl positions relative to ship position, supplying the means to track the trawl location along the seafloor throughout each tow. The ITI and PI44 data streams are monitored and continuously recorded during fishing operations.
Aspects of net performance (e.g., spread between net wings and distance from the headrope to the footrope) are recorded using acoustic and bottom contact instruments attached to the net during each deployment. Adequate wingspread and door spread indicate that the net is making consistent bottom contact and that the proper amount of scope was deployed. Extreme or prolonged periods of abnormal spread are indicative of net performance problems.
Sensor data and point estimationAll features of the trawl event (from the commencement of net deployment to completion of net retrieval), including trawl mensuration data, are synchronized based on time stamps. BCS data indicate when the net landed on and lifted off of the bottom, and are used to determine tow duration and distance fished. The Simrad ITI and PI44 trawl instruments record net
21

mensuration data and provide georeferenced trawl positions relative to ship position, supplying a means to track trawl location along the seafloor throughout each tow. Position data, collected at two-second intervals, are used to monitor ground speed, track the vessel and trawl paths, and estimate distance fished. Standard survey haul positions—generally the midpoint between the net touchdown and net liftoff positions—are estimated from GPS data. A Garmin WAAS GPS navigation unit is used to monitor towing speed during each haul. Average net speed-over-ground and distance fished are calculated from the position data and actual bottom time (Keller et al. 2008). Gear depth and bottom depth are estimated from Simrad ITI and PI44 sensor readings of headrope depth and headrope distance from bottom. Gear depth is provided by a headrope depth sensor and SBE-39 (Sea-Bird Electronics, Bellevue, Washington) mounted on the wing. Bottom depth is calculated as the sum of headrope depth and distance of the headrope from the bottom.
Mean net widths (in meters) and distances fished (in kilometers) are calculated for each haul. When net mensuration data are available, the mean net width for each tow is calculated, excluding the initial and final 10% of the tow duration. The mean net width is 13.9 m, based on data from 3,753 hauls that had available net mensuration measurements and exhibited good trawl performance. Net widths ranged from 9.8 to 17.6 m, with a standard deviation of 0.96 m. When the net mensuration instrumentation does not function properly, the mean of net width per tow was estimated using multiple linear regressions of net width as a function of net height and inverse scope (deployed wire length) for the individual chartered vessel. Distances fished were calculated by estimating the distance that the net traveled on the seafloor from the point where it touched down to the point where it lifted off (Wallace and West 2006).
Sensor data qualityIn addition to their role in evaluating trawl performance, three sensors—BCS, ITI, and GPS—provided data used to estimate effort following the completion of the survey. Because of the occasional erratic readings inherent to acoustic data, sensor streams are reviewed prior to use. Since sensor readings should be consistently present during a tow, recorded values of zero are treated as missing values and filtered prior to estimation of depth, net geometry, and temperature. Exclusion of extreme points is more difficult: large isolated spikes in depth, net geometry, and temperature readings are frequent and assumed to be the result of acoustic or electronic noise and are removed prior to processing. When multiple extreme points occur in sequence, they are more difficult to evaluate because large swings in sensor data are expected during tows over sloped and irregular substrates. Trawl execution problems also produce data sets with large fluctuations in readings. Consequently, extreme values recorded where expected—either as part of a continuous variation in magnitude, or during a particularly variable stretch of readings—are not excluded prior to analysis.
To ensure reliability of on-bottom readings, sensor data used to estimate depth, net width, and height are restricted to a subset of values collected from the center 80% of the tow duration. In the vast majority of tows, this criterion did not appreciably reduce the number of observations, but did effectively exclude small timing offsets between the BCS and ITI sensor systems and noise introduced by net touchdown and liftoff.
22

For some tows, only a few sensor readings (depth, net geometry, and temperature) fell within the estimation time interval. The extent to which these single- or few-point subsamples were representative of the entire tow was necessarily a subjective judgment. If the points seemed in alignment with the trajectory of points outside the subset time interval, they were used as the basis for estimation. Notations, hand recorded at sea during tows, provided an additional level of data quality control. These notations are subsequently evaluated and can potentially impact the decision whether to accept or reject a tow.
Biological data collectionThe surveys encounter more than 380 species or groups of fish and at least 540 species or groups of invertebrates. All fishes and invertebrates are sorted to species (or the lowest possible taxon), and then weighed using an electronic, motion-compensated scale (Marel, Reykjavik, Iceland). Any unidentified species are labeled, frozen, or preserved in formalin and retained for later identification. Subsamples of selected management species are randomly selected for individual measurements (length and weight) and biological sampling (age structure, sex determination, maturity staging, or stomach content analysis). Up to 100 (depending upon the species) sex determinations and length measurements (to the nearest centimeter) are collected per haul from each of these species. Although fork length or total length is generally measured for most species, anal length is recorded for spotted ratfish (Hydrolagus colliei) and Pacific grenadier (Coryphaenoides acrolepis). Carapace width may be recorded for Dungeness crab (Cancer magister) and/or grooved tanner crab (Chionoecetes tanneri).
A subset of fish selected for length measurement is also randomly selected for ageing. Age structures for up to 100 individuals per species (again, depending upon the species) are collected per haul. Otoliths are removed to determine age, except for lingcod (Ophiodon elongatus; fin rays), skates (Raja spp.; vertebrae), and spiny dogfish (Squalus acanthias; dorsal spines and vertebrae). For other species, only total counts and weights are recorded. From 2003 to 2008, the surveys collected more than 750,000 individual length measurements and 136,000 age structures. The species with the greatest number of length measurements and age structures include Dover sole (Microstomus pacificus), English sole (Parophrys vetulus), longspine thornyhead (Sebastolobus altivelis), Pacific hake (Merluccius productus), Pacific sanddab (Citharichthys sordidus), rex sole (Glyptocephalus zachirus), sablefish (Anoplopoma fimbria), shortspine thornyhead (Sebastolobus alascanus), splitnose rockfish (Sebastes diploproa), and stripetail rockfish (Sebastes saxicola). These ten species typically represent more than 60% of total length measurements taken during the survey. Target numbers for samples of otoliths, gonads (for maturities), lengths, weights, gender, etc., are developed for each species prior to each annual survey in close consultation with the assessment scientists. The number of target samples is tailored to the upcoming assessment cycle, with greater emphasis on species being assessed in the following year.
23
Calibration between AFSC and NWFSC SurveysOver the years, there has been considerable discussion and exploration of combining the AFSC Triennial Survey (and/or slope surveys) with the NWFSC surveys into a single time series (at least for particular depth and latitudinal ranges). However, as was evaluated at length in a workshop conducted 31 October–2 November 2006, there are a number of issues that make this challenging.
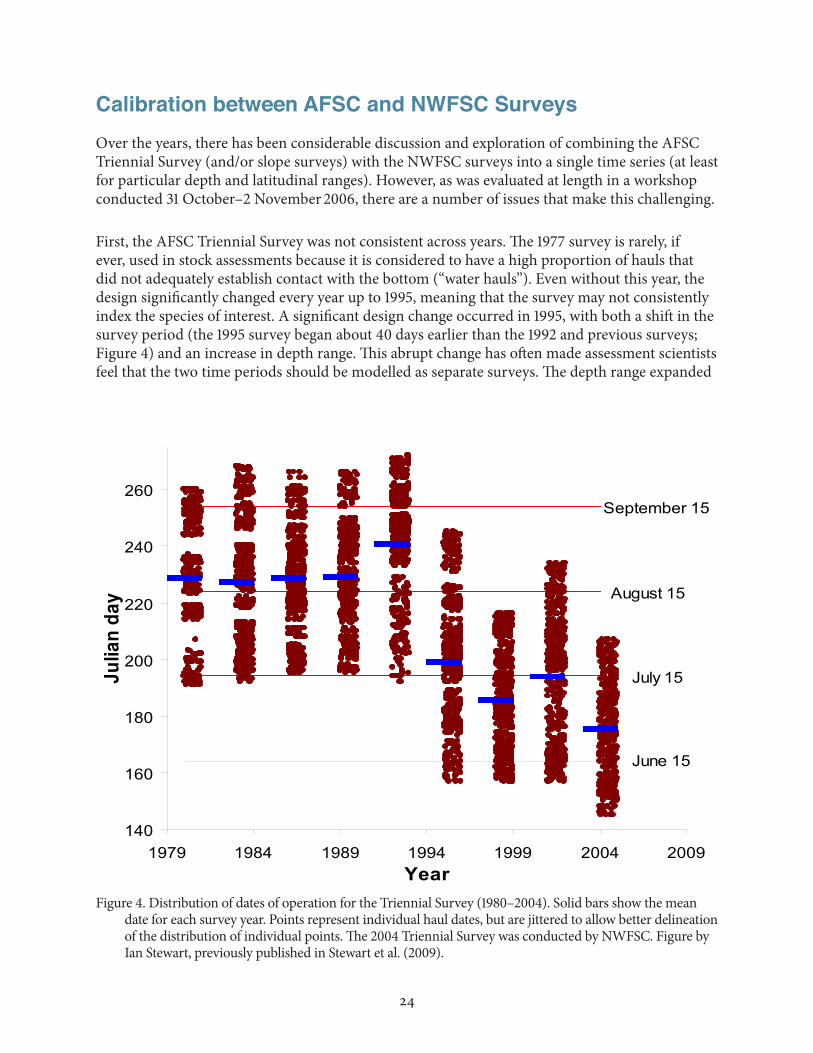
First, the AFSC Triennial Survey was not consistent across years. The 1977 survey is rarely, if ever, used in stock assessments because it is considered to have a high proportion of hauls that did not adequately establish contact with the bottom (“water hauls”). Even without this year, the design significantly changed every year up to 1995, meaning that the survey may not consistently index the species of interest. A significant design change occurred in 1995, with both a shift in the survey period (the 1995 survey began about 40 days earlier than the 1992 and previous surveys; Figure 4) and an increase in depth range. This abrupt change has often made assessment scientists feel that the two time periods should be modelled as separate surveys. The depth range expanded
Figure 4. Distribution of dates of operation for the Triennial Survey (1980–2004). Solid bars show the mean date for each survey year. Points represent individual haul dates, but are jittered to allow better delineation of the distribution of individual points. The 2004 Triennial Survey was conducted by NWFSC. Figure by Ian Stewart, previously published in Stewart et al. (2009).
June 15
August 15
July 15
September 15
140
160
180
200
220
240
260
1979 1984 1989 1994 1999 2004 2009Year
Julia
n da
y
24

from 55–366 m in 1992 to 55–500 m in 1995. For species that reside in the 366–500 m depth range in any substantial numbers, including this information is another reason to consider this a separate survey. The 1995, 1998, and 2001 surveys had similar designs, and the 2004 survey carried that design forward, but was implemented by NWFSC instead of AFSC. The exact protocols were difficult to identify when developing the 2004 survey because in later years, AFSC failed to follow their own written protocols, resulting in a fixed survey design. Also, for many species, the estimated abundance in 2004 appears much greater than expected based on previous years’ abundance indices; however, this could be influenced by the exceptional 1999-year class. Overall, the AFSC Triennial Survey is likely to be inconsistent across the years, making it difficult to treat those years as a precise relative index of a fish stock.
Second, the surveyed depth ranges between the WCGBTS and the Triennial Survey are very different. The shelf/slope survey extends to 1,280 meters, whereas the maximum depth of the AFSC Triennial Survey is 500 m (1995 and later) or 366 m (1980–1992). This will not matter for species that do not extend beyond 366 m or 500 m, but will mean that a significant amount of data will be lost from the AFSC Triennial Survey for those that do.
Third, the gear and vessels were very different between the two surveys. The nets used in these surveys were considerably different in their size and ability to fish hard and soft surfaces. The vessels used in the AFSC Triennial Surveys were larger than the vessels used in the WCGBTS, and the captains used in the WCGBTS were more experienced on the West Coast and more familiar with the areas being surveyed than the captains used in the AFSC Triennial Survey. Recent studies of differences in the WCGBTS indicate that a large amount of variability comes from differences between vessels, even though they are similar and following the same protocols.
Fourth, the protocols were different between the two surveys, which could have a large effect on the catch rates and selectivities of the survey for certain species. For example, the AFSC Triennial Survey used a fixed transect design and performed longer tows (30 minutes) than the NWFSC WCGBTS (15 minutes). Among other differences, this means that the NWFSC WCGBTS can place tows in smaller trawlable areas than the AFSC Triennial Survey.
Given all of the above challenges, stock assessments currently do not treat these surveys as a single time series when examining indices of abundance. However, recent efforts to interpret shifts in species distributions using both the Triennial Survey and the WCGBTS indicate that the earlier data are useful in evaluating distribution shifts for West Coast species, even if indices of abundance are not comparable (Thorson et al. 2016). •
25

ReferencesBertrand, J., L. Gil de Sola, C. Papaconstantinou, G. Relini, and A. Souplet. 2002a. The General
Specifications of the MEDITS Surveys. Scientia Marina 66(Suppl.2):9–17.
Bertrand, J., I. Leonori, P.-Y. Dremière, and G. Cosimi. 2002b. Depth Trajectory and Performance of a Trawl Used for an International Bottom Trawl Survey in the Mediterranean. Scientia Marina 66(Suppl.2):169–182.
Byrne, C. J., T. R. Azarovitz, and M. P. Sissenwine. 1981. Factors Affecting Variability of Research Vessel Trawl Surveys. Pages 258–273 in W. G. Doubleday, and D. Rivard, editors. Bottom Trawl Surveys: Proceedings of a Workshop Held at Ottawa, November 12–14, 1980. Department of Fisheries and Oceans, Ottawa, Canada.
Byrne, C. J., and M. J. Fogarty. 1985. Comparison of the Fishing Power of Two Fisheries Research Vessels. Northwest Atlantic Fisheries Organization Scientific Council Meeting Document 85/90.
Dark, T. A., and M. E. Wilkins. 1994. Distribution, Abundance, and Biological Characteristics of Groundfish off the Coast of Washington, Oregon, and California, 1977–1986. U.S. Department of Commerce, NOAA Technical Report NMFS-TR-117.
Frechet, A. 1997. The Use of Multiple Commercial Boats to Conduct a Stratified-Random Survey for Groundfish in the Gulf of St. Lawrence. International Council for the Exploration of the Sea report ICES C.M. 1997/W:01.
Goddard, P. D., and G. Walters. 2000. 1997 Bottom Trawl Survey of the Eastern Bering Sea Continental Shelf. U.S. Department of Commerce, Alaska Fisheries Science Center Processed Report 2000–02.
Keller, A. A., B. H. Horness, E. L. Fruh, V. H. Simon, V. J. Tuttle, K. L. Bosley, J. B. Buchanan, D. J. Kamikawa, and J. R. Wallace. 2008. The 2005 U.S. West Coast Bottom Trawl Survey of Groundfish Resources off Washington, Oregon, and California: Estimates of Distribution, Abundance, and Length Composition. U.S. Department of Commerce, NOAA Technical Memorandum NMFS-NWFSC-93.
Lauth, R. R. 1997a. The 1995 Pacific West Coast Upper Continental Slope Trawl Survey of Groundfish Resources off Southern Oregon and Northern California: Estimates of Distribution, Abundance, and Length Composition. U.S. Department of Commerce, NOAA Technical Memorandum NMFS-AFSC-80.
Lauth, R. R. 1997b. The 1996 Pacific West Coast Upper Continental Slope Trawl Survey of Groundfish Resources off Washington and Oregon: Estimates of Distribution, Abundance, and Length Composition. U.S. Department of Commerce, NOAA Technical Memorandum NMFS-AFSC-81.
Lauth, R. R. 1999. The 1997 Pacific West Coast Upper Continental Slope Trawl Survey of Groundfish Resources off Washington, Oregon, and California: Estimates of Distribution, Abundance, and Length Composition. U.S. Department of Commerce, NOAA Technical Memorandum NMFS-AFSC-98.
Lauth, R. R. 2000. The 1999 Pacific West Coast Upper Continental Slope Trawl Survey of Groundfish Resources off Washington, Oregon, and California: Estimates of Distribution, Abundance, and Length Composition. U.S. Department of Commerce, NOAA Technical Memorandum NMFS-AFSC-115.
Lauth, R. R. 2001. The 2000 Pacific West Coast Upper Continental Slope Trawl Survey of Groundfish Resources off Washington, Oregon, and California: Estimates of Distribution, Abundance, and Length Composition. U.S. Department of Commerce, NOAA Technical Memorandum NMFS-AFSC-120.
26
Lauth, R. R., S. S. Syrjala, and S. W. McEntire. 1998. Effects of Gear Modifications on the Trawl Performance and Catching Efficiency of the West Coast Upper Continental Slope Groundfish Survey Trawl. Marine Fisheries Review, 60:1–26.
Lauth, R. R., M. E. Wilkins, and P.A. Raymore, Jr. 1997. Results of Trawl Surveys of Groundfish Resources of the West Coast Upper Continental Slope from 1989 to 1993. U.S. Department of Commerce, NOAA Technical Memorandum NMFS-AFSC-79.
McAllister, M., and E. K. Pikitch. 1997. A Bayesian Approach to Choosing a Design for Surveying Fishery Resources: Application to the Eastern Bering Sea Trawl Survey. Canadian Journal of Fisheries and Aquatic Sciences 54:301–311.
Methot, R. D., J. R. Wallace, and C. W. West. 2000. Introducing a New Trawl Survey for U.S. West Coast Slope Groundfish. International Council for the Exploration of the Sea report ICES C.M. 2000/W:11.
Shaw, F. R., M. E. Wilkins, K. L. Weinberg, M. Zimmermann, and R. R. Lauth. 2000. The 1998 Pacific West Coast Bottom Trawl Survey of Groundfish Resources: Estimates of Distribution, Abundance, and Length and Age Composition. U.S. Department of Commerce, NOAA Technical Memorandum NMFS-AFSC-114.
Sissenwine, M. P., and E. W. Bowman. 1978. An Analysis of Some Factors Affecting the Catchability of Fish by Bottom Trawls. International Commission for the Northwest Atlantic Fisheries Research Bulletin 13:81–87.
Stark, J. 1997. Report to Industry: Fishing Log for the 1996 Bottom Trawl Survey of the Gulf of Alaska. U.S. Department of Commerce, Alaska Fisheries Science Center Processed Report 1997-05.
Stauffer, G. 2004. NOAA Protocols for Groundfish Bottom Trawl Surveys of the Nation’s Fishery Resources. U.S. Department of Commerce, NOAA Technical Memorandum NMFS-F/SPO-65.
Stewart, I. J., J. R. Wallace, and C. McGilliard. 2009. Status of the U.S. Yelloweye Rockfish Resource in 2009. Final Report to the Pacific Fishery Management Council, Portland, Oregon.
Thompson, S. K. 2002. Sampling, 2nd edition. John Wiley and Sons, New York.
Thorson, J. T., M. L. Pinsky, and E. J. Ward. 2016. Model-Based Inference for Estimating Shifts in Species Distribution, Area Occupied and Centre of Gravity. Methods in Ecology and Evolution 7(8):990–1002. DOI: 10.1111/2041-210X.12567
Wallace, J. R., and C. W. West. 2006. Measurements of Distance Fished during the Trawl Retrieval Period. Fisheries Research 77:285–292.
Weinberg, K. L., M. E. Wilkins, R. R. Lauth, and P. A. Raymore, Jr. 1994. The 1989 Pacific West Coast Bottom Trawl Survey of Groundfish Resources: Estimates of Distribution, Abundance, and Length and Age Composition. U.S. Department of Commerce, NOAA Technical Memorandum NMFS-AFSC-33.
Weinberg, K. L., M. E. Wilkins, F. R. Shaw, and M. Zimmermann. 2002. The 2001 Pacific West Coast Bottom Trawl Survey of Groundfish Resources: Estimates of Distribution, Abundance, and Length and Age Composition. U.S. Department of Commerce, NOAA Technical Memorandum NMFS-AFSC-128.
Wilderbuer, T. K., R. F. Kappenman, and D. R. Gunderson. 1998. Analysis of Fishing Power Correction Factor Estimates from a Trawl Comparison Experiment. North American Journal of Fisheries Management 18:11–18.
Wilkins, M. E., M. Zimmermann, and K. L. Weinberg. 1998. The 1995 Pacific West Coast Bottom Trawl Survey of Groundfish Resources: Estimates of Distribution, Abundance, and Length and Age Composition. U.S. Department of Commerce, NOAA Technical Memorandum NMFS-AFSC-89.
Zimmermann, M., M. E. Wilkins, R. R. Lauth, and K. L. Weinberg. 1994. The 1992 Pacific West Coast Bottom Trawl Survey of Groundfish Resources: Estimates of Distribution, Abundance, and Length Composition. U.S. Department of Commerce, NOAA Technical Memorandum NMFS-AFSC-42.
27

Appendix
The following report is an abridged version of a previously unpublished report, without the original figures. It has received minor revision and editing.
28

Evaluation of West Coast Slope Survey Methodology
Charles W. West,* Donald R. Gunderson,1,* and Richard D. Methot
Fishery Resource Analysis and Monitoring DivisionNorthwest Fisheries Science Center2725 Montlake Boulevard EastSeattle, Washington 98112
1Fisheries Research InstituteBox 357980University of WashingtonSeattle, Washington 98195
*Retired
March 1998
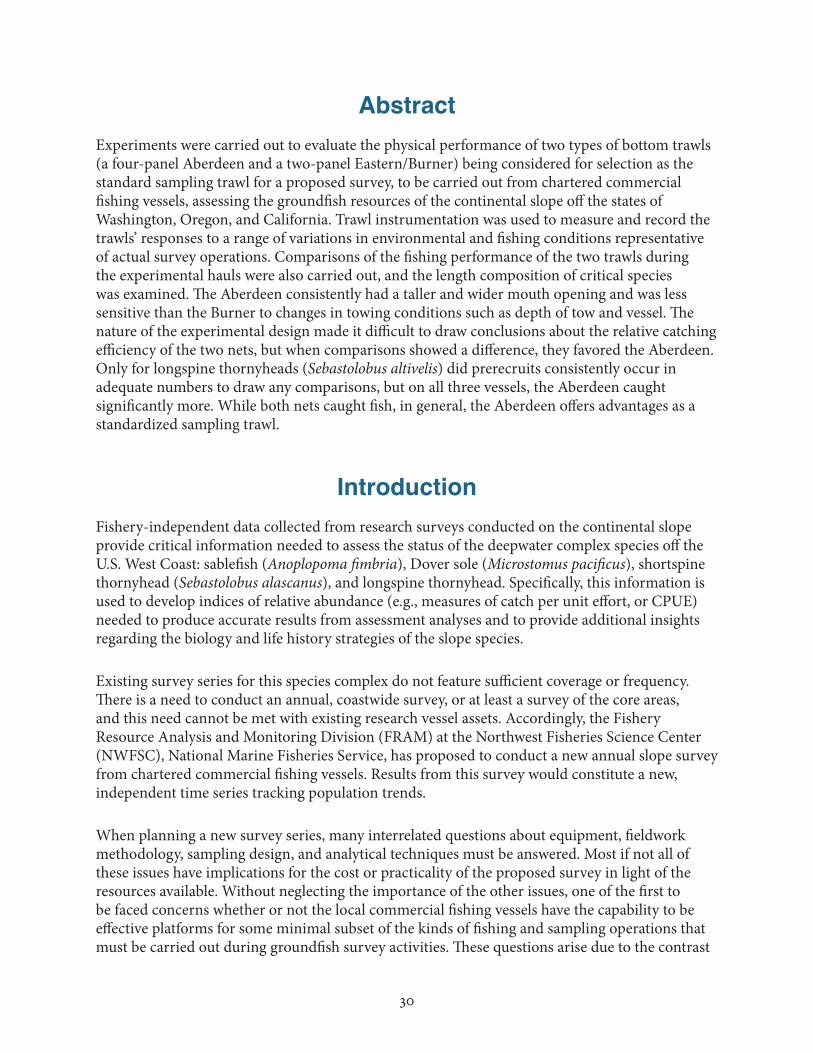
AbstractExperiments were carried out to evaluate the physical performance of two types of bottom trawls (a four-panel Aberdeen and a two-panel Eastern/Burner) being considered for selection as the standard sampling trawl for a proposed survey, to be carried out from chartered commercial fishing vessels, assessing the groundfish resources of the continental slope off the states of Washington, Oregon, and California. Trawl instrumentation was used to measure and record the trawls’ responses to a range of variations in environmental and fishing conditions representative of actual survey operations. Comparisons of the fishing performance of the two trawls during the experimental hauls were also carried out, and the length composition of critical species was examined. The Aberdeen consistently had a taller and wider mouth opening and was less sensitive than the Burner to changes in towing conditions such as depth of tow and vessel. The nature of the experimental design made it difficult to draw conclusions about the relative catching efficiency of the two nets, but when comparisons showed a difference, they favored the Aberdeen. Only for longspine thornyheads (Sebastolobus altivelis) did prerecruits consistently occur in adequate numbers to draw any comparisons, but on all three vessels, the Aberdeen caught significantly more. While both nets caught fish, in general, the Aberdeen offers advantages as a standardized sampling trawl.
IntroductionFishery-independent data collected from research surveys conducted on the continental slope provide critical information needed to assess the status of the deepwater complex species off the U.S. West Coast: sablefish (Anoplopoma fimbria), Dover sole (Microstomus pacificus), shortspine thornyhead (Sebastolobus alascanus), and longspine thornyhead. Specifically, this information is used to develop indices of relative abundance (e.g., measures of catch per unit effort, or CPUE) needed to produce accurate results from assessment analyses and to provide additional insights regarding the biology and life history strategies of the slope species.
Existing survey series for this species complex do not feature sufficient coverage or frequency. There is a need to conduct an annual, coastwide survey, or at least a survey of the core areas, and this need cannot be met with existing research vessel assets. Accordingly, the Fishery Resource Analysis and Monitoring Division (FRAM) at the Northwest Fisheries Science Center (NWFSC), National Marine Fisheries Service, has proposed to conduct a new annual slope survey from chartered commercial fishing vessels. Results from this survey would constitute a new, independent time series tracking population trends.
When planning a new survey series, many interrelated questions about equipment, fieldwork methodology, sampling design, and analytical techniques must be answered. Most if not all of these issues have implications for the cost or practicality of the proposed survey in light of the resources available. Without neglecting the importance of the other issues, one of the first to be faced concerns whether or not the local commercial fishing vessels have the capability to be effective platforms for some minimal subset of the kinds of fishing and sampling operations that must be carried out during groundfish survey activities. These questions arise due to the contrast
30
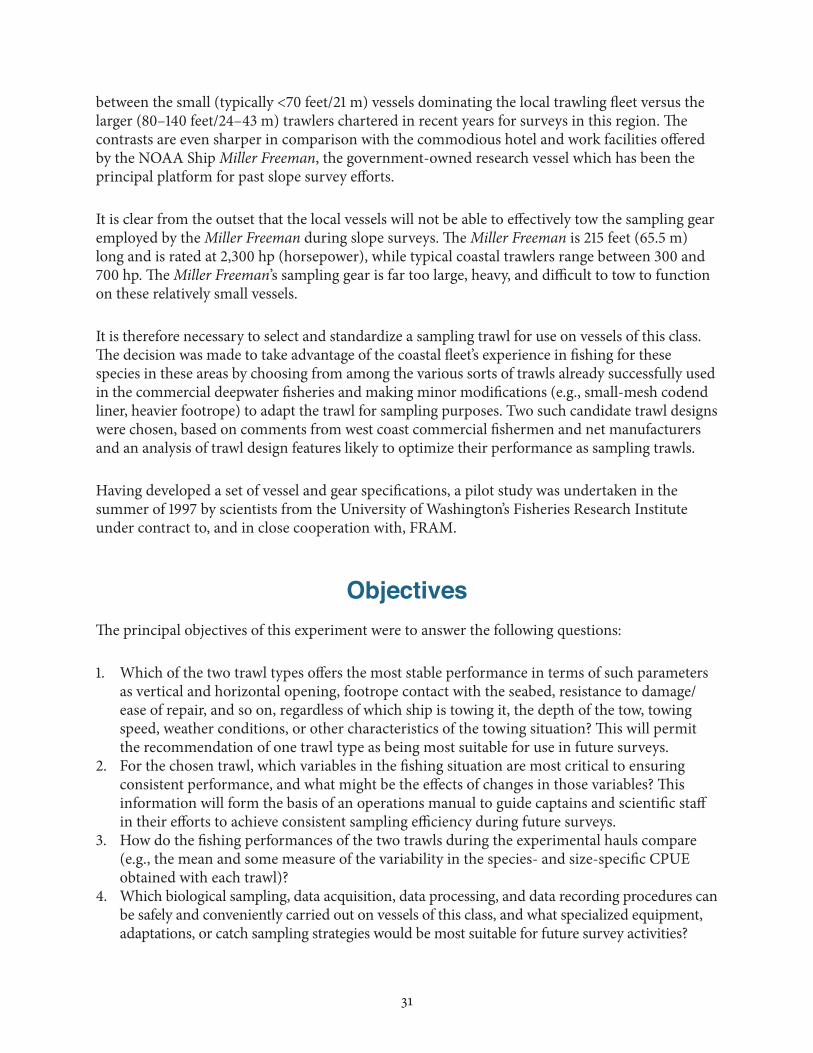
between the small (typically <70 feet/21 m) vessels dominating the local trawling fleet versus the larger (80–140 feet/24–43 m) trawlers chartered in recent years for surveys in this region. The contrasts are even sharper in comparison with the commodious hotel and work facilities offered by the NOAA Ship Miller Freeman, the government-owned research vessel which has been the principal platform for past slope survey efforts.
It is clear from the outset that the local vessels will not be able to effectively tow the sampling gear employed by the Miller Freeman during slope surveys. The Miller Freeman is 215 feet (65.5 m) long and is rated at 2,300 hp (horsepower), while typical coastal trawlers range between 300 and 700 hp. The Miller Freeman’s sampling gear is far too large, heavy, and difficult to tow to function on these relatively small vessels.
It is therefore necessary to select and standardize a sampling trawl for use on vessels of this class. The decision was made to take advantage of the coastal fleet’s experience in fishing for these species in these areas by choosing from among the various sorts of trawls already successfully used in the commercial deepwater fisheries and making minor modifications (e.g., small-mesh codend liner, heavier footrope) to adapt the trawl for sampling purposes. Two such candidate trawl designs were chosen, based on comments from west coast commercial fishermen and net manufacturers and an analysis of trawl design features likely to optimize their performance as sampling trawls.
Having developed a set of vessel and gear specifications, a pilot study was undertaken in the summer of 1997 by scientists from the University of Washington’s Fisheries Research Institute under contract to, and in close cooperation with, FRAM.
ObjectivesThe principal objectives of this experiment were to answer the following questions:
1. Which of the two trawl types offers the most stable performance in terms of such parameters as vertical and horizontal opening, footrope contact with the seabed, resistance to damage/ease of repair, and so on, regardless of which ship is towing it, the depth of the tow, towing speed, weather conditions, or other characteristics of the towing situation? This will permit the recommendation of one trawl type as being most suitable for use in future surveys.
2. For the chosen trawl, which variables in the fishing situation are most critical to ensuring consistent performance, and what might be the effects of changes in those variables? This information will form the basis of an operations manual to guide captains and scientific staff in their efforts to achieve consistent sampling efficiency during future surveys.
3. How do the fishing performances of the two trawls during the experimental hauls compare (e.g., the mean and some measure of the variability in the species- and size-specific CPUE obtained with each trawl)?
4. Which biological sampling, data acquisition, data processing, and data recording procedures can be safely and conveniently carried out on vessels of this class, and what specialized equipment, adaptations, or catch sampling strategies would be most suitable for future survey activities?
31

Materials and MethodsThe following trawl performance variables were acoustically measured, with all readings stored on a portable computer: spread between the trawl doors, spread between the wingends, vertical distance from the center of the headrope to the bottom, distance from the headrope to the footrope, and clearance (if any) between the footrope and the bottom. Additional instruments were used to mechanically sense and record the moment at which the footrope contacted, or lost contact with, the bottom, at a finer spatial scale than was possible with the acoustic system. Other data on operational conditions that could have an impact on trawl performance (i.e., depth, amount of towing cable deployed, towing speed, tow duration, and weather conditions) were recorded during each experimental haul.
The bottom contact sensors were used to calculate two variables: settling time and time to liftoff. Settling time was the time elapsed between the moment at which the winches were stopped when shooting the gear and the moment that the bottom contact sensors showed the gear contacting the bottom. Liftoff time was similarly calculated as the time between starting the winches to heave the gear and the moment at which the gear actually came off bottom.
The tested trawl designs were of two types commonly used in slope commercial fisheries, scaled to fit vessels ranging from 325 to 600 hp. One trawl was of the Aberdeen four-panel type, and the other of the Eastern/Burner two-panel type. The trawls were modified to prepare them for survey use by installing small-mesh (2-inch [5-cm] stretched measure or less) liners in the codends in order to retain prerecruits, and each was fitted with a footrope constructed of 8-inch (20.3-cm) rubber discs mounted on 0.5-inch (1.3-cm) alloy long-link chain. Both were rigged with 15-fathom (27.4-m) double bridles leading to a 15-fathom single sweep attached to 1,100-lb (500-kg), 5 × 7-ft (1.5 × 2.1-m) steel V doors, the lower bridle and single section on each side covered with rubber discs.
The Aberdeen was rigged with 24 inches (61 cm) of setback (including connectors) in the upper bridles, and 28 10-inch (25.4-cm) diameter plastic trawl floats, each with 13 lb (5.9 kg) net buoyancy. During the first two cruises (FV Excalibur and FV High Sea), the Burner was rigged with a 70-lb (31.75-kg) chain link installed in-line between each lower bridle and lower wingend, chain extensions in the upper bridles to yield 24 inches of setback after allowing for the extra length of the chain link, and 12 10-inch trawl floats. Prior to the third cruise (on the FV Coast Pride), the Burner’s fishing line and footrope were adjusted to compensate for stretching and slippage, and the rigging was adjusted as follows: the two 70-lb chain links were replaced with weighted bunt bobbins (~100 lb/45.4 kg each), the upper bridle setback lengths were reduced to 18 inches (45.7 cm), and five floats were added to the headrope.
The work was carried out during three ten-day charter periods, each period on a different vessel chosen to represent a portion of the range of horsepower ratings listed above. Vessel and cruise particulars are summarized in Table A-1.
All hauls were made at the direction of the chief scientist and conformed to the following experimental design: The two trawls were fished on an alternating basis. Treatment variables were
32
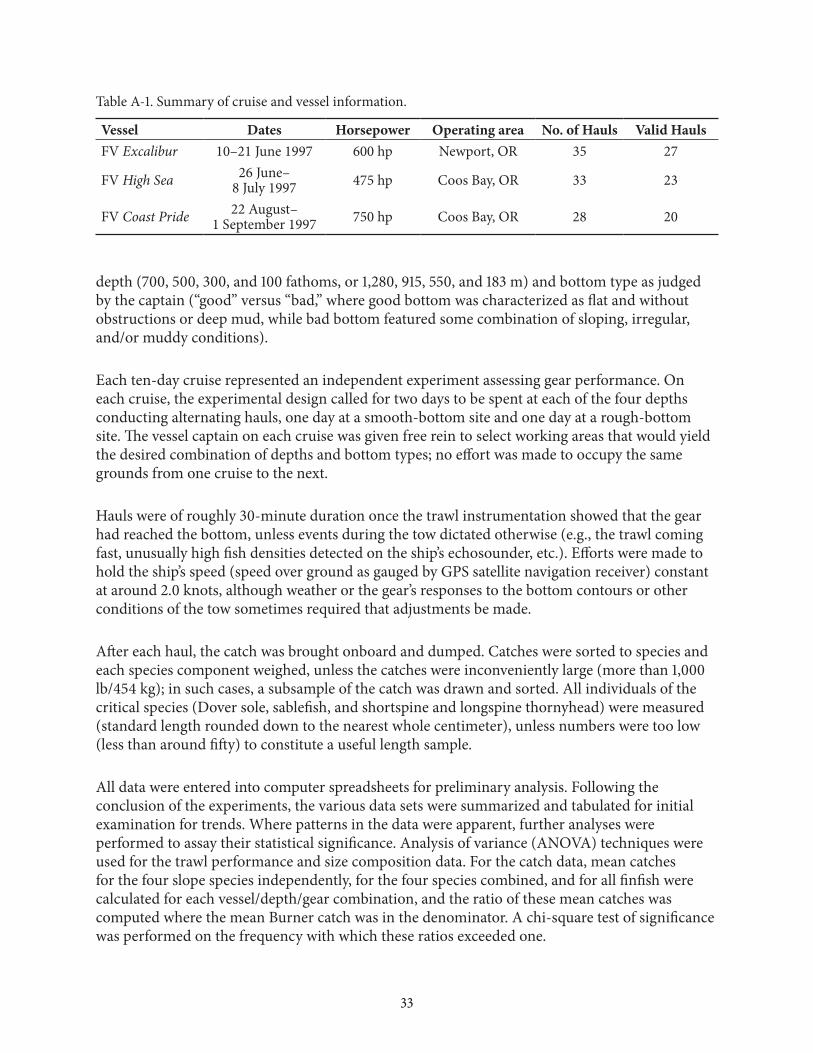
Table A-1. Summary of cruise and vessel information.
Vessel Dates Horsepower Operating area No. of Hauls Valid HaulsFV Excalibur 10–21 June 1997 600 hp Newport, OR 35 27
FV High Sea 26 June– 8 July 1997 475 hp Coos Bay, OR 33 23
FV Coast Pride 22 August– 1 September 1997 750 hp Coos Bay, OR 28 20
depth (700, 500, 300, and 100 fathoms, or 1,280, 915, 550, and 183 m) and bottom type as judged by the captain (“good” versus “bad,” where good bottom was characterized as flat and without obstructions or deep mud, while bad bottom featured some combination of sloping, irregular, and/or muddy conditions).
Each ten-day cruise represented an independent experiment assessing gear performance. On each cruise, the experimental design called for two days to be spent at each of the four depths conducting alternating hauls, one day at a smooth-bottom site and one day at a rough-bottom site. The vessel captain on each cruise was given free rein to select working areas that would yield the desired combination of depths and bottom types; no effort was made to occupy the same grounds from one cruise to the next.
Hauls were of roughly 30-minute duration once the trawl instrumentation showed that the gear had reached the bottom, unless events during the tow dictated otherwise (e.g., the trawl coming fast, unusually high fish densities detected on the ship’s echosounder, etc.). Efforts were made to hold the ship’s speed (speed over ground as gauged by GPS satellite navigation receiver) constant at around 2.0 knots, although weather or the gear’s responses to the bottom contours or other conditions of the tow sometimes required that adjustments be made.
After each haul, the catch was brought onboard and dumped. Catches were sorted to species and each species component weighed, unless the catches were inconveniently large (more than 1,000 lb/454 kg); in such cases, a subsample of the catch was drawn and sorted. All individuals of the critical species (Dover sole, sablefish, and shortspine and longspine thornyhead) were measured (standard length rounded down to the nearest whole centimeter), unless numbers were too low (less than around fifty) to constitute a useful length sample.
All data were entered into computer spreadsheets for preliminary analysis. Following the conclusion of the experiments, the various data sets were summarized and tabulated for initial examination for trends. Where patterns in the data were apparent, further analyses were performed to assay their statistical significance. Analysis of variance (ANOVA) techniques were used for the trawl performance and size composition data. For the catch data, mean catches for the four slope species independently, for the four species combined, and for all finfish were calculated for each vessel/depth/gear combination, and the ratio of these mean catches was computed where the mean Burner catch was in the denominator. A chi-square test of significance was performed on the frequency with which these ratios exceeded one.
33

Table A-2. Summary of factors affecting trawl performance.
Vertical Opening Wingspread Settling Time Time to Liftoff
Vessel Aberdeen Burnera
Burner
Aberdeen Burner
Aberdeen Burner
Depth Burner
Aberdeen Burner
Aberdeen Burner
Aberdeen Burner
Bottom Type No effect No effect No effect No effect
Towing Speed No effect Aberdeen Burner
Aberdeen Burner
Aberdeen Burner
a Effect was statistically significant.
ResultsA total of 96 hauls were logged during the three cruises, including test tows to verify instrument function and hauls ruled invalid due to hangs, gear or instrument malfunctions, or other problems. Of these 96 hauls, 70 were considered valid hauls with usable instrument and/or catch data.
Trawl performanceThe fishing dimensions of the two trawls were different. Averaged over all tows made at all depths by all three vessels, the Aberdeen’s vertical opening was 15 feet (4.64 m), while its wingspread was 49 feet (15 m). The Burner’s vertical opening was almost 9 feet (2.67 m) while its wingspread was about 40 feet (12 m).
The two trawl types responded in different ways to the various factors in the towing situation, although there were some similarities (Table A-2).
Starting with the similar responses, bottom type (good vs. bad) did not emerge as an important factor for any performance variable monitored on either trawl. Both trawls were sensitive to the towing speed (speed over ground), often in similar ways. The vertical opening was apparently not affected by towing speed with either trawl. Considered on a vessel-by-vessel basis, at higher towing speeds wingspreads were reduced for both trawls, except for the Burner on the FV High Sea, where wingspread appeared to increase with towing speed. However, the range of towing speeds observed on this vessel was a bit lower than that seen on the other two vessels.
Once they had reached the bottom, both trawls maintained stable footrope contact with the bottom so long as the vessel could hold the depth contour, and neither seemed consistently stronger or weaker in this regard.
34

For both trawls, settling time and time to liftoff were both higher at higher speeds, and increased with increasing depth. Both variables were sensitive to vessel effects, probably because of differences in the vessel’s operating practices during shooting and heaving (such as whether or not the vessel was idling or moving slowly ahead). However, settling time and time to liftoff were virtually identical for both nets.
Vessel effects and depth effects did have different impacts on the vertical and horizontal dimensions of the trawls’ mouth areas. The Aberdeen was relatively insensitive to both, although the vertical opening did respond slightly to vessel effects and its wingspread was slightly affected by depth. Depth and vessel effects both had stronger impacts on the vertical and horizontal dimensions of the Burner.
Catching performanceAny attempts to discern or interpret apparent patterns in the catching performance of these gears must be made with great caution. The focus of the experimental design was to characterize the physical performance of the two gear types as they responded to changes in the towing conditions. This is counter to the requirements of a fishing power experiment, where it is necessary to hold fishing conditions as constant as possible among tows and to get multiple replicates of each tow in order to overcome the inherent variability in catches from one tow to the next. Further, because the three vessels operated at different times and/or areas, it is not possible to adequately distinguish between vessel effects and time or area effects. Nonetheless, some patterns may be cautiously described.
Breaking down the catches by vessel and depth zone for each species, the Aberdeen often had a higher mean catch (Table A-3), although tests such as this have limitations.
Size composition of catchesThe experimental methodology did lend itself to comparisons of the size composition of catches taken with the two trawls. Of the four slope species, only for longspine thornyheads were there sufficient numbers of prerecruit (<8 inches/20 cm) fish present to permit such an analysis. On all three vessels, the Aberdeen caught significantly greater numbers of prerecruits. There were no significant differences in numbers of fully recruited (8 inches or larger) fish caught by the two trawls, except on the FV High Sea, where the Burner caught more.
35

Table A-3. Ratios of average catches (mean Aberdeen catch/mean Burner catch).
Sablefish Depth (m) No. of comparisons: 11Vessel 183 366 550 915 1,280 Aberdeen greater: 7FV Excalibur 3.07 0.72 1.11 1.80 — Frequency = 0.6364FV High Sea 2.27 — 0.78 1.54 — c2 = 0.8182FV Coast Pride 0.17 — 0.51 1.82 3.05 P = 0.3657
Longspine Thornyhead Depth (m) No. of comparisons: 7Vessel 183 366 550 915 1,280 Aberdeen greater: 6FV Excalibur — — 1.19 1.13 — Frequency = 0.8571FV High Sea — — 1.16 0.96 — c2 = 3.5714FV Coast Pride — — 1.08 1.45 1.39 P = 0.0588
Shortspine Thornyhead Depth (m) No. of comparisons: 11Vessel 183 366 550 915 1,280 Aberdeen greater: 8FV Excalibur 0.90 1.38 1.71 1.03 — Frequency = 0.7273FV High Sea 0.67 — 3.66 1.69 — c2 = 2.2727FV Coast Pride 0.41 — 2.23 — — P = 0.1317
Dover Sole Depth (m) No. of comparisons: 11Vessel 183 366 550 915 1,280 Aberdeen greater: 9FV Excalibur 1.89 3.54 1.84 0.96 — Frequency = 0.8182FV High Sea 1.46 — 1.38 1.52 — c2 = 4.4545FV Coast Pride 0.17 — 1.20 1.30 4.25 P = 0.0348
All Slope Species Depth (m) No. of comparisons: 11Vessel 183 366 550 915 1,280 Aberdeen greater: 10FV Excalibur 2.50 1.89 1.32 1.19 — Frequency = 0.9091FV High Sea 1.55 — 1.20 1.32 — c2 = 7.3636FV Coast Pride 0.19 — 1.02 1.44 2.28 P = 0.0067
All Finfish Species Depth (m) No. of comparisons: 11Vessel 183 366 550 915 1,280 Aberdeen greater: 11FV Excalibur 3.02 2.08 1.46 1.62 — Frequency = 1.0000FV High Sea 1.67 — 1.70 1.11 — c2 = 11.0000FV Coast Pride 1.98 — 1.22 1.37 1.37 P = 0.0009
36
DiscussionBoth trawls performed adequately under typical slope survey conditions on the vessels employed for this experiment, which represent the pool of vessels from which likely survey vessels will be drawn in future charters. Either could serve satisfactorily as a standard sampling trawl for slope surveys. However, it is necessary to choose one as the standard, and the Aberdeen offers several advantages with no glaring disadvantages: 1) Its physical performance was more stable and less sensitive to the sorts of variations in fishing conditions that are likely to be encountered over a coastwide, multivessel survey. 2) It caught fish of the slope species at least as well as the Burner. 3) It was more efficient at catching prerecruits of at least one of the slope species, an important property for a sampling trawl. 4) While vertical opening was not considered a critical criterion for the slope species, which are presumed to be strongly bottom-oriented, it is a much more important feature for surveying some rockfish species and other species of the continental shelf. Since it is possible that future surveys will be conducted on the shelf using coastal vessels, it is desirable that they be able to employ the same standard gear as the slope survey so long as one can be identified that functions adequately in both environments. The Aberdeen clearly functioned at least as well as the Burner under representative slope survey conditions, and with its taller opening, it would seem to be a superior choice for surveys in shallower waters.
The experiments demonstrated that within the physical and operational constraints of coastal trawlers, it is possible to carry out a suite of biological sampling and data-collection tasks similar to those required during a groundfish survey. Much was learned about the adaptations of equipment and methodology that will be needed to ensure the success of future surveys conducted from such platforms.
The experiments also pointed out where more effort is required to ensure that the sampling efficiency (catching efficiency) is as consistent as possible across vessels and years. Examples would include the need to standardize towing speed, scope ratios, shooting and hauling procedures, gear construction and rigging specifications, and other such variables. The study also demonstrated the value of using trawl instrumentation in order to ensure consistent trawl performance and monitor unavoidable variations in performance, especially in the challenging fishing environment found on the slope.
37
Recently published by the Northwest Fisheries Science CenterNOAA Technical Memorandum NMFS-NWFSC-
135 Mongillo, T. M., G. M. Ylitalo, L. D. Rhodes, S. M. O’Neill, D. P. Noren, and M. B. Hanson. 2016. Exposure to a Mixture of Toxic Chemicals: Implications for the Health of Endangered Southern Resident Killer Whales. U.S. Department of Commerce, NOAA Technical Memorandum NMFS-NWFSC-135. NTIS number pending. DOI: 10.7289/V5/TM-NWFSC-135.
134 Leonard, J. 2016. Washington and Oregon Charter Vessel Survey: Methodology and Results. U.S. Department of Commerce, NOAA Technical Memorandum NMFS-NWFSC-134. NTIS number PB2017-100472. DOI: 10.7289/V5/TM-NWFSC-134.
133 Duffield, D., J. K. Gaydos, S. Raverty, K. Wilkinson, B. Norberg, L. Barre, M. B. Hanson, P. Foreman, A. Traxler, D. Lambourn, J. Huggins, J. Calambokidis, T. McKlveen, S. Dennison, and H. Brubaker. 2016. Wild Animal Mortality Investigation: Southern Resident Killer Whale L-112 Final Report. U.S. Department of Commerce, NOAA Technical Memorandum NMFS-NWFSC-133. NTIS number PB2017-100471. DOI: 10.7289/V5/TM-NWFSC-133.
132 Anderson, L. E., and M. Plummer. 2016. Puget Sound Recreational Shellfishing Survey: Methodology and Results. U.S. Department of Commerce, NOAA Technical Memorandum NMFS-NWFSC-132. NTIS number PB2017-100470. DOI: 10.7289/V5/TM-NWFSC-132.
131 Waples, R. S. 2016. Small Investments with Big Payoffs: A Decade of the Internal Grants Program at the Northwest Fisheries Science Center. U.S. Department of Commerce, NOAA Technical Memorandum NMFS-NWFSC-131. NTIS number PB2017-100469. DOI: 10.7289/V5/TM-NWFSC-131.
130 Puget Sound Recovery Implementation Technical Team. 2015. Puget Sound Chinook Salmon Recovery: A Framework for the Development of Monitoring and Adaptive Management Plans. U.S. Department of Commerce, NOAA Technical Memorandum NMFS-NWFSC-130. NTIS number PB2016-100691. DOI: 10.7289/V5/TM-NWFSC-130.
129 Hard, J. J., J. M. Myers, E. J. Connor, R. A. Hayman, R. G. Kope, G. Lucchetti, A. R. Marshall, G. R. Pess, and B. E. Thompson. 2015. Viability Criteria for Steelhead within the Puget Sound Distinct Population Segment. U.S. Department of Commerce, NOAA Technical Memorandum NMFS-NWFSC-129. NTIS number PB2015-105188. DOI: 10.7289/V5/TM-NWFSC-129.
128 Myers, J. M., J. J. Hard, E. J. Connor, R. A. Hayman, R. G. Kope, G. Lucchetti, A. R. Marshall, G. R. Pess, and B. E. Thompson. 2015. Identifying Historical Populations of Steelhead within the Puget Sound Distinct Population Segment. U.S. Department of Commerce, NOAA Technical Memorandum NMFS-NWFSC-128. NTIS number PB2015-103741. DOI: 10.7289/V5/TM-NWFSC-128.
127 Roni, P., G. R. Pess, T. J. Beechie, and K. M. Hanson. 2014. Fish–Habitat Relationships and the Effectiveness of Habitat Restoration. U.S. Department of Commerce, NOAA Technical Memorandum NMFS-NWFSC-127. NTIS number PB2014-108836.
126 Russell, S., and M. S. Ruff. 2014. The U.S. Whale Watching Industry of Greater Puget Sound: A Description and Baseline Analysis. U.S. Department of Commerce, NOAA Technical Memorandum NMFS-NWFSC-126. NTIS number PB-2014-105939.
NOAA Technical Memorandums NMFS-NWFSC are available at theNorthwest Fisheries Science Center website, https://www.nwfsc.noaa.gov/index.cfm.