the norwegian national innovation system: a … · · 2016-03-292 keith smith, espen dietrichs...
TRANSCRIPT

1
Keith Smith, Espen Dietrichs and Svein Olav Nås: The Norwegian National Innovation System.A Pilot Study of Knowledge Creation, Distribution and Use.
The Norwegian National Innovation System:A Preliminary Overview and Assessment
Keith Smith, Espen Dietrichs and Svein Olav Nås
STEP Group, OsloStorgaten 1N-0155 Oslo
Tel: +47 22 42 87 80Fax: + 47 22 42 95 33
2
Keith Smith, Espen Dietrichs and Svein Olav Nås: The Norwegian National Innovation System.A Pilot Study of Knowledge Creation, Distribution and Use.
1. Introduction
This paper is a preliminary attempt to map some main components of the Norwegiansystem for the creation and use of technological knowledge, and to discuss somecentral policy challenges for the Norwegian system. The paper has two maincomponents. Firstly, there is a discussion of the rationale for thinking aboutinnovation in Norway in terms of an overall system. Secondly, we offer an empirical(mainly statistical) description of the main elements of the system; this description isby no means complete, and this version of the paper is concerned with methodologicalissues as well as with matters of substance. We seek to answer the followingquestions:
• what are the structural characteristics of the Norwegian system as a whole?• what are the patterns of interaction and knowledge flow in the system?• what are the policy implications of these interaction patterns?• how can we describe ‘knowledge bases’ and map them empirically?
In approach this project is closely linked to the body of literature related to NationalInnovation Systems and specifically to the work of Paul David and Dominique Foray(1995) and Keith Smith (1995). However although there will be several interlinkageswith this literature, we seek to expand the empirical base beyond that which has beenused either in the various studies of national innovation systems, or those of Davidand Foray. A main objective of the project is the evaluation of the system as a whole,using a multiple-indicator methodology. Works of special relevance to this are listedboth in the references and in a separate bibliographic paper.1
The objective of the project, then, is to provide an overall description and analysis ofthe Norwegian knowledge system, covering its main components and the interactionsamong them. The project is based on a wide range of datasets, with the data beinganalysed from a ‘systems’ perspective, focusing on the interactions among thedifferent actors and sectors rather than treating them as isolated from each other.
2. Systems theories of innovation
A key development in modern analyses of innovation and technical change has beenthe emergence of ‘systems’ theories of innovation. These theories rest on the idea thatfirms rarely innovate in isolation, purely on the basis of their own internal resources.Rather, the extent to which they innovate, as well as the particular forms anddirections of innovation, are determined by the ways firms interact with - and areshaped by - their environment. The relevant environment can be conceptualised indifferent ways and at different levels: it may include technological actors andorganisations, and consist of the interactions between the firm and these actors. Or itmay be seen in terms of the framework within which firms act: institutional structures,social values, political cultures, and so on. In other words, systems can be
________________________1 Available on request from the STEP Group

3
Keith Smith, Espen Dietrichs and Svein Olav Nås: The Norwegian National Innovation System.A Pilot Study of Knowledge Creation, Distribution and Use.
conceptualised in terms of real economic and technological transactions and flows,but also in terms of the factors which regulate the behaviour of firms and set the ‘rulesof the game’.
One influential way of looking at these interactions has been in terms of so-called‘national systems of innovation’. This concept was developed in the 1980s byChristopher Freeman and Bengt-Åke Lundvall, to analyse the ways in whichdifferences in economic performance among countries were shaped by differences innational institutions, framework conditions, values, resources and so on.2 In the early1990s, this resulted in two important books, edited by Lundvall and Richard Nelson.The first dealt with the theory of national innovation systems, and the second withinternational comparisons based on eleven country case studies.3 Freeman defined thenational system of innovation as ‘the network of institutions in the public and privatesectors whose activities and interactions initiate, import, modify and diffuse newtechnologies’.4 Lundvall offered a broader definition: the national system ofinnovation is ‘all parts and aspects of the economic structure and the institutional set-up affecting learning as well as searching and exploring - the production system, themarketing system and the system of finance present themselves as sub-systems inwhich learning takes place’.5
However it is clear that interactions between firms and their environments can lead tovarious types of ‘systems’ approach, and in fact there is a wide variety of ‘systems’approaches to innovation. We have argued elsewhere that they can be broadlygrouped into four types:6
Technological system approaches: these are analyses of technology whichconceptualise technologies not as artefacts but as integrated systems of components,and supporting managerial or social arrangements.
Industrial cluster approaches: these are analyses which explore the performance ofindustrial sectors in terms of the integration of different types of firms and industries,sometimes around key technologies, and which emphasise environmental conditions
________________________2Freeman developed the concept in an attempt to discuss specific features of Japanese innovationperformance: C. Freeman, Technology and Economic Performance: Lessons From Japan(London: Pinter, 1987). Lundvall’s approach was built on the implications of a long study ofinteractive learning among firms: B.Å. Lundvall, ‘From user-producer interaction to the nationalsystem of innovation’ in G. Dosi et al (eds) ... . However, in different ways, the concept of nationaleconomic systems has a long background: see C. Freeman, “The ‘national system of innovation’ inhistorical perspective’, Cambridge Journal of Economics, Vol 19 No 1 1995, pp.5-24.3Bengt-Åke Lundvall (ed) National Innovation Systems - Towards a Theory ofInnovation and Interactive Learning (London: Pinter), 1992; Richard Nelson (ed)National Systems of Innovation. A comparative study (1992).
4op. cit, p.15op.cit., p.126 K. Smith, ‘Interactions in Knowledge Systems: Foundations, Empirical Mapping, and PolicyImplications’, STI Review, 16 (Paris: OECD)
4
Keith Smith, Espen Dietrichs and Svein Olav Nås: The Norwegian National Innovation System.A Pilot Study of Knowledge Creation, Distribution and Use.
and inter-industry interactions in creating dynamic clusters or blocks of industrycharacterised by high growth of output, productivity and - sometimes - trade shares.
National systems of innovation: these are essentially analyses of innovativeenvironments which focus on processes of learning and knowledge accumulation,particularly emphasising institutional aspects, and various form of interaction amonginnovators.
Knowledge system approaches. These approaches explore the problem ofconceptualising the main knowledge-producing agencies in a system, and ofunderstanding flows of both codified and tacit knowledge among them.
These ‘system’ ideas have begun to have an impact on thinking about innovationpolicy, partly through the OECD’s TEP programme, and partly through worksponsored by the European Commission.7 However it is clearly important to developadequate empirical descriptions of systems if the systems approach is to have any realpolicy relevance. This conceptual complexity makes empirical description of systems acomplicated and multi-level problem, but nevertheless such empirical analysis is a veryimportant task. The reason is that the systems approach involves a strong hypothesisabout economic performance. Systems are in part rooted geographically: they rest onreal institutions and resources which have tangible national or regional locations, andthe argument is that the overall innovation performance of firms is to some extentexplained by the structure and operations of the systems of which they arecomponents. It follows that national economic performance is similarly determined:understanding variations in performance among countries is in part a matter ofunderstanding the specificities of the social, economic and institutional makeup of thesystem as a whole. The hypothesis, then, is that national economic performance restson the nature of the national innovation system: primarily on the institutionalstructure, and the ways in which this structure facilitates interactive learning, flows ofknowledge and investment in technology creation.
Testing this hypothesis requires both conceptual and empirical work, of quitechallenging kinds. On the one hand, there are some real theoretical challengesconcerning how to conceptualise systems, how to understand their components andboundaries. Some important work has been done on this, but unsolved problemsremain. On the other hand there are major empirical challenges. We must not only finddata and indicators which permit meaningful descriptions of systems (which is achallenging task since most economic statistics describe magnitudes of systemcomponents, but not the direction or extent of interactions), but ultimately we mustdo so in ways which permit meaningful comparisons across systems in terms ofstructures, operations and performance differences.
________________________7 See in particular OECD, Technology and the Economy: the Key Relationships (OECD: Paris,1992), and European Commission, An Integrated Approach to European Innovation andTechnology Diffusion Policy (Maastricht Memorandum), Luxembourg 1993

5
Keith Smith, Espen Dietrichs and Svein Olav Nås: The Norwegian National Innovation System.A Pilot Study of Knowledge Creation, Distribution and Use.
2.1 Systems approaches and interactive learning
The basic foundation of systems theories is that innovation should be seen in terms ofknowledge creation as an interactive process. The point here is that innovationshould not be seen in terms of individual acts of discovery, or in terms of specifictechnical breakthroughs. Innovation is, by definition, novelty in some form, whichimplies that it rests on a process of learning. How should such learning beunderstood? Much recent analysis sees such learning as interactive, along twodimensions. Within a firm, for example, successful innovation results from multi-directional feedbacks between the various forms of competence and skill on which abusiness relies: between marketing, finance, and product-process development, forinstance. Innovation is thus a process of interactive knowledge-creation, in which -for example - skills in marketing are used to channel relevant information about userneeds into the development processes which shape the technical and performanceattributes of products. In this context, innovation is far from being simply the‘transfer’ of knowledge which has been developed elsewhere. A second interactivedimension follows from the boundedness of firms’ knowledge bases, referred toabove. Successful innovative firms are usually those which are open to theirenvironments. That is, they engage in interactive learning involving other institutions:partners, rivals, and a wide range of other knowledge-creating and knowledge-holdinginstitutions.
Modern innovation research involves both a nuanced and complex concept of thenature of technological knowledge and learning, and an approach to innovationperformance which looks at overall systems rather than individual actors. What is thelink between these ideas? What is it about the view of technological knowledgepresented above which leads to the necessity to think in terms of systems? There areat least three dimensions to the foundations and structuring of systems: atechnological dimension, a competence dimension, and a social dimension.
Firstly, it is important not to neglect the technological level itself. Advanced-economytechnologies do not exist as individual artefacts: they usually take the form ofintegrated technological systems, in which component elements are incorporated intooverall systems. For such key technologies as cars, computers, and aircraft, but alsofor a host of less spectacular products, there is in a sense no unified knowledge baseat all: product producers are in effect system managers, whose competence reliesprimarily on the ability to specify and integrate diverse inputs.
So no item of technical hardware ever stands alone: it is almost always part of acomplex technical and production system which integrates many technical functionsand activities. Getting a technology such as the automobile into large-scale productioninvolved solving an enormous number of related technical problems in chemicalengineering (especially related to refining of petroleum), in electrical technology, inmetallurgy, and so on. These problems had to be solved in the context of building aintegrated production system which could actually be managed; this in turn requiredthe solution of problems in factory architecture, materials handling, labour recruitmentand management, and so on. (In the context of this kind of complex integration it
6
Keith Smith, Espen Dietrichs and Svein Olav Nås: The Norwegian National Innovation System.A Pilot Study of Knowledge Creation, Distribution and Use.
should be noted that information and communications systems are a core element ofthe technical system). Similar points apply to the diffusion of the electric generatingsystem and the "dynamo revolution" which reshaped power supply and managementin the modern factory and for society as a whole. In this case, integrating thetechnology into an existing production system required changing the structures andmethods of plants across a wide range of industries, with a wide range of sector-specific problems.8
Secondly, technologies always exist within an economic and social system.Technologies are put to work within particular organisational structures of particularfirms, and within a general social context which defines the financial environment, thelegal context, technical standards, the supply of scientific and technological skills,social and cultural norms concerning work, and so on. Very often the use of atechnology involves changes and adaptation in this system. The early factory systemwas slow to develop in part because there was little or no social acceptance of theidea of a regular working day. The emergence of electrical power technology in theUS involved new forms of business enterprise (the holding company), legal changesallowing monopoly supply of electricity, the emergence of electrical engineering as aprofession with its own training methods, plus a wide range of standards forelectricity supply and the operation of electrical products: all of these were based onsocial changes or decisions. Automobiles involved new forms of work organisation,new forms of legal regulation and above all the creation of a vast public infrastructureof roads and bridges, and an industrial energy infrastructure. Again, these involvedeither a direct social change or some form of social decision. The complexity anddifficulty of such large-scale organisational change in the social and infrastructuralsystem is obviously a vital element determining the speed of diffusion of a newtechnology.
Innovating a particular piece of hardware is therefore a much simpler matter thanchanging the social and technological system in which it is embedded. But technicalchange and changes in production systems and the social system go together, and aretime-consuming. With a generic technology such as IT, the problem is not to developthe technology but to apply it across industries or across various branches of publicadministration or the education system; but each industry, each department, eachschool area or each hospital has its own specific systems which must be changed. Thecomplexity of this pattern of systemic change, then, is one of the main reasonsunderlying the slow diffusion of radical new generic technologies. It is also one of thereasons why major "clusters" of innovation - such as those we are now experiencing -do not necessarily lead to immediate or rapid increases in productivity: theproductivity improvements depend on the much slower process of system change.(Which is probably why productivity growth has slowed down sharply in many
________________________8 Professor Thomas Hughes has emphasized the systemic elements of innovation inthe electrical power system; he suggests that successful innovators are usually systemmanagers, and therefore that technologies are always "systems, presided over bysystem builders". T.P. Hughes, Networks of Power. Electrification in WesternSociety 1880-1930 (Baltimore and London 1983).
7
Keith Smith, Espen Dietrichs and Svein Olav Nås: The Norwegian National Innovation System.A Pilot Study of Knowledge Creation, Distribution and Use.
advanced economies over the past 15 years despite the fact that the pace oftechnological advance appears to be increasing).
This overall set of institutions in turn operates inside a framework of regulation: at anational level this involves technical standards, risk-management rules, health andsafety regulations, and so on. The regulatory system includes not just formal rules, butalso the general legal system relating to contracts, employment, intellectual propertyrights (patent and copyright law) within which firms operate. Finally there is the widercontext of political culture and social values, which shapes public policy objectivesand particularly the macroeconomic policy environment. Taken together, thisintegrated set of public and private institutions, regulatory systems and the policysystem makes up a "national system of innovation": an overall context of economicand technical behaviour which shapes the technological opportunities and capabilitiesof firms. It thereby shapes firms' economic performance and the macroeconomicevolution of the economy as a whole. Attempts to conceptualise such systems, and tounderstand their capabilities and dynamics, are at the core of much modern theory ofinnovation. influential example of this approach can be found in the works of MichaelPorter, Bengt-Åke Lundvall and his collaborators, and Richard Nelson andcolleagues.9
2.2 The importance of national specificities
Regardless of what type or level of system approach is adopted, it is clear that thenational level is highly relevant in conceptualising systems. The reason for this is thenational specificity of some of the key institutional factors, regulatory systems andpolitical and legal frameworks. Despite more and more comprehensive processes ofeconomic integration these aspects of the system often remain distinctively national.For example, institutional frameworks shaping the nature and extent of co-operationboth within and between firms vary widely. Systems of corporate governancecontinue to have sharp differences between countries. Formal and informal systems ofeducation, and patterns of labour mobility (and hence of flows of disembodiedknowledge) differ very much across countries, with effects on innovation behaviour.Of course many aspects of behaviour are sector-specific or technology-specific: itwould be absurd to deny the role of the technological regimes or paradigms which arespecific to certain types of activity, and which shape innovation paths. At the sametime, however, these sector or technology effects operate within the institutionalconstraints referred to above, and this makes the understanding of the specificities atthe national level an important task.
2.3 Measurement of interactions
The basic problem in mapping knowledge systems is to identify the structure ofeconomic and technological interactions. This section deals with the identification oftypes of interactions. In each case, techniques and sources are identified, with a brief
________________________9 Michael Porter, The Competitive Advantage of Nations (London: Macmillan), 1991; Bengt-ÅkeLundvall (ed) National Innovation Systems (London: Pinter), 1992; Richard Nelson (ed) NationalSystems of Innovation. A comparative study (1992).

8
Keith Smith, Espen Dietrichs and Svein Olav Nås: The Norwegian National Innovation System.A Pilot Study of Knowledge Creation, Distribution and Use.
discussion of how they contribute to an understanding of interactions, and of theirgeneral strengths and weaknesses. The intention here is to look at a range ofquantitative measures for exploring three basic types of interactions:
• inter-industry transactions embodying flows of technological knowledge• methods for describing patterns of use of formal scientific knowledges• patterns of technological collaboration between firms, universities and research
institutions• measures of personnel mobility and related interactions
These types of interactions have both domestic and transnational components, and ineach case the potential for transnational mapping is described.
3. Policy issues
This is not the place for an extended discussion of the policy issues which arise from asystems approach.10 However the systems approach raises a number of quite basicissues for policymakers. We need to bear in mind here that most innovation policy hasin the past consisted of R&D policies predicated on the idea that the basic constrainton innovation is financial resources for R&D and access to R&D results. Systemsapproaches extend this substantially, with a range of other issues. These include
• to what extent should policymakers concentrate their efforts on issues to do withlegal or regulatory structures affecting firm behaviour?
• to what extent do interactive processes reshape traditional arguments for policyintervention (for example, by changing our notions of externalities and marketfailures)?
• to what extent should policy focus on facilitating interactions and knowledgeflows, by concentrating on nodal points in such flows?
• to what extent should policymakers focus on specificities of national knowledgebases related to sector or technology specific assets within national boundaries?
These questions by no means exhaust the relevant problems; but they do at leastindicator one thing, which is that answers cannot be produced at a general level: theyrequire empirical identification and quantification.
4. Mapping of knowledge-system components
4.1 Institutional, structural and resource factors in the Norwegiansystem
________________________10 For discussion, see European Commission, An Integrated Approach to European Innovationand Technology Diffusion Policy (Maastricht Memorandum), Luxembourg 1993; David andForay, 1995 op. cit, Smith 1995, op.cit.

9
Keith Smith, Espen Dietrichs and Svein Olav Nås: The Norwegian National Innovation System.A Pilot Study of Knowledge Creation, Distribution and Use.
This section is a (very brief) introduction to some of the nationally specificinstitutional and resource factors which shape the operation of the Norwegian system,and hence are background to the quantitative material which follows. We discusshere issues related to the natural resource base of the Norwegian economy, theindustrial structure (including role of small firms), and institutional issues, relating inparticular to the role of the public sector.
Firstly, it is important to recognise the extent to which the Norwegian economy isbased on the exploitation of natural resources. The most important of these is ofcourse oil and gas, an industry which came on stream strongly at the end of the 1970s,and which rapidly became a major force driving structural change in Norway. This hasbeen particularly important in three broad ways for the Norwegian systems. It had amajor impact on the dynamics of the Norwegian industrial structure: a number ofmajor industries declined as oil grew in importance, leading to an overall decline in theshare of GDP from manufacturing, with important regional effect. Oil also affectedthe public sector budget, as oil tax revenues increased sharply; this made it possiblefor the Norwegian public sector to expand R&D and higher education, to sustain highlevels of regional policy activity, and to engage in major technology developmentprogrammes. Finally, oil affected what we might call the ‘learning structure’ of theeconomy: R&D in oil-related activities grew sharply, and expertise in oil-related fieldsof science and technology (such as seismography, fluid flow dynamics, fixed andflating offshore strucures, and so on).
However it is important to note that other natural resources are of great importance:these include fish stocks, timber, non-ferrous metals and water resources (particularlyfor hydropower). The primary implication of this resource structure for the operationof the system as a whole is that the industries which are based on them are low R&D-intensive, yet at the same time intensive in their use of technologies from outside theindustry concerned. Particularly for process change, these industries draw heavilyboth in suppliers of capital and intermediate goods, and on knowledge bases locatedin formal research institutions.

10
Keith Smith, Espen Dietrichs and Svein Olav Nås: The Norwegian National Innovation System.A Pilot Study of Knowledge Creation, Distribution and Use.
Figure 4.1 Value added in Norwegian manufacturing 1991 by R&D intensity (high,medium and low tech).
Textiles, leather 2 %
Chemicals 8 %
Food, beverages, tobacco
20 %
Other manufacturing
1 %
Machinery
12 %
Transport equipment
8 %
Rubber and plastics
2 %
Metal products
6 %
Mineral products
3 %
Computers etc 0 %
Technical and scietific
instruments 1 %
Signal, radio, tele 3 %
Petroleum refining
2 %
Pulp and paper
15 %
Wood products
6 %
Electrical equipment
3 %Basic metals
7 %
High-tech
23 %
Medium tech
30 %
Low tech
47 %
Source: R&D statistics 1991.STEP-group 1994
Value added in
Norwegian manufacturing 1991
Secondly, the Norwegian manufacturing and service sectors are heavily based onSMEs. Norway has relatively few large firms, and these are for the most partoperating within ‘traditional’ low-tech activities (even though in an absolute sensetheir research efforts may be large). The SME sector is characterised by highlyasymmetrical distributions of research and innovation activity, and apparentlyproblematic relations to the formal science and technology infrastructure.
Thirdly, the Norwegian system is characterised - in institutional terms - by a broadpolitical consensus that the public sector has an important role in industrial issues, andhence by large-scale programs of public investment and general support. In the area ofknowledge creation this primarily involves the support of a large sector oftechnological institutes which carry out both strategic R&D and applied contractR&D for firms. Policy in this area in the 1980s focused on five so-called ‘PriorityInvestment Areas’: offshore, IT, biotechnology, materials and health. These areasreceived large-scale investment in infrastructure, programme R&D and publicprocurement. In recent years policy has concentrated heavily on improving the ‘user-directed’ character of such research. In the sections which follow, we concentrateheavily on this overall R&D support, and some of its effects on disembodiedknowledge flows and general innovation performance. However it is very importantto note that this support extend to a wide range of other activities: provision of riskcapital, resources for restructuring, technology transfer activities from universities,and so on. In later versions of this paper, these activities will be covered in moredetail.
11
Keith Smith, Espen Dietrichs and Svein Olav Nås: The Norwegian National Innovation System.A Pilot Study of Knowledge Creation, Distribution and Use.
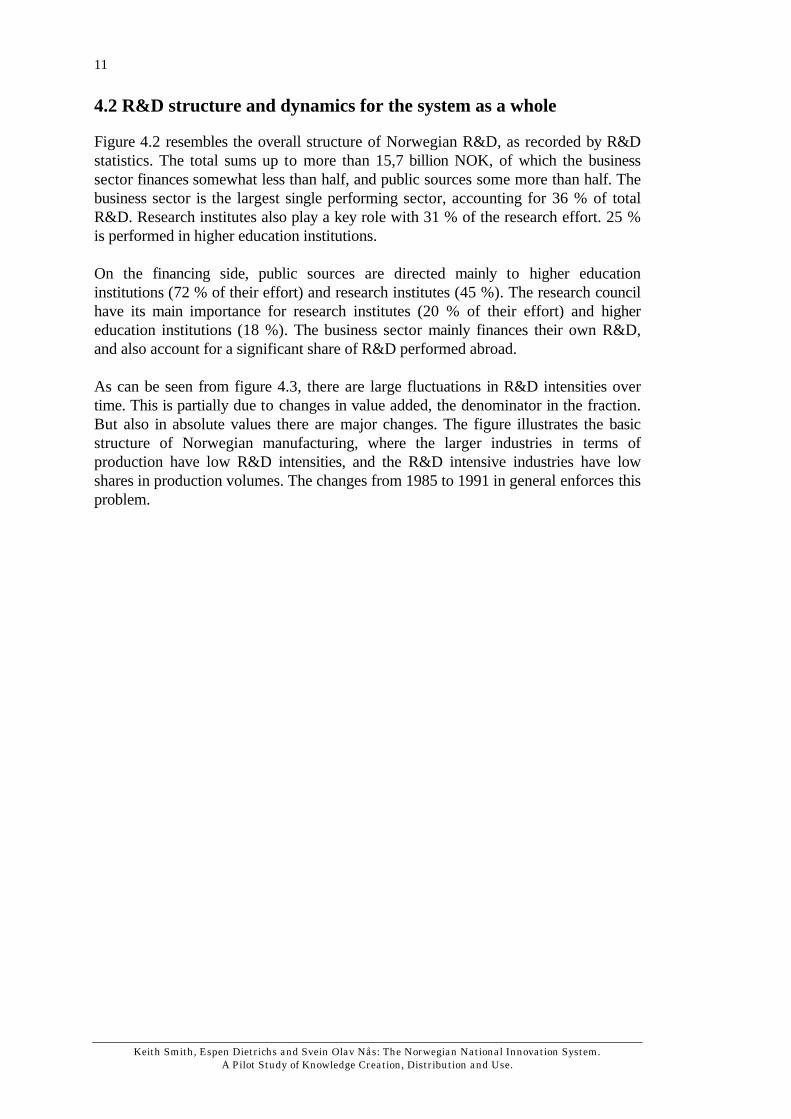
4.2 R&D structure and dynamics for the system as a whole
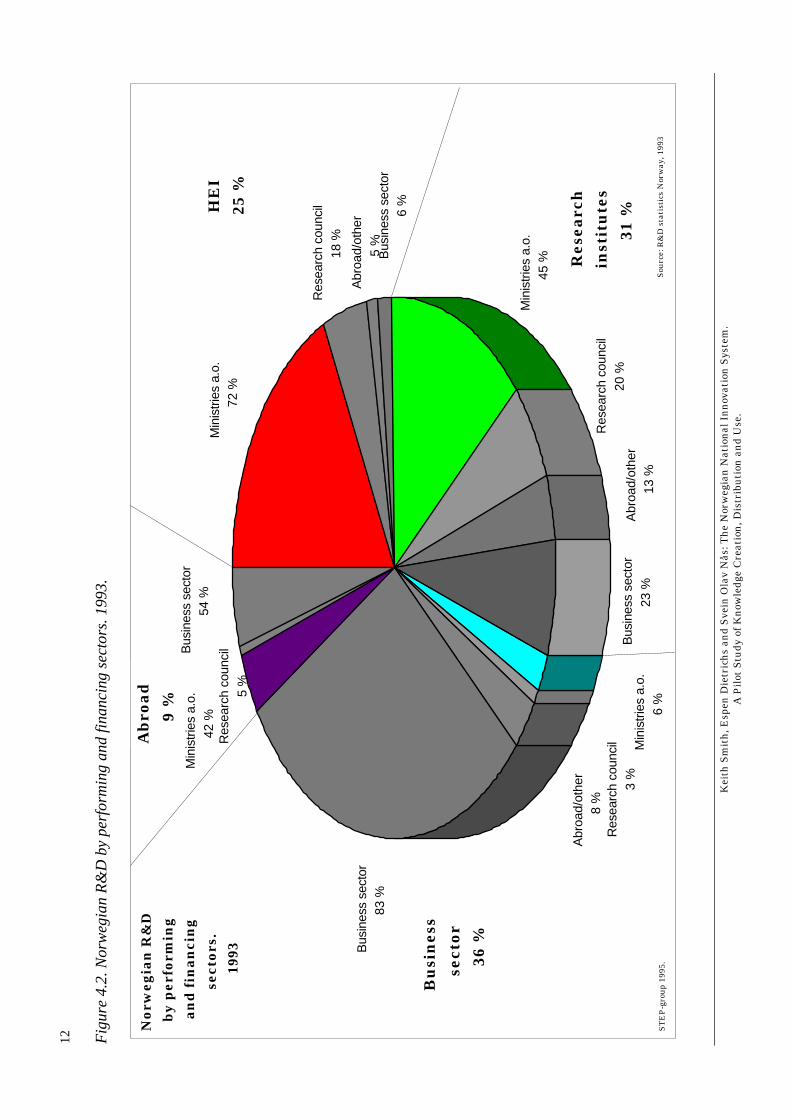
Figure 4.2 resembles the overall structure of Norwegian R&D, as recorded by R&Dstatistics. The total sums up to more than 15,7 billion NOK, of which the businesssector finances somewhat less than half, and public sources some more than half. Thebusiness sector is the largest single performing sector, accounting for 36 % of totalR&D. Research institutes also play a key role with 31 % of the research effort. 25 %is performed in higher education institutions.
On the financing side, public sources are directed mainly to higher educationinstitutions (72 % of their effort) and research institutes (45 %). The research councilhave its main importance for research institutes (20 % of their effort) and highereducation institutions (18 %). The business sector mainly finances their own R&D,and also account for a significant share of R&D performed abroad.
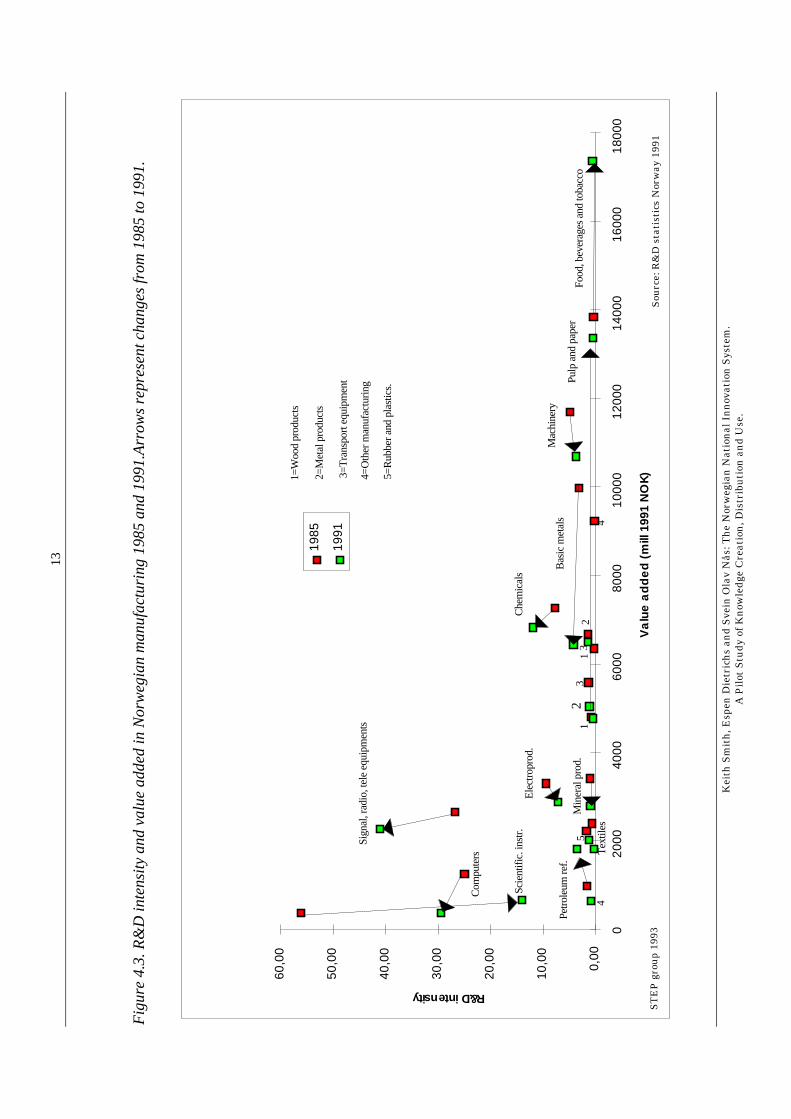
As can be seen from figure 4.3, there are large fluctuations in R&D intensities overtime. This is partially due to changes in value added, the denominator in the fraction.But also in absolute values there are major changes. The figure illustrates the basicstructure of Norwegian manufacturing, where the larger industries in terms ofproduction have low R&D intensities, and the R&D intensive industries have lowshares in production volumes. The changes from 1985 to 1991 in general enforces thisproblem.
12
Kei
th S
mit
h, E
spen
Die
tric
hs
and
Sve
in O
lav
Nås
: Th
e N
orw
egia
n N
atio
nal
In
nov
atio
n S
yste
m.
A P
ilot
Stu
dy o
f K
now
ledg
e C
reat
ion
, Dis
trib
uti
on a
nd
Use
.
Fig
ure
4.2
. N
orw
eg
ian
R&
D b
y p
erf
orm
ing
an
d fin
an
cin
g s
ect
ors
. 1
99
3.
Res
earc
h co
unci
l5
%
Min
istr
ies
a.o.
42 %
Bus
ines
s se
ctor
54 %
Min
istr
ies
a.o.
6 %
Res
earc
h co
unci
l18
%
Bus
ines
s se
ctor
6 %
Abr
oad/
othe
r5
%B
usin
ess
sect
or83
%
Min
istr
ies
a.o.
72 %
Min
istr
ies
a.o.
45 %
Res
earc
h co
unci
l20
%A
broa
d/ot
her
13 %
Bus
ines
s se
ctor
23 %
Res
earc
h co
unci
l3
%
Abr
oad/
othe
r8
%
HE
I25
%
Res
earc
h
inst
itu
tes
31 %
Bu
sin
ess
sect
or36
%
Nor
weg
ian
R&
Db
y p
erfo
rmin
gan
d f
inan
cin
gse
ctor
s.19
93
Sou
rce:
R&
D s
tati
stic
s N
orw
ay, 1
993
ST
EP
-gro
up 1
995.
Ab
road
9 %
13
Kei
th S
mit
h, E
spen
Die
tric
hs
and
Sve
in O
lav
Nås
: Th
e N
orw
egia
n N
atio
nal
In
nov
atio
n S
yste
m.
A P
ilot
Stu
dy o
f K
now
ledg
e C
reat
ion
, Dis
trib
uti
on a
nd
Use
.
Fig
ure
4.3
. R
&D
inte
nsi
ty a
nd
va
lue
ad
de
d in
No
rwe
gia
n m
an
ufa
ctu
rin
g 1
98
5 a
nd
19
91
.Arr
ow
s re
pre
sen
t ch
an
ge
s fr
om
19
85
to
19
91
.
0,00
10,0
0
20,0
0
30,0
0
40,0
0
50,0
0
60,0
0
020
0040
0060
0080
0010
000
1200
014
000
1600
018
000
Va
lue
ad
de
d (
mill
199
1 N
OK)
R&D intensity
1985
1991
Foo
d, b
ever
ages
and
toba
cco
Pul
p an
d pa
per
Mac
hine
ry
Che
mic
als B
asic
met
als
Sig
nal,
radi
o, te
le e
quip
men
ts
Com
pute
rs
Sci
entif
ic. i
nstr
.E
lect
ropr
od.
Pet
role
um r
ef.
Min
eral
pro
d.
Tex
tiles
4=O
ther
man
ufac
turin
g
11
22
33
1=W
ood
prod
ucts
2=M
etal
pro
duct
s
3=T
rans
port
equ
ipm
ent
44
5
5=R
ubbe
r an
d pl
astic
s.
ST
EP
gro
up
1993
Sou
rce:
R&
D s
tati
stic
s N
orw
ay 1
991

14
Keith Smith, Espen Dietrichs and Svein Olav Nås: The Norwegian National Innovation System.A Pilot Study of Knowledge Creation, Distribution and Use.
4.3 Innovation expenditures and R&D collaboration
The focus on R&D as the main driving force behind innovation is partly due to thedominance of the linear model in innovation studies, and partly to the fact that it is theonly available internationally comparable indicator in time series. Through the CISsurvey work of EUROSTAT, based on the Oslo manual, we are now starting to get(more or less) comparable data on other components of innovative activity. Still R&Dseems to be the single largest factor, but with great variation among industries (seefigure 4.4). Particularly R&D is of relatively marginal importance in the traditionallow-tech industries, which are also in many cases producing consumer products.These are large industries in Norway. As the major part of technology policies areconcerned with R&D, policy by this lose relevance for large parts of manufacturing.For most industries, investments related to innovation are larger than R&Dexpenditures.
Figure 4.4. Total innovation costs by industry and cost type. Norway, 1992. Figuresare scaled to national totals.
0
10
20
30
40
50
60
70
80
90
100
Tex
tile
s
Met
al g
oods
Foo
d, b
ever
ages
an
d
toba
cco
Mac
hin
ery
IT-i
ndu
stry
Box
es, c
onta
iner
s
etc.
Ele
ctri
cal m
ach
iner
y
and
appa
ratu
s
Pu
lp a
nd
pape
r
Met
allu
rgy
Ch
emis
try
Per
cen
t
Investments linked to innovation
Other innovation costs
Market analysis (excluding launch costs)
Aquisition of patents and licences
Trial production, training and tooling up
Product design
R&D
STEP-group 1995 Source: CIS Norway, 1992 (Statistics Norway)
15
Keith Smith, Espen Dietrichs and Svein Olav Nås: The Norwegian National Innovation System.A Pilot Study of Knowledge Creation, Distribution and Use.
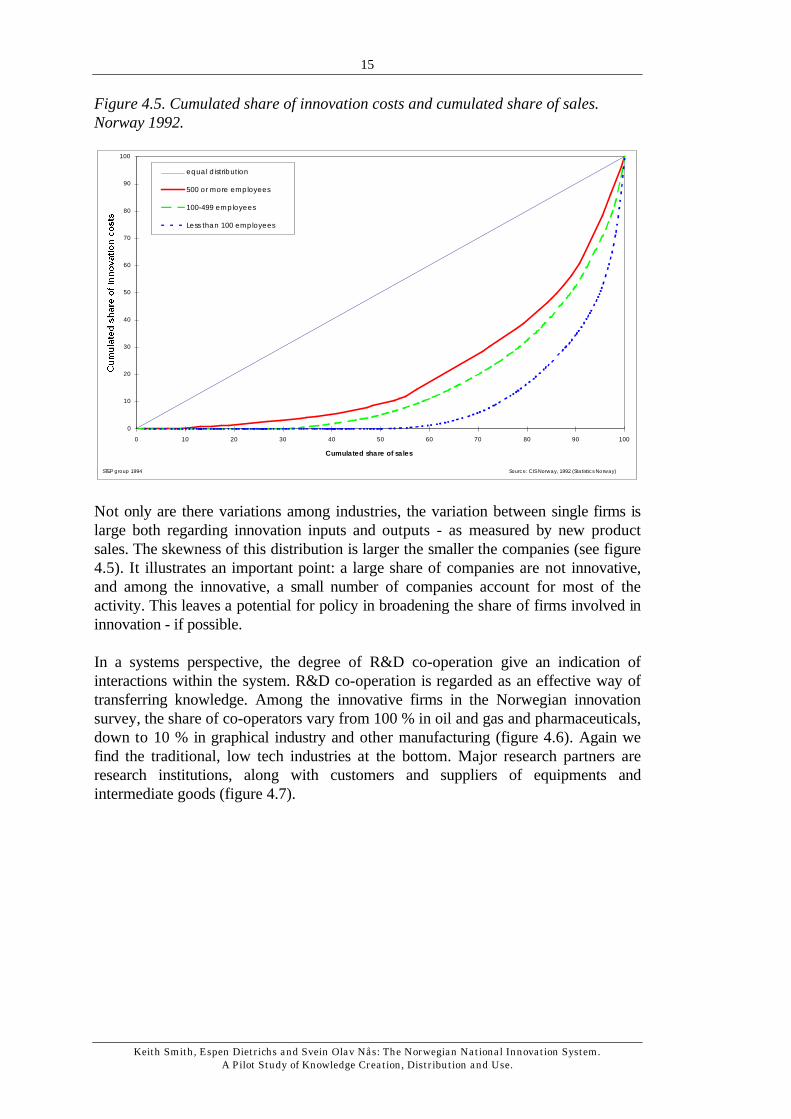
Figure 4.5. Cumulated share of innovation costs and cumulated share of sales.Norway 1992.
0
10
20
30
40
50
60
70
80
90
100
0 10 20 30 40 50 60 70 80 90 100
Cumulated share of sales
equal distribution
500 or more employees
100-499 employees
Less than 100 employees
STEP group 1994 Source: CIS Norway, 1992 (Statistics Norway)
Not only are there variations among industries, the variation between single firms islarge both regarding innovation inputs and outputs - as measured by new productsales. The skewness of this distribution is larger the smaller the companies (see figure4.5). It illustrates an important point: a large share of companies are not innovative,and among the innovative, a small number of companies account for most of theactivity. This leaves a potential for policy in broadening the share of firms involved ininnovation - if possible.
In a systems perspective, the degree of R&D co-operation give an indication ofinteractions within the system. R&D co-operation is regarded as an effective way oftransferring knowledge. Among the innovative firms in the Norwegian innovationsurvey, the share of co-operators vary from 100 % in oil and gas and pharmaceuticals,down to 10 % in graphical industry and other manufacturing (figure 4.6). Again wefind the traditional, low tech industries at the bottom. Major research partners areresearch institutions, along with customers and suppliers of equipments andintermediate goods (figure 4.7).

16
Keith Smith, Espen Dietrichs and Svein Olav Nås: The Norwegian National Innovation System.A Pilot Study of Knowledge Creation, Distribution and Use.
Figure 4.6. Share of firms with R&D co-operation among innovative firms, byindustry.
0 10 20 30 40 50 60 70 80 90 100
Other manufacturing
Graphical industry
Wood products
Metal products
Textiles, clothing
Food, beverage and tobacco
Machinery
Transport equipment
Mineral products
Chemicals
Electronics
Mining
Electrical machinery, etc.
Metals
Pulp and paper
Pharmaceuticals
Oil and gas
PercentSTEP group 1994 Source: CIS Norway, 1992 (Statistics Norway)
Figure 4.7. Share of firms with R&D co-operation among innovative firms accordingto partner.
0 10 20 30 40 50 60 70 80 90 100
Competitor
Joint venture
Consultant
Industrial research assosiation
Mother-, daughter-,sisterenterprise
University/higher education
Supplier
Client/customer
Research institute
Percent
STEP group, 1994 Source: CIS Norway, 1992 (Statistics Norway)
17
Keith Smith, Espen Dietrichs and Svein Olav Nås: The Norwegian National Innovation System.A Pilot Study of Knowledge Creation, Distribution and Use.
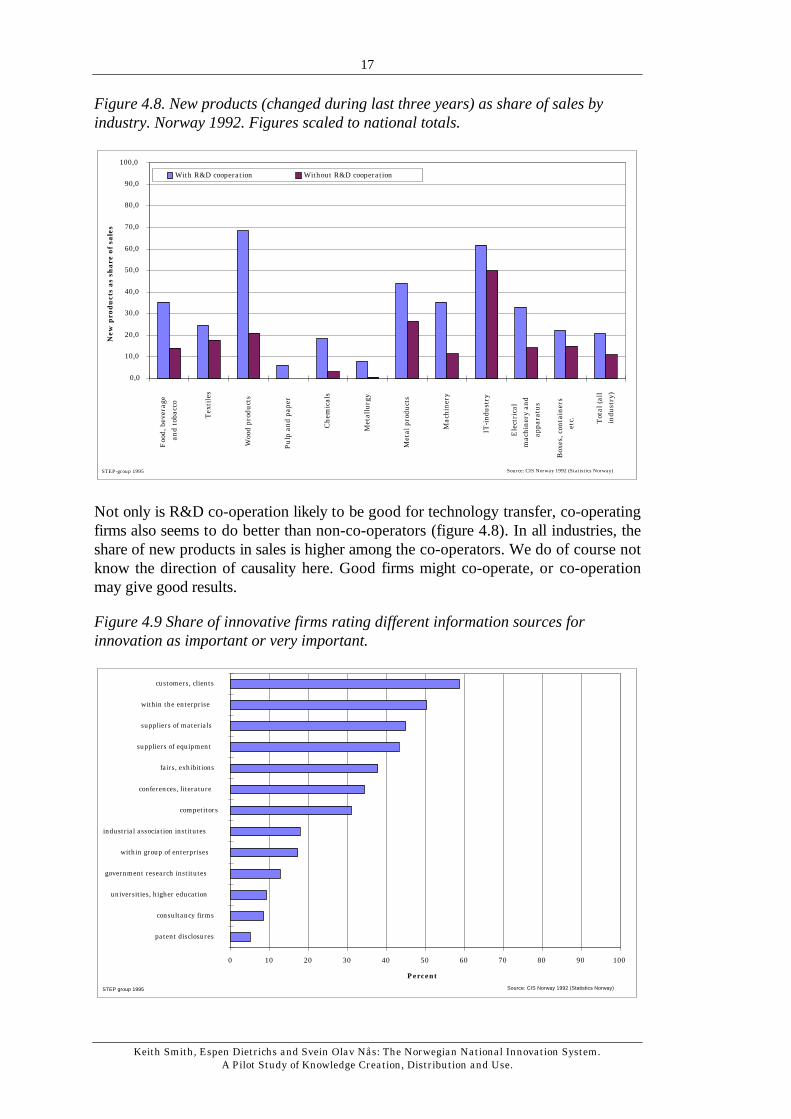
Figure 4.8. New products (changed during last three years) as share of sales byindustry. Norway 1992. Figures scaled to national totals.
0,0
10,0
20,0
30,0
40,0
50,0
60,0
70,0
80,0
90,0
100,0F
ood,
bev
erag
e
and
toba
cco
Tex
tile
s
Woo
d pr
odu
cts
Pul
p an
d pa
per
Ch
emic
als
Met
allu
rgy
Met
al p
rodu
cts
Mac
hin
ery
IT-i
ndus
try
Ele
ctri
cal
mac
hine
ry a
nd
appa
ratu
s
Box
es, c
onta
iner
s
etc. Tot
al (
all
indu
stry
)
New
pro
du
cts
as s
har
e of
sal
es
With R&D cooperation Without R&D cooperation
STEP-group 1995 Source: CIS Norway 1992 (Statistics Norway)
Not only is R&D co-operation likely to be good for technology transfer, co-operatingfirms also seems to do better than non-co-operators (figure 4.8). In all industries, theshare of new products in sales is higher among the co-operators. We do of course notknow the direction of causality here. Good firms might co-operate, or co-operationmay give good results.
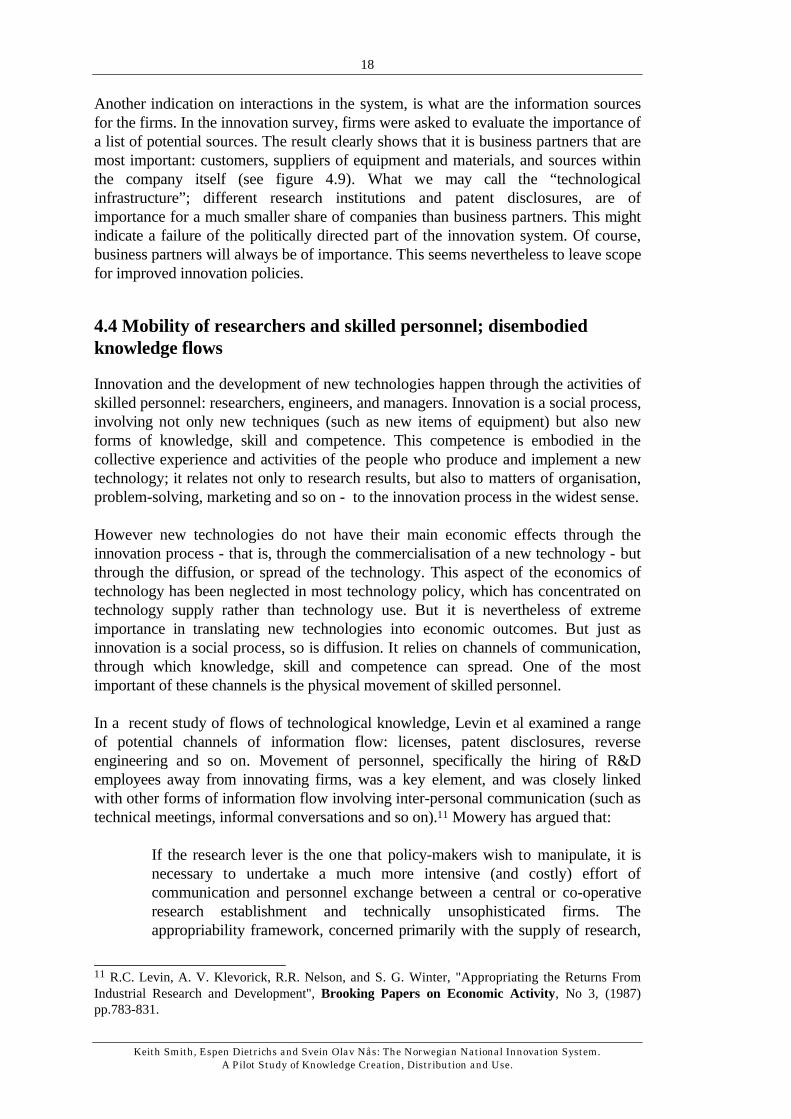
Figure 4.9 Share of innovative firms rating different information sources forinnovation as important or very important.
0 10 20 30 40 50 60 70 80 90 100
patent disclosures
consultancy firms
universities, higher education
government research institutes
within group of enterprises
industrial association institutes
competitors
conferences, literature
fairs, exhibitions
suppliers of equipment
suppliers of materials
within the enterprise
customers, clients
Percent
STEP group 1995 Source: CIS Norway 1992 (Statistics Norway)
18
Keith Smith, Espen Dietrichs and Svein Olav Nås: The Norwegian National Innovation System.A Pilot Study of Knowledge Creation, Distribution and Use.
Another indication on interactions in the system, is what are the information sourcesfor the firms. In the innovation survey, firms were asked to evaluate the importance ofa list of potential sources. The result clearly shows that it is business partners that aremost important: customers, suppliers of equipment and materials, and sources withinthe company itself (see figure 4.9). What we may call the “technologicalinfrastructure”; different research institutions and patent disclosures, are ofimportance for a much smaller share of companies than business partners. This mightindicate a failure of the politically directed part of the innovation system. Of course,business partners will always be of importance. This seems nevertheless to leave scopefor improved innovation policies.
4.4 Mobility of researchers and skilled personnel; disembodiedknowledge flows
Innovation and the development of new technologies happen through the activities ofskilled personnel: researchers, engineers, and managers. Innovation is a social process,involving not only new techniques (such as new items of equipment) but also newforms of knowledge, skill and competence. This competence is embodied in thecollective experience and activities of the people who produce and implement a newtechnology; it relates not only to research results, but also to matters of organisation,problem-solving, marketing and so on - to the innovation process in the widest sense.
However new technologies do not have their main economic effects through theinnovation process - that is, through the commercialisation of a new technology - butthrough the diffusion, or spread of the technology. This aspect of the economics oftechnology has been neglected in most technology policy, which has concentrated ontechnology supply rather than technology use. But it is nevertheless of extremeimportance in translating new technologies into economic outcomes. But just asinnovation is a social process, so is diffusion. It relies on channels of communication,through which knowledge, skill and competence can spread. One of the mostimportant of these channels is the physical movement of skilled personnel.
In a recent study of flows of technological knowledge, Levin et al examined a rangeof potential channels of information flow: licenses, patent disclosures, reverseengineering and so on. Movement of personnel, specifically the hiring of R&Demployees away from innovating firms, was a key element, and was closely linkedwith other forms of information flow involving inter-personal communication (such astechnical meetings, informal conversations and so on).11 Mowery has argued that:
If the research lever is the one that policy-makers wish to manipulate, it isnecessary to undertake a much more intensive (and costly) effort ofcommunication and personnel exchange between a central or co-operativeresearch establishment and technically unsophisticated firms. Theappropriability framework, concerned primarily with the supply of research,
________________________11 R.C. Levin, A. V. Klevorick, R.R. Nelson, and S. G. Winter, "Appropriating the Returns FromIndustrial Research and Development", Brooking Papers on Economic Activity, No 3, (1987)pp.783-831.
19
Keith Smith, Espen Dietrichs and Svein Olav Nås: The Norwegian National Innovation System.A Pilot Study of Knowledge Creation, Distribution and Use.
is not sufficiently attentive to the utilisation problem, and the way in whichthis problem affects the distribution of the benefits of technology programs,to provide guidelines for research and technology policies.12
In Norway the basic relevant process of mobility is one which connects the sector ofresearch institutes with the industrial sector. Two recent studies of this have beenundertaken, looking at annual patterns of mobility, measured as job turnover, andlooking at the institutions from which mobile researchers were recruited, and at theirdestinations. The basic conclusions of the most recent study were:
• In 1992 the rate of outward mobility from the research institutes was at 6%. Thismarks a decline from an 8% rate of mobility in 1991.
• The business sector was the largest recipient of researchers from the institutesector. 31% of the researchers who left the institutes went to the business sector.In 1991 this figure was 42%.
• The business and University and College sectors receive experienced researchersfrom the technological institutes. But over one half of those researchers enteringthe business sector from the technological institutes do not continue with researchin their new positions.
• The second largest recipient of researchers from the institute sector is theUniversity and College sector. This sector receives almost as many as the businesssector. In 1992 28% of researchers from the institute sector went to theUniversity and College sector.
• 63% of the researchers that left the institutes had been employed there for lessthan 6 years. Those that left in 1992 had on average been employed for greaterlengths of time than those that left in 1991.
• In 1992 the institutes had a recruitment rate of 11%. The recruitment pattern wasthe same as in 1991. The institute sector had a net growth of approximately 200researchers in 1992.60% of the recruited researchers came from the University andCollege sector, and the majority of these were newly qualified candidates.
The basic structure of this flow is described in the following diagram:
Figure 4.10. Mobility of researchers to and from Norwegian research institutes,1992. Number of job shifts recorded.
________________________12 Mowery, op. cit., p.36
20
Keith Smith, Espen Dietrichs and Svein Olav Nås: The Norwegian National Innovation System.A Pilot Study of Knowledge Creation, Distribution and Use.
Absorption of Higher Educated Candidates
Knowledge is becoming an increasingly important aspect of innovation and theprocess of economic growth. And, the handling, adaptation and transformation ofnew, complex technologies requires substantial human skills. These skills aredeveloped within several contexts. One such context is the formal educational system.
In the knowledge intensive era, in which we are entering, there are fewer and fewerroutine or unskilled jobs. New and remaining places of work tend to require highskills. A large proportion of the competence represented by blue collar workers, areeither substituted by physical capital or must be upgraded13. The business sectorcannot alone contribute with these kinds of investments in human capital. Thisdevelopment has triggered an expansion of secondary and tertiary education, both interms of supply and demand.
From the 1970s all OECD countries have experienced a substantial rise in theeducational attainment within their population. This is especially so for Norway whichhas experienced an enormous increase in the number of students within highereducation. In the early 80s , only 20% of each age class went into higher education.Today this number is doubled (to 40%)14. The number of students at the universitieshas augmented by 70% during the same period. The number of candidates having agraduate degree has been doubled. The output of doctors from the Norwegianeducational system has augmented by a factor 2,5. The percentage of the populationhaving at least one university degree has increased by 5,80% annually from 1972 till1987. The percentage of the population having at least finished upper secondaryeducation is also increasing. For the youngest part of the population 90% havefinished secondary education. In sum, the educational attainment in Norway areamong the highest in the OECD area15.
The results of the increasing educational attainment in terms of employment, is shownbelow. The figures are based on the employee-employer relations in Norway. Fromadministrative registers, Statistics Norway have constructed files containinginformation on all employees in Norway, containing educational background andinformation on the employing companies. This is referred to as “non-correctednumbers based on administrative registers in Statistics Norway”. The reason for thesomewhat vague heading, is that there exist mismatches in the files in an order ofmagnitude of approximately 15 %. The information is therefore not “exact”, but doesnevertheless give a rough picture of the educational background of personnel indifferent industries.
________________________13 OECD, 1992, Technology and the Economy, The Key Relalionsships, Paris14 Universitetet i Bergen, 1995, Norge som høgutdanningsland. Comparing with other countries, thecorresponding numbers is Great Brittain 30%, France 40% and Japan 50%.15 OECD, Education at a glance, Paris 1995

21
Keith Smith, Espen Dietrichs and Svein Olav Nås: The Norwegian National Innovation System.A Pilot Study of Knowledge Creation, Distribution and Use.
Figure 4.11.Knowledge intensity by sector and type of education 1986.1
0
5
10
15
20
25
1 2 3 4 5 6 7 8 9
ISIC
Kno
wle
dge
inte
nsity
, 198
6
Others
Economics and social sciences
Natural sciences and teqnique
STEP-group, 1995 Source: Non-corrected numbers based on administrative registers, SSB Norway
1 Knowledge intensity is calculated as the number of employees with educational attainmentcorresponding to more than two years of university training within a specific field i. B is the numberof employees with educational attainment corresponding to less than 3 years of university training.Source: Based on numbers from ‘administative registers, uncorreted numbers. Statistics Norway’ Thefollowing sectors are used: 1: Agriculture, hunting forestry and fishing, 2: Oil extraction, mining andquarrying, 3: Manufacturing, 4: Electricity, gas and water supply, 5: Construction, 6: Wholesale andretail trade, restaurants and hotels, 7: Transport, storage and communication, 8: Financing,insurance, real estate and business services, 9: Community, social and personal services.
22
Keith Smith, Espen Dietrichs and Svein Olav Nås: The Norwegian National Innovation System.A Pilot Study of Knowledge Creation, Distribution and Use.
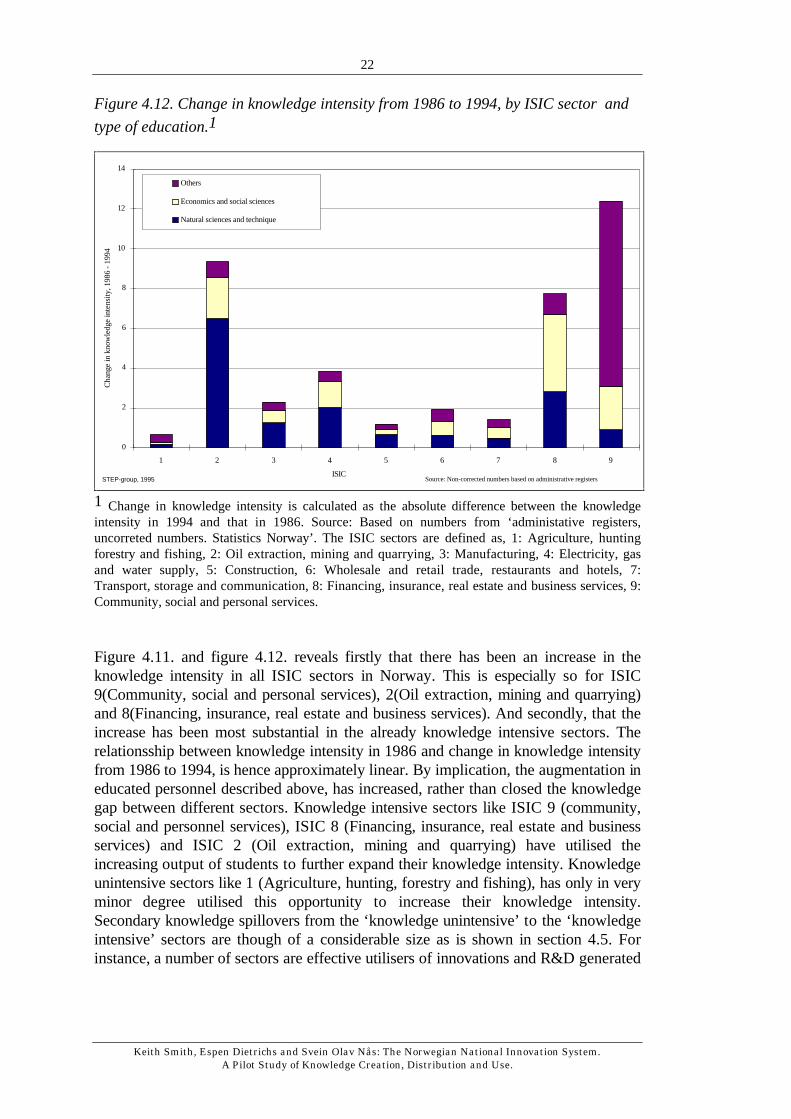
Figure 4.12. Change in knowledge intensity from 1986 to 1994, by ISIC sector and
type of education.1
0
2
4
6
8
10
12
14
1 2 3 4 5 6 7 8 9
ISIC
Cha
nge
in k
now
ledg
e in
tens
ity, 1
986
- 19
94
Others
Economics and social sciences
Natural sciences and technique
STEP-group, 1995 Source: Non-corrected numbers based on administrative registers
1 Change in knowledge intensity is calculated as the absolute difference between the knowledgeintensity in 1994 and that in 1986. Source: Based on numbers from ‘administative registers,uncorreted numbers. Statistics Norway’. The ISIC sectors are defined as, 1: Agriculture, huntingforestry and fishing, 2: Oil extraction, mining and quarrying, 3: Manufacturing, 4: Electricity, gasand water supply, 5: Construction, 6: Wholesale and retail trade, restaurants and hotels, 7:Transport, storage and communication, 8: Financing, insurance, real estate and business services, 9:Community, social and personal services.
Figure 4.11. and figure 4.12. reveals firstly that there has been an increase in theknowledge intensity in all ISIC sectors in Norway. This is especially so for ISIC9(Community, social and personal services), 2(Oil extraction, mining and quarrying)and 8(Financing, insurance, real estate and business services). And secondly, that theincrease has been most substantial in the already knowledge intensive sectors. Therelationsship between knowledge intensity in 1986 and change in knowledge intensityfrom 1986 to 1994, is hence approximately linear. By implication, the augmentation ineducated personnel described above, has increased, rather than closed the knowledgegap between different sectors. Knowledge intensive sectors like ISIC 9 (community,social and personnel services), ISIC 8 (Financing, insurance, real estate and businessservices) and ISIC 2 (Oil extraction, mining and quarrying) have utilised theincreasing output of students to further expand their knowledge intensity. Knowledgeunintensive sectors like 1 (Agriculture, hunting, forestry and fishing), has only in veryminor degree utilised this opportunity to increase their knowledge intensity.Secondary knowledge spillovers from the ‘knowledge unintensive’ to the ‘knowledgeintensive’ sectors are though of a considerable size as is shown in section 4.5. Forinstance, a number of sectors are effective utilisers of innovations and R&D generated

23
Keith Smith, Espen Dietrichs and Svein Olav Nås: The Norwegian National Innovation System.A Pilot Study of Knowledge Creation, Distribution and Use.
in other sectors of the economy16, and therefore implicitly, they are utilisers ofeducated personell from other sectors. An important task for policy makers istherefore to map the impacts of the knowledge intensive sectors on the lessknowledge intensive ones and vice versa. These questions may be studied by input-output analysis, mobility studies etc.
Further development on analysis based on employer-employee registers
Work on the employer-employee registers, with information on each single individualin the work force, will continue as part of this project. A range of questions regardingmobility and knowledge flows can be studied. We will for now concentrate on fourkey areas. The aim is to develop tables and figures that are - as far as possible -comparable between Norway and Sweden.
The four key areas are:
(i) Cross-section description - examining structures according to different types ofclassification. Firms can be categorised according to industry or size, and so on.
(ii) Global structure changes. Comparing the variables of levels and structure overtime.
We plan to compare two years and chart the global changes in employment patternswithin categories of firms. This entails examining the covariation between differentlevels of education, which may point to complementary relationships between functionand types of knowledge (e.g., ‘vertically’ - to what degree and in which direction arechanges to the Civil engineer degree correlated to changes in number of lower levelspecialists). What is the employment structure of SME vs., large enterprises, and howare they changing, in regard to engineers vs. Civil engineers?
(iii) Patterns of mobility will partly enable us to compensate for ‘crowding out’effects, as we can generally assume that individual movements are not linked to thiskind of effect to any significant degree. We will not be able to use salary levels as ameasure of this, as a fall in salary may reflect differentials in salary levels betweensectors (reflecting for instance a move from private industry to the public sector orinsitute sector), and because we cannot account for incomes from externalemployment activities. Patterns of mobility allow in principle the production of twoindicators: ‘career paths’ and ‘input-output’.
(iv) the fourth area is related to changes in flows in the education system. Theproduction of graduates and specialists by the education system emerges as the mostsignificant external factor, and will presumably influence employment patterns for thefirst 5-10 years after graduation. The first question that arises is classificatory: where
________________________16 F.M.Scherer, 1982, Inter industry technology flows in the US, research policy, pp 232-33
N. Rosenberg, 1993, An outsiders view of technological change in the forest products industry,Fremtek notat 22/93
24
Keith Smith, Espen Dietrichs and Svein Olav Nås: The Norwegian National Innovation System.A Pilot Study of Knowledge Creation, Distribution and Use.
do the newly qualified go? And how does the marginal demand alter in relation tofluctuations in graduate numbers?
In the next instance more complex questions arise. Whether changes are driven bydemand (and can therefore be related to structural conditions) or supply (thusinvolving ‘crowding out’) is unclear. In principle it is possible to calculate acorrelation period, that is, an estimate of the period for which educational backgroundis a significant explanatory variable for careers.
4.5 Maps of key industrial knowledge bases and their institutionalforms
In a resource-based, low R&D-intensity economy such as Norway, it is of criticalimportance to recognise that low-R&D industries are not necessarily low innovationindustries. Low R&D-performing sectors are often the recipients of substantialknowledge flows, either embodied in capital and intermediate goods, or disembodiedin the form of indirect research results and human mobility. Behind and apparentlylow-tech industry may lie an extremely sophisticated knowledge base; such indirectknowledge bases by definition involve system interactions and flows. One way inwhich this project has attempted to grasp this problem is by exploring and defining theknowledge bases of some key Norwegian industries in terms of
• the basic technologies which are used in the activities which make up the industry• the relevant forms of knowledge (scientific and otherwise) which are used in the
production of these technologies• the role of any background scientific knowledges which are relevant• the physical location - particularly in Norway - of institutions which create, diffuse
and maintain such knowledges
An example of such an approach is given in the following table. This refers to anincreasingly important activity in Norway, namely fish farming. We discuss this hereas an example of how we might approach the general problem of understandingindustry knowledge bases in the context of inter-institutional knowledge flows andlearning. As natural fish stocks decline under the impact of over-fishing, farmed fishare taking an increasingly large part of the market, and this is in general a rapidlygrowing industry. Although fish-farming is a very low R&D-performing industry, thisis by no means a low technology activity: underlying it are sophisticated knowledgebases and an extensive range of relevant research institutions.
25
Keith Smith, Espen Dietrichs and Svein Olav Nås: The Norwegian National Innovation System.A Pilot Study of Knowledge Creation, Distribution and Use.
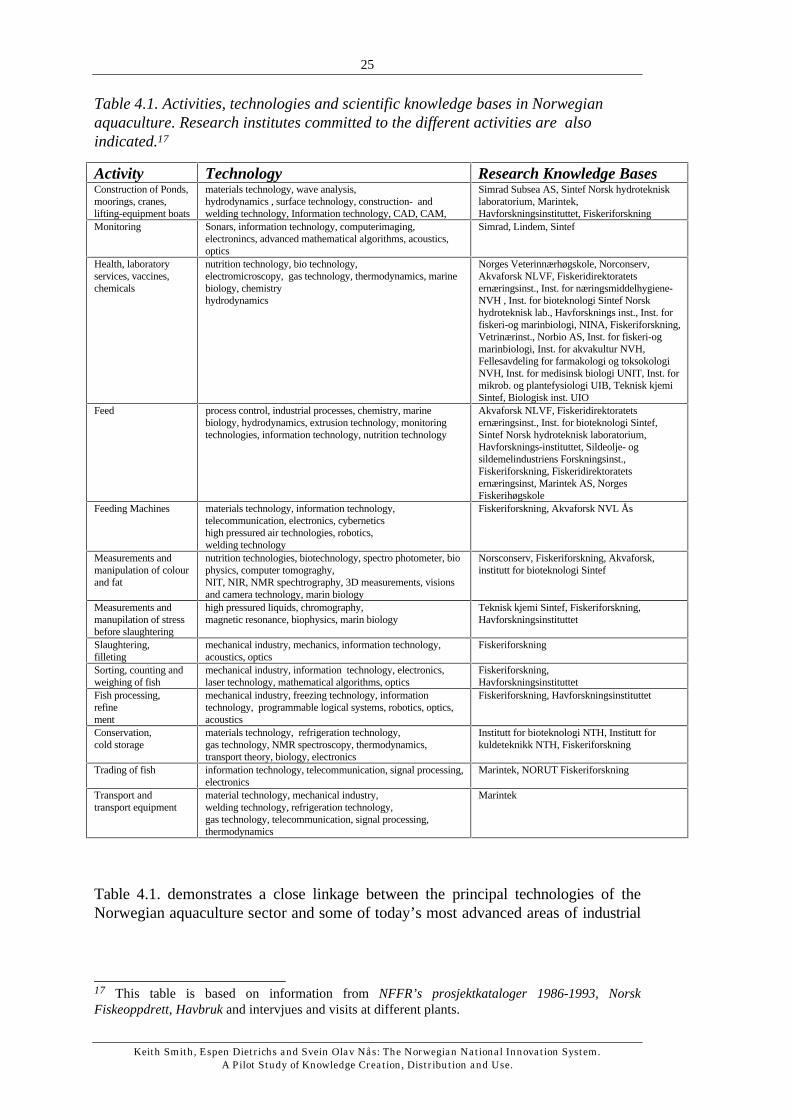
Table 4.1. Activities, technologies and scientific knowledge bases in Norwegianaquaculture. Research institutes committed to the different activities are alsoindicated.17
Activity Technology Research Knowledge BasesConstruction of Ponds,moorings, cranes,lifting-equipment boats
materials technology, wave analysis,hydrodynamics , surface technology, construction- andwelding technology, Information technology, CAD, CAM,
Simrad Subsea AS, Sintef Norsk hydroteknisklaboratorium, Marintek,Havforskningsinstituttet, Fiskeriforskning
Monitoring Sonars, information technology, computerimaging,electronincs, advanced mathematical algorithms, acoustics,optics
Simrad, Lindem, Sintef
Health, laboratoryservices, vaccines,chemicals
nutrition technology, bio technology,electromicroscopy, gas technology, thermodynamics, marinebiology, chemistryhydrodynamics
Norges Veterinnærhøgskole, Norconserv,Akvaforsk NLVF, Fiskeridirektoratetsernæringsinst., Inst. for næringsmiddelhygiene-NVH , Inst. for bioteknologi Sintef Norskhydroteknisk lab., Havforsknings inst., Inst. forfiskeri-og marinbiologi, NINA, Fiskeriforskning,Vetrinærinst., Norbio AS, Inst. for fiskeri-ogmarinbiologi, Inst. for akvakultur NVH,Fellesavdeling for farmakologi og toksokologiNVH, Inst. for medisinsk biologi UNIT, Inst. formikrob. og plantefysiologi UIB, Teknisk kjemiSintef, Biologisk inst. UIO
Feed process control, industrial processes, chemistry, marinebiology, hydrodynamics, extrusion technology, monitoringtechnologies, information technology, nutrition technology
Akvaforsk NLVF, Fiskeridirektoratetsernæringsinst., Inst. for bioteknologi Sintef,Sintef Norsk hydroteknisk laboratorium,Havforsknings-instituttet, Sildeolje- ogsildemelindustriens Forskningsinst.,Fiskeriforskning, Fiskeridirektoratetsernæringsinst, Marintek AS, NorgesFiskerihøgskole
Feeding Machines materials technology, information technology,telecommunication, electronics, cyberneticshigh pressured air technologies, robotics,welding technology
Fiskeriforskning, Akvaforsk NVL Ås
Measurements andmanipulation of colourand fat
nutrition technologies, biotechnology, spectro photometer, biophysics, computer tomograghy,NIT, NIR, NMR spechtrography, 3D measurements, visionsand camera technology, marin biology
Norsconserv, Fiskeriforskning, Akvaforsk,institutt for bioteknologi Sintef
Measurements andmanupilation of stressbefore slaughtering
high pressured liquids, chromography,magnetic resonance, biophysics, marin biology
Teknisk kjemi Sintef, Fiskeriforskning,Havforskningsinstituttet
Slaughtering,filleting
mechanical industry, mechanics, information technology,acoustics, optics
Fiskeriforskning
Sorting, counting andweighing of fish
mechanical industry, information technology, electronics,laser technology, mathematical algorithms, optics
Fiskeriforskning,Havforskningsinstituttet
Fish processing,refinement
mechanical industry, freezing technology, informationtechnology, programmable logical systems, robotics, optics,acoustics
Fiskeriforskning, Havforskningsinstituttet
Conservation,cold storage
materials technology, refrigeration technology,gas technology, NMR spectroscopy, thermodynamics,transport theory, biology, electronics
Institutt for bioteknologi NTH, Institutt forkuldeteknikk NTH, Fiskeriforskning
Trading of fish information technology, telecommunication, signal processing,electronics
Marintek, NORUT Fiskeriforskning
Transport andtransport equipment
material technology, mechanical industry,welding technology, refrigeration technology,gas technology, telecommunication, signal processing,thermodynamics
Marintek
Table 4.1. demonstrates a close linkage between the principal technologies of theNorwegian aquaculture sector and some of today’s most advanced areas of industrial
________________________17 This table is based on information from NFFR’s prosjektkataloger 1986-1993, NorskFiskeoppdrett, Havbruk and intervjues and visits at different plants.

26
Keith Smith, Espen Dietrichs and Svein Olav Nås: The Norwegian National Innovation System.A Pilot Study of Knowledge Creation, Distribution and Use.
innovation18. The salient observation is that aquaculture, typically classified as a ‘lowtechnology’ sector according to the standard OECD definition, in fact is an industry inwhich advanced technologies are created, transformed, adopted and used. As Table4.1. essentially illustrates, aquaculture is the subject of substantial spillovers fromother industries.
An example of such spillovers comes from the food sector industry. A technologyknown as extrusion that originated from the plastic foil industry, revolutionisedaquaculture industry in the early 80s. Extrusion, basically a thermic process thatconverts solids into manipulatable, soft plastic mass, was applied to fish feed. In thisapplication, the organic feed, having been converted into a plastic mass is runthrough a dicer and made into pellets, which are then dried. The change-over to dryfeed , also forced change in complementary technologies, notably mechanical feeders.In the early 70’s wet-food, unrefined bi-products from commercial fisheries weredominant in aquaculture. Transport costs were high as this type of feed had to bepumped through expensive acid proof pipes from land to the farm-enclosures. Dryfeed dramatically lowered transport as well as maintenance costs. The feed was bothlighter and could be conveyed and dispersed by means of air and not water pumps,amongst other things reducing wear and tear on the pumps and pipes. As a result, alarge cluster of complementary technologies has emerged which also involvetechnologies from the plastic industry: today’s wet-feed machines are approximately 3times more expensive than the dry-feed systems.
Both feed-systems rely however on the bi-products of commercial fishing, particularly‘junk fish.’ As pressure on the oceans’ fish stocks increase, with more and more‘junk fish’ supplementing exhausted high quality sorts, 19, aquaculture’s feed base isbecoming more uncertain. This prospect has led to the industry’s search for newsources for feed. Here again, aquaculture sector seems to be able to take advantageof technologies originally generated elsewhere. The oil industry is developing anartificial single cell protein by feeding bacteria methane gas. Biomar, a feed companyowned by the oil giant Norsk Hydro, finds the technique promising for the use in farmfeeds.
Another important area of technological spillover connected to feed techniques ismonitoring technology. In this area, interesting technologies are being developedwhich promise to help farms in the important job of ensuring effective feedingregimes. To this end, the aquaculture industry is in the process of adopting andadapting the sonar technology that has become a mainstay of more traditional fisheriesin gathering information about the exact location and volume of fish stocks . Suchtechniques, based on high-tech information technologies, acoustics and advancedmathematical algorithms, can be used to monitor the behaviour of the salmon in theirpens. Monitoring behaviour in this way over time can help establish feeding patterns.Further, as farm managers learn to recognise behavioural patterns, this techniquemight also be used to uncover early symptoms of spreading diseases.
________________________18 This pattern of technology use is not reflected in the internal R&D of the industry itself, and theusual indicator of technology intensity (the R&D/Sales ratio) is a very unsuitable indicator of the realtechnological characteristics of the industry.19 The Economist, The tragedy of the oceans, March 1994.

27
Keith Smith, Espen Dietrichs and Svein Olav Nås: The Norwegian National Innovation System.A Pilot Study of Knowledge Creation, Distribution and Use.
It is important to note that the Norwegian firms involved in developing monitoringdevices tailored to the needs of the aquaculture sector were also those active indeveloping sonar for traditional fisheries, attesting to an active spillover process.Other areas in which Norwegian firms are advancing are sea-farm enclosuretechnologies, sea vessels and general offshore equipment. A report about Europeancompetitiveness20 indicates that Norway’s strong industrial cluster related to shippingindustry, offshore and sub-sea technologies have put it in the lead in Europe.
Norwegian aquaculture is building its way into this cluster, learning from it whilecontributing to it. In fact the labour productivity in aquaculture and that in oil industryare correlated by a factor r = 0,93 in the period from 1978 - 1991. Tab.(1)demonstrates that several of the research institutions active in aquaculture also havesubstantial interest in the oil industry. Sintef crops up repeatedly in this table,especially under the name Marintek which is a strong research resource in generaloffshore technologies. Particularly active in cross-industrial links are supply-orientedfirms such as Trio Machines, Aga Gass, SM Remote Systems, Fina Exploration, BPNorway, BP Nutrition, Hydrogas and Marinaqua (Hydro/Statoil) which are involvedboth with aquaculture and the oil industry. Meanwhile the Norwegian oil giant,Norsk Hydro, owns one of the biggest fish farms (Mowi AS) and food producers(Biomar) in Norway.
As shown above, Norwegian aquaculture is in the technological forefront withinseveral fields. Norway is, in such high tech sectors as acoustics, optics, electronicsand information technologies, building up considerable knowledge resources andapplying them to aquaculture and fisheries. Crucial in this development have been thealready existing Norwegian clusters within shipping, offshore, and traditional fishingtechnologies. A knowledge infrastructure depending on these milieus has beensuccessfully established very much due to the new market conditions with largecompetitive firms being able to absorb distant technologies by establishing links tovery advanced scientific milieus. Within this infrastructure an innovative andtechnically very advanced aquaculture industry has grown up. An essential point aboutlow-tech industries is hence revealed through our analyses: i) these industries do notnecessarily create or access new technologies via internal R&D, and ii) they often useinputs that are highly advanced and R&D intensive.
We emphasize that this approach is given here as an example: we intend to developsimilar analyses of industry knowledge bases across the system as a whole as a meansof understanding the wider dimesnions of inter-institutional learning in Norway.
4.6 Inter-industry embodied knowledge flows
As an integral part of the national accounts system in Norway, Statistics Norwayconstructs input-output tables for the whole Norwegian economy. They summarise alltransactions between a number of disaggregated sectors, specifying delivering andreceiving sector along with some “external” sectors, such as final consumption and
________________________20 T. Reve and Mathisen L., 1994, European Competitivness, Norges Handelshøyskole, Bergen,Norway.
28
Keith Smith, Espen Dietrichs and Svein Olav Nås: The Norwegian National Innovation System.A Pilot Study of Knowledge Creation, Distribution and Use.
exports/imports. A series of assumptions are necessary to construct the tables, but wewill not enter this discussion here.
The information in the input-output tables is extremely useful to describe differentindustries’ roles versus other production sectors; if they are important suppliers ofintermediate goods and capital equipment, to who they may be important, if they aremainly focused on end-user production etc. On the basis of the data one may hence beable to identify inter- and intra industrial linkages, nodes in the technologicalinfrastructure, generic industries, etc. Combined with other data indications ofnetworks and clusters may also be identified.
One option to be explored by the data is the supply and deliveries of indirect R&Ddeliveries (from one sector to another). By coupling R&D statistics input-output ofintermediate goods, it is possible to track indirect transfers of R&D between sectors.This is done by Olav Fagerlid and Arne Stokka, and the following is based on theirresults.21
Figure 4.13. shows an example of the inflow and outflow of indirect R&D for onesector, namely IT. (Only the largest suppliers and receivers are included in the figure4.13). We see that the IT industry receives a considerable amount of R&D via importsand that ‘transport equipment’, ‘chemicals’, ‘electrical apparatus and material’,‘scientific instruments’ and ‘machinery’ makes up an important part of the nationalindustrial infrastructure ‘surrounding’ the IT industry.
Figure 4.14. shows the generic character of IT. All deliveries of indirect R&D frommanufacturing to manufacturing firms are included in the figure. It is seen thatalthough the IT industry in Norway is quite small (with regard to gross production), itcontibutes by more than 25% of all R&D deliveries to all manufacturing firms.‘Chemicals, ‘transport equipment’, ‘electrical apparatus’ and ‘machinery’ also sevesas nodal industries in this sense.
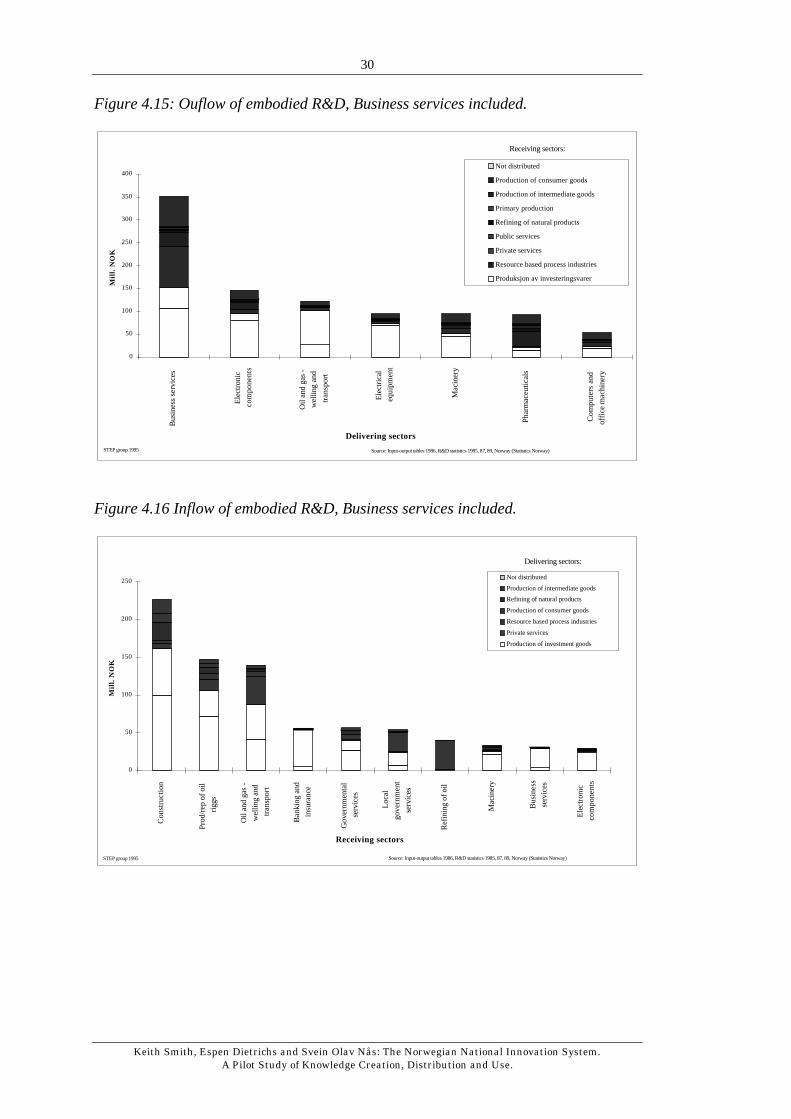
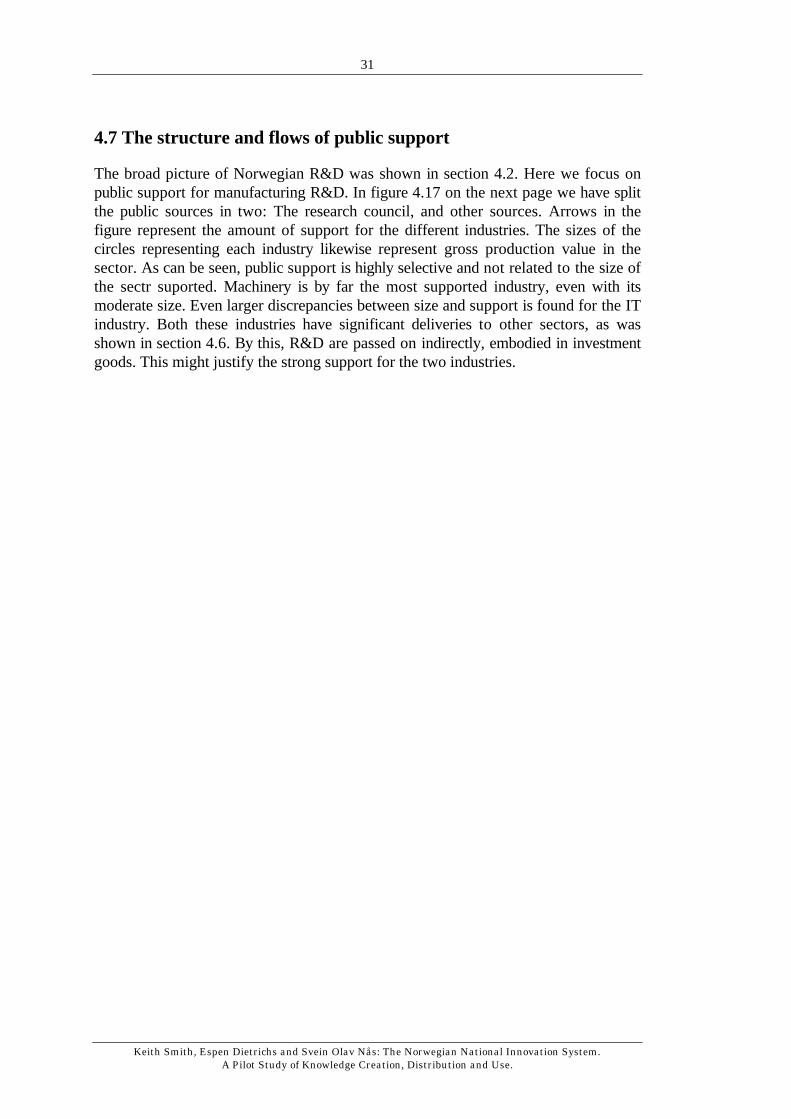
We also present two input-output based figures which includes ISIC sector 832 and833: Business services. This sector is in general of growing importance in severalrespects. This is underlined by figure 4.15 and figure 4.16. Business services is one ofthe most important R&D delivering sector within the Norwegian economy (figure4.15.) and in many ways represent a nodal point in the system due to the fact thatR&D deliveries are distributed to a large number of other sectors, figure 4.16. ( Themost important R&D delivering sector within business services is informationtechnology and engineering related services in general).
________________________21 See Olav Fagerlid and Arne Stokka: FoU-strukturen i norsk industri. SINTEF rapport
STF83 A94005.
By misfortune, our work have been carried out concomitantly with a major revision of the wholesystem of national accounts in Statistics Norway. As a result, Statistics Norway has not been able tosupply input-output tables at our specifications during the work. To be able to present data on thisaspect of technology transfer at all, we have used tables received from Olav Fagerlid and ArneStokka for the year 1986. This give us a broad picture of the situation, but is obviously not anupdated description of the present situation. We plan to come back to this in later work.

29
Keith Smith, Espen Dietrichs and Svein Olav Nås: The Norwegian National Innovation System.A Pilot Study of Knowledge Creation, Distribution and Use.
Figure 4.13. The IT industry: Inflow and outflow of embodied R&D.
Food, beverages, tobacco85,3
Chemicals24,7
Machinery18,6
Electricalapparatus9,4
IT-industry4,8
Instru-ments4,4
Import
IT-industry4,8
Transport equipment36,9
Source: R&D statistics Norway 1985-1989 and Input-output Norway 1986.
Figure 4.14 Inflow and outflow of embodied R&D (manufacturing sectors).
0 5 10 15 20 25 30
IT-industry
Chemicals
Transport equipment
Electrical apparatus
Machinery
Basic metals
Metal products
Optics, instruments
Pulp and paper, graphical ind.
Food, beverages and tobacco
Other manufacturing
Rubber and plastic products
Mineral products
Petroleum products
Wood products
Textiles etc.
Del
iver
ing
sect
or
Share of total manufacturing R&D deliveries
STEP group 1995 Source: Input-output tables 1986, R&D statistics 1985, 87, 89. (Statistics Norway).
30
Keith Smith, Espen Dietrichs and Svein Olav Nås: The Norwegian National Innovation System.A Pilot Study of Knowledge Creation, Distribution and Use.
Figure 4.15: Ouflow of embodied R&D, Business services included.
0
50
100
150
200
250
300
350
400B
usin
ess
serv
ices
Ele
ctro
nic
com
po
ne
nts
Oil
and
gas
-
wel
ling
and
tra
nsp
ort
Ele
ctric
al
eq
uip
me
nt
Mac
iner
y
Pha
rmac
eutic
als
Co
mp
ute
rs a
nd
offic
e m
achi
nery
Delivering sectors
Mill
. N
OK
Not distributed
Production of consumer goods
Production of intermediate goods
Primary production
Refining of natural products
Public services
Private services
Resource based process industries
Produksjon av investeringsvarer
Receiving sectors:
STEP group 1995 Source: Input-output tables 1986, R&D statistics 1985, 87, 89, Norway (Statistics Norway)
Figure 4.16 Inflow of embodied R&D, Business services included.
0
50
100
150
200
250
Co
nst
ruct
ion
Pro
d/re
p of
oil
riggs
Oil
and
gas
-
wel
ling
and
tra
nsp
ort
Ban
king
and
insu
ranc
e
Gov
ernm
enta
l
serv
ices
Loca
l
go
vern
me
nt
serv
ices
Ref
inin
g of
oil
Mac
iner
y
Bus
ines
s
serv
ices
Ele
ctro
nic
com
po
ne
nts
Receiving sectors
Mill
. N
OK
Not distributed
Production of intermediate goods
Refining of natural products
Production of consumer goods
Resource based process industries
Private services
Production of investment goods
Delivering sectors:
STEP group 1995 Source: Input-output tables 1986, R&D statistics 1985, 87, 89, Norway (Statistics Norway)
31
Keith Smith, Espen Dietrichs and Svein Olav Nås: The Norwegian National Innovation System.A Pilot Study of Knowledge Creation, Distribution and Use.
4.7 The structure and flows of public support
The broad picture of Norwegian R&D was shown in section 4.2. Here we focus onpublic support for manufacturing R&D. In figure 4.17 on the next page we have splitthe public sources in two: The research council, and other sources. Arrows in thefigure represent the amount of support for the different industries. The sizes of thecircles representing each industry likewise represent gross production value in thesector. As can be seen, public support is highly selective and not related to the size ofthe sectr suported. Machinery is by far the most supported industry, even with itsmoderate size. Even larger discrepancies between size and support is found for the ITindustry. Both these industries have significant deliveries to other sectors, as wasshown in section 4.6. By this, R&D are passed on indirectly, embodied in investmentgoods. This might justify the strong support for the two industries.
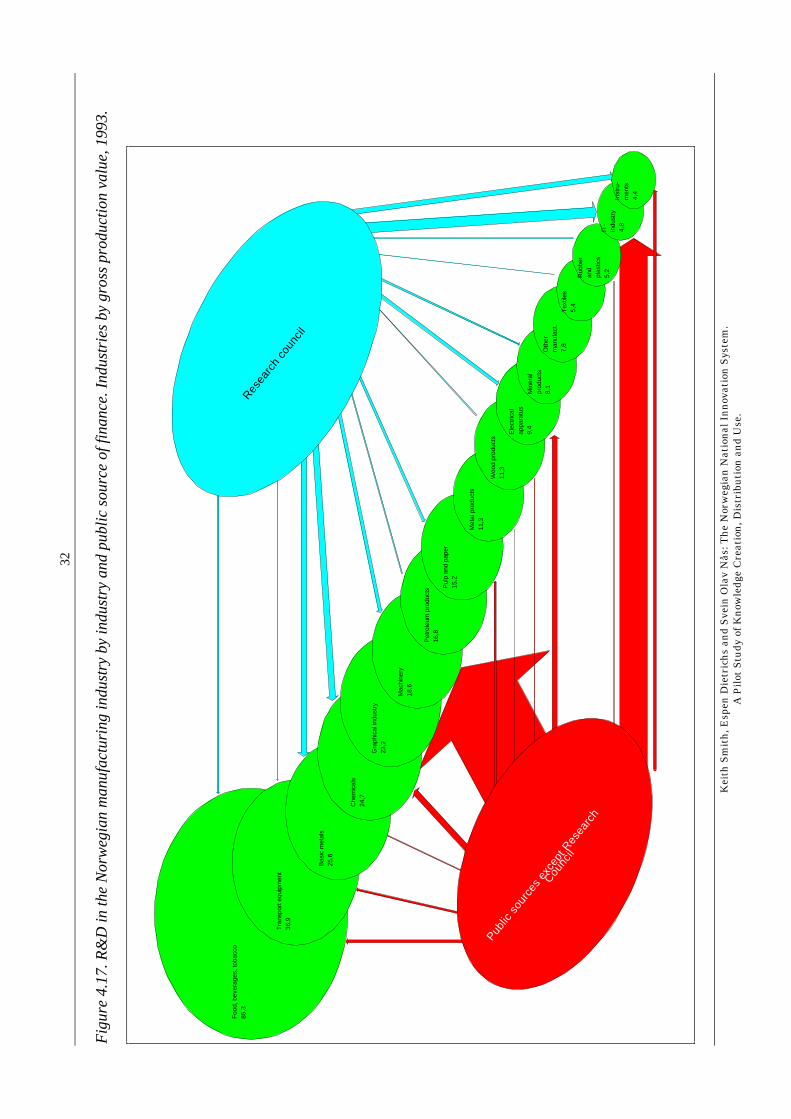
32
Kei
th S
mit
h, E
spen
Die
tric
hs
and
Sve
in O
lav
Nås
: Th
e N
orw
egia
n N
atio
nal
In
nov
atio
n S
yste
m.
A P
ilot
Stu
dy o
f K
now
ledg
e C
reat
ion
, Dis
trib
uti
on a
nd
Use
.
Fig
ure
4.1
7. R
&D
in th
e N
orw
eg
ian
ma
nu
fact
urin
g in
du
stry
by
ind
ust
ry a
nd
pu
blic
so
urc
e o
f fin
an
ce. In
du
strie
s b
y g
ross
pro
du
ctio
n v
alu
e, 1
99
3.
Foo
d, b
ever
ages
, tob
acco
85,3
Tra
nspo
rt e
quip
men
t36
,9
Bas
ic m
etal
s25
,6
Che
mic
als
24,7
Gra
phic
al in
dust
ry23
,2
Mac
hine
ry18
,6
Pet
role
um p
rodu
cts
16,8
Pul
p an
d pa
per
15,2
Met
al p
rodu
cts
11,3
Woo
d pr
oduc
ts11
,3
Public
sou
rces
exc
ept R
esea
rch
Counc
il
Resea
rch
coun
cil
Ele
ctric
alap
para
tus
9,4
Min
eral
prod
ucts
8,1
Oth
erm
anuf
act.
7,8
Tex
tiles
5,4
Rub
ber
and
plas
tics
5,2
IT-
indu
stry
4,8
Inst
ru-
men
ts4,
4
33
Keith Smith, Espen Dietrichs and Svein Olav Nås: The Norwegian National Innovation System.A Pilot Study of Knowledge Creation, Distribution and Use.
5. Key branch studies
Future work on this project will be based in large part on a series of micro-level sectorstudies, of specific industries in Norway. In this section we summarise the preliminaryfindings of a few of 10 such industry studies being undertaken by STEP.
The focus of the studies is on innovative performance, looking at sources oftechnology and information flows, along with the firms’own expenditures oninnovative activities. The main sources of information are the Norwegian innovationsurvey from 1992, and the biannual R&D statistics. Also the OECD STAN databasehave been of use. Some of the results are collected in table A.1 in the annex. As thework develops, the information will be supplemented with information on what arethe key knowledge bases of the different industries, along with result from moredetailed studies of personnel mobility and input-output analysis.
Chemicals
Innovation in the chemicals industry is not a leftover of the industry's rapid expansionduring the 60s, 70s and parts of the 80s. In fact, for the traditional sectors such aspetro-chemicals and other bulk markets, the premium placed on innovationperformance is of ever-increasing importance. Here, increasing competition on worldmarkets, adjustments to environmental effects and a cyclical over-capacity notedabove argue more and more insistently for greater efficiency and greater specialisationtailored to suit the changing needs of bulk-consumers. Innovation is needed to adaptmost efficiently to such forces.
Further, today's sectors of rapid growth, those of pharmaceuticals and specialitychemicals such as cosmetics, require increasing levels of innovation investment. Here,innovation is itself being stimulated by innovation, and possibilities are beingaugmented by the pioneering of biotechnology. Norway's industry is investing highrates into innovation projects, in part to adjust to the arising challenges andpossibilities.
IT industry
The IT sector is one of the most knowledge- and education-intensive branches inNorway today. Highly skilled personnel is one of the obvious advantages this sectorpossesses. At the same time IT is a sector with a high level of internal transactionswhen it comes to suppliers of inputs and when it comes to R&D co-operation. Thebranch innovates in a highly competitive environment. This is reflected in its positiveattitude towards information flow from demanding clients and customers, whichensures feedback on their innovations. To a large degree, innovation activity takesplace as internal investment and R&D, i.e., within the sector, within blocks ofcompanies, strategic alliances and co-operative partnerships, and in clusters. We can

34
Keith Smith, Espen Dietrichs and Svein Olav Nås: The Norwegian National Innovation System.A Pilot Study of Knowledge Creation, Distribution and Use.
say little about international cluster relations. Input imports account for around 30%of total deliveries to the sector. R&D co-operation is in NOK greater than R&D co-operation within Norway as a whole, though with a smaller proportion of firmsparticipating. The Norwegian IT sector has one of the highest R&D intensities in theWestern world today.
The level of innovation performance in this sector is one of the highest amongNorwegian branches. The capacity of individual IT firms to absorb innovations fromthe sector as a whole is relatively high. The proportion of sales accounted for by newproducts is high. In terms of these indicators, IT is today one of the most successfulbranches in Norway. When we look at the innovation activity and intensity, andcompare it with innovation output and other Norwegian branches, we are tempted toask the question of whether such levels of R&D related investment are justified interms of the relatively low output as share of new products sales.
Food, beverages and tobacco
• Second largest Norwegian manufacturing sector• Production all over the country, important for employment and settlement• Falling production and employment, but relatively high profitability• Based on Norwegian raw materials from the highly regulated primary sector• Most of the sector is sheltered from international competition• Growing market for “convenience products”• Increasing competition due to deregulations both nationally and through WTO• Increased pressure from monopsonistic customers (chains)• Smaller than average firm size, somewhat above average on exports (fish products)• Traditionally high investments compared to rest of industry and internationally, but
levelling off• Particularly low on innovation inputs, both compared to other industries, over time
and compared to the industry in other countries• Innovation inputs strongly biased towards innovative investments, particularly low
on R&D• Share of indirect R&D higher than own direct R&D expenditures• In sum: To a large degree dependent on other sectors for new technology• A large share of new products in sales, both in comparisons with other Norwegian
industries and internationally• Hard to explain the seemingly lack of correlation between innovation inputs and
outputs• Contacts with other units in the business sector more important as a source for
innovation than the “technological infrastructure”• Innovation more oriented towards reduction in process cost components than
improved or extended product range• Risks, high costs, lack of financing and skilled personnel are viewed as the most
important obstacles to innovation• Firms with public support for innovation or engaged in R&D co-operation are far
more innovative than companies without such support or co-operation• Innovative companies are slightly more profitable than non-innovators

35
Keith Smith, Espen Dietrichs and Svein Olav Nås: The Norwegian National Innovation System.A Pilot Study of Knowledge Creation, Distribution and Use.
• Non-R&D innovation expenditures seem to be more closely related to new productsales than R&D
6. International comparisons
Clearly, international comparisons can take place along a number of dimensions. Herewe mention only one, which is of some importnce for understanding Norwegian R&Dperformance. Norway has a relatively low R&D Intensity for the manufacturing sectoras a whole, but this in large part reflects an indutrial structure based on low R&D-intensity industries. However if we look at a simple breakdown of R&D across theusual high, medium and low technology industries, and compare Norwegian R&Dperformance with other OECD countries, then we notice immediately that NorwegianR&D intensities are not uniformly low in comparison with other OECD economies.
In fact, in high-tech industries, Norways ranks among the highest countries in terms ofR&D intensity. However Figures 6.1, 6.2 and 6.3 also look at the shares ofmanufacturing output which are accounted for by these industry groups. What we seeis that Norways ranks high in R&D intensity, but low in terms of the share of outputfrom high-tech sectors.
Figure 6.1 Comparison of R&D intensity and share of manufacturing production forindustries with a high R&D intensity.
Andel samlet industriproduksjon, prosent
FOU
-int
ens
itet,
pro
sent
0
5
10
15
20
25
0 5 10 15 20 25 30 35
USAS
UKN
F
Fin J
FRGDKCanI
Aus
Source: OECD STAN Database, Release 1, OECD STI Database
When we turn to medium tech industries, the share of output from the industries rises,but Norways ranking in terms of R&D intensity falls:
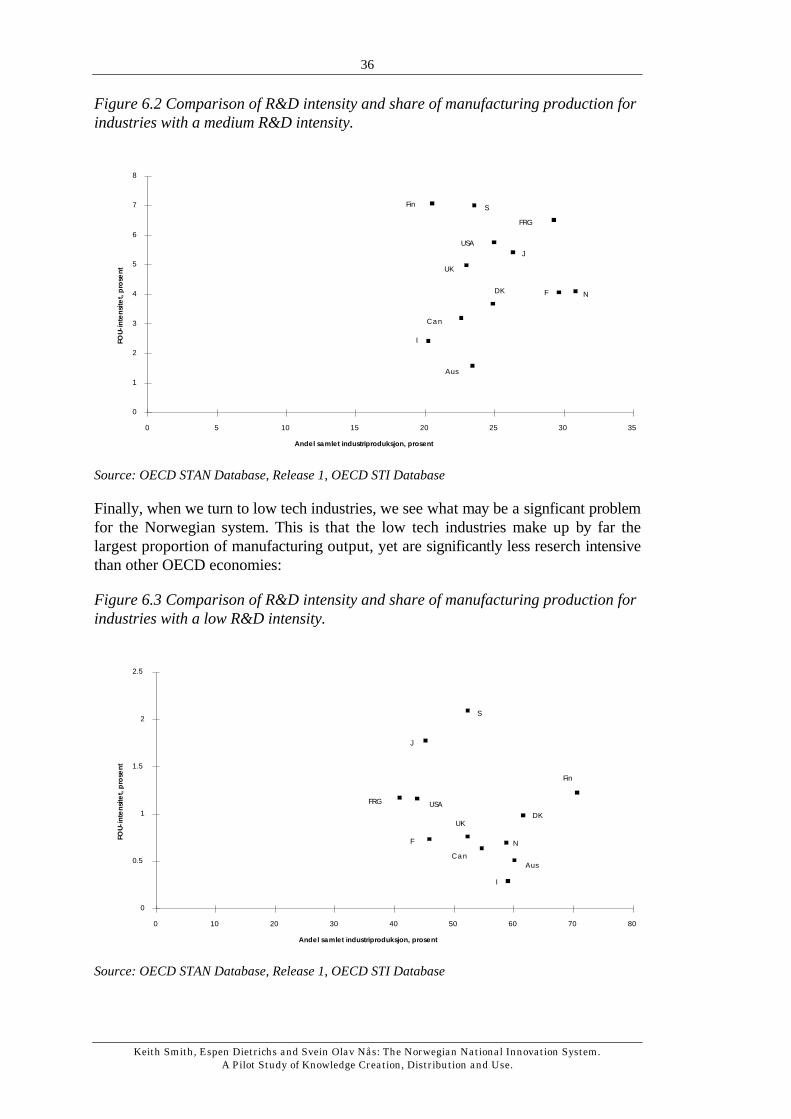
36
Keith Smith, Espen Dietrichs and Svein Olav Nås: The Norwegian National Innovation System.A Pilot Study of Knowledge Creation, Distribution and Use.
Figure 6.2 Comparison of R&D intensity and share of manufacturing production forindustries with a medium R&D intensity.
Andel samlet industriproduksjon, prosent
FOU
-int
ens
itet,
pro
sent
0
1
2
3
4
5
6
7
8
0 5 10 15 20 25 30 35
Fin S
FRG
USAJ
UK
NFDK
Can
I
Aus
Source: OECD STAN Database, Release 1, OECD STI Database
Finally, when we turn to low tech industries, we see what may be a signficant problemfor the Norwegian system. This is that the low tech industries make up by far thelargest proportion of manufacturing output, yet are significantly less reserch intensivethan other OECD economies:
Figure 6.3 Comparison of R&D intensity and share of manufacturing production forindustries with a low R&D intensity.
Andel samlet industriproduksjon, prosent
FOU
-int
ens
itet,
pro
sent
0
0.5
1
1.5
2
2.5
0 10 20 30 40 50 60 70 80
S
J
Fin
FRG USA
DKUK
F N
CanAus
I
Source: OECD STAN Database, Release 1, OECD STI Database

37
Keith Smith, Espen Dietrichs and Svein Olav Nås: The Norwegian National Innovation System.A Pilot Study of Knowledge Creation, Distribution and Use.
7. Concluding remarks
This study is no more than a pilot. It represent an aproach to a set of issues, and anexploration of various conceptual and technial methods of addressing those issues.Future generations of this paper will concentrate on updating the data whereapropriate, on extending the coverage of formal knowledge production (where weplan to introduce various bibliometric techniques), and extending the approach toindustry knowledge bases, and on a deeper discussion of public policy measures. Ourapproach here rsts on the view that empirical mapping of the nature andcharacteristics of knowledge use is an immesely complex task, yet is must be theprecursor to any attempt to understand the distribution power of a system.

38
Kei
th S
mit
h, E
spen
Die
tric
hs
and
Sve
in O
lav
Nås
: Th
e N
orw
egia
n N
atio
nal
In
nov
atio
n S
yste
m.
A P
ilot
Stu
dy o
f K
now
ledg
e C
reat
ion
, Dis
trib
uti
on a
nd
Use
.
Ta
ble
A.1
. In
dic
ato
rs o
n e
con
om
ic a
nd
inn
ova
tive
pe
rfo
rma
nce
.
Indust
ry
Sh
are
ofm
anu
f.G
PV
1993
Ch
ange
in
GP
V19
89-1
993
Sh
are
ofm
anu
fact
.va
lue
add
ed19
93
Sh
are
ofm
anu
fact
.in
vest
men
ts19
93
Sh
are
ofm
anu
fact
.em
ploy
men
t19
93
Sh
are
o fm
anu
fact
.R
&D
1993
Sh
are
ofR
&D
pu
b.fi
nan
ced
1993
Sh
are
ind
irec
tR
&D
(198
6-89
)
Sh
are
ofto
tal
man
ufa
ct.
ind
irec
tR
&D
del
iver
ies
(198
5-89
)
Sh
are
ofR
&D
perf
orm
edex
tern
ally
1993
Sh
are
ofR
&D
in
tot.
in
nov
.co
sts
1992
Sh
are
ofem
pl.
hig
her
edu
c.
Hig
her
edu
cati
onin
dex
Foo
d, b
ever
ages
and
toba
cco
27,2
4,9
18,0
26,5
18,6
4,0
6,5
52,9
2,0
36,4
23,8
6,6
0
Te
xtile
s e
tc.
1,7
5,7
2,3
2,1
3,1
0,3
4,8
57,0
0,1
13,1
15,7
5,5
0
Woo
d pr
oduc
ts3,
6-4
2,3
3,9
3,1
5,0
0,4
13,6
0,4
43,8
Pu
lp a
nd
pa
pe
r4,
8-2
8,5
4,3
9,9
3,9
3,4
7,2
37,5
**2,
339
,347
,19,
80,
7
Gra
phic
al in
dust
ry7,
4-1
,911
,67,
213
,10,
50,
0**
4,0
Pet
role
um p
rodu
cts
5,4
10,8
2,0
3,7
0,7
1,6
2,6
0,8
38,0
Che
mic
als
7,9
1,5
8,6
10,9
5,2
23,5
2,9
16,5
12,7
30,7
59,2
25,8
2
Ru
bb
er
an
d p
last
ic p
rod
uct
s1,
7-1
9,1
2,1
2,3
2,3
0,8
6,4
1,5
7,8
Min
era
l pro
du
cts
2,6
-12,
43,
43,
23,
00,
910
,01,
516
,1
Ba
sic
me
tals
8,1
-40,
76,
55,
55,
16,
56,
127
,710
,546
,251
,711
,01
Me
tal p
rod
uct
s3,
6-2
1,3
5,1
2,8
6,0
1,4
0,6
35,8
3,7
21,1
16,4
7,8
0
Mac
hine
ry5,
9**
-56,
37,
24,
78,
012
,641
,638
,911
,124
,329
,714
,01
IT-in
dust
ry1,
5**
2,0
1,6
1,8
33,0
6,7
12,1
26,6
16,1
33,1
38,9
4
Ele
ctri
cal a
pp
ara
tus
3,0
-36,
03,
92,
53,
44,
69,
618
,611
,216
,834
,516
,41
Op
tics,
inst
rum
en
ts1,
421
6,5
1,8
1,2
1,7
3,5
11,1
2,5
20,8
Tra
nsp
ort
eq
uip
me
nt
11,8
89,1
14,1
10,8
14,9
2,7
5,3
11,2
45,0
Oth
er m
anuf
actu
ring
2,5
465,
03,
22,
34,
20,
20,
01,
920
,2
Tot
al m
anuf
actu
ring
100,
0-1
1,3
100,
010
0,0
100,
010
0,0
10,3
100,
016
,938
,711
,91

39
Keith Smith, Espen Dietrichs and Svein Olav Nås: The Norwegian National Innovation System.A Pilot Study of Knowledge Creation, Distribution and Use.