the numbers tell (part of) the · pdf filethe numbers tell (part of) the story ... cim - 5...
TRANSCRIPT

October 18, 2007Illinois PLTW Counselor, Administrator, Teacher Conference
The Numbers Tell (Part of) the Story
Brenda Pacey Illinois PLTW Affiliate DirectorBrenda Pacey, Illinois PLTW Affiliate DirectorSteve Parrott, PLTW State Leader
1

Growth Status Growth Status
As of May 2007 PLTW has:250,000+ students,located at 2200+ school sites,in 46 states & DC,being taught engineering curricula,by over 3500 teachers,all trained by PLTW,at 29 university sites.
2

Network Growth Network Growth –– Participating StatesParticipating States
346 States & DC • 1700+ School Sites • Derby, England

Illi i S h l 2007Illi i S h l 2007 0808Illinois Schools 2007Illinois Schools 2007--08:08:
61 sites offer PLTW courses:55 Hi h S h l ff PLTW55 High Schools offer PLTW courses (includes career center and college sites)6 Middle Schools offer GTT courses6 Middle Schools offer GTT courses
19 of these are new 2007-0815 25 additional schools have indicated15-25 additional schools have indicated interest to join and to begin courses in 2008-09
4
2008-09

Illi i HS PLTW CIlli i HS PLTW CIllinois HS PLTW Course Illinois HS PLTW Course Offerings 2007Offerings 2007--08:08:
17 sites offering 1 course21 sites offering 2 courses9 sites offering 3 or more coursesg8 sites offering 4 or more courses
5

Illi i PLTWIlli i PLTWIllinois PLTW Illinois PLTW Course Offerings 2007Course Offerings 2007--0808gg
GTT6 schools
FoundationsIED-48
SpecialtyBiotech- 36 schools IED-48
POE-30DE-18
Biotech- 3CEA - 11CIM - 5EDD- 5
6

Illi i PLTW T hIlli i PLTW T hIllinois PLTW Teachers Illinois PLTW Teachers Trained 2004Trained 2004--20072007
126 teachers totalTeachers trained per course
GTT - 15 Teachers (6 schools offer 2007-08)
Biotech- 5 Teachers (3 schools)
CEA 11 T h (11 h l )CEA- 11 Teachers (11 schools)
CIM- 7 Teachers (5 schools)
DE- 19 Teachers (18 schools)
EDD- 5 Teachers (5 schools)
IED- 62 Teachers (48 schools)
POE- 41 Teachers (30 schools)
2007 Summer Training Institute participation
7
69 teachers from 38 Illinois schools attended STI sessions in Illinois (42) and out-of-state (27)

Illinois PLTW High SchoolEnrollments 2006-07
8

PLTW Di itPLTW Di itPLTW DiversityPLTW Diversity
Gender Ratio
17%8%
1%
Racial Composition
Females18%
4%0%
African-Americans
Asians
Native Americans
Caucasians
Males82%70%
Hispanic
Multi-Racial
9

E ll t FiE ll t FiEnrollment FiguresEnrollment FiguresTotal Enrollment Course Breakdown
400
450
500
Total Enrollment
4% 11%
2%
Course Breakdown
IED
200
250
300
350
Freshmen
Sophomores
Juniors
48%2%
5% POE
CIM
CEA
0
50
100
150 Seniors
28%
BTE
DE
EDD
Freshmen Sophomores Juniors Seniors
10

C Off iC Off iCourse OfferingsCourse OfferingsIED Classes POE Classes
200
250
IED Classes
140160180
POE Classes
100
150Freshmen
Sophomores
Juniors406080
100120140
Freshmen
Sophomores
Juniors
0
50 Seniors
02040 Seniors
11
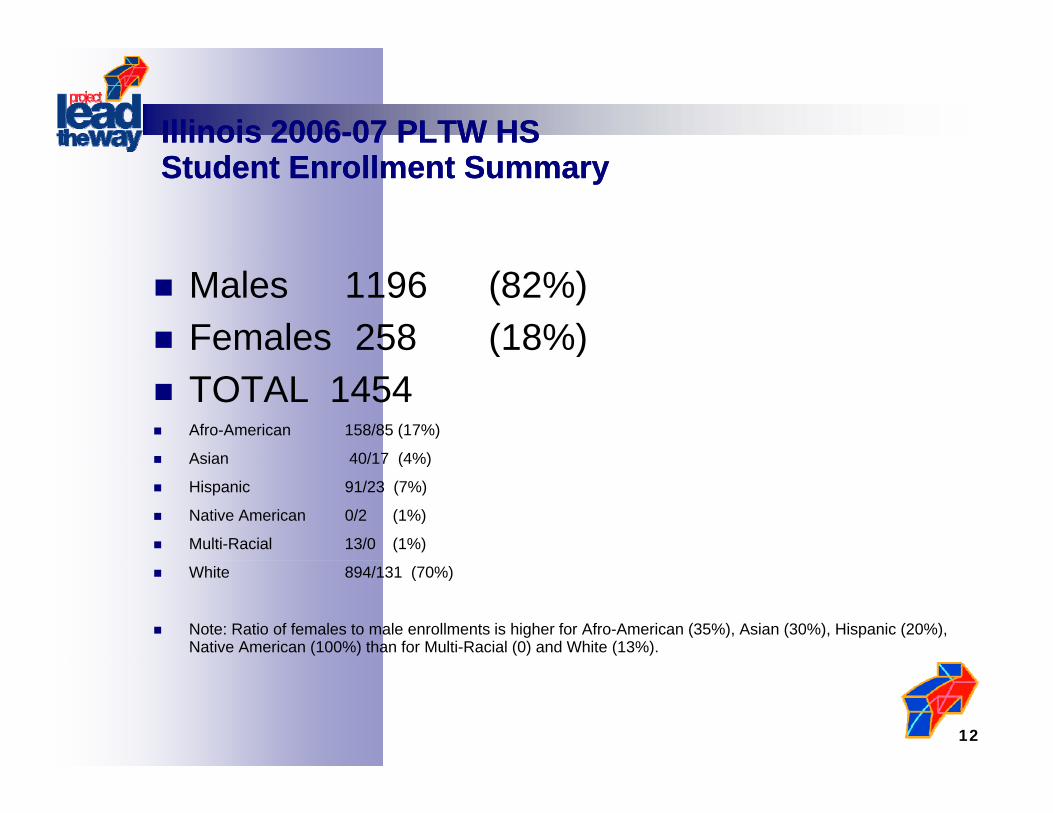
Illinois 2006Illinois 2006--07 PLTW HS 07 PLTW HS Student Enrollment SummaryStudent Enrollment Summary
Males 1196 (82%)Females 258 (18%)( )TOTAL 1454Afro-American 158/85 (17%)
Asian 40/17 (4%)Asian 40/17 (4%)
Hispanic 91/23 (7%)
Native American 0/2 (1%)
Multi-Racial 13/0 (1%)
White 894/131 (70%)
Note: Ratio of females to male enrollments is higher for Afro-American (35%), Asian (30%), Hispanic (20%), Native American (100%) than for Multi-Racial (0) and White (13%).
12

))Illinois 2006-07 PLTW HS Enrollment by CourseCourse
M F TotalBiotech 40 23 63Biotech 40 23 63CEA 66 12 78CIM 24 2 78DE 132 26 158EDD 21 1 22IED 589 115 704POE 324 79 403
Total 1196 258 1454N t R ti f f l t l ll t i hi h t f Bi t h (37%) f ll d b POE
13
Note: Ratio of females to male enrollments is highest for Biotech (37%), followed by POE (20%), IED, CEA, and DE (all 16%), CIM (8%), EDD (5%).

Southern Research Education Board (SREB) -“PLTW Works” ( )(2007 report—selected findings)
*PLTW students were significantly more likely to experience challenging and engaging i t ti l ti i lit /l t (33 % 17%) / th (44%instructional practices in literacy/language arts (33 % vs. 17%), numeracy/math (44% vs. 30%), and science (31% vs. 18%) than other CTE students.
*PLTW students were more likely than other HSTW CTE students to experience courses that required them to use academic knowledge to complete authentic assignments: q g p gChallenging assignments at least monthly (69% vs. 48%)
Used math in challenging assignments at least monthly (81% vs. 43%)
Sometimes or often studied CTE subjects related to science (30% vs. 17%)
Portfolios contained CTE class egs on how they used math (66% vs. 41%)
Portfolios contained CTE class egs on how they used science (60% vs. 34%)
*Recommendation—stress that PLTW students must complete 4 yrs of math and at least
14
Recommendation stress that PLTW students must complete 4 yrs of math and at least 3 yrs of college-prep science courses.

SREB 2007 “PLTW Works”SREB 2007 “PLTW Works”SREB 2007 PLTW Works SREB 2007 PLTW Works Study Recommendations Study Recommendations (page 17)(page 17)
“Provide special workshops where PTLW teachers collaborate with mathematics and
science educators to plan lessons for instructing mathematics and science concepts
embedded in career/technical assigned projects g jand problems.”
“Train PLTW teachers to plan lessons using proven instructional strategies that frequently engage students in reading, interpreting and
l i t h i l t i l d itianalyzing technical materials and writing technical reports.”
“Provide materials, workshops and online support to improve the rigor and quality of
mathematics and science instructions within themathematics and science instructions within the high schools participating in PTLW.”
15

Illi i ISBE/PLTW CIlli i ISBE/PLTW CIllinois ISBE/PLTW Course Illinois ISBE/PLTW Course Delivery ModelsDelivery Modelsyy
Perkins/ISBE CTE elective credit fundingApproved plan (note new Pre-Engineering CIP option) which includes Illinois Plan and at least two training level orincludes Illinois Plan and at least two training level or cooperative education coursesTaught by CTE certified/highly qualified teacher (or a Provisional teacher) with 2000 hours paid relevant work experience ) p p
Three High School Credit ModelsTech Ed creditMath/Science elective creditHybrid—mix of elective credits, depending upon teacher qualifications
16
q

Why are these PLTWWhy are these PLTWWhy are these PLTW Why are these PLTW numbers significant?numbers significant?
1957
192121616912612621.020114141454145482/1870/30675
17
67536002007

20072007 0808 E ti t d Illi iE ti t d Illi i20072007--0808 Estimated Illinois Estimated Illinois PLTW HS EnrollmentPLTW HS Enrollment
3600 students : 2.4 X more than 2006-07 (1454)
Includes:-675 IED students in 16 new schools alone;675 IED students in 16 new schools alone; -similar 06-07 enrollment in 07-08 for continuing schools;
-estimated new courses/new student enrollments for continuing schools based on STI teacher surveys and other sources
18

20072007--08 Illinois PLTW Middle08 Illinois PLTW Middle20072007 08 Illinois PLTW Middle 08 Illinois PLTW Middle School GTT School GTT EnrollmentEnrollment
4 of 6 schools reporting:
1414 students involved at this time
Includes school year quarterly units, after y q y ,school, and summer camp formats
19

Contact Info:Brenda Pacey
Illinois PLTW Affiliate DirectorUniversity of Illinois Outreach and Public Service
Steve ParrottIllinois PLTW State Leader
Illinois State Board of Education
Contact Info:
807 S. Wright, Suite 370, MC-307Champaign, IL 61820
217/244-5217 FAX 217/244-3173bpacey@uillinois edu
100 North First StreetSpringfield, IL 62777
217/782-4620 FAX 217/782-0710sparrott@isbe [email protected] [email protected]
Richard GreeneBradley University
1501 W Bradley Ave For Illinois PLTW 1501 W. Bradley Ave.Morgan Hall Room 109B
Peoria, IL 61625309/677-2745 FAX 309/677-2853
For Illinois PLTW news and updates, visit:www.pltw.illinois.edu
20