the nutrition requirements and dietary replacement of fish ... · maggot meal maggot meal is...
TRANSCRIPT

The nutrition requirements and dietary
replacement of fish meal for white
shrimp, Litopenaeus vannamei
by
Dr. Shyn Shin Sheen
National Taiwan Ocean University,
Department of Aquaculture
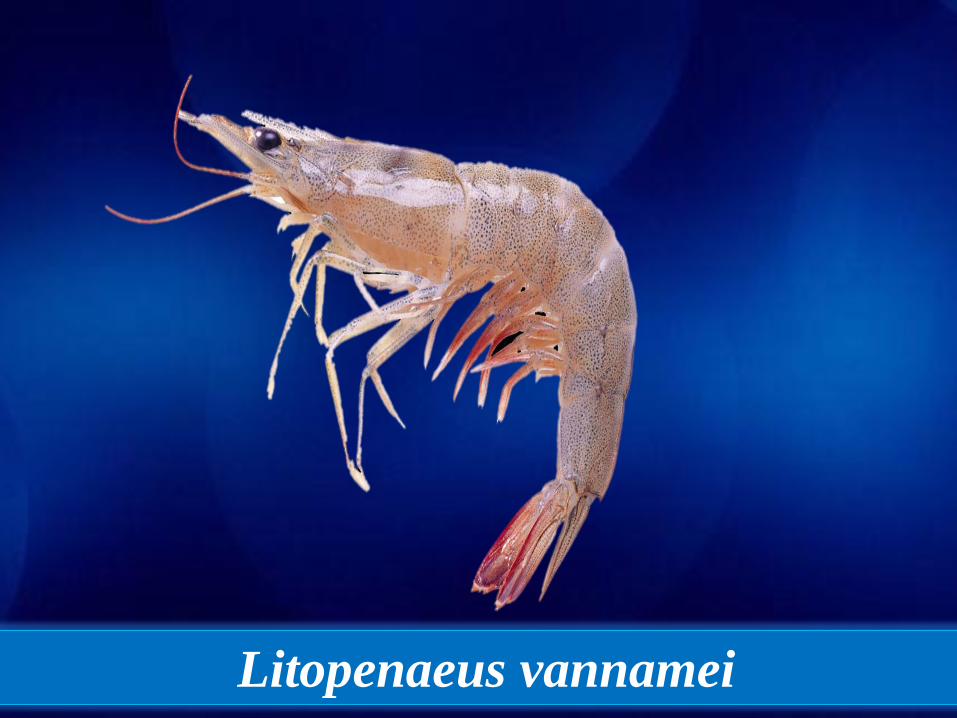
Litopenaeus vannamei
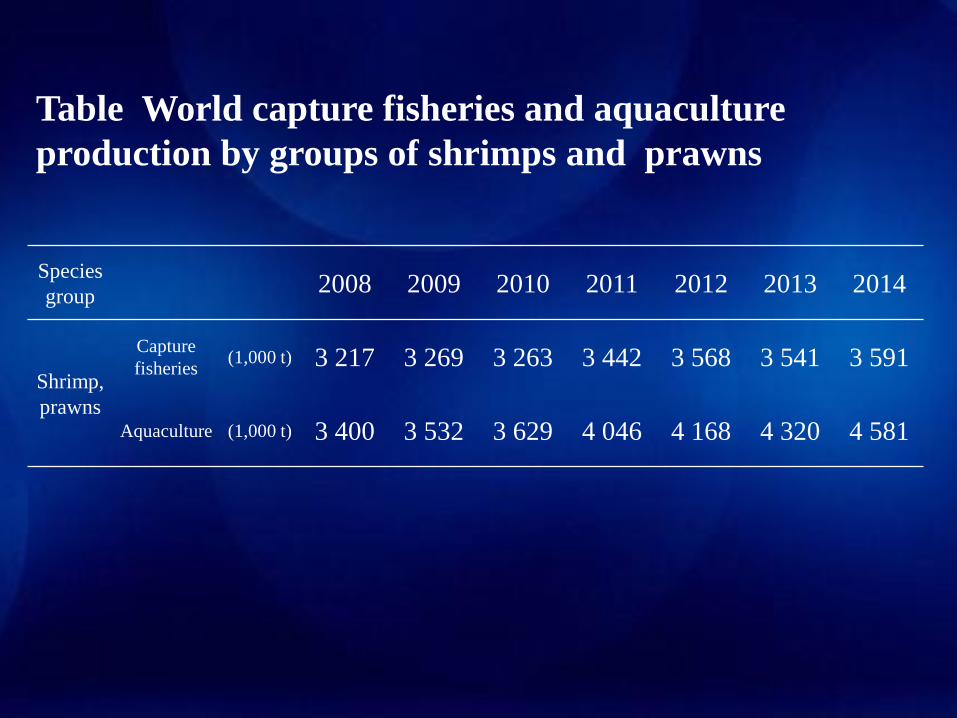
Table World capture fisheries and aquaculture
production by groups of shrimps and prawns
Species
group2008 2009 2010 2011 2012 2013 2014
Shrimp,
prawns
Capture
fisheries(1,000 t) 3 217 3 269 3 263 3 442 3 568 3 541 3 591
Aquaculture (1,000 t) 3 400 3 532 3 629 4 046 4 168 4 320 4 581

L.
vannamei2006 2007 2008 2009 2010 2011 2012 2013 2014
Q 2 161 008 2 352 245 2 304 558 2 444 776 2 688 233 3 089 293 3 238 382 3 289 317 3 668 682
V 7 798 553 8 880 377 9 332 910 9 756 183 11 330 689 14 032 420 14 596 120 16 856 172 18 459 842
Q=tV=USD 1 000
Table World aquaculture production of Litopenaeus vannamei
0
500000
1000000
1500000
2000000
2500000
3000000
3500000
4000000
2006 2007 2008 2009 2010 2011 2012 2013 2014
Aq
uac
ult
ure
pro
du
ctio
n (
t)
Year
World aquaculture production of L. vannamei
0
2000000
4000000
6000000
8000000
10000000
12000000
14000000
16000000
18000000
20000000
2006 2007 2008 2009 2010 2011 2012 2013 2014
Val
ue
(U
SD 1
00
0)
Year
Estimated value of L. vannamei
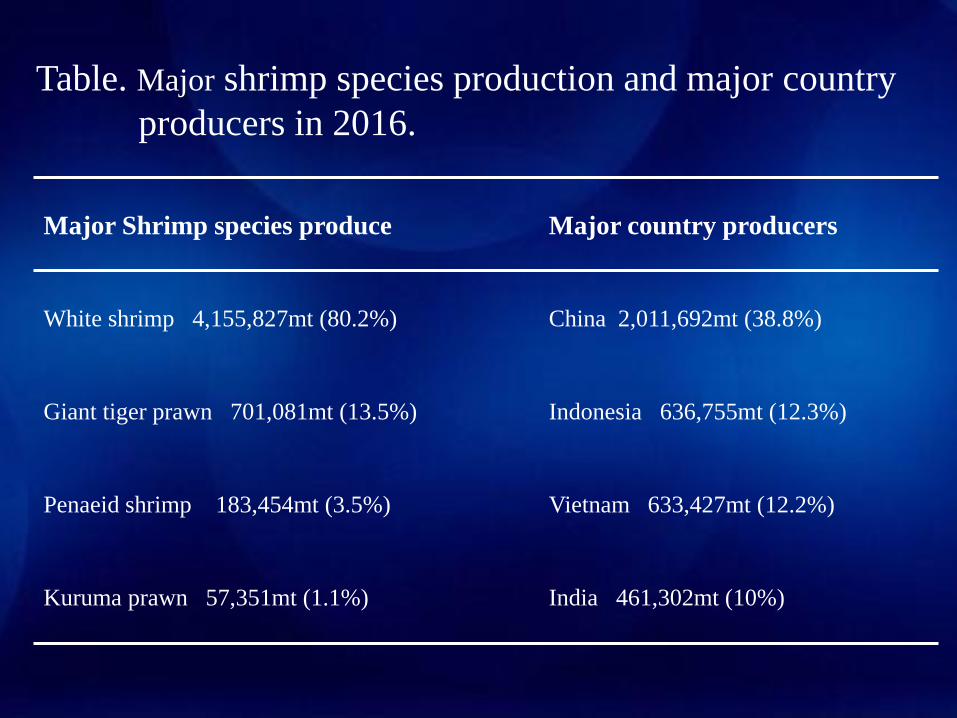
Major Shrimp species produce Major country producers
White shrimp 4,155,827mt (80.2%) China 2,011,692mt (38.8%)
Giant tiger prawn 701,081mt (13.5%) Indonesia 636,755mt (12.3%)
Penaeid shrimp 183,454mt (3.5%) Vietnam 633,427mt (12.2%)
Kuruma prawn 57,351mt (1.1%) India 461,302mt (10%)
Table. Major shrimp species production and major country
producers in 2016.
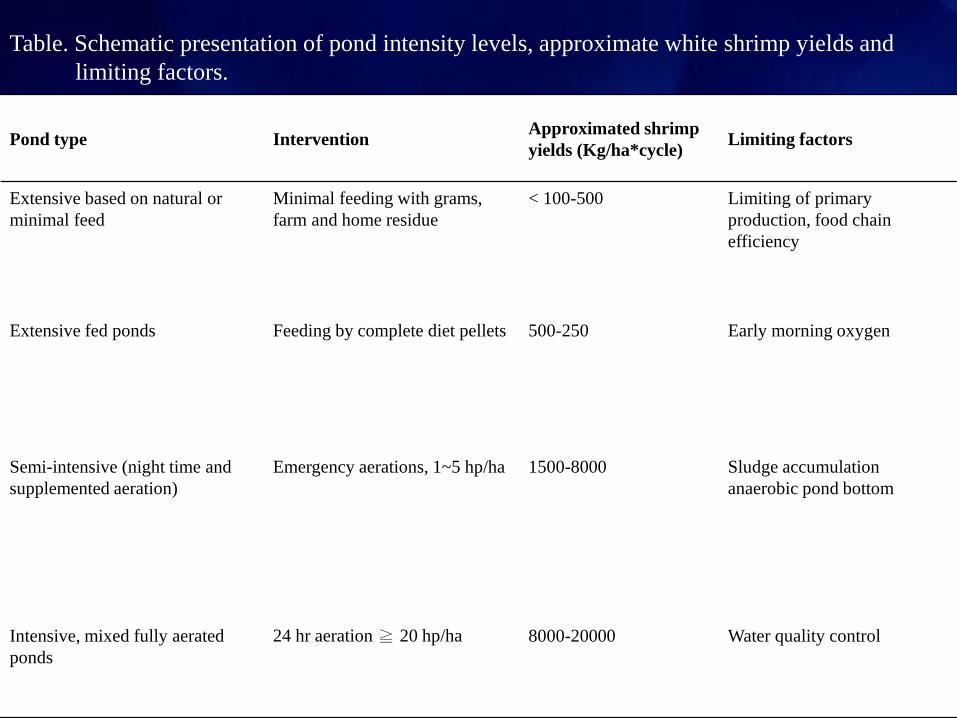
Table. Schematic presentation of pond intensity levels, approximate white shrimp yields and
limiting factors.
Pond type InterventionApproximated shrimp
yields (Kg/ha*cycle)Limiting factors
Extensive based on natural or
minimal feed
Minimal feeding with grams,
farm and home residue
< 100-500 Limiting of primary
production, food chain
efficiency
Extensive fed ponds Feeding by complete diet pellets 500-250 Early morning oxygen
Semi-intensive (night time and
supplemented aeration)
Emergency aerations, 1~5 hp/ha 1500-8000 Sludge accumulation
anaerobic pond bottom
Intensive, mixed fully aerated
ponds
24 hr aeration ≧ 20 hp/ha 8000-20000 Water quality control
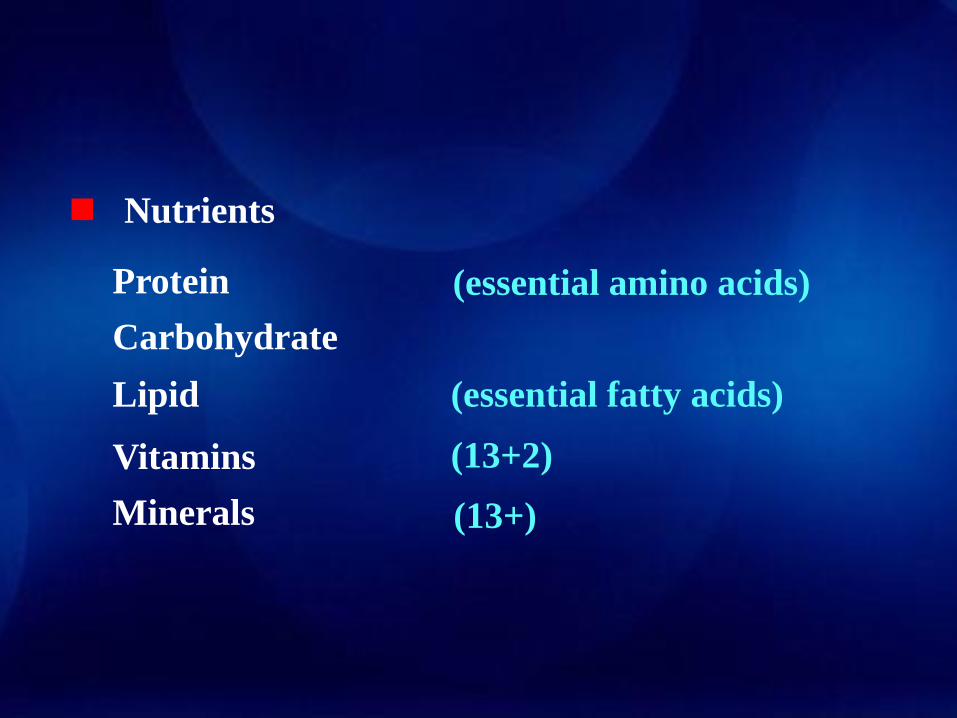
Protein
Carbohydrate
Lipid
Vitamins
Minerals
(essential fatty acids)
(13+2)
(essential amino acids)
(13+)
◼ Nutrients

Establishing nutrient requirements
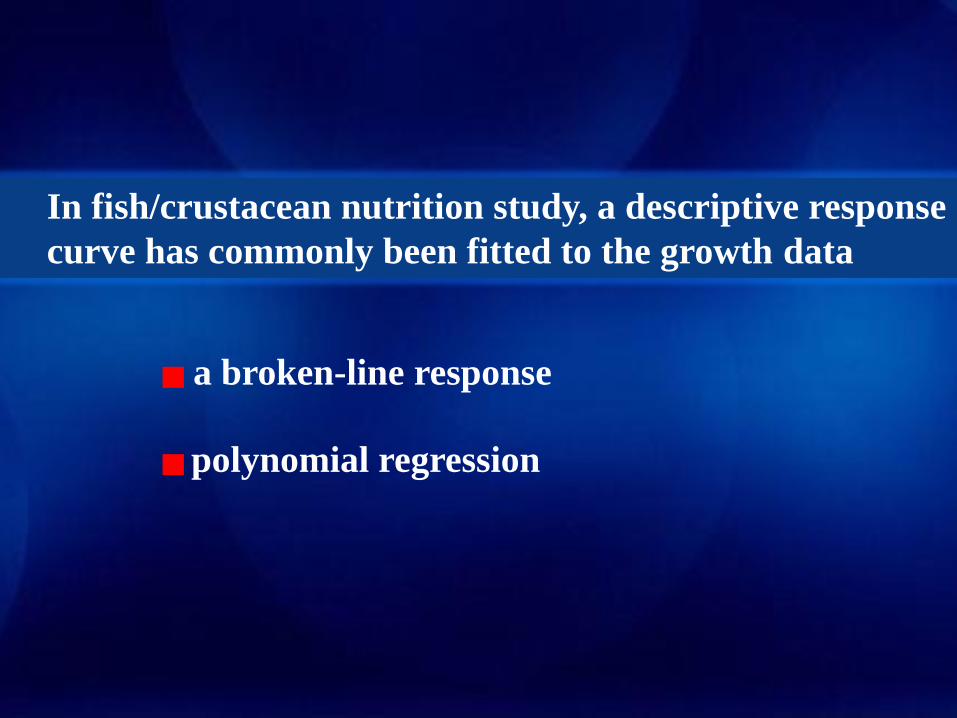
■ a broken-line response
■polynomial regression
In fish/crustacean nutrition study, a descriptive response
curve has commonly been fitted to the growth data
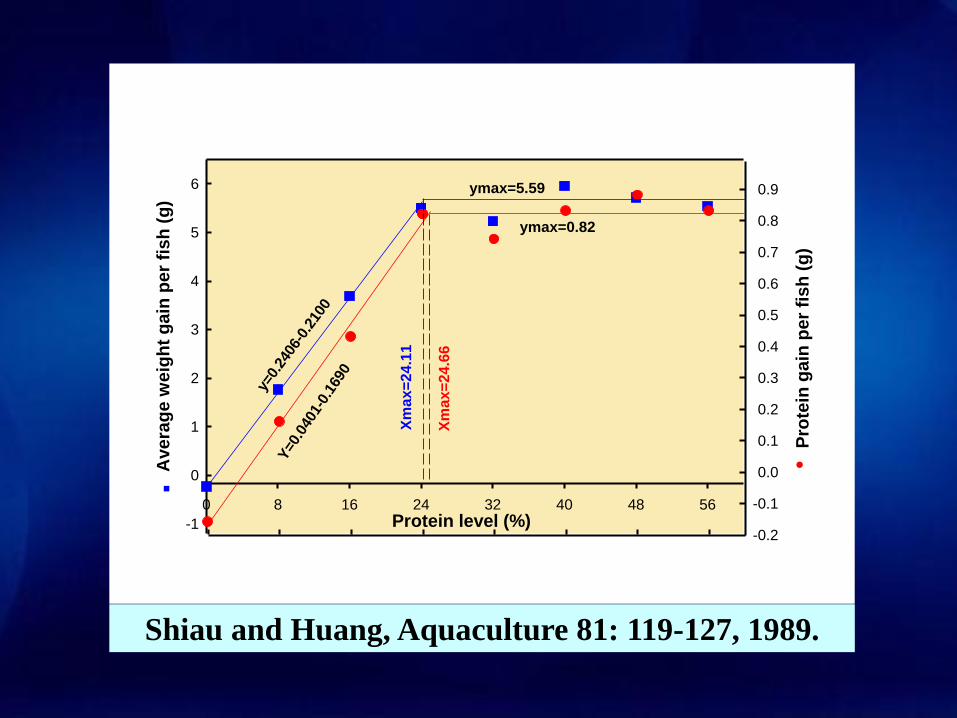
Shiau and Huang, Aquaculture 81: 119-127, 1989.
Protein level (%)0 8 16 24 32 40 48 56
■ A
vera
ge w
eig
ht
gain
per
fish
(g
)
-1
0
1
2
3
4
5
6
Pro
tein
gain
per
fish
(g
)
-0.2
-0.1
0.0
0.1
0.2
0.3
0.4
0.5
0.6
0.7
0.8
0.9ymax=5.59
ymax=0.82
y=0.
2406
-0.2
100
Y=0.
0401
-0.1
690
Xm
ax=
24.1
1
Xm
ax=
24.6
6
●
Choline chloride concentration (mg/kg diet)
0 500 1000 1500 2000 2500
We
igh
t g
ain
perc
en
t
200
400
600
800
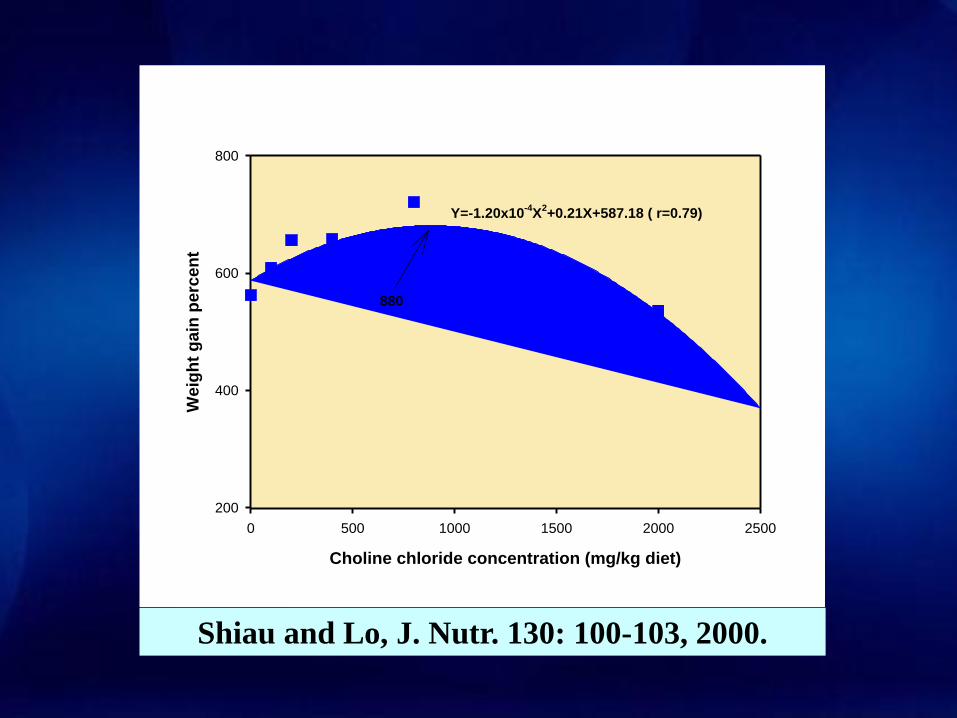
Y=-1.20x10-4
X2+0.21X+587.18 ( r=0.79)
880
Shiau and Lo, J. Nutr. 130: 100-103, 2000.

Protein requirements
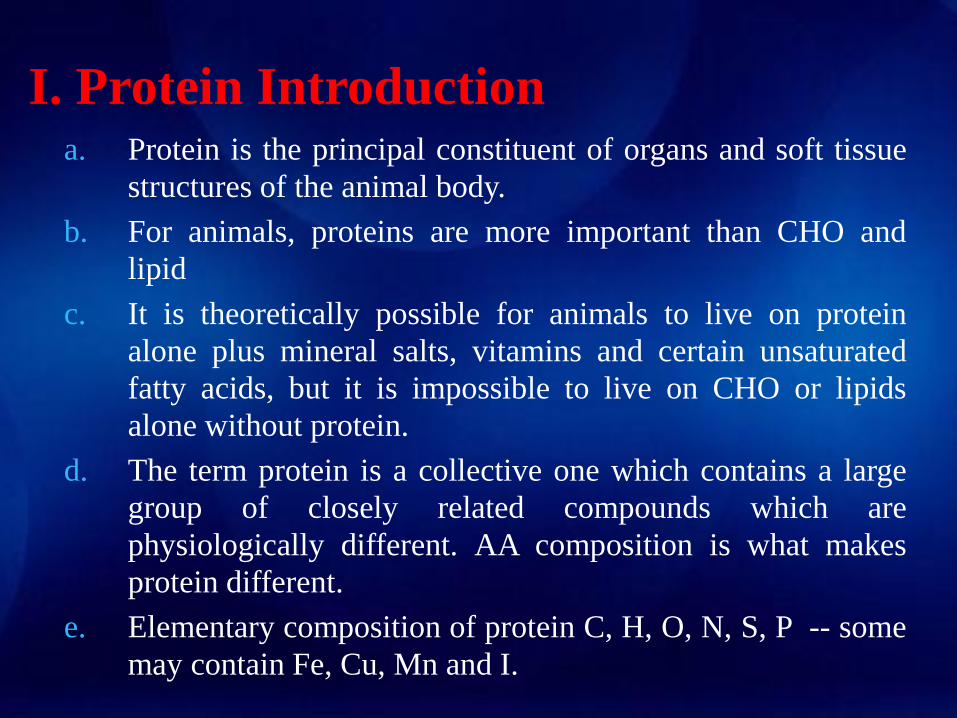
I. Protein Introductiona. Protein is the principal constituent of organs and soft tissue
structures of the animal body.
b. For animals, proteins are more important than CHO and
lipid
c. It is theoretically possible for animals to live on protein
alone plus mineral salts, vitamins and certain unsaturated
fatty acids, but it is impossible to live on CHO or lipids
alone without protein.
d. The term protein is a collective one which contains a large
group of closely related compounds which are
physiologically different. AA composition is what makes
protein different.
e. Elementary composition of protein C, H, O, N, S, P -- some
may contain Fe, Cu, Mn and I.
II. Amino acids
Amino acids are the hydrolytic end
products of protein digestion. They are
building stones of body proteins. Only
difference between thousands of proteins
is the combination of AA’s. If protein is
boiled with acid or treated by enzymes, it
is hydrolyzed toAA’s.
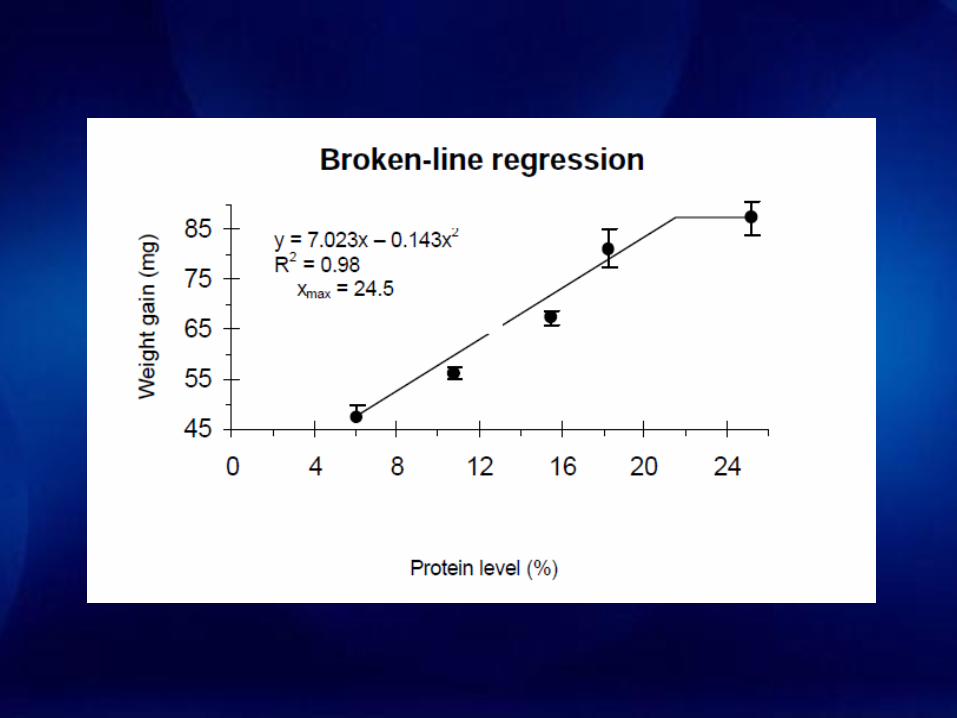
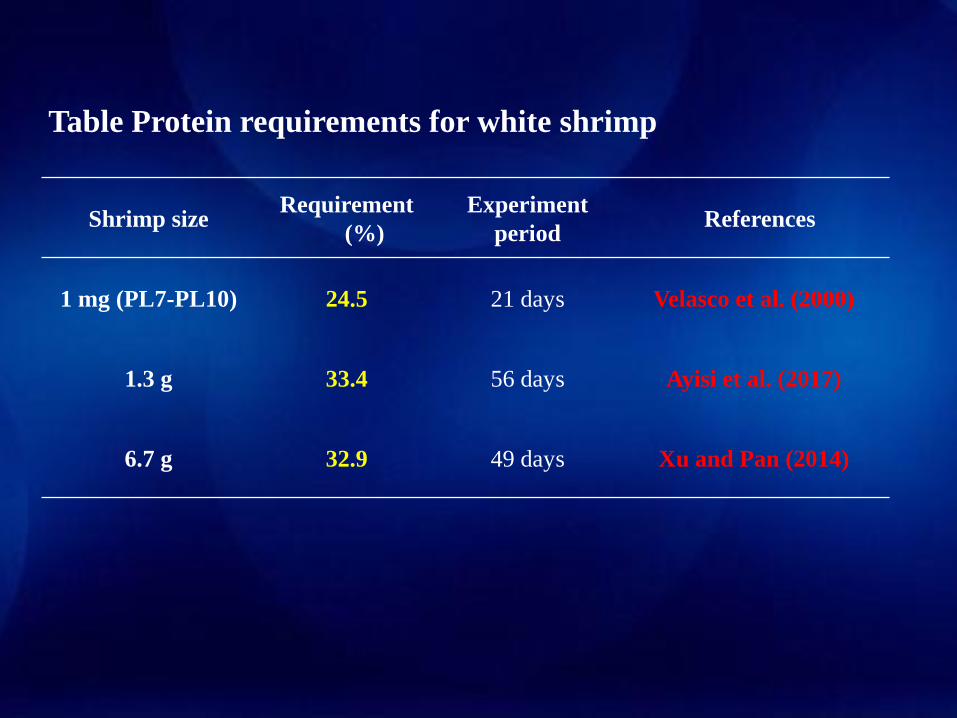
Table Protein requirements for white shrimp
Shrimp size Requirement
(%)
Experiment
periodReferences
1 mg (PL7-PL10) 24.5 21 days Velasco et al. (2000)
1.3 g 33.4 56 days Ayisi et al. (2017)
6.7 g 32.9 49 days Xu and Pan (2014)
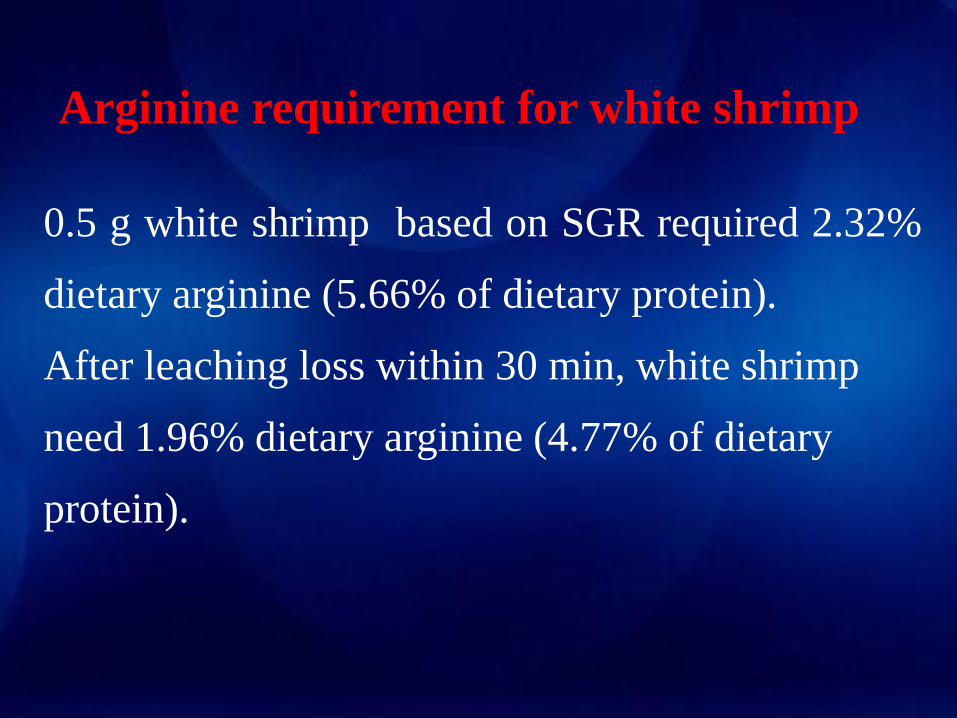
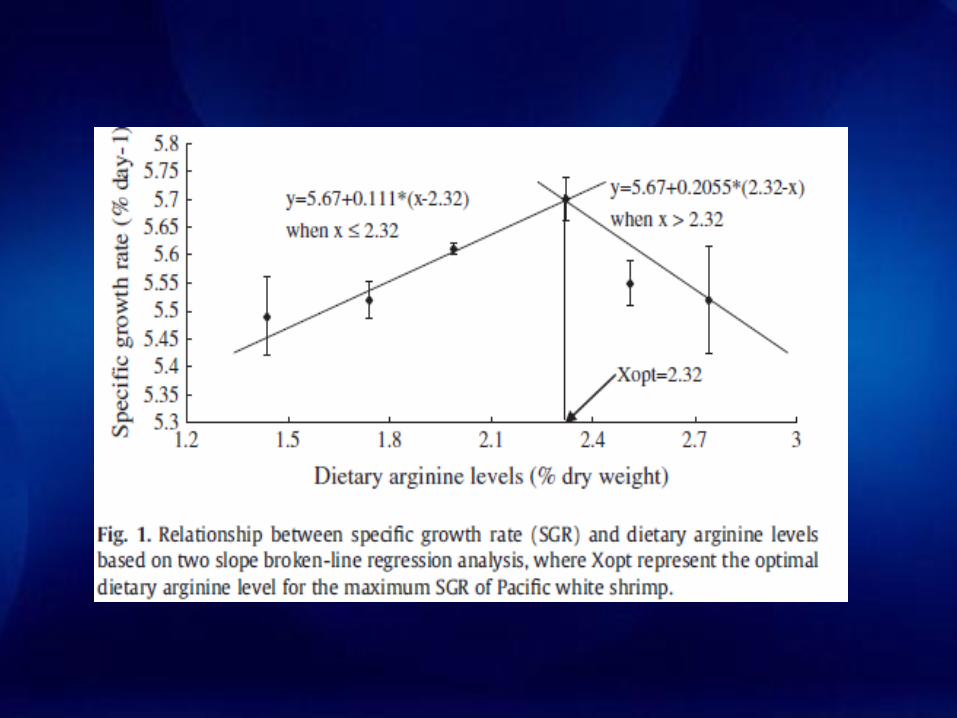
Arginine requirement for white shrimp
0.5 g white shrimp based on SGR required 2.32%
dietary arginine (5.66% of dietary protein).
After leaching loss within 30 min, white shrimp
need 1.96% dietary arginine (4.77% of dietary
protein).

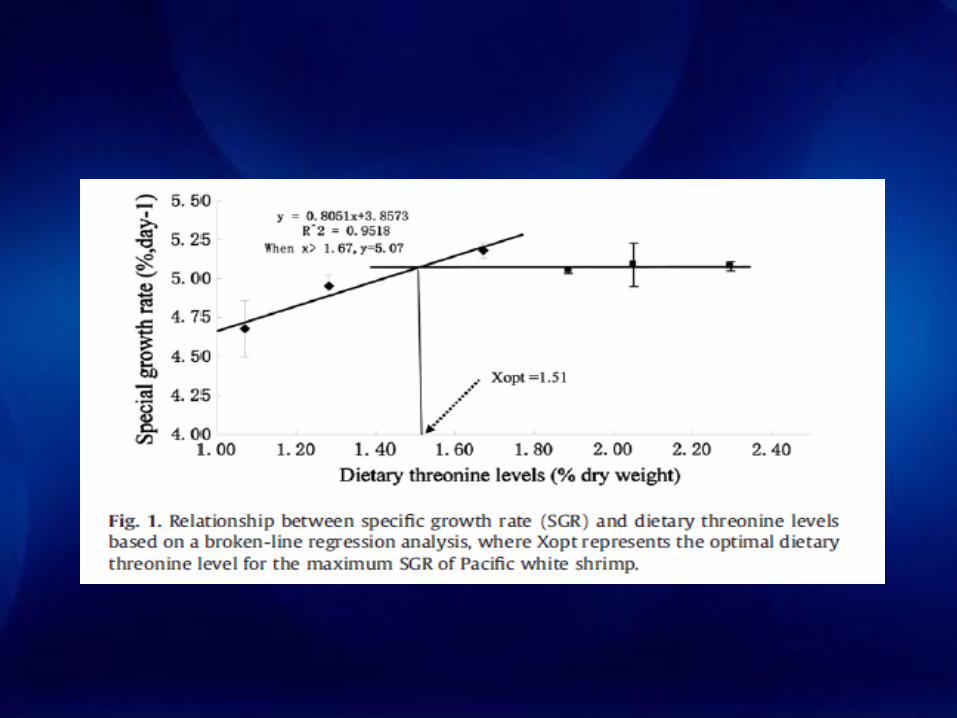
Threonine requirement for white shrimp
0.53 g shrimp based on SGR require 1.51% dietary threonine (3.53% of dietary protein).
After leaching loss within 30 min, 1.18% dietary threonine (2.81% of dietary protein).
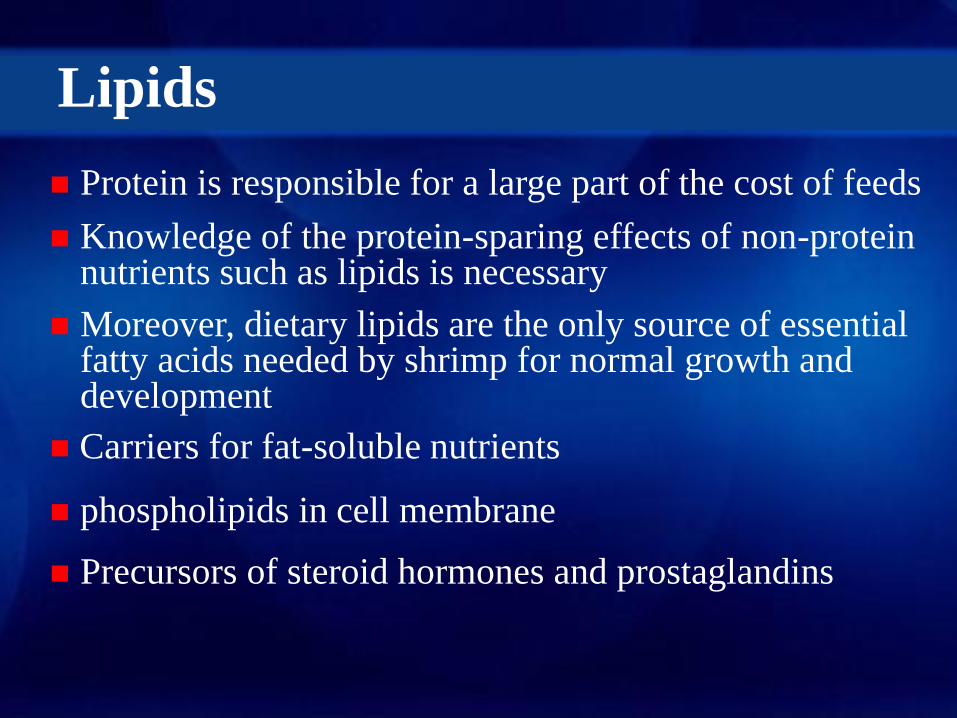
Lipids
◼ Protein is responsible for a large part of the cost of feeds
◼ Knowledge of the protein-sparing effects of non-protein nutrients such as lipids is necessary
◼ Moreover, dietary lipids are the only source of essential fatty acids needed by shrimp for normal growth and development
◼ Carriers for fat-soluble nutrients
◼ phospholipids in cell membrane
◼ Precursors of steroid hormones and prostaglandins
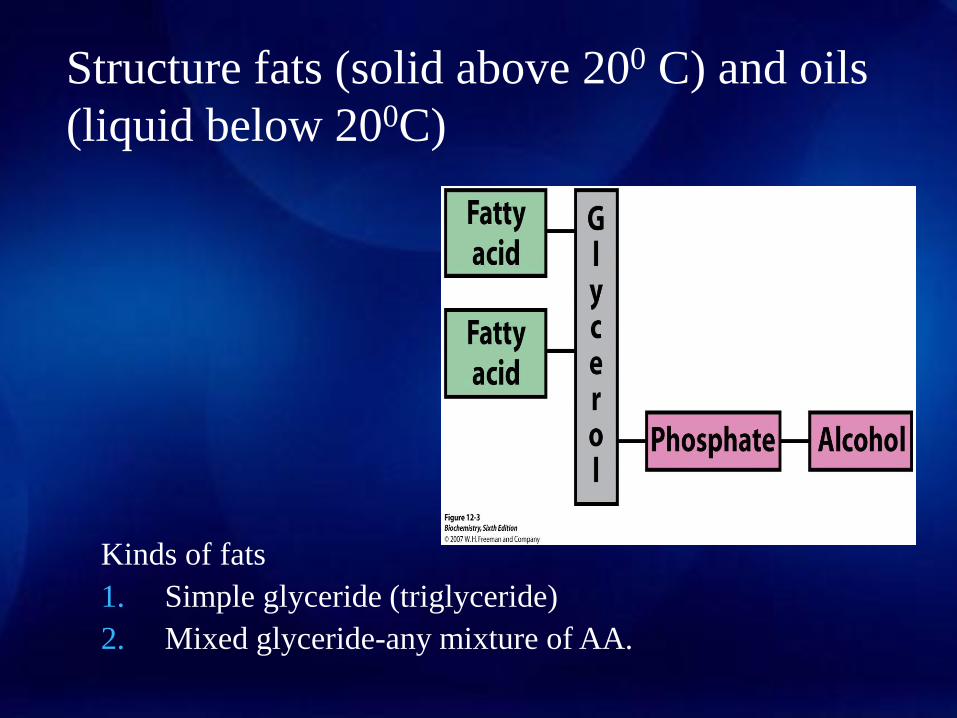
Structure fats (solid above 200 C) and oils
(liquid below 200C)
Kinds of fats
1. Simple glyceride (triglyceride)
2. Mixed glyceride-any mixture of AA.
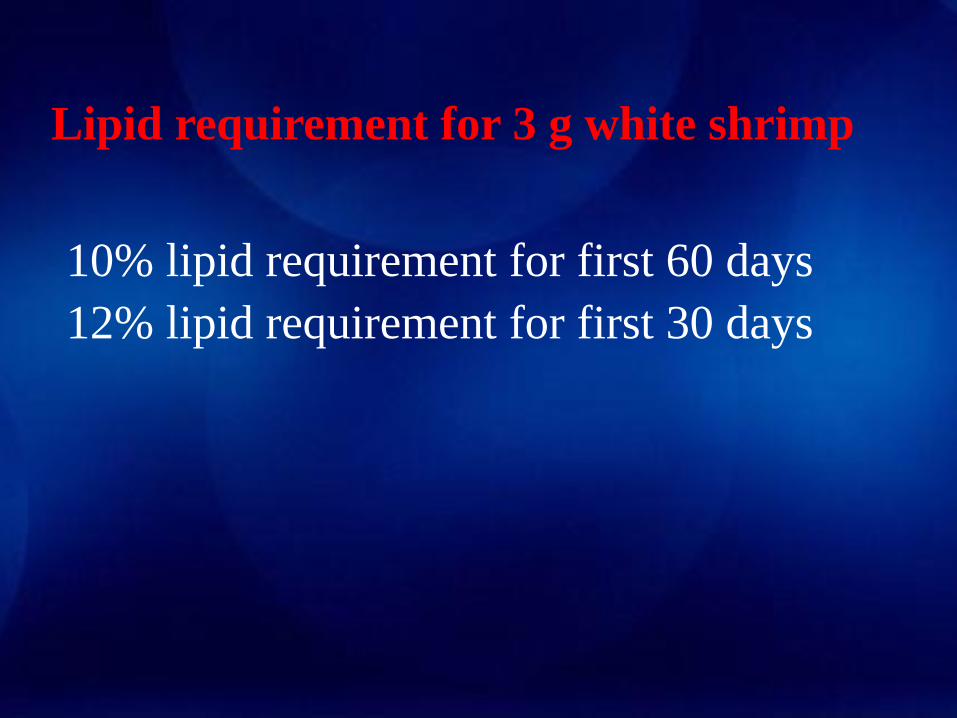
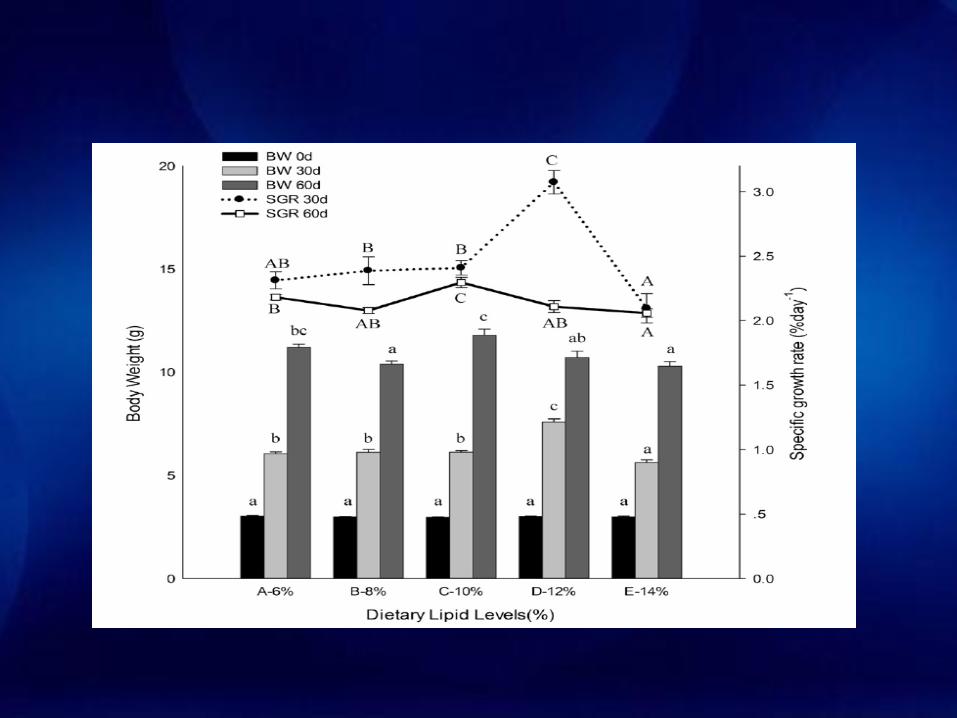
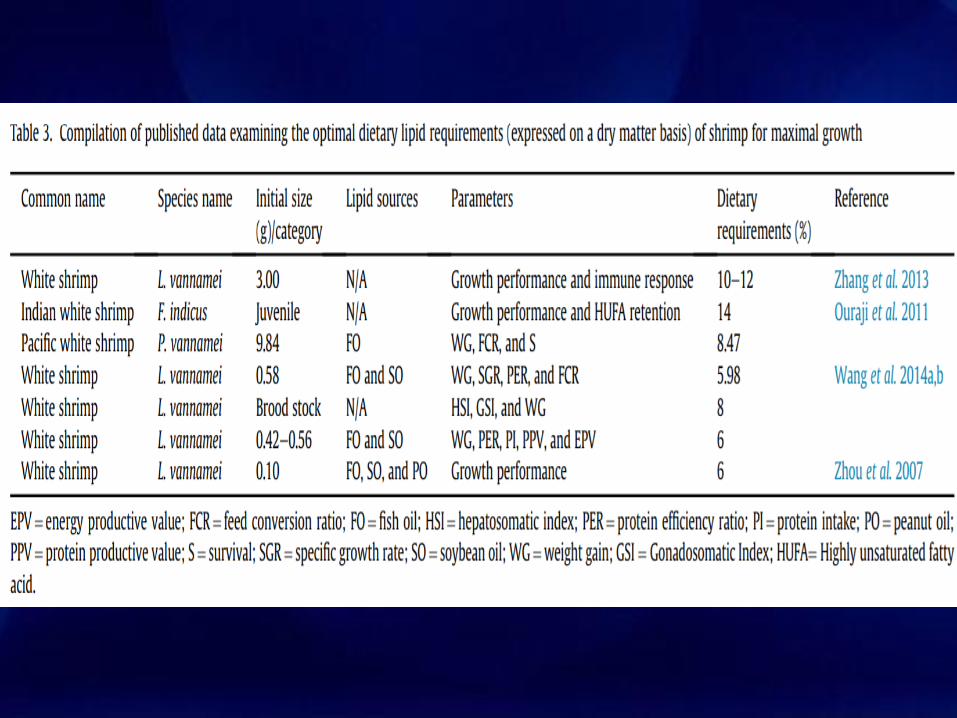
Lipid requirement for 3 g white shrimp
10% lipid requirement for first 60 days
12% lipid requirement for first 30 days
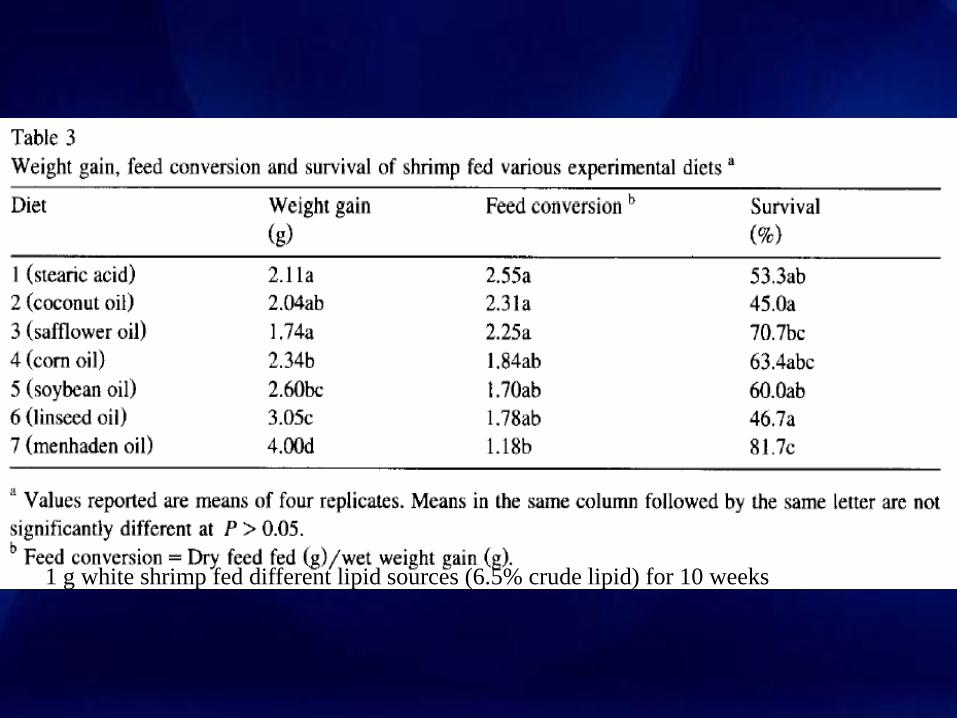
1 g white shrimp fed different lipid sources (6.5% crude lipid) for 10 weeks
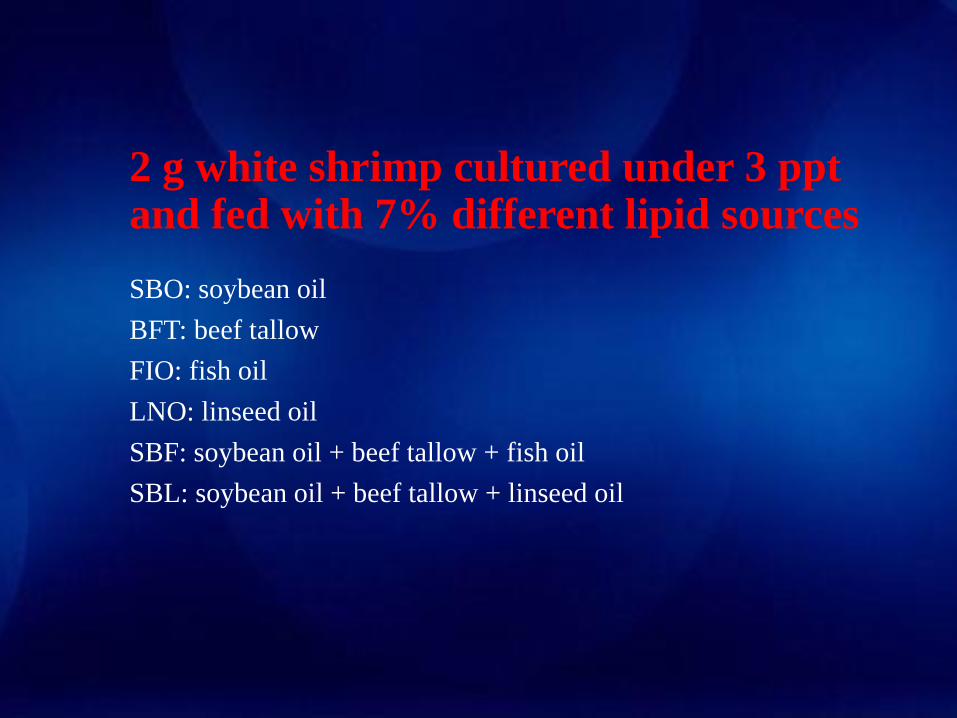
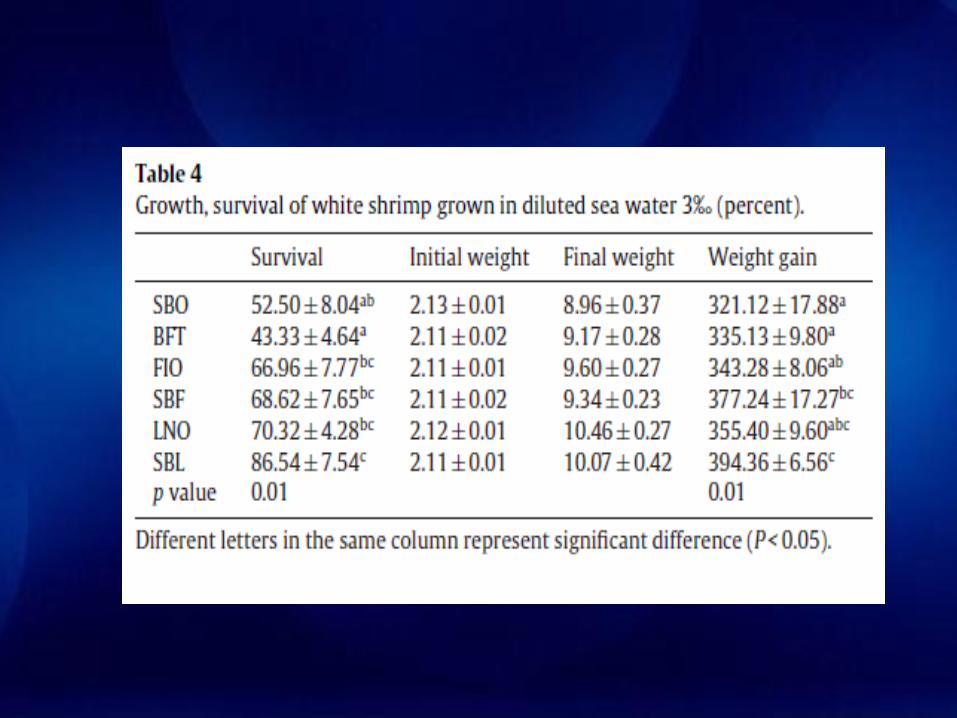
2 g white shrimp cultured under 3 pptand fed with 7% different lipid sources
SBO: soybean oil
BFT: beef tallow
FIO: fish oil
LNO: linseed oil
SBF: soybean oil + beef tallow + fish oil
SBL: soybean oil + beef tallow + linseed oil
Vitamins


Minerals
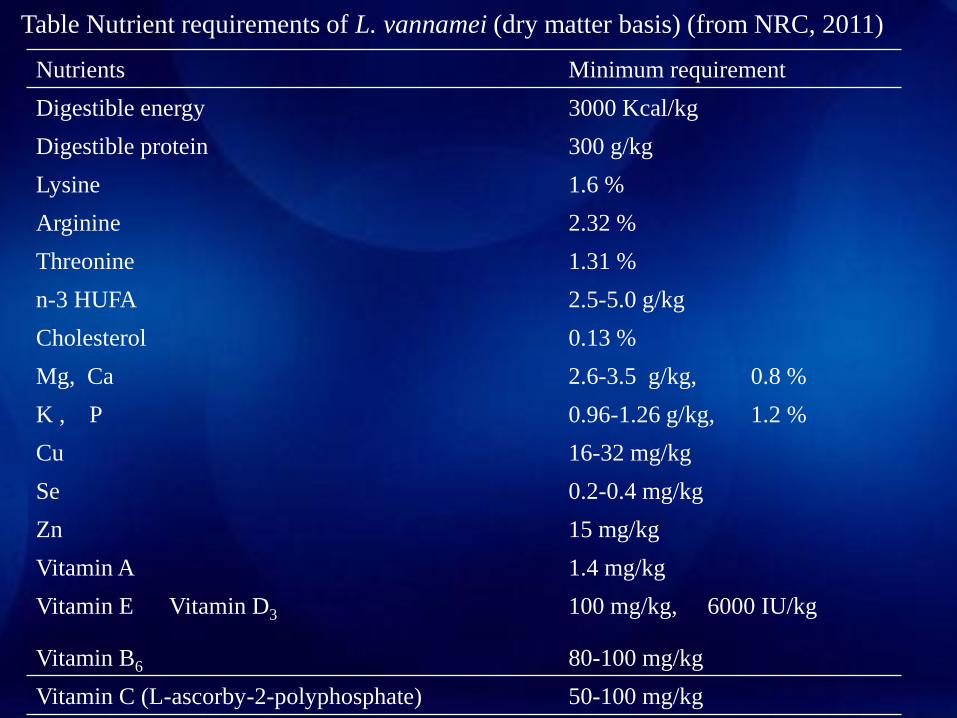
Table Nutrient requirements of L. vannamei (dry matter basis) (from NRC, 2011)
Nutrients Minimum requirement
Digestible energy 3000 Kcal/kg
Digestible protein 300 g/kg
Lysine 1.6 %
Arginine 2.32 %
Threonine 1.31 %
n-3 HUFA 2.5-5.0 g/kg
Cholesterol 0.13 %
Mg, Ca 2.6-3.5 g/kg, 0.8 %
K , P 0.96-1.26 g/kg, 1.2 %
Cu 16-32 mg/kg
Se 0.2-0.4 mg/kg
Zn 15 mg/kg
Vitamin A 1.4 mg/kg
Vitamin E Vitamin D3 100 mg/kg, 6000 IU/kg
Vitamin B6 80-100 mg/kg
Vitamin C (L-ascorby-2-polyphosphate) 50-100 mg/kg
Dietary ingredients
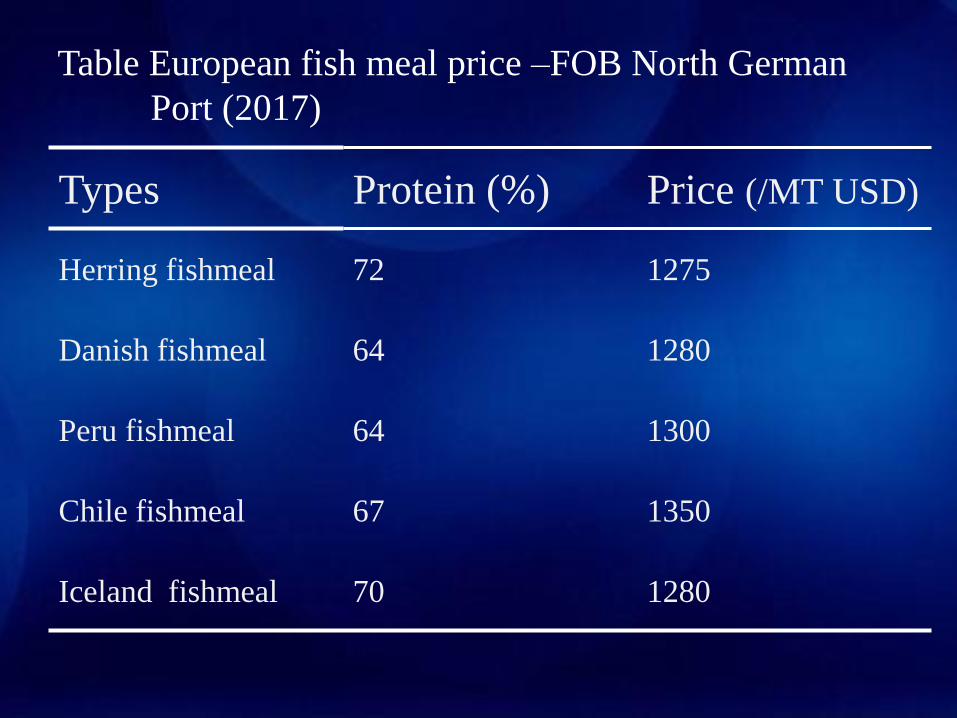
Table European fish meal price –FOB North German
Port (2017)
Types Protein (%) Price (/MT USD)
Herring fishmeal 72 1275
Danish fishmeal 64 1280
Peru fishmeal 64 1300
Chile fishmeal 67 1350
Iceland fishmeal 70 1280
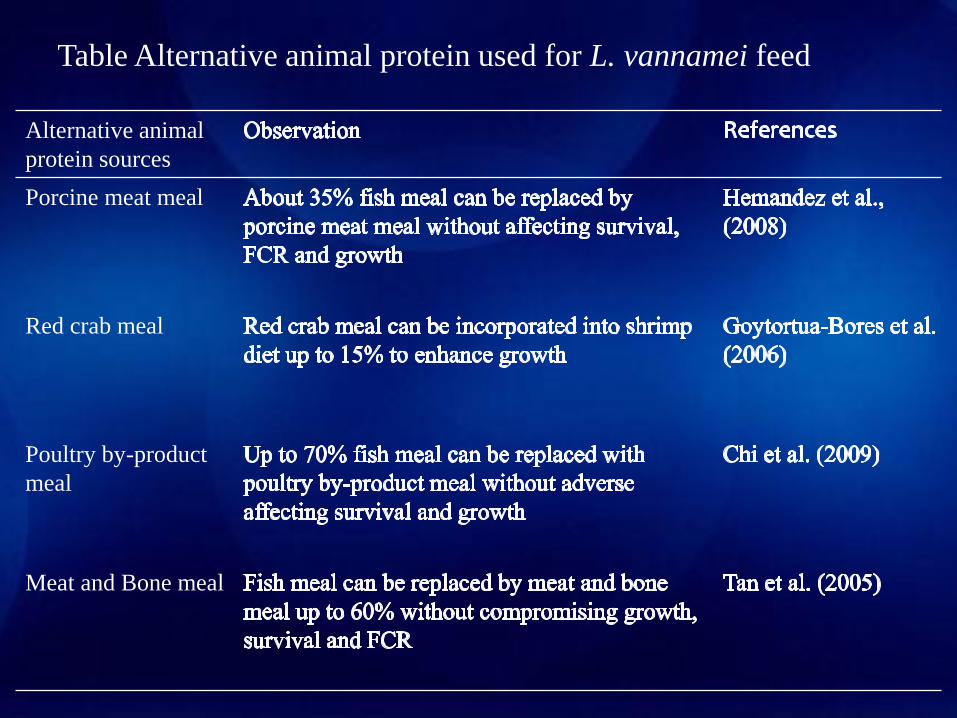
Table Alternative animal protein used for L. vannamei feed
Alternative animal
protein sources
Porcine meat meal
Red crab meal
Poultry by-product
meal
Meat and Bone meal
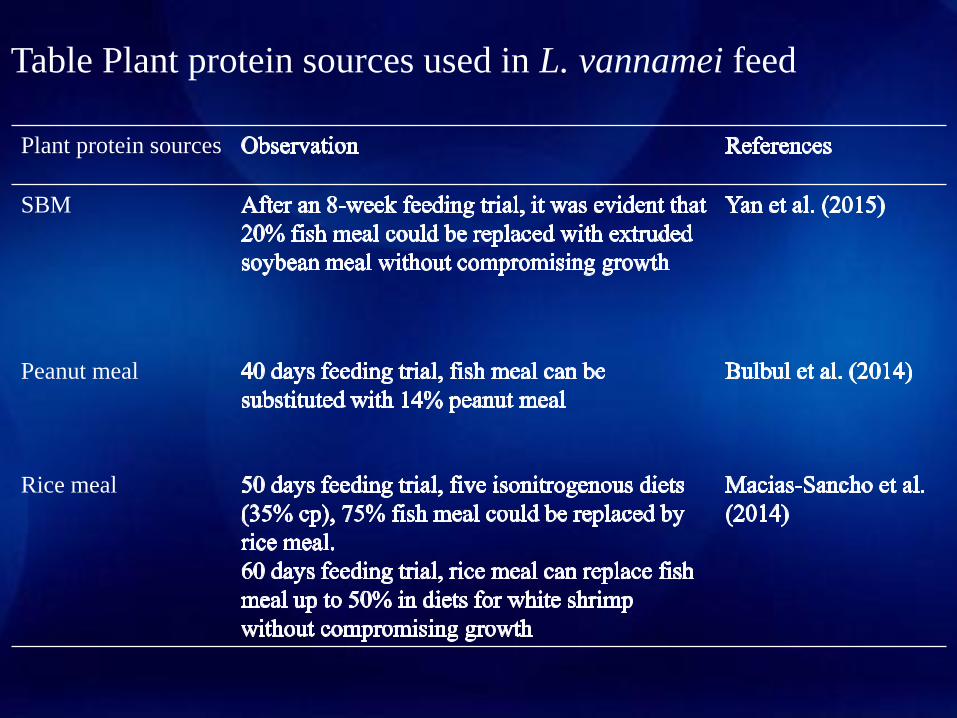
Table Plant protein sources used in L. vannamei feed
Plant protein sources
SBM
Peanut meal
Rice meal
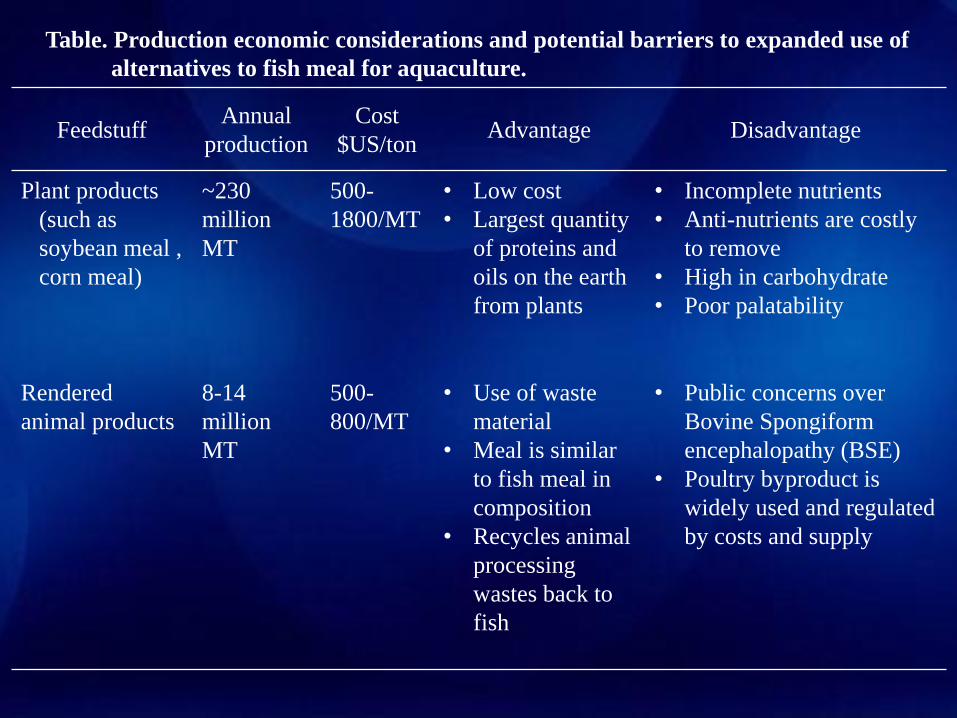
FeedstuffAnnual
production
Cost
$US/tonAdvantage Disadvantage
Plant products
(such as
soybean meal ,
corn meal)
~230
million
MT
500-
1800/MT
• Low cost
• Largest quantity
of proteins and
oils on the earth
from plants
• Incomplete nutrients
• Anti-nutrients are costly
to remove
• High in carbohydrate
• Poor palatability
Rendered
animal products
8-14
million
MT
500-
800/MT
• Use of waste
material
• Meal is similar
to fish meal in
composition
• Recycles animal
processing
wastes back to
fish
• Public concerns over
Bovine Spongiform
encephalopathy (BSE)
• Poultry byproduct is
widely used and regulated
by costs and supply
Table. Production economic considerations and potential barriers to expanded use of
alternatives to fish meal for aquaculture.
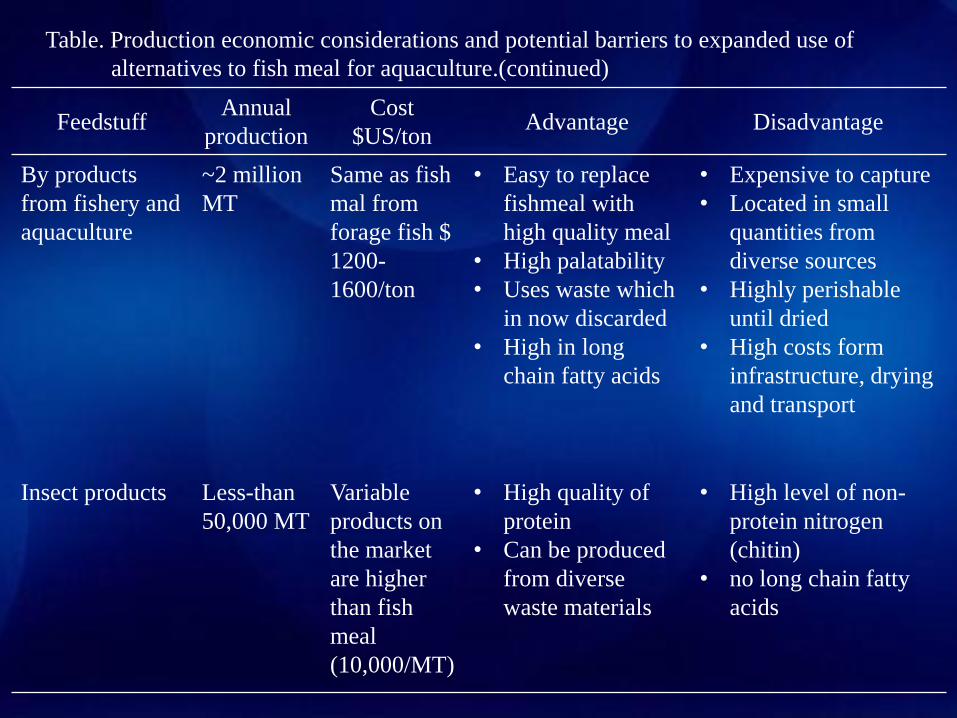
FeedstuffAnnual
production
Cost
$US/tonAdvantage Disadvantage
By products
from fishery and
aquaculture
~2 million
MT
Same as fish
mal from
forage fish $
1200-
1600/ton
• Easy to replace
fishmeal with
high quality meal
• High palatability
• Uses waste which
in now discarded
• High in long
chain fatty acids
• Expensive to capture
• Located in small
quantities from
diverse sources
• Highly perishable
until dried
• High costs form
infrastructure, drying
and transport
Insect products Less-than
50,000 MT
Variable
products on
the market
are higher
than fish
meal
(10,000/MT)
• High quality of
protein
• Can be produced
from diverse
waste materials
• High level of non-
protein nitrogen
(chitin)
• no long chain fatty
acids
Table. Production economic considerations and potential barriers to expanded use of
alternatives to fish meal for aquaculture.(continued)
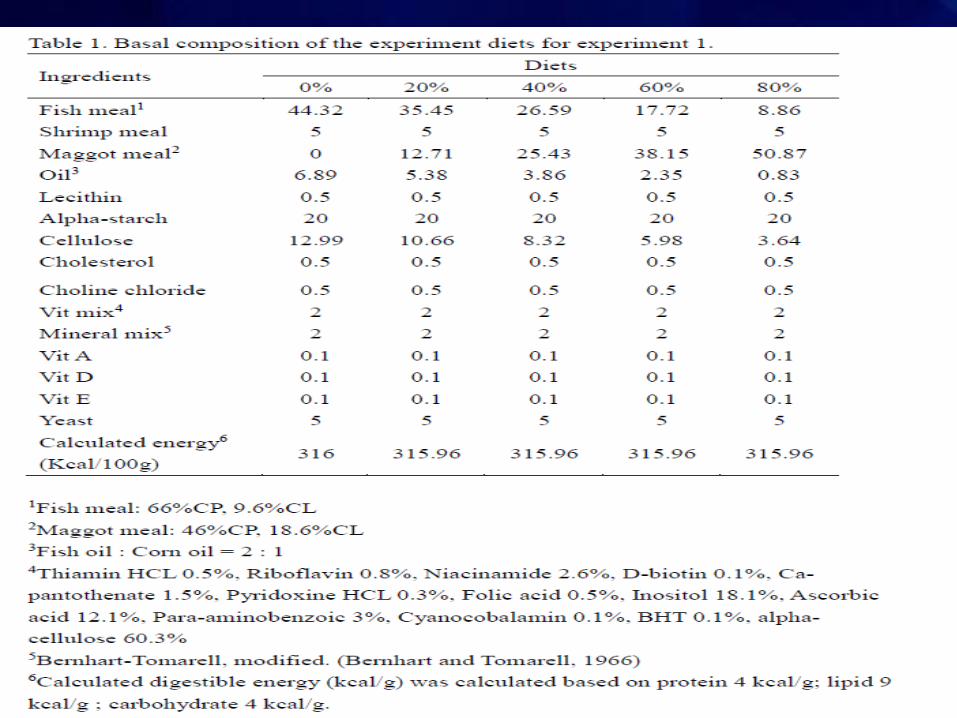
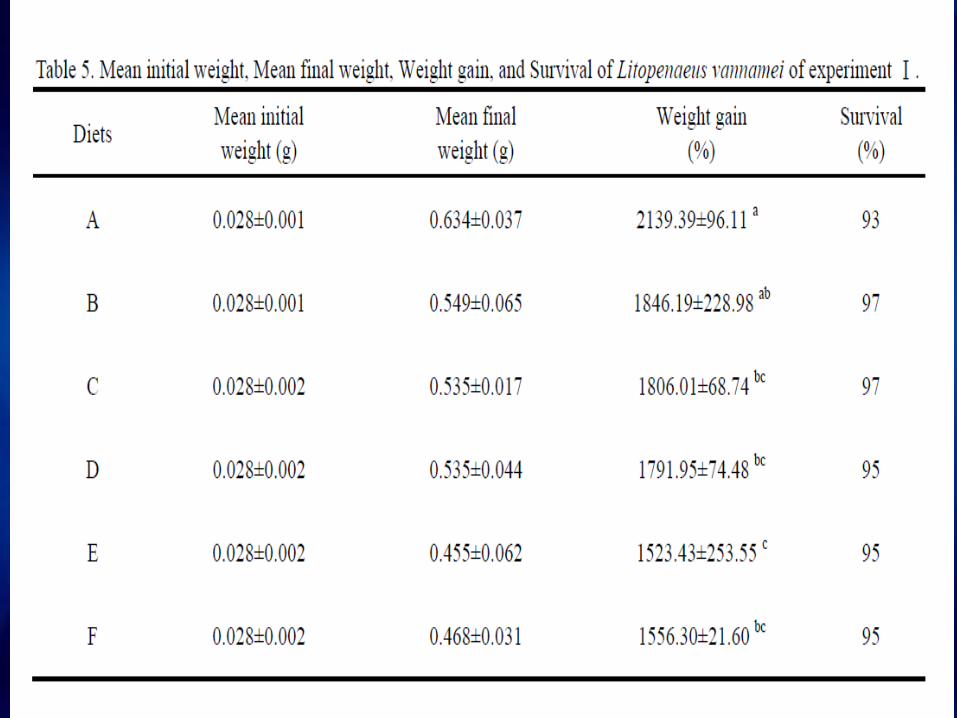
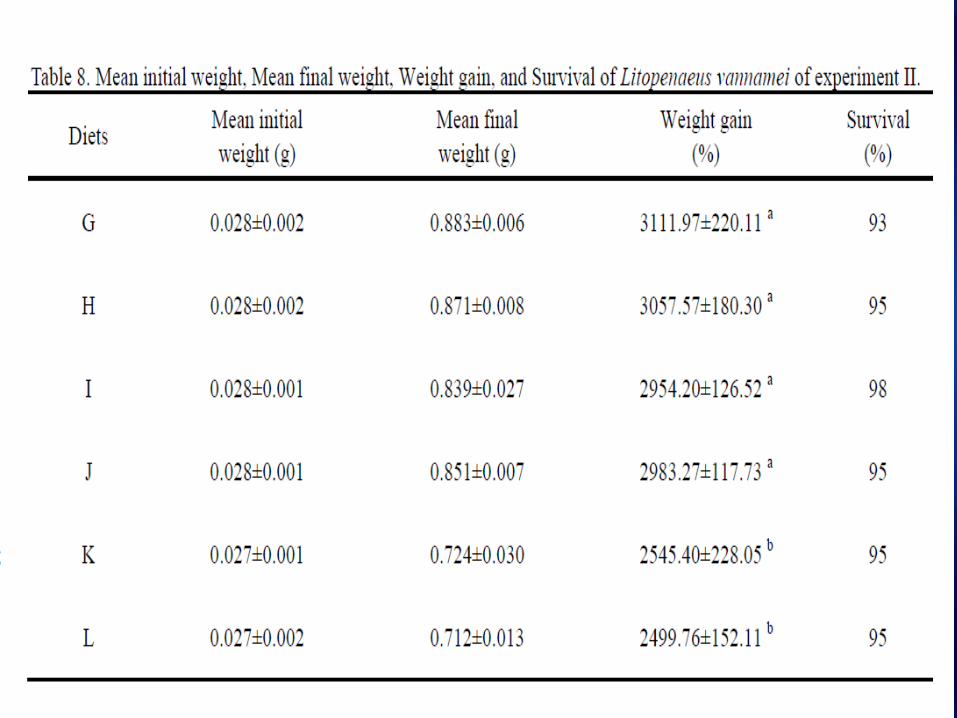
The replacement of fish meal with
alternative ingredients
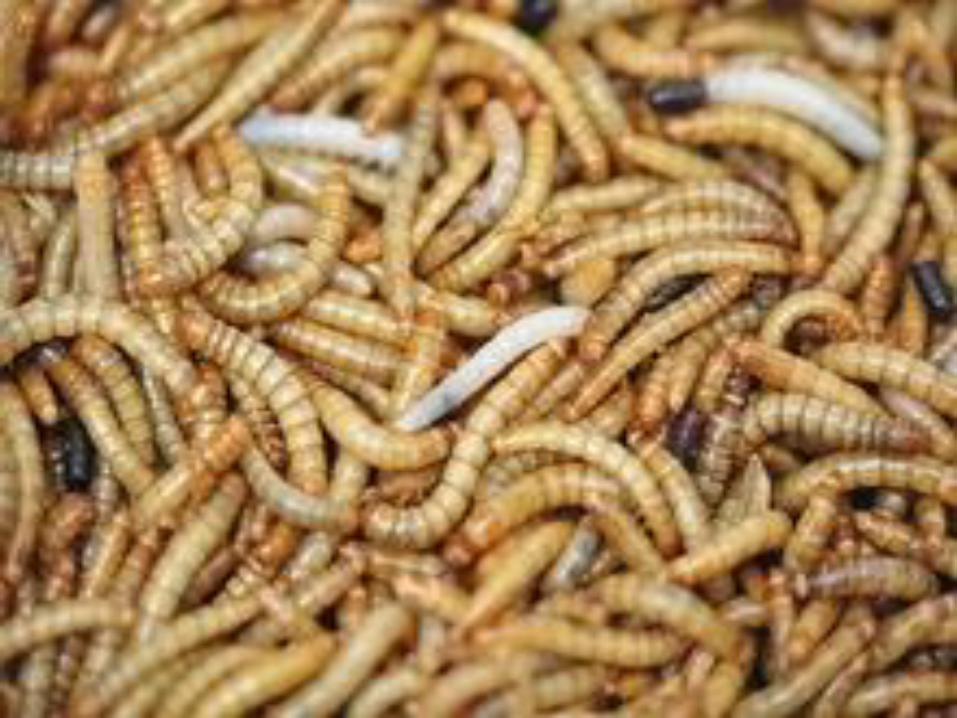
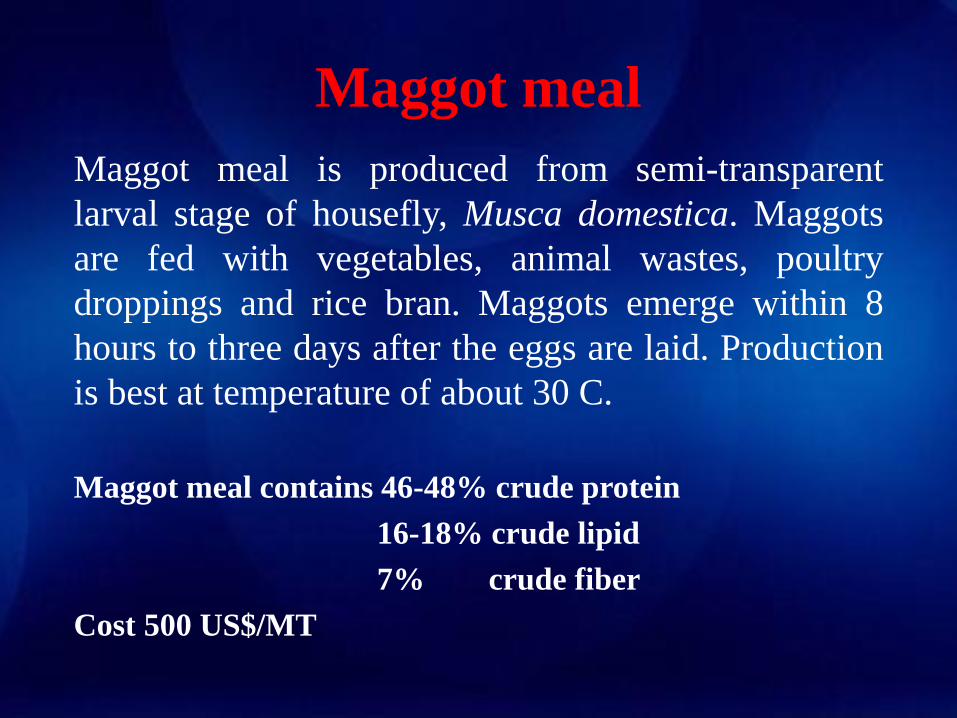
Maggot meal
Maggot meal is produced from semi-transparent
larval stage of housefly, Musca domestica. Maggots
are fed with vegetables, animal wastes, poultry
droppings and rice bran. Maggots emerge within 8
hours to three days after the eggs are laid. Production
is best at temperature of about 30 C.
Maggot meal contains 46-48% crude protein
16-18% crude lipid
7% crude fiber
Cost 500 US$/MT


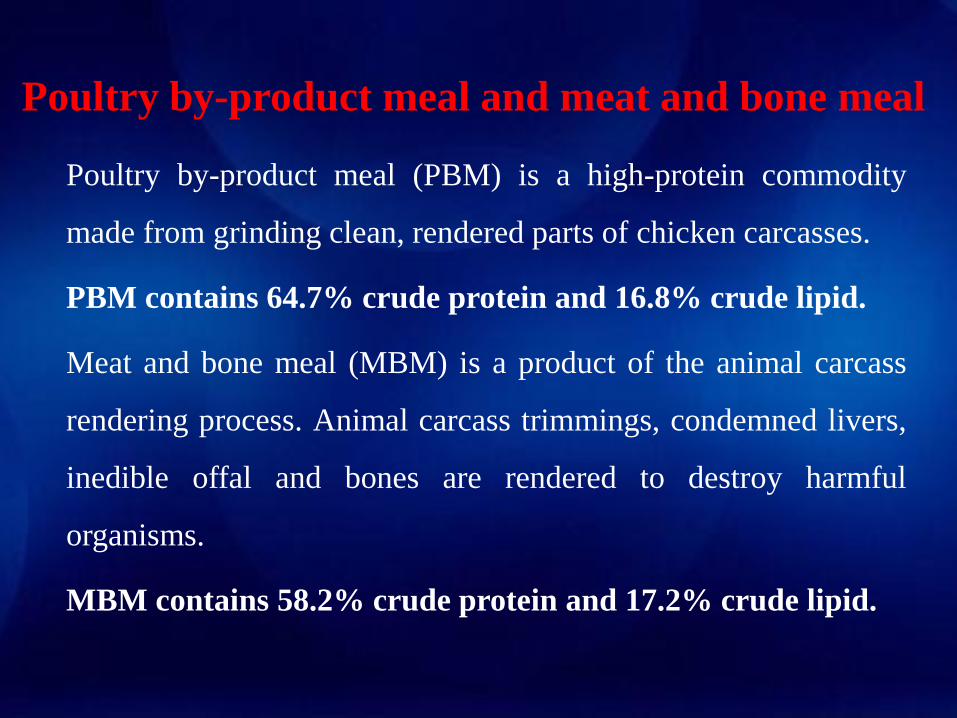
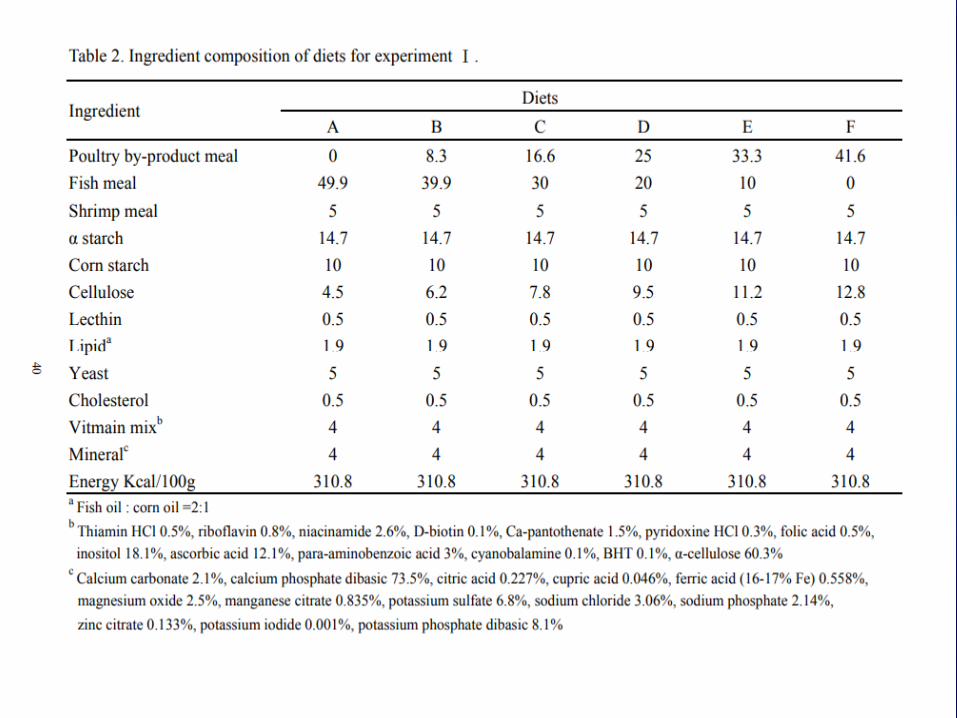
Poultry by-product meal and meat and bone meal
Poultry by-product meal (PBM) is a high-protein commodity
made from grinding clean, rendered parts of chicken carcasses.
PBM contains 64.7% crude protein and 16.8% crude lipid.
Meat and bone meal (MBM) is a product of the animal carcass
rendering process. Animal carcass trimmings, condemned livers,
inedible offal and bones are rendered to destroy harmful
organisms.
MBM contains 58.2% crude protein and 17.2% crude lipid.

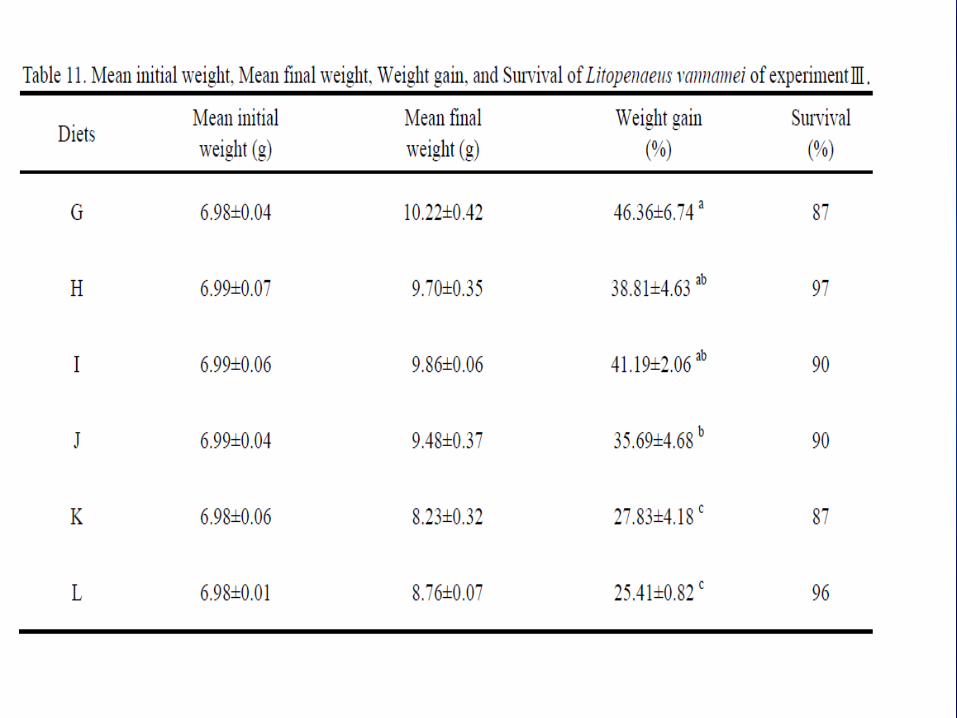
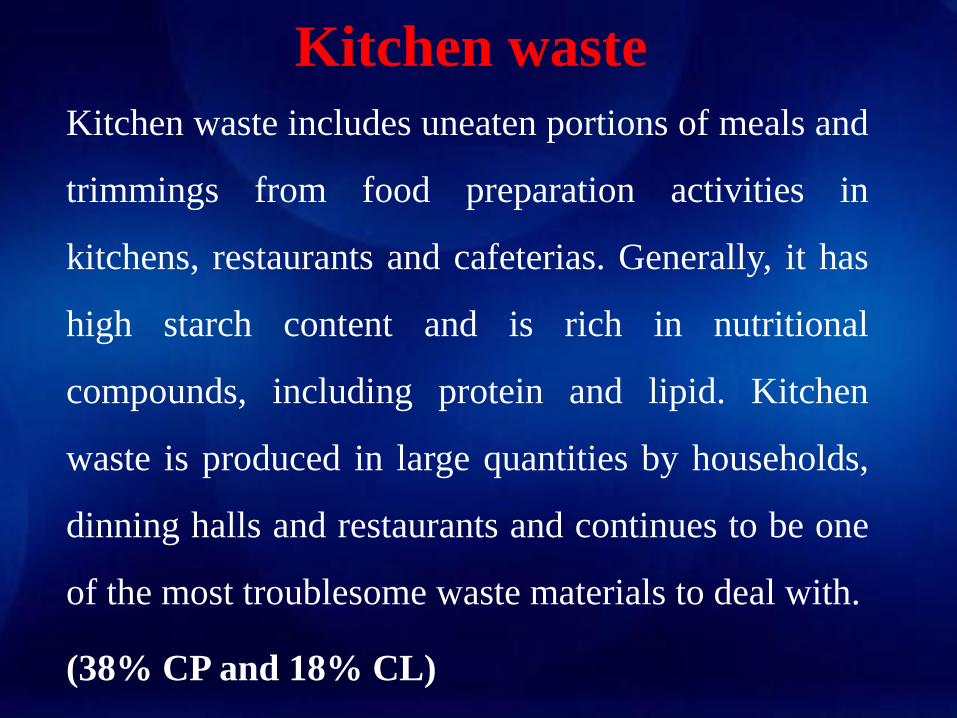
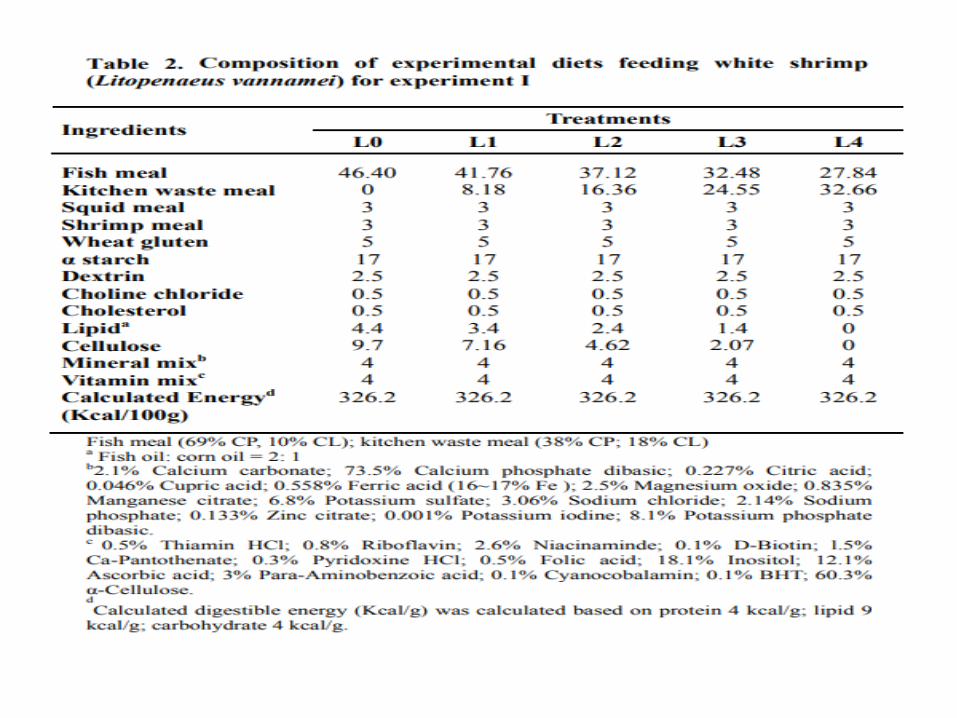
Kitchen waste
Kitchen waste includes uneaten portions of meals and
trimmings from food preparation activities in
kitchens, restaurants and cafeterias. Generally, it has
high starch content and is rich in nutritional
compounds, including protein and lipid. Kitchen
waste is produced in large quantities by households,
dinning halls and restaurants and continues to be one
of the most troublesome waste materials to deal with.
(38% CP and 18% CL)
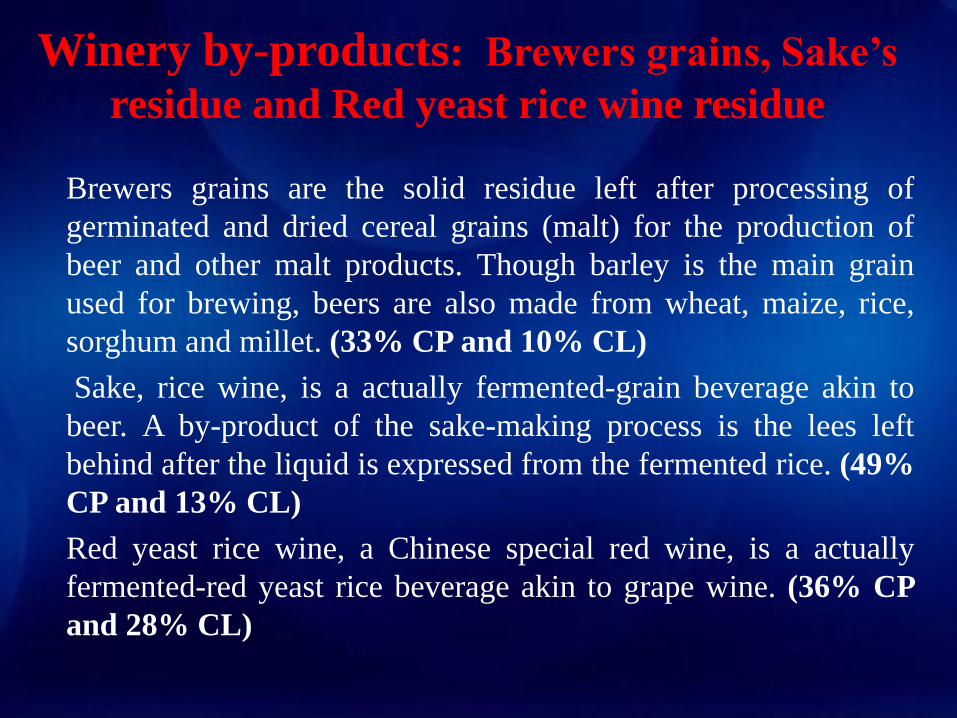
Winery by-products: Brewers grains, Sake’s
residue and Red yeast rice wine residue
Brewers grains are the solid residue left after processing of
germinated and dried cereal grains (malt) for the production of
beer and other malt products. Though barley is the main grain
used for brewing, beers are also made from wheat, maize, rice,
sorghum and millet. (33% CP and 10% CL)
Sake, rice wine, is a actually fermented-grain beverage akin to
beer. A by-product of the sake-making process is the lees left
behind after the liquid is expressed from the fermented rice. (49%
CP and 13% CL)
Red yeast rice wine, a Chinese special red wine, is a actually
fermented-red yeast rice beverage akin to grape wine. (36% CP
and 28% CL)
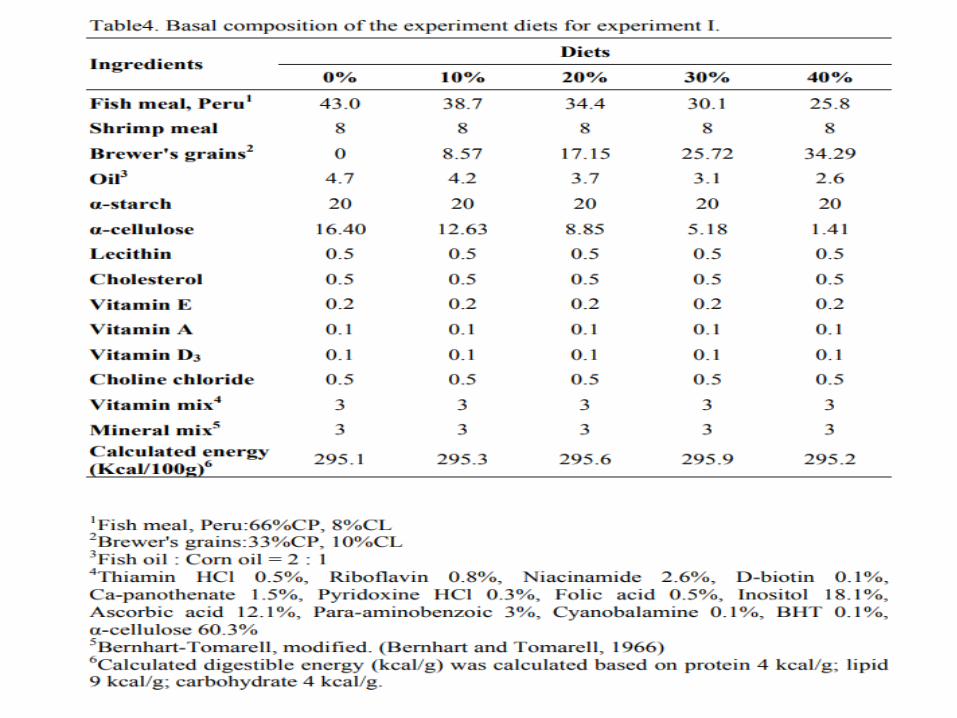
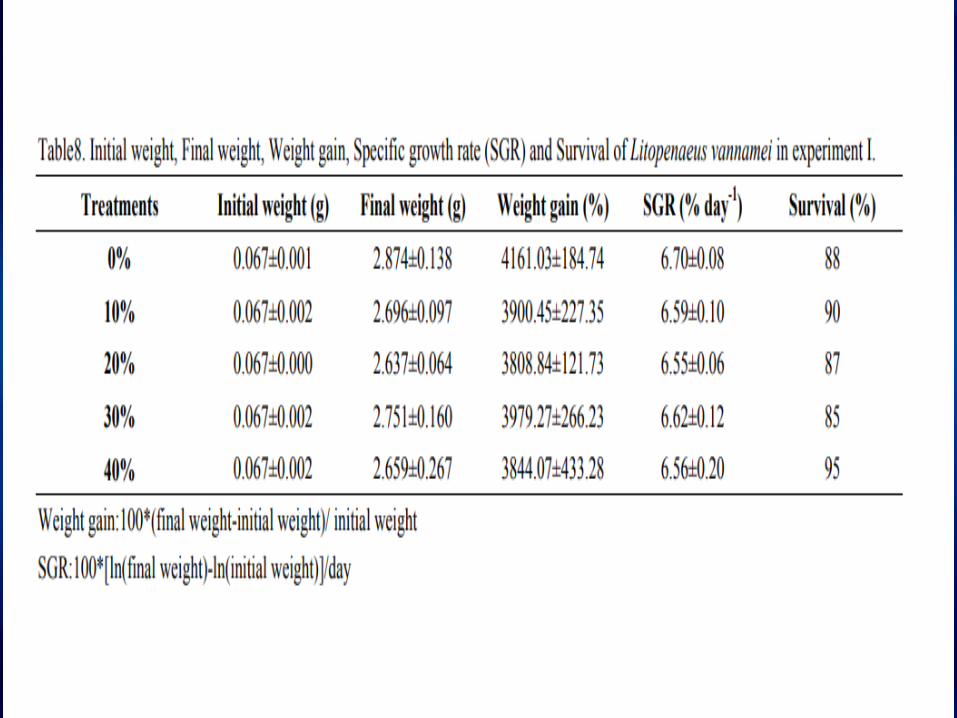
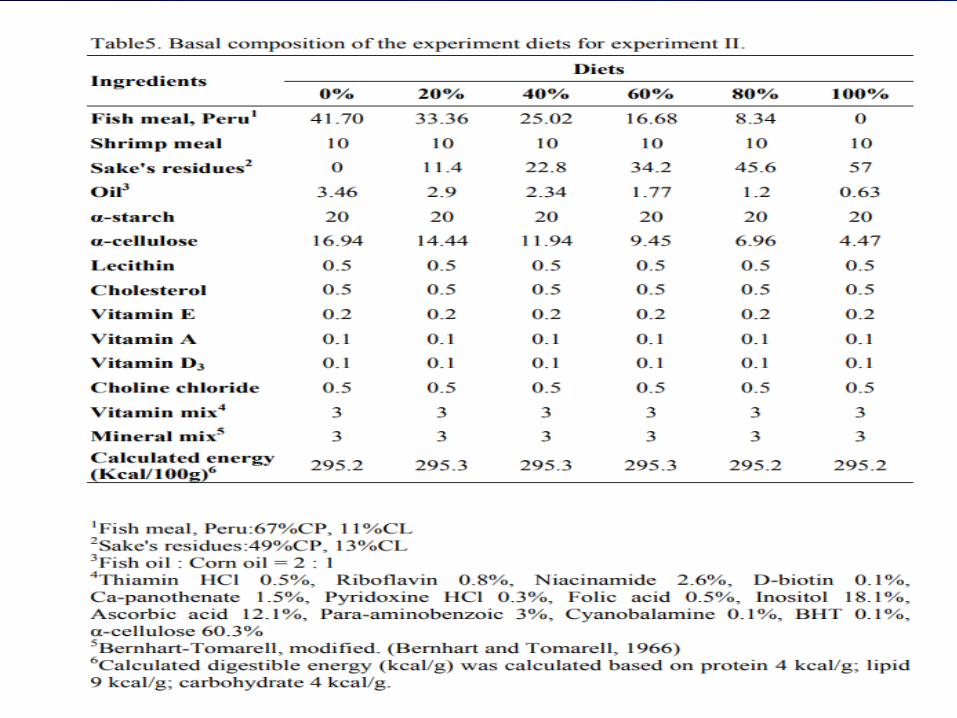
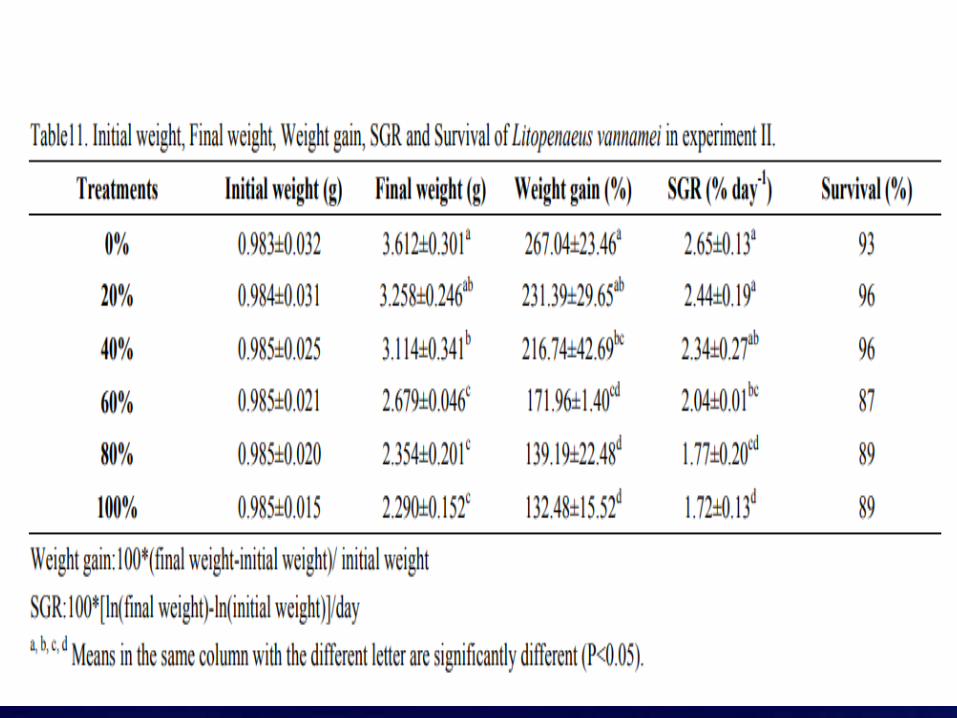
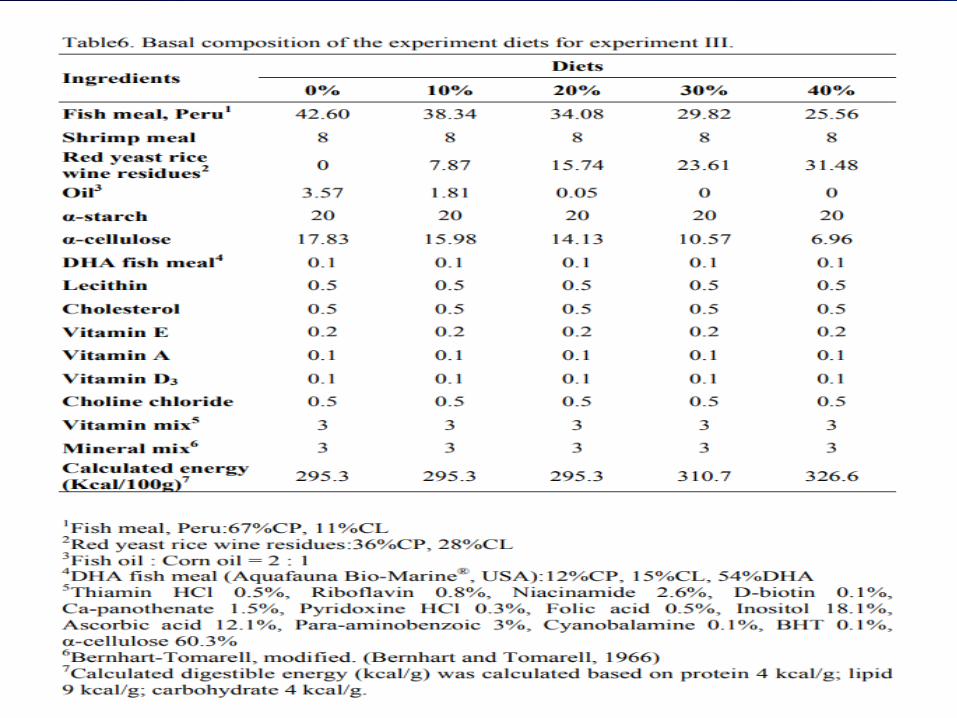
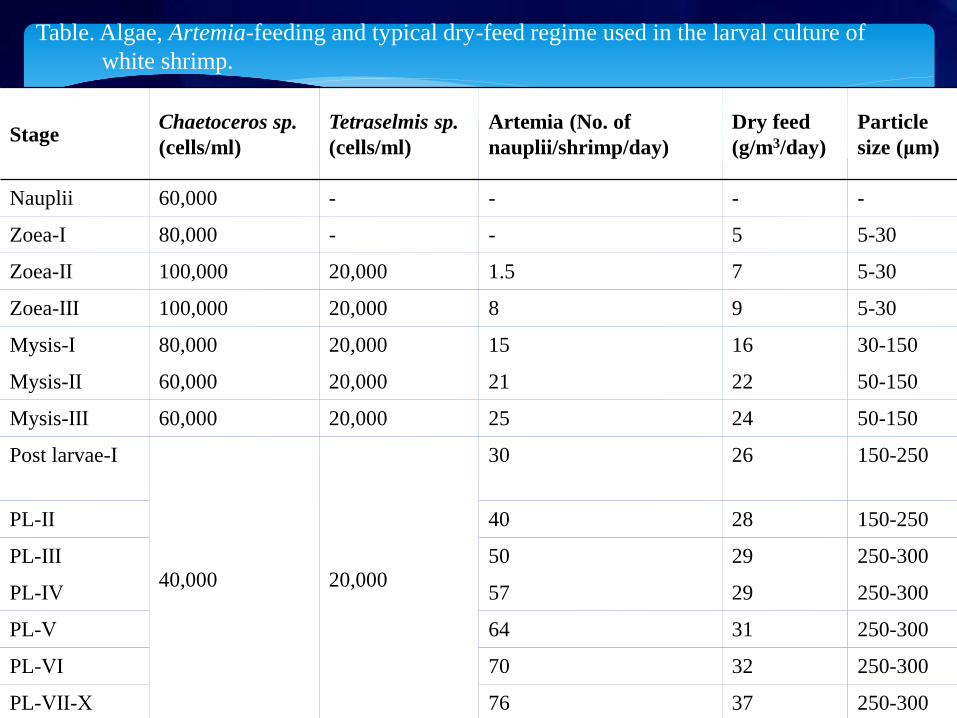
Table. Algae, Artemia-feeding and typical dry-feed regime used in the larval culture of
white shrimp.
StageChaetoceros sp.
(cells/ml)
Tetraselmis sp.
(cells/ml)
Artemia (No. of
nauplii/shrimp/day)
Dry feed
(g/m3/day)
Particle
size (μm)
Nauplii 60,000 - - - -
Zoea-Ⅰ 80,000 - - 5 5-30
Zoea-Ⅱ 100,000 20,000 1.5 7 5-30
Zoea-Ⅲ 100,000 20,000 8 9 5-30
Mysis-Ⅰ 80,000 20,000 15 16 30-150
Mysis-Ⅱ 60,000 20,000 21 22 50-150
Mysis-Ⅲ 60,000 20,000 25 24 50-150
Post larvae-Ⅰ
40,000 20,000
30 26 150-250
PL-Ⅱ 40 28 150-250
PL-Ⅲ 50 29 250-300
PL-Ⅳ 57 29 250-300
PL-Ⅴ 64 31 250-300
PL-Ⅵ 70 32 250-300
PL-Ⅶ-Ⅹ 76 37 250-300
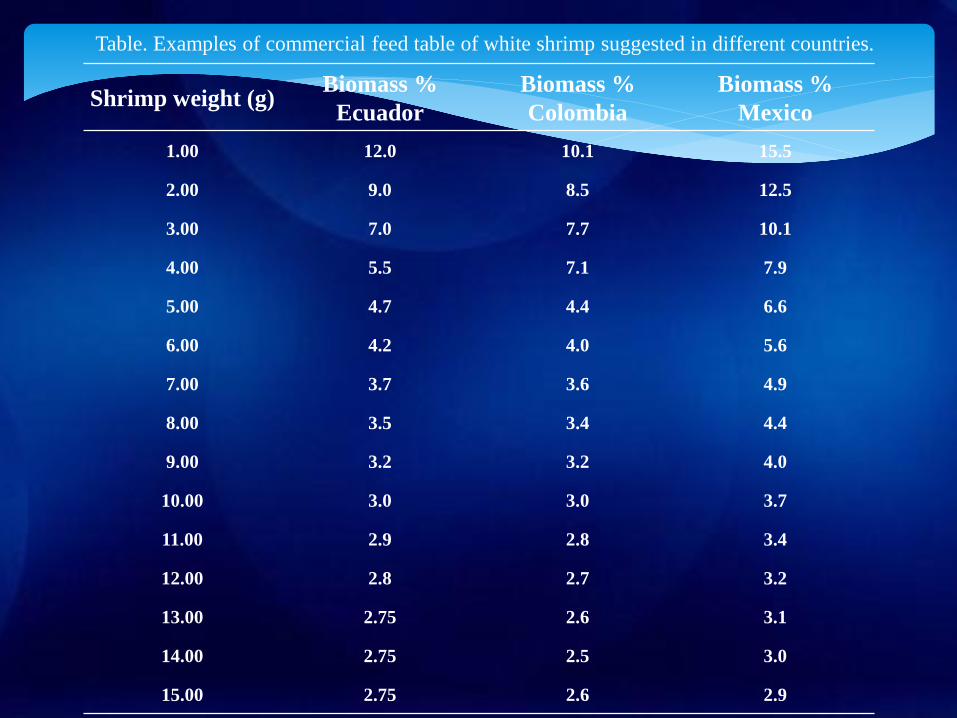
Shrimp weight (g)Biomass %
Ecuador
Biomass %
Colombia
Biomass %
Mexico
1.00 12.0 10.1 15.5
2.00 9.0 8.5 12.5
3.00 7.0 7.7 10.1
4.00 5.5 7.1 7.9
5.00 4.7 4.4 6.6
6.00 4.2 4.0 5.6
7.00 3.7 3.6 4.9
8.00 3.5 3.4 4.4
9.00 3.2 3.2 4.0
10.00 3.0 3.0 3.7
11.00 2.9 2.8 3.4
12.00 2.8 2.7 3.2
13.00 2.75 2.6 3.1
14.00 2.75 2.5 3.0
15.00 2.75 2.6 2.9
Table. Examples of commercial feed table of white shrimp suggested in different countries.