the ohio state university enrollment services
TRANSCRIPT

HIGHLIGHTS OF FIFTEENTH DAY ENROLLMENT FOR THE SUMMER TERM 2013
THE OHIO STATE UNIVERSITY
ENROLLMENT SERVICES – ANALYSIS AND REPORTING
July 2, 2013

2012 2013 Change % Change● Total University Enrollment 16,004 22,162 6,158 38.5%● Columbus Campus Total Enrollment 14,998 20,646 5,648 37.7%● Regional Campus Total Enrollment 1,006 1,516 510 50.7% ▪ Lima 198 215 17 8.6% ▪ Mansfield 217 335 118 54.4% ▪ Marion 169 336 167 98.8% ▪ Newark 346 499 153 44.2% ▪ Wooster 76 131 55 72.4%
● Enrollment by Level ▪ Undergraduate all campuses 8,533 13,696 5,163 60.5% ▪ Undergraduate Columbus campus 7,653 12,286 4,633 60.5% ▪ New Freshmen, Columbus 29 48 19 65.5% ▪ Columbus Transfers 176 264 88 50.0% ▪ Graduate all campuses 6,223 6,942 719 11.6% ▪ Graduate Columbus campus 6,097 6,836 739 12.1% ▪ Post Baccalaureate Professional Columbus campus 1,248 1,524 276 22.1%
● Enrollment by Ethnicity all campuses, all levels ▪ Hispanic 438 712 274 62.6% ▪ American Indian/Alaskan Native 37 46 9 24.3% ▪ Asian 805 1,310 505 62.7% ▪ African American 1,061 1,474 413 38.9% ▪ Native Hawaiian or Other Pacific Islander 6 15 9 150.0% ▪ White 10,756 14,777 4,021 37.4% ▪ Two or More Races 205 422 217 105.9% ▪ International Students 2,202 2,827 625 28.4%
● Enrollment by Residency all campuses ▪ Undergraduate Ohio residents 7,197 11,369 4,172 58.0% ▪ Undergraduate Non-Ohio residents 1,336 2,327 991 74.2% ▪ Graduate and Professional Ohio residents 4,629 5,124 495 10.7% ▪ Graduate and Professional Non-Ohio residents 2,842 3,342 500 17.6%
THE OHIO STATE UNIVERSITYSUMMER TERM 2013 OFFICIAL ENROLLMENT
COMPARED TO SUMMER 2012

TABLE OF CONTENTS
Total Enrollment by Campus and Sex .............................................................................................. Table 1
Enrollment by Source of Student ...................................................................................................... Table 2
Enrollment by College and School, Columbus Campus ................................................................... Table 3
Headcount, Credits, and Credits per Student by Level .................................................................... Table 4
Enrollment by County at the Time of Application, Total University ................................................... Table 5
Enrollment by County at the Time of Application, Columbus Campus ............................................. Table 6
Enrollment by State at the Time of Application, Total University ...................................................... Table 7
Enrollment by State at the Time of Application, Columbus Campus ................................................ Table 8
Enrollment of International Students, Total University ..................................................................... Table 9
Enrollment of International Students by Curriculum, Columbus Campus ...................................... Table 10
Enrollment by Race and Campus ................................................................................................... Table 11
Enrollment by Level, Source, and Race, Total University ............................................................... Table 12
Enrollment by Level, Source, and Race, Columbus Campus ......................................................... Table 13
Enrollment by Level, Race, and Residency, Total University ......................................................... Table 14
Enrollment by Full-time/Part-time, Level, and Age Range, Total University ....................................Table 15
Enrollment by Full-time/Part-time, Level, and Age Range, Columbus Campus................................Table16

TOTAL ENROLLMENT BY CAMPUS AND SEX SUMMER TERM 2013 COMPARED TO SUMMER TERM 2012
FIFTEENTH DAY ENROLLMENT TABLE 1
SU '12 SU '13 CHANGE Number Number CurrentCAMPUS Number /Total Number /Total Number /Past
Columbus Men 7,215 9,751 2,536 35.1%
95.0% 94.2%Women 7,783 10,895 3,112 40.0%
92.6% 92.3% Total 14,998 20,646 5,648 37.7%
93.7% 93.2% Lima
Men 62 83 21 33.9% 0.8% 0.8%
Women 136 132 -4 -2.9% 1.6% 1.1%
Total 198 215 17 8.6% 1.2% 1.0% Mansfield
Men 80 115 35 43.8% 1.1% 1.1%
Women 137 220 83 60.6% 1.6% 1.9%
Total 217 335 118 54.4% 1.4% 1.5% Marion
Men 58 131 73 125.9% 0.8% 1.3%
Women 111 205 94 84.7% 1.3% 1.7%
Total 169 336 167 98.8% 1.1% 1.5% Newark
Men 131 197 66 50.4% 1.7% 1.9%
Women 215 302 87 40.5% 2.6% 2.6%
Total 346 499 153 44.2% 2.2% 2.3% Wooster
Men 50 77 27 54.0% 0.7% 0.7%
Women 26 54 28 107.7% 0.3% 0.5%
Total 76 131 55 72.4% 0.5% 0.6% TOTAL
Men 7,596 10,354 2,758 36.3% 47.5% 46.7%
Women 8,408 11,808 3,400 40.4% 52.5% 53.3% GRAND TOTAL 16,004 22,162 6,158 38.5%
THE OHIO STATE UNIVERSITY Enrollment Services - Analysis and ReportingJuly 2, 2013

ENROLLMENT BY SOURCE OF STUDENTSUMMER TERM 2013 COMPARED TO SUMMER TERM 2012
FIFTEENTH DAY ENROLLMENT TABLE 2
Transfers Transfers Contin- Non- NFYS Ranks 1 & 2 Ranks 3 & 4 uing Former Degree Total_______________________ _____ ________ ________ ________ ______ ______ _____UNDERGRADUATE_______________________ Columbus SU '12 29 51 125 6,430 219 799 7,653 SU '13 48 83 181 10,895 305 774 12,286 Change 19 32 56 4,465 86 -25 4,633 % Change 65.5% 62.7% 44.8% 69.4% 39.3% -3.1% 60.5% Extended SU '12 0 23 9 758 48 42 880 SU '13 43 44 12 1,182 58 71 1,410 Change 43 21 3 424 10 29 530 % Change 91.3% 33.3% 55.9% 20.8% 69.0% 60.2% Total Undergraduate SU '12 29 74 134 7,188 267 841 8,533 SU '13 91 127 193 12,077 363 845 13,696 Change 62 53 59 4,889 96 4 5,163 % Change 213.8% 71.6% 44.0% 68.0% 36.0% 0.5% 60.5%
New to New from Contin- Non- OSU OSU uing Former Degree Total_____________________ ________ ________ ________ ______ ______ _____GRADUATEPROFESSIONAL_____________________ Columbus SU '12 2 0 1,228 10 8 1,248 SU '13 1 0 1,506 3 14 1,524 Change -1 0 278 -7 6 276 % Change -50.0% 22.6% -70.0% 75.0% 22.1%
New to New from Contin- Non- OSU OSU uing Former Degree Total_____________________ ________ ________ ________ ______ ______ _____GRADUATE _____________________ Columbus SU '12 197 225 5,060 103 512 6,097 SU '13 184 282 5,706 83 581 6,836 Change -13 57 646 -20 69 739 % Change -6.6% 25.3% 12.8% -19.4% 13.5% 12.1% Extended SU '12 1 25 53 4 43 126 SU '13 0 8 66 3 29 106 Change -1 -17 13 -1 -14 -20 % Change -100.0% -68.0% 24.5% -25.0% -32.6% -15.9% Total Graduate SU '12 198 250 5,113 107 555 6,223 SU '13 184 290 5,772 86 610 6,942 Change -14 40 659 -21 55 719 % Change -7.1% 16.0% 12.9% -19.6% 9.9% 11.6%
THE OHIO STATE UNIVERSITY Enrollment Services - Analysis and Reporting July 2, 2013

TABLE 3
Enrollment in Enrollment by Graduate Students Degree-Granting Programs in Curricular Academic Programs
Change Change SU '12 SU '13 Number Percent SU '12 SU '13 Number Percent
UNDERGRADUATE GRADUATE
Arts & Sciences 3,100 5,094 1,994 64.3% 1,991 2,064 73 3.7%
Business 902 1,433 531 58.9% 335 424 89 26.6%
Continuing Education 779 734 -45 -5.8% n/a n/a n/a n/a
Dentistry: Dental Hygiene 29 37 8 27.6% n/a n/a n/a n/a
Education and Human Ecology 891 1,236 345 38.7% 598 666 68 11.4%
Engineering, Total 780 1,681 901 115.5% 879 1,055 176 20.0% Engineering 735 1,556 821 111.7% 855 1,003 148 17.3% Architecture 45 125 80 177.8% 24 52 28 116.7%
Exploration Program 235 422 187 79.6% n/a n/a n/a n/a
Food, Agricultural, and Environmental Sciences (FAES), Total 246 459 213 86.6% 344 363 19 5.5%
Environment and Natural Resources 55 141 86 156.4% 55 60 5 9.1% FAES 191 318 127 66.5% 289 303 14 4.8%
Health and Rehabilitation Sciences 252 390 138 54.8% 341 302 -39 -11.4% Nursing 230 362 132 57.4% 318 387 69 21.7%
Other Graduate Interdisciplinary n/a n/a n/a n/a 527 597 70 13.3%
Pharmacy 55 121 66 120.0% 53 55 2 3.8%
Public Affairs 36 66 30 83.3% 74 84 10 13.5%
Public Health 0 84 84 95 180 85 89.5% Social Work 96 137 41 42.7% 195 280 85 43.6% Undergraduate Student Academic Services 22 30 8 36.4% n/a n/a n/a n/a TOTAL 7,653 12,286 4,633 60.5%
GRADUATE PROFESSIONAL
Dentistry 322 327 5 1.6% 74 87 13 17.6%Law 91 79 -12 -13.2% 0 0 0Medicine 439 629 190 43.3% 170 190 20 11.8%Optometry 124 125 1 0.8% 8 9 1 12.5%Pharmacy, Doctor of 135 200 65 48.1% 0 0 0Veterinary Medicine 137 164 27 19.7% 95 93 -2 -2.1% TOTAL 1,248 1,524 276 22.1% 6,097 6,836 739 12.1%
THE OHIO STATE UNIVERSITY Enrollment Services - Analysis and ReportingJuly 2, 2013
ENROLLMENT BY COLLEGE AND SCHOOL COLUMBUS CAMPUS
SUMMER TERM 2013 COMPARED TO SUMMER TERM 2012
FIFTEENTH DAY ENROLLMENT
College/School

HEADCOUNT, CREDITS, AND CREDITS PER STUDENT BY LEVEL SUMMER TERM 2013 COMPARED TO SUMMER TERM 2012
FIFTEENTH DAY ENROLLMENT TABLE 4
FULL-TIME* PART-TIME TOTAL Credits Credits Credits Head- per Head- per Head- per UNDERGRADUATE count Credits Student count Credits Student count Credits Student __________________ ______ ______ ______ ______ ______ ______ ______ ______ ______ Columbus SU '12 850 10,884.5 12.81 6,803 34,374.5 5.05 7,653 45,259.0 5.91 SU '13 1,376 18,522.0 13.46 10,910 51,395.0 4.71 12,286 69,917.0 5.69 Change 526 7,637.5 0.66 4,107 17,020.5 -0.34 4,633 24,658.0 -0.22 % Change 61.9% 70.2% 5.1% 60.4% 49.5% -6.8% 60.5% 54.5% -3.8% Extended SU '12 56 709.5 12.67 824 4,306.0 5.23 880 5,015.5 5.70 SU '13 105 1,376.0 13.10 1,305 6,577.0 5.04 1,410 7,953.0 5.64 Change 49 666.5 0.44 481 2,271.0 -0.19 530 2,937.5 -0.06 % Change 87.5% 93.9% 3.4% 58.4% 52.7% -3.6% 60.2% 58.6% -1.0% Total Undergraduate SU '12 906 11,594.0 12.80 7,627 38,680.5 5.07 8,533 50,274.5 5.89 SU '13 1,481 19,898.0 13.44 12,215 57,972.0 4.75 13,696 77,870.0 5.69 Change 575 8,304.0 0.64 4,588 19,291.5 -0.33 5,163 27,595.5 -0.21 % Change 63.5% 71.6% 5.0% 60.2% 49.9% -6.4% 60.5% 54.9% -3.5%
FULL-TIME* PART-TIME TOTAL
Credits Credits Credits GRADUATE Head- per Head- per Head- per PROFESSIONAL count Credits Student count Credits Student count Credits Student ________________ ______ ______ ______ ______ ______ ______ ______ ______ ______ Columbus SU '12 1,013 14,980.5 14.79 235 1,331.5 5.67 1,248 16,312.0 13.07 SU '13 1,173 18,155.0 15.48 351 1,089.5 3.10 1,524 19,244.5 12.63 Change 160 3,174.5 0.69 116 -242.0 -2.56 276 2,932.5 -0.44 % Change 15.8% 21.2% 4.7% 49.4% -18.2% -45.2% 22.1% 18.0% -3.4%
FULL-TIME* PART-TIME TOTAL
Credits Credits Credits Head- per Head- per Head- per GRADUATE count Credits Student count Credits Student count Credits Student ___________ ______ ______ ______ ______ ______ ______ ______ ______ ______ Columbus SU '12 1,025 8,853.5 8.64 5,072 18,620.5 3.67 6,097 27,474.0 4.51 SU '13 1,298 12,136.5 9.35 5,538 21,234.5 3.83 6,836 33,371.0 4.88 Change 273 3,283.0 0.71 466 2,614.0 0.16 739 5,897.0 0.38 % Change 26.6% 37.1% 8.2% 9.2% 14.0% 4.4% 12.1% 21.5% 8.3% Extended SU '12 22 308.0 14.00 104 376.0 3.62 126 684.0 5.43 SU '13 20 231.0 11.55 86 398.0 4.63 106 629.0 5.93 Change -2 -77.0 -2.45 -18 22.0 1.01 -20 -55.0 0.51 % Change -9.1% -25.0% -17.5% -17.3% 5.9% 28.0% -15.9% -8.0% 9.3% Total Graduate SU '12 1,047 9,161.5 8.75 5,176 18,996.5 3.67 6,223 28,158.0 4.52 SU '13 1,318 12,367.5 9.38 5,624 21,632.5 3.85 6,942 34,000.0 4.90 Change 271 3,206.0 0.63 448 2,636.0 0.18 719 5,842.0 0.37 % Change 25.9% 35.0% 7.2% 8.7% 13.9% 4.8% 11.6% 20.7% 8.2%
FULL-TIME* PART-TIME TOTAL Credits Credits Credits Head- per Head- per Head- per TOTAL count Credits Student count Credits Student count Credits Student ___________ ______ ______ ______ ______ ______ ______ ______ ______ ______ Columbus SU '12 2,888 34,718.5 12.02 12,110 54,326.5 4.49 14,998 89,045.0 5.94 SU '13 3,847 48,813.5 12.69 16,799 73,719.0 4.39 20,646 122,532.5 5.93 Change 959 14,095.0 0.67 4,689 19,392.5 -0.10 5,648 33,487.5 0.00 % Change 33.2% 40.6% 5.5% 38.7% 35.7% -2.2% 37.7% 37.6% 0.0% Extended SU '12 78 1,017.5 13.04 928 4,682.0 5.05 1,006 5,699.5 5.67 SU '13 125 1,607.0 12.86 1,391 6,975.0 5.01 1,516 8,582.0 5.66 Change 47 589.5 -0.19 463 2,293.0 -0.03 510 2,882.5 0.00 % Change 60.3% 57.9% -1.4% 49.9% 49.0% -0.6% 50.7% 50.6% -0.1% Total SU '12 2,966 35,736.0 12.05 13,038 59,008.5 4.53 16,004 94,744.5 5.92 SU '13 3,972 50,420.5 12.69 18,190 80,694.0 4.44 22,162 131,114.5 5.92 Change 1,006 14,684.5 0.65 5,152 21,685.5 -0.09 6,158 36,370.0 0.00 % Change 33.9% 41.1% 5.4% 39.5% 36.7% -2.0% 38.5% 38.4% -0.1%
* Undergraduate students are classified as full-time if they register for 12 or more credits. Graduate or graduate professional students are classified as full-time if they register for 8 or more credits. Full-time equivalency can be determined by dividing the total number of credits by 15.
THE OHIO STATE UNIVERSITY Enrollment Services - Analysis and ReportingJuly 2, 2013

ENROLLMENT BY COUNTY AT THE TIME OF APPLICATION*TOTAL UNIVERSITY
SUMMER TERM 2013 COMPARED TO SUMMER TERM 2012 FIFTEENTH DAY ENROLLMENT TABLE 5 Percent PercentOhio County SU '12 SU '13 Change Ohio County SU '12 SU '13 Change Adams 4 5 25.0% Marion 132 177 34.1%Allen 182 203 11.5% Medina 111 200 80.2%Ashland 45 107 137.8% Meigs 4 6 50.0%Ashtabula 29 33 13.8% Mercer 47 62 31.9%Athens 24 25 4.2% Miami 60 74 23.3%
Auglaize 68 80 17.6% Monroe 4 7 75.0%Belmont 32 45 40.6% Montgomery 370 500 35.1%Brown 13 22 69.2% Morgan 5 7 40.0%Butler 162 266 64.2% Morrow 56 81 44.6%Carroll 4 15 275.0% Muskingum 75 101 34.7%
Champaign 23 25 8.7% Noble 5 5 0.0%Clark 73 95 30.1% Ottawa 29 41 41.4%Clermont 72 116 61.1% Paulding 15 20 33.3%Clinton 17 26 52.9% Perry 19 35 84.2%Columbiana 28 40 42.9% Pickaway 60 68 13.3%
Coshocton 23 33 43.5% Pike 7 16 128.6%Crawford 45 91 102.2% Portage 39 72 84.6%Cuyahoga 722 1,124 55.7% Preble 12 11 -8.3%Darke 18 30 66.7% Putnam 41 86 109.8%Defiance 21 26 23.8% Richland 216 290 34.3%
Delaware 545 849 55.8% Ross 41 60 46.3%Erie 42 62 47.6% Sandusky 25 37 48.0%Fairfield 259 376 45.2% Scioto 28 30 7.1%Fayette 18 26 44.4% Seneca 31 48 54.8%Franklin 4,140 5,400 30.4% Shelby 38 72 89.5%
Fulton 12 29 141.7% Stark 208 303 45.7%Gallia 5 15 200.0% Summit 301 449 49.2%Geauga 56 108 92.9% Trumbull 82 120 46.3%Greene 124 157 26.6% Tuscarawas 39 58 48.7%Guernsey 25 16 -36.0% Union 82 125 52.4%
Hamilton 448 651 45.3% Van Wert 23 26 13.0%Hancock 70 94 34.3% Vinton 3 1 -66.7%Hardin 30 44 46.7% Warren 191 280 46.6%Harrison 3 3 0.0% Washington 33 34 3.0%Henry 12 24 100.0% Wayne 82 110 34.1%
Highland 9 14 55.6% Williams 18 29 61.1%Hocking 9 17 88.9% Wood 95 105 10.5%Holmes 12 24 100.0% Wyandot 28 36 28.6%Huron 39 54 38.5% Jackson 6 19 216.7% Total Ohio Counties 11,264 15,797 40.2%
Jefferson 26 35 34.6% Other States and D.C. 2,470 3,440 39.3%Knox 69 106 53.6% U.S. Territories 12 33 175.0%Lake 115 178 54.8% U.S. Students from Lawrence 12 17 41.7% Foreign Countries 50 55 10.0%Licking 361 479 32.7% Foreign Students 2,202 2,827 28.4%
Location Unknown 6 10 66.7%Logan 47 54 14.9% Lorain 132 206 56.1% Lucas 224 317 41.5% Total Enrolled 16,004 22,162 38.5%Madison 53 78 47.2% Mahoning 101 156 54.5%
*Determined by domestic student's permanent address at time of application for admission. Foreign students include only nonresident aliens, regardless of permanent address given at the time of application. THE OHIO STATE UNIVERSITY Enrollment Services - Analysis and ReportingJuly 2, 2013

ENROLLMENT BY COUNTY AT THE TIME OF APPLICATION*COLUMBUS CAMPUS
SUMMER TERM 2013 COMPARED TO SUMMER TERM 2012 FIFTEENTH DAY ENROLLMENT TABLE 6 Percent PercentOhio County SU '12 SU '13 Change Ohio County SU '12 SU '13 Change Adams 4 5 25.0% Marion 67 66 -1.5%Allen 97 106 9.3% Medina 102 186 82.4%Ashland 33 61 84.8% Meigs 4 5 25.0%Ashtabula 27 32 18.5% Mercer 40 55 37.5%Athens 23 25 8.7% Miami 60 73 21.7%
Auglaize 51 64 25.5% Monroe 4 7 75.0%Belmont 31 42 35.5% Montgomery 363 495 36.4%Brown 11 20 81.8% Morgan 5 7 40.0%Butler 157 257 63.7% Morrow 38 45 18.4%Carroll 4 14 250.0% Muskingum 61 86 41.0%
Champaign 23 25 8.7% Noble 3 5 66.7%Clark 70 94 34.3% Ottawa 28 40 42.9%Clermont 68 113 66.2% Paulding 10 14 40.0%Clinton 15 23 53.3% Perry 14 27 92.9%Columbiana 28 37 32.1% Pickaway 58 65 12.1%
Coshocton 15 20 33.3% Pike 7 15 114.3%Crawford 22 36 63.6% Portage 38 69 81.6%Cuyahoga 711 1,110 56.1% Preble 12 11 -8.3%Darke 18 30 66.7% Putnam 28 67 139.3%Defiance 20 24 20.0% Richland 106 155 46.2%
Delaware 514 757 47.3% Ross 40 59 47.5%Erie 42 57 35.7% Sandusky 24 36 50.0%Fairfield 235 337 43.4% Scioto 28 29 3.6%Fayette 16 25 56.3% Seneca 24 42 75.0%Franklin 3,998 5,167 29.2% Shelby 30 54 80.0%
Fulton 12 26 116.7% Stark 203 295 45.3%Gallia 5 14 180.0% Summit 293 434 48.1%Geauga 56 106 89.3% Trumbull 82 118 43.9%Greene 120 156 30.0% Tuscarawas 39 53 35.9%Guernsey 22 15 -31.8% Union 65 98 50.8%
Hamilton 437 637 45.8% Van Wert 17 18 5.9%Hancock 58 85 46.6% Vinton 3 1 -66.7%Hardin 10 22 120.0% Warren 186 277 48.9%Harrison 3 3 0.0% Washington 33 33 0.0%Henry 10 18 80.0% Wayne 66 90 36.4%
Highland 9 14 55.6% Williams 18 24 33.3%Hocking 9 15 66.7% Wood 94 103 9.6%Holmes 10 19 90.0% Wyandot 21 16 -23.8%Huron 27 43 59.3% Jackson 6 19 216.7% Total Ohio Counties 10,267 14,297 39.3%
Jefferson 26 32 23.1% Other States and D.C. 2,466 3,428 39.0%Knox 51 79 54.9% U.S. Territories 12 33 175.0%Lake 114 172 50.9% U.S. Students from Lawrence 12 17 41.7% Foreign Countries 50 55 10.0%Licking 194 281 44.8% Foreign Students 2,197 2,824 28.5%
Location Unknown 6 9 50.0%Logan 26 38 46.2% Lorain 129 192 48.8% Lucas 220 311 41.4% Total Enrolled 14,998 20,646 37.7%Madison 53 75 41.5% Mahoning 101 154 52.5%
THE OHIO STATE UNIVERSITY Enrollment Services - Analysis and ReportingJuly 2, 2013
*Determined by domestic student's permanent address at time of application for admission. Foreign students include only nonresident aliens, regardless of permanent address given at the time of application.
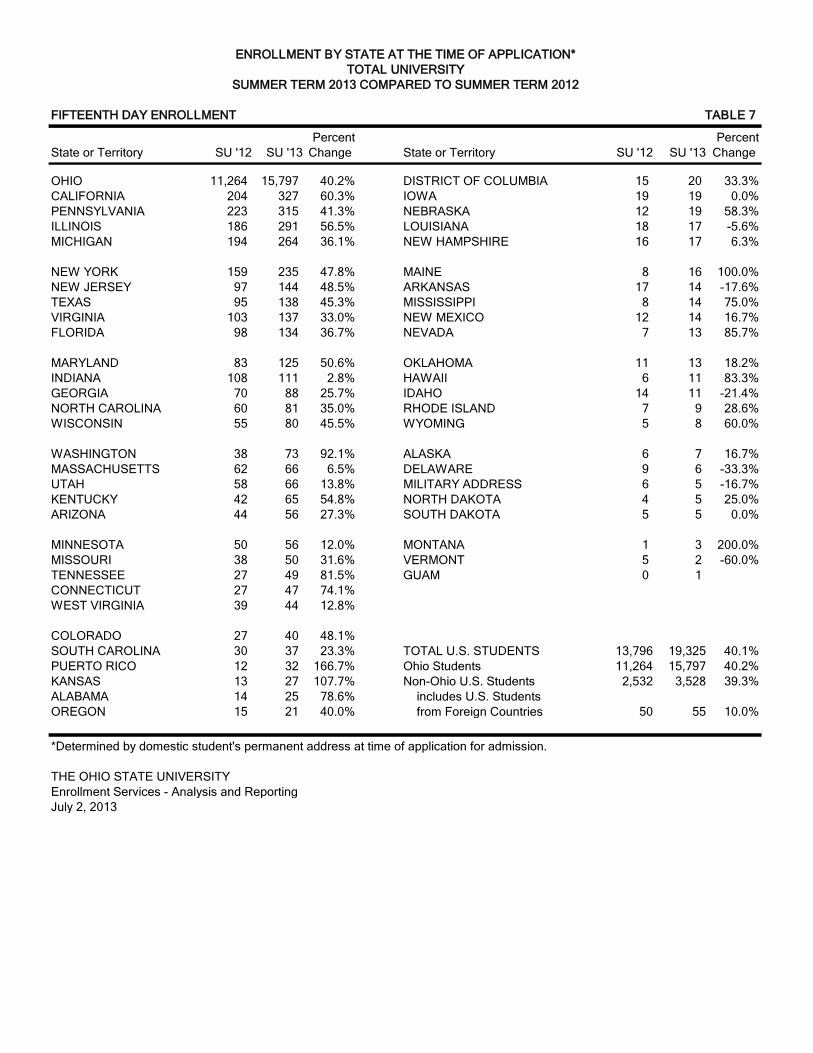
ENROLLMENT BY STATE AT THE TIME OF APPLICATION*TOTAL UNIVERSITY
SUMMER TERM 2013 COMPARED TO SUMMER TERM 2012 FIFTEENTH DAY ENROLLMENT TABLE 7 Percent PercentState or Territory SU '12 SU '13 Change State or Territory SU '12 SU '13 Change OHIO 11,264 15,797 40.2% DISTRICT OF COLUMBIA 15 20 33.3%CALIFORNIA 204 327 60.3% IOWA 19 19 0.0%PENNSYLVANIA 223 315 41.3% NEBRASKA 12 19 58.3%ILLINOIS 186 291 56.5% LOUISIANA 18 17 -5.6%MICHIGAN 194 264 36.1% NEW HAMPSHIRE 16 17 6.3%
NEW YORK 159 235 47.8% MAINE 8 16 100.0%NEW JERSEY 97 144 48.5% ARKANSAS 17 14 -17.6%TEXAS 95 138 45.3% MISSISSIPPI 8 14 75.0%VIRGINIA 103 137 33.0% NEW MEXICO 12 14 16.7%FLORIDA 98 134 36.7% NEVADA 7 13 85.7%
MARYLAND 83 125 50.6% OKLAHOMA 11 13 18.2%INDIANA 108 111 2.8% HAWAII 6 11 83.3%GEORGIA 70 88 25.7% IDAHO 14 11 -21.4%NORTH CAROLINA 60 81 35.0% RHODE ISLAND 7 9 28.6%WISCONSIN 55 80 45.5% WYOMING 5 8 60.0%
WASHINGTON 38 73 92.1% ALASKA 6 7 16.7%MASSACHUSETTS 62 66 6.5% DELAWARE 9 6 -33.3%UTAH 58 66 13.8% MILITARY ADDRESS 6 5 -16.7%KENTUCKY 42 65 54.8% NORTH DAKOTA 4 5 25.0%ARIZONA 44 56 27.3% SOUTH DAKOTA 5 5 0.0%
MINNESOTA 50 56 12.0% MONTANA 1 3 200.0%MISSOURI 38 50 31.6% VERMONT 5 2 -60.0%TENNESSEE 27 49 81.5% GUAM 0 1CONNECTICUT 27 47 74.1% 0 0 0WEST VIRGINIA 39 44 12.8% 0 0 0
COLORADO 27 40 48.1% SOUTH CAROLINA 30 37 23.3% TOTAL U.S. STUDENTS 13,796 19,325 40.1%PUERTO RICO 12 32 166.7% Ohio Students 11,264 15,797 40.2%KANSAS 13 27 107.7% Non-Ohio U.S. Students 2,532 3,528 39.3%ALABAMA 14 25 78.6% includes U.S. Students OREGON 15 21 40.0% from Foreign Countries 50 55 10.0%
*Determined by domestic student's permanent address at time of application for admission. THE OHIO STATE UNIVERSITY Enrollment Services - Analysis and ReportingJuly 2, 2013

ENROLLMENT BY STATE AT THE TIME OF APPLICATION*COLUMBUS CAMPUS
SUMMER TERM 2013 COMPARED TO SUMMER TERM 2012 FIFTEENTH DAY ENROLLMENT TABLE 8 Percent PercentState or Territory SU '12 SU '13 Change State or Territory SU '12 SU '13 Change OHIO 10,267 14,297 39.3% DISTRICT OF COLUMBIA 15 20 33.3%CALIFORNIA 204 327 60.3% IOWA 19 19 0.0%PENNSYLVANIA 220 313 42.3% NEBRASKA 12 19 58.3%ILLINOIS 186 291 56.5% LOUISIANA 18 17 -5.6%MICHIGAN 194 264 36.1% NEW HAMPSHIRE 16 17 6.3%
NEW YORK 159 235 47.8% MAINE 8 16 100.0%NEW JERSEY 97 142 46.4% ARKANSAS 17 14 -17.6%TEXAS 95 138 45.3% MISSISSIPPI 8 14 75.0%VIRGINIA 102 137 34.3% NEVADA 7 13 85.7%FLORIDA 98 134 36.7% NEW MEXICO 12 13 8.3%
MARYLAND 83 125 50.6% OKLAHOMA 11 13 18.2%INDIANA 108 110 1.9% HAWAII 6 11 83.3%GEORGIA 70 88 25.7% IDAHO 14 11 -21.4%NORTH CAROLINA 60 80 33.3% RHODE ISLAND 7 9 28.6%WISCONSIN 55 80 45.5% WYOMING 5 8 60.0%
WASHINGTON 38 73 92.1% ALASKA 6 7 16.7%MASSACHUSETTS 62 66 6.5% DELAWARE 9 6 -33.3%UTAH 58 66 13.8% MILITARY ADDRESS 6 5 -16.7%KENTUCKY 42 64 52.4% NORTH DAKOTA 4 5 25.0%MINNESOTA 50 56 12.0% SOUTH DAKOTA 5 5 0.0%
ARIZONA 44 55 25.0% MONTANA 1 2 100.0%MISSOURI 38 50 31.6% VERMONT 5 2 -60.0%TENNESSEE 27 49 81.5% GUAM 0 1CONNECTICUT 27 47 74.1% 0 0 0WEST VIRGINIA 39 44 12.8% 0 0 0
0 0 0COLORADO 27 40 48.1% SOUTH CAROLINA 30 36 20.0% TOTAL U.S. STUDENTS 12,795 17,813 39.2%PUERTO RICO 12 32 166.7% Ohio Students 10,267 14,297 39.3%KANSAS 13 27 107.7% Non-Ohio U.S. Students 2,528 3,516 39.1%ALABAMA 14 24 71.4% includes U.S. Students OREGON 15 21 40.0% from Foreign Countries 50 55 10.0%
*Determined by domestic student's permanent address at time of application for admission. THE OHIO STATE UNIVERSITY Enrollment Services - Analysis and ReportingJuly 2, 2013

FIFTEENTH DAY ENROLLMENT TABLE 9 Percent Percent
Location UG GRD PRF TOT UG GRD PRF TOT Change Location UG GRD PRF TOT UG GRD PRF TOT Change
China 376 552 2 930 717 688 2 1,407 51.3% Bahamas 0 0 0 0 1 0 0 1
India 28 302 1 331 53 331 2 386 16.6% Bosnia and Herzegovina 0 0 0 0 0 1 0 1
Korea, Republic of 59 141 5 205 73 157 6 236 15.1% Bulgaria 0 0 0 0 1 0 0 1
Taiwan 10 64 1 75 18 78 3 99 32.0% Cyprus 0 1 0 1 0 1 0 1 0.0%
Malaysia 37 4 0 41 48 6 1 55 34.1% Czech Republic 0 1 0 1 0 1 0 1 0.0%
Canada 21 30 1 52 26 23 2 51 -1.9% Guatemala 0 1 0 1 0 1 0 1 0.0%
Turkey 0 44 0 44 1 50 0 51 15.9% Haiti 0 1 0 1 0 1 0 1 0.0%
Saudi Arabia 70 1 0 71 37 6 0 43 -39.4% Iceland 0 2 0 2 0 1 0 1 -50.0%
Japan 14 12 0 26 12 17 0 29 11.5% Iraq 0 1 0 1 0 1 0 1 0.0%
Egypt 0 12 0 12 3 21 0 24 100.0% Madagascar 0 1 0 1 0 1 0 1 0.0%
Indonesia 22 14 0 36 12 12 0 24 -33.3% Mauritania 0 0 0 0 1 0 0 1
Colombia 0 18 0 18 0 20 0 20 11.1% Mauritius 0 1 0 1 0 1 0 1 0.0%
Hong Kong 10 6 1 17 13 4 2 19 11.8% Mongolia 0 0 0 0 0 1 0 1
Germany 1 9 0 10 7 10 0 17 70.0% Morocco 0 0 0 0 1 0 0 1
Iran (Islamic Republic Of) 1 15 0 16 1 16 0 17 6.3% Myanmar 0 1 0 1 0 1 0 1 0.0%
Nepal 0 10 0 10 0 15 0 15 50.0% Nicaragua 0 1 0 1 0 1 0 1 0.0%
Sri Lanka 3 4 0 7 9 4 0 13 85.7% Norway 2 0 0 2 1 0 0 1 -50.0%
Thailand 0 17 0 17 2 11 0 13 -23.5% Oman 1 0 0 1 0 1 0 1 0.0%
United Arab Emirates 6 0 0 6 13 0 0 13 116.7% Palestinian Terr., Occupied 0 0 0 0 0 1 0 1
Libyan Arab Jamahiriya 2 5 0 7 4 8 0 12 71.4% Paraguay 0 1 0 1 0 1 0 1 0.0%
Bangladesh 1 9 0 10 1 10 0 11 10.0% Portugal 0 1 0 1 0 1 0 1 0.0%
Kenya 0 4 0 4 2 8 0 10 150.0% Saint Lucia 0 1 0 1 0 1 0 1 0.0%
Russian Federation 1 5 0 6 2 8 0 10 66.7% Serbia 1 1 0 2 1 0 0 1 -50.0%
Mexico 1 7 0 8 3 6 0 9 12.5% Yemen 0 1 0 1 0 1 0 1 0.0%
Nigeria 1 1 0 2 4 5 0 9 350.0% Bahrain 1 0 0 1 0 0 0 0 -100.0%
Pakistan 0 13 0 13 0 9 0 9 -30.8% Congo, The Democratic Republic 1 0 0 1 0 0 0 0 -100.0%
United Kingdom 0 10 1 11 2 6 1 9 -18.2% Croatia 0 1 0 1 0 0 0 0 -100.0%
Chile 0 2 0 2 0 8 0 8 300.0% Estonia 0 1 0 1 0 0 0 0 -100.0%
Costa Rica 1 3 0 4 2 6 0 8 100.0% Finland 1 0 0 1 0 0 0 0 -100.0%
Italy 1 5 0 6 2 6 0 8 33.3% Georgia 0 1 0 1 0 0 0 0 -100.0%
Kuwait 17 3 0 20 5 3 0 8 -60.0% Lithuania 0 1 0 1 0 0 0 0 -100.0%
Singapore 3 2 0 5 4 4 0 8 60.0% Romania 0 2 0 2 0 0 0 0 -100.0%
Viet Nam 3 6 0 9 4 4 0 8 -11.1% Senegal 1 0 0 1 0 0 0 0 -100.0%
Brazil 0 6 0 6 1 6 0 7 16.7% Slovenia 1 0 0 1 0 0 0 0 -100.0%
Peru 0 7 0 7 1 6 0 7 0.0% Syrian Arab Republic 0 1 0 1 0 0 0 0 -100.0%
Tanzania, United Republic of 0 1 0 1 0 7 0 7 600.0% Tajikistan 0 1 0 1 0 0 0 0 -100.0%
France 1 6 0 7 1 5 0 6 -14.3% Tunisia 1 0 0 1 0 0 0 0 -100.0%
Jordan 0 2 0 2 1 5 0 6 200.0% 0 0 0 0 0 0 0 0 0
South Africa 2 2 1 5 1 5 0 6 20.0% 0 0 0 0 0 0 0 0 0
Spain 2 7 0 9 0 6 0 6 -33.3% 0 0 0 0 0 0 0 0 0
Trinidad and Tobago 1 8 0 9 1 5 0 6 -33.3% 0 0 0 0 0 0 0 0 0
Argentina 1 6 0 7 0 5 0 5 -28.6% 0 0 0 0 0 0 0 0 0
Australia 3 0 0 3 4 1 0 5 66.7% 0 0 0 0 0 0 0 0 0
Greece 1 4 0 5 1 4 0 5 0.0% 0 0 0 0 0 0 0 0 0
Lebanon 1 6 0 7 0 5 0 5 -28.6% 0 0 0 0 0 0 0 0 0
New Zealand 2 2 0 4 3 2 0 5 25.0% 0 0 0 0 0 0 0 0 0
Philippines 0 5 0 5 0 5 0 5 0.0% 0 0 0 0 0 0 0 0 0
Ecuador 0 4 0 4 0 4 0 4 0.0% 0 0 0 0 0 0 0 0 0
Ghana 1 4 0 5 1 3 0 4 -20.0% 0 0 0 0 0 0 0 0 0
Israel 1 4 0 5 1 3 0 4 -20.0% 0 0 0 0 0 0 0 0 0
Cameroon 0 2 0 2 0 3 0 3 50.0% 0 0 0 0 0 0 0 0 0
Guyana 0 1 0 1 0 3 0 3 200.0% 0 0 0 0 0 0 0 0 0
Honduras 0 3 0 3 0 3 0 3 0.0% 0 0 0 0 0 0 0 0 0
Ireland 0 0 0 0 1 2 0 3 0 0 0 0 0 0 0 0 0
Jamaica 0 6 0 6 0 3 0 3 -50.0% 0 0 0 0 0 0 0 0 0
Macao 1 1 0 2 2 1 0 3 50.0% 0 0 0 0 0 0 0 0 0
Panama 1 1 0 2 0 3 0 3 50.0% 0 0 0 0 0 0 0 0 0
Poland 0 3 0 3 0 3 0 3 0.0% 0 0 0 0 0 0 0 0 0
Ukraine 1 1 0 2 1 2 0 3 50.0% 0 0 0 0 0 0 0 0 0
Zimbabwe 0 1 0 1 0 3 0 3 200.0% 0 0 0 0 0 0 0 0 0
Austria 0 0 0 0 0 2 0 2 0 0 0 0 0 0 0 0 0
Bolivia 0 4 0 4 0 2 0 2 -50.0% 0 0 0 0 0 0 0 0 0
Hungary 0 0 0 0 1 1 0 2 0 0 0 0 0 0 0 0 0
Netherlands 0 1 0 1 1 1 0 2 100.0% 0 0 0 0 0 0 0 0 0
Slovakia 0 3 0 3 1 1 0 2 -33.3% 0 0 0 0 0 0 0 0 0
Sweden 1 1 0 2 1 1 0 2 0.0% 0 0 0 0 0 0 0 0 0
Switzerland 1 1 0 2 1 1 0 2 0.0%
Uganda 0 2 0 2 0 2 0 2 0.0%
Venezuela 1 6 0 7 0 2 0 2 -71.4%
Albania 0 1 0 1 0 1 0 1 0.0%
Angola 1 0 0 1 1 0 0 1 0.0%
Armenia 0 1 0 1 0 1 0 1 0.0% TOTAL INTERNATIONAL STUDENTS 722 1,467 13 2,202 1,112 1,696 19 2,827 28.4%
THE OHIO STATE UNIVERSITY Enrollment Services - Analysis and ReportingJuly 2, 2013
ENROLLMENT OF INTERNATIONAL STUDENTS TOTAL UNIVERSITY
SUMMER TERM 2013 COMPARED TO SUMMER TERM 2012
SU '12 SU '13 SU '12 SU '13

ENROLLMENT OF INTERNATIONAL STUDENTS BY CURRICULUMCOLUMBUS CAMPUS
SUMMER TERM 2013 COMPARED TO SUMMER TERM 2012FIFTEENTH DAY ENROLLMENT TABLE 10
Enrollment in Enrollment by Graduate Students Degree-Granting Programs in Curricular Academic Programs
Percent of Percent of Percent of Percent ofTotal Enrolled Total Enrolled Total Enrolled Total Enrolled
SU '12 in Curriculum SU '13 in Curriculum SU '12 in Curriculum SU '13 in Curriculum
UNDERGRADUATE GRADUATE
Arts and Sciences 151 4.9% 290 5.7% 559 28.1% 631 30.6% Business 296 32.8% 470 32.8% 49 14.6% 81 19.1% Continuing Education 108 13.9% 60 8.2% n/a n/a n/a n/a Dentistry: Dental Hygiene 0 0.0% 0 0.0% n/a n/a n/a n/a Education and Human Ecology 28 3.1% 36 2.9% 74 12.4% 80 12.0%
Engineering, Total 117 15.0% 233 13.9% 519 59.0% 605 57.3% Engineering 111 15.1% 223 14.3% 513 60.0% 594 59.2% Architecture 6 13.3% 10 8.0% 6 25.0% 11 21.2%
Exploration Program 1 0.4% 4 0.9% n/a n/a n/a n/a
Food, Agricultural, and Environmental Sciences (FAES), Total 11 4.5% 10 2.2% 124 36.0% 141 38.8%
Environment and Natural Resources 3 5.5% 3 2.1% 7 12.7% 13 21.7% FAES 8 4.2% 7 2.2% 117 40.5% 128 42.2% Health and Rehabilitation Sciences 3 1.2% 2 0.5% 3 0.9% 3 1.0% Nursing 2 0.9% 1 0.3% 3 0.9% 0 0.0%
Other Graduate Interdisciplinary n/a n/a n/a n/a 21 4.0% 24 4.0%
Pharmacy 0 0.0% 3 2.5% 33 62.3% 34 61.8%
Public Affairs 1 2.8% 1 1.5% 7 9.5% 5 6.0%
Public Health n/a n/a 0 0.0% 8 8.4% 19 10.6% Social Work 0 0.0% 0 0.0% 1 0.5% 4 1.4% Undergraduate Student Academic Services 0 0.0% 0 0.0% n/a n/a n/a n/a TOTAL 718 9.4% 1,110 9.0%
GRADUATE PROFESSIONAL
Dentistry 3 0.9% 4 1.2% 17 23.0% 23 26.4%Law 1 1.1% 1 1.3% 0 0Medicine 0 0.0% 0 0.0% 13 7.6% 10 5.3%Optometry 0 0.0% 1 0.8% 0 0.0% 0 0.0%Pharmacy, Doctor of 9 6.7% 13 6.5% 0 0Veterinary Medicine 0 0.0% 0 0.0% 35 36.8% 35 37.6% TOTAL 13 1.0% 19 1.2% 1,466 24.0% 1,695 24.8%
THE OHIO STATE UNIVERSITY Enrollment Services - Analysis and ReportingJuly 2, 2013

ENROLLMENT BY RACE AND CAMPUSSUMMER TERM 2013 COMPARED TO SUMMER TERM 2012
FIFTEENTH DAY ENROLLMENT TABLE 11 Columbus Lima Mansfield Marion Newark Wooster TOTAL Nonresident Alien SU '12 2,197 0 2 2 1 0 2,202 SU '13 2,824 1 1 0 1 0 2,827 Change 627 1 -1 -2 0 0 625 % Change 28.5% -50.0% -100.0% 0.0% 28.4% Hispanic SU '12 420 0 8 4 5 1 438 SU '13 681 4 8 6 12 1 712 Change 261 4 0 2 7 0 274 % Change 62.1% 0.0% 50.0% 140.0% 0.0% 62.6% American Indian/Alaskan Native SU '12 37 0 0 0 0 0 37 SU '13 43 0 0 2 0 1 46 Change 6 0 0 2 0 1 9 % Change 16.2% 24.3% Asian SU '12 781 3 2 5 13 1 805 SU '13 1,275 1 5 9 19 1 1,310 Change 494 -2 3 4 6 0 505 % Change 63.3% -66.7% 150.0% 80.0% 46.2% 0.0% 62.7% African American SU '12 979 14 16 14 38 0 1,061 SU '13 1,371 10 24 27 42 0 1,474 Change 392 -4 8 13 4 0 413 % Change 40.0% -28.6% 50.0% 92.9% 10.5% 38.9% Native Hawaiian or Other Pacific Islander SU '12 6 0 0 0 0 0 6 SU '13 14 0 0 0 1 0 15 Change 8 0 0 0 1 0 9 % Change 133.3% 150.0% White SU '12 9,912 176 180 139 276 73 10,756 SU '13 13,502 194 284 281 395 121 14,777 Change 3,590 18 104 142 119 48 4,021 % Change 36.2% 10.2% 57.8% 102.2% 43.1% 65.8% 37.4% Two or More Races SU '12 192 0 6 0 7 0 205 SU '13 388 2 5 5 19 3 422 Change 196 2 -1 5 12 3 217 % Change 102.1% -16.7% 171.4% 105.9% Unknown SU '12 474 5 3 5 6 1 494 SU '13 548 3 8 6 10 4 579 Change 74 -2 5 1 4 3 85 % Change 15.6% -40.0% 166.7% 20.0% 66.7% 300.0% 17.2% TOTAL UNIVERSITY SU '12 14,998 198 217 169 346 76 16,004 SU '13 20,646 215 335 336 499 131 22,162 Change 5,648 17 118 167 153 55 6,158 % Change 37.7% 8.6% 54.4% 98.8% 44.2% 72.4% 38.5%
THE OHIO STATE UNIVERSITY Enrollment Services - Analysis and ReportingJuly 2, 2013
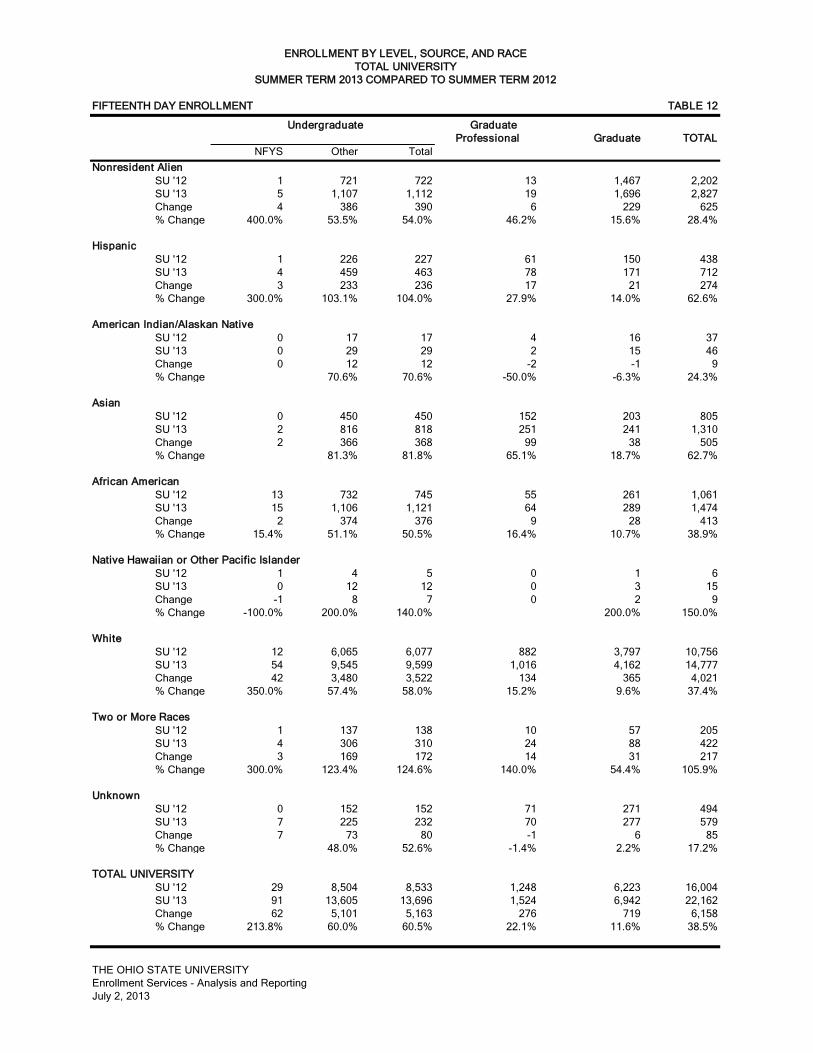
ENROLLMENT BY LEVEL, SOURCE, AND RACETOTAL UNIVERSITY
SUMMER TERM 2013 COMPARED TO SUMMER TERM 2012 FIFTEENTH DAY ENROLLMENT TABLE 12 Undergraduate Graduate Professional Graduate TOTAL NFYS Other Total Nonresident Alien SU '12 1 721 722 13 1,467 2,202 SU '13 5 1,107 1,112 19 1,696 2,827 Change 4 386 390 6 229 625 % Change 400.0% 53.5% 54.0% 46.2% 15.6% 28.4% Hispanic SU '12 1 226 227 61 150 438 SU '13 4 459 463 78 171 712 Change 3 233 236 17 21 274 % Change 300.0% 103.1% 104.0% 27.9% 14.0% 62.6% American Indian/Alaskan Native SU '12 0 17 17 4 16 37 SU '13 0 29 29 2 15 46 Change 0 12 12 -2 -1 9 % Change 70.6% 70.6% -50.0% -6.3% 24.3% Asian SU '12 0 450 450 152 203 805 SU '13 2 816 818 251 241 1,310 Change 2 366 368 99 38 505 % Change 81.3% 81.8% 65.1% 18.7% 62.7% African American SU '12 13 732 745 55 261 1,061 SU '13 15 1,106 1,121 64 289 1,474 Change 2 374 376 9 28 413 % Change 15.4% 51.1% 50.5% 16.4% 10.7% 38.9% Native Hawaiian or Other Pacific Islander SU '12 1 4 5 0 1 6 SU '13 0 12 12 0 3 15 Change -1 8 7 0 2 9 % Change -100.0% 200.0% 140.0% 200.0% 150.0% White SU '12 12 6,065 6,077 882 3,797 10,756 SU '13 54 9,545 9,599 1,016 4,162 14,777 Change 42 3,480 3,522 134 365 4,021 % Change 350.0% 57.4% 58.0% 15.2% 9.6% 37.4% Two or More Races SU '12 1 137 138 10 57 205 SU '13 4 306 310 24 88 422 Change 3 169 172 14 31 217 % Change 300.0% 123.4% 124.6% 140.0% 54.4% 105.9% Unknown SU '12 0 152 152 71 271 494 SU '13 7 225 232 70 277 579 Change 7 73 80 -1 6 85 % Change 48.0% 52.6% -1.4% 2.2% 17.2% TOTAL UNIVERSITY SU '12 29 8,504 8,533 1,248 6,223 16,004 SU '13 91 13,605 13,696 1,524 6,942 22,162 Change 62 5,101 5,163 276 719 6,158 % Change 213.8% 60.0% 60.5% 22.1% 11.6% 38.5%
THE OHIO STATE UNIVERSITY Enrollment Services - Analysis and ReportingJuly 2, 2013

ENROLLMENT BY LEVEL, SOURCE, AND RACECOLUMBUS CAMPUS
SUMMER TERM 2013 COMPARED TO SUMMER TERM 2012 FIFTEENTH DAY ENROLLMENT TABLE 13 Undergraduate Graduate Professional Graduate TOTAL NFYS Other Total Nonresident Alien SU '12 1 717 718 13 1,466 2,197 SU '13 5 1,105 1,110 19 1,695 2,824 Change 4 388 392 6 229 627 % Change 400.0% 54.1% 54.6% 46.2% 15.6% 28.5% Hispanic SU '12 1 208 209 61 150 420 SU '13 3 429 432 78 171 681 Change 2 221 223 17 21 261 % Change 200.0% 106.3% 106.7% 27.9% 14.0% 62.1% American Indian/Alaskan Native SU '12 0 17 17 4 16 37 SU '13 0 26 26 2 15 43 Change 0 9 9 -2 -1 6 % Change 52.9% 52.9% -50.0% -6.3% 16.2% Asian SU '12 0 426 426 152 203 781 SU '13 0 784 784 251 240 1,275 Change 0 358 358 99 37 494 % Change 84.0% 84.0% 65.1% 18.2% 63.3% African American SU '12 13 653 666 55 258 979 SU '13 13 1,006 1,019 64 288 1,371 Change 0 353 353 9 30 392 % Change 0.0% 54.1% 53.0% 16.4% 11.6% 40.0% Native Hawaiian or Other Pacific Islander SU '12 1 4 5 0 1 6 SU '13 0 11 11 0 3 14 Change -1 7 6 0 2 8 % Change -100.0% 175.0% 120.0% 200.0% 133.3% White SU '12 12 5,339 5,351 882 3,679 9,912 SU '13 20 8,404 8,424 1,016 4,062 13,502 Change 8 3,065 3,073 134 383 3,590 % Change 66.7% 57.4% 57.4% 15.2% 10.4% 36.2% Two or More Races SU '12 1 124 125 10 57 192 SU '13 1 275 276 24 88 388 Change 0 151 151 14 31 196 % Change 0.0% 121.8% 120.8% 140.0% 54.4% 102.1% Unknown SU '12 0 136 136 71 267 474 SU '13 6 198 204 70 274 548 Change 6 62 68 -1 7 74 % Change 45.6% 50.0% -1.4% 2.6% 15.6% TOTAL SU '12 29 7,624 7,653 1,248 6,097 14,998 SU '13 48 12,238 12,286 1,524 6,836 20,646 Change 19 4,614 4,633 276 739 5,648 % Change 65.5% 60.5% 60.5% 22.1% 12.1% 37.7%
THE OHIO STATE UNIVERSITY Enrollment Services - Analysis and ReportingJuly 2, 2013

ENROLLMENT BY LEVEL, RACE, AND RESIDENCYTOTAL UNIVERSITY
SUMMER TERM 2013 COMPARED TO SUMMER TERM 2012 FIFTEENTH DAY ENROLLMENT TABLE 14
GraduateUndergraduate Professional Graduate
Not Not Not Ohio Ohio Ohio Ohio Ohio Ohio Resident Resident Total Resident Resident Total Resident Resident Total Nonresident Alien SU '12 722 722 13 13 1,467 1,467 SU '13 1,112 1,112 19 19 1,696 1,696 Change 390 390 6 6 229 229 % Change 54.0% 54.0% 46.2% 46.2% 15.6% 15.6% Hispanic SU '12 189 38 227 59 2 61 67 83 150 SU '13 343 120 463 63 15 78 81 90 171 Change 154 82 236 4 13 17 14 7 21 % Change 81.5% 215.8% 104.0% 6.8% 650.0% 27.9% 20.9% 8.4% 14.0% American Indian/Alaskan Native SU '12 15 2 17 4 0 4 11 5 16 SU '13 26 3 29 2 0 2 11 4 15 Change 11 1 12 -2 0 -2 0 -1 -1 % Change 73.3% 50.0% 70.6% -50.0% -50.0% 0.0% -20.0% -6.3% Asian SU '12 411 39 450 139 13 152 129 74 203 SU '13 723 95 818 211 40 251 154 87 241 Change 312 56 368 72 27 99 25 13 38 % Change 75.9% 143.6% 81.8% 51.8% 207.7% 65.1% 19.4% 17.6% 18.7% African American SU '12 671 74 745 51 4 55 186 75 261 SU '13 984 137 1,121 57 7 64 204 85 289 Change 313 63 376 6 3 9 18 10 28 % Change 46.6% 85.1% 50.5% 11.8% 75.0% 16.4% 9.7% 13.3% 10.7% Native Hawaiian or Other Pacific Islander SU '12 3 2 5 0 0 0 0 1 1 SU '13 6 6 12 0 0 0 0 3 3 Change 3 4 7 0 0 0 0 2 2 % Change 100.0% 200.0% 140.0% 200.0% 200.0% White SU '12 5,650 427 6,077 844 38 882 2,847 950 3,797 SU '13 8,808 791 9,599 937 79 1,016 3,120 1,042 4,162 Change 3,158 364 3,522 93 41 134 273 92 365 % Change 55.9% 85.2% 58.0% 11.0% 107.9% 15.2% 9.6% 9.7% 9.6% Two or More Races SU '12 121 17 138 8 2 10 37 20 57 SU '13 268 42 310 20 4 24 52 36 88 Change 147 25 172 12 2 14 15 16 31 % Change 121.5% 147.1% 124.6% 150.0% 100.0% 140.0% 40.5% 80.0% 54.4% Unknown SU '12 137 15 152 61 10 71 186 85 271 SU '13 211 21 232 46 24 70 166 111 277 Change 74 6 80 -15 14 -1 -20 26 6 % Change 54.0% 40.0% 52.6% -24.6% 140.0% -1.4% -10.8% 30.6% 2.2% TOTAL UNIVERSITY SU '12 7,197 1,336 8,533 1,166 82 1,248 3,463 2,760 6,223 SU '13 11,369 2,327 13,696 1,336 188 1,524 3,788 3,154 6,942 Change 4,172 991 5,163 170 106 276 325 394 719 % Change 58.0% 74.2% 60.5% 14.6% 129.3% 22.1% 9.4% 14.3% 11.6%
THE OHIO STATE UNIVERSITY Enrollment Services - Analysis and ReportingJuly 2, 2013

ENROLLMENT BY FULL-TIME/PART-TIME, LEVEL, AND AGE RANGE TOTAL UNIVERSITY SUMMER TERM 2013
FIFTEENTH DAY ENROLLMENT TABLE 15 FULL-TIME* PART-TIME TOTAL
Men Women Total Men Women Total Men Women Total UNDERGRADUATE
14 to 17 0 1 1 96 53 149 96 54 150 18 to 19 58 97 155 1,021 1,409 2,430 1,079 1,506 2,585 20 to 21 240 414 654 2,237 2,869 5,106 2,477 3,283 5,760 22 to 24 182 207 389 1,498 1,116 2,614 1,680 1,323 3,003 25 to 29 105 57 162 520 405 925 625 462 1,087 30 to 34 39 22 61 200 185 385 239 207 446 35 to 39 19 11 30 96 131 227 115 142 257 40 to 49 14 8 22 78 165 243 92 173 265 50 to 64 1 5 6 35 92 127 36 97 13365 and over 1 0 1 5 4 9 6 4 10 Unknown 0 0 0 0 0 0 0 0 0
TOTAL 659 822 1,481 5,786 6,429 12,215 6,445 7,251 13,696 GRADUATE
14 to 17 0 0 0 0 0 0 0 0 0 18 to 19 0 0 0 0 1 1 0 1 1 20 to 21 8 44 52 11 20 31 19 64 83 22 to 24 142 361 503 584 615 1,199 726 976 1,702 25 to 29 154 249 403 1,250 1,085 2,335 1,404 1,334 2,738 30 to 34 71 103 174 506 510 1,016 577 613 1,190 35 to 39 49 44 93 183 222 405 232 266 498 40 to 49 24 41 65 136 256 392 160 297 457 50 to 64 9 19 28 56 180 236 65 199 26465 and over 0 0 0 1 8 9 1 8 9 Unknown 0 0 0 0 0 0 0 0 0
TOTAL 457 861 1,318 2,727 2,897 5,624 3,184 3,758 6,942 GRADUATEPROFESSIONAL
14 to 17 0 0 0 0 0 0 0 0 0 18 to 19 0 0 0 0 0 0 0 0 0 20 to 21 1 0 1 0 5 5 1 5 6 22 to 24 194 257 451 115 121 236 309 378 687 25 to 29 296 334 630 50 35 85 346 369 715 30 to 34 35 25 60 11 10 21 46 35 81 35 to 39 15 10 25 1 0 1 16 10 26 40 to 49 4 2 6 3 0 3 7 2 9 50 to 64 0 0 0 0 0 0 0 0 0 65 and over 0 0 0 0 0 0 0 0 0 Unknown 0 0 0 0 0 0 0 0 0 TOTAL 545 628 1,173 180 171 351 725 799 1,524
* Undergraduate students are classified as full-time if they register for 12 or more credits. Graduate or graduate professional students are classified as full-time if they register for 8 or more credits. THE OHIO STATE UNIVERSITY Enrollment Services - Analysis and ReportingJuly 2, 2013

ENROLLMENT BY FULL-TIME/PART-TIME, LEVEL, AND AGE RANGE COLUMBUS CAMPUSSUMMER TERM 2013
FIFTEENTH DAY ENROLLMENT TABLE 16 FULL-TIME* PART-TIME TOTAL
Men Women Total Men Women Total Men Women Total UNDERGRADUATE
14 to 17 0 1 1 92 48 140 92 49 141 18 to 19 50 84 134 806 1,173 1,979 856 1,257 2,113 20 to 21 237 392 629 2,118 2,665 4,783 2,355 3,057 5,412 22 to 24 178 197 375 1,409 1,007 2,416 1,587 1,204 2,791 25 to 29 96 53 149 453 338 791 549 391 940 30 to 34 34 10 44 178 146 324 212 156 368 35 to 39 15 6 21 75 96 171 90 102 192 40 to 49 11 6 17 63 130 193 74 136 210 50 to 64 1 4 5 30 75 105 31 79 11065 and over 1 0 1 5 3 8 6 3 9 Unknown 0 0 0 0 0 0 0 0 0
TOTAL 623 753 1,376 5,229 5,681 10,910 5,852 6,434 12,286 GRADUATE
14 to 17 0 0 0 0 0 0 0 0 0 18 to 19 0 0 0 0 1 1 0 1 1 20 to 21 8 43 51 11 20 31 19 63 82 22 to 24 140 353 493 581 598 1,179 721 951 1,672 25 to 29 154 246 400 1,249 1,069 2,318 1,403 1,315 2,718 30 to 34 71 102 173 506 495 1,001 577 597 1,174 35 to 39 49 40 89 181 218 399 230 258 488 40 to 49 24 40 64 135 239 374 159 279 438 50 to 64 9 19 28 55 171 226 64 190 25465 and over 0 0 0 1 8 9 1 8 9 Unknown 0 0 0 0 0 0 0 0 0
TOTAL 455 843 1,298 2,719 2,819 5,538 3,174 3,662 6,836 GRADUATEPROFESSIONAL
14 to 17 0 0 0 0 0 0 0 0 0 18 to 19 0 0 0 0 0 0 0 0 0 20 to 21 1 0 1 0 5 5 1 5 6 22 to 24 194 257 451 115 121 236 309 378 687 25 to 29 296 334 630 50 35 85 346 369 715 30 to 34 35 25 60 11 10 21 46 35 81 35 to 39 15 10 25 1 0 1 16 10 26 40 to 49 4 2 6 3 0 3 7 2 9 50 to 64 0 0 0 0 0 0 0 0 0 65 and over 0 0 0 0 0 0 0 0 0 Unknown 0 0 0 0 0 0 0 0 0 TOTAL 545 628 1,173 180 171 351 725 799 1,524
* Undergraduate students are classified as full-time if they register for 12 or more credits. Graduate or graduate professional students are classified as full-time if they register for 8 or more credits. THE OHIO STATE UNIVERSITY Enrollment Services - Analysis and ReportingJuly 2, 2013

SUPPLEMENTAL TABLES
Supplement: Title:
1 Total University by College, Campus, and Sex
2 Total University by College, Rank, and Sex
3 Columbus Campus by College, Rank, and Sex
4 Not-Columbus Campuses by College, Rank, and Sex
5 Total University by College, Race, and Sex
6 Columbus Campus by College, Race, and Sex
7 Not-Columbus Campuses by College, Race, and Sex
8 Total University Nonresident Alien Students by College and School, by Source
9 Total University Hispanic Students by College and School, by Source
10 Total University American Indian/Alaskan Native Students by College and School, by Source
11 Total University Asian Students by College and School, by Source
12 Total University African American Students by College and School, by Source
13 Total University Native Hawaiian or Other Pacific Islander Students by College and School, by
Source
14 Total University White Students by College and School, by Source
15 Total University Two or More Races Students by College and School, by Source
16 Total University Race Unknown Students by College and School, by Source
17 Total University Total Enrollment by College and School, by Source
18 Columbus Campus Nonresident Alien Students by College and School, by Source
19 Columbus Campus Hispanic Students by College and School, by Source
20 Columbus Campus American Indian/Alaskan Native Students by College and School, by Source
21 Columbus Campus Asian Students by College and School, by Source
22 Columbus Campus African American Students by College and School, by Source
23 Columbus Campus Native Hawaiian or Other Pacific Islander Students by College and School, by Source
24 Columbus Campus White Students by College and School, by Source
25 Columbus Campus Two or More Races Students by College and School, by Source
26 Columbus Campus Race Unknown Students by College and School, by Source
27 Columbus Campus Total Enrollment by College and School, by Source
28 Total University Students With Disabilities by College and School, by Source
29 Total University Full-time/Part-time Students by Level, Sex, and Source
30 Columbus Campus Full-time/Part-time Students by Level, Sex, and Source
31 Not-Columbus Campuses Full-time/Part-time Students by Level, Sex, and Source
32 Total University Enrollment by College and School, Level, Sex, and Full-time/Part-time
33 Total University Enrollment by Campus, Level, Sex, and Full-time/Part-time Status
34 Columbus Campus Enrollment by Level, Sex, and Age
35 Columbus Campus Enrollment of New Undergraduate Students by Sex and Age
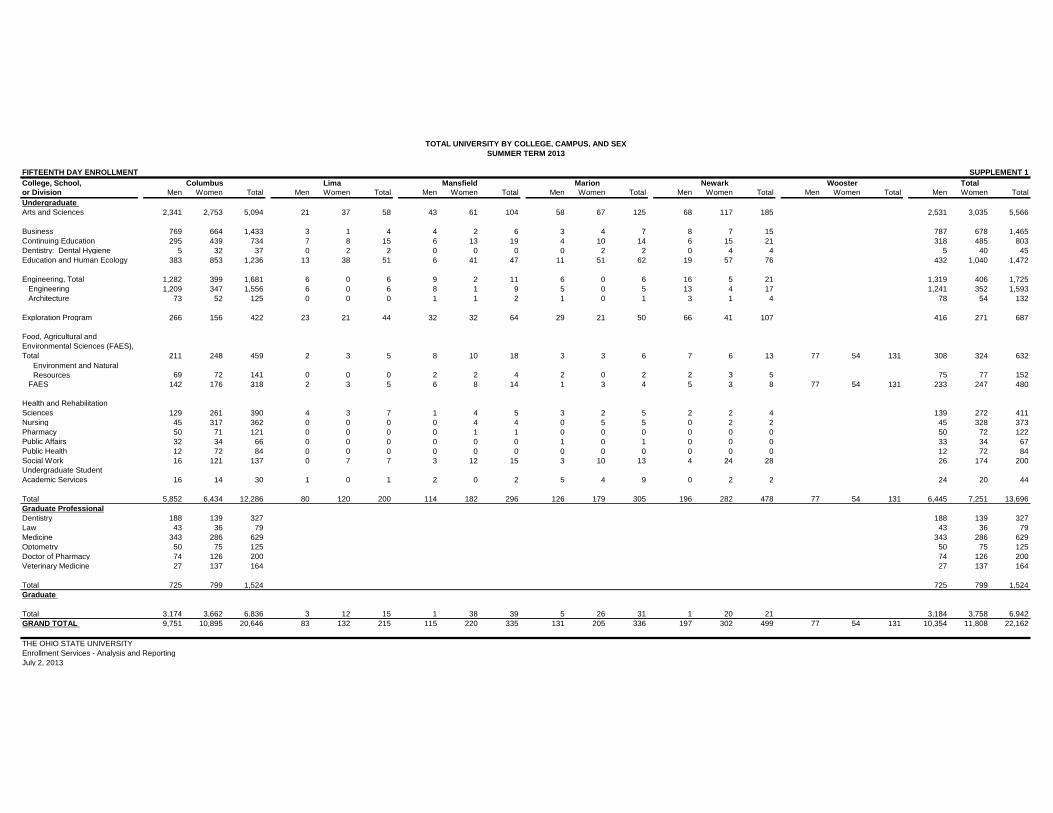
TOTAL UNIVERSITY BY COLLEGE, CAMPUS, AND SEXSUMMER TERM 2013
FIFTEENTH DAY ENROLLMENT SUPPLEMENT 1
College, School, Columbus Lima Mansfield Marion Newark Wooster Totalor Division Men Women Total Men Women Total Men Women Total Men Women Total Men Women Total Men Women Total Men Women TotalUndergraduate Arts and Sciences 2,341 2,753 5,094 21 37 58 43 61 104 58 67 125 68 117 185 2,531 3,035 5,566 Business 769 664 1,433 3 1 4 4 2 6 3 4 7 8 7 15 787 678 1,465Continuing Education 295 439 734 7 8 15 6 13 19 4 10 14 6 15 21 318 485 803Dentistry: Dental Hygiene 5 32 37 0 2 2 0 0 0 0 2 2 0 4 4 5 40 45Education and Human Ecology 383 853 1,236 13 38 51 6 41 47 11 51 62 19 57 76 432 1,040 1,472
Engineering, Total 1,282 399 1,681 6 0 6 9 2 11 6 0 6 16 5 21 1,319 406 1,725 Engineering 1,209 347 1,556 6 0 6 8 1 9 5 0 5 13 4 17 1,241 352 1,593 Architecture 73 52 125 0 0 0 1 1 2 1 0 1 3 1 4 78 54 132
Exploration Program 266 156 422 23 21 44 32 32 64 29 21 50 66 41 107 416 271 687
Food, Agricultural and Environmental Sciences (FAES), Total 211 248 459 2 3 5 8 10 18 3 3 6 7 6 13 77 54 131 308 324 632
Environment and Natural Resources 69 72 141 0 0 0 2 2 4 2 0 2 2 3 5 75 77 152
FAES 142 176 318 2 3 5 6 8 14 1 3 4 5 3 8 77 54 131 233 247 480
Health and Rehabilitation Sciences 129 261 390 4 3 7 1 4 5 3 2 5 2 2 4 139 272 411Nursing 45 317 362 0 0 0 0 4 4 0 5 5 0 2 2 45 328 373Pharmacy 50 71 121 0 0 0 0 1 1 0 0 0 0 0 0 50 72 122Public Affairs 32 34 66 0 0 0 0 0 0 1 0 1 0 0 0 33 34 67Public Health 12 72 84 0 0 0 0 0 0 0 0 0 0 0 0 12 72 84Social Work 16 121 137 0 7 7 3 12 15 3 10 13 4 24 28 26 174 200Undergraduate Student Academic Services 16 14 30 1 0 1 2 0 2 5 4 9 0 2 2 24 20 44 Total 5,852 6,434 12,286 80 120 200 114 182 296 126 179 305 196 282 478 77 54 131 6,445 7,251 13,696Graduate Professional Dentistry 188 139 327 188 139 327Law 43 36 79 43 36 79Medicine 343 286 629 343 286 629Optometry 50 75 125 50 75 125Doctor of Pharmacy 74 126 200 74 126 200Veterinary Medicine 27 137 164 27 137 164 Total 725 799 1,524 725 799 1,524Graduate Total 3,174 3,662 6,836 3 12 15 1 38 39 5 26 31 1 20 21 3,184 3,758 6,942GRAND TOTAL 9,751 10,895 20,646 83 132 215 115 220 335 131 205 336 197 302 499 77 54 131 10,354 11,808 22,162
THE OHIO STATE UNIVERSITY Enrollment Services - Analysis and ReportingJuly 2, 2013

TOTAL UNIVERSITY BY COLLEGE, RANK, AND SEXSUMMER TERM 2013
FIFTEENTH DAY ENROLLMENT SUPPLEMENT 2
College, School, Freshmen Sophomores Juniors Seniors Visitor Totalor Division Men Women Total Men Women Total Men Women Total Men Women Total Men Women Total Men Women TotalUndergraduate Arts and Sciences 98 100 198 275 393 668 633 873 1,506 1,525 1,669 3,194 2,531 3,035 5,566 Business 30 12 42 120 101 221 227 218 445 410 347 757 787 678 1,465Continuing Education 36 73 109 7 8 15 5 4 9 101 176 277 169 224 393 318 485 803Dentistry: Dental Hygiene 0 2 2 0 7 7 0 0 0 5 31 36 5 40 45Education and Human Ecology 34 52 86 40 112 152 101 275 376 257 601 858 432 1,040 1,472
Engineering, Total 47 12 59 183 59 242 338 110 448 751 225 976 1,319 406 1,725 Engineering 41 11 52 172 51 223 319 90 409 709 200 909 1,241 352 1,593 Architecture 6 1 7 11 8 19 19 20 39 42 25 67 78 54 132
Exploration Program 126 72 198 152 122 274 94 56 150 44 21 65 416 271 687
Food, Agricultural and Environmental Sciences (FAES), Total 23 20 43 92 94 186 59 74 133 134 136 270 308 324 632
Environment and Natural Resources 3 3 6 7 14 21 20 24 44 45 36 81 75 77 152
FAES 20 17 37 85 80 165 39 50 89 89 100 189 233 247 480
Health and Rehabilitation Sciences 11 12 23 23 49 72 38 61 99 67 150 217 139 272 411Nursing 0 4 4 3 26 29 1 57 58 41 241 282 45 328 373Pharmacy 1 2 3 4 9 13 18 25 43 27 36 63 50 72 122Public Affairs 0 0 0 6 5 11 7 12 19 20 17 37 33 34 67Public Health 0 2 2 1 10 11 5 25 30 6 35 41 12 72 84Social Work 3 10 13 1 33 34 9 50 59 13 81 94 26 174 200Undergraduate Student Academic Services 14 12 26 5 5 10 2 3 5 3 0 3 24 20 44 Total 423 385 808 912 1,033 1,945 1,537 1,843 3,380 3,404 3,766 7,170 169 224 393 6,445 7,251 13,696Graduate Professional Dentistry 0 0 0 63 50 113 65 41 106 60 48 108 188 139 327Law 36 30 66 1 2 3 6 4 10 0 0 0 43 36 79Medicine 97 77 174 2 8 10 131 106 237 113 95 208 343 286 629Optometry 0 0 0 0 0 0 18 43 61 32 32 64 50 75 125Doctor of Pharmacy 0 0 0 19 19 38 6 18 24 49 89 138 74 126 200Veterinary Medicine 0 0 0 3 17 20 0 2 2 24 118 142 27 137 164 Total 133 107 240 88 96 184 226 214 440 278 382 660 725 799 1,524Graduate Total 3,184 3,758 6,942GRAND TOTAL 556 492 1,048 1,000 1,129 2,129 1,763 2,057 3,820 3,682 4,148 7,830 169 224 393 10,354 11,808 22,162
THE OHIO STATE UNIVERSITY Enrollment Services - Analysis and ReportingJuly 2, 2013

COLUMBUS CAMPUS BY COLLEGE, RANK, AND SEXSUMMER TERM 2013
FIFTEENTH DAY ENROLLMENT SUPPLEMENT 3
College, School, Freshmen Sophomores Juniors Seniors Visitor Totalor Division Men Women Total Men Women Total Men Women Total Men Women Total Men Women Total Men Women TotalUndergraduate Arts and Sciences 49 54 103 232 330 562 597 810 1,407 1,463 1,559 3,022 2,341 2,753 5,094 Business 26 11 37 115 95 210 222 215 437 406 343 749 769 664 1,433Continuing Education 22 53 75 5 6 11 5 3 8 98 161 259 165 216 381 295 439 734Dentistry: Dental Hygiene 0 1 1 0 1 1 0 0 0 5 30 35 5 32 37Education and Human Ecology 28 24 52 34 85 119 89 239 328 232 505 737 383 853 1,236
Engineering, Total 29 10 39 172 55 227 336 110 446 745 224 969 1,282 399 1,681 Engineering 26 10 36 162 48 210 317 90 407 704 199 903 1,209 347 1,556 Architecture 3 0 3 10 7 17 19 20 39 41 25 66 73 52 125
Exploration Program 43 22 65 106 76 182 81 45 126 36 13 49 266 156 422
Food, Agricultural and Environmental Sciences (FAES), Total 2 4 6 20 40 60 57 70 127 132 134 266 211 248 459
Environment and Natural Resources 0 2 2 5 10 15 19 24 43 45 36 81 69 72 141
FAES 2 2 4 15 30 45 38 46 84 87 98 185 142 176 318
Health and Rehabilitation Sciences 5 10 15 22 46 68 37 58 95 65 147 212 129 261 390Nursing 0 2 2 3 24 27 1 55 56 41 236 277 45 317 362Pharmacy 1 1 2 4 9 13 18 25 43 27 36 63 50 71 121Public Affairs 0 0 0 6 5 11 7 12 19 19 17 36 32 34 66Public Health 0 2 2 1 10 11 5 25 30 6 35 41 12 72 84Social Work 0 1 1 0 17 17 7 36 43 9 67 76 16 121 137Undergraduate Student Academic Services 13 9 22 2 4 6 0 1 1 1 0 1 16 14 30 Total 218 204 422 722 803 1,525 1,462 1,704 3,166 3,285 3,507 6,792 165 216 381 5,852 6,434 12,286Graduate Professional Dentistry 0 0 0 63 50 113 65 41 106 60 48 108 188 139 327Law 36 30 66 1 2 3 6 4 10 0 0 0 43 36 79Medicine 97 77 174 2 8 10 131 106 237 113 95 208 343 286 629Optometry 0 0 0 0 0 0 18 43 61 32 32 64 50 75 125Doctor of Pharmacy 0 0 0 19 19 38 6 18 24 49 89 138 74 126 200Veterinary Medicine 0 0 0 3 17 20 0 2 2 24 118 142 27 137 164 Total 133 107 240 88 96 184 226 214 440 278 382 660 725 799 1,524Graduate Total 3,174 3,662 6,836GRAND TOTAL 351 311 662 810 899 1,709 1,688 1,918 3,606 3,563 3,889 7,452 165 216 381 9,751 10,895 20,646
THE OHIO STATE UNIVERSITY Enrollment Services - Analysis and ReportingJuly 2, 2013

EXTENDED CAMPUSES BY COLLEGE, RANK, AND SEXSUMMER TERM 2013
FIFTEENTH DAY ENROLLMENT SUPPLEMENT 4
College, School, Freshmen Sophomores Juniors Seniors Visitor Totalor Division Men Women Total Men Women Total Men Women Total Men Women Total Men Women Total Men Women TotalUndergraduate Arts and Sciences 49 46 95 43 63 106 36 63 99 62 110 172 190 282 472 Business 4 1 5 5 6 11 5 3 8 4 4 8 18 14 32Continuing Education 14 20 34 2 2 4 0 1 1 3 15 18 4 8 12 23 46 69Dentistry: Dental Hygiene 0 1 1 0 6 6 0 0 0 0 1 1 0 8 8Education and Human Ecology 6 28 34 6 27 33 12 36 48 25 96 121 49 187 236
Engineering, Total 18 2 20 11 4 15 2 0 2 6 1 7 37 7 44 Engineering 15 1 16 10 3 13 2 0 2 5 1 6 32 5 37 Architecture 3 1 4 1 1 2 0 0 0 1 0 1 5 2 7
Exploration Program 83 50 133 46 46 92 13 11 24 8 8 16 150 115 265
Food, Agricultural and Environmental Sciences (FAES), Total 21 16 37 72 54 126 2 4 6 2 2 4 97 76 173
Environment and Natural Resources 3 1 4 2 4 6 1 0 1 0 0 0 6 5 11
FAES 18 15 33 70 50 120 1 4 5 2 2 4 91 71 162
Health and Rehabilitation Sciences 6 2 8 1 3 4 1 3 4 2 3 5 10 11 21Nursing 0 2 2 0 2 2 0 2 2 0 5 5 0 11 11Pharmacy 0 1 1 0 0 0 0 0 0 0 0 0 0 1 1Public Affairs 0 0 0 0 0 0 0 0 0 1 0 1 1 0 1Public Health 0 0 0 0 0 0 0 0 0 0 0 0 0 0 0Social Work 3 9 12 1 16 17 2 14 16 4 14 18 10 53 63Undergraduate Student Academic Services 1 3 4 3 1 4 2 2 4 2 0 2 8 6 14 Total 205 181 386 190 230 420 75 139 214 119 259 378 4 8 12 593 817 1,410Graduate Professional Dentistry 0 0 0 0 0 0 0 0 0 0 0 0 0 0 0Law 0 0 0 0 0 0 0 0 0 0 0 0 0 0 0Medicine 0 0 0 0 0 0 0 0 0 0 0 0 0 0 0Optometry 0 0 0 0 0 0 0 0 0 0 0 0 0 0 0Doctor of Pharmacy 0 0 0 0 0 0 0 0 0 0 0 0 0 0 0Veterinary Medicine 0 0 0 0 0 0 0 0 0 0 0 0 0 0 0 Total 0 0 0 0 0 0 0 0 0 0 0 0 0 0 0Graduate Total 10 96 106GRAND TOTAL 205 181 386 190 230 420 75 139 214 119 259 378 4 8 12 603 913 1,516
THE OHIO STATE UNIVERSITY Enrollment Services - Analysis and ReportingJuly 2, 2013

TOTAL UNIVERSITY BY COLLEGE, RACE, AND SEXSUMMER TERM 2013
FIFTEENTH DAY ENROLLMENT SUPPLEMENT 5
College, School,or Division Men Women Total Men Women Total Men Women Total Men Women Total Men Women Total Men Women Total Men Women Total Men Women Total Men Women Total Men Women TotalUndergraduate Arts and Sciences 140 152 292 103 107 210 8 3 11 155 217 372 213 291 504 1 5 6 1,820 2,100 3,920 48 107 155 43 53 96 2,531 3,035 5,566
Business 190 280 470 16 20 36 0 0 0 46 44 90 34 23 57 0 0 0 482 296 778 9 12 21 10 3 13 787 678 1,465Continuing Education 32 28 60 16 30 46 1 1 2 19 15 34 33 43 76 0 0 0 203 343 546 4 7 11 10 18 28 318 485 803Dentistry: Dental Hygiene 0 0 0 0 3 3 0 0 0 0 0 0 1 3 4 0 0 0 3 33 36 0 1 1 1 0 1 5 40 45Education and Human Ecology 11 25 36 14 26 40 3 5 8 8 26 34 52 93 145 1 1 2 329 828 1,157 7 23 30 7 13 20 432 1,040 1,472
Engineering, Total 176 57 233 32 16 48 1 0 1 119 33 152 62 22 84 1 0 1 888 257 1,145 18 18 36 22 3 25 1,319 406 1,725 Engineering 172 51 223 30 12 42 1 0 1 117 31 148 56 20 76 1 0 1 826 219 1,045 17 16 33 21 3 24 1,241 352 1,593 Architecture 4 6 10 2 4 6 0 0 0 2 2 4 6 2 8 0 0 0 62 38 100 1 2 3 1 0 1 78 54 132
Exploration Program 4 0 4 14 16 30 1 0 1 29 17 46 63 34 97 3 0 3 283 188 471 7 10 17 12 6 18 416 271 687
Food, Agricultural and Environmental Sciences (FAES), Total 2 8 10 8 8 16 2 1 3 2 5 7 8 7 15 0 0 0 273 282 555 5 7 12 8 6 14 308 324 632
Environment and Natural Resources 1 2 3 2 1 3 0 0 0 0 3 3 0 1 1 0 0 0 70 65 135 0 2 2 2 3 5 75 77 152
FAES 1 6 7 6 7 13 2 1 3 2 2 4 8 6 14 0 0 0 203 217 420 5 5 10 6 3 9 233 247 480
Health and Rehabilitation Sciences 0 2 2 7 5 12 2 0 2 9 20 29 15 24 39 0 0 0 103 213 316 2 6 8 1 2 3 139 272 411Nursing 0 1 1 0 11 11 0 0 0 1 13 14 1 18 19 0 0 0 41 273 314 2 7 9 0 5 5 45 328 373Pharmacy 0 3 3 1 1 2 0 0 0 7 13 20 4 4 8 0 0 0 36 46 82 0 4 4 2 1 3 50 72 122Public Affairs 0 1 1 1 1 2 0 0 0 2 3 5 5 7 12 0 0 0 24 21 45 1 0 1 0 1 1 33 34 67Public Health 0 0 0 0 1 1 0 0 0 0 6 6 2 12 14 0 0 0 10 49 59 0 1 1 0 3 3 12 72 84Social Work 0 0 0 0 5 5 1 0 1 1 2 3 6 36 42 0 0 0 17 127 144 0 4 4 1 0 1 26 174 200Undergraduate Student Academic Services 0 0 0 1 0 1 0 0 0 3 3 6 3 2 5 0 0 0 17 14 31 0 0 0 0 1 1 24 20 44 Total 555 557 1,112 213 250 463 19 10 29 401 417 818 502 619 1,121 6 6 12 4,529 5,070 9,599 103 207 310 117 115 232 6,445 7,251 13,696Graduate Professional Dentistry 3 1 4 7 7 14 0 0 0 15 21 36 5 5 10 0 0 0 151 97 248 3 4 7 4 4 8 188 139 327Law 1 0 1 4 2 6 0 0 0 3 1 4 0 6 6 0 0 0 25 23 48 0 2 2 10 2 12 43 36 79Medicine 0 0 0 22 21 43 1 0 1 84 67 151 7 35 42 0 0 0 204 147 351 2 9 11 23 7 30 343 286 629Optometry 0 1 1 2 2 4 0 0 0 4 7 11 0 1 1 0 0 0 43 61 104 0 1 1 1 2 3 50 75 125Doctor of Pharmacy 3 10 13 3 2 5 0 1 1 21 23 44 1 4 5 0 0 0 44 80 124 0 1 1 2 5 7 74 126 200Veterinary Medicine 0 0 0 1 5 6 0 0 0 2 3 5 0 0 0 0 0 0 22 119 141 0 2 2 2 8 10 27 137 164 Total 7 12 19 39 39 78 1 1 2 129 122 251 13 51 64 0 0 0 489 527 1,016 5 19 24 42 28 70 725 799 1,524Graduate Total 1,003 693 1,696 72 99 171 10 5 15 111 130 241 95 194 289 2 1 3 1,728 2,434 4,162 30 58 88 133 144 277 3,184 3,758 6,942
GRAND TOTAL 1,565 1,262 2,827 324 388 712 30 16 46 641 669 1,310 610 864 1,474 8 7 15 6,746 8,031 14,777 138 284 422 292 287 579 10,354 11,808 22,162
THE OHIO STATE UNIVERSITY Enrollment Services - Analysis and ReportingJuly 2, 2013
AsianAmerican Indian or Alaskan
NativeHispanicNonresident Alien TotalWhiteNative Hawaiian or Other
Pacific IslanderAfrican American UnknownTwo or More Races

FIFTEENTH DAY ENROLLMENT SUPPLEMENT 6
College, School,or Division Men Women Total Men Women Total Men Women Total Men Women Total Men Women Total Men Women Total Men Women Total Men Women Total Men Women Total Men Women TotalUndergraduate Arts and Sciences 139 151 290 97 98 195 7 3 10 149 210 359 191 273 464 1 4 5 1,676 1,869 3,545 43 98 141 38 47 85 2,341 2,753 5,094
Business 190 280 470 16 20 36 0 0 0 45 43 88 33 23 56 0 0 0 467 283 750 8 12 20 10 3 13 769 664 1,433Continuing Education 32 28 60 16 30 46 1 1 2 19 15 34 31 43 74 0 0 0 183 298 481 4 7 11 9 17 26 295 439 734Dentistry: Dental Hygiene 0 0 0 0 3 3 0 0 0 0 0 0 1 3 4 0 0 0 3 26 29 0 0 0 1 0 1 5 32 37Education and Human Ecology 11 25 36 13 22 35 3 5 8 8 26 34 49 86 135 1 1 2 286 659 945 7 17 24 5 12 17 383 853 1,236
Engineering, Total 176 57 233 31 16 47 1 0 1 116 33 149 61 21 82 1 0 1 856 253 1,109 18 16 34 22 3 25 1,282 399 1,681 Engineering 172 51 223 30 12 42 1 0 1 114 31 145 55 20 75 1 0 1 798 216 1,014 17 14 31 21 3 24 1,209 347 1,556 Architecture 4 6 10 1 4 5 0 0 0 2 2 4 6 1 7 0 0 0 58 37 95 1 2 3 1 0 1 73 52 125
Exploration Program 4 0 4 11 14 25 1 0 1 21 13 34 41 25 66 3 0 3 172 93 265 4 9 13 9 2 11 266 156 422
Food, Agricultural and Environmental Sciences (FAES), Total 2 8 10 7 7 14 1 1 2 1 5 6 8 7 15 0 0 0 185 210 395 2 5 7 5 5 10 211 248 459
Environment and Natural Resources 1 2 3 2 1 3 0 0 0 0 3 3 0 1 1 0 0 0 64 61 125 0 1 1 2 3 5 69 72 141
FAES 1 6 7 5 6 11 1 1 2 1 2 3 8 6 14 0 0 0 121 149 270 2 4 6 3 2 5 142 176 318
Health and Rehabilitation Sciences 0 2 2 5 5 10 2 0 2 9 20 29 14 23 37 0 0 0 96 203 299 2 6 8 1 2 3 129 261 390Nursing 0 1 1 0 10 10 0 0 0 1 11 12 1 18 19 0 0 0 41 265 306 2 7 9 0 5 5 45 317 362Pharmacy 0 3 3 1 1 2 0 0 0 7 13 20 4 4 8 0 0 0 36 45 81 0 4 4 2 1 3 50 71 121Public Affairs 0 1 1 1 1 2 0 0 0 2 3 5 4 7 11 0 0 0 24 21 45 1 0 1 0 1 1 32 34 66Public Health 0 0 0 0 1 1 0 0 0 0 6 6 2 12 14 0 0 0 10 49 59 0 1 1 0 3 3 12 72 84Social Work 0 0 0 0 5 5 0 0 0 1 1 2 3 28 31 0 0 0 12 84 96 0 3 3 0 0 0 16 121 137Undergraduate Student Academic Services 0 0 0 1 0 1 0 0 0 3 3 6 1 2 3 0 0 0 11 8 19 0 0 0 0 1 1 16 14 30 Total 554 556 1,110 199 233 432 16 10 26 382 402 784 444 575 1,019 6 5 11 4,058 4,366 8,424 91 185 276 102 102 204 5,852 6,434 12,286Graduate Professional Dentistry 3 1 4 7 7 14 0 0 0 15 21 36 5 5 10 0 0 0 151 97 248 3 4 7 4 4 8 188 139 327Law 1 0 1 4 2 6 0 0 0 3 1 4 0 6 6 0 0 0 25 23 48 0 2 2 10 2 12 43 36 79Medicine 0 0 0 22 21 43 1 0 1 84 67 151 7 35 42 0 0 0 204 147 351 2 9 11 23 7 30 343 286 629Optometry 0 1 1 2 2 4 0 0 0 4 7 11 0 1 1 0 0 0 43 61 104 0 1 1 1 2 3 50 75 125Doctor of Pharmacy 3 10 13 3 2 5 0 1 1 21 23 44 1 4 5 0 0 0 44 80 124 0 1 1 2 5 7 74 126 200Veterinary Medicine 0 0 0 1 5 6 0 0 0 2 3 5 0 0 0 0 0 0 22 119 141 0 2 2 2 8 10 27 137 164 Total 7 12 19 39 39 78 1 1 2 129 122 251 13 51 64 0 0 0 489 527 1,016 5 19 24 42 28 70 725 799 1,524Graduate Total 1,003 692 1,695 72 99 171 10 5 15 111 129 240 95 193 288 2 1 3 1,718 2,344 4,062 30 58 88 133 141 274 3,174 3,662 6,836
GRAND TOTAL 1,564 1,260 2,824 310 371 681 27 16 43 622 653 1,275 552 819 1,371 8 6 14 6,265 7,237 13,502 126 262 388 277 271 548 9,751 10,895 20,646
THE OHIO STATE UNIVERSITY Enrollment Services - Analysis and ReportingJuly 2, 2013
COLUMBUS CAMPUS BY COLLEGE, RACE, AND SEXSUMMER TERM 2013
Nonresident Alien HispanicAmerican Indian or Alaskan
Native Asian Unknown TotalAfrican AmericanNative Hawaiian or Other
Pacific Islander White Two or More Races

FIFTEENTH DAY ENROLLMENT SUPPLEMENT 7
College, School,or Division Men Women Total Men Women Total Men Women Total Men Women Total Men Women Total Men Women Total Men Women Total Men Women Total Men Women Total Men Women TotalUndergraduate Arts and Sciences 1 1 2 6 9 15 1 0 1 6 7 13 22 18 40 0 1 1 144 231 375 5 9 14 5 6 11 190 282 472 Arts and Sciences, General 1 1 2 6 9 15 1 0 1 6 7 13 22 18 40 0 1 1 144 231 375 5 9 14 5 6 11 190 282 472 The Arts, Total 0 0 0 0 0 0 0 0 0 0 0 0 0 0 0 0 0 0 0 0 0 0 0 0 0 0 0 0 0 0 The Arts 0 0 0 0 0 0 0 0 0 0 0 0 0 0 0 0 0 0 0 0 0 0 0 0 0 0 0 0 0 0 Music 0 0 0 0 0 0 0 0 0 0 0 0 0 0 0 0 0 0 0 0 0 0 0 0 0 0 0 0 0 0 Biological Sciences 0 0 0 0 0 0 0 0 0 0 0 0 0 0 0 0 0 0 0 0 0 0 0 0 0 0 0 0 0 0 Humanities 0 0 0 0 0 0 0 0 0 0 0 0 0 0 0 0 0 0 0 0 0 0 0 0 0 0 0 0 0 0
Mathematical and Physical Sciences, Total 0 0 0 0 0 0 0 0 0 0 0 0 0 0 0 0 0 0 0 0 0 0 0 0 0 0 0 0 0 0
Earth Science 0 0 0 0 0 0 0 0 0 0 0 0 0 0 0 0 0 0 0 0 0 0 0 0 0 0 0 0 0 0Mathematical and Physical Sciences 0 0 0 0 0 0 0 0 0 0 0 0 0 0 0 0 0 0 0 0 0 0 0 0 0 0 0 0 0 0
Social & Behavioral Sciences 0 0 0 0 0 0 0 0 0 0 0 0 0 0 0 0 0 0 0 0 0 0 0 0 0 0 0 0 0 0
Business 0 0 0 0 0 0 0 0 0 1 1 2 1 0 1 0 0 0 15 13 28 1 0 1 0 0 0 18 14 32Continuing Education 0 0 0 0 0 0 0 0 0 0 0 0 2 0 2 0 0 0 20 45 65 0 0 0 1 1 2 23 46 69Dentistry: Dental Hygiene 0 0 0 0 0 0 0 0 0 0 0 0 0 0 0 0 0 0 0 7 7 0 1 1 0 0 0 0 8 8Education and Human Ecology 0 0 0 1 4 5 0 0 0 0 0 0 3 7 10 0 0 0 43 169 212 0 6 6 2 1 3 49 187 236
Engineering, Total 0 0 0 1 0 1 0 0 0 3 0 3 1 1 2 0 0 0 32 4 36 0 2 2 0 0 0 37 7 44 Engineering 0 0 0 0 0 0 0 0 0 3 0 3 1 0 1 0 0 0 28 3 31 0 2 2 0 0 0 32 5 37 Architecture 0 0 0 1 0 1 0 0 0 0 0 0 0 1 1 0 0 0 4 1 5 0 0 0 0 0 0 5 2 7
Exploration Program 0 0 0 3 2 5 0 0 0 8 4 12 22 9 31 0 0 0 111 95 206 3 1 4 3 4 7 150 115 265
Food, Agricultural and Environmental Sciences (FAES), Total 0 0 0 1 1 2 1 0 1 1 0 1 0 0 0 0 0 0 88 72 160 3 2 5 3 1 4 97 76 173
Environment and Natural Resources 0 0 0 0 0 0 0 0 0 0 0 0 0 0 0 0 0 0 6 4 10 0 1 1 0 0 0 6 5 11
FAES 0 0 0 1 1 2 1 0 1 1 0 1 0 0 0 0 0 0 82 68 150 3 1 4 3 1 4 91 71 162
Health and Rehabilitation Sciences 0 0 0 2 0 2 0 0 0 0 0 0 1 1 2 0 0 0 7 10 17 0 0 0 0 0 0 10 11 21Nursing 0 0 0 0 1 1 0 0 0 0 2 2 0 0 0 0 0 0 0 8 8 0 0 0 0 0 0 0 11 11Pharmacy 0 0 0 0 0 0 0 0 0 0 0 0 0 0 0 0 0 0 0 1 1 0 0 0 0 0 0 0 1 1Public Affairs 0 0 0 0 0 0 0 0 0 0 0 0 1 0 1 0 0 0 0 0 0 0 0 0 0 0 0 1 0 1Public Health 0 0 0 0 0 0 0 0 0 0 0 0 0 0 0 0 0 0 0 0 0 0 0 0 0 0 0 0 0 0Social Work 0 0 0 0 0 0 1 0 1 0 1 1 3 8 11 0 0 0 5 43 48 0 1 1 1 0 1 10 53 63Undergraduate Student Academic Services 0 0 0 0 0 0 0 0 0 0 0 0 2 0 2 0 0 0 6 6 12 0 0 0 0 0 0 8 6 14 Total 1 1 2 14 17 31 3 0 3 19 15 34 58 44 102 0 1 1 471 704 1,175 12 22 34 15 13 28 593 817 1,410Graduate Professional Dentistry 0 0 0 0 0 0 0 0 0 0 0 0 0 0 0 0 0 0 0 0 0 0 0 0 0 0 0 0 0 0Law 0 0 0 0 0 0 0 0 0 0 0 0 0 0 0 0 0 0 0 0 0 0 0 0 0 0 0 0 0 0Medicine 0 0 0 0 0 0 0 0 0 0 0 0 0 0 0 0 0 0 0 0 0 0 0 0 0 0 0 0 0 0Optometry 0 0 0 0 0 0 0 0 0 0 0 0 0 0 0 0 0 0 0 0 0 0 0 0 0 0 0 0 0 0Doctor of Pharmacy 0 0 0 0 0 0 0 0 0 0 0 0 0 0 0 0 0 0 0 0 0 0 0 0 0 0 0 0 0 0Veterinary Medicine 0 0 0 0 0 0 0 0 0 0 0 0 0 0 0 0 0 0 0 0 0 0 0 0 0 0 0 0 0 0 Total 0 0 0 0 0 0 0 0 0 0 0 0 0 0 0 0 0 0 0 0 0 0 0 0 0 0 0 0 0 0Graduate Total 0 1 1 0 0 0 0 0 0 0 1 1 0 1 1 0 0 0 10 90 100 0 0 0 0 3 3 10 96 106
GRAND TOTAL 1 2 3 14 17 31 3 0 3 19 16 35 58 45 103 0 1 1 481 794 1,275 12 22 34 15 16 31 603 913 1,516
THE OHIO STATE UNIVERSITY Enrollment Services - Analysis and ReportingJuly 2, 2013
EXTENDED CAMPUSES BY COLLEGE, RACE, AND SEXSUMMER TERM 2013
Unknown TotalWhite Two or More RacesNonresident Alien HispanicAmerican Indian or Alaskan
Native Asian African AmericanNative Hawaiian or Other
Pacific Islander
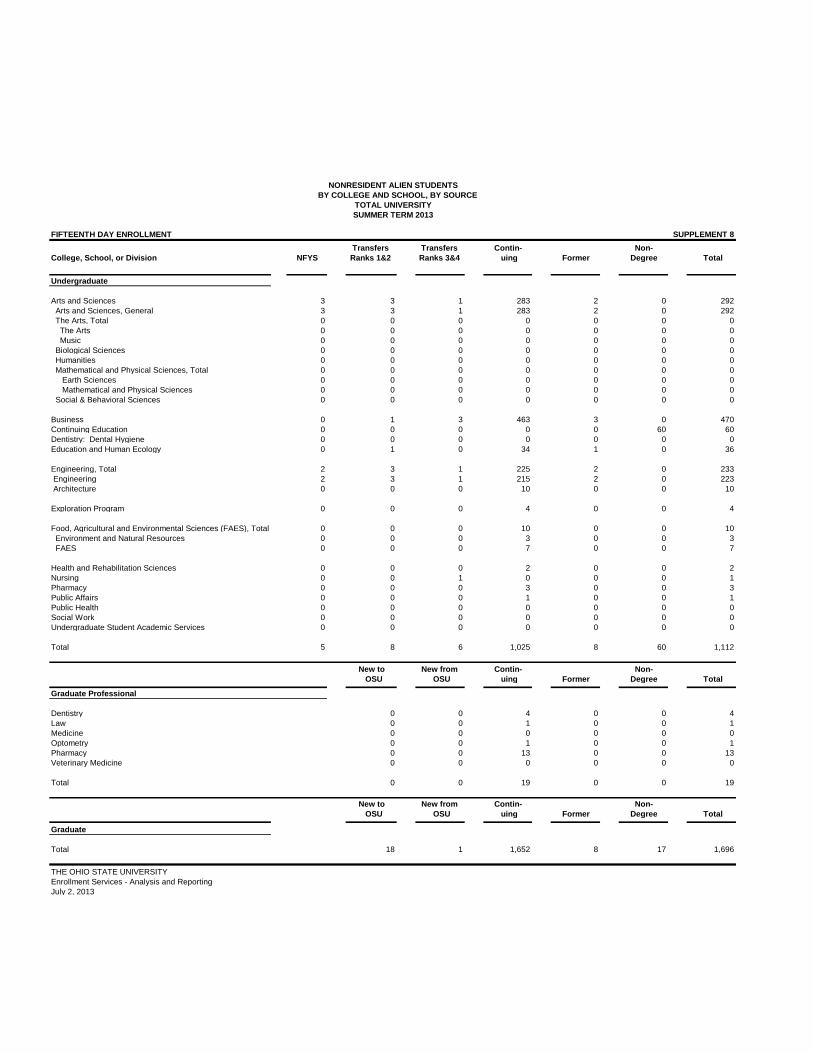
NONRESIDENT ALIEN STUDENTS BY COLLEGE AND SCHOOL, BY SOURCE
TOTAL UNIVERSITYSUMMER TERM 2013
FIFTEENTH DAY ENROLLMENT SUPPLEMENT 8
Transfers Transfers Contin- Non- College, School, or Division NFYS Ranks 1&2 Ranks 3&4 uing Former Degree Total
Undergraduate
Arts and Sciences 3 3 1 283 2 0 292 Arts and Sciences, General 3 3 1 283 2 0 292 The Arts, Total 0 0 0 0 0 0 0 The Arts 0 0 0 0 0 0 0 Music 0 0 0 0 0 0 0 Biological Sciences 0 0 0 0 0 0 0 Humanities 0 0 0 0 0 0 0 Mathematical and Physical Sciences, Total 0 0 0 0 0 0 0 Earth Sciences 0 0 0 0 0 0 0 Mathematical and Physical Sciences 0 0 0 0 0 0 0 Social & Behavioral Sciences 0 0 0 0 0 0 0 Business 0 1 3 463 3 0 470Continuing Education 0 0 0 0 0 60 60Dentistry: Dental Hygiene 0 0 0 0 0 0 0Education and Human Ecology 0 1 0 34 1 0 36
Engineering, Total 2 3 1 225 2 0 233 Engineering 2 3 1 215 2 0 223 Architecture 0 0 0 10 0 0 10
Exploration Program 0 0 0 4 0 0 4
Food, Agricultural and Environmental Sciences (FAES), Total 0 0 0 10 0 0 10 Environment and Natural Resources 0 0 0 3 0 0 3 FAES 0 0 0 7 0 0 7
Health and Rehabilitation Sciences 0 0 0 2 0 0 2Nursing 0 0 1 0 0 0 1Pharmacy 0 0 0 3 0 0 3Public Affairs 0 0 0 1 0 0 1Public Health 0 0 0 0 0 0 0Social Work 0 0 0 0 0 0 0Undergraduate Student Academic Services 0 0 0 0 0 0 0 Total 5 8 6 1,025 8 60 1,112
New to New from Contin- Non- OSU OSU uing Former Degree Total
Graduate Professional
Dentistry 0 0 4 0 0 4Law 0 0 1 0 0 1Medicine 0 0 0 0 0 0Optometry 0 0 1 0 0 1Pharmacy 0 0 13 0 0 13Veterinary Medicine 0 0 0 0 0 0 Total 0 0 19 0 0 19
New to New from Contin- Non- OSU OSU uing Former Degree Total
Graduate
Total 18 1 1,652 8 17 1,696
THE OHIO STATE UNIVERSITY Enrollment Services - Analysis and Reporting July 2, 2013
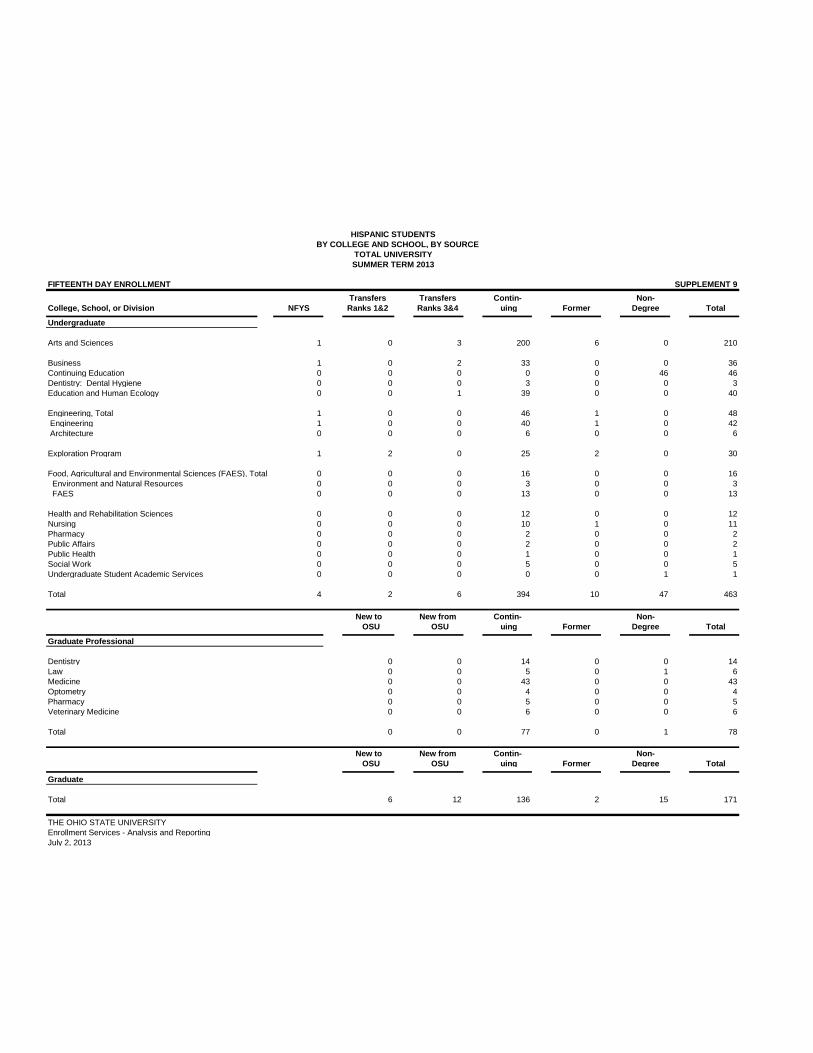
HISPANIC STUDENTS BY COLLEGE AND SCHOOL, BY SOURCE
TOTAL UNIVERSITYSUMMER TERM 2013
FIFTEENTH DAY ENROLLMENT SUPPLEMENT 9
Transfers Transfers Contin- Non- College, School, or Division NFYS Ranks 1&2 Ranks 3&4 uing Former Degree Total
Undergraduate
Arts and Sciences 1 0 3 200 6 0 210 Business 1 0 2 33 0 0 36Continuing Education 0 0 0 0 0 46 46Dentistry: Dental Hygiene 0 0 0 3 0 0 3Education and Human Ecology 0 0 1 39 0 0 40
Engineering, Total 1 0 0 46 1 0 48 Engineering 1 0 0 40 1 0 42 Architecture 0 0 0 6 0 0 6
Exploration Program 1 2 0 25 2 0 30
Food, Agricultural and Environmental Sciences (FAES), Total 0 0 0 16 0 0 16 Environment and Natural Resources 0 0 0 3 0 0 3 FAES 0 0 0 13 0 0 13
Health and Rehabilitation Sciences 0 0 0 12 0 0 12Nursing 0 0 0 10 1 0 11Pharmacy 0 0 0 2 0 0 2Public Affairs 0 0 0 2 0 0 2Public Health 0 0 0 1 0 0 1Social Work 0 0 0 5 0 0 5Undergraduate Student Academic Services 0 0 0 0 0 1 1 Total 4 2 6 394 10 47 463
New to New from Contin- Non- OSU OSU uing Former Degree Total
Graduate Professional
Dentistry 0 0 14 0 0 14Law 0 0 5 0 1 6Medicine 0 0 43 0 0 43Optometry 0 0 4 0 0 4Pharmacy 0 0 5 0 0 5Veterinary Medicine 0 0 6 0 0 6 Total 0 0 77 0 1 78
New to New from Contin- Non- OSU OSU uing Former Degree Total
Graduate
Total 6 12 136 2 15 171
THE OHIO STATE UNIVERSITY Enrollment Services - Analysis and Reporting July 2, 2013
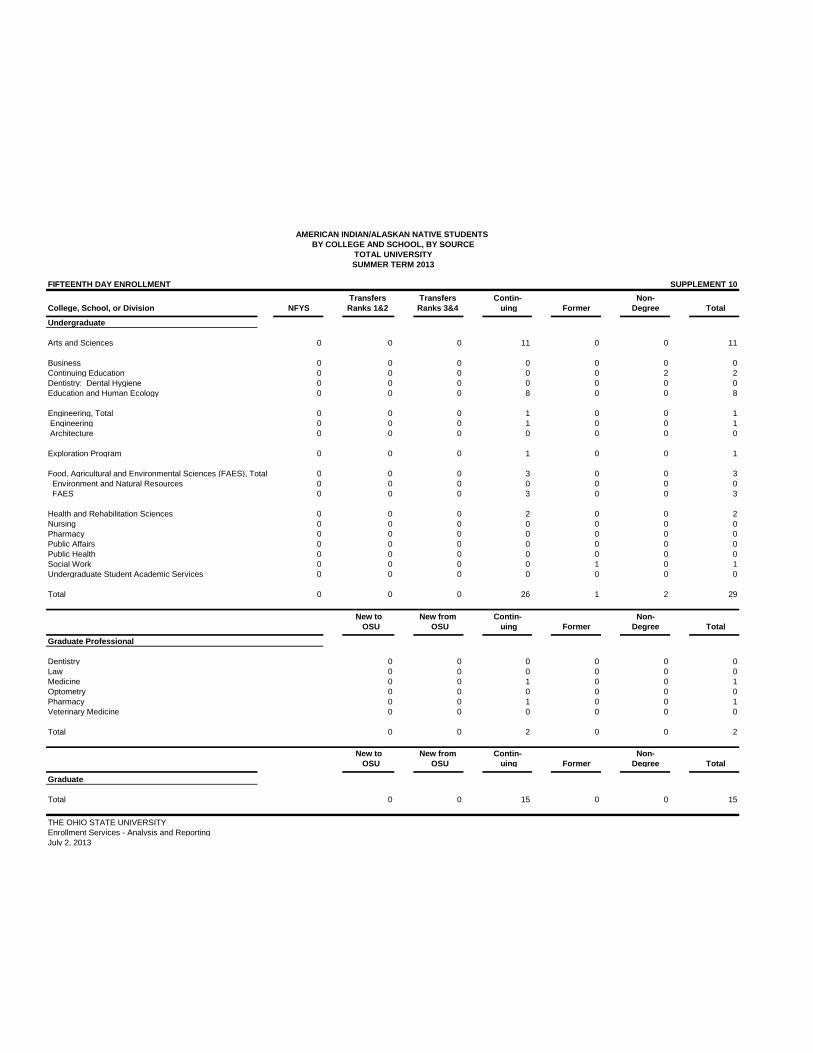
AMERICAN INDIAN/ALASKAN NATIVE STUDENTS BY COLLEGE AND SCHOOL, BY SOURCE
TOTAL UNIVERSITYSUMMER TERM 2013
FIFTEENTH DAY ENROLLMENT SUPPLEMENT 10
Transfers Transfers Contin- Non- College, School, or Division NFYS Ranks 1&2 Ranks 3&4 uing Former Degree Total
Undergraduate
Arts and Sciences 0 0 0 11 0 0 11 Business 0 0 0 0 0 0 0Continuing Education 0 0 0 0 0 2 2Dentistry: Dental Hygiene 0 0 0 0 0 0 0Education and Human Ecology 0 0 0 8 0 0 8
Engineering, Total 0 0 0 1 0 0 1 Engineering 0 0 0 1 0 0 1 Architecture 0 0 0 0 0 0 0
Exploration Program 0 0 0 1 0 0 1
Food, Agricultural and Environmental Sciences (FAES), Total 0 0 0 3 0 0 3 Environment and Natural Resources 0 0 0 0 0 0 0 FAES 0 0 0 3 0 0 3
Health and Rehabilitation Sciences 0 0 0 2 0 0 2Nursing 0 0 0 0 0 0 0Pharmacy 0 0 0 0 0 0 0Public Affairs 0 0 0 0 0 0 0Public Health 0 0 0 0 0 0 0Social Work 0 0 0 0 1 0 1Undergraduate Student Academic Services 0 0 0 0 0 0 0 Total 0 0 0 26 1 2 29
New to New from Contin- Non- OSU OSU uing Former Degree Total
Graduate Professional
Dentistry 0 0 0 0 0 0Law 0 0 0 0 0 0Medicine 0 0 1 0 0 1Optometry 0 0 0 0 0 0Pharmacy 0 0 1 0 0 1Veterinary Medicine 0 0 0 0 0 0 Total 0 0 2 0 0 2
New to New from Contin- Non- OSU OSU uing Former Degree Total
Graduate
Total 0 0 15 0 0 15
THE OHIO STATE UNIVERSITY Enrollment Services - Analysis and Reporting July 2, 2013

ASIAN STUDENTSBY COLLEGE AND SCHOOL, BY SOURCE
TOTAL UNIVERSITYSUMMER TERM 2013
FIFTEENTH DAY ENROLLMENT SUPPLEMENT 11
Transfers Transfers Contin- Non- College, School, or Division NFYS Ranks 1&2 Ranks 3&4 uing Former Degree Total
Undergraduate
Arts and Sciences 0 0 2 364 6 0 372 Business 0 1 2 86 1 0 90Continuing Education 0 0 0 0 0 34 34Dentistry: Dental Hygiene 0 0 0 0 0 0 0Education and Human Ecology 0 0 0 32 2 0 34
Engineering, Total 0 0 1 147 4 0 152 Engineering 0 0 1 144 3 0 148 Architecture 0 0 0 3 1 0 4
Exploration Program 2 3 1 37 3 0 46
Food, Agricultural and Environmental Sciences (FAES), Total 0 0 0 7 0 0 7 Environment and Natural Resources 0 0 0 3 0 0 3 FAES 0 0 0 4 0 0 4
Health and Rehabilitation Sciences 0 0 1 28 0 0 29Nursing 0 0 1 10 3 0 14Pharmacy 0 0 0 19 1 0 20Public Affairs 0 0 0 5 0 0 5Public Health 0 0 0 6 0 0 6Social Work 0 0 0 3 0 0 3Undergraduate Student Academic Services 0 0 0 0 0 6 6 Total 2 4 8 744 20 40 818
New to New from Contin- Non- OSU OSU uing Former Degree Total
Graduate Professional
Dentistry 0 0 36 0 0 36Law 0 0 4 0 0 4Medicine 0 0 150 1 0 151Optometry 0 0 11 0 0 11Pharmacy 0 0 44 0 0 44Veterinary Medicine 0 0 5 0 0 5 Total 0 0 250 1 0 251
New to New from Contin- Non- OSU OSU uing Former Degree Total
Graduate
Total 9 12 205 4 11 241
THE OHIO STATE UNIVERSITY Enrollment Services - Analysis and Reporting July 2, 2013

AFRICAN AMERICAN STUDENTS BY COLLEGE AND SCHOOL, BY SOURCE
TOTAL UNIVERSITYSUMMER TERM 2013
FIFTEENTH DAY ENROLLMENT SUPPLEMENT 12
Transfers Transfers Contin- Non- College, School, or Division NFYS Ranks 1&2 Ranks 3&4 uing Former Degree Total
Undergraduate
Arts and Sciences 4 2 6 474 18 0 504 Business 0 1 3 52 1 0 57Continuing Education 0 0 0 0 0 76 76Dentistry: Dental Hygiene 0 0 0 4 0 0 4Education and Human Ecology 2 0 3 137 2 1 145
Engineering, Total 0 1 1 81 1 0 84 Engineering 0 0 1 74 1 0 76 Architecture 0 1 0 7 0 0 8
Exploration Program 9 4 8 66 10 0 97
Food, Agricultural and Environmental Sciences (FAES), Total 0 1 0 14 0 0 15 Environment and Natural Resources 0 0 0 1 0 0 1 FAES 0 1 0 13 0 0 14
Health and Rehabilitation Sciences 0 3 2 34 0 0 39Nursing 0 0 3 12 4 0 19Pharmacy 0 0 0 8 0 0 8Public Affairs 0 0 0 12 0 0 12Public Health 0 0 0 14 0 0 14Social Work 0 0 1 37 4 0 42Undergraduate Student Academic Services 0 0 0 2 0 3 5 Total 15 12 27 947 40 80 1,121
New to New from Contin- Non- OSU OSU uing Former Degree Total
Graduate Professional
Dentistry 0 0 10 0 0 10Law 0 0 5 0 1 6Medicine 0 0 42 0 0 42Optometry 0 0 1 0 0 1Pharmacy 0 0 5 0 0 5Veterinary Medicine 0 0 0 0 0 0 Total 0 0 63 0 1 64
New to New from Contin- Non- OSU OSU uing Former Degree Total
Graduate
Total 10 6 208 9 56 289
THE OHIO STATE UNIVERSITY Enrollment Services - Analysis and Reporting July 2, 2013

NATIVE HAWAIIAN OR OTHER PACIFIC ISLANDER STUDENTSBY COLLEGE AND SCHOOL, BY SOURCE
TOTAL UNIVERSITYSUMMER TERM 2013
FIFTEENTH DAY ENROLLMENT SUPPLEMENT 13
Transfers Transfers Contin- Non- College, School, or Division NFYS Ranks 1&2 Ranks 3&4 uing Former Degree Total
Undergraduate
Arts and Sciences 0 0 0 6 0 0 6 Business 0 0 0 0 0 0 0Continuing Education 0 0 0 0 0 0 0Dentistry: Dental Hygiene 0 0 0 0 0 0 0Education and Human Ecology 0 0 0 2 0 0 2
Engineering, Total 0 0 0 1 0 0 1 Engineering 0 0 0 1 0 0 1 Architecture 0 0 0 0 0 0 0
Exploration Program 0 0 0 3 0 0 3
Food, Agricultural and Environmental Sciences (FAES), Total 0 0 0 0 0 0 0 Environment and Natural Resources 0 0 0 0 0 0 0 FAES 0 0 0 0 0 0 0
Health and Rehabilitation Sciences 0 0 0 0 0 0 0Nursing 0 0 0 0 0 0 0Pharmacy 0 0 0 0 0 0 0Public Affairs 0 0 0 0 0 0 0Public Health 0 0 0 0 0 0 0Social Work 0 0 0 0 0 0 0Undergraduate Student Academic Services 0 0 0 0 0 0 0 Total 0 0 0 12 0 0 12
New to New from Contin- Non- OSU OSU uing Former Degree Total
Graduate Professional
Dentistry 0 0 0 0 0 0Law 0 0 0 0 0 0Medicine 0 0 0 0 0 0Optometry 0 0 0 0 0 0Pharmacy 0 0 0 0 0 0Veterinary Medicine 0 0 0 0 0 0 Total 0 0 0 0 0 0
New to New from Contin- Non- OSU OSU uing Former Degree Total
Graduate
Total 1 0 1 0 1 3
THE OHIO STATE UNIVERSITY Enrollment Services - Analysis and Reporting July 2, 2013

WHITE STUDENTSBY COLLEGE AND SCHOOL, BY SOURCE
TOTAL UNIVERSITYSUMMER TERM 2013
FIFTEENTH DAY ENROLLMENT SUPPLEMENT 14
Transfers Transfers Contin- Non- College, School, or Division NFYS Ranks 1&2 Ranks 3&4 uing Former Degree Total
Undergraduate
Arts and Sciences 13 20 30 3,759 98 0 3,920 Business 5 10 6 728 29 0 778Continuing Education 0 0 0 0 0 546 546Dentistry: Dental Hygiene 0 1 0 35 0 0 36Education and Human Ecology 10 10 6 1,096 23 12 1,157
Engineering, Total 9 2 6 1,116 12 0 1,145 Engineering 8 1 5 1,020 11 0 1,045 Architecture 1 1 1 96 1 0 100
Exploration Program 12 30 19 387 23 0 471
Food, Agricultural and Environmental Sciences (FAES), Total 3 3 3 536 10 0 555 Environment and Natural Resources 1 2 1 129 2 0 135 FAES 2 1 2 407 8 0 420
Health and Rehabilitation Sciences 1 6 5 300 4 0 316Nursing 0 1 44 207 62 0 314Pharmacy 0 0 0 82 0 0 82Public Affairs 0 1 0 43 1 0 45Public Health 0 0 0 58 1 0 59Social Work 1 7 13 119 4 0 144Undergraduate Student Academic Services 0 1 0 11 1 18 31 Total 54 92 132 8,477 268 576 9,599
New to New from Contin- Non- OSU OSU uing Former Degree Total
Graduate Professional
Dentistry 0 0 248 0 0 248Law 1 0 45 0 2 48Medicine 0 0 349 2 0 351Optometry 0 0 104 0 0 104Pharmacy 0 0 124 0 0 124Veterinary Medicine 0 0 141 0 0 141 Total 1 0 1,011 2 2 1,016
New to New from Contin- Non- OSU OSU uing Former Degree Total
Graduate
Total 126 253 3,261 58 464 4,162
THE OHIO STATE UNIVERSITY Enrollment Services - Analysis and Reporting July 2, 2013
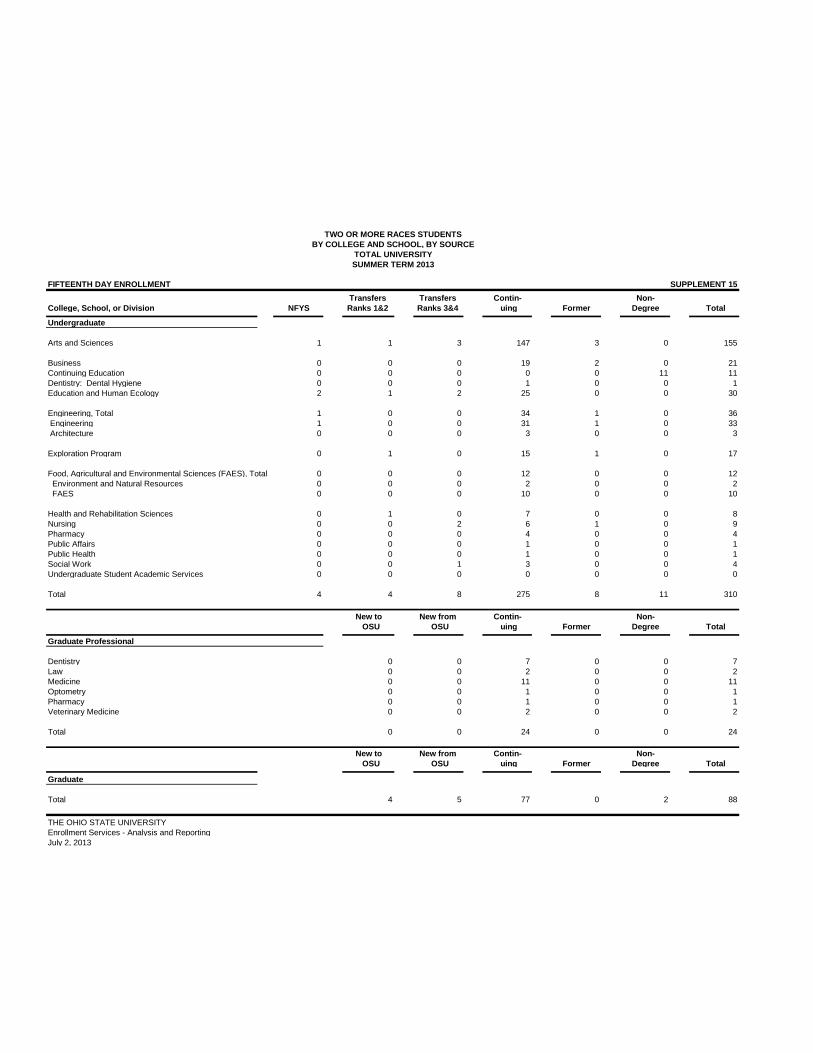
TWO OR MORE RACES STUDENTSBY COLLEGE AND SCHOOL, BY SOURCE
TOTAL UNIVERSITYSUMMER TERM 2013
FIFTEENTH DAY ENROLLMENT SUPPLEMENT 15
Transfers Transfers Contin- Non- College, School, or Division NFYS Ranks 1&2 Ranks 3&4 uing Former Degree Total
Undergraduate
Arts and Sciences 1 1 3 147 3 0 155 Business 0 0 0 19 2 0 21Continuing Education 0 0 0 0 0 11 11Dentistry: Dental Hygiene 0 0 0 1 0 0 1Education and Human Ecology 2 1 2 25 0 0 30
Engineering, Total 1 0 0 34 1 0 36 Engineering 1 0 0 31 1 0 33 Architecture 0 0 0 3 0 0 3
Exploration Program 0 1 0 15 1 0 17
Food, Agricultural and Environmental Sciences (FAES), Total 0 0 0 12 0 0 12 Environment and Natural Resources 0 0 0 2 0 0 2 FAES 0 0 0 10 0 0 10
Health and Rehabilitation Sciences 0 1 0 7 0 0 8Nursing 0 0 2 6 1 0 9Pharmacy 0 0 0 4 0 0 4Public Affairs 0 0 0 1 0 0 1Public Health 0 0 0 1 0 0 1Social Work 0 0 1 3 0 0 4Undergraduate Student Academic Services 0 0 0 0 0 0 0 Total 4 4 8 275 8 11 310
New to New from Contin- Non- OSU OSU uing Former Degree Total
Graduate Professional
Dentistry 0 0 7 0 0 7Law 0 0 2 0 0 2Medicine 0 0 11 0 0 11Optometry 0 0 1 0 0 1Pharmacy 0 0 1 0 0 1Veterinary Medicine 0 0 2 0 0 2 Total 0 0 24 0 0 24
New to New from Contin- Non- OSU OSU uing Former Degree Total
Graduate
Total 4 5 77 0 2 88
THE OHIO STATE UNIVERSITY Enrollment Services - Analysis and Reporting July 2, 2013

RACE UNKNOWN STUDENTSBY COLLEGE AND SCHOOL, BY SOURCE
TOTAL UNIVERSITYSUMMER TERM 2013
FIFTEENTH DAY ENROLLMENT SUPPLEMENT 16
Transfers Transfers Contin- Non- College, School, or Division NFYS Ranks 1&2 Ranks 3&4 uing Former Degree Total
Undergraduate
Arts and Sciences 2 1 1 89 3 0 96 Business 1 0 0 12 0 0 13Continuing Education 0 0 0 0 0 28 28Dentistry: Dental Hygiene 0 0 0 1 0 0 1Education and Human Ecology 0 1 0 17 2 0 20
Engineering, Total 0 0 1 24 0 0 25 Engineering 0 0 1 23 0 0 24 Architecture 0 0 0 1 0 0 1
Exploration Program 4 3 0 10 1 0 18
Food, Agricultural and Environmental Sciences (FAES), Total 0 0 1 12 1 0 14 Environment and Natural Resources 0 0 0 4 1 0 5 FAES 0 0 1 8 0 0 9
Health and Rehabilitation Sciences 0 0 0 3 0 0 3Nursing 0 0 3 1 1 0 5Pharmacy 0 0 0 3 0 0 3Public Affairs 0 0 0 1 0 0 1Public Health 0 0 0 3 0 0 3Social Work 0 0 0 1 0 0 1Undergraduate Student Academic Services 0 0 0 0 0 1 1 Total 7 5 6 177 8 29 232
New to New from Contin- Non- OSU OSU uing Former Degree Total
Graduate Professional
Dentistry 0 0 8 0 0 8Law 0 0 2 0 10 12Medicine 0 0 30 0 0 30Optometry 0 0 3 0 0 3Pharmacy 0 0 7 0 0 7Veterinary Medicine 0 0 10 0 0 10 Total 0 0 60 0 10 70
New to New from Contin- Non- OSU OSU uing Former Degree Total
Graduate
Total 10 1 217 5 44 277
THE OHIO STATE UNIVERSITY Enrollment Services - Analysis and Reporting July 2, 2013

TOTAL ENROLLMENTBY COLLEGE AND SCHOOL, BY SOURCE
TOTAL UNIVERSITYSUMMER TERM 2013
FIFTEENTH DAY ENROLLMENT SUPPLEMENT 17
Transfers Transfers Contin- Non- College, School, or Division NFYS Ranks 1&2 Ranks 3&4 uing Former Degree Total
Undergraduate
Arts and Sciences 24 27 46 5,333 136 0 5,566 Business 7 13 16 1,393 36 0 1,465Continuing Education 0 0 0 0 0 803 803Dentistry: Dental Hygiene 0 1 0 44 0 0 45Education and Human Ecology 14 13 12 1,390 30 13 1,472
Engineering, Total 13 6 10 1,675 21 0 1,725 Engineering 12 4 9 1,549 19 0 1,593 Architecture 1 2 1 126 2 0 132
Exploration Program 28 43 28 548 40 0 687
Food, Agricultural and Environmental Sciences (FAES), Total 3 4 4 610 11 0 632 Environment and Natural Resources 1 2 1 145 3 0 152 FAES 2 2 3 465 8 0 480
Health and Rehabilitation Sciences 1 10 8 388 4 0 411Nursing 0 1 54 246 72 0 373Pharmacy 0 0 0 121 1 0 122Public Affairs 0 1 0 65 1 0 67Public Health 0 0 0 83 1 0 84Social Work 1 7 15 168 9 0 200Undergraduate Student Academic Services 0 1 0 13 1 29 44 Total 91 127 193 12,077 363 845 13,696
New to New from Contin- Non- OSU OSU uing Former Degree Total
Graduate Professional
Dentistry 0 0 327 0 0 327Law 1 0 64 0 14 79Medicine 0 0 626 3 0 629Optometry 0 0 125 0 0 125Pharmacy 0 0 200 0 0 200Veterinary Medicine 0 0 164 0 0 164 Total 1 0 1,506 3 14 1,524
New to New from Contin- Non- OSU OSU uing Former Degree Total
Graduate
Total 184 290 5,772 86 610 6,942
THE OHIO STATE UNIVERSITY Enrollment Services - Analysis and Reporting July 2, 2013

NONRESIDENT ALIEN STUDENTS BY COLLEGE AND SCHOOL, BY SOURCE
COLUMBUS CAMPUSSUMMER TERM 2013
FIFTEENTH DAY ENROLLMENT SUPPLEMENT 18
Transfers Transfers Contin- Non- College, School, or Division NFYS Ranks 1&2 Ranks 3&4 uing Former Degree Total
Undergraduate
Arts and Sciences 3 3 1 281 2 0 290 Business 0 1 3 463 3 0 470Continuing Education 0 0 0 0 0 60 60Dentistry: Dental Hygiene 0 0 0 0 0 0 0Education and Human Ecology 0 1 0 34 1 0 36
Engineering, Total 2 3 1 225 2 0 233 Engineering 2 3 1 215 2 0 223 Architecture 0 0 0 10 0 0 10
Exploration Program 0 0 0 4 0 0 4
Food, Agricultural and Environmental Sciences (FAES), Total 0 0 0 10 0 0 10 Environment and Natural Resources 0 0 0 3 0 0 3 FAES 0 0 0 7 0 0 7
Health and Rehabilitation Sciences 0 0 0 2 0 0 2Nursing 0 0 1 0 0 0 1Pharmacy 0 0 0 3 0 0 3Public Affairs 0 0 0 1 0 0 1Public Health 0 0 0 0 0 0 0Social Work 0 0 0 0 0 0 0Undergraduate Student Academic Services 0 0 0 0 0 0 0 Total 5 8 6 1,023 8 60 1,110
New to New from Contin- Non- OSU OSU uing Former Degree Total
Graduate Professional
Dentistry 0 0 4 0 0 4Law 0 0 1 0 0 1Medicine 0 0 0 0 0 0Optometry 0 0 1 0 0 1Pharmacy 0 0 13 0 0 13Veterinary Medicine 0 0 0 0 0 0 Total 0 0 19 0 0 19
New to New from Contin- Non- OSU OSU uing Former Degree Total
Graduate
Total 18 1 1,651 8 17 1,695
THE OHIO STATE UNIVERSITY Enrollment Services - Analysis and Reporting July 2, 2013

HISPANIC STUDENTSBY COLLEGE AND SCHOOL, BY SOURCE
COLUMBUS CAMPUSSUMMER TERM 2013
FIFTEENTH DAY ENROLLMENT SUPPLEMENT 19
Transfers Transfers Contin- Non- College, School, or Division NFYS Ranks 1&2 Ranks 3&4 uing Former Degree Total
Undergraduate
Arts and Sciences 0 0 3 187 5 0 195 Business 1 0 2 33 0 0 36Continuing Education 0 0 0 0 0 46 46Dentistry: Dental Hygiene 0 0 0 3 0 0 3Education and Human Ecology 0 0 1 34 0 0 35
Engineering, Total 1 0 0 45 1 0 47 Engineering 1 0 0 40 1 0 42 Architecture 0 0 0 5 0 0 5
Exploration Program 1 2 0 22 0 0 25
Food, Agricultural and Environmental Sciences (FAES), Total 0 0 0 14 0 0 14 Environment and Natural Resources 0 0 0 3 0 0 3 FAES 0 0 0 11 0 0 11
Health and Rehabilitation Sciences 0 0 0 10 0 0 10Nursing 0 0 0 9 1 0 10Pharmacy 0 0 0 2 0 0 2Public Affairs 0 0 0 2 0 0 2Public Health 0 0 0 1 0 0 1Social Work 0 0 0 5 0 0 5Undergraduate Student Academic Services 0 0 0 0 0 1 1 Total 3 2 6 367 7 47 432
New to New from Contin- Non- OSU OSU uing Former Degree Total
Graduate Professional
Dentistry 0 0 14 0 0 14Law 0 0 5 0 1 6Medicine 0 0 43 0 0 43Optometry 0 0 4 0 0 4Pharmacy 0 0 5 0 0 5Veterinary Medicine 0 0 6 0 0 6 Total 0 0 77 0 1 78
New to New from Contin- Non- OSU OSU uing Former Degree Total
Graduate
Total 6 12 136 2 15 171
THE OHIO STATE UNIVERSITY Enrollment Services - Analysis and Reporting July 2, 2013

AMERICAN INDIAN / ALASKAN NATIVE STUDENTS BY COLLEGE AND SCHOOL, BY SOURCE
COLUMBUS CAMPUSSUMMER TERM 2013
FIFTEENTH DAY ENROLLMENT SUPPLEMENT 20
Transfers Transfers Contin- Non- College, School, or Division NFYS Ranks 1&2 Ranks 3&4 uing Former Degree Total
Undergraduate
Arts and Sciences 0 0 0 10 0 0 10 Business 0 0 0 0 0 0 0Continuing Education 0 0 0 0 0 2 2Dentistry: Dental Hygiene 0 0 0 0 0 0 0Education and Human Ecology 0 0 0 8 0 0 8
Engineering, Total 0 0 0 1 0 0 1 Engineering 0 0 0 1 0 0 1 Architecture 0 0 0 0 0 0 0
Exploration Program 0 0 0 1 0 0 1
Food, Agricultural and Environmental Sciences (FAES), Total 0 0 0 2 0 0 2 Environment and Natural Resources 0 0 0 0 0 0 0 FAES 0 0 0 2 0 0 2
Health and Rehabilitation Sciences 0 0 0 2 0 0 2Nursing 0 0 0 0 0 0 0Pharmacy 0 0 0 0 0 0 0Public Affairs 0 0 0 0 0 0 0Public Health 0 0 0 0 0 0 0Social Work 0 0 0 0 0 0 0Undergraduate Student Academic Services 0 0 0 0 0 0 0 Total 0 0 0 24 0 2 26
New to New from Contin- Non- OSU OSU uing Former Degree Total
Graduate Professional
Dentistry 0 0 0 0 0 0Law 0 0 0 0 0 0Medicine 0 0 1 0 0 1Optometry 0 0 0 0 0 0Pharmacy 0 0 1 0 0 1Veterinary Medicine 0 0 0 0 0 0 Total 0 0 2 0 0 2
New to New from Contin- Non- OSU OSU uing Former Degree Total
Graduate
Total 0 0 15 0 0 15
THE OHIO STATE UNIVERSITY Enrollment Services - Analysis and Reporting July 2, 2013

ASIAN STUDENTS BY COLLEGE AND SCHOOL, BY SOURCE
COLUMBUS CAMPUSSUMMER TERM 2013
FIFTEENTH DAY ENROLLMENT SUPPLEMENT 21
Transfers Transfers Contin- Non- College, School, or Division NFYS Ranks 1&2 Ranks 3&4 uing Former Degree Total
Undergraduate
Arts and Sciences 0 0 2 351 6 0 359 Business 0 1 2 84 1 0 88Continuing Education 0 0 0 0 0 34 34Dentistry: Dental Hygiene 0 0 0 0 0 0 0Education and Human Ecology 0 0 0 32 2 0 34
Engineering, Total 0 0 1 144 4 0 149 Engineering 0 0 1 141 3 0 145 Architecture 0 0 0 3 1 0 4
Exploration Program 0 2 1 30 1 0 34
Food, Agricultural and Environmental Sciences (FAES), Total 0 0 0 6 0 0 6 Environment and Natural Resources 0 0 0 3 0 0 3 FAES 0 0 0 3 0 0 3
Health and Rehabilitation Sciences 0 0 1 28 0 0 29Nursing 0 0 1 8 3 0 12Pharmacy 0 0 0 19 1 0 20Public Affairs 0 0 0 5 0 0 5Public Health 0 0 0 6 0 0 6Social Work 0 0 0 2 0 0 2Undergraduate Student Academic Services 0 0 0 0 0 6 6 Total 0 3 8 715 18 40 784
New to New from Contin- Non- OSU OSU uing Former Degree Total
Graduate Professional
Dentistry 0 0 36 0 0 36Law 0 0 4 0 0 4Medicine 0 0 150 1 0 151Optometry 0 0 11 0 0 11Pharmacy 0 0 44 0 0 44Veterinary Medicine 0 0 5 0 0 5 Total 0 0 250 1 0 251
New to New from Contin- Non- OSU OSU uing Former Degree Total
Graduate
Total 9 12 204 4 11 240
THE OHIO STATE UNIVERSITY Enrollment Services - Analysis and Reporting July 2, 2013

AFRICAN AMERICAN STUDENTS BY COLLEGE AND SCHOOL, BY SOURCE
COLUMBUS CAMPUSSUMMER TERM 2013
FIFTEENTH DAY ENROLLMENT SUPPLEMENT 22
Transfers Transfers Contin- Non- College, School, or Division NFYS Ranks 1&2 Ranks 3&4 uing Former Degree Total
Undergraduate
Arts and Sciences 3 1 6 438 16 0 464 Business 0 1 3 51 1 0 56Continuing Education 0 0 0 0 0 74 74Dentistry: Dental Hygiene 0 0 0 4 0 0 4Education and Human Ecology 2 0 3 127 2 1 135
Engineering, Total 0 1 1 79 1 0 82 Engineering 0 0 1 73 1 0 75 Architecture 0 1 0 6 0 0 7
Exploration Program 8 1 8 47 2 0 66
Food, Agricultural and Environmental Sciences (FAES), Total 0 1 0 14 0 0 15 Environment and Natural Resources 0 0 0 1 0 0 1 FAES 0 1 0 13 0 0 14
Health and Rehabilitation Sciences 0 3 2 32 0 0 37Nursing 0 0 3 12 4 0 19Pharmacy 0 0 0 8 0 0 8Public Affairs 0 0 0 11 0 0 11Public Health 0 0 0 14 0 0 14Social Work 0 0 1 27 3 0 31Undergraduate Student Academic Services 0 0 0 0 0 3 3 Total 13 8 27 864 29 78 1,019
New to New from Contin- Non- OSU OSU uing Former Degree Total
Graduate Professional
Dentistry 0 0 10 0 0 10Law 0 0 5 0 1 6Medicine 0 0 42 0 0 42Optometry 0 0 1 0 0 1Pharmacy 0 0 5 0 0 5Veterinary Medicine 0 0 0 0 0 0 Total 0 0 63 0 1 64
New to New from Contin- Non- OSU OSU uing Former Degree Total
Graduate
Total 10 6 208 9 55 288
THE OHIO STATE UNIVERSITY Enrollment Services - Analysis and Reporting July 2, 2013

NATIVE HAWAIIAN OR OTHER PACIFIC ISLANDER STUDENTSBY COLLEGE AND SCHOOL, BY SOURCE
COLUMBUS CAMPUSSUMMER TERM 2013
FIFTEENTH DAY ENROLLMENT SUPPLEMENT 23
Transfers Transfers Contin- Non- College, School, or Division NFYS Ranks 1&2 Ranks 3&4 uing Former Degree Total
Undergraduate
Arts and Sciences 0 0 0 5 0 0 5 Business 0 0 0 0 0 0 0Continuing Education 0 0 0 0 0 0 0Dentistry: Dental Hygiene 0 0 0 0 0 0 0Education and Human Ecology 0 0 0 2 0 0 2
Engineering, Total 0 0 0 1 0 0 1 Engineering 0 0 0 1 0 0 1 Architecture 0 0 0 0 0 0 0
Exploration Program 0 0 0 3 0 0 3
Food, Agricultural and Environmental Sciences (FAES), Total 0 0 0 0 0 0 0 Environment and Natural Resources 0 0 0 0 0 0 0 FAES 0 0 0 0 0 0 0
Health and Rehabilitation Sciences 0 0 0 0 0 0 0Nursing 0 0 0 0 0 0 0Pharmacy 0 0 0 0 0 0 0Public Affairs 0 0 0 0 0 0 0Public Health 0 0 0 0 0 0 0Social Work 0 0 0 0 0 0 0Undergraduate Student Academic Services 0 0 0 0 0 0 0 Total 0 0 0 11 0 0 11
New to New from Contin- Non- OSU OSU uing Former Degree Total
Graduate Professional
Dentistry 0 0 0 0 0 0Law 0 0 0 0 0 0Medicine 0 0 0 0 0 0Optometry 0 0 0 0 0 0Pharmacy 0 0 0 0 0 0Veterinary Medicine 0 0 0 0 0 0 Total 0 0 0 0 0 0
New to New from Contin- Non- OSU OSU uing Former Degree Total
Graduate
Total 1 0 1 0 1 3
THE OHIO STATE UNIVERSITY Enrollment Services - Analysis and Reporting July 2, 2013

WHITE STUDENTSBY COLLEGE AND SCHOOL, BY SOURCE
COLUMBUS CAMPUSSUMMER TERM 2013
FIFTEENTH DAY ENROLLMENT SUPPLEMENT 24
Transfers Transfers Contin- Non- College, School, or Division NFYS Ranks 1&2 Ranks 3&4 uing Former Degree Total
Undergraduate
Arts and Sciences 7 14 27 3,415 82 0 3,545 Business 4 9 6 703 28 0 750Continuing Education 0 0 0 0 0 481 481Dentistry: Dental Hygiene 0 0 0 29 0 0 29Education and Human Ecology 3 9 6 894 21 12 945
Engineering, Total 4 2 6 1,085 12 0 1,109 Engineering 4 1 5 993 11 0 1,014 Architecture 0 1 1 92 1 0 95
Exploration Program 2 15 18 219 11 0 265
Food, Agricultural and Environmental Sciences (FAES), Total 0 0 3 384 8 0 395 Environment and Natural Resources 0 0 1 122 2 0 125 FAES 0 0 2 262 6 0 270
Health and Rehabilitation Sciences 0 6 4 285 4 0 299Nursing 0 0 42 204 60 0 306Pharmacy 0 0 0 81 0 0 81Public Affairs 0 1 0 43 1 0 45Public Health 0 0 0 58 1 0 59Social Work 0 1 9 85 1 0 96Undergraduate Student Academic Services 0 0 0 2 1 16 19 Total 20 57 121 7,487 230 509 8,424
New to New from Contin- Non- OSU OSU uing Former Degree Total
Graduate Professional
Dentistry 0 0 248 0 0 248Law 1 0 45 0 2 48Medicine 0 0 349 2 0 351Optometry 0 0 104 0 0 104Pharmacy 0 0 124 0 0 124Veterinary Medicine 0 0 141 0 0 141 Total 1 0 1,011 2 2 1,016
New to New from Contin- Non- OSU OSU uing Former Degree Total
Graduate
Total 126 245 3,199 56 436 4,062
THE OHIO STATE UNIVERSITY Enrollment Services - Analysis and Reporting July 2, 2013

TWO OR MORE RACES STUDENTSBY COLLEGE AND SCHOOL, BY SOURCE
COLUMBUS CAMPUSSUMMER TERM 2013
FIFTEENTH DAY ENROLLMENT SUPPLEMENT 25
Transfers Transfers Contin- Non- College, School, or Division NFYS Ranks 1&2 Ranks 3&4 uing Former Degree Total
Undergraduate
Arts and Sciences 0 1 2 135 3 0 141 Business 0 0 0 18 2 0 20Continuing Education 0 0 0 0 0 11 11Dentistry: Dental Hygiene 0 0 0 0 0 0 0Education and Human Ecology 1 1 2 20 0 0 24
Engineering, Total 0 0 0 33 1 0 34 Engineering 0 0 0 30 1 0 31 Architecture 0 0 0 3 0 0 3
Exploration Program 0 0 0 13 0 0 13
Food, Agricultural and Environmental Sciences (FAES), Total 0 0 0 7 0 0 7 Environment and Natural Resources 0 0 0 1 0 0 1 FAES 0 0 0 6 0 0 6
Health and Rehabilitation Sciences 0 1 0 7 0 0 8Nursing 0 0 2 6 1 0 9Pharmacy 0 0 0 4 0 0 4Public Affairs 0 0 0 1 0 0 1Public Health 0 0 0 1 0 0 1Social Work 0 0 1 2 0 0 3Undergraduate Student Academic Services 0 0 0 0 0 0 0 Total 1 3 7 247 7 11 276
New to New from Contin- Non- OSU OSU uing Former Degree Total
Graduate Professional
Dentistry 0 0 7 0 0 7Law 0 0 2 0 0 2Medicine 0 0 11 0 0 11Optometry 0 0 1 0 0 1Pharmacy 0 0 1 0 0 1Veterinary Medicine 0 0 2 0 0 2 Total 0 0 24 0 0 24
New to New from Contin- Non- OSU OSU uing Former Degree Total
Graduate
Total 4 5 77 0 2 88
THE OHIO STATE UNIVERSITY Enrollment Services - Analysis and Reporting July 2, 2013

RACE UNKNOWN STUDENTSBY COLLEGE AND SCHOOL, BY SOURCE
COLUMBUS CAMPUSSUMMER TERM 2013
FIFTEENTH DAY ENROLLMENT SUPPLEMENT 26
Transfers Transfers Contin- Non- College, School, or Division NFYS Ranks 1&2 Ranks 3&4 uing Former Degree Total
Undergraduate
Arts and Sciences 1 1 1 79 3 0 85 Business 1 0 0 12 0 0 13Continuing Education 0 0 0 0 0 26 26Dentistry: Dental Hygiene 0 0 0 1 0 0 1Education and Human Ecology 0 0 0 16 1 0 17
Engineering, Total 0 0 1 24 0 0 25 Engineering 0 0 1 23 0 0 24 Architecture 0 0 0 1 0 0 1
Exploration Program 4 1 0 6 0 0 11
Food, Agricultural and Environmental Sciences (FAES), Total 0 0 1 8 1 0 10 Environment and Natural Resources 0 0 0 4 1 0 5 FAES 0 0 1 4 0 0 5
Health and Rehabilitation Sciences 0 0 0 3 0 0 3Nursing 0 0 3 1 1 0 5Pharmacy 0 0 0 3 0 0 3Public Affairs 0 0 0 1 0 0 1Public Health 0 0 0 3 0 0 3Social Work 0 0 0 0 0 0 0Undergraduate Student Academic Services 0 0 0 0 0 1 1 Total 6 2 6 157 6 27 204
New to New from Contin- Non- OSU OSU uing Former Degree Total
Graduate Professional
Dentistry 0 0 8 0 0 8Law 0 0 2 0 10 12Medicine 0 0 30 0 0 30Optometry 0 0 3 0 0 3Pharmacy 0 0 7 0 0 7Veterinary Medicine 0 0 10 0 0 10 Total 0 0 60 0 10 70
New to New from Contin- Non- OSU OSU uing Former Degree Total
Graduate
Total 10 1 215 4 44 274
THE OHIO STATE UNIVERSITY Enrollment Services - Analysis and Reporting July 2, 2013
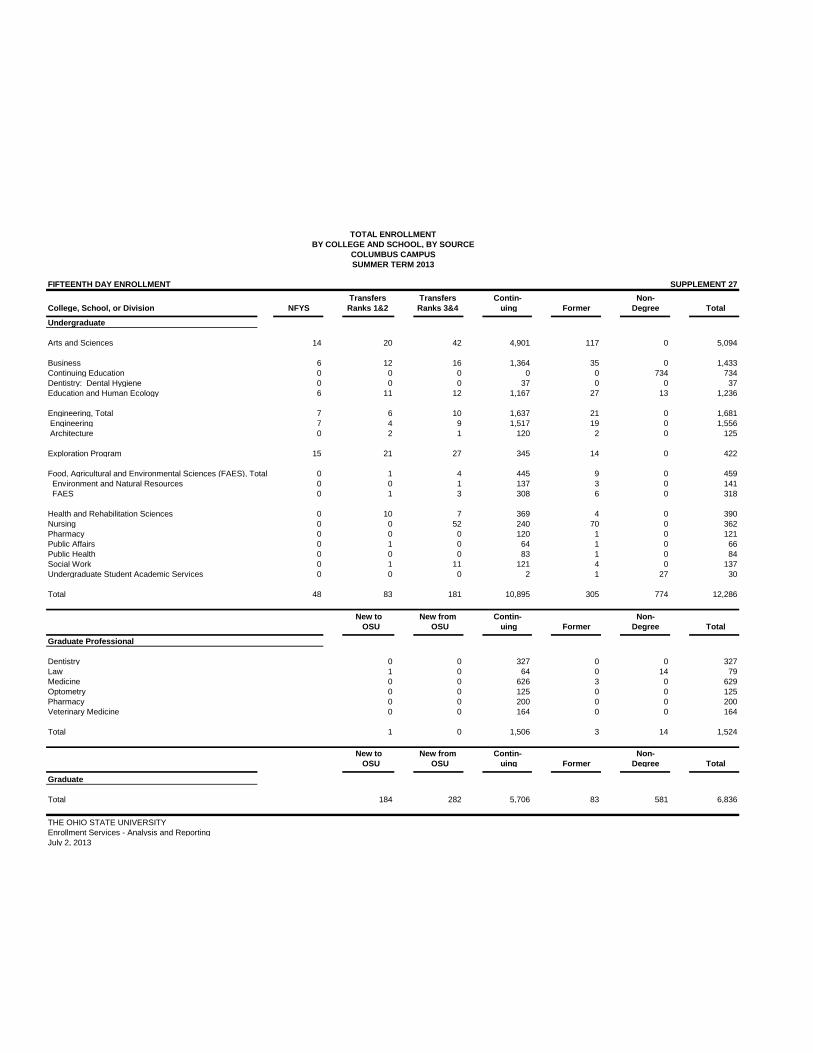
TOTAL ENROLLMENTBY COLLEGE AND SCHOOL, BY SOURCE
COLUMBUS CAMPUSSUMMER TERM 2013
FIFTEENTH DAY ENROLLMENT SUPPLEMENT 27
Transfers Transfers Contin- Non- College, School, or Division NFYS Ranks 1&2 Ranks 3&4 uing Former Degree Total
Undergraduate
Arts and Sciences 14 20 42 4,901 117 0 5,094 Business 6 12 16 1,364 35 0 1,433Continuing Education 0 0 0 0 0 734 734Dentistry: Dental Hygiene 0 0 0 37 0 0 37Education and Human Ecology 6 11 12 1,167 27 13 1,236
Engineering, Total 7 6 10 1,637 21 0 1,681 Engineering 7 4 9 1,517 19 0 1,556 Architecture 0 2 1 120 2 0 125
Exploration Program 15 21 27 345 14 0 422
Food, Agricultural and Environmental Sciences (FAES), Total 0 1 4 445 9 0 459 Environment and Natural Resources 0 0 1 137 3 0 141 FAES 0 1 3 308 6 0 318
Health and Rehabilitation Sciences 0 10 7 369 4 0 390Nursing 0 0 52 240 70 0 362Pharmacy 0 0 0 120 1 0 121Public Affairs 0 1 0 64 1 0 66Public Health 0 0 0 83 1 0 84Social Work 0 1 11 121 4 0 137Undergraduate Student Academic Services 0 0 0 2 1 27 30 Total 48 83 181 10,895 305 774 12,286
New to New from Contin- Non- OSU OSU uing Former Degree Total
Graduate Professional
Dentistry 0 0 327 0 0 327Law 1 0 64 0 14 79Medicine 0 0 626 3 0 629Optometry 0 0 125 0 0 125Pharmacy 0 0 200 0 0 200Veterinary Medicine 0 0 164 0 0 164 Total 1 0 1,506 3 14 1,524
New to New from Contin- Non- OSU OSU uing Former Degree Total
Graduate
Total 184 282 5,706 83 581 6,836
THE OHIO STATE UNIVERSITY Enrollment Services - Analysis and Reporting July 2, 2013

STUDENTS WITH DISABILITIES* BY COLLEGE AND SCHOOL, BY SOURCE
TOTAL UNIVERSITYSUMMER TERM 2013
FIFTEENTH DAY ENROLLMENT SUPPLEMENT 28
Transfers Transfers Contin- Non- College, School, or Division NFYS Ranks 1&2 Ranks 3&4 uing Former Degree Total
Undergraduate
Arts and Sciences 0 0 0 233 4 0 237 Business 0 0 1 36 1 0 38Continuing Education 0 0 0 0 0 14 14Dentistry: Dental Hygiene 0 0 0 1 0 0 1Education and Human Ecology 0 0 0 68 5 0 73
Engineering, Total 0 0 0 63 2 0 65 Engineering 0 0 0 62 2 0 64 Architecture 0 0 0 1 0 0 1
Exploration Program 0 0 0 23 0 0 23
Food, Agricultural and Environmental Sciences (FAES), Total 0 0 0 35 0 0 35 Environment and Natural Resources 0 0 0 5 0 0 5 FAES 0 0 0 30 0 0 30
Health and Rehabilitation Sciences 0 0 0 4 0 0 4Nursing 0 0 0 1 1 0 2Pharmacy 0 0 0 3 0 0 3Public Affairs 0 0 0 3 0 0 3Public Health 0 0 0 0 0 0 0Social Work 0 0 0 7 1 0 8Undergraduate Student Academic Services 0 0 0 0 0 2 2 Total 0 0 1 477 14 16 508
New to New from Contin- Non- OSU OSU uing Former Degree Total
Graduate Professional
Dentistry 0 0 11 0 0 11Law 0 0 3 0 0 3Medicine 0 0 19 0 0 19Optometry 0 0 4 0 0 4Pharmacy 0 0 9 0 0 9Veterinary Medicine 0 0 5 0 0 5 Total 0 0 51 0 0 51
New to New from Contin- Non- OSU OSU uing Former Degree Total
Graduate
Total 2 3 111 4 5 125
*Self identified students whose disability has been documented based on OSU standards
THE OHIO STATE UNIVERSITY Enrollment Services - Analysis and Reporting July 2, 2013

FULL-TIME/PART-TIME STUDENTS BY LEVEL, SEX, AND SOURCETOTAL UNIVERSITYSUMMER TERM 2013
FIFTEENTH DAY ENROLLMENT SUPPLEMENT 29
Transfers Transfers Contin- Non-Level/FT or PT/Sex NFYS Ranks 1&2 Ranks 3&4 uing Former Degree Total
Undergraduate
Full-time* Men 5 9 15 584 37 9 659 Women 7 8 10 772 16 9 822 Total 12 17 25 1,356 53 18 1,481 Part-time Men 60 53 63 5,130 146 334 5,786 Women 19 57 105 5,591 164 493 6,429 Total 79 110 168 10,721 310 827 12,215 Total 91 127 193 12,077 363 845 13,696
New to New from Contin- Non-
Graduate Professional OSU OSU uing Former Degree Total
Full-time* Men 0 0 543 2 0 545 Women 0 0 628 0 0 628 Total 0 0 1,171 2 0 1,173 Part-time Men 0 0 168 1 11 180 Women 1 0 167 0 3 171 Total 1 0 335 1 14 351 Total 1 0 1,506 3 14 1,524
New to New from Contin- Non- Graduate OSU OSU uing Former Degree Total Full-time* Men 33 71 341 5 7 457 Women 70 156 608 9 18 861 Total 103 227 949 14 25 1,318 Part-time Men 26 21 2,485 36 159 2,727 Women 55 42 2,338 36 426 2,897 Total 81 63 4,823 72 585 5,624 Total 184 290 5,772 86 610 6,942
* Undergraduate students are classified as full-time if they register for 12 or more credits. Graduate and graduate professional students are classified as full-time if they register for 8 or more credits. THE OHIO STATE UNIVERSITY Enrollment Services - Analysis and ReportingJuly 2, 2013
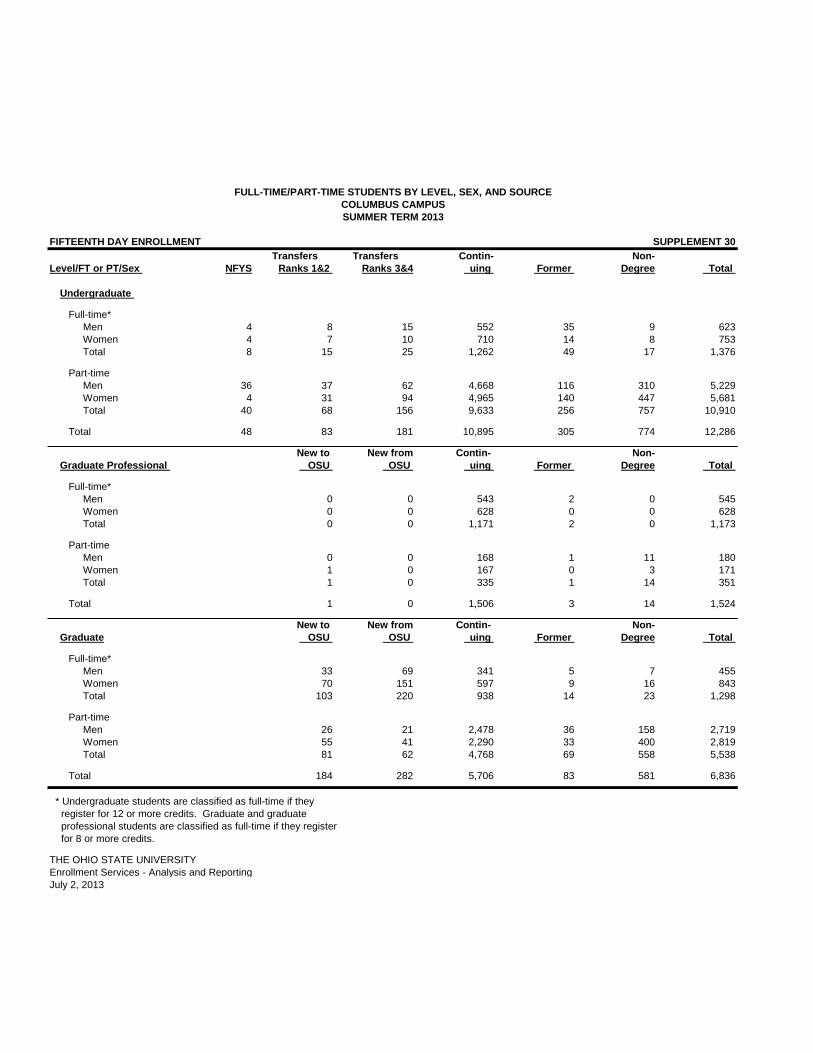
FULL-TIME/PART-TIME STUDENTS BY LEVEL, SEX, AND SOURCECOLUMBUS CAMPUSSUMMER TERM 2013
FIFTEENTH DAY ENROLLMENT SUPPLEMENT 30
Transfers Transfers Contin- Non-Level/FT or PT/Sex NFYS Ranks 1&2 Ranks 3&4 uing Former Degree Total
Undergraduate
Full-time* Men 4 8 15 552 35 9 623 Women 4 7 10 710 14 8 753 Total 8 15 25 1,262 49 17 1,376 Part-time Men 36 37 62 4,668 116 310 5,229 Women 4 31 94 4,965 140 447 5,681 Total 40 68 156 9,633 256 757 10,910 Total 48 83 181 10,895 305 774 12,286
New to New from Contin- Non-
Graduate Professional OSU OSU uing Former Degree Total
Full-time* Men 0 0 543 2 0 545 Women 0 0 628 0 0 628 Total 0 0 1,171 2 0 1,173 Part-time Men 0 0 168 1 11 180 Women 1 0 167 0 3 171 Total 1 0 335 1 14 351 Total 1 0 1,506 3 14 1,524
New to New from Contin- Non- Graduate OSU OSU uing Former Degree Total Full-time* Men 33 69 341 5 7 455 Women 70 151 597 9 16 843 Total 103 220 938 14 23 1,298 Part-time Men 26 21 2,478 36 158 2,719 Women 55 41 2,290 33 400 2,819 Total 81 62 4,768 69 558 5,538 Total 184 282 5,706 83 581 6,836
* Undergraduate students are classified as full-time if they register for 12 or more credits. Graduate and graduate professional students are classified as full-time if they register for 8 or more credits. THE OHIO STATE UNIVERSITY Enrollment Services - Analysis and ReportingJuly 2, 2013

FULL-TIME/PART-TIME STUDENTS BY LEVEL, SEX, AND SOURCEEXTENDED CAMPUSES
SUMMER TERM 2013
FIFTEENTH DAY ENROLLMENT SUPPLEMENT 31
Transfers Transfers Contin- Non-Level/FT or PT/Sex NFYS Ranks 1&2 Ranks 3&4 uing Former Degree Total
Undergraduate
Full-time* Men 1 1 0 32 2 0 36 Women 3 1 0 62 2 1 69 Total 4 2 0 94 4 1 105 Part-time Men 24 16 1 462 30 24 557 Women 15 26 11 626 24 46 748 Total 39 42 12 1,088 54 70 1,305 Total 43 44 12 1,182 58 71 1,410
New to New from Contin- Non- Graduate OSU OSU uing Former Degree Total Full-time* Men 0 2 0 0 0 2 Women 0 5 11 0 2 18 Total 0 7 11 0 2 20 Part-time Men 0 0 7 0 1 8 Women 0 1 48 3 26 78 Total 0 1 55 3 27 86 Total 0 8 66 3 29 106
* Undergraduate students are classified as full-time if they register for 12 or more credits. Graduate and graduate professional students are classified as full-time if they register for 8 or more credits. THE OHIO STATE UNIVERSITY Enrollment Services - Analysis and ReportingJuly 2, 2013

ENROLLMENT BY COLLEGE, LEVEL, SEX, AND FULL-TIME/PART-TIMETOTAL UNIVERSITYSUMMER TERM 2013
FIFTEENTH DAY ENROLLMENT SUPPLEMENT 32
FULL-TIME* PART-TIME TOTALCollege, School,or Division Men Women Total Men Women Total Men Women TotalUndergraduate Arts and Sciences 340 382 722 2,191 2,653 4,844 2,531 3,035 5,566
Business 95 89 184 692 589 1,281 787 678 1,465Continuing Education 9 9 18 309 476 785 318 485 803Dentistry: Dental Hygiene 0 3 3 5 37 42 5 40 45Education and Human Ecology 40 153 193 392 887 1,279 432 1,040 1,472
Engineering, Total 90 35 125 1,229 371 1,600 1,319 406 1,725 Engineering 83 33 116 1,158 319 1,477 1,241 352 1,593 Architecture 7 2 9 71 52 123 78 54 132
Exploration Program 32 15 47 384 256 640 416 271 687
Food, Agricultural and Environmental Sciences (FAES), Total 13 20 33 295 304 599 308 324 632 Environment and Natural Resources 4 6 10 71 71 142 75 77 152 FAES 9 14 23 224 233 457 233 247 480
Health and Rehabilitation Sciences 24 56 80 115 216 331 139 272 411Nursing 1 5 6 44 323 367 45 328 373Pharmacy 0 3 3 50 69 119 50 72 122Public Affairs 9 10 19 24 24 48 33 34 67Public Health 1 12 13 11 60 71 12 72 84Social Work 4 30 34 22 144 166 26 174 200Undergraduate Student Academic Services 1 0 1 23 20 43 24 20 44 Total 659 822 1,481 5,786 6,429 12,215 6,445 7,251 13,696
Graduate Professional
Dentistry 182 139 321 6 0 6 188 139 327Law 1 4 5 42 32 74 43 36 79Medicine 241 205 446 102 81 183 343 286 629Optometry 50 73 123 0 2 2 50 75 125Pharmacy, Doctor of 48 89 137 26 37 63 74 126 200Veterinary Medicine 23 118 141 4 19 23 27 137 164 Total 545 628 1,173 180 171 351 725 799 1,524
Graduate Total 457 861 1,318 2,727 2,897 5,624 3,184 3,758 6,942
GRAND TOTAL 1,661 2,311 3,972 8,693 9,497 18,190 10,354 11,808 22,162
* Undergraduate students are classified as full-time if they register for 12 or more credits. Graduate and graduate professional students are classified as full-time if they register for 8 or more credits. THE OHIO STATE UNIVERSITY Enrollment Services - Analysis and ReportingJuly 2, 2013

FULL-TIME / PART-TIME STUDENTS BY CAMPUS, LEVEL, AND SEXTOTAL UNIVERSITYSUMMER TERM 2013
FIFTEENTH DAY ENROLLMENT SUPPLEMENT 33
CAMPUS UNDERGRADUATE GRADUATE GRADUATE PROFESSIONAL TOTAL
FT/PT Men Women Total Men Women Total Men Women Total Men Women Total
Columbus Campus
Full-time* 623 753 1,376 455 843 1,298 545 628 1,173 1,623 2,224 3,847
Part-time 5,229 5,681 10,910 2,719 2,819 5,538 180 171 351 8,128 8,671 16,799
Total 5,852 6,434 12,286 3,174 3,662 6,836 725 799 1,524 9,751 10,895 20,646
Lima Campus
Full-time* 5 18 23 2 5 7 7 23 30
Part-time 75 102 177 1 7 8 76 109 185
Total 80 120 200 3 12 15 83 132 215
Mansfield Campus
Full-time* 4 13 17 0 3 3 4 16 20
Part-time 110 169 279 1 35 36 111 204 315
Total 114 182 296 1 38 39 115 220 335
Marion Campus
Full-time* 18 25 43 0 7 7 18 32 50
Part-time 108 154 262 5 19 24 113 173 286
Total 126 179 305 5 26 31 131 205 336
Newark Campus
Full-time* 9 13 22 0 3 3 9 16 25
Part-time 187 269 456 1 17 18 188 286 474
Total 196 282 478 1 20 21 197 302 499
Wooster-ATI
Full-time* 0 0 0 0 0 0
Part-time 77 54 131 77 54 131
Total 77 54 131 77 54 131
Total University
Full-time* 659 822 1,481 457 861 1,318 545 628 1,173 1,661 2,311 3,972
Part-time 5,786 6,429 12,215 2,727 2,897 5,624 180 171 351 8,693 9,497 18,190
Total 6,445 7,251 13,696 3,184 3,758 6,942 725 799 1,524 10,354 11,808 22,162
* Undergraduate students are classified as full-time if they
register for 12 or more credits. Graduate or graduate professional
professional students are classified as full-time if they register
for 8 or more credits.
THE OHIO STATE UNIVERSITY
Enrollment Services - Analysis and Reporting
July 2, 2013
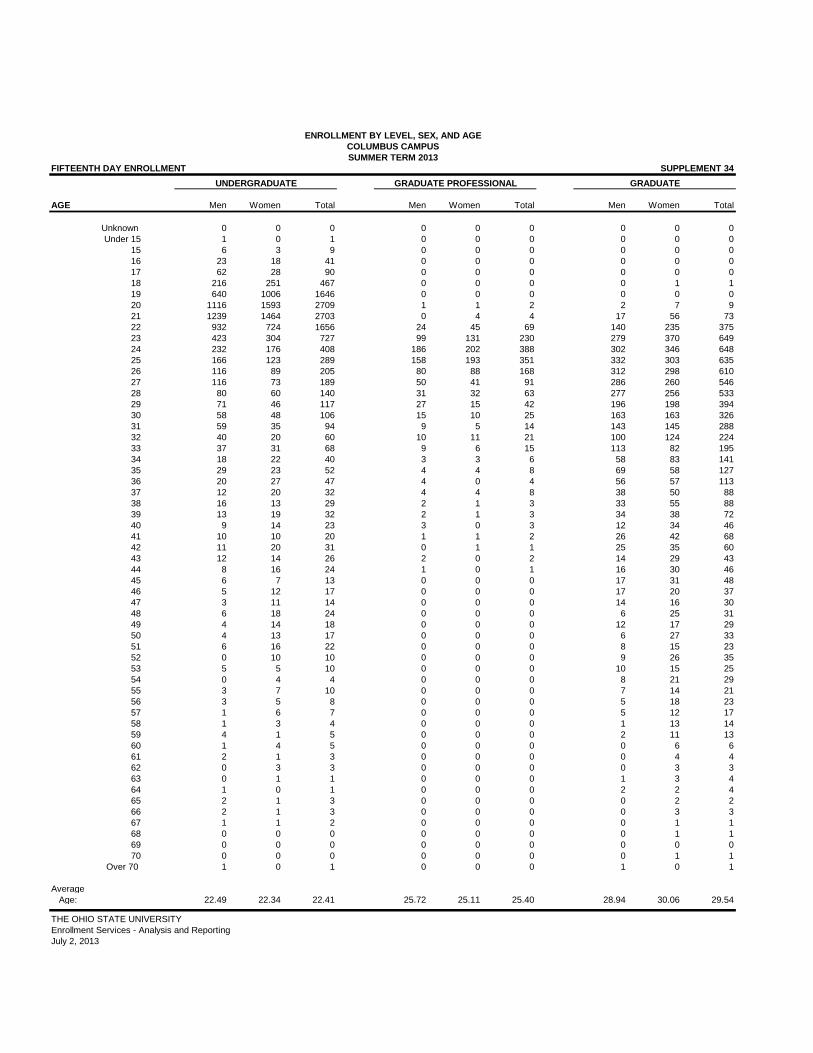
ENROLLMENT BY LEVEL, SEX, AND AGECOLUMBUS CAMPUSSUMMER TERM 2013
FIFTEENTH DAY ENROLLMENT SUPPLEMENT 34
UNDERGRADUATE GRADUATE PROFESSIONAL GRADUATE
AGE Men Women Total Men Women Total Men Women Total
Unknown 0 0 0 0 0 0 0 0 0Under 15 1 0 1 0 0 0 0 0 0
15 6 3 9 0 0 0 0 0 016 23 18 41 0 0 0 0 0 017 62 28 90 0 0 0 0 0 018 216 251 467 0 0 0 0 1 119 640 1006 1646 0 0 0 0 0 020 1116 1593 2709 1 1 2 2 7 921 1239 1464 2703 0 4 4 17 56 7322 932 724 1656 24 45 69 140 235 37523 423 304 727 99 131 230 279 370 64924 232 176 408 186 202 388 302 346 64825 166 123 289 158 193 351 332 303 63526 116 89 205 80 88 168 312 298 61027 116 73 189 50 41 91 286 260 54628 80 60 140 31 32 63 277 256 53329 71 46 117 27 15 42 196 198 39430 58 48 106 15 10 25 163 163 32631 59 35 94 9 5 14 143 145 28832 40 20 60 10 11 21 100 124 22433 37 31 68 9 6 15 113 82 19534 18 22 40 3 3 6 58 83 14135 29 23 52 4 4 8 69 58 12736 20 27 47 4 0 4 56 57 11337 12 20 32 4 4 8 38 50 8838 16 13 29 2 1 3 33 55 8839 13 19 32 2 1 3 34 38 7240 9 14 23 3 0 3 12 34 4641 10 10 20 1 1 2 26 42 6842 11 20 31 0 1 1 25 35 6043 12 14 26 2 0 2 14 29 4344 8 16 24 1 0 1 16 30 4645 6 7 13 0 0 0 17 31 4846 5 12 17 0 0 0 17 20 3747 3 11 14 0 0 0 14 16 3048 6 18 24 0 0 0 6 25 3149 4 14 18 0 0 0 12 17 2950 4 13 17 0 0 0 6 27 3351 6 16 22 0 0 0 8 15 2352 0 10 10 0 0 0 9 26 3553 5 5 10 0 0 0 10 15 2554 0 4 4 0 0 0 8 21 2955 3 7 10 0 0 0 7 14 2156 3 5 8 0 0 0 5 18 2357 1 6 7 0 0 0 5 12 1758 1 3 4 0 0 0 1 13 1459 4 1 5 0 0 0 2 11 1360 1 4 5 0 0 0 0 6 661 2 1 3 0 0 0 0 4 462 0 3 3 0 0 0 0 3 363 0 1 1 0 0 0 1 3 464 1 0 1 0 0 0 2 2 465 2 1 3 0 0 0 0 2 266 2 1 3 0 0 0 0 3 367 1 1 2 0 0 0 0 1 168 0 0 0 0 0 0 0 1 169 0 0 0 0 0 0 0 0 070 0 0 0 0 0 0 0 1 1
Over 70 1 0 1 0 0 0 1 0 1 Average Age: 22.49 22.34 22.41 25.72 25.11 25.40 28.94 30.06 29.54
THE OHIO STATE UNIVERSITY Enrollment Services - Analysis and ReportingJuly 2, 2013

ENROLLMENT OF NEW UNDERGRADUATE STUDENTS BY SEX AND AGECOLUMBUS CAMPUSSUMMER TERM 2013
FIFTEENTH DAY ENROLLMENT SUPPLEMENT 35
NFYS NEW TRANSFERS TOTAL
AGE Men Women Total Men Women Total Men Women Total
Unknown 0 0 0 0 0 0 0 0 0Under 15 0 0 0 0 0 0 0 0 0
15 0 0 0 0 0 0 0 0 016 1 0 1 0 0 0 1 0 117 8 2 10 0 2 2 8 4 1218 23 3 26 3 1 4 26 4 3019 3 3 6 8 10 18 11 13 2420 2 0 2 13 19 32 15 19 3421 0 0 0 16 11 27 16 11 2722 0 0 0 8 4 12 8 4 1223 1 0 1 11 10 21 12 10 2224 1 0 1 5 8 13 6 8 1425 0 0 0 9 10 19 9 10 1926 0 0 0 7 8 15 7 8 1527 0 0 0 6 4 10 6 4 1028 0 0 0 6 4 10 6 4 1029 0 0 0 2 3 5 2 3 530 0 0 0 8 6 14 8 6 1431 0 0 0 5 1 6 5 1 632 0 0 0 1 2 3 1 2 333 0 0 0 4 4 8 4 4 834 0 0 0 1 1 2 1 1 235 0 0 0 1 5 6 1 5 636 0 0 0 1 4 5 1 4 537 0 0 0 0 1 1 0 1 138 0 0 0 2 0 2 2 0 239 0 0 0 0 4 4 0 4 440 0 0 0 1 3 4 1 3 441 0 0 0 0 1 1 0 1 142 0 0 0 1 1 2 1 1 243 0 0 0 0 2 2 0 2 244 0 0 0 0 1 1 0 1 145 0 0 0 0 0 0 0 0 046 0 0 0 0 4 4 0 4 447 0 0 0 0 1 1 0 1 148 1 0 1 1 1 2 2 1 349 0 0 0 0 1 1 0 1 150 0 0 0 0 1 1 0 1 151 0 0 0 1 1 2 1 1 252 0 0 0 0 1 1 0 1 153 0 0 0 0 0 0 0 0 054 0 0 0 0 0 0 0 0 055 0 0 0 0 1 1 0 1 156 0 0 0 0 0 0 0 0 057 0 0 0 0 1 1 0 1 158 0 0 0 0 0 0 0 0 059 0 0 0 0 0 0 0 0 060 0 0 0 0 0 0 0 0 061 0 0 0 0 0 0 0 0 062 0 0 0 0 0 0 0 0 063 0 0 0 0 0 0 0 0 064 0 0 0 0 0 0 0 0 065 0 0 0 0 0 0 0 0 066 0 0 0 1 0 1 1 0 167 0 0 0 0 0 0 0 0 068 0 0 0 0 0 0 0 0 069 0 0 0 0 0 0 0 0 070 0 0 0 0 0 0 0 0 0
Over 70 0 0 0 0 0 0 0 0 0 Average Age: 18.95 18.13 18.81 25.68 28.22 27.05 24.02 27.68 25.78
THE OHIO STATE UNIVERSITY Enrollment Services - Analysis and ReportingJuly 2, 2013