the ongoing dynamics of integrating sustainability into ... · the ongoing dynamics of integrating...
TRANSCRIPT

637© Springer Science+Business Media B.V. 2019G. G. Lenssen, N. C. Smith (eds.), Managing Sustainable Business, https://doi.org/10.1007/978-94-024-1144-7_30
M. Morsing (*) Stockholm School of Economics, Stockholm, Sweden
Copenhagen Business School, Frederiksberg, Denmarke-mail: [email protected]
D. Oswald London Business School, London, UK
Ross School of Management, University of Michigan, Ann Arbour, MI, USA
S. Stormer Corporate Sustainability, NovoNordisk, Copenhague, Denmark
30The Ongoing Dynamics of Integrating Sustainability into Business Practice: The Case of Novo Nordisk A/S
Mette Morsing, Dennis Oswald, and Susanne Stormer
Prologue
The data for this case study was collected in 2005. Today, 10 years later in 2015, some of the content of the systems (for example the KPIs) and the persons (for example Eric Drapé) have changed. But the tools and the challenges to integrating sustainability in Novo Nordisk remain. Instead of re-writing the case from 2005, we decided to pro-duce an epilogue that provides the reader with an update on some of the important areas that have influenced the way that Novo Nordisk works. We hope that the epi-logue anno 2015 will further stimulate discussions in the class room – and beyond – about integration of sustainability into the organization and how such integration is never a “quick fix” that is done once-and-for-all, but an ongoing and dynamic process that needs careful managerial attention and development over time.

638
Introduction
We all have a vision of how we’d like the world to be. For a company like Novo Nordisk committed to sustainable development, that vision is one of trust, openness, shared values and partnerships. We translate that as the Triple Bottom Line – social and environmental responsibility and economic viability. In an age where companies are scrutinised and transparency is the only way to gain trust, social responsibility is vital to maintain a business advantage. CEO Lars Rebien Sørensen, Novo Nordisk.1
Novo Nordisk is an excellent example of an organisation that attempts to consider sustainability as an integrated part of its strategy and in all of its business decisions. To meet this goal, the company has adopted a management philosophy which they call the ‘Novo Nordisk Way of Management’ to ensure all actions taken by employees meet corporate objectives. Within this management tool are three pillars that are used as control mechanisms to integrate sustainability into Novo Nordisk’s business practices: facilitators, sustainability report, and the balanced scorecard. However, it is not certain to what extent each of these pillars is effective in influenc-ing behaviour at the operational level.
Novo Nordisk defines sustainable development as being about preserving the planet while improving the quality of life for its current and future inhabitants. From a business perspective this involves the inclusion of economic, social and environmental considerations in the business strategy. During the 1990s many com-panies experienced an enormous pressure from critical stakeholders, governments, media, NGOs, and international organisations to demonstrate that they had adopted sustainable business practices.
The days when Aristotle Onassis could tuck his whalers out of sight behind convenient icebergs are almost gone. New technologies and open borders render most forms of eco-nomic, environmental, and social abuse increasingly visible. Indeed, far from being drowned in a floodtide of useless information, many of the world’s citizens – thanks in large part to the public interest groups a number of them support – are becoming increasingly adept at keeping track of the activities of corporations and governments.2
The concept of ‘sustainability’ is often traced back to the World Commission on Environment and Development (the Brundtland Commission) report which coined the following definition: “Sustainable Development is development that meets the needs of the present without compromising the ability of future generations to meet their own needs”.3 As the number of organisations that claim to adhere to sustain-able business practices increases, so does the number of pieces of information that is prepared and disseminated about these practices. In a recent publication, the ACCA (Association of Chartered Certified Accountants) and CorporateRegistar.com reported that in 1993 there were fewer than 100 cases of corporate non- financial
1 Novo Nordisk, “Take Action. Make the Triple Bottom Line Your Business”, May, 2003, p. 2.2 Elkington, J. “Cannibals With Forks. The Triple Bottom Line of 21st Century Business”, Oxford: Capstone Publishing Ltd., 1999, p. 161.3 World Commission on Environment and Development, Our Common Future, 1987.
M. Morsing et al.

639
reporting worldwide, but by 2003 there were over 1500 reports produced worldwide on an annual basis.4 As these practices have become more common amongst corpo-rations, there has been criticism as to whether these same firms are purely ‘window dressing’, with no ambitions to embed sustainability in their business practices. A survey on corporate social responsibility in The Economist stated:
Under pressure, big multinationals ask their critics to judge them by CSR criteria, and then, as the critics charge, mostly fail to follow through. Their efforts may be enough to convince the public that what they see is pretty, and in many cases this may be all they ever intended to achieve. But by and large CSR is at best a gloss on capitalism, not the deep systematic reform that its champions deem desirable.5
This case raises the question of how managers can adopt appropriate manage-ment control systems to communicate to employees and other stakeholders what behaviour is desired, and to ensure that their corporate sustainability claims are implemented at the operational level. That is, how can organisations demonstrate that their sustainability declarations are not just “good looks”. Specifically, this case unfolds Novo Nordisk’s long-term commitment to sustainable business practices and the company’s validations of these practices by focusing on how issues of sus-tainability have been integrated and cascaded throughout the entire organisation via the company’s ‘Way of Management’. The Novo Nordisk business unit – Diabetes Finished Products – is used an example.
Introduction to Novo Nordisk A/S
Novo Nordisk A/S was founded by August Krogh in the 1922, a Danish Nobel lau-reate in physiology. He was inspired by two Canadian researchers, Frederick Banting and Charles Best, who had begun extracting insulin from the pancreas of cows in the previous year. August Krogh’s wife, Marie, had type 2 diabetes; there-fore, he established Nordisk Insulinlaboratorium to produce insulin for the treat-ment of diabetes. In 1925 two former employees, Harald and Thorvald Pedersen, established a competing insulin company, Novo Terapeutisk Laboratorium. In 1989, the two companies merged and became Novo Nordisk A/S.
By 2005, Novo Nordisk was a world leader in diabetes care; the company also held a leading position in hemostasis management, growth hormone therapy and hormone replacement therapy. Novo Nordisk previously was involved in the pro-duction of enzymes. However, a demerger in 2000 saw the establishment of Novozymes, which took over the enzymes production, leaving Novo Nordisk to focus entirely on healthcare. Novo Nordisk headquarters is located in Denmark, on
4 ACCA and CorporateRegister.com, “Towards transparency: progress on global sustainability reporting 2004”, p. 8.5 Crook, C., “A survey of corporate social responsibility”, The Economist, January 22nd, 2005, p. 2.
30 The Ongoing Dynamics of Integrating Sustainability into Business Practice…

640
the outskirts of Copenhagen, and employed in 2005 approximately 20,000 employ-ees in 78 countries. Novo Nordisk marketed its products in 179 countries.
Appendix 1 provides Novo Nordisk’s organisational structure anno 2005. From 2002 Corporate Stakeholder Relations became part of the executive management team along with R&D, Quality, Regulatory & Business Development, Finance and Operations.
Novo Nordisk is a company based on research. Research and development expenditures equalled 43.2% of the total wage costs in 2004 and have been in the range of 15.0–16.6% of total turnover over the period 2000–2004. During this same period, Novo Nordisk had between 526 and 778 active patent families, with between 85 and 145 new patent families per year.6
Financially, Novo Nordisk has performed well, with strong growth in turnover combined with continued high profitability; the market value of the Novo Nordisk has followed the booming American pharmaceutical sector and it outperformed the European pharmaceutical index. In 2004, Novo Nordisk reported an operating profit of 6980 million Danish kroner (DKK), turnover of DKK 29,031 million and a diluted earnings per share of DKK 14.83. Additionally, Novo Nordisk reported a return on invested capital of 21% in 2004. Over the period May 1, 2004 to April 30, 2005 Novo Nordisk had a negative share return of 1.55%; however, over the last 5 years (May 1, 2000 to April 30, 2005) Novo Nordisk’s share return equalled 44.17%.7 Appendix 2 provides key financial data for the last 5 years, and return data for Novo Nordisk, the Danish market, and other large European pharmaceutical companies over the same period.
The share ownership of Novo Nordisk is developed to ensure that the organisation has a high degree of freedom, as it is not open for takeovers, for example, from larger pharmaceutical companies. Specifically, total share capital is divided into A-shares and B-shares (each B-share carries 1/10 of the votes of an A-share). The A-shares are non-listed and held by Novo A/S (which is a private limited Danish company that is 100% owned by the Novo Nordisk Foundation which was established with the merger in 1989). The B-shares are publicly traded on the Copenhagen, London and New York stock exchanges. As reported in the 2004 Annual Report, Novo A/S con-trols 26.1% of the B-shares, giving it 70.6% of the total number of votes. Large block-holdings of the remaining B-shares included in 2005 large institutional inves-tors like the Danish ATP Pension Fund (4.3%), The Capital Group Companies (10%), and Fidelity Investments (4.4%). Additionally, the company itself held 6.4% of the shares. ‘Other’ investors held the remaining 48.8%, which included employees.8 Novo Nordisk’s board of directors consisted of ten members: seven elected by the shareholders and three by the employees.9 Novo Nordisk’s six executive directors as
6 Novo Nordisk A/S, Annual Report 2004, pp. 49, 60 and 98.7 Sources: Novo Nordisk A/S, Annual Report 2004, p. 38 and Thompson Financial Datastream.8 Novo Nordisk A/S, Annual Report 2004, p. 108.9 For more than 30 years it has been mandatory to have employees represented at the board of directors in Danish companies, see for example: Rose, C., “Medarbejderrepræsentation i danske bestyrelser”. Center for Kreditret- og Kapitalmarkedsret, Copenhagen Business School Press, 2004, p. 21–32.
M. Morsing et al.

641
well as the directors of the Novo Nordisk Foundation were not represented in the Novo Nordisk board, which was in accordance with the general guidelines of corpo-rate governance at the Copenhagen, London and New York stock exchanges. It was increasingly important issue to demonstrate that Novo Nordisk was doing business according to these guidelines. However, in 2000, the former CEO, Mads Øvlisen, assumed the role as chairman of the Board of Novo Nordisk..
Sustainability as Part of Novo Nordisk’s Business Strategy
Novo Nordisk has worked strategically with environmental and social responsibility since the beginning of 1990es, and in 2005 sustainability was an integrated part of the business strategy. Engagement in stakeholder dialogue and corporate social responsibility was extremely important to Novo Nordisk, and CEO of the company, Lars Rebien Sørensen, believed trust to be imperative:
Public authorities and NGOs have sharpened their tone, and we must take them seriously”, stated President and CEO of Novo Nordisk, Lars Rebien Sørensen. “It is important to be open and honest about our stand and our actions. Trust has to be earned10
Executive management at Novo Nordisk had made corporate values and sustain-ability an integrated part of the company’s corporate brand. Mads Øvlisen, Novo Nordisk’s chairman until 2006, often expressed strong views in the business press, and on a number of occasions on the front pages, on issues of sustainability. Many Danish business managers considered him the embodiment of corporate sustain-ability.11 He has participated in a number of government and business initiatives in this area, as well as contributing to the foundation of the European Academy of Business in Society and he is Senior Advisor to the Un Global Compact. He is also an adjunct professor of corporate social responsibility at Copenhagen Business School.
Novo Nordisk’s annual financial report of 2003 demarcated top management’s dedication to sustainability, as it carries the same title as the sustainability report 2003: “What does being there mean to you?” In the welcome letter the CEO, Lars Rebien Sørensen and the chairman, Mads Øvlisen, explained why stakeholders matter to core business:
Whom do corporations serve? Not so many years ago, we would have said ‘shareholders’, without hesitation. But increasingly business enterprises are recognising commitments to serve other stakeholders – such as customers, employees, societies at large – in addition to
10 Novo Nordisk A/S, Annual Report 2004, p. 18.11 For example: “This is Mads Øvlisen, the former CEO of Novo Nordisk and one of the most admired individuals in Danish business. As he retired in 2000 after 19 years as chief executive offi-cer in Novo Nordisk, he had increased the number of employees from 4.000 to 15.000. He has won prizes for his management style of trustworthiness, and he has made Novo Nordisk synonymous with corporate social responsibility. But he has remained the approachable Mads with tucked-up sleeves. Øvlisen is a success, a living legend, a walking lump of gold”, Euroman, March 2005, p. 46.
30 The Ongoing Dynamics of Integrating Sustainability into Business Practice…

642
shareholders. In order to serve the long term interest of stakeholders, companies must regards it as core part of their business to assume a wider responsibility and consider broadly the wide range of factors which may impact its ability to generate returns over long periods of time12
The conspicuous commitment to sustainability was reinforced in the 2004 annual report, which was the company’s first integrated triple bottom line report combining economic, environmental and social results. In the opening, the commitment was stated clearly collectively by Lars Rebien Sørensen and Mads Øvlisen on page 1 of the 2004 Annual Report:
Novo Nordisk takes a multi-pronged approach to providing better access to health through capacity building, a preferential pricing policy for the poorest nations and funding through the World Diabetes Foundation, which is now reaching out to many millions of people with diabetes. In terms of sustainability, Novo Nordisk demonstrates its determination to play a leading role by setting a target for an absolute reduction of CO2 emissions over the next decade. When people can overcome the challenges of diabetes, we must as a company tackle the global challenges of social and sustainable stewardship.
In 2002, the inclusion of Stakeholder Relations as part of the executive manage-ment team demarcated a strengthening of Novo Nordisk’s sustainability focus. In 2004, the Stakeholder Relations area was expanded and Lise Kingo (Executive Vice President) became responsible for corporate communications, human resources and occupational health service in what was in 2005 referred to as “People, reputation and relations” with approximately 200 employees working in this group. Ms. Kingo believed that her group was responsible for the two most important assets in Novo Nordisk: the people and the brand. This department was responsible for driving, challenging and monitoring Triple Bottom Line strategies and helping the business units to implement new activities in relation to sustainability by13:
• Monitoring issues and spotting trends that may affect future business• Engaging with stakeholders to reconcile dilemmas and find common ground for
more sustainable solutions• Building relationships with key stakeholders in the global, international and
local communities of which Novo Nordisk is a part• Driving and embedding long-term thinking and the Triple Bottom Line mindset
throughout the company• Accounting for the company’s performance and conveying Novo Nordisk’s
positions, objectives and goals to audiences with an interest in the company• Translating and integrating the Triple Bottom Line approach into all business
processes to obtain sustainable competitive advantages in the marketplace
12 Novo Nordisk, Annual Report 2003, p. 2.13 Corporate Stakeholder Relations’ Strategic Plan 2004–05, March 2004, slide 2.
M. Morsing et al.

643
History of Sustainability
The focus on sustainability was not new for Novo Nordisk. In the late 1960s Novo Nordisk was confronted with severe stakeholder criticisms for the first time, and a close interaction with a broad variety of stakeholders have been part of the compa-ny’s strategy since then. Novo Nordisk’s first encounter with stakeholder criticism was surrounding new production methods that introduced genetically engineered micro-organisms, resulting in the development of a new product line of enzymes. These enzymes were important ingredients in many products (e.g., detergent). Environmentally oriented NGOs, as well as scientific articles, first raised awareness that the use of detergents with enzymes could lead to those in contact with the prod-uct developing allergies, and that the dust from the production process could have implications for employees’ health. Novo Nordisk’s sales fell dramatically, and the company reacted with a strong and fast response by developing dust-free enzymes presenting no risk for the consumers.14 Sales rose again and enzyme production became an important part of Novo Nordisk’s production in Denmark, USA and Japan.
In 2001, Novo Nordisk was once again confronted with criticism from NGOs. The pharmaceutical industry association in South Africa,, including Novo Nordisk, raised the issue of protecting intellectual property rights with the South African government. This led to major public criticism of the consortium mem-bers, who were accused of giving priority to profits at the expense of the health of less advantaged people. Again, Novo Nordisk reacted fast. By engaging in dia-logue with the NGOs, the company defined a new policy to strengthen the com-pany’s presence and development of medicines to combat diabetes in developing countries. A new pricing policy and the establishment of the World Diabetes Foundation in late 2001 can be seen as a strategic result of Novo Nordisk’s response to the criticism.
Issues of importance for sustainability in Novo Nordisk had changed from a predominantly environmental focus to a focus that includes health, safety and bio-ethics issues, and a focus on how to integrate issues of social responsibility. To illustrate the concurrent broadening of the scope Novo Nordisk had developed a learning curve, shown below in Fig. 30.1.15
The learning curve shows that Novo Nordisk perceived sustainability as a con-tinuous learning process, in which the company needed to be able to take in new issues and integrate these concurrently in the business strategy towards “full busi-ness integration”.
14 See Novo Nordisk History, p.15; available at: http://www.novonordisk.com/about_us/history/milestones_in_nn_history.asp15 Source: Corporate Stakeholder Relations Strategic Plan 2004–05, March 2004, p. 15.
30 The Ongoing Dynamics of Integrating Sustainability into Business Practice…

644
How Did Novo Nordisk Meet Its Objectives of Being Sustainable?
In 1997, the Novo Nordisk Way of Management (see Fig. 30.2, below) was intro-duced as an overall guideline to ensure that Novo Nordisk’s strategic goals were reached at the operational level. A central part of the strategic goal was the integra-tion and implementation of sustainable business practices:
The Novo Nordisk Way of Management serves as the solid footing from which innovative ideas can take off. Its immediate strengths lie in its consistency, coherence and systematic follow-up methods. It is the way we do things.16
The Novo Nordisk Way of Management was designed and introduced to strike a balance between corporate control and decentralized decision-making. It was implemented as a reaction to the situation in the previous year where company systems, procedures and routines were standardized and centralized at headquarters in Bagsværd in Denmark, and this had led to dissatisfaction among managers in the foreign subsidiaries who found that the systems did not always fit with the local situation and needs. As an illustration of this balance, Henrik Gürtler, CEO of Novo A/S, saw the Novo Nordisk Way of Management as an
16 Ibid, p. 13.
Fig. 30.1 Novo Nordisk learning curve
M. Morsing et al.

645
opportunity to develop new and motivating control systems throughout the entire organisation:
New initiatives and management programmes were introduced regularly, but they had no effect across borders. They were encapsulated and never seemed to make much difference outside corporate headquarters. It annoyed me, and when the Novo Nordisk Way of Management was designed as a new and overall guideline, I decided to do something about it.17
17 Quote from CEO Henrik Gürtler, Novo A/S, June 2, 2005
Fig. 30.2 The Novo Nordisk way of management
30 The Ongoing Dynamics of Integrating Sustainability into Business Practice…

646
Then CEO, Mads Øvlisen explained the Novo Nordisk Way of Management for all managers and employees in a letter in January 1997:
The Novo Nordisk Way of Management is a comprehensive and easy-to-use guide which should allow you to use your insight and judgment in complying also with the “local” man-agement and quality system derived from this corporate basis for use in functions an depart-ments throughout Novo Nordisk.”18
The Novo Nordisk Way of Management extended beyond products and manu-facturing operations to include all activities, and as such it was a broad frame that described the rationale that should set the tone and the standards amongst managers and employees in the entire organization. Additionally, Novo Nordisk also devel-oped a vision, values, commitments, and fundamentals in order to inspire and guide its employees to achieve superior performance. These are included in Appendix 3.
To ensure that the entire organisation understood and adhered to the Novo Nordisk Way of Management, the company has developed a methodology consisting of three elements: facilitators, sustainability reporting and balanced scorecard. Each of these elements is discussed below.
Facilitators
The Facilitators were a team of around 16 high-profile professionals at the holding company, Novo A/S. Each of them had a professional background from senior specialist or managerial positions in Novo Nordisk or Novozymes. They travelled in pairs to visit all business units and levels of the entire organisation every third year. The first team of facilitators was recruited internally in 1996; the Facilitator team had a blend of ages, gender, professions and nationalities. They served to assess, assist and facilitate units and projects to perform better. Their tasks were19:
1. Through on-site auditing/faciliting of departments, factories, affiliates, assess whether or not the company-wide minimum standard requirements or “ground rules” as specified in the Novo Nordisk Way of Management are met.
2. Through on-site advice and help, assist the unit in question in correcting identified non-compliance with these requirements.
3. Through on-site identification of “best practices” applied, facilitate communica-tion and sharing of these across the organization.
A facilitation was a structured, planned assessment of the status the Novo Nordisk Way of Management within the unit or project with the aim of developing agreed actions for improvement. In conducting the facilitation, the facilitators would20:
18 “Novo Nordisk Way of Management: a short interpretation guide to the fundamentals”, preface, 1997.19 Novo Nordisk: “The facilitation process: charter of standards, procedures and guidelines”, 1998.20 Ibid.
M. Morsing et al.

647
• Obtain objective evidence through a fact-finding process• Provide objective, validated assessments and conclusion• Include recommendations for improvements where appropriate• Agree on action plans with unit or process managers• Follow up on the implementation of the action plan• Fulfil their responsibilities in a manner demonstrating integrity, objectivity, and
professional behaviour
The facilitation process consisted of three stages. First is the pre-facilitation, in which the scope of the facilitation was identified and material to support the process was developed. Second was the facilitation itself, in which facilitators meet with the individual unit or project members, and an agreement was made on how to improve. Finally, a post-facilitation process was conducted, in which the facilitator was responsible for following up and reporting to executive management on the achieve-ments with respect to the action points agreed upon in stage two. Appendix 4 pro-vides excerpts from a facilitation at the Diabetes Pharmaceutical Site Hillerød.
Sustainability Reporting
Sustainability reporting was used to ensure that sustainability thinking became part of everyday business practices at Novo Nordisk. In 1989 Novo Nordisk produced its first environmental management review as part of its proactive stakeholder strategy – long before environmental reporting became compulsory for companies like Novo Nordisk. In 1994 Novo Nordisk produced its first environmental report including resource con-sumption, emissions and use of experimental animals. Later, in 1998, a social report was issued, and since 1999 Novo Nordisk has published annual reports on sustain-ability integrating environmental, social and economic concerns.21 For the first time in 2004, Novo Nordisk integrated this information with its financial results and reported a combined social, environmental and economic report – The Annual Report 2004. These reports addressed issues recommended by United Nation’s Global Compact, the Global Reporting Initiative’s 2002 Sustainability Reporting Guidelines, and fol-lowed the approach laid out in the AA1000 Framework; the reports delivered a com-prehensive documentation of Novo Nordisk’s ambitions, goals, initiatives, results and new targets for environmental and social responsibility.
Novo Nordisk was renowned nationally and internationally for its dedication to corporate sustainability and for pioneering new agendas and concurrent develop-ment of stakeholder relations. Recent recognition included being ranked by Corporate Knights Inc. in February 2005 amongst the top 100 sustainable compa-nies in the world, and being ranked second in the world by SustainAbility and the United Nations Environment Programme in November 2004 for its ability to iden-tify and manage social and environmental issues as accounted for in its sustainabil-ity report. Additionally, their Sustainability Report 2003 won the 1st prize (for the
21 These reports are available at http://www.novonordisk.com/sustainability/sustainability_in_short
30 The Ongoing Dynamics of Integrating Sustainability into Business Practice…

648
sixth time!) of the European Sustainability Awards (sponsored by the Association of Chartered Certified Accountants), and in Denmark, Novo Nordisk had won six prizes for the best annual social report awarded by the Association of Danish Accountants and the Danish business newspaper Børsen.22 In the annual image anal-ysis reported in Børsen, Novo Nordisk had in 1992, 2001, 2002, 2003 and 2005 ranked either one or two, with a high score on the corporate social responsibility element. In 2004 Novo Nordisk was second to A.P. Møller.23
In order to measure its progress towards sustainability, Novo Nordisk used a Triple Bottom Line approach which linked a set of key targets to sustainability goals. Appendix 5 provided details from Novo Nordisk’s Annual Report 2004 on the specific indicators used, and the reason for using them (impact). As shown in this appendix there were six strategic areas for Novo Nordisk’s Triple Bottom Line performance:
1. Living our values 2. Access to health 3. Our employees 4. Our use of animals 5. Eco-efficiency and compliance 6. Economic contribution
‘Living our values’ aimed to measure whether business actions are consistent with corporate values. Three performance metrics were used to gauge how well the company performs in this area; two of which were taken from an annual employee survey (eVoice) and one was directly related to the use of facilitators (discussed above).
‘Access to health’ was included as a means to ensure that the company as a phar-maceutical company was involved in promoting improvements in global health standards. Two measures were used to gauge Novo Nordisk’s presence in less devel-oped countries.
‘Our employees’ was included to ensure Novo Nordisk maintains high standards in relation to its workforce. Four performance measures were used to gauge Novo Nordisk’s treatment of their employees; two of these measures were taken from the eVocie employee survey.
‘Our use of animals’ was included to ensure Novo Nordisk, as a pharmaceutical company was in good standing with a key stakeholder group – animal welfare groups (in particular, the Danish Animal Welfare Society). Two metrics were used to ensure the ethical treatment of all animals used in research.
‘Eco-efficiency and compliance’ was included to measure Novo Nordisk’s impact on the environment. Four performance measures were included to measure
22 For further accolades, refer to http://www.novonordisk.com/sustainability/news23 Berlingske Nyhedsmagasin, no. 13, April 29.-June 13, 2005, p. 28.
M. Morsing et al.

649
the organisation’s use of water and energy, their compliance with regulations and the implementation of ISO 140001.24
‘Economic contribution’ was more than the traditional area of financial perfor-mance – it also covered the company’s socio-economic impacts. Five metrics were used, including traditional measures such as operating profit margin and return on invested capital, but also one metric that measured how much the company contrib-utes to the national economic capacity (total taxes as a percentage of turnover).
The Triple Bottom Line was used as a firm wide tool to ensure Novo Nordisk took actions that were consistent with operating as a sustainable company. All met-rics used in the Triple Bottom Line reported aggregate performance across all busi-ness units to present the full picture. Novo Nordisk did not report Triple Bottom Line performance at a disaggregated level (i.e., for each business unit), but did pro-vide specific and detailed data for eight major production sites.
Transparent reporting is a vital instrument for us in accounting for our performance on the Triple Bottom Line. This is where we can account for our approach to doing business in a single document and cohesively present performance, progress, positions and strategic ini-tiatives as well as the dilemmas and key issues we face as a pharmaceutical company. Most importantly, what we present in the report is the result of our interactions and engagements with stakeholders, said Susanne Stormer,25 then manager in Corporate Stakeholder Relations and responsible for Novo Nordisk’s sustainability reporting.
Balanced Scorecard
Rather than assessing each division with a Triple Bottom Line performance report, Novo Nordisk relied on the balanced scorecard:
The Balanced Scorecard is the management tool for embedding and cascading the Triple Bottom Line approach throughout the organisation. The Scorecard is a vital element of the corporate governance set-up in Novo Nordisk and thus a very powerful tool to ensure inte-gration of the sustainability approach into all business processes.26
Novo Nordisk had been using balanced scorecards since 1996; it was introduced primarily as a financial management tool. The administration of the scorecards rested with the Finance, Legal and IT department, which had a mandate to use the best management methods, of which balanced scorecards are viewed as an effective tool. The involvement of finance personnel with respect to balanced scorecards was to facilitate workshops (that is supporting management teams), assist in setting of targets, reviewing balanced scorecards, and changes to/improvements in financial management (i.e., integrating the balanced scorecard with processes).
Novo Nordisk cascaded its balanced scorecard down to the business unit level, from which it translated into individual employees’ personal targets, which were set
24 ISO 14001 is an environmental management standard with auditing tools and procedures.25 Quote from Susanne Stormer, June 19, 200526 Corporate Stakeholder Relations’ Strategic Plan 2004–05, March 2004, p. 13.
30 The Ongoing Dynamics of Integrating Sustainability into Business Practice…
650
and reviewed on a biannual basis. Specifically, a balanced scorecard was prepared for the organisation as a whole; this scorecard was then cascaded down to the execu-tive VP level (there were five executive VPs, each with their own scorecard). From this level, each of the 20 Senior VPs also had a balanced scorecard (i.e., the business unit level). From this level there was no formal mandate that the scorecards were further cascaded; however, in some business units, scorecards could be prepared for each individual sub-unit (e.g., a particular factory). In general, the sub-unit typically was evaluated on a collection of KPIs, rather than having objectives in each of the four traditional sections of a balanced scorecard.
Novo Nordisk currently had a total of 24 objectives in its balanced scorecard under the following four headings: (1) Customers & Society, (2) Finance, (3) Business Processes, and (4) People & Organisation. To facilitate the operation of the balanced scorecard, each objective was ‘owned’ by one of the five executive areas at Novo Nordisk. Corporate Stakeholder Relations was responsible for seven of the 24 objectives. These were:
1. Increase internationalisation 2. Support diversity 3. Ensure talent development 4. Ensure performance management 5. Ensure superior company reputation 6. Ensure environmental, social, and ethical performance 7. Improve our collaboration with key stakeholders in diabetes care worldwide
The Use of the Balanced Scorecard at Diabetes Finished Products
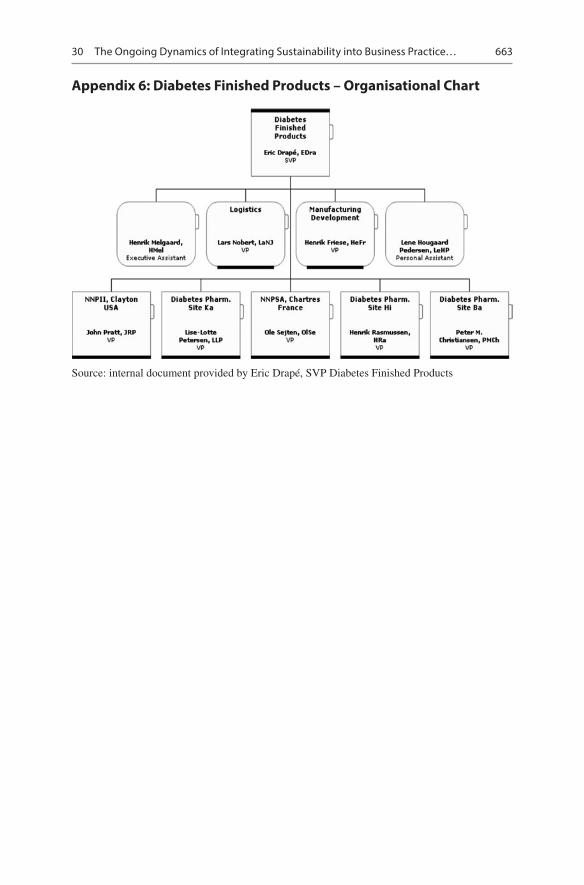
One of the key business units at Novo Nordisk was Diabetes Finished Products (DFP). This group was responsible for the production and distribution of all prod-ucts related to the treatment of Diabetes. In 2004, the group produced 807 million units of its four key products (Penfill® 3 ml filling, Prefilled 3 ml total, Penfill® 3 ml blister, and Insulin vials).27 There were approximately 3100 employees, spread across eight sites and DFP headquarters. Appendix 6 provides the organisational chart for DFP. Specifically, there were five production sites (three in Denmark, one in the United States, one in France); moreover, Novo Nordisk was expanding with another production facility in Brazil. Additionally, there was a logistics unit, and a manufacturing development unit that worked to take new products to mass produc-tion. Eric Drapé was the Senior Vice President of Diabetes Finished Products. Eric was a pharmacist by training, and had been with Novo Nordisk since 1990. He had been in his role since January 2004; his previous position was as a site manager (VP) at the French production facility.
27 Source: information supplied by Eric Drapé.
M. Morsing et al.

651
Figure 30.3 illustrates how the Balanced Scorecard was cascaded from Corporate to DFP. In our illustrations (Appendices 6, 7 and 8), we chose to not include the corporate level.
To illustrate how specific critical success factors (CSF) were cascaded through the organisation, Appendices 7, 8 and 9 describe the KPIs, the KPI definition and the 2005 target for three CSFs for Operations, Product Supply and Diabetes Finished Products. The three CSFs illustrated were those that were most closely aligned with the social and environmental issues in Novo Nordisk’s Triple Bottom Line.
The first CSF (Appendix 7) is to ensure environmental, social and ethical perfor-mance. With respect to DFP only one KPI was included, EPI performance, which was intended to measure the relation between total yield of product and consump-tion of water and energy. Further up the organisation, the emission of carbon diox-ide (CO2) was also measured. Noticeably missing from the corporate balanced scorecards28 were any KPIs which measured social and ethical performance – most likely a reflection of the general difficulty of defining meaningful and quantifiable social indicators at a corporate level.
The second CSF (Appendix 8) was a focus on supporting diversity and social responsibility. Throughout the organisation three KPIs were used. The first was intended to ensure that each level of the organisation supported diversity and ensured equal opportunities to its employees. The second was the number of employees that had evaluated progress according to the OA. Finally, was a metric which focused on the functioning and value of the Job Transfer Centre, which was a centre that had been established in connection with the company’s global sourcing strategy, accord-ing to which new jobs were created abroad, not in Denmark. The Job Transfer
28 Please note that the corporate balanced score card is not printed in the case. The balanced scorecard from Operations, Product Supply and Diabetes Finished Products are presented in Appendix 7.
Corporate BSC
Operations BSC
Product Supply BSC
Diabetes Finished Products BSC
Fig. 30.3 Cascading of the balanced scorecard
30 The Ongoing Dynamics of Integrating Sustainability into Business Practice…

652
Centre assisted Novo Nordisk employees in those units that were facing staffing changes to find a new job within, or outside Novo Nordisk.
The third CSF (Appendix 9) was to ensure talent development. Similar to the previous CSF, the use and number of KPIs was consistently applied throughout the organisation. Specifically, two KPIs were used. The first was the utilisation of talent pools with respect to the filling of new or vacant VP positions. The second KPI was the results of the section of questions on an annual employee survey (eVoice) which aimed to gauge perceptions of employee development.29
As a SVP, Eric was responsible for the balanced scorecard for his business unit, and he believed that it was an effective management tool:
The primary benefit [of the balanced scorecard] is to secure that people are aligned to the strategic goals of the company, and that they are not working for something which is not necessary to work for. We have full alignment, and that’s very convenient and comfortable.30
Eric was responsible for the 2005 DFP balanced scorecard, which had 27 KPIs: three in Finance, 12 in Business Processes, eight in People & Organisations, and four in Customers & Society, (Appendix 9 illustrates the CSFs, CSF rationale and KPIs for DFP’s 2005 balanced scorecard). There was no formal cascading of this balanced scorecard to the seven VPs. Nevertheless, each site was responsible for, and evaluated on, the majority of KPIs that were in the DFP balanced scorecard (each site is evaluated on approximately 20 KPIs).
The formal monitoring of the sites was done on a monthly basis. Specifically, data on all KPIs was calculated and updated into Novo Nordisk’s IT system (PEIS), and each site manager had to prepare a monthly report which explained any devia-tions from targets. Additionally, any deviation that was significantly large (gaining a red designation in the system) must be answered with a specific action plan. Eric also had informal discussions with his VPs every one to 2 months. The purpose of these meetings was to gauge how performance is proceeding. In addition to the monthly monitoring and informal discussions, Eric met each of his site managers twice a year as part of a formal Business Review. The purpose of these meetings was to discuss the monthly action plans, but also to discuss the overall site’s balanced scorecard.
In addition to being evaluated on the balanced scorecard, Eric’s (and his VPs) bonus compensation was also tied to balance scorecard performance. Appendix 10 provides Eric’s Performance Index for 2005. As shown, Eric was compensated
29 eVoice was an annual survey which asks a minimum of 48 questions around eight mandatory themes (Vision and Values, Development of employees, Employee engagement, Equal Opportunity, Stress and workload, Quality mindset, Performance orientation, and Internationalisation). In addi-tion, each unit and project group could include up to an additional 72 questions from 12 themes (Customer orientations, Winning culture, Working climate, Empowerment, Cooperation across functions, Communication, Innovation, Planning and execution, Working conditions, Novo Nordisk policies, Best Practice, and Reporting).30 Interview with Eric Drapé on October 26, 2004.
M. Morsing et al.

653
based on 13 KPIs (two in Finance, three in Customers, six in Processes and two in People & Organisation). The weighting scheme worked as follows: if Eric achieves each target, he received a score for that KPI of 100. If he exceeded the target, then the score for the particular KPI was greater than 100; if he did not achieve the target, then the score for the particular KPI was less than 100. Each KPI score was multi-plied by its respective percentage weight (e.g., 15% for Investments). The achieved index score was equal to the sum of the weighted scores across all of the KPIs. For Eric, the amount of bonus he received was 50% dependent on his achieved index score and 50% dependent on the achieved index score of Product Supply. For each VP in DFP, their bonus calculation was similar, except each VP only had ten KPIs influencing their bonus calculation. Of these ten, some were mandatory (across all sites) and some were voluntary (agreed between Eric and each VP). The voluntary KPIs tended to be related more to social objectives, as they were geared towards addressing issues which reflected the local environment. The payment of the bonus to each VP was 50% dependent on their achieved index score, and 50% dependent on the achieved index for DFP. Finally, Novo Nordisk used stretch targets in that in 2005 to receive a full bonus Eric (and his VPs) must have had an achieved index score of 105 (if targets were only hit (i.e., not exceeded) then only a 50% bonus was paid) (Appendix 11).
Conclusion
As illustrated Novo Nordisk was prime example of one organisation that included sustainability as an integrated part of its strategy, and attempts to consider it in all of its business decisions. To help managers consider sustainability in all of their busi-ness decisions, the company had adopted the Novo Nordisk Way of Management as one of their primary operating tools. Included in the Novo Nordisk Way of Management were three pillars that should help to operationalise Novo Nordisk’s corporate objectives: the facilitators, the annual (sustainability) reporting and the balanced scorecard. The significant question that remained, however, is to what extent each of these pillars was effective in influencing behaviour at the operational level.
Epilogue 2015
Ten years can seem like a lifetime. Especially when working in a dynamic business in a rapidly changing environment. Similarly, the field of research into sustainability in business practices has evolved dramatically since this case was written.
By the entry into 2015 Novo Nordisk had grown significantly and had become the most valuable company in Scandinavia, and even surpassed the Volkswagen group, measured by market capitalisation. It had enjoyed more than 10 years of double-digit sales growth, maintained competitive operating growth rates, expanded its global operations and almost doubled the number of employees. Yet, the
30 The Ongoing Dynamics of Integrating Sustainability into Business Practice…
654
company retained its culture and values, rooted in the Scandinavian tradition, and many of its senior managers remained in the company, albeit not necessarily in the same positions. They would often grow with the business, thereby reinforcing the values and behaviours that were seen as the right thing to do.
When the long-standing CEO, Mads Øvlisen, stepped down and left his desk to Lars Rebien Sørensen there had been concerned voices expressing doubts whether he could fill the shoes of his predecessor, and whether the strong company values would live on.
Indeed, Lars Rebien Sørensen had a rough start, faced with the South African court case, but in that situation, and in many that would follow, he demonstrated that his leadership style was formed through many years of working in the organisation. And so his intuitive reactions in times of crisis would always be consistent with the values that the company had lived by for generations: essentially these were about acting responsibly and striking the right balance, respecting the integrity of business partners and other stakeholders, fairness and good old-fashioned decency.
By 2006, Mads Øvlisen had left Novo Nordisk, but had made his mark after 34 years in the company, of which 19 years in the role as CEO. And through their partnership while he was chairman of the Board and with Lars Rebien as his CEO successor, a step was taken that would ensure the longevity of the company’s commitment to the Triple Bottom Line principle: In connection with an update of the company’s Articles of Association (the bylaws) a proposal was presented for adoption at the Annual General Meeting in 2004 to include a sentence in the clause ‘objects’: “The Company strives to conduct its activities in a financially, environ-mentally, and socially responsible way.” The proposal was, unsurprisingly – given the majority vote of the owner, the Novo Nordisk Foundation, and the broad support from both institutional and private shareholders – adopted. The Triple Bottom Line principle had been institutionalised and was as of then safeguarded, regardless of who would be in the CEO chair.
The intent was to send a very clear signal to investors and other business partners that this is how the company is managed, and will make decisions accordingly. It also specified to people working in Novo Nordisk the philosophy that would guide their decisions and actions, and emphasised the need to get the balance right, par-ticularly when faced with difficult dilemmas.
That decision paved the way for further integration of sustainability thinking into business practices. First, the company’s reporting – which had hitherto like many other companies consisted in a financial report as the legal document and a supplementary, voluntary sustainability report – was merged into one document. This was presented to, and approved by the Board, as the logical consequence of the decision to emphasise the Triple Bottom Line in the bylaws. Some were concerned it would be the death to sustainability reporting, and with that the company’s leader-ship position, while others were convinced that this would be the future of corporate reporting.
In 2009 Lars Rebien Sørensen found it was time to revisit the Novo Nordisk Way of Management, which had been used since the mid-1990s as the guide for managers on the company’s values-based approach to doing business. In light of the
M. Morsing et al.

655
company’s growth, particularly outside of Denmark, time had come to do a sanity check to assess if a revision was needed. He travelled to meet with employees and stakeholders in all corners of the world and came back with a strong conviction that the values were very much alive and that the Triple Bottom Line was important to employees and stakeholders alike. So he and the management team worked together to update and simplify the document that was quite lengthy, and in 2010 announced a renewed, much shorter Novo Nordisk Way. A short credo-like stosryline of the purpose and mission of the company, supplemented with 10 statements, so-called essentials, on the behaviours that should be expected of people working at Novo Nordisk. And it was emphasised that this was not intended for managers, but for every employee.
While the wording was changed, most of the contents remained, and so did the management system around it. Including the function of the facilitators to ascertain the extent to which the values are being put into action, the principles of remunera-tion, the stakeholder engagement approach, and the responsible business practices across the value chain. Over time, management control and reporting systems became more sophisticated, and much effort was invested in upgrading the quality of social and environmental data so they could stand the test of being represented in the Annual Report side by side with financial data that were subject to the strictest international standards for internal controls. Integration came at a cost, and a clean- up of data points was begun to ensure that data were robust and similar in scope. Social and environmental reporting became more streamlined over time, and more aligned with strategic business priorities.
In parallel with these internal changes the sustainability agenda matured, too. While originally companies would typically be pressured by stakeholder groups to adapt criticised practices that were considered harmful to people, communities or the environment, regulation took over, complemented by soft law and voluntary initiatives, often made by industry sectors rather than individual companies. Responsibility had become common practice and a floor was set for expectations of ‘good behaviour’ by companies in Denmark and abroad, not least facilitated by the growing adoption of the UN Global Compact’s principles for responsible business.
In 2010 Novo Nordisk framed a new strategy that would divert from the issues- based approach of the past decade, described in the case. Now focus would be on continuing the integration by making the business case to demonstrate how the Triple Bottom Line approach generates value – for the business and for stakehold-ers. As it happened, this was an act of foresight; the efforts preceded the concept of shared value articulated by Professor Michael Porter of Harvard Business School, which gained significant traction in boardrooms and business school classrooms.
The strategy was to create, capture and communicate value by using the Triple Bottom Line. To articulate an approach that combined rationales such as retaining the social contract (licence to operate), promoting smarter and more sustainable solutions (competitiveness) and experimenting with innovative and collaborative initiatives to address systemic challenges (game changers). And, most importantly, to bring it all to life in everyday practice, so that there would be consistency between ‘what we say’ and ‘what we do’. And it appeared to be successful, for as the
30 The Ongoing Dynamics of Integrating Sustainability into Business Practice…

656
business continued to grow, so did the company’s reputation, brand value and influ-ence. Still, it was important to have a team to support, align and drive efforts to be a sustainable business. And, importantly, with a mandate to challenge current prac-tices. That was, and is, the role of the Corporate Sustainability team.
Many lessons have been learnt, and although by now almost a cliché, one should be reminded that sustainability is a journey with no end destination. To Novo Nordisk, sustainable business means prospering as a result of doing business that is responsible and profitable. This is what guides decision-making, and this is what is built into the performance management and reward systems described in this case. Then and now.
Acknowledgments We sincerely want to thank Novo Nordisk A/S for inviting us to collect data and for checking facts and figures for this case study. From Novo Nordisk we also want to thank Lito Valencia, business analyst in Finance and Business Integration, Hanne Schou-Rode, VP of Knowledge, IT & Quality in Corporate Stakeholder Relations, and Eric Drapé, SVP in Diabetes Finished Products for their time and constructive reflections. And we appreciate the valuable input to the case from professor Niels Mygind, Copenhagen Business School, Stephanie Robertson, Lene Hougaard Pedersen, Henrik Nielsen, research assistant at Copenhagen Business School, and Henrik Melgaard. Finally, we gratefully acknowledge financial support from Copenhagen Business School, London Business School and the Academy of Business in Society (ABIS).
M. Morsing et al.

657
Appendices
Appendix 1: Novo Nordisk A/S Organisational Structure 2005
Source: internal document provided by Susanne Stormer.
R&DMads Krogsgaard
Thomsen
President & CEO
Lars Rebien Sørensen
Quality, Regulatory &Business dev.
Lars AlmblomJørgensen
FinanceJesper Brandgaard
OperationsKåre Schultz
CorporateStakeholder
Relations
Lise Kingo
30 The Ongoing Dynamics of Integrating Sustainability into Business Practice…

658
Appendix 2: Selected Financial Information
Panel A: Financial Statement Information (in DKK million)a
2000 2001 2002 2003 2004Sales 20,485 23,385 24,866 26,158 29,031Operating profit 4703 5410 5927 6422 6980Net profit 3154 3620 4116 4833 5013Total assets 24,597 28,662 31,612 34,564 37,433Total current liabilities 5860 6138 6152 7032 7280Total long-term liabilities 2117 2824 2983 2756 3649Equity 16,620 19,700 22,477 24,776 26,504R&D/sales 16.6% 16.6% 15.9% 15.5% 15.0%Net profit margin 15.4% 15.5% 16.6% 18.5% 17.3%Return on invested capital 22.3% 22.7% 20.5% 19.5% 20.6%
Panel B: Share Return Informationb
Company Country Current 5 YearAstrazeneca U.K. −11.47% −3.99%Glaxosmithkline U.K. 16.48% −22.78%Novartis ‘R’ Switzerland 2.16% 9.08%Novo Nordisk ‘B’ Denmark −1.55% 44.17%Roche holdings ‘B’ Switzerland −11.29% −11.82%Sanofie-Aventis France 32.65% 80.82%Schering Germany 18.89% 7.08%Shire pharmaceuticals U.K. 5.87% −39.68%UCB Belgium 13.74% 9.71%Danish market (KFX) 23.14% 17.77%
aSource: Novo Nordisk A/S – Annual Report 2004; Net profit margin equals net profit as a percent-age of sales; Return on invested capital equals operating profit after tax (using the effective tax rate) as a percentage of average inventories, receivables, property, plant and equipment and as well as intangible assets less non-interest bearing liabilities including provisions (the sum of above assets and liabilities at the beginning of the year and at year-end divided by two).bSource: Thompson Financial Datastream; the current return is calculated over the period May 1, 2004 – April 30, 2005 and the 5 Year return is calculated over the period May 1, 2000 – April 30, 2005.
M. Morsing et al.

659
Appendix 3: Novo Nordisk’s Vision, Values, Commitments and Fundamentals
The VisionWe want to be the world’s leader in diabetes treatmentWe offer products and services in other areas where we can make a differenceWe deliver competitive business resultsA job with us is more than “just a job”Our values are reflected in our actionsOur history shows that it can be doneThe Values are six corporate values to guide decision-making and action:
accountable, ambitious, responsible, engaged with stakeholders, open and honest, ready for change.
The Commitments are a reflection of the commitment to sustainability and to integrating the Triple Bottom Line thinking in organisational practices.
The Fundamentals consist of ten behavioural guidelines on how to organize and behave in everyday organisational life in all units at all levels in Novo Nordisk:
1. Each unit must share and use better practices. 2. Each unit must have a clear definition of where accountabilities and decision
powers recide 3. Each unit must have an action plan to ensure improvement of its busienss and
performance and working climate 4. Every team and employee must have updated business and competency targets
and receive timely feedback on performance against these targest 5. Each unit must have an action plan to ensure the development of teams and
individuals based on busienss requirements and employee input. 6. Every manager must establish and maintain procedures in the unit for living up
to relevant laws, regulations, and Novo Nordisk policies 7. Each unit and employee must know how they create value for their customers 8. Every manager requring reporting from others must explain the actual use of
the report and the added value 9. Every manager must continuously make it easier for the employees to liberate
energy for customer related issues. 10. Every manager and unit must actively support cross-unit projects and working
relationships of relevance to the business
Source: http://www.novonordisk.com/about_us/about_novo_nordisk/the_charter.asp
30 The Ongoing Dynamics of Integrating Sustainability into Business Practice…

660
Appendix 4: Example of a Facilitation
Following are excerpts from a recent facilitation at Diabetes Pharmaceutical Site Hillerød:
Facilitation Start Date: 15 November 2004Facilitation End Date: 22 December 2004
Purpose and Scope of FacilitationThe purpose and scope of the facilitation is to assess the state of compliance, within Pharmaceutical Diabetes Site Hillerød, with the Novo Nordisk Way of Management, excluding Financial Commitments, and to agree and follow up on actions resulting from the facilitation and to report the results.
At the time of the facilitation the organisation is influenced by a number of changes. The unit VP and the QA (quality assurance) VP were appointed in the Q4 2004 and several department managers have been appointed to their current position within 2004.
Executive SummaryThe facilitation of DPSH in Site Hillerød has shown a unit dedicated to live up to the targets and challenges set by Diabetes Finished Products (DFP). All interview-ees were aware of Novo Nordisk Way of management and feel that the unit and management are living up to the values of Novo Nordisk. Facilitations show that there are different levels of compliance amongst the departments with respect to the implementation of Fundamentals.
The unit is highly focused on achieving its business targets, sometimes at the expense of overlooking the quality of some of the management processes such as APIS and development planning.
DPSH is currently developing its own strategy in alignment with DFP strategy and business plans. There is a clear understanding by all in the unit that focus must be on supporting the needs defined in the production agreements. Roll out of cLEAN™ is at variable stages within the different functions within DPSH.
Target setting based on the DPSH Balanced Scorecard and follow up needs to be improved for both teams and individuals. The lack of specific targets in some teams also influences the frequency and quality of feedback given in the organisation and needs to be enhanced.
DPSH is as an organisation in close daily contact with its key stakeholders within Novo Nordisk and interviewees are aware of their customers needs.
Source: internal document provided by Eric Drapé, SVP Diabetes Finished Products.
M. Morsing et al.

661
Appendix 5: Indicators of Triple Bottom Line Performance
Strategic area Indicators ImpactLiving our valuesTwo indicators show how we live up to the company’s values, as perceived by employees. This is measured as part of the climate survey, eVoice, conducted annualy. One indicator showws follow-up on the facilitation process.
Average of respondents’ answers as to whether social and environmental issues are important for the future of the company.
Organisational support for and understanding of responsible business practices.
Average of respondents’ answers as to whether management demonstrates in words and action that they live up to our values.
Integration of corporate values in all decisions.
Percent of fulfilment of action points planned arising from facilitations of the Novo Nordisk way of management and values
Corrective actions on values following facilitations.
Access to healthTwo indicators measure progress on one of the programmes for global access to health, the best possible pricing scheme in least developed countries (LDCs). In 2004 there were 50 LDCs.
Number of LDCs where Novo Nordisk operates.
Access to essential medicines.
Number of LDCs which have chosen to buy insulin under the best possible pricing scheme.
Affordability of essential medicines.
Our employeesFour indicators measure standards of health and safety in the workplace, employee development and equal opportunities.
Frequency of occupational injuries.
Increased quality of life for employees, improved work flow and productivity, and less absence due to illness.
Employee turnover rate. Influx and outflux of knowledge.
Average of respondents’ answers as to whether their work gives them an opportunity to use and develop their competences/skills.
Increased competence level for employees and increase competence capital in the company.
Average of respondents’ answers as to whether people from diverse backgrounds have equal opportunities (for example in terms of hiring, promotion and training) at Novo Nordisk, regardless of gender, race, ways of thinking etc.
Increased diversity in the workplace.
(continued)
30 The Ongoing Dynamics of Integrating Sustainability into Business Practice…

662
Strategic area Indicators ImpactOur use of animalsTwo indicators track efforts to reduce the number of experimental animals and improve their welfare.
Percent of animal test types removed from external and internal specification.
Reduction and replacement of experimental animals.
Housing conditions for experimental animals, considering the needs of the animals.
Improved welfare of experimental animals.
Eco-efficiency and complianceTwo environmental indicators, eco-productivity indices (EPIs), are based on eco-effeciciency thinking and reflect internationally adopted views. Full compliance with local laws and regulations is a company policy. Certification of production facilities is instrumental to that end.
Annual improvement in water efficiency.
Water use efficiency.
Annual improvement in energy efficiency.
Energy use efficiency.
Compliance. Compliance with regulatory requirements.
ISO 14001 implementation. Accidental releases.Pollution prevention through decreased use of raw materials, water and energy and decreased environmental impact per produced unit.
Economic contributionFive financial measures for reporting to shareholders and the financial markets serve as indicators for economic contribution.
Operating profit margin. Contribution to company efficiency, growth and investors’ economic capacity.
Growth in operating profit. Contribution to company growth and investors’ economic capacity.
Total corporate taxe as share of sales.
Contribution to national economic capacity.
Return on invested capital. Efficiency of invested capital, contribution to asset base, and investors’ economic capacity.
Cash to earnings (3-year average). Contribution to the company’s degree of freedom in terms of available cash funds (resources).
Source: Novo Nordisk A/S Annual Report 2004
M. Morsing et al.
663
Appendix 6: Diabetes Finished Products – Organisational Chart
Source: internal document provided by Eric Drapé, SVP Diabetes Finished Products
30 The Ongoing Dynamics of Integrating Sustainability into Business Practice…

664
Appendix 7: Cascading of Balanced Scorecard 2005 – Ensure Environmental, Social and Ethical Performance
Operations Product supply Diabetes finished productsKPI 1. EPI performance 1. EPI performance 1. EPI performance
2. CO2 emission reduction target
2. CO2 emissions reduction strategy and action plan.3. CO2 emission reduction target.
KPI definition
1. EPI is calculated as the relation between the total yield of product to the respective consumption of water and energy. Performance is tracked annually against previous year.
1. EPI is calculated as the relation between the total yield of product to the respective consumption of water and energy.
1. EPI is calculated as the relation between the total yield of product to the respective consumption of water and energy. Performance is tracked quarterly against previous year. Simple average of the two index is the target.2. CO2 emission
reduction target to be approved by Environment & Bioethics Committee and communicated to relevant stakeholders
2. A CO2-compliance plan for Bagsvaerd and Hillerod to be drafted and implemented.3. Establish an implementation plan for the CO2 strategy with base year 2004.
Target 2005
1. Increase the eco- productivity index for water in the period 2001–2005 by an annual average of 5% corresponding to a total increase in EPI of 30% end of 2005. Increase the eco-productivity index for energy in the period 2001–2005 by an annual average of 4% corresponding to a total increase in EPI of 25% end 2005.
1. Increase the eco- productivity index for water in the period 2001–2005 by an annual average of 5% corresponding to a total increase in EPI of 30% end of 2005. Increase the eco-productivity index for energy in the period 2001–2005 by an annual average of 4% corresponding to a total increase in EPI of 25% end 2005.
1. 2005: Water: 101 energy: 99
2. S&R to set target . 2. CO2-complaince plan approved by PS management. Information seminar for key internal stake- holders to ensure effective implementation of the CO2 strategy.3. Include the CO reduction target in PS BSC06.
Source: internal documents provided by Eric Drapé, SVP Diabetes Finished Products
M. Morsing et al.

665
Appendix 8: Cascading of Balanced Scorecard 2005 – Support Diversity
Operations Product supplyDiabetes finished products
KPI 1. Equal opportunity implementation.
1. Equal opportunity implementation.
1. Equal opportunity implementation.
2. Number of EVPs/SVPs that have evaluated progress achieved according to plan as part of the OA process.
2. Number of employees that have evaluated progress achieved according to plan as part of the OA process.
2. Number of employees that have evaluated progress achieved according to plan as part of the OA process.
3. JTC (job transfer Centre) process is running smoothly.
3. JTC process is running smoothly.
KPI definition
1. Action plans for 2005 achieved.
1. % of targets in the action plans for 2005 achieved.
1. % of targets in the action plans for 2005 achieved.
2. EVPs/SVPs have evaluated progress.
2. % of EVPs/SVPs that have evaluated progress.
2. Progress evaluated.
3. The KPI measures: A) JTC’s ability to send the right people to the right job; B) the interviewers acceptance of these candidates.
3. The KPI measures: A) JTC’s ability to send the right people to the right job; B) the interviewers acceptance of these candidates.
Target 2005
1. % of targets in the action plans for 2005 achieved; red <80%, yellow 80%, green >80%.
1. 80% 1. Target > = 80%
2. % of EVPs/SVPs have evaluated progress according to plan from OA (combined SVPs); red <95%, yellow 95% – 99%; green 100%
2. 100% 2. Target = 100%; evaluation done according to templates from corporate responsibility management.
3. When JTC has relevant candidates for vacant positions, 90% of those vacant positions must be filled by a JTC candidate.
3. When JTC has relevant candidates for vacant positions, 90% of those vacant positions must be filled by a JTC candidate.
Source: internal documents provided by Eric Drapé, SVP Diabetes Finished Products.
30 The Ongoing Dynamics of Integrating Sustainability into Business Practice…

666
Appendix 9: Cascading of Balanced Scorecard 2005 – Ensure Talent Development
Operations Product supply Diabetes finished productsKPI 1. Utilisation of talent
pools – % of VP positions filled from talent pools.
1. Utilisation of talent pools – % of VP positions filled from talent pools.
1. Utilisation of talent pools – % of VP positions filled from talent pools.
2. Employee perception of development based on eVoice survey (development theme).
2. Employee perception of development based on eVoice
2. Employee perception of development based on eVoice
KPI definition
1. VP positions (new or vacant) filled from talent pools.
1. VP positions (new or vacant) filled from talent pools.
1. VP positions (new or vacant) filled from talent pools.
2. Percentage of units score.
2. Units to score an average of > = 3.0 on the mandatory eVoice theme “development of people”.
2. Percentage of units score 3.0 or above 0 on the mandatory eVoice theme “development of people”.
Target 2005
1. % VPs filled from talent pools. Red <55%, yellow 55%–60%, green >60%.
1. 60% 1. Target > = 60%2. 85% 2. Target = 85%
Source: internal documents provided by Eric Drapé, SVP Diabetes Finished Products
M. Morsing et al.

667
Appendix 10: Diabetes Finished Products – 2005 Balanced Scorecard
CSF CSF – Rationale KPIFinanceRealise growth in operating profit
Secure industry competitive growth
Operating profit
Ensure competitive ROIC – Working capital and investments
Ensure industry competitive return on invested capital
Inventory
Investments Ensure investment management InvestmentsBusiness processesImprove productivity in DFP
Secure cost efficiency in production
Output vs. cost (unit costs)Approval of batch recordsReduction in number of NCsQuality costCOGS
Timely and efficient execution of investment portfolio
Critical to increase production capacity in future demand and to improve productivity
Progress on major investments projects
Ensure successful implementation of IT projects
Successful implementation and use of IT
IT project milestones
Improve quality management focus in all business processes
Quality issues and documentation will be subject to increasing attention from both customers and authorities
% of non-conformity reports approvedAudit NC timelinessInspection readinessQAPRecalls
People & organisationIncrease internationalisation Support the globalisation of Novo
NordiskInternationalisation initiatives carried out
Support diversity/social responsibility
Enhance and promote innovation, attraction and reputation
Equal opportunity implementationEvaluated progress achievedJTC process is running smoothly
Ensure talent development To ensure specialist and leadership capabilities that will support and drive growth
Utilisation of talent poolsEmployee perception of development
Ensure performance management
Improve individual performance and alignment with overall business goals
Implement uniform global performance management system
All units with absence due to illness >5% have to decrease this absence
Absence due to illness
(continued)
30 The Ongoing Dynamics of Integrating Sustainability into Business Practice…

668
CSF CSF – Rationale KPICustomers & societyEnsure superior customer satisfaction – Improve production quality
Product quality is a critical parameter for achieving customer satisfaction
Customer complaint
Ensure environmental, social and ethical performance
Help the organisation to ensure social, environmental, social and bioethical performance
EPI performance
Ensure timely and efficiently delivery to market
In order to be the world’s leading diabetes care company we have to have products ready to meet customer demands
Affiliate inventory levelLevemir® finished product production
Launch of Levemir®
Source: internal document provided by Eric Drapé, SVP Diabetes Finished Products
M. Morsing et al.

669
Appendix 11: Performance Index 2005 – for Eric Drapé
Diabetes finished products
WeightsYTD Dec 2005 results WeightedTarget Expected Index Perf. Perf. +/−
Finance 40.0 40.0 0.0Investments 15.0 1762 1762 100 15.0 –Operating costs* 25.0 2539 2539 100 25.0 –Customers 30.0 30.0 0.0Stock outs 5.0 10 10 100 5.0 –EPI performance 5.0 100 100 100 5.0 –Production output**
3ml Penfill, fill 10.0 345 345 100 10.0 – disposables pack
(NL,FP,IL)5.0 164 164 100 5.0 –
vials pack 5.0 102 102 100 5.0 –Processes 20.0 20.0 0.0NN248 timeliness*** 2.5 100 100 100 2.5Unit cost 2.5 100 100 100 2.5 –Number of actual recalls
5.0 4 4 100 5.0 –
FDA Inspection readiness
2.5 100 100 100 2.5
QAP 2.5 80% 80% 100 2.5 –COGS20, volume/fte 5.0 100 100 100 5.0 –People & Organisation
10.0 10.0 0.0
Decrease in absence 5.0 10 10 100 5.0 –JTC 5.0 90 90 100 5.0 –Total 100.0 100.0 0.0
Source: internal document provided by Eric Drapé, SVP Diabetes Finished Products*Operating profit target is AB05 plus logbooks and approved target corrections**Target to be corrected downwards if reduced demand in local markets create excess capacity***Final product specification. Target is August. If target is reached in September = index 66,6, October = index 33,3, November or later = index 0. If target is reached in July = index 133,3, June = index 166,6, and May or sonner index 200
30 The Ongoing Dynamics of Integrating Sustainability into Business Practice…