the only way is up - c.ymcdn.comc.ymcdn.com/sites/batterycouncil.org/resource/resmgr/2017... ·...
TRANSCRIPT

Neil Hawkes (CRU)
BCI Convention, Hyatt Regency, Jacksonville, Florida, USA
(2nd May 2017)
Global trends and issues in the lead market
The Only Way Is Up ?

1,000
1,500
2,000
2,500
3,000
Jan-0
9
Ma
r-0
9
Ma
y-0
9
Jul-0
9
Sep-0
9
No
v-0
9
Jan-1
0
Ma
r-1
0
Ma
y-1
0
Jul-1
0
Sep-1
0
No
v-1
0
Jan-1
1
Ma
r-1
1
Ma
y-1
1
Jul-1
1
Sep-1
1
No
v-1
1
Jan-1
2
Ma
r-1
2
Ma
y-1
2
Jul-1
2
Sep-1
2
No
v-1
2
Jan-1
3
Ma
r-1
3
Ma
y-1
3
Jul-1
3
Sep-1
3
No
v-1
3
Jan-1
4
Ma
r-1
4
Ma
y-1
4
Jul-1
4
Sep-1
4
No
v-1
4
Jan-1
5
Ma
r-1
5
Ma
y-1
5
Jul-1
5
Sep-1
5
No
v-1
5
Jan-1
6
Ma
r-1
6
Ma
y-1
6
Jul-1
6
Sep-1
6
No
v-1
6
Jan-1
7
Ma
r-1
7
$2,500/t
$2,000/t
Data: LME
LME 3-month lead price, daily ($/tonne)
Lead price rallies in 2H2016 to touch highs last seen in 2011
$1,700/t

80
100
120
140
160
180
200
Ja
n…
Fe
…
Ma
…
Apr…
Ma
…
Ju
n…
Ju
l-…
Au…
Se…
Oct…
No
…
De
…
Ja
n…
Fe
…
Ma
…
Apr…
Ma
…
Ju
n…
Ju
l-…
Au…
Se…
Oct…
No
…
De
…
Ja
n…
Fe
…
Ma
…
Apr…
Nickel
LME 3-months prices, index to 4th January 2016 = 100
Copper
Zinc
All LME metal prices lifting through 2016-2017, but zinc running
ahead of the chasing pack
AluminiumLead
Tin
Data: LME

• Combination of broader metal price drivers and lead-specific price drivers turning more positive over last
year or so
• Broader drivers - stronger US dollar trend starting to stall, Chinese slowdown levelling out, tightening
supply picture across metals
• Lead-specific drivers - steady (if not spectacular) demand growth, tighter global primary (mine)
availability, firmer inside China, tightening outlook outside China, smaller stock ‘iceberg’ already shrinking
What has been driving lead price renaissance ?

What’s the lead demand picture ?
01,0002,0003,0004,0005,0006,0007,0008,0009,000
10,00011,00012,00013,000
1960 1965 1970 1975 1980 1985 1990 1995 2000 2005 2010 2015 2020
OtherEuropeRest of AmericasUSARest of AsiaChina
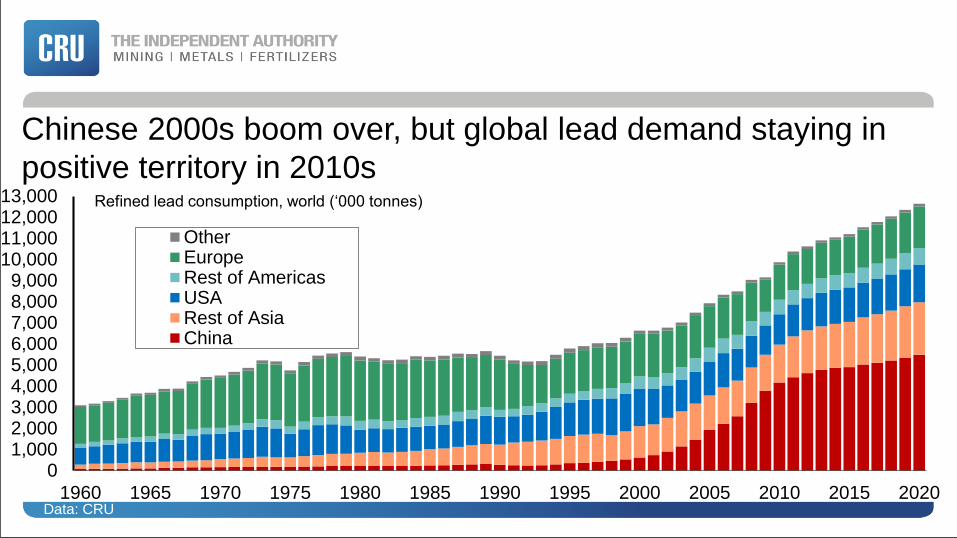
Refined lead consumption, world (‘000 tonnes)
Chinese 2000s boom over, but global lead demand staying in
positive territory in 2010s
Data: CRU

01,0002,0003,0004,0005,0006,0007,0008,0009,000
10,00011,00012,00013,000
1960 1965 1970 1975 1980 1985 1990 1995 2000 2005 2010 2015 2020
Non-battery uses
Batteries - automotive & industrial
Refined lead consumption, world (‘000 tonnes)
Long-run rise in global lead demand intimately linked to growing
dominance of use in lead-acid batteries
Data: CRU

0
50
100
150
200
250
2013 2014 2015 2016 2017 2018 2019 2020
Non-ICE**
ICE*
Light vehicle production by powertrain, world (million units)
*ICE = Internal Combustion Engine vehicle, includes ‘stop-start’ vehicles
**Non-ICE = HEVs, EVs and Fuel Cell ‘new technology ‘vehicles.
Majority of new vehicles are ‘conventional’ (ICE) rather than ‘new
technology’ (non-ICE), though latter’s share is rising
2.3% 2.7% 2.8%3.7% 6.2% 7.6% 8.8%% shown are ‘Non-ICE’ as % of total
4.7%
Data: LMC Automotive

0%
10%
20%
30%
40%
50%
60%
70%
80%
90%
100%
2013 2014 2015 2016 2017 2018 2019 2020
Excluding stop-start
Including stop-start
32%
18%22% 26%
36% 39% 42%
‘Stop-start’ vehicles as % of ICE* vehicle production, global
‘Stop-start’ vehicles rising to account for over 40% of all new
vehicles produced globally in 2020
29%
Data: LMC Automotive Note: *ICE = Internal Combustion-Engine vehicle

-10.0
-8.0
-6.0
-4.0
-2.0
0.0
2.0
4.0
6.0
8.0
10.0
2,000
3,000
4,000
5,000
6,000
7,000
8,000
9,000
10,000
11,000
12,000
13,000
14,000
1960 1965 1970 1975 1980 1985 1990 1995 2000 2005 2010 2015 2020
Steadier ‘normal’ global lead demand growth in 2010s compared
to earlier Chinese-boom fuelled yearsRefined lead consumption, world (‘000 tonnes) % year-on-year change
2.4% per year (1960-2016)
Data: CRU

What’s happening in lead production ?

• Before the recent lift in metal prices, lower earlier values prompted lead-producing polymetallic mine cuts (led by
Glencore), alongside well-flagged ‘running out of ore’ mine cuts (e.g. Century)
• 2016 marked another drop in global mine output (led by Australia), alongside higher primary smelter demand (led
by Korea Zinc) resulting in a marked tightening in global lead concentrate availability
• So long-standing scramble for scrap has been joined by harder fight for lead concentrate
• Now waiting for response of polymetallic mines to higher metal prices and lower TCs, including reversal of price-
related mine cuts
• Having drained excess feed, primary smelter production path to more closely follow ‘fresh’ mine production this
year and beyond
• Unlike in other metals, impact of primary production path will be diluted by the importance of secondary supplies
that will continue to grow
Slower primary supplies diluted in lead by importance of rising
secondary supplies

0%
10%
20%
30%
40%
50%
60%
70%
80%
90%
100%
Lead Copper Zinc
Primary
Secondary
10%17%
Secondary and primary production as % of total, world - 2016
Secondary production far more important in lead than in copper
or zinc
Data: CRU
60%

• Further steady growth in lead demand to ensure further steady growth in scrap supplies
• Alongside high recycling rates and sufficient smelter capacity, secondary lead production to remain the main driver
of global supply growth
• Main issue in secondary lead industry remains one of the ongoing fight for scrap share
• US lead recycling dominated by main lead-acid battery makers, through own smelters or tolling
• New entrant Aqua ramping up new technology Reno facility - need to show can recycle at lower costs and
emissions than existing conventional secondary smelters
• Resolution to entrenched problem of excess lead recycling capacity in Europe remains elusive. EC scrap fines for 3
lead recyclers - Eco-Bat, Campine and Recylex
• Environmental clampdown and more organised scrap collection in China re-directing more scrap away from informal
small-scale operators towards more modern, cleaner and larger-size lead recyclers
• Still too many smelters chasing the scrap pool available around the world inevitably leads to higher scrap prices and
higher scrap flows, both within regions and between regions
Secondary lead industry trends and issues

-300
-200
-100
0
100
200
300
400
500
600
2,000
3,000
4,000
5,000
6,000
7,000
8,000
1990 1995 2000 2005 2010 2015 2020
Year-on-year change - secondary (RHS)
Year-on-year change - primary (RHS)
Total - primary (LHS)
Total - secondary (LHS)
Global secondary production typically bigger growth in contrast to
more erratic global primary pictureRefined lead production, world (‘000 tonnes) year-on-year change (‘000t lead)
Data: CRU

-6.0
-4.0
-2.0
0.0
2.0
4.0
6.0
8.0
10.0
12.0
2,000
3,000
4,000
5,000
6,000
7,000
8,000
9,000
10,000
11,000
12,000
13,000
14,000
1960 1965 1970 1975 1980 1985 1990 1995 2000 2005 2010 2015 2020
Steadier ‘normal’ global lead output growth in 2010s compared to
earlier Chinese-boom fuelled yearsRefined lead production, world (‘000 tonnes) % year-on-year change
2.3% per year (1960-2016)
Data: CRU

What’s the supply/demand balance picture ?

-250
-200
-150
-100
-50
0
50
100
150
200
250
6,000
7,000
8,000
9,000
10,000
11,000
12,000
13,000
2003 2004 2005 2006 2007 2008 2009 2010 2011 2012 2013 2014 2015 2016 2017
Balance (RHS)
Production
Consumption
Refined lead balance, world (‘000t)
Pulling demand and supply together, lead surplus shrinks
before moving into deficit
Refined lead consumption/production, world (‘000t)
Data: CRU

-250
-200
-150
-100
-50
0
50
100
150
200
250
2003 2004 2005 2006 2007 2008 2009 2010 2011 2012 2013 2014 2015 2016 2017
Balance outside China
Balance inside China
World outside China joining already tighter lead market inside
China this year, most of early 2010s surplus ‘ex-China’
Refined lead – market balance (‘000 tonnes)
Data: CRU

-200
-150
-100
-50
0
50
100
150
200
2004 2005 2006 2007 2008 2009 2010 2011 2012 2013 2014 2015 2016 1Q2017
Reported
Implied unreported*
Refined lead stocks, world year-on-year change (‘000 tonnes, year-end)
Smaller stock ‘iceberg’ already ‘melting’?
* Derived from difference between change in reported stocks and market balance
Data: CRU, ILZSG, LME, SHFE

What path lies ahead for lead prices ?

0
500
1,000
1,500
2,000
2,500
3,000
1970 1975 1980 1985 1990 1995 2000 2005 2010 2015
Tick up in lead prices, but longer-term trend still down from 2007
peak
LME 3-months price - $ of the day (nominal terms)
LME 3-months price - 2016$ (real terms)
$2,000/t
$500/t - old 1900s ‘long-term floor’
LME 3-month price , nominal/real terms, annual average ($/tonne lead)
$1,800/t
Data: LME, CRU
• Still room for reasonably robust lead demand growth, helped by LAB usage in ‘stop-start’ vehicles
• Worst over for adjustment in China - orderly transition to slower growth path
• Tighter raw material feed (concentrates joining scrap) restraining smelter production - future primary growth path
less certain than secondary growth path. Mine project pipeline zinc-rich and lead-poor
• Switch into deficit - scope for error could see bigger shortfalls drawing down from smaller stockpiles
• Not just size of lead stock ‘iceberg’ - composition (‘use-ability’) and rate of ‘drip feed’ to the market will be key in
determining lead price path ahead
• More favourable ‘external’ drivers - more bullish outlook for other metals, notably zinc; US dollar rally running out
of steam. Lead swept higher by wider rally in zinc and other metal prices
• LME lead price already taken a step up into low $2,000s from high $1,000s - greater volatility as market tries to
work out ‘real v fake’ improvements in underlying lead market dynamics
• November 2016 high in $2,500s provides first upside target - next is 2011 high of around $2,850/t - 2007 record of
nearly $4,000/t still seems out of reach
The only way is up...

• More political and geopolitical events could blow metals off course – 2017 European elections, ‘Brexit’ process,
less conventional Trump administration, more assertive Russia, Middle East war/tensions, maverick North
Korea, more ‘surprises’ (unknown unknowns)...
• US and Chinese spending sprees disappoint - slower world economic growth and slower metals demand growth
• Underestimating rising threat to LAB dominance from alternative battery chemistries, notably LIBs on vehicle
electrification path. Chinese government moves faster down this path
• Higher metal prices (lower TCs) triggers swifter/greater polymetallic mine response than expected
• January 2017 removal of Chinese 10% export tax had been successful tool in slowing Chinese lead exports to a
trickle - could they lift again ?
• Less tight lead market (weaker demand/better supplies) and renewed investor caution could see LME lead price
struggle to sustain further steps higher
• Even struggle to hold recent gains back up into low $2,000s - instead falls back into previous high $1,000s
trading - next downside targets late 2015 lows in $1,500s then late 2008/early 2009 lows (dip below $1,000/t)
...or is it ?

Time for reflection and any questions...
Neil Hawkes
Lead market analyst (CRU)
T +44 20 7903 2101
W www.crugroup.com
BCI Convention, Hyatt Regency, Jacksonville, Florida, USA (2nd May 2017)