the open data institute prepared this study as part of the ... · the open data institute prepared...
TRANSCRIPT


2
The Open Data Institute prepared this study as part of the European Data Portal project. The European
Data Portal is developed by the European Commission with the support of a consortium led by
Capgemini Consulting, including INTRASOFT International, Fraunhofer Fokus, con.terra, Sogeti, the
Open Data Institute, Time.Lex and the University of Southampton.
For more information about this paper, please contact:
European Commission Directorate General for Communications Networks, Content and Technology
Unit G.1 Data Policy and Innovation
Daniele Rizzi – Policy Officer
Email: [email protected]
Project team Dinand Tinholt – Vice President, EU Lead, Capgemini Consulting
Executive lead European Data Portal
Email: [email protected]
Wendy Carrara – Director, Principal Consultant, Capgemini Consulting
Project Manager European Data Portal
Email: [email protected]
This report was written by Tom Sasse, Amanda Smith, Ellen Broad, Jeni Tennison, Peter Wells, and
Ulrich Atz (Open Data Institute). Wendy Carrara and Heleen Vollers (Capgemini Consulting) reviewed
and contributed to it.
DISCLAIMER
By the European Commission, Directorate-General of Communications Networks, Content &
Technology.
The information and views set out in this publication are those of the author(s) and do not necessarily
reflect the official opinion of the Commission. The Commission does not guarantee the accuracy of
the data included in this study. Neither the Commission nor any person acting on the Commission’s
behalf may be held responsible for the use, which may be made of the information contained therein.
© European Union, 2017. All rights reserved. Certain parts are licensed under conditions to the EU.
Reproduction is authorised provided the source is acknowledged.

3
Abstract
This is the first of two reports which explore the Sustainability of Open Data Portals across Europe.
Open Data Portals are a critical part of our data infrastructure: they connect data holders with data
users, who in turn create services that citizens and businesses benefit from and rely on.
The overall maturity of portals across Europe is increasing as they develop more advanced features.
Yet most do not have coherent strategies for sustainability that address each aspect of how a portal
functions: the governance, financing, architecture and operations that make a portal sustainable, as
well as the metrics that can be used to monitor and evaluate progress. It is vital that they develop
such approaches so that they can respond and adapt to the challenges they face.
This report sets outs how portals can move from setup to sustainability, with recommendations in
each of these five key areas. The recommendations are drawn from in-depth interviews with portal
owners across Europe, which aimed to understand individual experiences, as well as practical. By
highlighting examples of successful ideas and initiatives across Europe, in the recommendations and
through several case studies, the report demonstrates best practices for others to follow.
Résumé
Ceci est le premier de deux rapports qui explorent comment garantir la pérennité dans le temps des
portails de données ouvertes (Open Data) à travers l’Europe. Les Portails « Open Data » constituent
une partie essentielle de notre infrastructure de données : ils connectent les détenteurs de données
avec leurs utilisateurs, qui à leur tour créent des services dont bénéficient et dépendent les entreprises
ainsi que les citoyens.
Dans l’ensemble, la maturité des portails à travers l’Europe augmente grâce notamment au
développement de nouvelles fonctionnalités. Cependant la plupart ne dispose pas de stratégies
spécifiques adressant leur pérennisation couvrant chacun des aspects nécessaires à leur bon
fonctionnement, qu’il s’agisse de la gouvernance, du financement, de l’architecture, et des
opérations qui rendent un portail durable. D’autres aspects tels que des indicateurs peuvent
également être mis en place pour rendre compte et évaluer les progrès réalisés en matière d’offre de
données. Il est indispensable que les portails de données développent de telles approches afin de
répondre et de s’adapter aux défis auxquels ils font face.
Pour chacun de ces aspects, le rapport présente une série de recommandations tirées d’entretiens
détaillés avec les services responsables de différents portails à travers l’Europe, portant sur l’analyse
d'expériences individuelles et pratiques. Les recommandations sont étayées d’exemples et
d’initiatives couronnées de succès en Europe et ont pour objectif d’appuyer les portails dans leur
évolution, de leur mise en place à leur pérennisation.

4
Table of Contents List of figures 6
Executive summary 7
Recommendations 8
1. Introduction 10
2. Methodology 14
3. Governance 17
3.1 Have a business plan and governance structure in place 18
3.2 Bring publishers and data users together to address key challenges using Open Data from
the portal 19
3.3 Build responsiveness to government priority changes into your governance structure 22
3.4 Create hard levers to set and enforce data quality & metadata standards 23
3.5 Create a non-ministerial leadership role to champion data publication and respond to
issues25
4. Financing 27
4.1 Be open about your funding strategy 28
4.2 Ensure your priorities align with those of your funding source(s) 29
4.3 Ensure that your own role as portal owner includes responsibility for setting funding
strategies and budgets 30
4.4 Securing funding for an Open Data portal 31
4.5 Generating revenue from an Open Data portal 31
4.6 Perform, commission or identify research into the impact of your portal’s current or
potential activities to support a business case for future funding 33
5. Architecture 35
5.1 Select open source software solutions and solutions that offer downloading/archiving
options 36
5.2 Build links to data held in other portals into yours, where they could be relevant for your
local users 38
5.3 Understand the data formats different users need to drive improvements 40
5.4 Other considerations 42
5.4.1 Storing data 42
5.4.2 Value-added services for Open Data portals: data visualisations, storytelling and
APIs43
6. Operations 45

5
6.1 Operational service management 47
6.2 Publication operations 47
6.3 Technical operations 48
6.4 Open Data operations 49
6.5 Managing data quality 49
6.6 Creating routine reports 50
6.7 Making data accessible 50
6.8 Onboarding new users 51
6.8.1 On-boarding end-users 51
6.8.2 On-boarding publishers 51
6.8.4 On-boarding monitors 53
6.9 Capturing and sharing lessons learned 53
7. Automated metrics 55
7.1 Using metrics to drive improvements and demonstrate impact 55
7.2 Background 57
7.3 Open Data metrics – research to date 57
7.4 OpenDataMonitor 58
7.5 Choose metrics that help benchmark publisher performance, but don’t rely on one metric
(e.g. quantity) 62
7.6 Measuring quality of Open Data 65
7.7 Choose metrics that help data users find data 65
7.8 What portal owners are measuring 66
7.9 What portal owners want to measure 67
7.10 Overcoming challenges in automating metrics 68
8. Conclusion 70
Annex I - Definitions 72
Annex II – Interview questions
74

6
List of figures
Figure 1: 25 years of the web - technology, services and standards 11
Figure 2: Portal Maturity and Open Data Readiness in Europe, 2016 13
Figure 3: Portal profiles 15
Figure 4: Data.gv.at - Governance model 23
Figure 5: Organisational Structure of Vienna City Council 26
Figure 6: The 5-stars of Linked Data 41
Figure 7: Mapping Open Data concepts to dimensions of availability and measurability 58
Figure 8: Quantity metrics from OpenDataMonitor 59
Figure 9: Quality metrics from OpenDataMonitor 60
Figure 10: Automated metrics provided by data portal software 66
Figure 11: Screenshot of data.gov.uk site analytics dashboard 67

7
Executive summary
Open Data portals are an essential part of the infrastructure on which people rely to find and use Open
Data. Citizens now rely on services created with Open Data. By making Open Data easier to find, good
Open Data portals enable more of these services to be built to benefit citizens.
In November 2015, the European Commission launched the European Data Portal (EDP) to foster
accessibility to data across Europe. To date, the portal references over 600,000 datasets from 34
countries and is available in 18 languages. For the EDP to continue growing it depends on a continuous
provision of metadata from national data portals.
The sustainability of Open Data portals – that is, the extent to which they can respond and adapt to
challenges – is therefore important. Yet most portals were created quickly as part of a politically driven
Open Data initiative, without feasibility studies, business case, strategy or user research. Many were
built in response to the nascent Open Government Partnership (OGP) movement, or simply because
governments felt they ought to have one. In short, most Open Data portals were set up without
sustainability in mind.
As a result of this, portal owners now face a series of interlinked problems: limited funding, challenges
instigating re-use of data, data-quality issues, securing political support for publishing relevant data,
and scaling up with legacy systems and operating structures. This means many portals struggle to
remain fit for purpose.
While this report examines portals that operate at varying levels of maturity, at its core each portal
has the same functions:
● help people find the Open Data they need;
● ensure that data accessed via the portal continues to be relevant, useful and usable;
● monitor and improve the quality and timeliness of data accessed via the portal; and
● keep pace with data technologies and services, and user needs, as they evolve.
This report, requested by the European Commission, in the context of the European Data Portal, sets
out what makes Open Data portals sustainable in four key areas: governance, financing, architecture
and operations. The fifth section explores how metrics can be used to monitor and evaluate progress
and explores the feasibility of automated metrics for Open Data portals. This is the first of two reports
which will look at the sustainability of Open Data portals. The second, which will be published in late
2017, will build further on the findings and recommendations set out here (see Next Steps).
The research is based on in-depth interviews with the portal owners and civil society representatives,
practical experience and secondary research (a full methodology is included in the Introduction). The
report’s authors have significant experience creating Open Data portals and leading Open Data
initiatives, including data.gov.uk, legislation.gov.uk, data.police.uk, and the Open Defra initiative. The
8
report was reviewed and contributed to by the team that have developed and manage the European
Data Portal.
The report finds that a sustainable Open Data portal is one that continues to respond to core
challenges and has the governance, finance, architecture and operational models to do so. It also uses
metrics effectively to drive improvements in data quality and usefulness, and attempts to measure
the impact from Open Data re-use as part of a support base for continued funding. The report finds
that, whilst portal owners have taken some measures or made ad hoc upgrades to their portals, none
have developed models or approaches to sustainability which encompassed all of these areas.
Some of the recommendations under each section may seem obvious. They have been included
because they may not otherwise feature in development plans and proposals at the outset of an Open
Data initiative. They are recommendations for any portal owner and any organisation looking to invest
in building an Open Data portal.
Ultimately, this report aims to create the conditions for continued investment in Open Data portals so
they are fit for purpose, now and in future. It is likely that the way in which we can search for data on
the web will continue to become more sophisticated and therefore affect how we use data portals.
Throughout each section, openness – open collaboration, open source and open standards – emerges
as key to ensuring Open Data portals are flexible enough to adapt in this rapidly evolving landscape.
Recommendations
This report makes recommendations for Open Data portal owners under five key areas based on interviews, secondary research and practical experience. Governance
● Have a business plan and clear governance structure in place ● Bring publishers and data users together to address specific challenges, using Open Data from
the portal ● Build responsiveness to government priority changes into your governance structure ● Create hard levers to set and enforce data quality and metadata standards, and pursue data
updates from publishers ● Create a non-ministerial leadership role to champion data publication and respond to issues
Finance
● Be open about your funding strategy, so that people publishing and accessing data from the portal can identify future needs, use cases and potential funding shortfalls
● To maximise scope for portal improvements, and reduce the impact of funding cuts, ensure your priorities (training, support for publishers, user engagement) align with those of your funding source(s)
● Ensure that your own role as portal owner includes responsibility for setting funding strategies and budgets

9
● Perform, commission or identify research into the impact of your portal’s current or potential activities, to develop and support a business case for future funding.
Architecture ● Select open source software solutions, and solutions that offer archiving/downloading
options for all data published via the portal ● Contribute to the development of standard APIs, that could be used across all Open Data
platforms, for sharing, summarising and presenting data ● Build links to data held in other portals into yours, where they could be relevant for your local
users ● Even if not responsible for the publication and maintenance of data, research your user needs
and their preferred data formats to drive data improvements ● Build upon recognised standards to foster interoperability and comparability of metadata
across Europe Operations
● Manage publication operations to support different types of publishers from small- to large-scale, enabling automation where possible
● Manage technical operations to include effective monitoring and reporting systems for inaccessible data, preferably through publicly accessible lists for users to track progress
● On-board new end-users, publishers and monitors with effective User Experience design, clear publication processes, feedback loops and training
● Automate functions to ensure seamless integration of a diversity of data sources, increase user friendliness and limit overheads for stakeholders
● Capture and share lessons learned, and be open to best practices and standards developed by other portal operators
Metrics
● Choose metrics that help to benchmark data publisher performance, but do not rely on one metric e.g. quantity. Combine quantity metrics with data quality and engagement measures
● Choose metrics that help potential data users find data that is suitable for them to use. Evaluate whether the metrics chosen are meaningful or potentially misleading
● In measuring quality of Open Data, take into account metadata and contextual information to increase user understanding and engagement
● Overcome challenges in automating metrics by adopting standard language and terminology, publishing processes and metrics for data quality and reuse

10
1. Introduction
Open Data is now a worldwide movement. It has, as the 2016 Open Data Barometer (ODB) report puts
it, ‘entered the mainstream’.1 More than half of the countries surveyed by the ODB in 2015 have an
Open Data initiative.2 In 93% of countries surveyed, even in countries where that data is not yet fully
open, civil society and the technology community are using government data.3 OpenDataSoft
estimates that there are more than 2,600 Open Data portals worldwide.4
In Europe, Open Data has been a focus for policymakers for over a decade.5 Revisions to the European
Union Directive on Re-use of Public Sector Information (PSI) in 2013 made reusable and open public
sector data the presumptive norm for Member States.6 The updated Directive also encouraged the
adoption of standard licences for public sector data, and strengthened mechanisms for people to
challenge decisions made not to make information available for re-use. Today, almost all European
countries now have an Open Data portal, and across the continent these portals are becoming more
advanced, being used more frequently and creating more benefits for citizens. As Open Data moves
from being a new initiative to business as usual for governments, ensuring Open Data portals are fit
for purpose and sustainable in the long term is a top priority.
The European Data Portal (EDP) was established in 2015 by the European Commission. It harvests
metadata from the publication of open datasets in national, regional and local portals across the
European Union, and seeks to improve the accessibility and usability of EU public sector information.
As well as operating as a portal, the EDP provides training materials and guidance for Open Data
publishers and re-users. To date, the European Data Portal references just over 600,000 datasets from
34 countries and translates metadata into 18 languages. In addition to increasing the accessibility of
Open Data, the European Data Portal also supports public administrations in their endeavour to
publish high quality datasets. Training material has been designed, along a full suite of examples of
Open Data re-use, reports and resources to inspire data publishers. Data re-use is also promoted and
showcased on the portal, as a tangible illustration of the benefits of Open Data.
Over the past 25 years, new tools and technologies have been developed to improve search on the
web. The web of documents (web pages) has become much more discoverable, but searching for data
via the web is still in its infancy. In the early days of the web, lists of web pages were also made
available via portals. Even though we rely on portals now for publishing and discovering all types of
data, we should anticipate that searching for data on the web will continue to evolve — and so
therefore will the role of portals. Ensuring that they can adapt to and support the evolution of the web
1 OpenDataBarometer, 2016, Global Report 2 OpenDataBarometer, 2016, Global Report 3 OpenDataBarometer, 2016, Global Report 4 OpenDataSoft, A comprehensive list of 2600+ Open Data portals around the world 5 For example: UK Cabinet Office, 2005, The Re-use of Public Sector Information Regulations 2005 6 With some exceptions e.g. for libraries and cultural institutions. European Directive on the Re-use of Public Sector
information 2013.

11
is important. They will never be obsolete. Just as curated lists and portals still exist within the web of
documents, so they will exist within the web of data.7
Figure 1: 25 years of the web - technology, services and standards8
Open Data portals have been created by national, regional and provincial governments and by councils
and communities at city level. And despite their name, Open Data portals are not exclusively
concerned with Open Data. Some Open Data portals include listings for unpublished data; others
include data published under non-open licences. The EDP currently harvests data carrying 49 different
types of licences which range from Open Government and CC-BY licences to specific national licences.9
7 The Open Data Institute, 2016, We need to learn how to search the web of data 8 The Open Data Institute, 2017 9 European Data Portal, 2016, Open Data Maturity in Europe 2016: Insights into the European state of play

12
One criticism that has been made of Open Data portals is that they usually do not enable the deposit
of data, or access to data, held by organisations or businesses outside government.10 Instead, ‘data
marketplaces’ – online marketplaces that connect organisations and individuals who have useful data
with those who want it – should be invested in.11 But data marketplaces, like Open Data portals, are
another centralised platform model for accessing data. As search for data on the web evolves,
centralised platform models will need to adapt. In the ‘Architecture’ section of this report, we explore
existing Open Data portal models and support a federated model for data discovery (that is as
decentralised as possible) – fit for meeting data-user needs now, while flexible enough to change as
the web of data changes in future.
Report: Open Data Maturity in Europe 2016 A recent report from the European Data Portal, Open Data Maturity in Europe 2016 provides the most up-to-date comparative assessment of the state of play for Open Data.12 It compares countries along two axes: Open Data readiness (which incorporates policies, licensing norms, national coordination and the use and impact of data) and portal maturity (see Figure 2). The report presents several headline findings. In the last year, the use and impact of Open Data across Europe has increased significantly, by 13.3% and 16.8% respectively. Countries are becoming more active in promoting and monitoring the use of Open Data, and better at measuring its impact. Only five countries in the EU 28+13 do not currently have a dedicated Open Data policy; fewer still do not have a policy which at least encourages the re-use of Open Data. Sixteen out of 31 countries have a standardised approach to ensure datasets are up to date. In 71% of the countries surveyed in the paper, regional and/or local portals exist as well, but only 13% of these have linked all of their regional portals to their national portal. Portals are becoming both easier to use and more responsive to users. Of the portals studied in Open Data Maturity in Europe 2016, 24 of the 29 have an API, and 75% now have a feedback mechanism for users to provide information about the data. This is twice as many as in 2015, and now one third of portals allow users to contribute data.
10 Eddie Copeland, 2016, It’s time to say goodbye to the Open Data portal. Here’s why. 11 Eddie Copeland, 2016, It’s time to say goodbye to the Open Data portal. Here’s why. 12 European Data Portal, 2016, Open Data Maturity in Europe 2016: Insights into the European state of play 13 The 28 European Union members countries plus Switzerland, Liechtenstein and Norway

13
Figure 2: Portal Maturity and Open Data Readiness in Europe, 2016
Open Data Maturity in Europe 2016 uses two measures – Open Data readiness and portal maturity – to identify four tiers of Open Data maturity: beginners, followers, fast trackers and trend-setters.14 Trend-setters have advanced Open Data policies, extensive portal features and national coordination across domains. Despite accelerating quickly, fast-trackers still have a small number of significant shortcomings. Followers have limitations in terms of data release.
The seven countries included in this study vary in their levels of Open Data maturity, as defined in the
Open Data Maturity in Europe 2016 report. Three are ‘trend-setters’ (Austria, Spain and the UK), two
are ‘fast-trackers’ (Norway and Romania) and two are ‘followers’ (Germany and Italy).
Open Data Maturity in Europe 2016 indicates that at a high level, Open Data maturity across European
countries continues to progress. But not all countries are progressing at the same pace. By
interviewing portal owners, we explored the barriers that countries faced in increasing access to and
use of Open Data published through portals.
14 The 28 European Union members countries plus Switzerland, Liechtenstein and Norway

14
2. Methodology
In order to foster trust with re-users and maximise the benefits of Open Data, data must be made
available over time: the supply of data must be sustainable
To address sustainability of Open Data portals, interviewers talked to portal owners to understand
how they perceive sustainability, what it means for their portals today and what they expect to do
about it in the future. By interviewing portal owners from a diversity of countries and settings, the
research highlights trends as well as clear priorities. Collecting multiple viewpoints ensures that
recommendations are consistent and complementary without offering a one-size fits all approach.
The report therefore offers a series of recommendations that have been grouped under specific
themes, for portal owners to determine which they should prioritise in their national setting.
In total, researchers interviewed 22 representatives from seven countries: Austria, Germany, Italy,
Norway, Spain, Romania and the UK. The countries were selected to provide a range geographically,
economically and in terms of their Open Data maturity. The principal aim was to interview national
and regional portal owners in each country. Where possible, these interviews were supplemented by
interviews with civil society representatives.
Researchers interviewed:
● 11 national portal owners covering the seven national portals;
● two community-led regional portals Bath:Hacked (UK) and Leeds Data Mill (UK);
● two regional government portals: the Aragon Data Portal (Spain), and the Vienna Data Portal (Austria)
● one government agency Open Data lead, from the UK Office for National Statistics; and
● four members of three civil society organisation, from the Coalition for Open Data (Romania), Fondazione Bruno Kessler and Open Knowledge Foundation.
The interviews were structured and followed a script of questions (see appendix). Interviews lasted
approximately one hour and were conducted under the Chatham House rule15 so that interviewees
could be frank in their answers. They were transcribed, analysed and compared to produce this report.
Interviewees were able to approve any attributed quotations prior to publication.
The majority of the national portal owners that researchers spoke to, held key positions in government
departments responsible for innovation or digital strategy. They managed the day-to-day running of
their portal, and were from a mixture of technical and governance roles. Most had held their positions
since the creation of the portals in 2011-12. They typically led small teams of between two and five
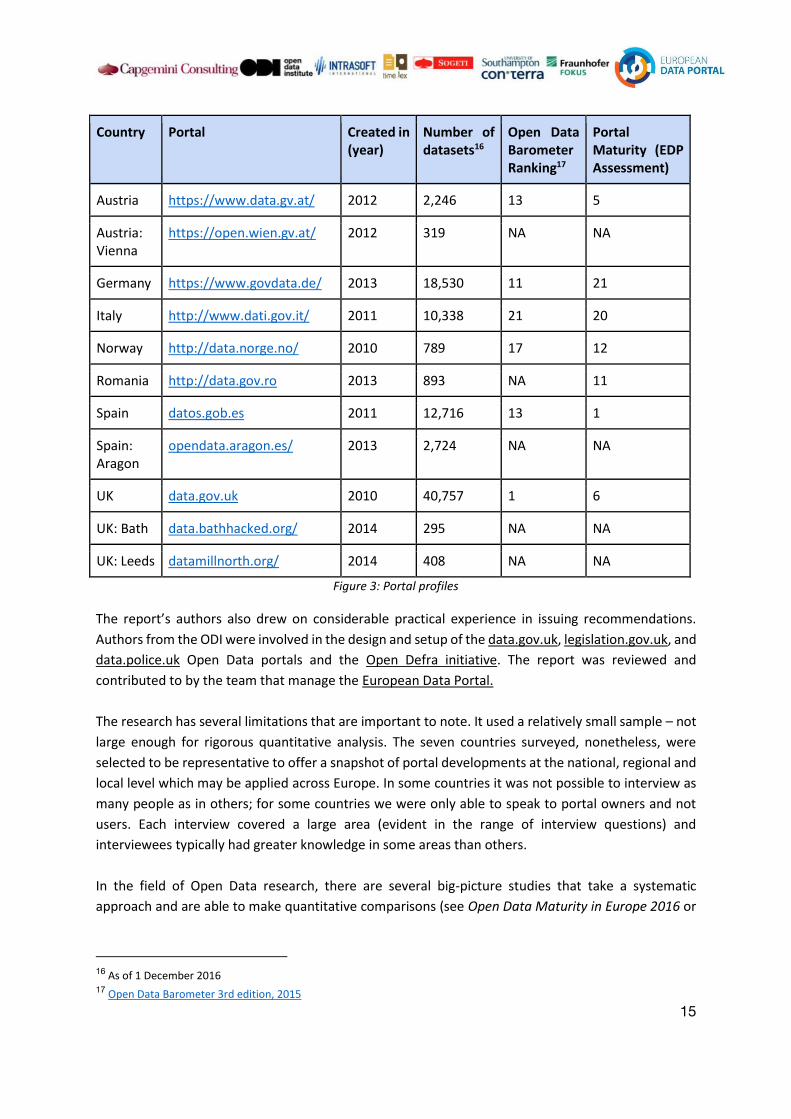
people. As Figure 3 demonstrates, the portals we spoke to varied significantly in terms of their age,
size and maturity.
15 Chatham House rule, 2017
15
Country Portal Created in (year)
Number of datasets16
Open Data Barometer Ranking17
Portal Maturity (EDP Assessment)
Austria https://www.data.gv.at/ 2012 2,246 13 5
Austria: Vienna
https://open.wien.gv.at/ 2012 319 NA NA
Germany https://www.govdata.de/ 2013 18,530 11 21
Italy http://www.dati.gov.it/ 2011 10,338 21 20
Norway http://data.norge.no/ 2010 789 17 12
Romania http://data.gov.ro 2013 893 NA 11
Spain datos.gob.es 2011 12,716 13 1
Spain: Aragon
opendata.aragon.es/ 2013 2,724 NA NA
UK data.gov.uk 2010 40,757 1 6
UK: Bath data.bathhacked.org/ 2014 295 NA NA
UK: Leeds datamillnorth.org/ 2014 408 NA NA
Figure 3: Portal profiles
The report’s authors also drew on considerable practical experience in issuing recommendations.
Authors from the ODI were involved in the design and setup of the data.gov.uk, legislation.gov.uk, and
data.police.uk Open Data portals and the Open Defra initiative. The report was reviewed and
contributed to by the team that manage the European Data Portal.
The research has several limitations that are important to note. It used a relatively small sample – not
large enough for rigorous quantitative analysis. The seven countries surveyed, nonetheless, were
selected to be representative to offer a snapshot of portal developments at the national, regional and
local level which may be applied across Europe. In some countries it was not possible to interview as
many people as in others; for some countries we were only able to speak to portal owners and not
users. Each interview covered a large area (evident in the range of interview questions) and
interviewees typically had greater knowledge in some areas than others.
In the field of Open Data research, there are several big-picture studies that take a systematic
approach and are able to make quantitative comparisons (see Open Data Maturity in Europe 2016 or
16 As of 1 December 2016 17 Open Data Barometer 3rd edition, 2015

16
the Open Data Barometer, for instance). These are vital for understanding trends and patterns in what
is happening, and producing hard evidence to support policy.
This report takes a different (but complementary) approach. Through qualitative inquiry it seeks to
draw out specific lessons from individual experiences that others can practically use. It aims to use
interviewees’ stories to fill in the details sketched out by bigger comparative studies. Each section
combines findings from the interviews, practical experience and secondary research to make a series
of recommendations. Case studies are used throughout to explore examples.
The challenges confronting Open Data portal owners, in their desire to make portals sustainable, are
multi-faceted. The report follows the European Commission’s framework for assessing the
sustainability of large scale Digital Service Infrastructure projects, which separates components of
sustainability into governance, operations, financing and architecture.18 The analytical framework
mapped very well onto how interviewees understood sustainability and helped researchers to
consider sustainability from multiple perspectives. The report therefore assesses:
● the governance model for a portal
● how it is financed
● its architecture, and
● how it is maintained and used from day to day (its operations).
This report also includes a chapter on metrics for measuring performance and use of an Open Data
portal. Several interviewees highlighted challenges monitoring and quantifying how their portal was
used, and using data quality and quantity metrics to compare and benchmark publishers. The metrics
chapter looks at existing metrics and tools for measuring Open Data portals, and the role they play in
driving sustainability.
The research will be iterated and the report updated at the end of 2017.
18 European Commission, 2013, The feasibility and scenarios for the long-term sustainability of the Large Scale Pilots,
including ‘ex-ante’ evaluation

17
3. Governance
The governance model for an Open Data portal shapes how it is financed, the extent of its influence
on data publishers and re-users, and the resources it has at its disposal for maintenance, engagement
and enhancements.
Open Data portals are typically established by governments in the early stages of their Open Data
initiative. Almost all of the national portals sampled for this report were set up between 2010 - 2012,
and so have been directing people to public sector Open Data for around five years. While the portals
sampled have different origin stories, some common features are worth keeping in mind in the context
of what is sustainable. Most of the portals were set up:
● as part of a specific Open Data initiative, and administered by the team responsible for the initiative;
● without the need for a comprehensive business case or user research to help make the case for funding (because Open Data was a strategic political objective);
● separate to (in terms of governance and staffing) digital functions and strategies for government, although with obvious overlap.
These features explain the rapid progress of Open Data initiatives in their early stages, being staffed
close to the power-centre of government and able to fast-track spending. But to become sustainable,
the governance model for an Open Data portal has to become embedded in ‘business as usual’
government functions, and able to continue to adapt to changing government priorities.
Main recommendations to make the governance model more sustainable: ● Have a business plan and clear governance structure in place
● Bring publishers and data users together to address specific challenges, using Open Data
from the portal
● Build responsiveness to government priority changes into your governance structure
● Create hard levers to set and enforce data quality and metadata standards, and pursue data
updates from publishers
● Create a non-ministerial leadership role to champion data publication and respond to issues

18
3.1 Have a business plan and governance structure in place
Open Data portals help people to find public sector data published as part of a government’s Open
Data initiative, in one central location. It is worth noting that data portals are not just managed by
public sector bodies, or limited to public sector data, but most interviewed for this paper were. Some
community driven portals, like the Leeds Data Mill and Bath:Hacked data store, have been set up by
community groups but link to public sector data.
For governments, whether a portal is the right mechanism to help people connect with and use their
data is not often subject to an independent business case or assessment of user needs. It is simply
‘part of’ doing Open Data in government.
Across portal managers interviewed for this report, most could not articulate why their Open Data
portal had been established: they felt they followed the lead of other countries, or set up portals
because they ‘had to’, as part of an Open Data initiative. Several portal owners cited the Open
Government Partnership as a catalyst. Some linked their portal to broader Open Data objectives. In
Norway, one policy objective was to improve openness about the government’s relationship with the
private sector; in Aragon, Spain, the establishment of an Open Data portal contributed to improving
budget transparency.
Because Open Data portals were most commonly established as part of a new national Open Data
initiative, management structures and financing tended to be ad hoc. Our interviews reflected this.

19
Teams close to the strategic priorities for the current government – in the President’s or Prime
Minister’s office (such as in Romania) – were generally tasked with coordinating Open Data efforts
and the portal, separate to other government IT and digital processes.
Regional and community-led portals, on the other hand – such as the Aragon Government portal,
Leeds Data Mill, the Bath:Hacked data store and the Vienna Data Portal – were more likely to be driven
by specific challenges within their local communities. Leeds Data Mill, for example, began by focusing
on datasets outlined in the UK Government Department for Communities and Local Government
(DCLG) Transparency Code, but quickly realised these may not be most beneficial in Leeds. Leeds Data
Mill therefore switched its focus to data areas with high potential re-use value such as footfall data,
accident rates and business rates.
Understanding the business needs for your Open Data portal, and having a clear business plan and
governance structure in place from the outset of portal development can help you to plan for
sustainability.
3.2 Bring publishers and data users together to address key challenges using
Open Data from the portal
For teams coordinating any Open Data portal, there are a range of stakeholders who shape how the
portal is used and evolves. These include:
● public sector bodies, as both publishers and users of data
● government ministers and senior officials, who drive uptake of a data portal by data publishers in government and may be accountable for data published (where it is a government Open Data portal)
● civil society organisations, as data users and advocates for/monitors of Open Data
● businesses – large and small – as data users and potential publishers of data to enhance value
● local councils and local service providers, as data publishers and users
● journalists, politicians, educators, statisticians as varied data users
Establishing strong connections with data holders and publishers across government is crucial to the
operation of a data portal, both to incentivise publication of Open Data, and monitor updates or
improvements. As part of running a portal in some countries, teams set up data publisher networks
inside government to share experiences using the portal, seek feedback, connect data holders to users
seeking their data and promote best practice. Maintaining these over time can be difficult, as
resourcing for the portal diminishes and priorities change. And without clear directions to areas of
potential collaboration between data users and publishers, it can be hard to maintain momentum.
Without an active community using data published via an Open Data portal, publishers have little
incentive to keep their data up to date, ensure it is of high quality or even publish data at all. There
may not be people within a community or sector with the skills to make sense of data that is published,
or there may not be public demand for Open Data.

20
To combat this, as well as to drive efficiency and improve the provision of public services, several
governments have adopted the concept of ‘dogfooding’. The principle states that by making the data
it produces integral to its day-to-day operations, a government benefits from it, becomes reliant upon
it and therefore has a strong incentive to improve data quality. In the countries where these ideas are
being adopted, portal owners were strongly supportive, saying that ensuring publishers are also users
increases sustainability.
Portal owners struggling with limited re-use of data published via the portal noted that it made funding
and support for the portal difficult to maintain. For regional portals, with less secure funding streams,
this problem was more acute. In Norway, the portal owner attributed the public already having a high
degree of trust in government (and not wanting to look further) as one reason why there had been
limited uptake of published data.
At the other extreme, some portal owners indicated that a sense of government being ‘corrupt
anyway’ limited re-use – people did not trust the data published and so did not want to investigate it
at all. These kinds of reflections are worth incorporating into a business case for creating an Open Data
portal prior to launch.
Portal owners in Austria, Germany, Spain and the UK described active user communities – civil society
groups, journalists, political groups, citizen scientists, businesses and academics – who not only used
data published through the portal but provided feedback, contributed to online forums and promoted
the data within their communities. Some portals were supported by specific user groups driving re-
use and improvements, such as the now disbanded Open Data User Group in the UK (established by
the UK Government) or independent Open Data advocates like the Open Knowledge Foundation
(which has international groups in Austria, Germany, Italy, Romania, Spain and the UK) and the Open
Data Institute (which has nodes in Austria, Italy, Spain and the UK).
In several cases - such as Bath, Vienna and Norway - small but active communities existed in
geographical pockets (such as a city or local community) who were interested in specific datasets and
challenge areas. Local events like hackathons and jams helped to bring these communities together,
alongside social media outreach and other forms of engagement. Some portal owners reported
hosting events with smaller communities but being mindful of ‘oversaturating them’ with too much
engagement.
Several portals researchers we spoke to had targeted prime sectors where data could be matched to
user demand to demonstrate immediate success. The owner of Bath:Hacked gave a good example.
They organised a series of events focussed on the environment. Before running hackathons, they ran
a series of meetups to discuss different ideas for what to work on, what data could be released and
so on. This enabled them to gauge demand within the community, and then use this to leverage data
releases. By ‘creating a partnership between the tech community, the council, and local sustainability
groups’, the project was able to create tangible results such as Energy Sparks, a project that provides
data visualisations to help schools become more energy efficient.19 In addition to identifying prime
19 The Open Data Institute, 2016, Energy Sparks

21
sectors for an individual context, portal owners can draw on existing research to identify priority
datasets. The European Commission identifies the top five priority data domains, namely statistics,
geospatial, transport & infrastructure, companies, and earth observation. The Open Data Maturity in
Europe 2016 report found these five priority domains to overlap with the five most consulted domains
as indicated by the EU28+20.
Case study: Open Data Spaghetti Open Data Spaghetti (ODS) is a community of Italian citizens ‘interested in the release of public data in open format, so as to make it easier to access and re-use (Open Data)’.21 Established in 2010 by a blog post by Alberto Cottica, a small group of bloggers and civil servants in Italy started to gather links of open data (and tools to manipulate the data with) whilst waiting for the official launch of dati.gov.it. Whereas dati.gov.it is the national open data portal, ODS become a community-driven initiative to share best practice and ideas on how best to extract information from open data, and contribute to the progression of the Italian open data movement. In 2010, the ODS community had aggregated 32 databases22. ODS host an annual gathering. The 2016 gathering, held in Trento was supported by Open Data Trentino, Consorzio dei Comuni Trentini, Provincia Autonoma de Trento, Comune de Trento, Fondazione Bruno Kessler and Biblioteca Comunale di Trento.23 At the 2016 gathering, ODS learnt about the European Data Portal, shared progress and ideas on the Freedom of Information Act and progress on the Open Data Search 20024 (a research study on the reuse of open data from companies in Italy). ODS also use Github25 on an on-going basis to collaborate with data. Example Github projects make use of open, shared and crowd sourced data and include:
● ‘Visualising Self Diagnosis’26, a project to visualise the number of people going online to diagnoses health conditions, based on Wikipedia page views data
● Open Gov Watchdog27 which documents what is done by the Open Government policies in Italy.
In our interview with Fondazione Bruno Kessler, the community leaders shared that ‘with transparency we always [use] open data, but the quality is [poor] and becomes out of date. We estimate our community has 500 very active members’.
Bringing together publishers and users to respond to concrete challenges using Open Data published
to the portal helped portal owners demonstrate its relevance. It also showed publishers how their
data could be used, provided valuable feedback for portal owners on how the portal infrastructure
20 European Data Portal, 2016, Open Data Maturity in Europe 2016: Insights into the European state of play 21 Spaghetti Open Data, 2016 22 Spaghetti Open Data, 2010, Spaghetti Open Data: a little thing that feels right 23 Spaghetti Open Data, 2016, Il Programma di #SOD16 24 Open Data 500, 2016, Open Data 200 Italia 2525 Github, 2016, Spaghetti Open Data 26 Github, 2016, Spaghetti Open Data/visualizing self-diagnosis 27 Github, 2016, Spaghetti Open Data/opengov-watchdog

22
could continue to be improved, and highlighted data that is not accessible but could be. Connecting
and maintaining communities who are interested in and actively using data from an Open Data
portal can ensure it continues to have value.
3.3 Build responsiveness to government priority changes into your
governance structure
While at the outset of an Open Data initiative the Open Data portal might gain significant attention
and support, maintaining momentum around data published and updated on the portal can be
difficult. Government focus goes elsewhere, and ongoing funding and refreshed governance for the
portal can be hard to maintain. Most portal owners sampled for this report (around five years into the
life of their portal) described their portals as ‘side projects’, with minimal oversight. A fundamental
challenge to the sustainability of Open Data portals is being able to refresh and improve their
governance arrangements, as the priorities of their respective governments change.
Across the portal owners surveyed, opinions varied as to the most sustainable governance structure
for an Open Data portal. The UK national portal owner felt that a centralised model in close proximity
to the seat of power (the Prime Minister or equivalent office) was most effective for keeping the
pressure on publishers to keep publishing, updating and improving. In Austria and Germany, a
federated model is in place that sees Federal States provide financial support for and jointly operate
the portal as a cooperative. A number of steering groups support strategy and operations, driving
portal maintenance and improvements. This model was received favourably by other portal owners
surveyed.
Case study: Cooperation Open Government Data Austria Cooperation Open Government Data Austria (Cooperation OGD Austria) offers a federated approach to managing public sector data. Comprising representatives from the federal government, Federal States, cities and municipalities who are responsible for driving forward Open Data, Cooperation OGD Austria functions as a network overseeing and maintaining data.gv.at, with technical and organisational frameworks shaping how that happens. The Open Knowledge Forum Austria, Danube University Krems, the Department for E-Governance and Open3.at act as advisors to Cooperation OGD Austria.28 Federal States have joined Cooperation OGD Austria since it was originally launched. In 2015, nine Federal States agreed to jointly fund the ongoing maintenance of data.gv.at, creating a cooperative model where they finance and manage the portal together. Portal owners for data.gv.at report this cooperative model makes managing infrastructure costs easier, as government and regional Open Data policies and regulations change, and best practice evolves. Currently, there are two groups providing strong national coordination of Cooperation OGD Austria and data.gv.at: a steering group, with the Federal Chancellory acting as Chair, and an operative group. This group decides on budget, new partners and exercises strategic decision making as
28 Research Gate, 2014, Open Government Data Implementation Evaluation

23
required, and meets at least annually. There is also an expert/operative group which meets more frequently to discuss portal developments, standards and licensing. Each cooperative member nominates a representative to this committee. Strong national coordination is key to making federal approaches work and ensuring accessibility of data (see Figure 4).
Figure 4: Data.gv.at - Governance model
To date, data.gv.at has published over 2000 datasets from federal, state and local level. They have a strong user-base, with 350 applications and services being created using Open Data from the portal that they know about.
3.4 Create hard levers to set and enforce data quality & metadata standards
Without the means to monitor and enforce standards of data publishing quality, discoverability and
timeliness, an Open Data portal will not be very useful for re-users.
Portal owners in Italy, Romania and Spain indicated that data-quality issues continue to be a barrier
to the use of data accessed via their portal, and that no hard levers exist to enforce quality. Resourcing
and budget issues prevent some portal owners from monitoring quality (see the Financing section).
Without the curation and enforcement of data quality, an Open Data portal can become a source of
broken links, out of date and unused data, and poor metadata. Atz (2014) developed and applied a
metric assessing the timeliness of data in catalogues against three existing catalogues: the World
24
Bank’s data catalogues, data.gov.uk and the London Data Store.29 Issues around datasets being
published without data about update frequency (on DGU, only 25% of datasets included information
about update frequency) made accurately assessing timeliness difficult. Applying the metric, only the
London Data Store had updated just over half of its data according to schedule. But enforcing the
updating of data can be out of reach – both in terms of authority and resourcing – for a team managing
an Open Data portal.
Several portal owners - for instance from Italy, Spain and the UK - indicated that they had developed
policies and standards to guide data publication via the portal. Others stated that they relied on digital
policies of the government or local council, or on regulation, to enforce aspects of data publishing via
the portal. Open Data Maturity in Europe 2016 found that, across Europe, the absence of a legal
framework for data publishing is seen as a key barrier and several countries are taking active steps to
amend legislation.30
In some countries, legislation compels public sector bodies to publish certain kinds of Open Data.
Furthermore, public sector bodies have to respond to requests from data users (based on the EU Re-
use of Public Sector Information Directive 2013 transposed in all Member States31). These do provide
a lever of sorts to maintain Open Data publishing by public sector bodies.
Setting standards for Open Data publishing: the Data Catalogue Vocabulary (DCAT) DCAT is an RDF vocabulary developed by the World Wide Web Consortium (W3C) designed to facilitate interoperability between different data catalogues published on the Web.32 It enables applications to easily consume metadata from multiple catalogues, and is what makes initiatives like the European Data Portal possible. The DCAT Application profile for data portals in Europe (DCAT-AP) is a specification based on W3C's Data Catalogue vocabulary (DCAT) for describing metadata of public sector datasets in Europe. It is the standard used by the European Data Portal as well. The benefits of DCAT-AP, are that by using a common metadata schema to describe datasets: 1. Data publishers increase the discoverability of the data and thus re-use 2. Data re-users can search across platforms without facing difficulties caused by the use of separate models or language differences
29 Open Data Monitor, 2014, The Tau of Data: a new metric for assessing the timeliness of data in catalogues 30 European Data Portal, 2016, Open Data Maturity in Europe 2016: Insights into the European state of play 31 European Commission, 2003, Directive on the re-use of public sector information 32 World Wide Web Consortium, 2014, DCAT W3C Recommendation 16 January 2014

25
While DCAT-AP is not a mandated standard (e.g. by national or European Commission law), it is widely accepted as the standard way for describing a dataset, and so has been adopted by portal owners. An example of national coordination is Italy where a metadata application profile has been developed based on the DCAT Application profile. The DCAT-AP_IT serves as a guideline for all public administrations across the country, regardless of the level of government to comply with when publishing Open Data. To support its implementation, National Guidelines have been established33
3.5 Create a non-ministerial leadership role to champion data publication
and respond to issues
Having policies and standards in place that set out what best practice data publishing looks like, and
how it will be monitored and assessed, is the necessary backbone for any potential hard levers
enforcing data quality. These do not need to be based in legislation, but they should be enforceable,
through a review panel, or direction from a senior official/government minister, for example.
Practical experience shows that, in many cases, the team coordinating the Open Data portal and portal
owner do not have the necessary authority to enforce data-quality standards and seek the publication
of key datasets by other public sector bodies. Senior leadership, highlighting best practice for the rest
of government and enforcing standards, is essential to continue to drive change. The owners of the
UK and Vienna portals highlighted the usefulness of a senior non-ministerial leader like a Chief Data
Officer in order to maintain momentum.
33 Italian Open Data Portal, 2016, DCAT-AP_IT v1.0

26
What should the role of a Chief Data Officer look like?
Chief Data Officers and executives with equivalent responsibilities are beginning to be appointed to senior roles in both private and public sector organisations.
In 2015, the Open Data Institute facilitated a roundtable with senior civil servants and private sector Chief Data Officers, to talk about what the role of a CDO for the public sector might look like, what its responsibilities should be and how it should engage with central and local governments. Participants agreed that the impact from the creation of a CDO would broadly follow two themes:34
● data delivery: developing a cohesive data architecture [a “canonical data model”] for the public sector; improving the consistency of data standards, quality, publication and use by public sector bodies, benefitting both the public and the public sector itself.
● data policy: providing strategic leadership on key policy questions surrounding the collection and use of data by the public sector, including personal data, data sharing and Open Data.
This might be a role with an enforcement aspect, capable of compelling the publication of certain data sets (where there was no legal barrier to their being made available) and requiring adherence to data publishing and maintenance standards. It may also have an ambassadorial element, championing the benefits of better use of data and advocating for investment. Of the portals interviewed, however, only two - the UK and Vienna - currently have Chief Data Officers working alongside them. The owner of the Vienna Data Portal said that Vienna’s Chief Data Officer played a vital role: working within the operational part of Vienna’s ICT-organisation, they support the portal by planning Open Data phases (including which datasets get released) and speaking with departments to help them publish data (see Figure 5).
Figure 5: Organisational Structure of Vienna City Council
34 Open Data Institute, 2015, What should a Chief Data Officer Look like for the UK Public Sector?
27
4. Financing
All public sector Open Data portals need financing, both for the infrastructure of the portal and
maintenance, as well as any outreach, training and support for publishers and re-users of data that is
within the scope of the portal’s operations. While the cost of software and hardware continues to fall,
the cost is not zero and people operating the portal still need to get paid. There are several factors to
consider in a financing model. It needs to:
● allow the team operating the service and planning its strategy to work with a known budget, and have confidence as to its longevity
● account for updates and enhancements to the portal, as well as bug fixing
● give users of the portal (both publishers and re users) confidence that it is to be a sustainable mechanism for accessing Open Data
Typically, Open Data portals tend to have less trouble securing financing for design and early
development. Securing sustained funding for both maintenance and improvements can be difficult
without having a clear funding strategy in place, an understanding of publisher and re-user needs and
a stable funding stream. Portal owners can take several measures in order to make portal financing
more sustainable, as explained in the recommendations below.
Main recommendations to make portal financing more sustainable: ● Be open about your funding strategy, so that people publishing and accessing data from the
portal can identify future needs, use cases and potential funding shortfalls
● To maximise scope for portal improvements, and reduce the impact of funding cuts, ensure
your priorities (training, support for publishers, user engagement) align with those of your
funding source(s)
● Ensure that your own role as portal owner includes responsibility for setting funding
strategies and budgets
● Perform, commission or identify research into the impact of your portal’s current or
potential activities, to develop and support a business case for future funding.

28
4.1 Be open about your funding strategy
Because data can be freely accessed from many Open Data portals – often without the need for
registration – it can be hard to accurately assess the extent of potential users/uses of the data to
incorporate into a funding model or make a business case. Openness about funding strategies can give
the community making use of the portal (both publishers and re-users) an opportunity to clarify
aspects of the strategy, and share experiences that might help argue for greater funding. It also helps
the community of Open Data portals as they can more easily learn from the strategies of other portals.
No evidence was found of portals publishing open strategies in this way. Portals owners could look to
other public sector bodies for an example of best practice, for example the Government Digital
Strategy published by the UK Government Digital Service.35
The financing a portal requires will vary during the lifecycle of the portal. When a portal is being
designed and built it may be given a time-limited grant to explore user needs and potential benefits,
and determine the design, scope and scale of the portal. When a portal is in active use and creating
impact, a funding model is likely to be over a number of years with a mix of recurring funding for day-
to-day governance, operations and maintenance and one-off funding for developments such as new
products and service features or to support updates and enhancements.
35 Government Digital Service, 2013, Government Digital Strategy: December 2013

29
How a portal will be financed will also be dependent on its governance model (see the Governance
section), and whether it is an independent arm within an organisation or embedded in a larger
function. Having a senior position associated with the portal – such as a Chief Data Officer, who can
influence funding decisions – will affect the financing model. Financing may also be channelled from
the portal to data publishers to assist with sustainable data release.
4.2 Ensure your priorities align with those of your funding source(s)
A financing model will be impacted by the components of the portal service and surrounding service.
If the portal service includes the role of increasing data supply then some funding may be directed to
assist with training data publishers and sustainable data publication. If the portal service includes the
role of encouraging re-use, then some funding may be directed to support training for data users,
general engagement activities or activities focussed around particular problems that funders might
wish to see solved.
There may be multiple funding sources, each with their own desired outcomes. Multiple funding
sources can assist with creating a sustainable funding model, as they ensure some continuity of
funding even if one source becomes unavailable. The Austrian data portal, for example, is jointly
funded and overseen by Austrian Federal States and municipalities (see page 10). Models with
multiple funders can also be seen outside the public sector.36
Several portals indicated that desired outcomes and conditions attached to funding could act as a
constraint. For instance, one national portal told us that the large majority of their budget could only
be spent on technical aspects of the portal. This limited their ability to run user-engagement events,
which they saw as more important to the sustainability and impact of the portal.
The two local portals from the UK indicated to often receive a mix of central government and local
council funding. For example, the Bath:Hacked data store is a community-run portal that was
established with a grant from the council. This is a different model to local government portals that
are directly paid for from council budgets and operated by civil servants. Bath:Hacked also receives
sponsorship from the Local Housing Association and local technology companies. If Bath:Hacked can
prove its impact, these organisations will renew their funding. This may point towards a more
sustainable model for local community-led portals with funding coming from a range of stakeholder
groups. The two regional government portals interviewed for this report were, however, funded
differently. Vienna receives funding directly from the Federal Chancellery because it publishes data to
the national portal while the Aragon portal is funded 50:50 by the Spanish government and the EU.
At an EU level, opportunities are available to fund Open Data initiatives. These include the 2016
Connecting European Facility (CEF) public Open Data call37 which made €3.5m available for proposals
which facilitate the re-use of datasets including enhancing metadata quality, and the 2016 CEF
36 The Open Data Institute, 2016, Aim to be boring: lessons for data infrastructure 37 European Commission, 2016, CEF Telecom Public Open Data call

30
Telecom automated translation call38 which made €6.5m available for proposals which promote
multilingual aspects.
4.3 Ensure that your own role as portal owner includes responsibility for
setting funding strategies and budgets
The research showed that most data portals recognised the need for a sustainable financing to support
day-to-day operations, allow future planning and act as a mechanism to provide confidence to data
users. In some cases, portal owners were not concerned with sustainable financing because they were
certain that open data would always be funded as a public good.
Nonetheless, most respondents found it difficult to answer exactly how much it costs to run their
portals as they do not have a discretionary budget of their own. Typically money came from multiple
budgets and was allocated to them and it was difficult to quantify expenditure on staff time for those
who had worked on the portal alongside other projects. For those portal owners that were able to
provide an estimate, annual budgets ranged from €90,000 to €700,000.
Open Data portals are a service provided to data publishers and users. As with all services, their
owners should have clear budget responsibilities and funding streams. This will direct them towards
providing appropriate levels of service to the data publishers and data users.
Multiple portal owners reported that their funding only supported basic day-to-day portal operations
rather than developments, with comments such as: ‘With just three of us, we have no capacity to
progress it, only really [to keep] it ticking over’, and: ‘We don’t have long-term targets – we have never
been able to plan long-term.’ Another portal owner told us: 'When it was first launched it was done in
a spirit of Open Data, [that is to] just go ahead and do it rather than [wait] for guaranteed funding.'
While portal owners found it hard to estimate ongoing running costs, most could tell us roughly what
it had cost to launch their portals. Overwhelmingly, these costs were staff time – especially for those
building more complex portals – followed by operational and technical overheads. Several portal
owners told us about specific funding allocations they had received for making updates. For instance,
one portal owner told us they had spent €20,000 on a recent update, which included changes to the
graphics and new uses of metadata. Respondents were less clear about their operational budgets.
It should be the senior leader’s responsibility (e.g. a Chief Data Officer) to ensure a sustainable funding
stream, and advocate for funding as needed on behalf of the portal owner. Decisions also need to be
made about the extent of the Open Data portal’s functions and responsibilities to find a balance
between managing the technical portal infrastructure, training for data publishers and engagement
with data users. It may be that the portal’s role is to kick-start an Open Data initiative and provide a
focus for publishing, but ultimately to aim for obsolescence (as search for data on the web becomes
more sophisticated). It’s worth noting, nonetheless, that portals can be seen as evidence of a
38 European Commission, 2016, CEF Telecom Automated Translation

31
government’s commitment to Open Data - and so shutting them down (or neglecting them) can be
seen as an indication of waning interest.
4.4 Securing funding for an Open Data portal
Researchers found three funding models. Most national portals were funded by a single government
department such as the digital agency or President's office. Portals under this arrangement, such as
Norway, have to compete with other digital infrastructure projects for funding. The German and
Austrian national portals have federated financing agreements with multiple regions contributing to
a national portals, based on the size of their population. Regional portals typically had mixed funding.
The Aragon portal is half-funded by the regional government and half-funded by the European Union.
The Bath:Hacked data store is funded local council grants and sponsorship from technology companies
and a local housing association.
There are several potential funding arguments for Open Data portals. They can typically be linked to
Open Data’s benefits and the portal’s positive impacts. Examples might include increased general tax
revenues from increased economic activity; compliance with regulation; compliance with a general
strategy to increase a nation's or region's digital economy; compliance with a general strategy of open
government; a technology strategy to create shared components such as an Open Data portal used by
multiple data publishers; or operational efficiencies and improved public sector services.
Of course, funding models and the arguments that can be made for them are contingent on the
political context within a country. If Open Data is considered an essential public service, and provided
for in law, it implies that portals will secure 100% public funding. In countries where the political
support is less clear-cut, portal owners may have to use a wider range of arguments in their funding
strategies.
4.5 Generating revenue from an Open Data portal
Researchers found no examples of national data portals generating revenue from data users. It is
recommended that this option be explored by portal owners and that they share lessons learned.
Researchers did speak to one national statistical agency, the UK Office for National Statistics, which
charges for providing particular data services to major clients, such as government departments and
the Central Bank. This organisation was beginning to publish more data openly and increase access to
data it shares, however clearly organisations whose business models rely on a certain amount of paid-
for data face different challenges in becoming sustainable to portals.
This report would strongly advise against portals charging for data that should be freely available as
Open Data. None of the countries interviewed charge for data - and European Data Portal research

32
found that 96% of EU Member States have implemented a zero marginal cost funding model in law,
meaning they should not charge for data.39
There are, however, multiple other methods for data publishers to generate revenue. For instance
activities such as training courses and service-level agreements for high-volume API access, or added-
value data analytics services can be provided on top of a portal. None of the portals interviewed were
yet engaged in such activities, however several - including Bath:hacked and Aragon - spoke of
ambitions to develop such income streams to help fund their portals. Data Mill North, another regional
portal in the United Kingdom provides an example of how this might be done by generating revenue
through training and other services in partnership with ODI Leeds.40'
Just like data publishers, data portal owners need to balance the desire to create revenue from data
users with the impact of revenue-generating services on the data market they are trying to stimulate.
In nascent markets, where third parties are not building products using data available from the portal,
and the data is not available in formats that are useful to users, providing these services could
stimulate demand and further re-use.
When there is high demand from data users to create services, however, greater impact can be
generated if portals do not intervene and instead foster open innovation. As the Bath:hacked portal
owner put it, ‘if portals do too much it hampers the downstream ecosystem.’
Case study: Transport for London (TfL) In 2012, TfL committed to encouraging open innovation by ‘syndicating Open Data to third parties’ and ‘engaging developers to deliver and innovate using Open Data’.41 It set out three main reasons for doing so:
● to ‘ensure any person needing travel information about London can get it wherever and whenever they wish’
● to ‘facilitate the development of technology enterprises, small and medium businesses, generating employment and wealth for London and beyond’
● to ‘effectively crowd-source innovation’ by ‘having thousands of developers working on designing and building applications, services and tools with [TfL’s] data’
TfL created and supported numerous APIs that provide transport data – such as timetables and live access to bus and train locations, and departure and arrival times – and convened an Open Data user group for developers to collaborate. This in turn led to the creation of travel information apps, such as CityMapper, which help users to plan journeys and avoid disruptions. Allowing apps such as these to emerge has created huge benefits for the data supplier, data users and service users. One study estimated that TfL had generated a return on investment of 58:1 from
39 European Data Portal, 2016, Open Data Maturity in Europe 2016: Insights into the European state of play 40 https://datamillnorth.org/ ; http://leeds.theodi.org/courses/ 41 Transport for London (TfL), Our Open Data

33
passengers using the service more efficiently.42 The Shakespeare Review estimated the value of this time saved by users to be £15-58 million each year.43 These benefits were possible because TfL did not use its position as data supplier to unfairly hamper data users downstream. Citymapper’s general manager Omid Ashtari said, ‘Citymapper was created [in the UK] because of the existence of Open Data. It’s the essential backbone of what we’re working on.’
4.6 Perform, commission or identify research into the impact of your
portal’s current or potential activities to support a business case for
future funding
Impact can be grouped into three categories: political impact, such as the increase in government
efficiency, effectiveness and transparency; social impact, for instance environmental sustainability
and increased inclusiveness; and economic impact, which includes economic growth, business
innovation and job creation.44
Different portals may be more focussed on one type of impact then another, and portals may focus
more on different types of impacts as they become more advanced. For instance, national portals set
up as a result of Open Government Partnership commitments were often initially strongly committed
to improving transparency. As portals evolve and publish more data, the priorities of funders may
move to demonstrating economic benefits. Community-led portals, by contrast, are often set up to
have a particular impact, such as solving a local environmental problem.
Except for Spain, none of the portals researchers spoke to had researched the impacts that their
portals had created or could create. However several portal owners were aware of such research
having been carried out by external parties and used that external research as part of their funding
discussions. A macroeconomic study in Germany, for instance, showed that opening up all public
sector information would generate €43.1 billion and create 20,000 jobs.45 In Norway, a study was
conducted on the ‘Value of free map and property data’.46 In Austria and the UK similar studies have
been on the market value of Open Data.47
Spain’s national portal, Datos.gob.es, has played a notably active role in assessing its data’s impacts.
The team has worked with the Telecomms Research Society to look into the impacts that the data on
their portal had helped to create for the public and private sectors. In 2014, they found that the Open
Data infomediary sector (including companies that sell products and/or services using Open Data
42 The Scottish Government, 2013, Open Data consultancy final report 43 APPSI, 2014, What is the value of Open Data? 44 European Data Portal, 2016, Open Data Maturity in Europe 2016: Insights into the European state of play 45 Konrad Adenauer Stifting, 2016, Open Data: The Benefits. The economic impact for Germany 46 Norwegian Government, 2014, Value of free map and property data 47 European Data Portal, 2016, Open Data Maturity in Europe 2016: Insights into the European state of play
34
published through Spain’s Open Data portal) was made up of over 350 companies, collectively
employing over 4,000 people and generating €4,500-€500m.48
In 2016, Spain was the ranked top in the EDP’s Open Data Maturity Assessment.49 Its portal owners
have focussed on specific impacts, namely ‘developing value around Open Data’ by ‘harmonising the
demand and offer in public administrations… and working with the private sector to develop business’.
Developing evidence of how it achieves these has been vital to making the business case for Open
Data - and therefore to winning further support and increasing sustainability.
Portals whose staff lack the skills, capacity or inclination to assess their data’s impacts internally should
commission this research from independent organisations. When combined with existing insights, this
can help to guide decisions around funding and resource provision.
48 Spanish Open Data Portal, 2014, Characterization Study of the Infomediary Sector 49 European Data Portal, 2016, Open Data Maturity in Europe 2016: Insights into the European state of play

35
5. Architecture
How Open Data is stored, published and made available varies across Open Data portals. While Open
Data portals tend to be set up at the beginning of an Open Data initiative (see the Governance section),
with financing for portal architecture (see the Finance section), sustainability is not necessarily a key
consideration when choosing a software solution.
Nonetheless, as Open Data initiatives mature and data services and technologies evolve, ensuring your
portal architecture is still fit for purpose and able to withstand service and funding changes becomes
harder. This section explores the Open Data portal architectures that are in place in the kinds of portals
explored for this report. It also considers best practice and makes recommendations for organisations
looking to establish their own Open Data portal or upgrade an existing one.
The term ‘Open Data portal’ is often used synonymously with phrases like ‘Open Data platform’,
‘Open Data catalogue’ and ‘Open Data repository’. This can make describing the nuances of
architecture behind ‘Open Data portals’ difficult. We have adopted the terminology used in
OpenDataMonitor (2014)50 to help distinguish between the different options for storing, hosting,
and publishing Open Data via a portal. A list of definitions can be found in Annex I.
Main recommendations to make the portal architecture more sustainable ● Select open source software solutions, and solutions that offer archiving/downloading
options for all data published via the portal
● Contribute to the development of standard APIs, that could be used across all Open Data
platforms, for sharing, summarising and presenting data
● Build links to data held in other portals into yours, where they could be relevant for your
local users
● Even if not responsible for the publication and maintenance of data, research your user
needs and their preferred data formats to drive data improvements
● Build upon recognised standards to foster interoperability and comparability of metadata
across Europe
50 OpenDataMonitor, 2013, Open Data topologies, catalogues and metadata harmonisation

36
5.1 Select open source software solutions and solutions that offer
downloading/archiving options
Many Open Data portals run on platforms (software) that offer integrated Open Data management
solutions. These platforms include features like metadata management, basic visualisations, user
management, data publishing and data storage. Some of the most commonly used Open Data
platforms include the following.
● CKAN: currently the most widely used open source data platform helping users from different levels and domains – from national and regional governments to companies and organisations – to make their data openly available.51 CKAN has been adopted by the European Data Portal (EDP), and all of the national portals included in the study. The regional portals interviewed use CKAN (one used CKAN through the platform Datapress).
As described in OpenDataMonitor’s research on Open Data topologies, catalogues, and
metadata harmonisation:
“CKAN provides tools to ease the workflow of data publishing, sharing, searching and
management. It also provides a set of visualisation tools, such as interactive tables, graphs
and maps. There is also a RESTful JSON API for querying and retrieving data.”52
51 OpenDataMonitor, 2013, Open Data topologies, catalogues and metadata harmonisation 52 Open Data Monitor, 2013, Open Data topologies, catalogues and metadata harmonisation

37
A CKAN-based open source data platform is being provided by the startup DataPress, which
also runs Leeds Data Mill, London Data Store and data.amsterdam.nl.
● DKAN: an open source Open Data platform maintained by NuCivic and developed openly and
collaboratively with the Open Data, open source and open government communities. It is
powered by Drupal and aligned with the data standards and best practices of the CKAN data
portal software. DKAN is used across the world53, including ministries in Czech Republic and
cities and regions in Germany.
● Socrata: provides a commercial platform to streamline data publishing, management, analysis
and re-use. The Bath:hacked city portal is hosted on Socrata. All the data hosted by Socrata
can be accessed using a RESTful API.54
Every portal examined for this report, except for the Bath:hacked city data store, was based on open
source software. Open source has become more preferable for government organisations over the
past decade for its adaptability and affordability. The UK Government’s IT Strategy, for example, states
that:
“Where appropriate, government will procure open source solutions. When used in
conjunction with compulsory open standards, open source presents significant opportunities
for the design and delivery of interoperable solutions.”55
Open source platforms can reassure users that it is possible to contribute to their development or self-
host the platform, if pricing of a hosted solution increases or the platform doesn’t fulfil their
requirements. Bath:hacked is hosted on Socrata and its owner expressed a concern that this may
result in future challenges, with apps built off the portal only sustainable while the service via Socrata
is maintained. However, it was more cost-effective for a small portal to use a non-open-source service
than paying for the staff time to build and maintain a portal on CKAN, for instance. The Bath:hacked
portal owner explained: ‘We have technical people but they can’t be on call’.
All of the national and regional portals interviewed (except for Bath:hacked and Leeds Data Mill) are
built on CKAN, as the EDP is. This interoperability was a key advantage for portal owners, for instance
the owner of the Vienna city portal told us, ‘It’s best for us to have our data in EDP, and to have it in
other languages too. [I] don’t think CKAN data structure is problem, [the] EDP is on CKAN.’ Portal
owners interviewed expressed a sense that the market for Open Data platforms was limited. One
portal owner described CKAN as ‘the best of a limited selection’. CKAN is affordable and open source.
On the other hand, some respondents said that CKAN can be hard for teams with limited technical
resource to maintain and update. One portal owner described their frustration in adapting CKAN to
their own purposes, even though it was open source, indicating that they had trouble sourcing
53 Github, 2016, A partial list of DKAN sites around the world 54 Socrata, Socrata developers 55 UK Cabinet Office, 2011, Government ICT Strategy
38
developer support and/or assistance from the CKAN community to help them make the changes they
needed. However, because CKAN is open, the community that adapts, evolves and fixes issues with
CKAN software will continue to grow as long as it is supported and nurtured.
Whatever software solution is chosen, it may result in vendor lock-in (e.g. around APIs) in the long-
term. While most open source and proprietary platforms offer standard metadata exports (DCAT),
there are no standard APIs for other aspects of data management, such as creating datasets, updating
datasets (in bulk or partially), or querying datasets. For true portability, platforms should adhere to a
standard set of APIs that cover all data import and export. This will make data portability easier, and
reduce vendor lock-in.
Limited convergence around Open Data standards and metadata standards makes sharing data
between portals difficult, and functions for summarising and presenting data to give immediate insight
(e.g. via visualisations) can be rudimentary. Developing standard APIs for presenting and sharing data
will help to maximise the discoverability of data across portals. Data platforms are likely to become
more sophisticated if the market for platform offerings grows.
Case study: OpenDataSoft OpenDataSoft is a commercial Software as a Service (SaaS) platform designed to launch open data portals and enable data producers to publish their data alongside interactive data visualisations including maps, charts and graphs. Around 50 open data portals around Europe are currently hosted by OpenDataSoft - including the City of Paris, the City of Brussels, the Paris Region and the French National Railway Company. More than 9000 datasets have already been published and are open for citizens to access and reuse. Datasets can be exported into several open formats, visualisations can be embedded in other websites and data can also be accessed via automatically generated APIs.
5.2 Build links to data held in other portals into yours, where they could be
relevant for your local users
By their nature, Open Data portals centralise access to data maintained by an organisation or network.
This is partly because without a portal, searching for Open Data from a government or organisation
on the web can be very difficult.
In the early days of the World Wide Web, web pages (documents) were also accessed via portals, such
as DMOZ and Yahoo!56 These were curated lists of websites and pages organised by particular topics.
As the web scaled, however, people moved to metadata search engines such as Altavista, which used
metadata that had been manually added to a webpage and provided information about a document.57
56 UK Cabinet Office, 2011, Government ICT Strategy 57 UK Cabinet Office, 2011, Government ICT Strategy
39
Then, PageRank-style search (e.g. Google) overtook metadata search engines. The search engines we
use today to find documents use information about the content of a page, who uses it and from where,
and how it is linked to, in order to point to pages that are relevant for users.
While the World Wide Web is over 25 years old, the web of data is in its infancy. Even though we are
currently reliant on portals to help us discover and use open government data, we can expect that this
will evolve, in the same way that discovery and search evolved on the web of documents.
For maximum scalability and sustainability, the overall architecture of Open Data publication and
discovery should be distributed so that it is possible for there to be different Open Data portals,
covering different parts of the Open Data ecosystem. Data should be discoverable and accessible,
wherever and however users need.
Open Data systems are currently predominantly centralised or federated. A centralised Open Data
portal may be the only source for access to data within an organisation, network or government that
is published, stored and updated via the portal. In these cases, the Open Data portal acts as a
repository for data, as well as a catalogue. Most national portals explored in this report reflect a
federated storage system, linking to data that is typically published and maintained by a government
department or local body and stored elsewhere (not hosted on the platform).
Some Open Data platform providers host the platform on their own servers, and take on any
modification and maintenance burdens as the software is improved over time – Socrata, which is used
by the Bath:Hacked portal, and DataPress are two of these. The German data portal, on the other
hand, simply links to data already published via other Open Data portals at the state and city level. If
more data platform providers entered the market, Open Data portals would become commodities
with a greater choice of hosted solutions: open source and proprietary.
A hosted Open Data platform is likely to reduce overheads for portal owners in the long-term,
although it may limit experimentation. The majority of Open Data portal customers are from the public
sector, and typically face resource constraints and challenges securing technical expertise in-house.
They may not be interested in a bespoke, customisable solution.
While storing data centrally is possibly easier to manage – with reduced concern for data going missing
or links needing to be updated – it can produce bottlenecks and put strain on resources. The Spanish
portal owner, describing their more federated approach to discovery, felt that the data would be less
up to date if they hosted it themselves.
Some federated Open Data portal models, such as that used in Spain, copy metadata from data
published via other local Open Data portals, or on discrete websites, to a central portal. These can be
more accurately described as ‘Open Data catalogues’, comprising metadata about datasets and links
for download. Portal owners from Spain and Germany spoke of harvesting local metadata catalogues
for duplication on a central hub as a priority. This requires sophisticated coordination to pass through
updates to datasets and metadata.

40
The existing federated approach still leans towards centralisation, with a central portal curating links
to data from other sources. As searching the web of data becomes more sophisticated, this will change
too. There are lessons that can be taken from the evolution of search on the web of documents, but
also novel approaches that have not been widely applied. For example, portals could federate search:
providing and using search results from each other (e.g. a user could be linked to national portal data
from a local portal) as part of a more decentralised approach.
Improving the discoverability of data – whether linked to via a central portal, or by using the
information that can be gleaned from search via portals themselves – is essential to driving portal
sustainability. Part of this involves using information about how data is searched for (search terms,
location, etc.) via portals. However, making data easier to interpret and use across different formats,
visualisations and APIs are also key to maximising its beneficial use and impacts.
Whether this should be the role of a central portal, however, is open to debate. The UK portal owner
felt that ‘value-add’ services like visualisations and APIs were best provided by local portals, since they
were closer to the data and to user needs. Some were also concerned that focusing too much on
visualisations and APIs as portal owners would hamper SMEs that could offer these kinds of services
themselves. Similar concerns also came up in discussions about how portal providers might generate
revenue from services provided on top of data published via their portal, as explained earlier in the
Finance section.
5.3 Understand the data formats different users need to drive
improvements
Satisfying a diverse range of user needs is a challenge for data portal owners. Engaging with re-use is
a cross-cutting theme, necessary to demonstrate impact (and secure funding), understand high value
datasets for publication and to seek feedback on operations (see Operations section). Understanding
user needs is also part of deciding what data formats will be supported by the portal.
The Spanish data portal owners commented that they do not try to change the formats in which
publishers choose to make data available, but observed that they had different kinds of users:
transparency users, who are usually not data experts and require data in Excel and CSV formats, and
data developer users who are looking for APIs. The Romanian portal owner also noted issues regarding
the technical literacy of some data users and requests for different formats.
In general, providing data in formats that can satisfy a range of data users can be challenging. On the
one hand, statisticians tend to require bulk data sets for statistical analysis. App developers, on the
other hand, may prefer accessing data via an API. And a significant number of users, without technical
data skills, prefer data in formats such as Excel or presented as visualisations or tables.

41
In a 2015 survey, OpenDataMonitor asked for what purposes people downloaded Open Data.58
Respondents chose multiple purposes, with 43% saying they used Open Data in application
development, 22% as part of data journalism, and 78% for ‘play’. Data about transport and traffic,
environment and climate and finance attracted highest interest.59 As part of the same study, the Open
Data Institute surveyed 270 businesses in the UK using Open Data to understand which Open Data
attributes influence their business strategy. When asked about formats, one participant said: ‘Data
need to be in a computer readable format. The format type does not matter,’ and another that ‘access
to data via an API is usually a big advantage for us.’
A common mechanism for benchmarking Open Data quality is Tim Berners-Lee’s 5-star system to
benchmark Open Data quality.60 The 5-star system is effectively a technical roadmap for publishing
data on the web, with a 5 star rating being for linked data. Alongside this, the Open Data Institute has
created Open Data Certificates (ODCs) to extend the 5-star system to measure other aspects of data
quality, like documentation and guarantees of availability. As more data becomes available as Open
Data, common benchmarks of quality will become more important. For more information about
quality metrics, see the Metrics section. The 5-stars of Linked Data are shown in the Figure 6.
Figure 6: The 5-stars of Linked Data61
58 Open Data Monitor, 2015, Open Data stakeholder report 59 Open Data Monitor, 2015, Open Data stakeholder report 60 5-star Open Data, 2012 61 5-star Open Data, 2012

42
Each of the data portal owners interviewed were enthusiastic about the potential of linked data. The
portal owner for Aragon is currently administering a project called ‘Aragopedia’, which aims to make
a website for every municipality in Aragon (there are 731), incorporating linked data. The German data
portal owner is also beginning a linked data pilot. The UK Office of National Statistics is testing a linked
data pilot, with four linked datasets currently accessible.
The Bath:hacked city portal owner described linked data as ‘a very high bar, technically’, with a limited
user-base. Aiming for three stars (an open licence, structured data and published in an open format)
was perceived to be more achievable.
Registers are becoming an increasing focus for governments publishing Open Data, as reliable, up to
date (‘authoritative’) reference sources. In the UK, the data programme within Government Digital
Service has been prototyping registers of official country names62 and local authorities in England63 for
use inside and outside of the public sector. These provide URLs for things, as required by linked data,
but concentrate on API access to CSV and JSON data, rather than RDF.
For Open Data portals to continue to be useful, and sustainable, the data that is accessible through
them needs to reflect user needs. We recommend that portal owners should gather intelligence on
the kinds of users searching for data via their portal and their preferred data formats. Several portal
owners told us that understanding user preferences was one of their biggest challenges (as we discuss
in the Automated Metrics section).
5.4 Other considerations
5.4.1 Storing data
As noted at the beginning of this section, some Open Data portals can best be described as ‘catalogues’
– offering access to a curated set of links to datasets – while other data portals have some function as
‘repositories’ (storage centres) for data maintained by various government departments or teams.
Not all organisations have the same data-publishing capabilities, so having a portal that provides some
storage and publishing capabilities can be useful. At the same time, some data publishers can more
easily publish data on their own systems. The data may be maintained and used by existing backend
systems, and they may already have targeted and specialised publishing software and processes in
place, and an active user community who knows where to find their data. A catch-all Open Data portal
might not give them what they need.
The majority of portal owners that we interviewed for this report do not store data via their portals.
Others (particularly local portals) noted that they did store their own data, with pointers to it from a
national Open Data portal. Some portal owners said they preferred to store data as it allows them to
publish a wider range of visualisations – tailored to the data they store, via their platform – or while
62 FCO, 2016, Country register 63 DCLG, 2016, Local authority England register

43
they explore more long-term data publishing solutions. The Romania portal owner noted that while
at the outset they did store data on the portal, mechanisms for data custodians to store and publish
data have since become more varied.
One portal owner rejected the idea of storing data, commenting that those responsible for
maintaining a dataset should be responsible for its distribution, not the portal owners. The portal’s
role, they felt, was to improve the discoverability of data maintained by publishers.
What is clear is that for those portals that act as gateways for other data publishers, as those
publishers become more sophisticated the need for portals to offer data storage may diminish. This
may mean that as they begin to function more like Open Data catalogues, issues associated with
broken links and pages from publishers will increase. Data portals should consider the provisions that
they do or do not have in place for archiving data if or when it disappears. In some instances, this may
be the responsibility of the national records office.
Conversely, as more organisations become publishers of Open Data – many with less advanced data
management expertise – the need to be able to publish easily may be more widely felt. But there is
no need to necessarily couple data publication platforms with data discovery platforms. Those portals
that cover data from a wide range of publishers may need to collate data from a similarly wide range
of methods of publication. This is another area where API standards, this time around metadata
publication, could help make the maintenance of data portals easier through enabling automated
harvesting of metadata. In general, portal owners should build upon recognised standards to foster
interoperability and comparability of metadata across Europe.
5.4.2 Value-added services for Open Data portals: data visualisations, storytelling and APIs
The future of Open Data portals is the central preoccupation of this report. What that future looks like
(and whether Open Data portals in their current guises are sustainable) was a subject of debate among
portal owners interviewed. Some portal owners we spoke to – particularly those who felt they
struggled to finance their portal and attract use – felt that for an Open Data portal to be sustainable
it would have to offer more value-added services, including APIs, analytics and visualisations, in order
to generate revenue. The Aragon portal owner commented:
“In the beginning (2013), it was as though we were just selling a product: the dataset. Now we
move from selling a product to selling services.”
The Norway portal owners felt that Open Data portals would eventually function less as repositories
for data and more as data catalogues, providing links to data that can be published easily elsewhere.
They said:
“If we succeed as a portal then the role of portals will not be important. If things are
decentralised and described well in a manner that makes sense on the web, there are several
ways of putting a front end on top, like a search engine or like google. I think portals will still

44
be there but people will be able to access data description in multiple ways. Our hope is that
the portal will eventually will be unnecessary. It's not about empire building it’s the opposite.”
Offering data visualisation functionality is becoming an increasingly desired feature of Open Data
portals, to accommodate different user needs, particularly non-technical user needs. As the portal
owner for Bath:Hacked noted:
“Portals are trying to reach a number of different audiences [including] developers and less-
technical people. Less-technical people might want maps and charts to be available. The
immediate questions you have as a developer can be different.”
The experiences that portal owners had of data visualisations were mixed. Some, such as the UK Office
for National Statistics, have introduced visualisations in response to users wanting to be able to quickly
identify trends in key datasets. One portal owner indicated that they already provided basic data-
preview functions via CKAN, while another portal owner considered CKAN’s data visualisation
functionality to be poor. The UK portal owner felt that it was not their role to provide visualisations,
rather the role of local data publishers and downstream users. They support third parties providing
more sophisticated visualisation tools, including those provided for profit, seeing it as a new market
based on the Open Data. The Singaporean government’s Open Data portal, data.gov.sg, was cited as
a leader in providing simple data visualisations.64
Visualisations can be a good test of whether an Open Dataset hosted via a portal is usable. Drag-and-
drop tools such as DataSeed65 and DataHero66 offer instant visualisations of structured data, making
it possible to quickly assess whether there are any errors in a dataset. It is worth noting that for an
Open Data portal to offer data visualisations, data typically needs to be stored on the portal as
structured and machine-readable data. The EDP only stores metadata of the datasets in its local
dataset repositories. The data that is attached to a dataset remains on the source portal that is
harvested by the EDP. In case of a visualization of that data, the data is accessed in real-time on the
source portal. Whereas most portals develop visualisations, these are not necessarily self-contained.
For instance, the European Data Portal has developed a graphical data visualisation based on the D3.js
JavaScript libraries to visualize (statistical) data in Visualisation tables and graphical charts. The
visualisations are therefore developed as an additional module linked to the CKAN library where the
metadata is stored.
One example is the UK’s national crime mapping website, police.uk, which is built on top of the
data.police.uk API. By keeping police.uk’s mapping (visualisation) website separate to its actual data
source (the data.police.uk portal), the interface demonstrates how the data source can be re-used. It
also serves different user needs (both citizens and developers).
64 Singapore Open Data portal 65 Dataseed 66 Datahero

45
6. Operations
In the case of an Open Data portal, the service being operated can go beyond the technical
infrastructure underpinning the portal – such as its servers – to the practices and procedures that
ensure it provides access to useful, high-quality, discoverable Open Data.
Because of the nature of the service an Open Data portal provides, Open Data portal owners are often
required to be more open, transparent and adaptive to end-user requests than may be expected of
other services. This brings its own challenges to the sustainable operation of an Open Data portal.
The operations of a sustainable Open Data portal involve a portal owner running it day to day, ensuring
that it continues to be responsive and useful for portal users. The extent of an Open Data portal’s
operations is shaped by its finance model (as discussed in the Financing section).
For an Open Data portal, users include:
● end-users, who look for data on the portal, and may come from inside or outside
government
● publishers, who publish or register data on the portal – these may include other owners
from whom data is syndicated or publishers outside government
● monitors (either internal and external), who assess the openness of governments by the
volume and quality of data on the platform, and by their responsiveness to feedback
The majority of portal owners that we spoke to were not themselves publishers of the data provided
through the portal. In most cases, portal owners said they only published metadata while the data
itself was stored by the publishers (typically government agencies or regional governments). Local
portal owners that we spoke to typically published data themselves to the national portal, effectively
taking on separate roles on different portals.
Main recommendations to make a portal operation more sustainable: ● Manage publication operations to support different types of publishers from small- to large-
scale, enabling automation where possible
● Manage technical operations to include effective monitoring and reporting systems for
inaccessible data, preferably through publicly accessible lists for users to track progress
● On-board new end-users, publishers and monitors with effective User Experience design,
clear publication processes, feedback loops and training
● Automate functions to ensure seamless integration of a diversity of data sources, increase
user friendliness and limit overheads for stakeholders
● Capture and share lessons learned, and be open to best practices and standards developed
by other portal operators

46
The range of organisations permitted to publish data varies based on the portal. Government portals
we spoke to did not publish non-public sector data, although several were open to the possibility. For
instance the Aragon portal owner had approached several organisations to try to facilitate this. The
Austrian portal owner said they used a model where the public sector portal has a ‘sister portal’ for
publishing non-public sector data67.
The local and community portals we spoke to published private and third sector data from a range of
sources. Leeds Data Mill had several publishers from ex-public sector industries, such as utilities
companies. Bath:hacked has published metadata about a local artist’s installation.
A sustainable Open Data portal will implement a set of processes that ensure the smooth running of
the portal, oriented around each of these user types, through:
● operational service management that ensures the portal operates as it should
● on-boarding new users onto the portal, which is particularly important for publishers
● training and knowledge transfer to ensure that experience in the running of the service is
passed on68
67 Austrian Open Data Portal 68 European Commission, 2013, ‘The feasibility and scenarios for the long-term sustainability of the Large Scale Pilots,
including ‘ex-ante’ evaluation

47
6.1 Operational service management
The ITIL practices69 for IT service management – a global framework for designing and improving IT
services – define service operation as involving:
● event management: detecting, reporting and handling routine or unanticipated events during
the operation of the service;
● incident management: quickly restoring operation after an interruption to the normal running
of the service;
● request fulfilment: dealing with requests for information or for changes to do with the service;
● problem management: identifying and addressing the root cause of problems with the
service; and
● identity management: granting authorised users permission to use the service and ensuring
that unauthorised users cannot.
However, these items deal only with handling issues or problems with the operation of the service,
not the more mundane aspect of, in the case of an Open Data portal, ensuring that data is published
and that the data is of a high quality, findable or accessible.
6.2 Publication operations
One of the most important functions of an Open Data portal is its support for data publication. Portal’s
operational processes are the endpoint of a government data management process that spans from
production to publication. Portal owners recognised the need for policies that addressed processes
across this journey, to drive improvements in data quality or efficiency. The German portal owner said
that operational processes could be better supported by national laws to support a ‘foundation level
of standardisation’, rather than relying on ‘different laws between different federal states’. Other
interviewees noted the challenges in prescribing technology standards within legislation – which can
become outdated – suggesting that laws should instead set out the power to prescribe standards (see
the Governance section for more on legislation).
In most of the portals explored in this report, publishers published datasets directly to the portal
without the intervention of the portal owner (some, such as Leeds Data Mill and the Norwegian portal,
have an approval or checking process prior to publication). The majority of portal owners we spoke to
had different publication processes to support different types of publishers. Several described three
different levels for publishers:
1. For small-scale publishers with minimal needs, portals owners aimed to reduce friction. One
provided a username and password for a simple Excel backend. Another allowed them to fill
in a simple metadata form directly into their CKAN backend.
2. For medium-scale publishers, for instance those with around 1,000 datasets, portal owners
offered more sophisticated processes. One had built an intermediate database where these
69 2011, ITIL Service Operation. The Stationery Office.

48
publishers could manage their own information and metadata, running a script once a week
and uploading anything that is new onto the portal. Another made it possible for publishers
to download a CSV of their metadata, change it locally and then upload it again.
3. For large-scale publishers with a professional data need and where data required more
regular updating, such as government departments, portals typically had a more automated
process. Some national portals fetched data on a daily basis using harvesting nodes, for
example.
Most portal owners told us that they wanted to automate more of their publication processes to make
publication more efficient and therefore more sustainable. One told us that CKAN, the platform their
portal used, did not lend itself to automating these processes. This was because it was difficult to get
remote support which, with limited resources, made changing publication processes a major
challenge. Another told us that automation depends very much on backend systems.
“If your backend system is integrated it’s more sustainable to automate it. But if the metadata is not
available in any system then it’s time-consuming to create an API and a harvesting mechanism.”
Despite these barriers, automating the publication of data is possible and desirable. An Austrian portal
owner estimated that one third of the publication of data on their portal was automated.
6.3 Technical operations
Taking a technical perspective on the ITIL practices, the characteristics of a sustainable Open Data
portal’s operations should be similar to those of other digital services. They should:
● have in place automated monitoring systems that ensure that errors, capacity problems and
downtime are quickly detected and dealt with
● provide clear mechanisms for users to report problems with the service
● provide a status page that informs users about known problems with the service
● have defined processes and responsible parties to deal with incidents where the service
becomes inaccessible for any user
● keep track of bugs and feature requests that require development time, preferably through a
publicly accessible issue list
● have a defined, rapid and preferably automated process for signing new users, particularly
publishers, up to the service
Of these, the only aspect mentioned by portal owners that we spoke to for this report was the process
involved in signing up publishers to the system. Publishers typically undergo an authentication process
– only when approved by the portal owner can a publisher have the access they require to publish
data. The nature of this process is covered in more detail below.

49
6.4 Open Data operations
Beyond its technical operation, a sustainable Open Data portal should manage its service to provide
high-quality Open Data. The same ITIL practices that apply at the technical level of running the online
service can also apply at this level.
6.5 Managing data quality
It is fairly rare for portal owners to be actively involved in ensuring that the data they publish is of a
high quality. An exception to this rule is the UK Office for National Statistics Portal, which publishes
sensitive data, where publishers load their data into a ‘holding pen’ where it is screened by quality
control managers.
Most respondents told us that their portals had no automated processes for identifying errors in the
data. These could include mechanisms for informing publishers when data does not validate against
prescribed schemas. The Spanish portal, for instance, has an automated process for identifying
metadata errors. Instead of automated processes, however, most portal owners and publishers rely
on users finding and highlighting errors; when they are alerted by users, portal owners will pass on
the issue to publishers, who are then responsible for correcting the error. Owners of larger portals
told us that they simply did not have the capacity for quality control of the data the portal contains.
The exception to the general lack of automated quality checking in portals is for metadata. Most
national catalogues that harvest metadata from local portals – such as the Spanish national portal
explored for this report – will not accept metadata registered by local portals if it contains errors.
The European Data Portal features its own Metadata Quality Assurance (MQA), monitoring the quality
of metadata harvested from other portals or stored manually with the EDP metadata creation form. 70 Metadata quality is based on validation against the metadata standard DCAT, and the availability of
distributions of a dataset. It checks against data portals on a weekly basis.
Ideally, to improve the quality of data publication and users’ experience, and to reduce the number of
complaints that portal owners have to handle, sustainable Open Data portals should:
● have in place automated monitoring systems that detect and report issues with the Open Data
the portal is providing, such as:
○ flagging missing or invalid metadata about the datasets before loading it into the
portal
○ (when the portal only registers rather than hosts data) handling the case when the
original data goes missing (is deleted or moved)
○ informing publishers when published data does not validate against prescribed
schemas, where these are available
70 European Data Portal, 2016, Portal version 1 - User manual
50
○ prompting publishers to update datasets when they go out of date or are not updated
to their prescribed schedule
● provide clear mechanisms for users to report when data is inaccessible, unusable or contains
errors, and have a process in place to act on those reports quickly, which may involve passing
them on to the original publisher of the data
6.6 Creating routine reports
All portals studied measured of the number of datasets that they contain. They were usually less
effective at reporting other information about the data, such as which datasets are most downloaded,
or measures of the overall quality of the data the portal holds.
Maintaining data quality was a priority for all the portals we looked at. The majority of portal owners
told us that quality (along with re-use) was what they most wanted to measure about their data. As
the Norwegian portal owner put it, ‘sustainability comes down to data quality’.
The majority of portal owners were aware of and enthusiastic about OpenDataMonitor,71 a project
that measures and compares data quality. Very few, however, had routine processes in place for
measuring data quality, such as creating reports. To review and report on data quality in a
systematised way may have been too resource-intensive for portals operating with small teams on
low budgets.
On the other hand, many portals had such reporting processes in place for metadata. An example is
the UK national portal’s reports page72 which includes reports about datasets with broken links,
missing resources, and datasets where the only resource is an HTML page. However this was not the
case for all portals we looked at and in some cases portals did have these reporting features but they
were not regularly updated.
6.7 Making data accessible
Support for data requests was another aspect of Open Data operations mentioned by Open Data
portal owners. Nine out of the eleven that we spoke to had a data-request function in some form.
Most had a form that users could fill out, although several told us that, even with such a form provided,
it was more common to receive data requests through other mediums such as Twitter.
All the portal owners we spoke to recognised that data-request functions fulfilled an important need,
connecting them with their user communities. However, several portal owners told us that they found
that a simple request form was not the best way to meet this need. Having a form can lead to the
portal owners' time being consumed by responding to requests that cannot be met, or requests for
specific statistics, rather than data. Several portal owners told us that responding to end-user requests
placed a high demand on their resources. The Austrian portal owner, for instance, described data-
71 European Data Portal, 2016, Portal version 1 - User manual 72 UK Open Data Portal, Data Reports

51
request forms – which often have to be responded to within a fixed time period – as ‘not a sustainable
way’ for users to request data. ‘You get every kind of request: some useful, many not,’ they explained.
‘It’s difficult to have resources to address them all so it’s better to have conversations to ask developer
groups what they want to know.’
Some portals - for instance Norway, Vienna, Bath:hacked and the UK - therefore try to encourage users
to request data in other ways that are more interactive and streamlined, such as at meetups or via
social media. Several portal owners made a comparison to Freedom of Information requests, which
can place a similar burden on government departments. One way that data portal owners have tried
to address users not knowing what data was available is to encourage publishers, such as government
departments, to publish data inventories. However, for most portals we explored this had not been
possible, and in those cases where it had been attempted it is not clear that it reduced or focused
further requests.
Several portals, such as the UK national portal and the Vienna City portal, told us that they published
the user requests they received. The owner of the Vienna portal told us they had a ‘red light function’
to demonstrate when users had requested data but data holders had not released it, making it clear
to users where responsibility lay. They told us that this transparency and accountability was important
to maintaining a good relationship with users.
6.8 Onboarding new users
The three types of users described above — end-users, publishers and monitors — have different
levels of interaction with an Open Data portal and different levels of on-boarding are required.
6.8.1 On-boarding end-users
End-users typically need little on-boarding. They may be casual visitors to the site, in which case the
portal’s User Experience (UX) should guide them to the data they are looking for, or through the
process of requesting it. Portals often have more involved users who may wish to subscribe to dataset
updates, or enter into conversations about the availability of Open Data. Again, on-boarding these
users should be done through effective UX design.
6.8.2 On-boarding publishers
Publishers require a more sophisticated on-boarding process. Open Data portals may have several
different modes of interaction. Depending on the design of the portal, datasets may be uploaded or
merely registered. The portal may require metadata about the dataset, or it may support the creation
of APIs and visualisations. The portal may automatically harvest data from other portals or websites,
or only accept manual additions. Portal owners should have a clear, agreed scope for the types of
dataset publication and publishers that it supports.
The means of on-boarding publishers vary depending on the scale of the portal. Open Data portals
that only host data from a single organisation need to on-board individuals from across the hosting

52
organisation – a local authority, for example. Open Data portals set up to serve a local area and
national Open Data portals tend to view publishers as organisations rather than individuals, and need
to on-board representatives from each organisation, who are then expected to act as a funnel for any
further interactions.
One portal we spoke to, the UK national portal, had conducted in-depth research with their publishers
to discover what problems they faced when publishing data to the portal. They interviewed 45 people
from different government departments about their experiences of data.gov.uk and published their
findings in a blog. They found a number of common problems. Publishers faced conflict between
internal IT processes and the portal processes; struggled to update their records on the national portal;
or commented that turning unpublished datasets into published datasets could be difficult. Others
found that the technical language of the publisher tool was inconsistent, making it difficult to
understand. As a result of their research, data.gov.uk is in the process of making changes to
publication processes, simplifying the workflow and providing more guidance.73
It is essential to seek regular feedback from publishers and users to guide bug fixes and future
enhancements. All portals we spoke to offered training to publishers. This ranged from in-person visits
and 1:1 tutorials with the portal owner, through telephone-based training sessions, multimedia video
guides, to basic written guides. The Italian portal owner told us they would like to provide much more
than written guides but they were restricted by a limited budget. They recognised the value of
improving data skills so that data could be released in the right formats. One portal owner said that
they are working on a new initiative to make the training they provide become part of a wider push
to upskill civil servants and create a more data-driven government.
Several portal owners identified scaling on-boarding processes as a major challenge. The German
portal owner, for instance, told us that they needed to automate time-consuming processes such as
making phone calls and providing training sessions to sustain the rate at which they were scaling.
If the number of publishers is expected to grow over time, portal owners should have a mechanism
for improving the processes for on-boarding publishers to make them as easy as possible. This may
include supporting peer networks of publishers. This will help to ensure the Open Data portal can scale
effectively.
In general, portals should have a clear repeatable process for on-boarding publishers of the different
types that the portal supports, which may include: training those publishers; helping with technical
implementation of automated ingestion; and coordinating surrounding activity for publishers being
brought onto the system, such as communications with wider groups of stakeholders.
Portals should automate their functions to ensure seamless integration of a diversity of data sources,
increase user friendliness and limit overheads for stakeholders. Several more advanced portals we
spoke to had automated processes for harvesting data from new publishers, however they were at
73 UK Government Digital Service, 2016, What we discovered about how government data is published

53
quite an early stage of doing this and therefore still adapting their processes to make them efficient.
Some portal owners told us that automating processes was difficult working with the legacy systems
and structures on which their portals were built. Portal owners should consider whether they need to
advocate for technical updates in order to make their day-to-day functions more sustainable.
6.8.4 On-boarding monitors
On-boarding of monitors was not included within the scope of the interviews, however the authors’
practical experience setting up portals can provide several lessons. The on-boarding process for
monitors depends on the nature of the monitor. Monitoring organisations that exist outside
government – such as Open Data researchers or transparency activists – will expect to be able to
retrieve the information they need to monitor the portal without being on-boarded. Like end-users,
they will expect the information and data that enables them to monitor the portal to be both
accessible and clearly signposted.
Monitors within government are likely to require a more elaborate on-boarding process. These
organisations or individuals are likely to be responsible for ensuring adherence to Open Data policies
and as such may need to create regular reports that enable them to identify where it needs to take
action. Portals should have a clear, repeatable process for training monitors to ensure that they know
how to access the reports that they need and adapt reports to meet the requirements of new monitors
and new commitments.
6.9 Capturing and sharing lessons learned
A sustainable Open Data portal should adapt to the changing circumstances in which it operates. To
do this, it should monitor and incorporate changes – in Open Data policy, data-discovery technologies
and data publication best practices, for example – and invest in training the team running the portal
so they understand the changes taking place. The portal should also ensure the lessons – particularly
those arising from breakdowns in either the portal system itself or the processes that surround it –
are understood and acted upon.
Portal owners we spoke to typically do not do this. Even the portals that self-identified as ‘advanced’
told us that they did now capture knowledge in a systematic way. The UK portal owner portal told us
that ‘a lot is in our head […] we are beginning to formalise it’. This reflects the fact that most portals
are operated by owners who have worked on them since they were created. Internal knowledge
transfer mechanisms have therefore not been tested in many cases.
Operators of sustainable Open Data portals should also consider themselves part of a wider
ecosystem, and seek to add to the shared pool of knowledge about portal operation as well as learn
from it. Portal owners can actively engage in sharing lessons in several ways, by:
● publishing and sharing blog posts
● engaging in portal operator peer networks and sharing research
● developing open source tools and libraries that other operators can re-use
● openly sharing information about the processes and practices they have in place

54
● including template documents and spreadsheets, so other operators can re-use them
Among the portal owners we spoke to, there was a divergence. Most of the leading portals were highly
engaged in the community in these ways, for instance attending conferences and networking events
with peers and sharing experiences via blogs or other mechanisms. They said that these interactions
were critical to their sustainability: to adapting to new demands and developments. Struggling portals,
by contrast, were often not engaged and instead felt isolated. These portals should focus on
communicating more about their portals, since an active community exists that can offer support with
problems.
We recommend that all portals should focus on increasing the amount of knowledge sharing they
do. This form of knowledge sharing is not as a replacement for internal procedures for capturing
knowledge: it is essential that portals engage in both to be sustainable.

55
7. Automated metrics
7.1 Using metrics to drive improvements and demonstrate impact
For an Open Data portal to be sustainable, the data accessible through it needs to be relevant, timely
and usable, and there must be evidence of use and impact to argue for continued investment.
In many instances, though, portal owners are not the publishers or maintainers of data on their portal.
Also, the extent of the data’s re-use can be difficult to track, making it hard to measure for impact.
The ways in which Open Data impact is measured can vary. A Lateral Economics report for the Open
Data Institute looked at the impact of public sector data assets being published openly, as opposed to
closed or shared (paid for). It found that as Open Data, public sector data assets contributed 0.5% of
GDP more economic value every year.74 Research undertaken75 by Capgemini as part of the European
Data Portal measured direct market size, number of jobs created, cost savings and efficiency gains.
The research found that ‘for 2016, the direct market size of Open Data is expected to be €55.3bn for
the EU 28+ and that between 2016 and 2020, the market size is expected to increase by 36.9%, to a
value of €75.7bn in 2020, including inflation corrections. For the period 2016-2020, the cumulative
direct market size is estimated at €325bn.’
Main recommendations to make portals more sustainable by using automated metrics:
● Choose metrics that help to benchmark data publisher performance, but do not rely on one
metric e.g. quantity. Combine quantity metrics with data quality and engagement measures
● Choose metrics that help potential data users find data that is suitable for them to use.
Evaluate whether the metrics chosen are meaningful or potentially misleading
● In measuring quality of Open Data, take into account metadata and contextual information
to increase user understanding and engagement
● Overcome challenges in automating metrics by adopting standard language and
terminology, publishing processes and metrics for data quality and re-use
74 The Open Data Institute, 2016, The economic value of open versus paid data 75 European Data Portal, 2015, Creating value through Open Data

56
It is often difficult to quantify impact from an Open Data portal (and its data). The Financing section
of this report includes a recommendation that portal owners should commission or undertake
research into the extent of use and impact of their portal, to help support funding bids.
One of the recommendations of the Governance section is that to continue to drive data
improvements, portal owners should create hard levers to set and enforce data quality and metadata
standards, and pursue data updates from publishers.
However, to enforce hard levers portal owners often need metrics against which they can compare
the performance of different publishers, and set best practice. While some metrics for measuring data
publication do exist – such as the quantity of Open Datasets published, with systems such as Open
Data Certificates76 and Tim Berners-Lee’s 5-star plan77 – they can have shortcomings. The extent to
which portal owners are able to set metrics and monitor publisher performance against them is
determined by their financing model.
This section explores existing metrics for measuring Open Data publication, how they contribute to
sustainability and the extent to which portal owners can use automated metrics, particularly as they
scale up.
76 The Open Data Institute, Open Data certificate 77 5-star Open Data

57
7.2 Background
Metrics are set as a form of assessment to measure the progress, performance, quality or quantity of
a project, product, service or tool. Metrics traditionally evaluate outputs – the amount of work
produced – but with an increasing focus on impact and sustainability, metrics are expected to now
report on outcomes, i.e. the way the work produced changes things.
Open Data outcomes can be difficult to evaluate. Users may incorporate a particular dataset into their
tool or service, but their re-use can be difficult to track if the right measures – such as the availability
of contact details for the dataset owner, or ‘showcase’ sections on portals – are not in place. And the
usefulness of a portal in terms of how easy it is to discover data through it can be difficult to measure.
Portal owners should both monitor impact (measuring performance on an ongoing basis) and evaluate
impact (with proof), and make sure to use metrics to drive both decision-making and policy.
7.3 Open Data metrics – research to date
Evaluations of impact in the Open Data sector are heavily reliant on case studies, with limited
availability of data on all levels but particularly those of portal owners. At best, studies attempt to mix
methodologies.78 Where benchmarking studies are completed, they can be difficult to scale and
automate. For example, the Open Data Barometer79 – a leading Open Data benchmark of countries –
is a concerted effort of 150 researchers and government representatives. It is a study that would be
near-impossible to automate. Despite the difficulties, some studies have attempted to provide
methodologies for automated assessments, for example, in the context of European projects and their
quality assurance.80
The Open Data Institute’s (ODI) report Benchmarking Open Data automatically81 attempts to provide
an overview and framework for grasping the technical and practical challenges for automation. Some
portal owners commented on the usefulness of automation, and expressed a desire for it, alongside
more critical comments that highlight, for example, the potential for gaming metrics.82
While the ODI’s report explores the challenges of automation, some work has already been done to
at least measure dataset metadata quality, e.g. by the EDP for their Metadata Quality Assurance. The
EDP has developed a number of indicators, including for measuring Open Data Readiness and Portal
Maturity.83
78 For example: The Journal of Community Informatics, 12(2), 2016, User Centred Methods for Measuring the Value of
Open Data 79 Open Data Barometer Global Report, 2015, Global Report 80 Proceedings of the 15th International Conference on Computer Systems and Technologies, 2014, A methodology for
automated evaluation of projects quality (pp. 325-332) 81 The Open Data Institute, 2015, Benchmarking Open Data Automatically. Technical report 82 For example: Open Data Impacts, 2015, The limited promise of (Open Data) 83 European Data Portal, 2016, Open Data Maturity in Europe 2016: Insights into the European state of play

58
A common critique of measuring Open Data is that metrics can be misleading: the most commonly
used metric is the number of datasets in a catalogue. While this is a good indicator of a rich Open Data
ecosystem, it is by no means guaranteed that counts of datasets are comparable across portals or
even time. The number may be artificially inflated because of different units of analysis or, more
prosaic, different ways to count.
As a rule of thumb, the more meaningful a construct appears, the harder it is to measure. The exact
definition here and in other places often remains vague, although there have been attempts to define
specific metrics.84
7.4 OpenDataMonitor
Figure 7 illustrates OpenDataMonitor’s approach to automated metrics, and the tension between
what is measurable and what is difficult to measure in an automated way. OpenDataMonitor,85 a
European Commission-funded project which ran from 2013-15, was the first of its kind to
automatically harvest and harmonise, measure and monitor, analyse and visualise metadata from
available datasets and catalogues at a regional, country and pan-European level.
84 European Data Portal, 2016, Open Data Maturity in Europe 2016: Insights into the European state of play 85 Open Data Monitor

59
Figure 7: Mapping Open Data concepts to dimensions of availability and measurability86
The intended audience of the project and its tools were portal owners, policymakers, journalists and
citizens. It therefore has a broad appeal and provides helpful lessons in applying metrics to Open Data.
By measuring Open Datasets harvested from portals across Europe, various aspects were studied with
regards to quality and quantity.
Quantity measures explored by OpenDataMonitor included:
● total number of datasets
● total number of distributions
● total number of catalogues
● total distribution size
● number of unique publishers
Quality measures explored by OpenDataMonitor included:
● Percentage of datasets with an open licence
● Percentage of machine-readable datasets
● Percentage of datasets with complete metadata
● Percentage of available datasets
● Percentage of datasets in an open format
86 OpenDataMonitor, 2013, Best Practice Visualisation, Dashboard and Key Figures Report

60
Figures 8 and 9 are reproduced from the OpenDataMonitor website87, and detail the quantity and
quality automated metrics derived from data catalogues across Europe.
Figure 8: Quantity metrics from OpenDataMonitor
87 OpenDataMonitor, Methodology of OpenDataMonitor

61
Figure 9: Quality metrics from OpenDataMonitor
With no funding or resources available to update or extend the OpenDataMonitor project and
platform after the project completed, its report needs to be built upon to delve further into the
concepts of quality and quantity metrics, and more general automated metrics.
As part of this report, we asked portal owners if they were aware of the OpenDataMonitor project.
Almost all supported it, and several told us they were keen to learn from it. One said: ‘It’s interesting…
[it] seems to know more about our data than we do.’ One of the benefits of a project like
OpenDataMonitor and the European Data Portal’s metadata quality assessment is that they enable
portal owners to assess the quality of data accessed via their portal alongside portals in other regions
and countries. Learnings from these projects can help portal owners plan for portal enhancements
and argue for greater funding.

62
Metadata quality assessments on the European Data Portal88 The EDP’s Metadata Quality Assurance (MQA) monitors the quality of metadata that is harvested from portals across the European Union or stored manually with the EDP metadata creation form.89 It is based on validation against the metadata standard DCAT-AP 1.1, and is run on a weekly basis. The European Data Portal includes a Metadata Quality Dashboard90, providing information about every catalogue included in the portal, distribution availability and data schema violations. The catalogue dashboard provides the same information as the overall dashboard gives, but only for the selected catalogue. Metadata quality overviews can be downloaded per catalogue91. Distribution statistics Each dataset, in accordance with the DCAT standard, is required to have an Access URL, with a Download URL recommended. A HTTP GET request is executed to check against URLs, and distribution statistics are calculated. Distribution information on the dashboard includes:
● Error status codes ● the ratio of machine readable distributions; and ● most commonly used distribution formats.
Catalogue availability measures the percentage of available distributions of the catalogue and Catalogue machine readability measures if a dataset is machine readable if at least one of its distributions is machine readable
88 European Data Portal, 2016, Data Portal User Manual v. 1 89 European Data Portal, 2016, Data Portal User Manual v. 1 90 European Data Portal, Metadata Quality Dashboard 91 European Data Portal

63
Dataset compliance The MQA also undertakes a simple assessment of each dataset’s compliance with the DCAT standard. Validation is done using metadata stored in CKAN. Users of the dashboard can identify which datasets are non-compliant, and why.
7.5 Choose metrics that help benchmark publisher performance, but don’t
rely on one metric (e.g. quantity)
Benchmarks relating to quantity of data published by teams within an organisation, or an organisation
itself, have benefits in that they are straightforward to measure. They are a useful mechanism to
compare different Open Data publishers, query blockages and encourage friendly competition

64
between departments, cities, regions and countries. They can accelerate a comprehensive data
initiative within an organisation and culture change. They indirectly result in teams developing
processes, standards and timetables for publishing Open Data. Large quantity metrics – such as the
8,000 Open Dataset challenge set by Defra in the UK – mean organisations have to get a handle on the
data they do have, who is responsible for it and how it is being used.
Relying on quantity measurements alone, however, is usually insufficient. One national portal owner
said that they intentionally avoided using the number of datasets as a proxy for measuring the success
of the portal, because it was difficult to know exactly what constitutes one dataset, and focussing on
quantity can be reductive. Another told us that what a portal should measure depended on what stage
it was at. In a portal’s first year or two, the number of datasets is the right metric but once you reach
certain number then those metrics become less important.
Focusing on quantity alone can impact on the quality of datasets published, and how they are used.
As important is ensuring that documentation published alongside datasets is accurate and
comprehensive, that data is published in open, machine-readable formats and with the correct
licence. Teams may focus too much on publishing the ‘low hanging fruit’ – old or out-of-date data,
aggregate data, or data that is not heavily used within the organisation. The data that gets published
does not get widely used as a result, and benefits are not seen by those involved in the initiative,
resulting in cynicism.
Case study: Open Defra (UK) In June 2015, then Secretary of State for the Department for Environment, Food and Rural Affairs (Defra) Liz Truss unveiled her vision to have Defra use data more effectively to transform the food, agriculture and environmental sectors.92 Open Data was central to the vision, with the Environment Secretary committing the whole Defra group to publishing 8,000 datasets as Open Data within 12 months (#OpenDefra). The Defra group comprises 33 agencies and public bodies.93 Many of these bodies contributed to reaching the 8,000 dataset target. By June 2016, Defra had exceeded its 8,000 dataset target, publishing 11,000 datasets as Open Data. The five biggest contributors to that total were:94
● Natural England – over 2,300 datasets
● Environment Agency – over 1,600 datasets
● Centre for Environment Fisheries and Aquaculture Science (CEFAS) – over 1,200 datasets
● Joint Nature Conservation Committee (JNCC) – over 1,000 datasets
● Rural Payments Agency – over 700 datasets
92 DEFRA, 2015, Environment Secretary unveils vision for Open Data to transform food and farming 93 UK Cabinet Office, Department for Environment, Food & Rural Affairs 94 As of 16 June 2016

65
The most downloaded #OpenDefra95 datasets were the Environment Agency’s LIDAR Composite DSM, 1m (3,648 downloads) and LIDAR Digital Surface Model (3,624 downloads). The target of opening 8,000 datasets provided a mechanism for comparing progress (or lack of progress) made in publishing data across each Defra agency and body. The high number accelerated efforts inside each organisation to understand the data they held and who had responsibility for it. Regular updates regarding progress against the target were provided to the Director of Strategy for Defra, and the Secretary of State. To attract attention to Defra’s data, the Defra Data Programme reached out to potential re-users through a variety of channels. Within the 12 months:
● 1,210 articles and blogs were written about #OpenDefra96
● 1,256 tweets were published using the #OpenDefra hashtag97
The Defra Data Programme, responsible for overseeing #OpenDefra, coordinated hack days and conferences throughout the year. Defra’s data also featured at third-party events throughout England including Sheffield, Leeds and Bristol. Defra Group data found its way into applications as diverse as childrens’ video games, archeological discoveries, urban planning, snowfall and wind experiments, national park resources for children, flood modelling, food visualisations and noise maps. LIDAR data published by the Environment Agency had most diverse application. The target raised awareness and investment among Defra bodies in Open Data and brought teams across the Defra group together to work on a common challenge. While attention has been focussed on reaching the target, the quantity metric did result in other benefits. Through #OpenDefra, Defra has uncovered limitations of its data assets, negotiated data access and use issues, and gained an awareness of the cultural barriers and the skills (or lack of skills) in place to make best use of its data. Now, many Defra bodies have an assessment of their data publishing capabilities.98 Several now have a Senior Responsible Owner (SRO) for data and a coordinating data lead. Data is a cross-cutting layer in Defra’s target operating model (TOM). Following the end of the 12 months of #OpenDefra, Defra still has work to do to make the data it has already published more discoverable and usable, and focus on making more high-value data widely accessible. While Defra is now the leading Open Data publisher for UK Government, its data can be hard to discover, metadata and dataset quality is mixed and datasets have been split up into multiple records for indexing via data.gov.uk. While working to improve the quality of data already published, the Defra Data Programme needs to use what it has learnt from #OpenDefra to begin to develop a robust and wide-reaching data infrastructure – spanning datasets, tools and processes (including standards and governance) – that will enable Defra itself to make better use of data.
95 Datasets published during the 12 months of #OpenDefra 96 That can be found via Google 97 There are a significant number of tweets not captured by this figure, which do not use that hashtag (e.g. related to the
Family Food Survey Open Data release) 98 UK Open Data Portal, Defra Group Open Data Maturity Assessment Scores

66
7.6 Measuring quality of Open Data
It can easily be assumed that when we discuss data quality, we are making reference to the underlying
quality of a dataset (for example, its location accuracy), rather than referring to the quality of the
metadata itself. Providing contextual information is essential for the audience to understand what is
meant by the term ‘quality’.
The European Data Portal’s Metadata Quality Assurance (MQA) measures the quality of metadata
attached to data published via Open Data portals. In addition to measuring accessibility, distribution
and machine readability, it indicates whether they are compliant with the DCAT-AP 1.1 metadata
standard. Metrics from OpenDataMonitor were incorporated by the European Data Portal into its
MQA as well as in the 2015 report, Open Data Maturity in Europe,99 to assess the reusability of data
published via Open Data portals in Europe.
Although quality metrics can be difficult to measure, they can provide information at a glance about
how reusable the data of a particular portal, country, city or region might be and highlight focus areas
for technical improvement.
Multiple studies - such as OpenDataMonitor and the European Data Portal’s work on Open Data
maturity in Europe100 - have shown that a low percentage of datasets harvested across Europe have
an open licence. When analysis was undertaken to understand these automated metrics and seek
areas for improvement, a number of discoveries were made, one being around the explicit licensing
of a dataset. A publisher might assume that by putting their data onto an Open Data platform or portal,
they were licensing the data for re-use. By using metrics to display the percentage of datasets that
have not been explicitly licensed, any underlying unlicensed data sources can be quickly modified.
Ensuring there is an explicit open licence provides legal permission to data users to access and use the
data, and stimulates re-use.
7.7 Choose metrics that help data users find data
Assessments of metadata quality provide signposts for portal owners and data publishers looking to
improve the discoverability and usefulness of their datasets for end-users. There are other kinds of
metrics a data portal owner might also choose to display to help end-users find the data they need.
There are metrics that can drive competition between publishers, or help policymakers evaluate the
impact of Open Data.
For example, a portal owner may display high download statistics to drive users to popular datasets.
Publishers might be given rankings based on what they publish, their frequency of updates and overall
data quality, to help portal owners understand which publishers need training and which might be
promoted as exemplars. They can also help data users build trust in key publishers.
99 European Data Portal, 2015, Open Data Maturity in Europe 2015 100 European Data Portal, 2015, Open Data Maturity in Europe 2015
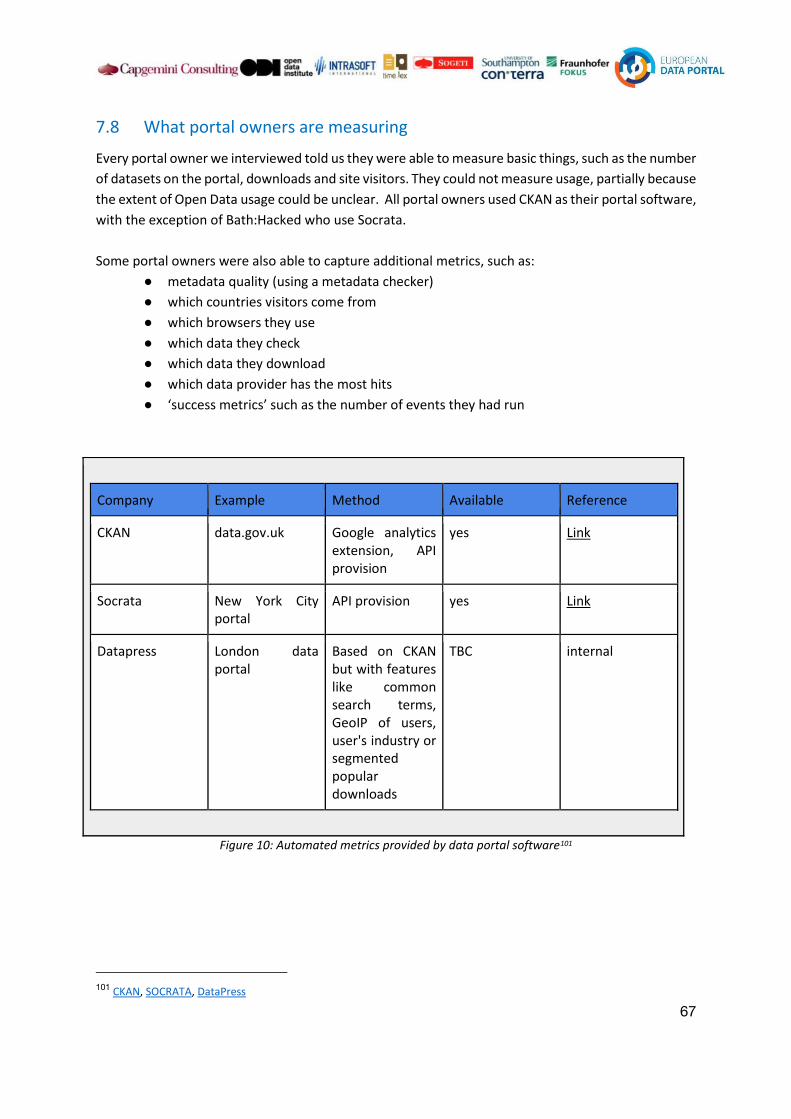
67
7.8 What portal owners are measuring
Every portal owner we interviewed told us they were able to measure basic things, such as the number
of datasets on the portal, downloads and site visitors. They could not measure usage, partially because
the extent of Open Data usage could be unclear. All portal owners used CKAN as their portal software,
with the exception of Bath:Hacked who use Socrata.
Some portal owners were also able to capture additional metrics, such as:
● metadata quality (using a metadata checker)
● which countries visitors come from
● which browsers they use
● which data they check
● which data they download
● which data provider has the most hits
● ‘success metrics’ such as the number of events they had run
Company Example Method Available Reference
CKAN data.gov.uk Google analytics extension, API provision
yes Link
Socrata New York City portal
API provision yes Link
Datapress London data portal
Based on CKAN but with features like common search terms, GeoIP of users, user's industry or segmented popular downloads
TBC internal
Figure 10: Automated metrics provided by data portal software101
101 CKAN, SOCRATA, DataPress

68
Figure 11: Screenshot of data.gov.uk site analytics dashboard102
7.9 What portal owners want to measure
Every portal owner we spoke to for this report told us they wanted to be able to measure re-use in
order to understand impact. A typical response was, ‘we want to know who is using our data and what
for. We want to know about apps built off the back of our data.’ The Norwegian portal owner summed
up the situation:
“We only have click rates and download rates. We can’t get use from that – only if you have APIs. I
compare it with a telephone book: if I get your number from a book, the telephone book is not aware
of how many times I use your number. We know number of apps because we invite them to tell us.”
Another told us they ‘would like to focus on how data is re-used’ and were developing an API for
tracking this.
Owners told us about several methods for trying to capture re-use, such as an initiative by
Datacampfire.com to capture stories, and experimental projects to monitor and trawl twitter for re-
use cases. However most portal owners settled with asking users to tell them when they reused data
from the portal to make things, because there were not suitable automated metrics available. Several
explained that there was a tension between wanting to understand users and their needs and wanting
to reduce barriers to accessing data as much as possible.
102 UK Open Data Portal, Site-usage

69
The next iteration of this report will explore further efforts to develop automated metrics for
measuring the use and impact of open data and their feasibility (see Next Steps).
In addition to discovering examples of re-use, portal owners face the challenge of trying to understand
their re-users. Open Data Maturity in Europe 2016 found that ‘only 48% of the countries with a
national Open Data portal have a basic overview of the typical profile of their visitors.’ Our research
supports this finding; most portal owners we spoke to explained why this was both important and
difficult. One respondent told us that they ‘would really like to capture the needs of people… [to]
mov[e] from metrics that capture supply towards demand.’ Another explained that, ‘you need
knowledge of your users’, so they ‘encouraged registration for accessing data’ but did not want it to
be mandatory.
The majority of portal owners told us they also wanted to measure:
● which datasets were accessed most frequently
● which combinations of datasets were accessed together
● which datasets were not updated
● the percentage of datasets that had open licences
● the percentage of datasets that were machine readable
● how many resources were downloaded
● how many geodata formats were downloaded
● the number of linked datasets the portal had
7.10 Overcoming challenges in automating metrics
Our research has shown attempts to measure and benchmark Open Data portals, related efforts by
the European Data Portal and projects such as OpenDataMonitor to automate metrics, what portal
owners can measure and what they would like to be able to measure.
Challenges remain to capture metrics, which must be addressed before automation can be
considered. These include:
● the potential gap between what metadata represents and how it is measured
● the need to quantify complex constructs
● the often missing information in the first place
● the potential for tensions between audiences and the issue of gaming metrics
● functionality and capability from platform providers
● the high cost in time and resources for building automation
● uncertainty about how future technological developments might affect automation
Despite all of this, we are seeing promising efforts from portal owners and a desire to measure much
more than they are currently capable of. Further work is needed to understand what portal owners
across other countries, cities and regions are doing to set and automate metrics for measuring their
success, and what they would like to measure, overlapped with a limitation in portal functionality.
70
Existing web analytics tools like the open-source analytics platform, Piwik103, and Google Analytics,
help to capture how frequently data portals are visited, for how long and whether users continue to
return to the portal as a useful source of data. Using web analytics to understand a site’s user base is
already common-place for content editors and web publishers. Similarly easy to use tools that
automate measures of data quality (in what format it is published, how it is updated and licensed) and
assess metadata quality will continue to evolve.
Different metrics for Open Data serve different audiences. Some help data publishers measure
themselves against other data publishers in comparable organisations and sectors. Others help to
guide end-users of data to data that is already widely used, or of a particular quality. Measures of
metadata quality help portal owners assess the extent to which data accessible via the portal is
discoverable and useful, and whether data publishers are complying with metadata standards.
While work on automated metrics continues to evolve towards widespread adoption, the varied
audiences for metrics is worth keeping in mind. This is reflected in the recommendations for this
section, which highlight the needs of both publishers and users:
● Choose metrics that help to benchmark data publisher performance, but do not rely on
one metric e.g. quantity. Combine quantity metrics with data quality and engagement
measures
● Choose metrics that help potential data users find data that is suitable for them to use.
Evaluate whether the metrics chosen are meaningful or potentially misleading.
Continuing to invest in automation of metadata quality assessments, like the MQA dashboard
developed by the EDP, provide a quick shorthand for portal owners to identify and respond to quality
issues. Making widely accepted metadata standards, like the Data Catalogue Vocabulary (DCAT) the
basis for measuring quality will help to accelerate uptake, and create a level playing field for data
publishers and users.
Metrics need to be integrated into the wider context so that they lead to decision-making and policy
formulation. Open Data is an agent for change, and when an organisation designs a theory of change,
the golden thread that runs through this is a well thought out monitoring and evaluation plan.
Understanding the desired impact and setting metrics to measure this, as well as plans for
sustainability, underpin such a strategy.
103 PIWIK

71
8. Conclusion
Open Data portals are an essential part of our data infrastructure. They connect data holders with
data users, who in turn create services that citizens benefit from and rely on.
They perform a wide range of functions – as platforms for publication, discovery, open government
and engagement, and policy compliance/monitoring – which portal owners have to balance. With
discovery of data on the web still in its infancy, Open Data portals will continue to perform these roles
for some time, though how they do so may change. If they function better, the benefits that they have
for citizens will increase.
Despite their critical role, most Open Data portals were not set up with sustainability in mind. They
were mostly created quickly as part of an emerging political movement without feasibility studies,
business case, strategy or user research. To move from setup to sustainability, Open Data portals need
to embed models and processes that allow them to best meet their goals, and respond and adapt to
the challenges they face.
Portals need robust governance frameworks that allow them to continue to operate effectively, even
as political priorities may change. Senior advocates, such as Chief Data Officers, can play a crucial role
as intermediaries between portals and data and budget-holders. To secure political support, portal
owners must have clear goals and set out what their portal will achieve. They can leverage further
support by demonstrating quick impacts in sectors that are prime for Open Data use. Portal owners
need to build strong relationships with user communities to identify these sectors.
Limited funding is a problem for many portals. To overcome this, portals owners should look for
multiple funding sources for different priorities such as training, support for publishers and user
engagement. They should develop evidence of the impact that funding has to support future petitions.
By clearly and openly explaining what they will achieve – and developing evidence to back it up –
portals can embed sustainable governance and financing models.
Portal owners can design their portals for sustainability by using open source software, linking data
from other catalogues and making data portable between catalogues – by developing standard APIs,
for instance – in order that it is most useful to users. Design decisions must balance the competing
functions a portal has, between being a platform for publishing and discovering data, for example.
Portal owners should be clear about their priorities and how these inform their decisions, as this will
help them to manage relationships with publishers, users and funders.
To create services that benefit citizens, data users need a reliable and consistent data supply. In order
to provide this, portal owners should adopt routine processes such as creating reports about quality,
responsiveness, accessibility, systematic issues and general operational processes. Many portals
operate with legacy systems and structures that were not built to be scalable. In assessing their
operational processes, portal owners should decide whether these are fit for purpose and petition to
fund updates if they are not.

72
Implementing change depends on the ability to monitor and evaluate progress. For Open Data portals,
metrics provide crucial insights into where to focus attention. Yet barriers remain to maximising their
effectiveness. Portal owners need to develop methods for measuring things that are difficult to
capture – such as user profiles, user demand and preferred formats. Whether open source platform
providers can play a greater role in this is an important question for future research. As portals scale
up, portal owners also have to develop a wider range of automated metrics.
These lessons apply to portals at all levels, from regional to national to supranational. The demands
that portals at different levels face are not the same. Small regional portals may be challenged to find
hosting solutions for storing data, whereas large national or supranational catalogues may have to
develop scalable processes for harvesting metadata. But the principles that underpin sustainability,
set out in this report, provide a framework with which to tackle different demands. They draw directly
on portal owners’ knowledge and experience of what has worked to propose common solutions to
embed sustainability.
This research will be reiterated at the end of 2017. We will be interviewing portal owners to keep track
of emerging patterns and developments and to test the usefulness of our recommendations. If you
would like to participate, or have any feedback, please get in touch.
Next Steps:
This report is the first of two which will look at the sustainability of Open Data portals. The second,
which will be published in late 2017, will draw on a wider research sample, surveying a larger number
of countries and comparing results. It will build on the findings set out here - what countries are doing
and how they are doing it - to provide more detailed and practical strategies for how countries can
become sustainable. As part of this, we will test the usefulness our recommendations with portal
owners, and update them based on the feedback we receive.
More specifically, the second report will explore several areas in further detail, including:
● how portals can tie the separate initiatives and measures described here into coherent
approaches to sustainability
● what portals can learn from updates others have made
● what funding models and approaches portals (operating in different national contexts)
can adopt to ensure long-term sustainability
● what impact different funding sources have on sustainability
● what efforts are or could be made to measure the reuse and impact of open data
automatically, and the technical and financial feasibility of setting up such metrics.
If you have any questions or comments on this report, or would like to be involved in the next iteration
of the research, please email [email protected].

73
Annex I - Definitions
Open Data repository: An online data storage/hosting service but with no discovery mechanism. This
could be as simple as a web server hosting static files from a single folder, with no additional index or
categorisation, except perhaps a 'landing page' for each dataset.
Open Data portal: Often used synonymously with ‘Open Data catalogue’, but may provide more
advanced discovery functionality to complement conventional browse-style catalogue interfaces. For
example, there may be text search over the metadata describing the datasets, or the ability to
preview/explore the data itself. Distinctions between ‘Open Data portals’ and ‘catalogues’, and
between ‘Open Data portals’ and ‘platforms’ should be considered to be blurred.
Open Data catalogue: A curated collection of metadata about datasets. Compared with ‘Open Data
repository’, ‘Open Data catalogue’ focuses on the organisation of datasets, while ‘Open Data
repository’ refers to the actual data storage. The catalogue would typically be agnostic regarding
where the data itself is located: (1) it may all be published on the same web server as the catalogue,
i.e. the catalogue contains a data repository, or (2) may be distributed across the web, with the
catalogue simply pointing to those remote locations, in which case the catalogue is also referred to as
a ‘data aggregator’ or ‘data indexer’.
Open Data platform: A piece of software that has implemented the core features to manage Open
Data. Those features include, but are not limited to, user management, data publishing, metadata
management, dataset storage, access control, search and visualisation, and so on.

74
Annex II – Interview questions
The script of questions used in the interviews is copied below. Please note that, while this provided a
template for the interviews, interviewers were not restricted to asking only or all of the following
questions in each interview.
Introduction
● Are you happy for this conversation being recorded and for approved quotes to be attributed?
● What is your level of involvement with your Open Data portal?
● What is the level of Open Data maturity in your country/sector/organisation?
● What are the main challenges you face with Open Data?
● How do you expect this to change over time?
● What measures have you taken to ensure your portal is sustainable?
● What are the key challenges you face in ensuring your portal is sustainable?
o How do you expect this to change over time?
Governance
● In your mind, what are the key principles of strategic governance and coordination for Open
Data portals?
● Where does management of the data portal sit in your organisational structure?
● What are your reasons for setting up a data portal?
o Do you have an Open Data policy and what does it say?
● Are you a data publisher as well as manager of the portal?
● How do you maintain the reliability of access to data on the portal?
● Can you enforce publication of certain kinds of data?
● What are you doing to address the legal aspects, regulations and compliance?
o How does that get maintained over time?
o What processes do you have in place to ensure the portal runs optimally?
o Are there any legal requirements that the portal enables you to satisfy?
● How would you describe your user community - large/small, active/non-active,
developers/civil society?
● Who are the key stakeholders that should be involved in a portal, and how do you manage
their needs?
● What is the governance model and is there a clear owner?
● Do you capture and share lessons learned as the portal is developed, launched, and
maintained? How?
● Do you have success metrics?

75
Financing
● How much has it cost to set up, launch, and maintain your portal?
o How does that break down?
o What about staff time?
● Which budget and from which organisations has that come from?
o How do you expect the way you fund it to change over the long-term?
● Are there business models for Open Data portals?
● What are the medium- and long-term financial implications of those business models?
o How do you expect this to change over time?
● Have you researched the benefits being created by Open Data portals and/or the Open Data
they make accessible?
● Who in the value chain receives those benefits?
Architecture
● What are the technical elements that must be in place for an Open Data portal to be
sustainable?
● What are the strengths and weaknesses of different types of portals (centralised,
decentralised, etc.)?
● What view do you take on linked data?
● What query time are you aiming for on your site?
● What is your view on portals storing data?
● What about portals providing visualisations of data sets?
● What are the key design decisions you have taken in balancing cost and performance?
● How many different formats do you provide for downloads (API, csv, etc?)
o How do you pick those formats?
o Which is most popular?
● How do you feel about the cloud and hosting?
o How do you expect this to change over time?
Operations
● What are the key processes required for the smooth running of a portal?
● What is the process for bringing new publishers onto the system?
o Do you have any non-public sector publishers? Did that method differ?
o What training do you provide for publishers?
o How is publishing on the Open Data portal built into the processes used by publishers?
● What is the process for publishing new data on the portal?
o How much of it is automated?
o How long does it take?
o Who can correct errors on the portal, such as broken links or missing metadata? How
do they do so?

76
o How do you deal with changes to the data published through the portal? What about
changes to the metadata?
● Can users request data through the portal? What is the relationship between requests for data
released via the portal and Freedom of Information requests?
● How do you maintain the reliability of access to data on the portal?
● How have the processes you use changed over time? How do you expect them to change in
the future?
● Which of the processes do you wish worked differently?
● What are the key methods of training and knowledge transfer e.g. documenting and sharing
past experiences so others can learn from the mistakes rather than repeating them?
○ How do you expect this to change over time?
Automated metrics
● What do you think are the key measures to keep track of your portal’s performance?
● What do you capture?
● How did you decide which metrics to measure?
● Are there any you would like to capture but can’t?
● Or ones you think are easy to capture but misleading?
● Were you aware of the research undertaken by the OpenDataMonitor project?
o What do you think of this approach?
Closing questions
● What do you think the future of Open Data portals looks like?
● Given all that you’ve said, how would you sum up the key factors in making open data portals
sustainable?