the open petroleum engineering journal · pdf file64 the open petroleum engineering journal...
TRANSCRIPT

Send Orders for Reprints to [email protected]
64 The Open Petroleum Engineering Journal, 2017, 10, 64-72
1874-8341/17 2017 Bentham Open
The Open Petroleum EngineeringJournal
Content list available at: www.benthamopen.com/TOPEJ/
DOI: 10.2174/1874834101701010064
RESEARCH ARTICLE
Gas Hydrate Formation Phase Boundary Behaviour of SyntheticNatural Gas System of the Keta Basin of Ghana
Eric Broni-Bediako1,*, Richard Amorin1 and Cornelius B. Bavoh2
1Department of Petroleum Engineering, University of Mines and Technology, Tarkwa, Ghana2Chemical Engineering Department, Universiti Teknologi Petronas (UTP), Seri Iskandar, Perak, Malaysia
Received: August 16, 2016 Revised: January 11, 2017 Accepted: January 20, 2017
Abstract:
Background:
Gas hydrates are considered as a major threat to the oil and gas flow assurance industry. At high pressure and low temperatureconditions, gas hydrates form in pipelines and production facilities leading to pipeline blockages, high removal cost, environmentalhazards and loss of lives. For a successful prevention of gas hydrate formation, predicting the hydrate formation phase boundary ofhydrocarbon fluid composition becomes very necessary.
Objective and Method:
In this study, computer simulation software called PVTSim was used to predict hydrate formation phase boundary of syntheticnatural gas composition of the Keta basin of Ghana at pressure and temperature ranges of 43.09 bar - 350 bar and 12.87 °C - 27.29°C respectively. The effect of changes in natural gas composition (N2 and H2S) and the presence of four commonly usedthermodynamic gas hydrate inhibitors (methanol, ethanol, diethylene glycol and monoethylene glycol) on the hydrate formationphase boundary is also discussed. Prior to the study, the accuracy of PVTSim was validated with the hydrate formation phase data inliterature.
Results and Conclusion:
Results suggested that the hydrate formation phase boundary decreased with increasing N2 composition and increased with increasingH2S composition, suggesting that, the presence of H2S increases the threat of hydrate formation. However, a reduction in hydrateformation threat was observed in the presence of all four commonly used gas hydrate thermodynamic inhibitors with methanoldemonstrating the highest inhibition effect.
Keywords: Gas hydrate, PVTSim, Phase boundary, Natural gas, Thermodynamics.
1. INTRODUCTION
The safe operation of oil and gas production facilities and pipelines is critical for successful oil and gas fieldoperations. The exploration and production of oil and gas activities in deep sea operations are exposed to certainpressure and temperature condition which can lead to gas hydrate formation and severe flow assurance problems inpipelines and facilities. The major flow assurance problem faced by companies is the formation of gas hydrates.According to Xiao-Sen et al. [1] the repairs of flow assurance in the oil and gas industry amount to over US$ 200 Mannually due to gas hydrate formation and aggregation. Gas hydrate plugs in pipelines do not only affect production, italso causes safety hazards due to the possibility of pressure build-up caused by the hydrate agglomeration. Since gashydrate formation is unacceptable in the oil and gas pipelines and production facilities, their prevention becomes
* Address correspondence to this author the Department of Petroleum Engineering, University of Mines and Technology, Box 237, Tarkwa, Ghana,Tel: +233 243 052 455; E-mails: [email protected], [email protected]

Gas Hydrate Formation Phase Boundary Behaviour The Open Petroleum Engineering Journal, 2017, Volume 10 65
necessary when they are formed. Prior to hydrate prevention, the knowledge and understanding of when hydrate willform are necessary, since gas hydrate formation condition is unique to every reservoir fluid composition. The discoveryof gas at the Keta basin of Ghana would be of great importance in the building of the Ghanaian economy. However, thesuccessive flow assurance production development of the field reservoir fluid will require the knowledge on theconditions at which gas hydrate will form in the system. In this study, PVTSim (computer simulation software) wasused to predict the hydrate formation phase boundary of a synthetic natural gas reservoir fluid composition of the Ketabasin of Ghana at pressure and temperature ranges of 43.09 bar - 350 bar and 12.87 °C - 27.29 °C respectively. Theeffects of changes in natural gas composition (N2 and H2S) and the presence of thermodynamic gas hydrate inhibitors onthe hydrate formation phase boundary are presented. This work is relevant to flow assurance production developmentand management of gas hydrate formation at the Keta basin of Ghana.
1.1. Overview of Gas Hydrate Formation
Gas hydrate is the trapping of gas molecules by hydrogen bonded water molecules at low temperature and highpressure condition [2]. Gas hydrates contain about 85 mol% of water cage-like molecules and are commonly formed inthree different types of structures; cubic structure I (sI), cubic structure II (sII) and hexagonal structure H (sH) as shownin Fig. (1). Gases such as CH4 and CO2 mostly form sI hydrates while natural gas forms sII hydrates [3, 4]. Hydratesonly form when water is combined with certain small molecules called “hydrate formers”. Among the commoncomponents in natural gas, methane, ethane, propane, isobutane, nitrogen, hydrogen sulphide, and carbon dioxide are allhydrate formers [5].
Fig. (1). Common gas hydrate crystal structures [6].
Gas hydrates have significant applications, as they are known as potential energy source that will replace fossil fuel[7]. In addition, they can be applied in other areas such as, gas storage and transportation [8, 9], sea water desalination[10] and CO2 capture and sequestration [11]. On the other hand, gas hydrate causes a lot of flow assurance problems.This includes; reduction of the internal diameter of tubular, flow restriction, increased surface roughness, increasedpumping pressure, reduced throughput, operational and safety problems, plugged surface flow lines, plugged tubing,production downtime, wear and tear of production tubing. All these problems may result in production losses,production shut downs and possible irreparable damage and hazardous conditions. In extensive cases, the plugged linewill be abandoned or replaced [12].
Prior to hydrate prevention, the knowledge and understanding of the nature of hydrate formation are critical tomaking the choices of design modification, initial prevention or neutralisation operations since gas hydrate formationcondition is unique to every reservoir fluid composition. The basic conditions for hydrate formation are low temperatureand high pressure [12, 13], which implies that, hydrates can only form at field operation temperatures lower than theequilibrium temperature and simultaneously at pressures higher than the equilibrium pressure of the reservoir fluid [14].
One most critical operation in oil and gas flow assurance is the prediction of the hydrate conditions at which gashydrates will form in production pipelines and facilities. According to Sloan and Koh [14], methods such as hand-calculation, empirical correlations, experimental and computer simulation method are available for predicting the gashydrate formation conditions in oil and gas production pipelines and facilities. The hand-calculation is basicallyaccurate for single gas system and has limited applicability, the empirical model (mostly based on the van der Waals-Platteew model) mostly face challenges in mixed gas predictions. Experimental method is the best but it’s much timeconsuming, costly, and needs very high precision and readily accessible apparatus. Therefore, computer simulation
Structure I Structure II Structure H

66 The Open Petroleum Engineering Journal, 2017, Volume 10 Broni-Bediako et al.
software, such as PVTSim, HYSYS etc. are mostly used by companies and researchers since they are less timeconsuming, very accurate and reliable and easily accessible [14]. In recent times, hydrate models based on ArtificialNeural Network (ANN) are proposed [15].
Generally, just as most (such as Parrish-Pransnitz model and the Du-Guo model) natural gas hydrate formation,thermodynamic conditions are developed from the van der Waals’ and Platteeuw model. Herath et al. [16] proposed aShortest Path of Hydrate Formation (SPHF) prediction method for predicting hydrate formation probability in a subseaproduction and transportation system, which is not based on van der Waals’ and Platteeuw model.
Currently water removal, depressurisation, heating and chemical inhibition are the available methods to preventhydrate formation, but chemical inhibition is currently used since it is economical and practically applicable than theother methods. Thermodynamic Hydrate Inhibitors (THIs) such as alcohols and glycols are injected to change thehydrate formation conditions of the hydrate free zone. THIs shift hydrate phase boundary to a lower temperature andhigher pressure by reducing the water activity, allowing the actual field operations outside Hydrate Stability Zone(HSZ) to have suffiecient inhibition. The type and amount of inhibitor needed to prevent hydrate is important in everyproduction flow assurance sector for economic and environmental reasons. THI are added at relatively highconcentrations of about 10 wt% - 60 wt% in the acqueous phase. Methanol and glycols are still actively used in theindustry for hydrate mitigation [17, 18].
There are several reported experimental and simulation studies on natural hydrates mitigation on different oil andgas fields in the world. For example in areas like China [19, 20], India (Krishna-Godavari basin) [21], Canada (Albertagas field) [22], Norway [23] etc. However, none has been reported on the Keta basin of Ghana.
Recently, Kim et al., [24] experimentally studied the inhibition effect of monoethylene glycol and NaCl solutions ofnatural gas (90.0 mol% CH4, 6.0 mol% C2H6, 3.0 mol% C3H8, and 1.0 mol% n-C4H10) hydrate formation. Theexperimental results were modelled using CSMGem. They suggested that, NaCl synergically increases the inhibitionimpact of MEG in an under-inhibition condition. Huang [20] reported the effect of CH4, N2, CO2 and condensate oil C6+
on hydrate formation conditions of wet-gases compositions from an offshore area in China. The study revealed that, theincrease in CH4 content lowered the hydrate formation temperatures of the wet-gases under the same pressure while thepresence of condensate oil C6+ showed inhibiting characteristic. However, N2 and CO2 showed negligible effect on thewet-gases systems. According to an experimental study by Lee and Kang [25] on natural gas hydrate of systemscontaining CH4, C2H6, C3H8, CO2 or H2S in the presence of MeOH, MeOH inhibited all studied systems but varied basedon phase behaviour of each system due to different compositions. The inhibition of MeOH was least in the presence ofH2S as it expanded the hydrate forming zone. Furthermore, Obanijesu et al. [26] studied that the presence of H2 and N2
in a natural gas could inhibit hydrate formation due to the pressure conditions for hydrate formation, with H2 showinghigher significant effect than N2. Rajnauth et al. [27] evaluated the effect of temperature, pressure, impurities (CO2, H2Sand N2) and water on gas hydrate formation of 21 natural gas systems using PVTSim. The study suggested that, CO2 andH2S decrease the pressure/temperature equilibrium while nitrogen increases it. Prior to the study, a PVTSim sensitivityanalysis was performed to validate the theoretical model and ensure reliable predictions. Ward et al. [28] studied thehydrate equilibrium phase of H2S experimentally and validated his work using PVTSim and reported that, PVTSimcould be accurately used for H2S hydrate equilibrium phase studies. In addition, Sule and Rahman [29] predicted thehydrate equilibrium phase of natural gas in the presence of H2S and inhibitor (methanol) using PVTSim. Their resultssuggested that PVTSim gives accurate prediction. More so, the presence of H2S increased the hydrate formation threatin the studied natural gas systems. However, as mentioned earlier, hydrate formation treats are composition dependent.Thus, the hydrate phase behaviour for every reservoir fluid composition is needed to a successful field operation.Therefore, it is promising to perform such studies on the natural gas composition of the Keta basin of Ghana to helpovercome field operational natural gas hydrate formation challenges.
2. MATERIALS AND METHODS
Table 1 shows the synthetic natural gas system of Keta basin and the experimental natural gas system taken fromliterature [30]. The data obtained from literature were used to validate the accuracy of PVTSim. PVTsim softwarepackage version 21 developed by Calsep was used for all the natural gas hydrate equilibrium phase predictions in thiswork. PVTSim is widely used to predict and simulate fluid properties as a function of temperature, pressure, volume,and composition using cubic Equations of State (EOS) [31].
In PVTSim, the natural gas hydrate phase condition predictions are modelled as proposed by Munck et al. [32],

Gas Hydrate Formation Phase Boundary Behaviour The Open Petroleum Engineering Journal, 2017, Volume 10 67
which is derived from the van der Waals’ and Platteeuw model and adapts the Langmuir adsorption theory fordetermining natural gas molecule occupying a cavity in the hydrate structure. The modified Peng-Robinson (PR)equation of state with the Peneloux volume correction parameter is used by PVTSim to calculate the fugacity parameterin the Langmuir equation.
Table 1. Natural gas systems.
Gas Synthetic Keta Natural Gas System Natural Gas System (ref [30])Composition
(mol %)Composition
(mol %)N2 1.016 0.04
CO2 0.853 -H2S 1.191 -C1 59.339 89.86C2 6.752 6.40C3 7.768 2.71iC4 1.659 0.48nC4 4.077 0.49iC5 2.032 -nC5 2.324 0.02C6 1.437 -C7 2.266 -C8 3.177 -C9 3.154 -C10 2.955 -Total 100 100
The simulation was done by inputting each natural gas system in Table 1 into PVTSim and the hydrate phaseconditions data was predicted using Peng-Robinson (P-R) equation of state. The hydrate phase boundary pressures andtemperatures in the range of study (43.09 bar - 350 bar and 12.87 - 27.29 °C) were generated in the PVTSim and plottedin a P-T graph for each natural gas system for analysis. These pressures and temperatures conditions were selected tocover a wide range of normal industrial operational conditions. In order to study the effect of changes in N2 and H2S onthe hydrate phase boundary of the Keta natural gas system, the N2 and H2S composition was increased by 5 mol% and10 mol% and their respectively hydrate phase boundary pressures and temperatures were generated. N2 and H2S wereselected, as they are generally considered as impurities in natural gas streams, and since their compositions in Table 1are slightly above 1 mol%, it’s appropriate to study their possible compositional increasing effect on the Keta naturalgas composition. Furthermore, the effect of four commonly used thermodynamic gas hydrate inhibitors; namely,methanol, ethanol, diethylene glycol and monoethylene glycol were studied on the Keta natural gas composition at aconcentration of 10 wt%. The studied concentration (10 wt%) was chosen as it falls within the normal range industryinhibitor application as reported by Yussof et al. [33] as 24 wt%.
3. RESULTS AND DISCUSSION
In order to validate the accuracy of PVTSim, the experimental hydrate equilibrium point of the natural gas system[30], as shown in Table 1 was predicted in PVTSim and compared accordingly. From Fig. (2), the PVTSim predicteddata agreed with the experimental data with an Average Absolute Error (AAE) of 0.5. This validates the accuracy ofPVTSim in simulating the hydrate equilibrium phase of the synthetic natural gas composition of Keta basin.
3.1. PVTSim Hydrate Equilibrium Phase Predictions
The PVTSim predicted hydrate equilibrium phase boundary curve of the synthetic natural gas reservoir fluid of Ketabasin is shown in Fig. (3). From Fig. (3), pipeline and facilities operating pressures and temperatures to the right-handside suggest hydrate free field operations while to the left-hand side of the curve suggests hydrate formation threats infield operations.

68 The Open Petroleum Engineering Journal, 2017, Volume 10 Broni-Bediako et al.
3.2. Effect of N2 and H2S Composition on the Hydrate Equilibrium Phase Boundary
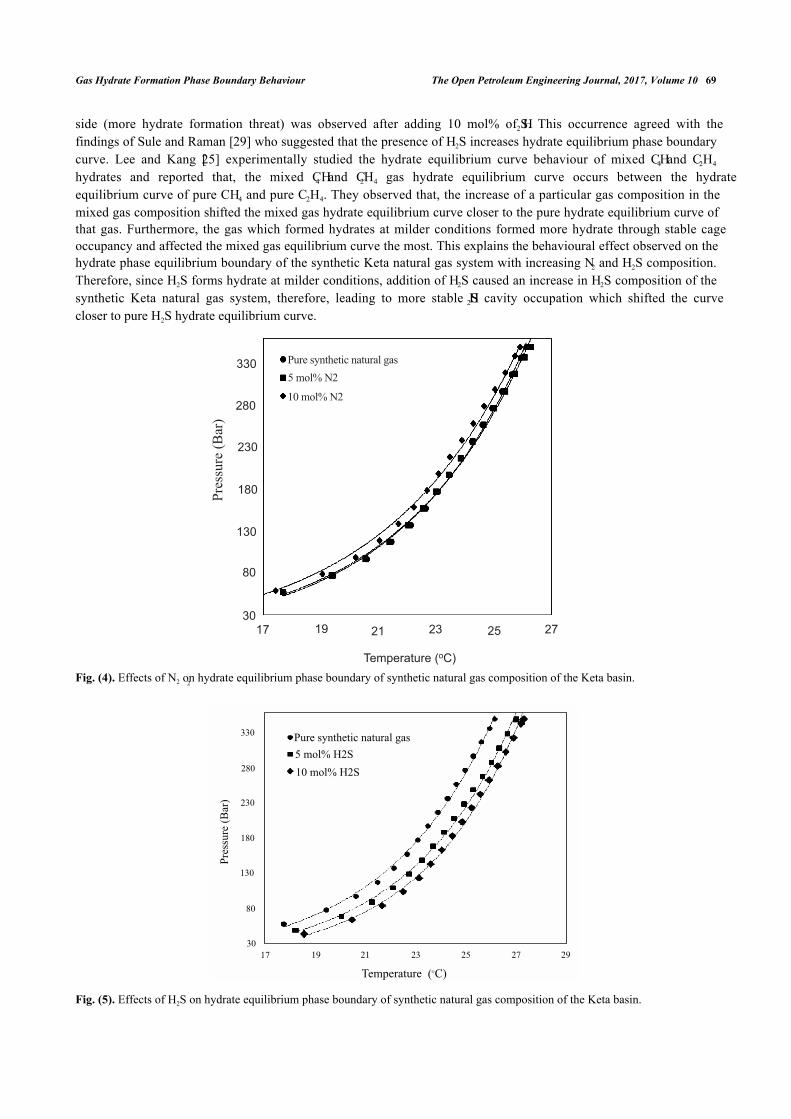
Natural gas consists primarily of methane, however, depending on the field location and production life of the field,impurities such as N2 and acids gas (CO2 and H2S) may be present or may have their composition increased. In suchcases the hydrate phase boundary of the new composition is necessary for safe operations and/or mitigation of hydratethreat since changes in natural gas composition affects hydrate equilibrium curve phase. Fig. (4) shows the effect ofincreasing N2 composition at 5 mol% and 10 mol% on the Keta synthetic natural gas system. From Fig. (4), the additionof 5 mol% of N2 showed negligible effect on the hydrate equilibrium curve. However, the addition of 10 mol% of N2
caused the curve to shift slightly to high pressures and low temperatures region, thereby reducing gas hydrate formationthreat in the system. This phenomenon according to Sloan and Koh [14], is because less N2 is involve in cageoccupancy since N2 requires very higher pressures and low temperatures to form hydrates [34].
Fig. (2). Experimental and PVTSim predicted hydrate equilibrium phase boundary of natural Gas system [30].
Fig. (3). Hydrate equilibrium phase boundary of synthetic natural gas composition of the Keta basin.
H2S is an acidic gas which changes natural gas composition into sour gas. It is highly soluble in water and formshydrates at the lowest pressure and persist to the highest temperatures [5]. According to Carroll [5], sour gas morereadily forms a hydrate than sweet gas. From Fig. (5), the addition of 5 mol% of H2S shifted the curve to a hightemperature and low pressure regions increasing hydrate formation threat in the system. A further shift to the right-hand
��
��
��
��
��� � �� � ��
�� ������������
���������� ���
���������������������
���������
�������� �!
���
�������� �!
���
���
���
���
��
���� �� �� �� �� ��
�� ������������
����������������������
�����������������
Gas Hydrate Formation Phase Boundary Behaviour The Open Petroleum Engineering Journal, 2017, Volume 10 69
side (more hydrate formation threat) was observed after adding 10 mol% of H2S. This occurrence agreed with thefindings of Sule and Raman [29] who suggested that the presence of H2S increases hydrate equilibrium phase boundarycurve. Lee and Kang [25] experimentally studied the hydrate equilibrium curve behaviour of mixed CH4 and C2H4
hydrates and reported that, the mixed CH4 and C2H4 gas hydrate equilibrium curve occurs between the hydrateequilibrium curve of pure CH4 and pure C2H4. They observed that, the increase of a particular gas composition in themixed gas composition shifted the mixed gas hydrate equilibrium curve closer to the pure hydrate equilibrium curve ofthat gas. Furthermore, the gas which formed hydrates at milder conditions formed more hydrate through stable cageoccupancy and affected the mixed gas equilibrium curve the most. This explains the behavioural effect observed on thehydrate phase equilibrium boundary of the synthetic Keta natural gas system with increasing N2 and H2S composition.Therefore, since H2S forms hydrate at milder conditions, addition of H2S caused an increase in H2S composition of thesynthetic Keta natural gas system, therefore, leading to more stable H2S cavity occupation which shifted the curvecloser to pure H2S hydrate equilibrium curve.
Fig. (4). Effects of N2 on hydrate equilibrium phase boundary of synthetic natural gas composition of the Keta basin.
Fig. (5). Effects of H2S on hydrate equilibrium phase boundary of synthetic natural gas composition of the Keta basin.
2
���
���
���
���
���
��
���� �� �� �� � �� ��
�� ��������������
���������������������������� �!�"�#
���� �!�"�#
����������$
���
�������� �!
���
�� ������������
���
���
���
���
��
���� �� �� �� �� ��
�����"��#��� ��������$��
���%�&�'(
)���%�&�'(

70 The Open Petroleum Engineering Journal, 2017, Volume 10 Broni-Bediako et al.
3.3. Effect of Inhibitors on the Hydrate Equilibrium Phase Boundary
The effect of commonly used oil and gas industry thermodynamic gas hydrate inhibitors namely; methanol, ethanol,monoethylene glycol and diethylene glycol on the synthetic natural gas system of Keta basin were studied and presentedin Fig. (6). All the gas hydrate inhibitors used in the study reduced hydrate formation threat in the system at 10 wt% byshifting the hydrate equilibrium curve to high pressures and lower temperatures region. Generally, the alcohol basedinhibitors showed high inhibition than glycol based, with methanol showing the highest inhibition impact. Theincreasing order of inhibition impact of studied inhibitors is; diethylene glycol < monoethylene glycol < ethanol <methanol. This implies that, among all the inhibitors used in this work, methanol is the best thermodynamic gas hydrateinhibitor, to inhibit gas hydrate formation of the synthetic Keta natural gas composition system.
Fig. (6). Effects of commonly used inhibitors on hydrate equilibrium phase boundary of synthetic natural gas composition of theKeta basin.
CONCLUSION
The hydrate equilibrium phase boundary behaviour of a synthetic natural gas composition of Keta basin in Ghana ispredicted at pressure and temperature ranges of 43.09 bar - 350 bar and 12.87 °C - 27.29 °C, respectively, usingPVTSim version 21. Prior to the simulation the accuracy of PVTSim was validated by predicting the experimentalhydrate equilibrium data in open literature with an AAE of 0.5. From the study, the following conclusions can bedrawn:
The addition of 5 mol% of N2 has negligible effect on the hydrate phase equilibrium curve of the synthetici.natural gas, but a further increase of N2 composition to 10 mol% slightly reduces hydrate formation threat in thesystem.The addition of H2S increases gas hydrate formation threat in the system with increasing H2S concentration.ii.The magnitude of increasing inhibition of commonly used industrial thermodynamic gas hydrate inhibitors wasiii.in the order of diethylene glycol < monoethylene glycol < ethanol < methanol. This implies that, among allstudied inhibitors in this work, methanol is the best thermodynamic gas hydrate inhibitor, to inhibit gas hydrateformation of the synthetic Keta natural gas composition system.
The finding in this work is relevant in ensuring hydrate free operation in the development and production of oil andgas at the Keta basin of Ghana.
CONFLICT OF INTEREST
The authors confirm that this article content has no conflict of interest.
�
��
�
��
�
��
�� � �� �
�� �������������
��������������������������%����� �% � ������������� �&�������������� �'���� �
����������$
���

Gas Hydrate Formation Phase Boundary Behaviour The Open Petroleum Engineering Journal, 2017, Volume 10 71
ACKNOWLEDGEMENTS
The authors are very grateful to the Petroleum Engineering Department of University of Mines and Technology(UMaT), Tarkwa, Ghana for supporting this research.
REFERENCES
[1] X.S. Li, Y.J. Liu, Z.Y. Zeng, Z.Y. Chen, G. Li, and H.J. Wu, "Equilibrium hydrate formation conditions for the mixtures of methane + ionicliquids + water", J. Chem. Eng. Data, vol. 56, pp. 119-123, 2011.[http://dx.doi.org/10.1021/je100987q]
[2] C.A. Koh, E.D. Sloan, A.K. Sum, and D.T. Wu, "Fundamentals and applications of gas hydrates", Annu. Rev. Chem. Biomol. Eng., vol. 2, pp.237-257, 2011.[http://dx.doi.org/10.1146/annurev-chembioeng-061010-114152] [PMID: 22432618]
[3] G.A. Jeffery, "Pentagonal dedecahedral water structure in crystalline hydrates", Mater. Res. Bull., vol. 7, pp. 1259-1270, 1972.[http://dx.doi.org/10.1016/0025-5408(72)90105-5]
[4] G.A. Jeffrey, "Hydrate inclusion compounds", J. Incl. Phenom., vol. 1, no. 3, pp. 211-222, 1984.[http://dx.doi.org/10.1007/BF00656757]
[5] J. Carroll, Natural Gas Hydrates A Guide for Engineers, 3rd ed. Elsevier: Amsterdum, Netherland, 2014.
[6] C.B. Bavoh, B. Partoon, L.K. Keong, B. Lal, and C.D. Wilfred, "Effect of 1-Ethyl-3- methylimidazolium chloride and polyvinylpyrrolidoneon kinetics of carbon dioxide hydrates", Int. J. Appl. Chem., vol. 12, no. 1, pp. 6-11, 2016.
[7] P. Englezos, "Clathrates hydrates", Ind. Eng. Chem. Res., vol. 32, pp. 1251-1274, 1993.[http://dx.doi.org/10.1021/ie00019a001]
[8] B. Lucia, B. Castellani, F. Rossi, F. Cotana, E. Morini, A. Nicolini, and M. Filipponi, "Experimental investigations on scaled-up methanehydrate production with surfactant promotion: Energy considerations", J. Petrol. Sci. Eng., vol. 120, pp. 187-193, 2014.[http://dx.doi.org/10.1016/j.petrol.2014.06.015]
[9] B. Nastasi, and G.L. Basso, "Hydrogen to link heat and electricity in the transition towards future smart energy systems", Energy, vol. 110,pp. 5-22, 2016.[http://dx.doi.org/10.1016/j.energy.2016.03.097]
[10] K.C. Kang, P. Linga, K.N. Park, S.J. Choi, and J.D. Lee, "Seawater desalination by gas hydrate process and removal characteristics ofdissolved ions (Na+, K+, Mg2+, Ca2+, B3+, Cl-, SO4
2-)", Desalination, vol. 353, pp. 84-90, 2014.[http://dx.doi.org/10.1016/j.desal.2014.09.007]
[11] P. Babu, P. Linga, R. Kumar, and P. Englezos, "A review of the hydrate based gas separation (HBGS) process for carbon dioxide pre-combustion capture", Energy, vol. 85, pp. 261-279, 2015.[http://dx.doi.org/10.1016/j.energy.2015.03.103]
[12] O.T. Olabisi, I.S. Sunday, and D. Appah, "LPG hydrate formation and prevention using ethanol and methanol", Soc. Pet. Eng., pp. 1-8, 2015.[http://dx.doi.org/10.2118/178333-MS]
[13] P.F. Worthington, "Petrophysical evaluation of gas hydrates formation, I", In: International Petroleum Technology Conference, IPTC 12610,Kuala Lumpur, Malaysia, 2008, pp. 1-11.[http://dx.doi.org/10.2523/12610-MS]
[14] E.D. Sloan, and C.A. Koh, Clathrate Hydrates of Natural Gases, 3rd ed. CRC Press: Baca Raton, 2007.[http://dx.doi.org/10.1201/9781420008494]
[15] S.M. Hesami, M. Dehghani, Z. Kamali, and A.E. Bakyani, "Developing a simple-to-use predictive model for prediction of hydrate formationtemperature", Int. J. Ambient Energy, vol. 750, pp. 1-9, 2016.[http://dx.doi.org/10.1080/01430750.2015.1100678]
[16] D. Herath, F. Khan, S. Rathnayaka, and M.A. Rahman, "Probabilistic estimation of hydrate formation", J. Petrol. Sci. Eng., vol. 135, pp.32-38, 2015.[http://dx.doi.org/10.1016/j.petrol.2015.08.007]
[17] K.A. Bullin, and J.A. Bullin, "Optimizing methanol usage for hydrate inhibition in a gas gathering system", In: GPA Annu. Conv. Proc, 2004,pp. 1-10.
[18] J. Yang, A. Chapoy, S. Mazloum, B. Tohidi, and G. Hydrate, "A novel technique for monitoring hydrate safety margin", SPE 143619, pp.23-26, 2012.
[19] R. Sun, C. Li, S. Yu, S. Wang, O. Sun, and E. Liu, "Hydrate formation conditions of natural gas with high content of carbon dioxide and thecalculation model", Soc. Pet. Eng. - Int. Oil 505 Gas Conf. Exhib. China 2010, IOGCEC, vol. 3, no. 2006, pp. 2407-2414, 2010.[http://dx.doi.org/10.2118/131812-MS]
[20] M. Huang, "Simulation of hydrate formation and inhibition in submarine wet-gas pipeline", Proc. Twent. Int. Offshore Polar Eng. Conf., vol.7, pp. 20-25, 2010.
[21] G. Gupta, and S.K. Singh, "Hydrate inhibition - Optimization in deep water field", Soc. Pet. 513 Eng. - SPE Oil Gas India Conf. Exhib. 2012,

72 The Open Petroleum Engineering Journal, 2017, Volume 10 Broni-Bediako et al.
514 OGIC - Further, Deep. Tougher Quest Contin., pp. 311-317, 2012.[http://dx.doi.org/10.2118/153504-MS]
[22] D. Budd, D. Hurd, M. Pakulski, and T. D. Schaffer, "SPE 90422 enhanced hydrate inhibition in Alberta gas field," SPE, 2004.
[23] H. E. Christiansen, "Rate of Hydrate Inhibitor in Long Subsea Pipelines", M.S. thesis, Institutt for Petroleum Steknologi og AnvendtGeofysikk, Norway, 2012.
[24] K.-J. Kim, B.-Y. Yi, N.-K. Kang, and D.-G. Yoo, "Reservoir characterization of gas hydrate in the Northwestern part of the Ulleung Basin,East Sea", Mar. Georesour. Geotechnol., vol. 618, pp. 1-10, 2016.[http://dx.doi.org/10.1080/1064119X.2016.1139644]
[25] J.W. Lee, and S.P. Kang, "Formation behaviours of mixed gas hydrates including olefin compounds", Chem. Eng. Trans., vol. 32, no. 1997,pp. 1921-1926, 2013.[http://dx.doi.org/10.3303/CET1332321]
[26] M. Chul, S. Bin, J. Yoon, M. Kim, and Y. Yoon, "Experimental study on the effect of N2, CO2, and steam dilution on the combustionperformance of H2 and CO synthetic gas in an industrial gas turbine", Fuel, vol. 102, pp. 431-438, 2012.[http://dx.doi.org/10.1016/j.fuel.2012.05.028]
[27] J. Rajnauth, M. Barrufet, and G. Falcone, "Hydrate formation: Considering the effects of pressure, temperature, composition and water", 72ndEur. Assoc. Geosci. Eng. Conf. Exhib. 2010 A New Spring Geosci. Inc. SPE Eur. 2010, vol. 2, pp. 824-833, 2010.[http://dx.doi.org/10.2118/131663-MS]
[28] Z.T. Ward, C.E. Deering, R.A. Marriott, A.K. Sum, E.D. Sloan, and C.A. Koh, "Phase equilibrium data and model comparisons for H2Shydrates", J. Chem. Eng. Data, vol. 60, pp. 403-408, 2014.[http://dx.doi.org/10.1021/je500657f]
[29] I. Sule, and A. Rahman, "Phase behaviour of hydrate formations in oil and gas production in subsea conditions", Ocean - St. John’s, Ocean.2014, 2015.[http://dx.doi.org/10.1109/OCEANS.2014.7003287]
[30] J.W. Lee, and S.P. Kang, "Phase equilibria of natural gas hydrates in the presence of methanol, ethylene glycol, and NaCl aqueous solutions",Ind. Eng. Chem. Res., vol. 50, no. 14, pp. 8750-8755, 2011.[http://dx.doi.org/10.1021/ie2001814]
[31] O.G. Avaldsnes, T. Barth, and P. Fotland, "An Analysis of CO2, CH4 and Mixed CO2 -CH4 Gas Hydrates: Experimental Phase EquilibriaMeasurements and Simulations with State-of-the-Art Software", M.S. thesis, The University of Bergen, Norway, 2014.
[32] J. Munck, S. Skjold-Jørgensen, and P. Rasmussen, "Computations of the formation of gas hydrates", Chem. Eng. Sci., vol. 43, pp. 2661-2672,1988.[http://dx.doi.org/10.1016/0009-2509(88)80010-1]
[33] M.H. Yousif, "Effect of underinhibition with methanol and ethylene glycol on the hydrate-control process", SPE Prod. Facil., vol. 13, pp.184-189, 1998.[http://dx.doi.org/10.2118/50972-PA]
[34] D. Lim, H. Ro, Y. Seo, Y.J. Seo, J.Y. Lee, S.J. Kim, J. Lee, and H. Lee, "Thermodynamic stability and guest distribution of CH4/N2/CO2
mixed hydrates for methane hydrate production using N2/CO2 injection", J. Chem. Thermodyn., vol. 106, pp. 16-21, 2017.[http://dx.doi.org/10.1016/j.jct.2016.11.012]
© 2017 Broni-Bediako et al.
This is an open access article distributed under the terms of the Creative Commons Attribution 4.0 International Public License (CC-BY 4.0), acopy of which is available at: https://creativecommons.org/licenses/by/4.0/legalcode. This license permits unrestricted use, distribution, andreproduction in any medium, provided the original author and source are credited.