the optimum location of reinforcement …€¦ · · 2016-10-10embedment depth at (u=0.5b),...
TRANSCRIPT
http://www.iaeme.com/IJCIET/index.asp 284 [email protected]
International Journal of Civil Engineering and Technology (IJCIET) Volume 7, Issue 5, September-October 2016, pp. 284–291, Article ID: IJCIET_07_05_031
Available online at http://www.iaeme.com/IJCIET/issues.asp?JType=IJCIET&VType=7&IType=5
ISSN Print: 0976-6308 and ISSN Online: 0976-6316
© IAEME Publication
THE OPTIMUM LOCATION OF REINFORCEMENT
EMBANKMENT USING 3D PLAXIS SOFTWARE
Dr. Alaa Hussein Abed
Assistant Professor, Al-Nahrain University,
Civil Engineering, Iraq.
Anas Mohammed Hameed
Al-Nahrain University,
Civil Engineering, Iraq.
ABSTRACT
Geo synthetics reinforcement in geotechnical layers are used to increase stiffness, separation,
filtration, drainage, and protection of soil. The Target of this study is to find the optimum geo
synthetic reinforcement depth of embankment using (PLAXIS 3D) software. A series of plane strain
models are used to simulate reinforcement sand slopes under surface loading (footing).
The analysis shows that settlement behavior of embankment improved by include geo synthetic
reinforcement layer as interface at the appropriate location in the fill slope. It is founded that placing
reinforcement as (0.5) times the width of the footing is the best position to reduce maximum settlement
of geo synthetic reinforcement slop embankment.
Key words: Geo synthetics, Embankment, Reinforcement, PLAXIS 3D.
Cite this Article: Dr. Alaa Hussein Abed and Anas Mohammed Hameed, The Optimum Location of
Reinforcement Embankment using 3D PLAXIS Software. International Journal of Civil Engineering
and Technology, 7(5), 2016, pp.284–291.
http://www.iaeme.com/IJCIET/issues.asp?JType=IJCIET&VType=7&IType=5
1. INTRUODICTION
In recent years, many structures are constructed on the slope embankment, such as buildings and roads on
hilly regions. The bearing capacity of sloped embankment will be reduced and settlement increase as
comparing with the loading on horizontal embankment, high tension strength of geo synthetic material are
used in the field to stabilize embankments or existing slopes to sustain traffic loading or heavy structures.
An understanding of the behavior of loaded reinforced slope with a surface footing is of practical importance
to geotechnical engineers.
The main purposes of this investigation are to examine some salient aspects that influence on the
performance of a strip footing loading on a granular slope by including a single layer of geo grid or geotextile
reinforcement.
Many researches such as Selvadurai and Gnanendran (1989), K.M. Lee and V.R. Manjunath (2000),
study the mechanisms of geo synthetic reinforcement of the slope embankment.

Dr. Alaa Hussein Abed and Anas Mohammed Hameed
http://www.iaeme.com/IJCIET/index.asp 285 [email protected]
Finite element analysis using (3D-Plaxis) software is used in this research, different models are carried
out to investigate the settlement of a plane strain rigid footing on slope embankment and verified with
experimental data.
2. MODELING USING FINITE ELEMENT MESHAND OUNDARYCONDITIONS
Experimental work done by Lee and Manjunath (2000) on embankment was chosen to verify finite model
in this study. This model include two type of soils, natural and geo grid reinforcement soils, different geo
grid locations at different depth (U/B=0.25, 0.5, 0.75, 1) from surface is used, when U is the embedment
depth of geo grid reinforcement and B is the width of footing, the dimensions of embankment, 1800mm long
(x-direction), 900mm wide (y-direction), 1000mm height(z-direction), the footing (surface load) width
100mm with long 900mm place at distance 100mm from edge of embankment (De/B=1), and for
embankment slope using (2H: 1V),as shown in Figures (1) and (2).
Figure 1 Numerical model of embankment by 3D Plaxis software program
Figure 2 Side view of embankment
According to model dimension, medium mesh generation was created and refined at the embankment
model and the reinforcement geo synthetic to allow short phase time phase to attain greater accuracy in the
beginning of plastic analysis. The mesh consists of over (6708) elements (10-node tetrahedrons) with over
(10394) nodes with average element size nearly (0.01554m) as shown in the Figure (3).

The Optimum Location of Reinforcement Embankment using 3D PLAXIS Software
http://www.iaeme.com/IJCIET/index.asp 286 [email protected]
Figure 3 Distribution of node and element of modeling in 3D Plaxis software program
3. CONSTITUTIVEMODELSANDMATERIALPARAMERTES
Hardening model of soil was used to simulate the sand slope embankment soil material. Plastic analysis was
conducted to simulate an embankment. These constitutive models were verified with experimental data of
Lee and Manjunath (2000).Parameters for the bench mark case are listed in Table (1) which is the same
parameters that adopted in this research.
Geo synthetics reinforcement is used to enhance load carrying capacity and reduces vertical deformation.
Linear elastic model is selected to simulate behavior geo grid model. Two interfaces were product for each
geo grid, the first outside the geo grid (positive interface) between geo grid and soil upward the geo grid
carrying the soil properties, and the second one inside the geo grid (negative interface) between geo grid and
soil underneath the geo grid carrying this soil property. Interfaces are composed of 12-node elements, six
pairs of nodes, compatible with the 6-noded triangular sides of the soil (Brinkgreve et al, 2013).
Table 1 Material parameters for the numerical analyses,(K.M. Lee and V.R. Manjunath 2000)
Parameter Sand top layer Sand bottom layer Geogrid
Unsaturated unit weight ,γunsat (KN/m3) 18.2 18.2
Saturated unit weight, γsat (KN/m3) 21.02 21.02
Material model Hardening soil Hardening soil
Drainage type Drained Drained
E50 ref (KPa) 35 000 60 000
Eoed ref (KPa) 35 000 60 000
Eur ref (KPa) 105 000 180 000
Power in stiffness laws, m 0.8 0.8
Unloading–reloading Poisson’s ratio ν 0.3 0.3
Cohesion , C (KN/m2) 1 1
Friction angle , φ (°) 36 38
Angle of dilatancy, Ψ (°) 3 10
Interface reduction factor, Rinter 0.75 1
Axial stiffness , EA (KN/m) 68
Dr. Alaa Hussein Abed and Anas Mohammed Hameed
http://www.iaeme.com/IJCIET/index.asp 287 [email protected]
4. NUMERICAL ANALYSIS PREOCEDURE
The numerical modeling consisted of four steps, the first step was initial geostatic equilibrium, the second
steps was modeling the embankment depend on dimension of model and material parameters as shown in
Table 1, the third steps mesh generation, the last step was modeling surface loading pressure (10, 20, 30, 40,
50 and 60) kpa of footing at the top of embankment. In case of modeling untreated embankment, modeling
treated embankment with reinforcement and interface element phase was added. Plastic calculation type was
used in all steps.
5. RESULT AND ANALYSIS
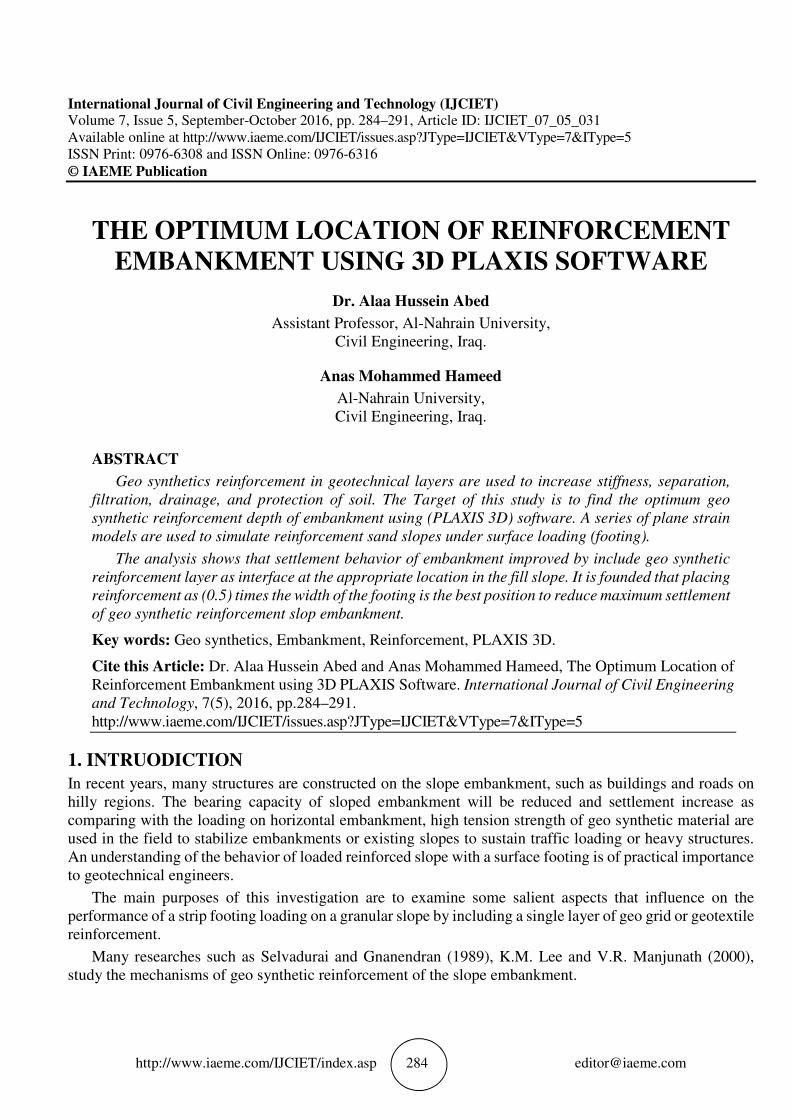
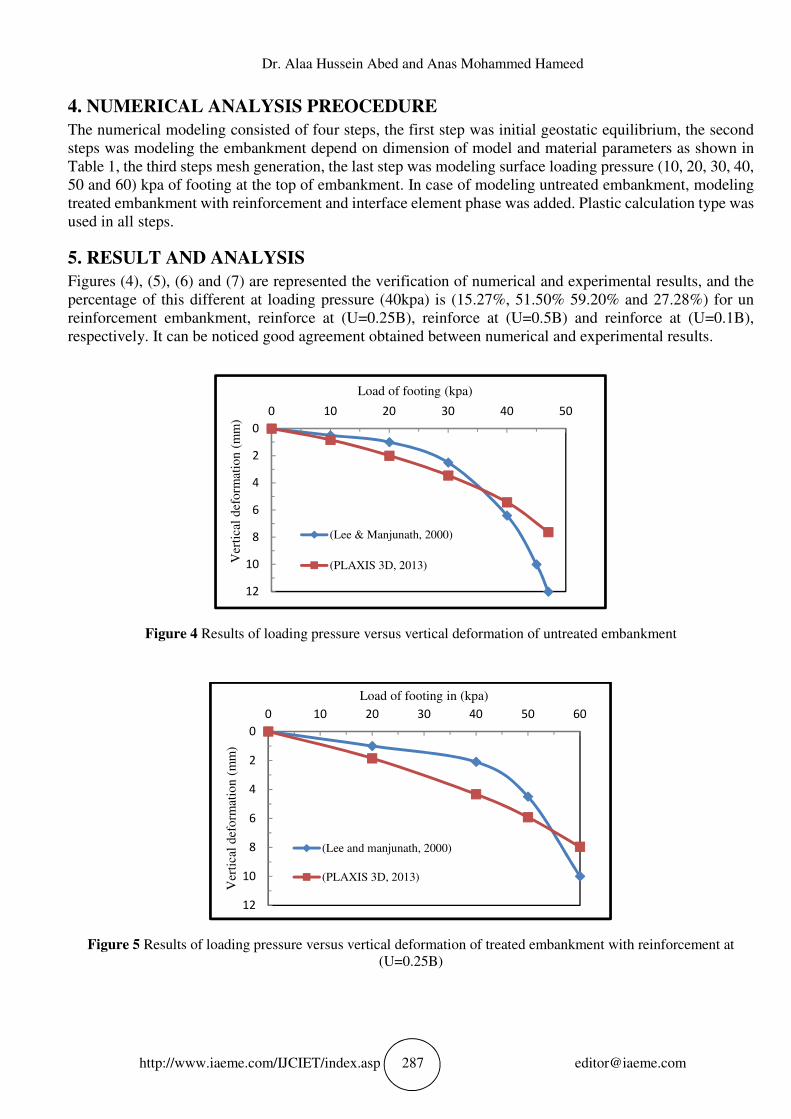
Figures (4), (5), (6) and (7) are represented the verification of numerical and experimental results, and the
percentage of this different at loading pressure (40kpa) is (15.27%, 51.50% 59.20% and 27.28%) for un
reinforcement embankment, reinforce at (U=0.25B), reinforce at (U=0.5B) and reinforce at (U=0.1B),
respectively. It can be noticed good agreement obtained between numerical and experimental results.
Figure 4 Results of loading pressure versus vertical deformation of untreated embankment
Figure 5 Results of loading pressure versus vertical deformation of treated embankment with reinforcement at
(U=0.25B)
0
2
4
6
8
10
12
0 10 20 30 40 50
Ver
tica
l d
efo
rmat
ion (
mm
)
Load of footing (kpa)
(Lee & Manjunath, 2000)
(PLAXIS 3D, 2013)
0
2
4
6
8
10
12
0 10 20 30 40 50 60
Ver
tica
l d
efo
rmat
ion (
mm
)
Load of footing in (kpa)
(Lee and manjunath, 2000)
(PLAXIS 3D, 2013)

The Optimum Location of Reinforcement Embankment using 3D PLAXIS Software
http://www.iaeme.com/IJCIET/index.asp 288 [email protected]
Figure 6 Results of loading pressure versus vertical deformation of treated embankment with reinforcement at
(U=0.5B)
Figure 7 Results of loading pressure versus vertical deformation of treated embankment with reinforcement at
(U=0.1B)
Different locations of geo grid in the embankment (U=0.25B, 0.5B, 0.75B and 1B) are trailed to use in
this study, to find optimum position.
Figure (8) explain this result with different location of geo grid reinforcement, and the percentage of reduce
in vertical deformation at loading pressure (40 kpa) (20.15%, 27.68%, 27.68% and 16.32%) for
reinforcement embankment at (U=0.25B, 0.5B, 0.75B and 1B) respectively, as compare with un
reinforcement embankment, as shown in Figure (9). It can be seen from these results the optimum
embedment depth at (U=0.5B), because the less deformation obtained at the surface. The output of vertical
deformations using 3D Plaxis software are illustrated in Figures (10),(11),(12),(13) and (14).
0
2
4
6
8
10
12
0 10 20 30 40 50 60 70
Ver
tica
l d
efo
rmat
ion (
mm
)
Load of footing in (kpa)
(Lee and manjunath, 2000)
(PLAXIS 3D, 2013)
0
2
4
6
8
10
12
14
0 10 20 30 40 50 60
Ver
tica
l d
efo
rmat
ion (
mm
)
Load of footing (kpa)
(Lee and manjunath, 2000)
(PLAXIS 3D, 2013)

Dr. Alaa Hussein Abed and Anas Mohammed Hameed
http://www.iaeme.com/IJCIET/index.asp 289 [email protected]
Figure 8 The relationship between vertical deformation and loading
Figure 9 The relationship between vertical deformation and location of geogrid
Figure 10 The vertical deformation of reinforcement embankment at loading pressure (40 kpa)
0
2
4
6
8
10
12
0 20 40 60 80
Ver
tica
l d
efo
rmat
ion (
mm
)
Load of footing (kpa)
UNREINF
REINF U=0.25B
REINF U=0.5B
REINF U=0.75B
REINF U=0.1B
3
4
5
6
0 0.25 0.5 0.75 1 1.25
Ver
tica
l d
efo
rmat
ion (
mm
)
Location of geogrid (U/B)

The Optimum Location of Reinforcement Embankment using 3D PLAXIS Software
http://www.iaeme.com/IJCIET/index.asp 290 [email protected]
Figure 11 The vertical deformation of reinforcement embankment with reinforcement at (0.25B) for loading
pressure (40 kpa)
Figure 12 The vertical deformation of reinforcement embankment with reinforcement at (0.5B) for loading pressure
(40 kpa)
Figure 13 The vertical deformation of reinforcement embankment with reinforcement at (0.75B) for loading
pressure (40 kpa)
Figure 14 The vertical deformation of reinforcement embankment with reinforcement at (1B) for loading pressure
(40 kpa)

Dr. Alaa Hussein Abed and Anas Mohammed Hameed
http://www.iaeme.com/IJCIET/index.asp 291 [email protected]
6. CONCLUSION
• 3D Plaxis software can be used to simulate numerical behavior of reinforced embankment.
• Good agreement obtained when compare between numerical and experimental results.
• The maximum reduction of vertical deformation (27.68 %) obtained when geogrid reinforcement depth is
placed as 0.5 width of footing.
REFERENCE
[1] Selvadurai, A. P. S. and Gnanendran, C. T. 1989. An Experimental Study of a Footing Located on a Sloped
Fill: Influence of a Soil Reinforcement Layer. Canadian Geotechnical Journal. 26(3): 467–473.
[2] K.M. Lee and V.R. Manjunath. (Experimental and numerical studies of geosynthetic-reinforced sand
slopes loaded with a footing).Published on the NRC Research Press website on August 8, 2000.
[3] Abhishek Singh B. R. Phanikumar and Ram Prasad, Effect of Geogrid Reinforcement on Load Carrying
Capacity of a Coarse Sand Bed. International Journal of Civil Engineering and Technology (IJCIET),
7(3), 2016, pp.01–06.
[4] Brinkgreve, R. B. J., Engin, E., Swolfs, W. M., editors. (2013). Plaxis 3D 2013tutorial manual.
[5] Asst. Prof. Dr. Qassun S. Mohammed Shafiqu and Fadhl Abbas Ahmed Al-Assady, Analysis of
Embankment Supported by Stone Columns Encased with Geosynthetic Material. International Journal of
Civil Engineering and Technology (IJCIET), 6(10), 2015, pp.97–107.
[6] V. Ramesh Babu and Dr. B. Ramesh Babu, An Experimental Study on Effect of Reinforcement in Polymer
and Fiber Forms on CBR Value. International Journal of Civil Engineering and Technology (IJCIET),
7(2), 2016, pp.352–358.