the oxygen and hydrogen isotope evolution of the great … longstaffe... · the oxygen and hydrogen...
TRANSCRIPT
The Oxygen and Hydrogen Isotope Evolution of the
Great Lakes
Fred J. Longstaffe, Avner Ayalon, Ryan Hladyniuk, Ayumi Hyodo, Rebecca Macdonald, Natalie St.
Amour, Allan Crowe and Patrice Huddart
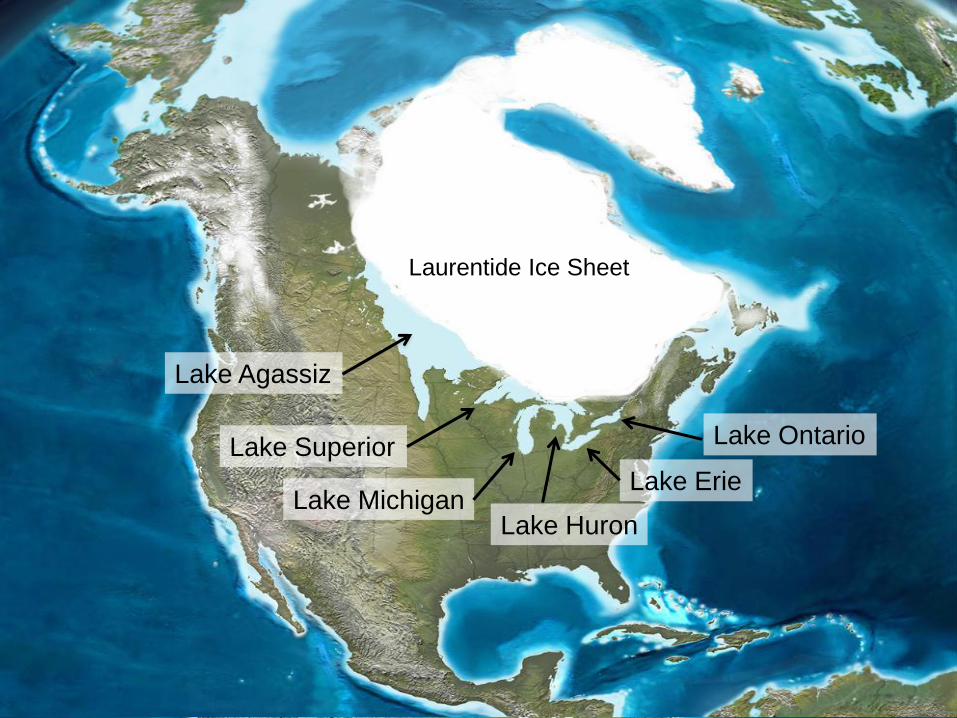
Lake Agassiz
Lake Superior
Lake Michigan Lake Huron
Lake Erie
Lake Ontario
Laurentide Ice Sheet
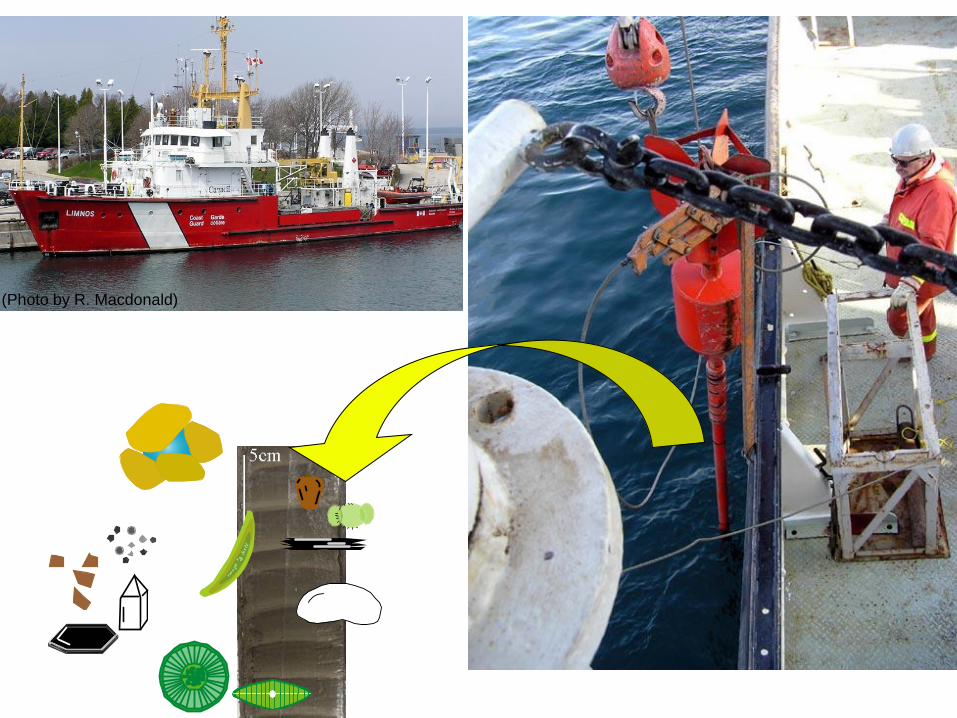
(Photo by R. Macdonald)

Candona subtriangulata
Arthropods with calcite valves
What are ostracodes?
Alive (by JG Morin)
0
2
4
6
8
10
12
14
16
-20 -18 -16 -14 -12 -10 -8 -6 -4
Calib
rate
d a
ge (
ka y
ears
BP
)
δ18Olake water (‰,VSMOW)
C. subtriangulata
Clams
F. caudata
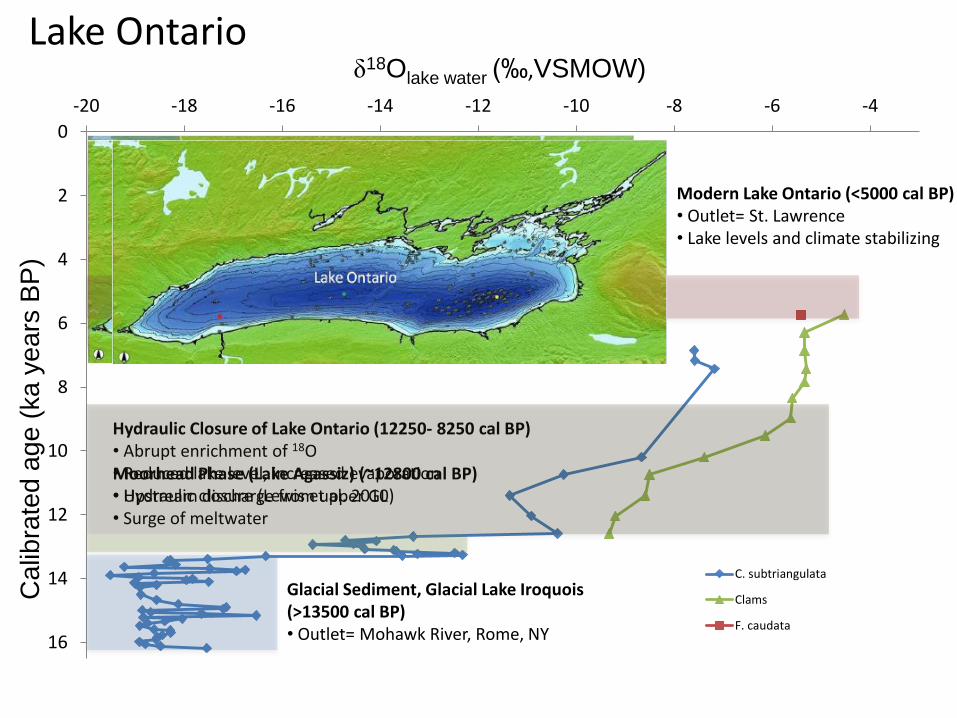
Glacial Sediment, Glacial Lake Iroquois (>13500 cal BP) • Outlet= Mohawk River, Rome, NY
Moorhead Phase (Lake Agassiz) (~12800 cal BP) • Upstream discharge from upper GL • Surge of meltwater
Hydraulic Closure of Lake Ontario (12250- 8250 cal BP) • Abrupt enrichment of 18O • Reduced lake level, increased evaporation • Hydraulic closure (Lewis et al. 2010)
Modern Lake Ontario (<5000 cal BP) • Outlet= St. Lawrence • Lake levels and climate stabilizing
Lake Ontario
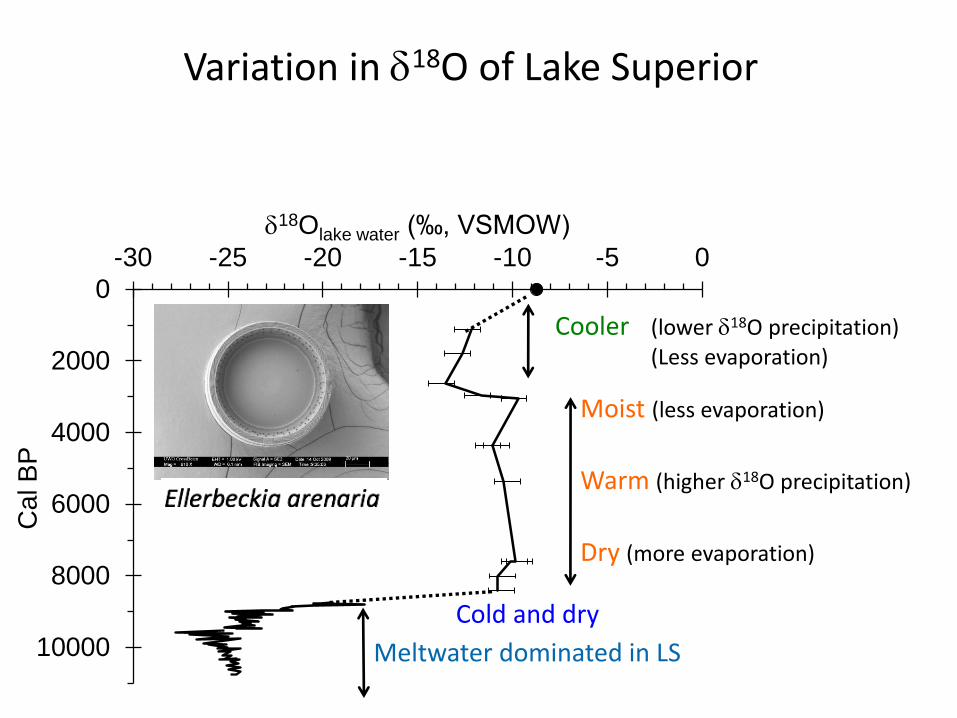
Variation in d18O of Lake Superior
0
2000
4000
6000
8000
10000
-30 -25 -20 -15 -10 -5 0
Ca
l B
P
d18Olake water (‰, VSMOW)
Moist (less evaporation)
Warm (higher d18O precipitation)
Dry (more evaporation)
Cooler (lower d18O precipitation) (Less evaporation)
Meltwater dominated in LS
Cold and dry

0
2000
4000
6000
8000
10000
-14 -11 -8
d18Olake water (‰, VSMOW)
Cal
BP
Lake Superior
Glacial sediments (few diatoms)
Holocene Neoglacial Interval (cooler)
(Renssen et al. 2009)
LS modern
Holocene Thermal Maximum (warmer)
(Edward et al. 1996; McAndrews 1981) LH 6,500 BP
(LH data from Dettman et al. 1995; Macdonald and Longstaffe 2008; Rea et al. 1994)
Cold and Dry
Moist
Dry
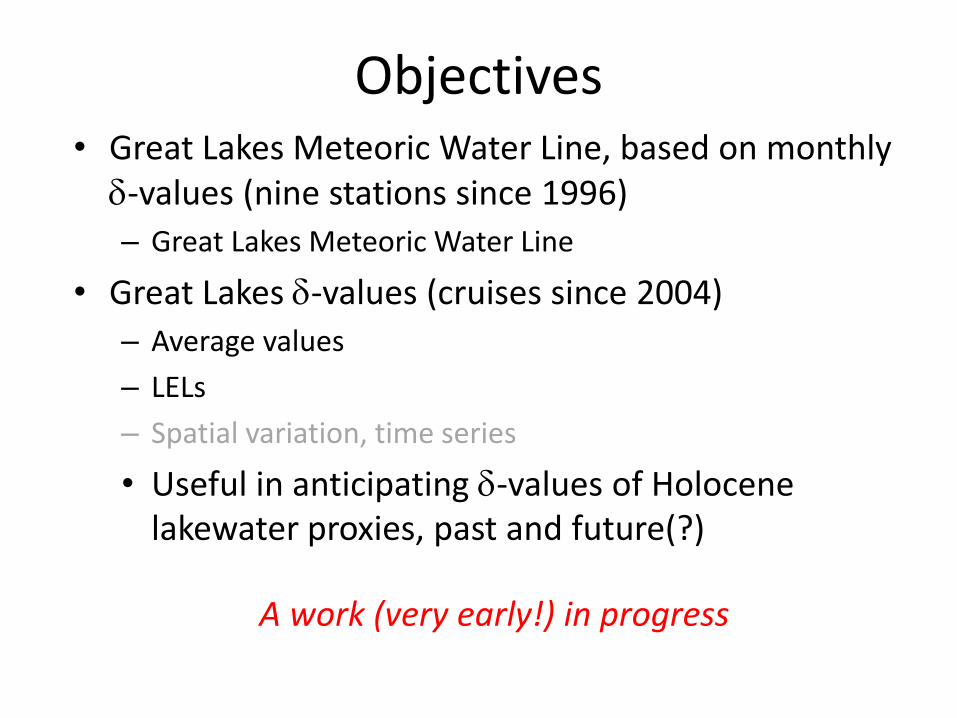
Objectives • Great Lakes Meteoric Water Line, based on monthly
d-values (nine stations since 1996)
– Great Lakes Meteoric Water Line
• Great Lakes d-values (cruises since 2004)
– Average values
– LELs
– Spatial variation, time series
• Useful in anticipating d-values of Holocene lakewater proxies, past and future(?)
A work (very early!) in progress
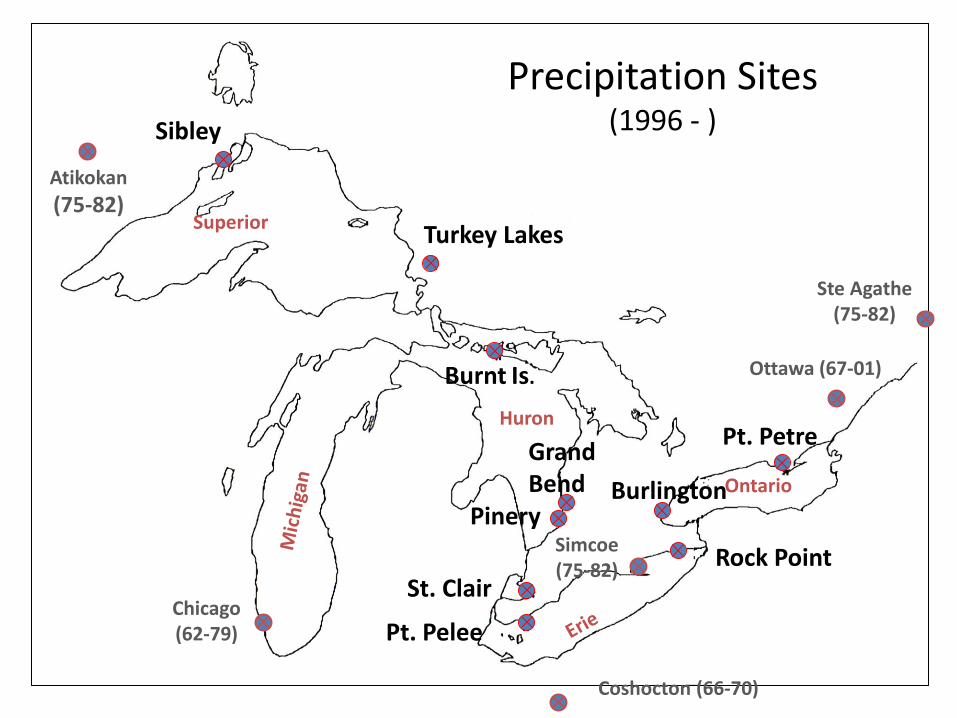
Pt. Pelee
St. Clair
Grand Bend
Rock Point
Burlington
Pt. Petre
Burnt Is.
Sibley
Turkey Lakes Superior
Huron
Ontario
Chicago (62-79)
Pinery
Atikokan
(75-82)
Ottawa (67-01)
Simcoe (75-82)
Ste Agathe (75-82)
Coshocton (66-70)
Precipitation Sites (1996 - )

-8.0
-7.1
-8.3
-8.1
-7.5
-8.5
-10.4
-12.2
-11.6 Superior
Huron
Ontario
-6.2
-9.5
-12.6
-11.2
-9.3
-12.6
-7.4
Annual d18O (‰, VSMOW)
(1996 - )

-25
-20
-15
-10
-5
0
Date
96 97 98 99 00 01 02 03 04 05 06
Sibley
P. Pelee
Pinery
Turkey
Lakes
Mean Monthly Variation in d18O Values of Precipitation
d1
8O (‰
, VSM
OW
)
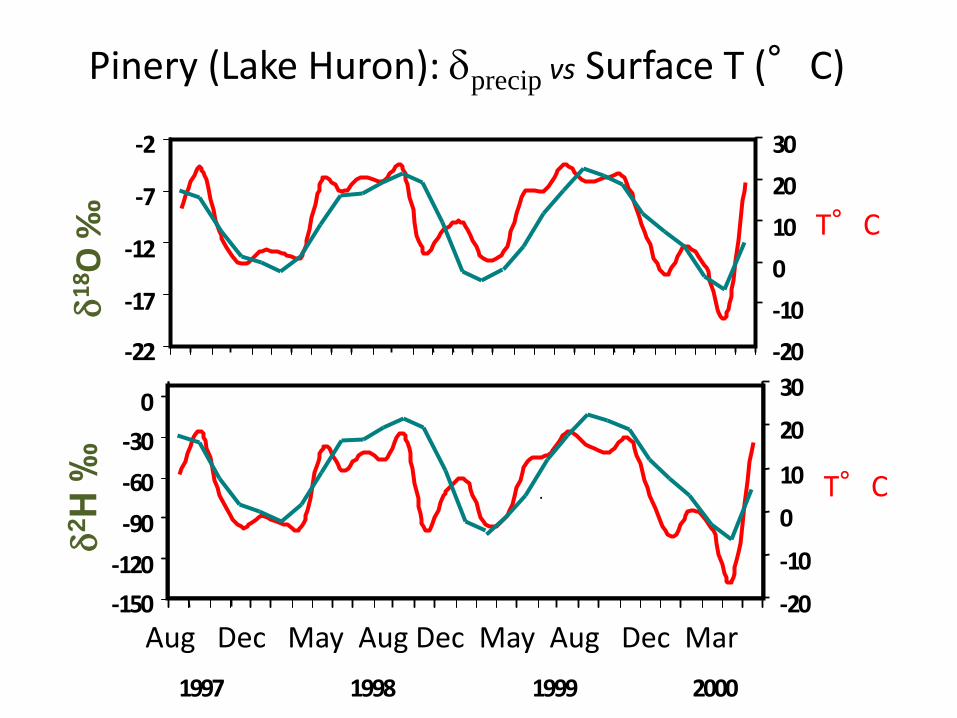
Pinery (Lake Huron): dprecip vs Surface T (°C)
- 1 5 0
- 1 2 0
- 9 0
- 6 0
- 3 0
0
d2H
‰
- 2 0
- 1 0
0
1 0
2 0
3 0
1 9 9 7 2 0 0 0 1 9 9 9 1 9 9 8
- 2 2
- 1 7
- 1 2
- 7
- 2
- 2 0
- 1 0
0
1 0
2 0
3 0
Aug Dec May Aug Dec May Aug Dec Mar
d1
8O
‰
T°C
T°C

Each data point = average of monthly
results for 10 years. 2
4
6
8
10
12
-13 -12 -11 -10 -9 -8 -7 -6
Tem
per
atu
re (°
C)
d18O (‰, VSMOW)
Lake Superior
Lake St. Clair
Manitoulin Island
Southern Lake Huron
Northern Lake Huron
Lake Erie
Lake Ontario
Temperature vs
Precipitation d18O

-120
-100
-80
-60
-40
-20
-14 -12 -10 -8 -6 -4
Sibley
Turkey Lakes Burnt Is.
Pinery St. Clair Burlington
P. Pelee P. Petre
Grand Bend
R. Point
d18O (‰, VSMOW)
dD
(‰
, VSM
OW
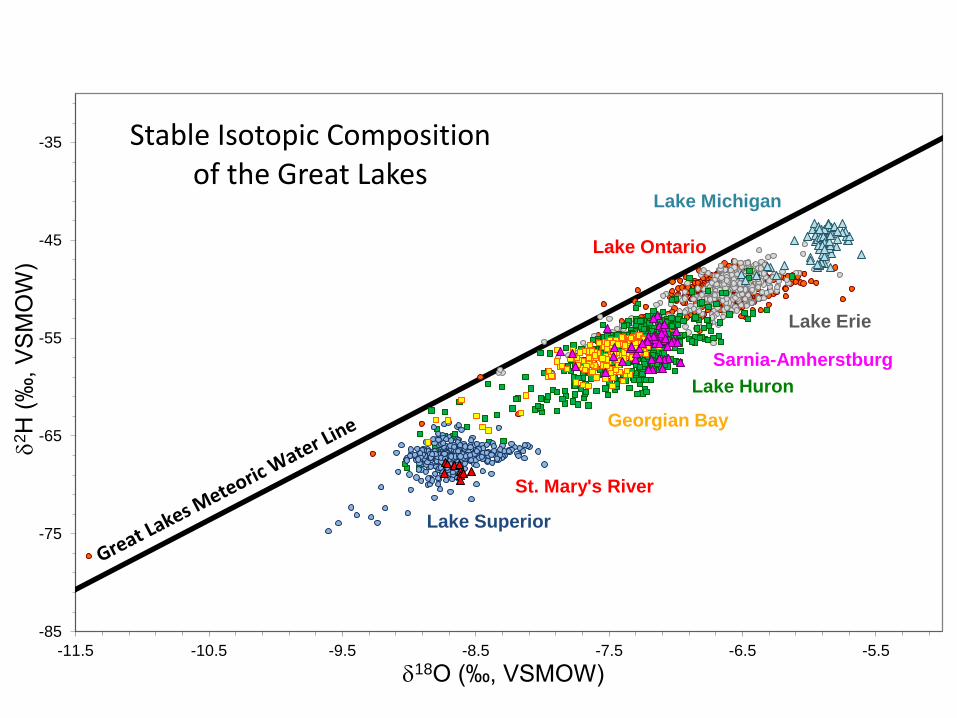
) Great Lakes Meteoric Water Line
dD = 7.1d18O + 1.0
Each point = annual arithmetic average of monthly results
GLMWL
-85
-75
-65
-55
-45
-35
-11.5 -10.5 -9.5 -8.5 -7.5 -6.5 -5.5
d2H
(‰
, V
SM
OW
)
d18O (‰, VSMOW)
Stable Isotopic Composition of the Great Lakes
Lake Superior
St. Mary's River
Georgian Bay
Lake Huron
Lake Erie
Lake Ontario
Lake Michigan
Sarnia-Amherstburg
18O (‰ VSMOW)
-10 -9 -8 -7 -6 -5
Depth
(m
)
0
20
40
60
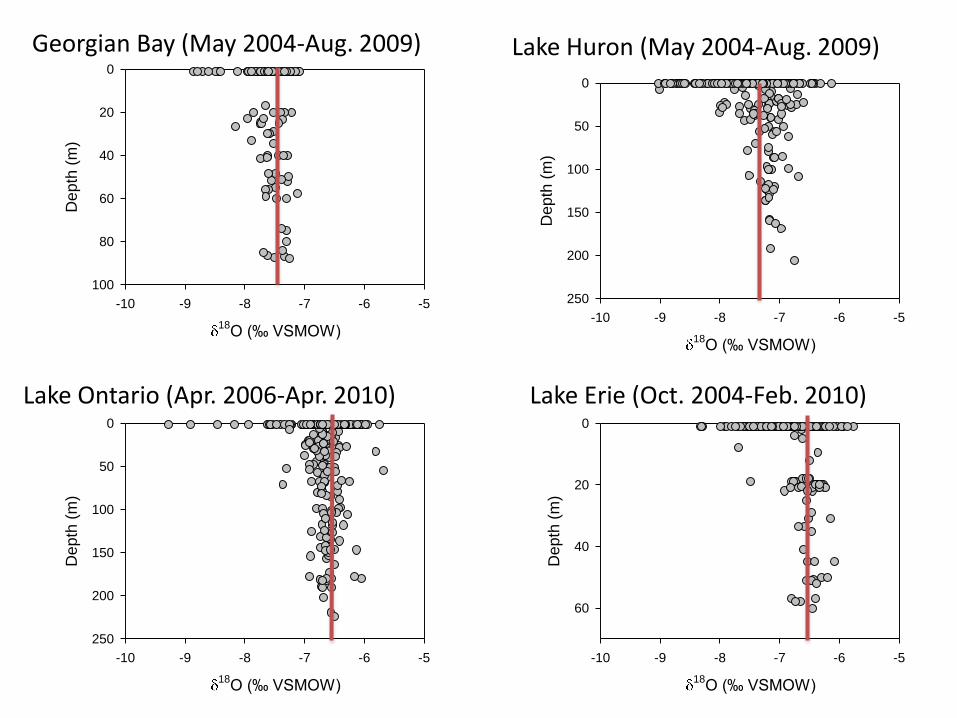
Lake Erie (Oct. 2004-Feb. 2010)
18O (‰ VSMOW)
-10 -9 -8 -7 -6 -5
Depth
(m
)
0
50
100
150
200
250
Lake Ontario (Apr. 2006-Apr. 2010)
18O (‰ VSMOW)
-10 -9 -8 -7 -6 -5
Depth
(m
)
0
50
100
150
200
250
Lake Huron (May 2004-Aug. 2009)
18O (‰ VSMOW)
-10 -9 -8 -7 -6 -5
Depth
(m
)0
20
40
60
80
100
Georgian Bay (May 2004-Aug. 2009)

18O (‰ VSMOW)
-10 -9 -8 -7 -6 -5
Depth
(m
)
0
50
100
150
200
250
300
Lake Michigan (June 2006)
18O (‰ VSMOW)
-10 -9 -8 -7 -6 -5
Depth
(m
)0
100
200
300
Lake Superior (May 2005-Oct.2008)
Lake Superior Georgian Bay Lake Huron
d18O d2H d18O d2H d18O d2H
Average -8.68 -67.5 -7.53 -57.1 -7.35 -56.5
Maximum -7.98 -63.6 -7.08 -54.7 -6.13 -48.2
Minimum -9.60 -74.7 -8.86 -65.7 -9.03 -68.3
Std 0.22 1.4 0.30 1.9 0.44 3.2
Sarnia-Amherst. Lake Erie Lake Ontario
d18O d2H d18O d2H d18O d2H
Average -7.22 -55.8 -6.71 -50.7 -6.65 -50.1
Maximum -6.96 -52.7 -5.77 -44.7 -5.68 -47.1
Minimum -7.87 -58.5 -8.33 -58.7 -11.40 -77.3
Std 0.21 1.4 0.37 2.4 0.34 2.1
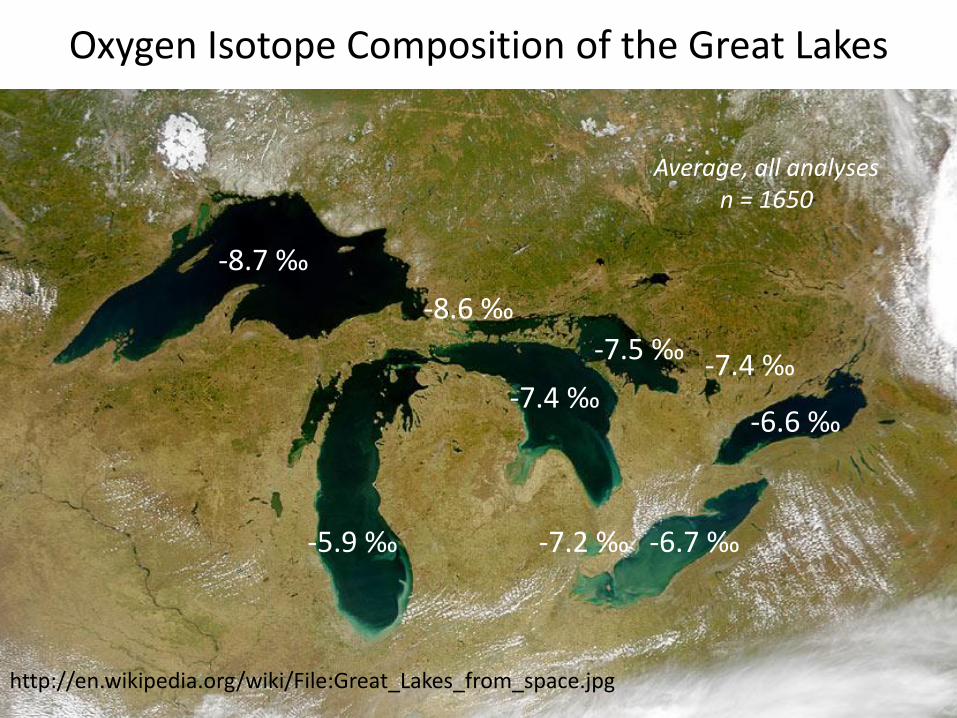
Oxygen Isotope Composition of the Great Lakes
http://en.wikipedia.org/wiki/File:Great_Lakes_from_space.jpg
-8.7 ‰
-6.7 ‰ -5.9 ‰
-7.4 ‰ -6.6 ‰
Average, all analyses n = 1650
-7.5 ‰
-7.2 ‰
-7.4 ‰
-8.6 ‰
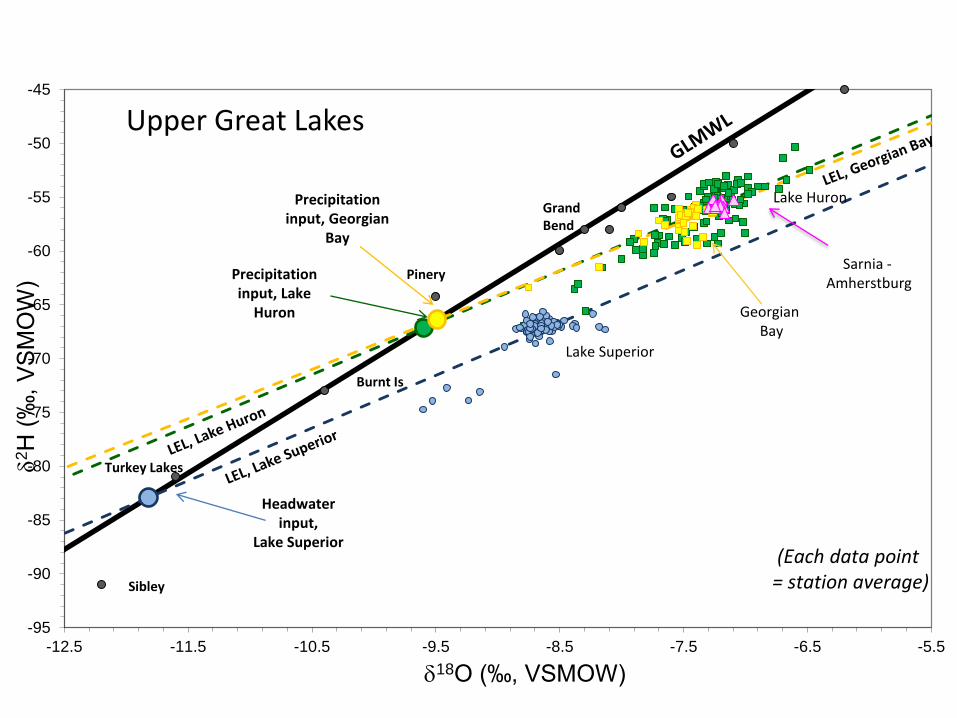
-95
-90
-85
-80
-75
-70
-65
-60
-55
-50
-45
-12.5 -11.5 -10.5 -9.5 -8.5 -7.5 -6.5 -5.5
d2H
(‰
, V
SM
OW
)
d18O (‰, VSMOW)
Upper Great Lakes
Burnt Is
Sibley
Turkey Lakes
Headwater input,
Lake Superior
Precipitation input, Georgian
Bay
Pinery
Grand Bend
Precipitation input, Lake
Huron
Lake Superior
Lake Huron
Sarnia - Amherstburg
Georgian Bay
(Each data point = station average)
-75
-70
-65
-60
-55
-50
-45
-40
-10 -9.5 -9 -8.5 -8 -7.5 -7 -6.5 -6 -5.5 -5
d2H
(‰
, V
SM
OW
)
d18O (‰, VSMOW)
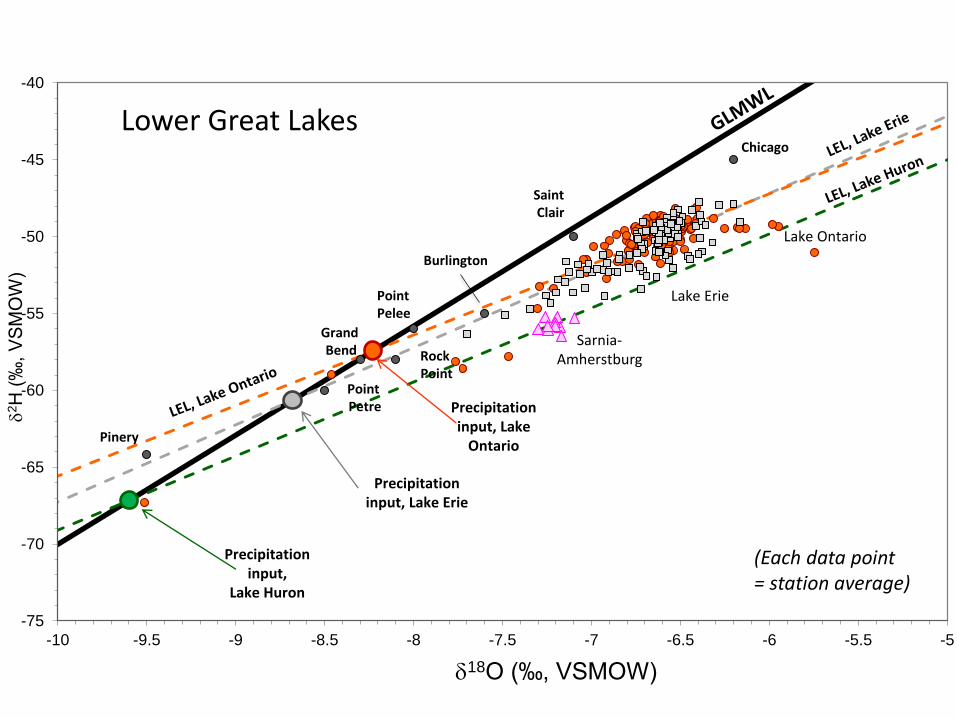
Lower Great Lakes
Pinery
Grand Bend
Point Petre
Precipitation input, Lake Erie
Rock Point
Point Pelee
Burlington
Saint Clair
Chicago
Precipitation input, Lake
Ontario
Precipitation input,
Lake Huron
Sarnia- Amherstburg
Lake Ontario
Lake Erie
(Each data point = station average)
-95
-85
-75
-65
-55
-45
-35
-12.5 -11.5 -10.5 -9.5 -8.5 -7.5 -6.5 -5.5 -4.5
d2H
(‰
, VSM
OW
)
d18O (‰, VSMOW)
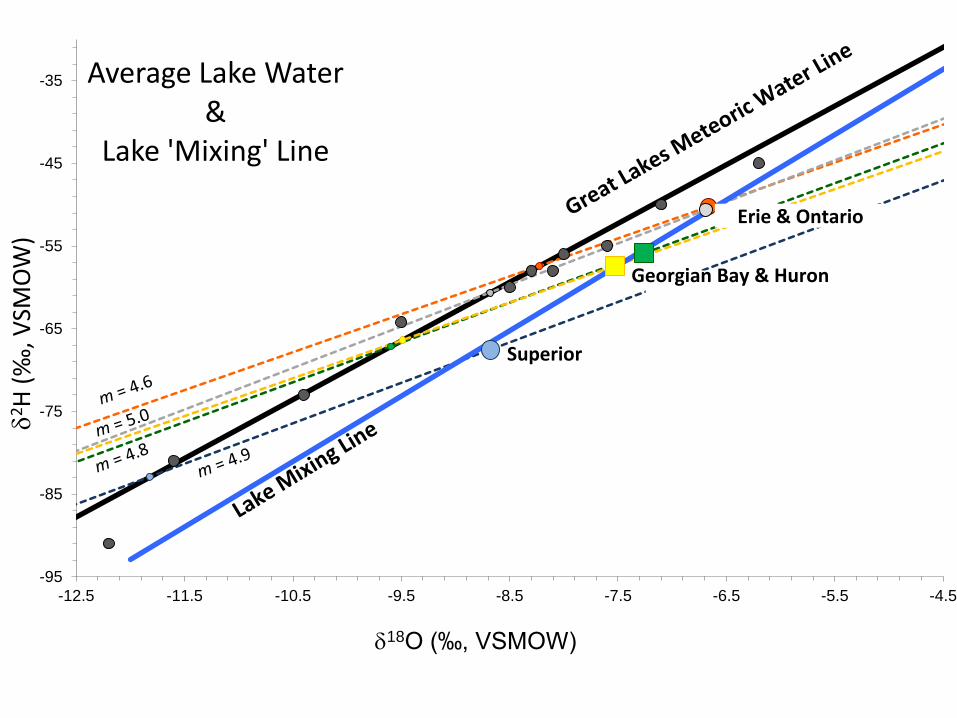
Average Lake Water &
Lake 'Mixing' Line
Georgian Bay & Huron
Superior
Erie & Ontario
0.00
0.05
0.10
0.15
0.20
0.25
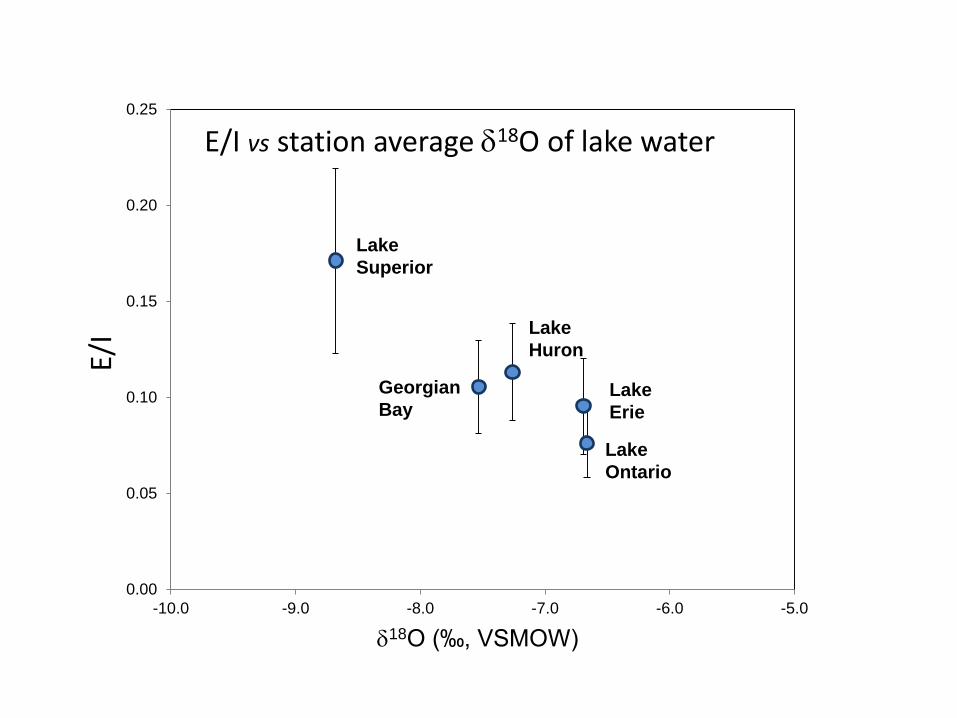
-10.0 -9.0 -8.0 -7.0 -6.0 -5.0
E/I
d18O (‰, VSMOW)
E/I vs station average d18O of lake water
Lake
Superior
Lake
Huron
Georgian
Bay Lake
Erie
Lake
Ontario

From Lewis et al. (2008), after Edwards et al. (1996)
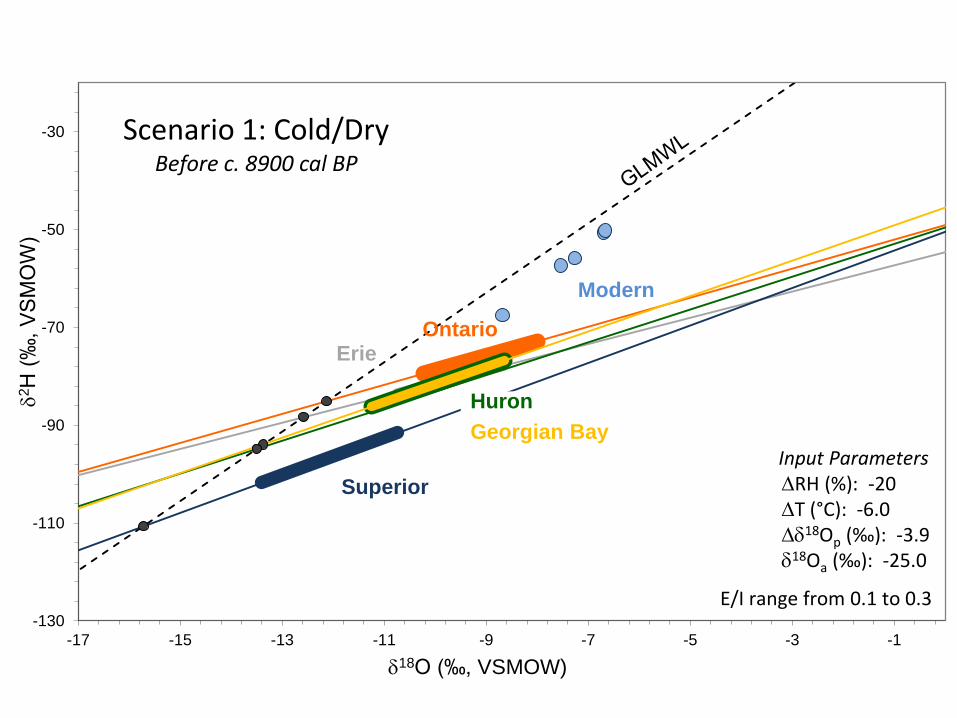
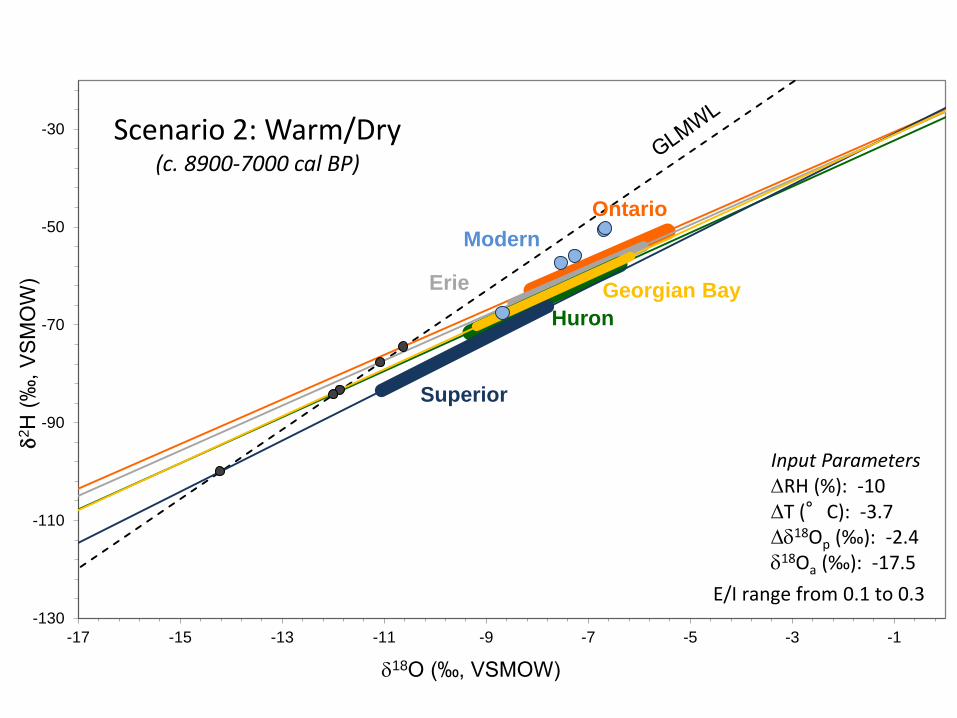
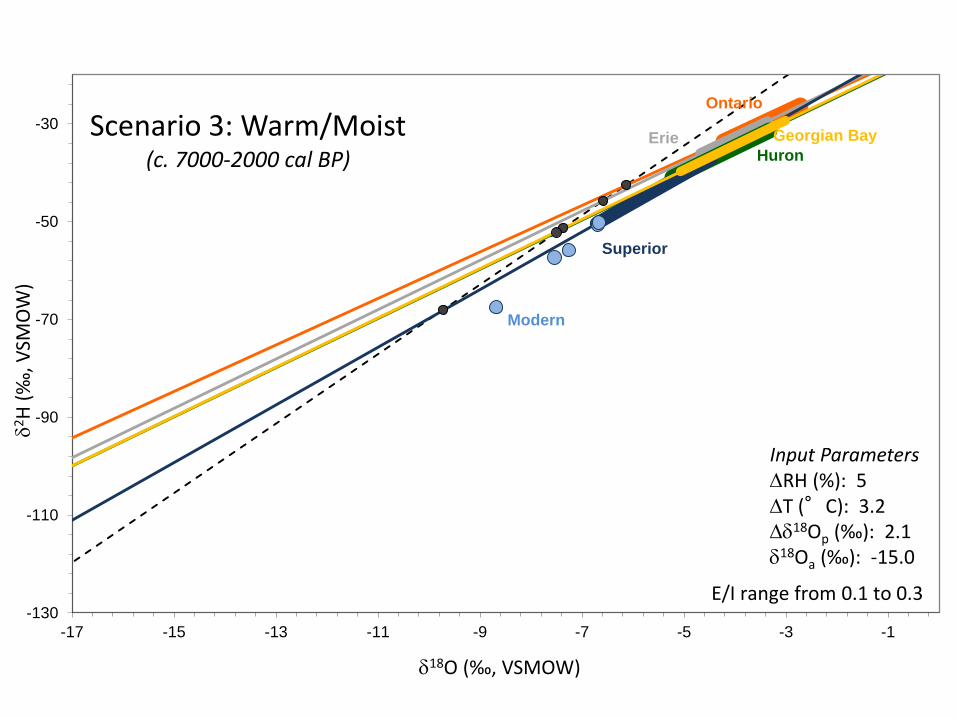
Scenarios 1. Cold/Dry Period 2. Warm/Dry Period 3. Warm/Moist
Period (before c. 8900 cal BP) (c. 8900-7000 cal BP) (c.7000-2000 cal BP)
DRH (%) -20 -10 5
Dtemp (°C) -6.0 -3.7 3.2
Dd18OP (‰) -3.9 -2.4 2.1
da (d18O ‰) -25.0 -17.5 -15.0
-130
-110
-90
-70
-50
-30
-17 -15 -13 -11 -9 -7 -5 -3 -1
d2H
(‰
, V
SM
OW
)
d18O (‰, VSMOW)
Scenario 1: Cold/Dry Before c. 8900 cal BP
E/I range from 0.1 to 0.3
Superior
Georgian Bay
Ontario
Huron
Erie
Modern
Input Parameters DRH (%): -20 DT (°C): -6.0 Dd18Op (‰): -3.9 d18Oa (‰): -25.0
-130
-110
-90
-70
-50
-30
-17 -15 -13 -11 -9 -7 -5 -3 -1
d2H
(‰
, V
SM
OW
)
d18O (‰, VSMOW)
Scenario 2: Warm/Dry (c. 8900-7000 cal BP)
E/I range from 0.1 to 0.3
Superior
Georgian Bay
Ontario
Huron
Erie
Modern
Input Parameters DRH (%): -10 DT (°C): -3.7 Dd18Op (‰): -2.4 d18Oa (‰): -17.5
-130
-110
-90
-70
-50
-30
-17 -15 -13 -11 -9 -7 -5 -3 -1
d2H
(‰
, VSM
OW
)
d18O (‰, VSMOW)
Scenario 3: Warm/Moist (c. 7000-2000 cal BP)
E/I range from 0.1 to 0.3
Superior
Georgian Bay
Ontario
Huron Erie
Modern
Input Parameters DRH (%): 5 DT (°C): 3.2 Dd18Op (‰): 2.1 d18Oa (‰): -15.0

Next Steps • Spatial analysis of lake data (and gather Lake
Michigan data)
• More sophisticated approach
– Variable lake volume
– Chain-of-lakes considerations
– Better tuning of climate parameters
– Better estimates of datmosphere
• Calibration with conventional E/I measures
• Acquire/compare large and small lake proxy records
With thanks to… • Staff of the Laboratory for Stable Isotope Science (Kim Law, Li Huang, Lisa Munro)
• Mike Lewis • Captain & Crew of the CCGS Limnos • Environment Canada staff
• Natural Sciences & Engineering Research Council of Canada
• Canada Foundation for Innovation • The University of Western Ontario

d-Excess (d) = dD - 8d18O
• d = ~10 for modern samples world-wide (86% RH) • Caused by kinetic effects during evaporation • Increases with an increase in moisture deficit (1-h), where h
is RH at the water surface temperature • Effect of evaporation is dD/d18O < 8; vapour plots to the left
of the MWL (thus having a higher d) • d varies with geographic location in NA (air mass source,
Dtemperature, aridity, contributions from lakes and transpiration)
• ~10 ‰ lower in glacial vs interglacial periods (????) because of change in RH (Harmon & Schwarcz, 1981)
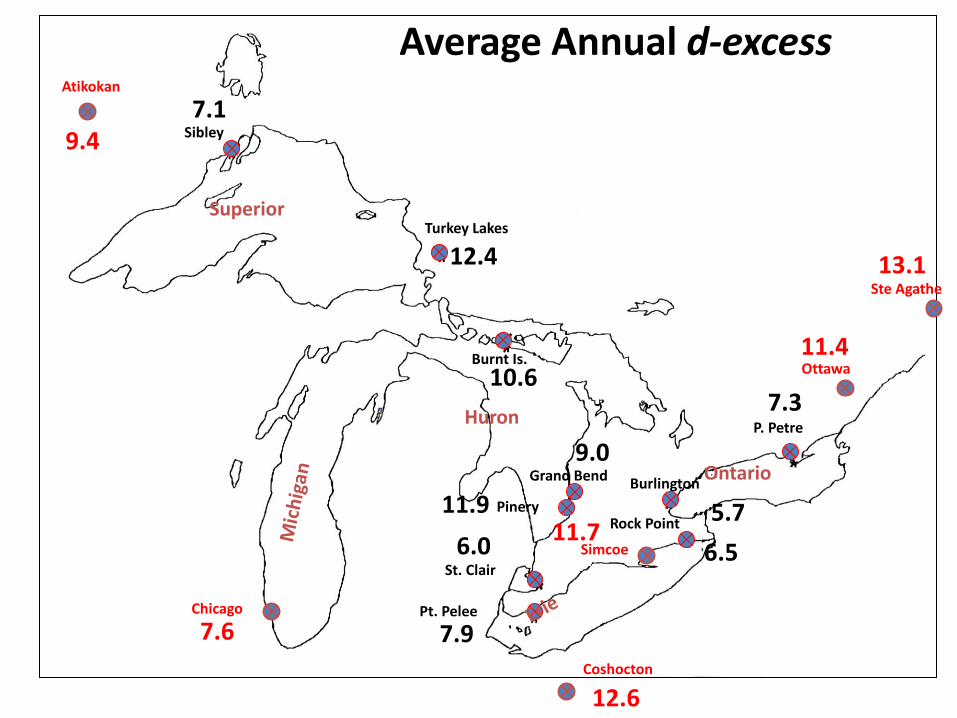
Pt. Pelee
St. Clair
Grand Bend
Rock Point
Burlington
P. Petre
Burnt Is.
Sibley
Turkey Lakes
Chicago
Pinery
Atikokan
Ottawa
Simcoe
Ste Agathe
Coshocton
7.1
12.4
10.6 7.3
6.5
5.7
9.0
11.9
7.9
6.0
9.4
7.6
12.6
11.4
13.1
11.7
Average Annual d-excess
Superior
Huron
Ontario
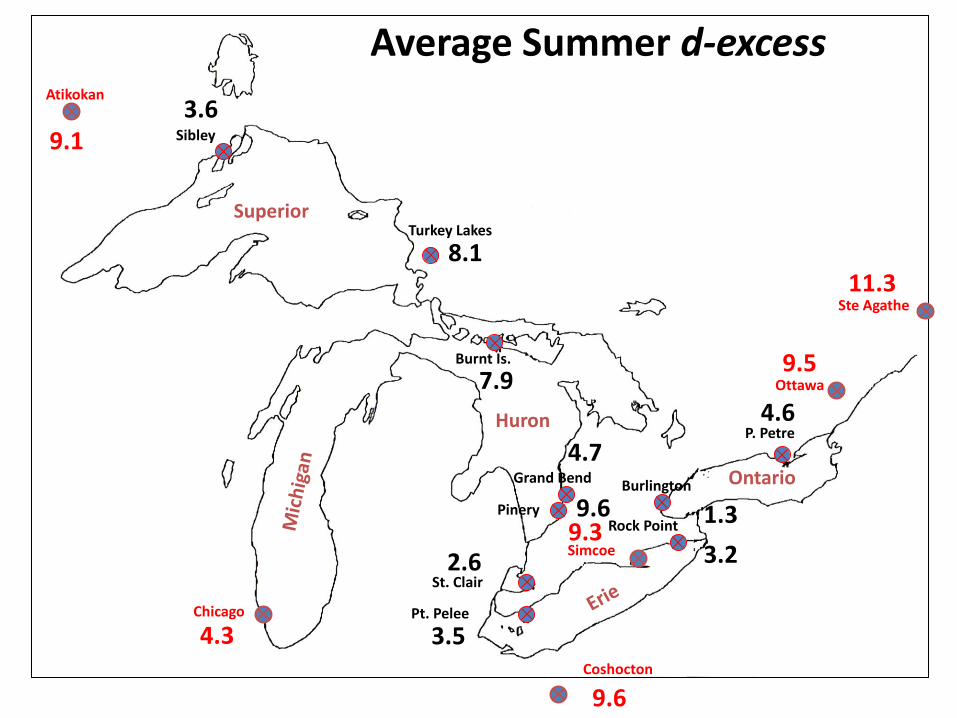
Pt. Pelee
St. Clair
Grand Bend
Rock Point
Burlington
P. Petre
Burnt Is.
Sibley
Turkey Lakes
Chicago
Pinery
Atikokan
Ottawa
Simcoe
Ste Agathe
Coshocton
3.2
4.6
3.6
8.1
7.9
1.3
4.7
3.5
2.6
9.6
9.1
4.3
9.6
9.5
11.3
9.3
Average Summer d-excess
Superior
Huron
Ontario

6
8
10
12
14
-13 -12 -11 -10 -9 -8 -7 -6
d-e
xces
s (‰
)
d18O (‰VSMOW)
Each data point = annual arithmetic average of monthly results for 10 years.
Sibley
Atikokan
Coshocton Turkey Lake
Burnt Island
Pt. Pelee
Pinery
Pt. Petre
Burlington
St. Clair
Rock Pt.
Grand Bend
Chicago
Simcoe Ottawa
Ste Agathe
-13
-12
-11
-10
-9
-8
-7
-6
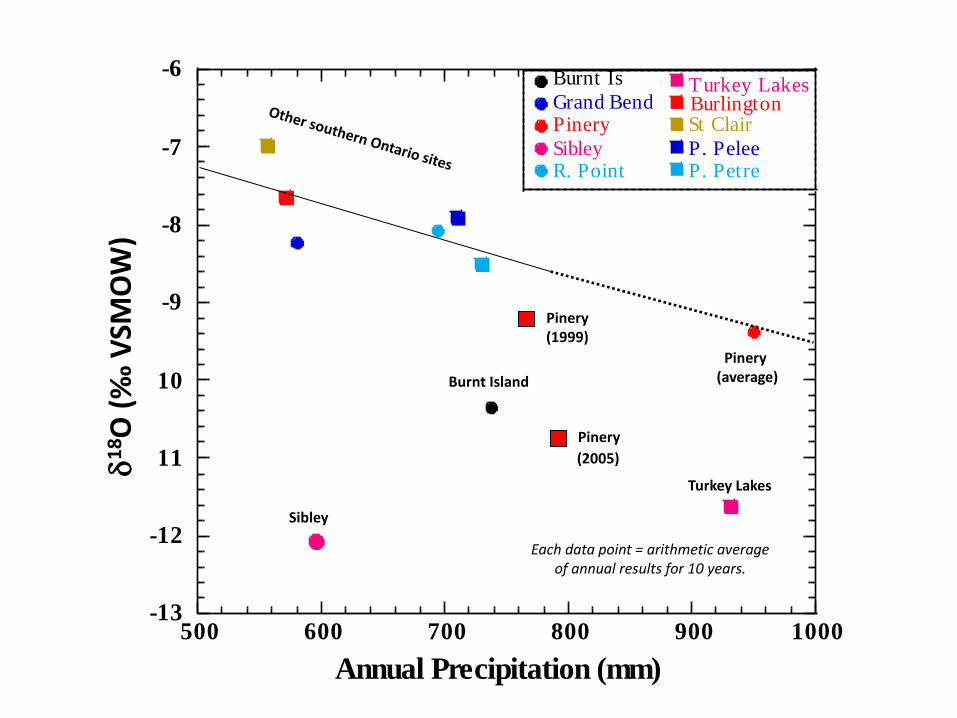
500 600 700 800 900 1000
Annual Precipitation (mm)
Sibley
Turkey LakesBurnt Is
Pinery St ClairBurlington
P. PeleeP. Petre
Grand Bend
R. Point
Each data point = arithmetic average of annual results for 10 years.
Pinery
(2005)
Sibley
Burnt Island
Turkey Lakes
Pinery (1999)
Pinery (average)
d1
8O
(‰
VSM
OW
)
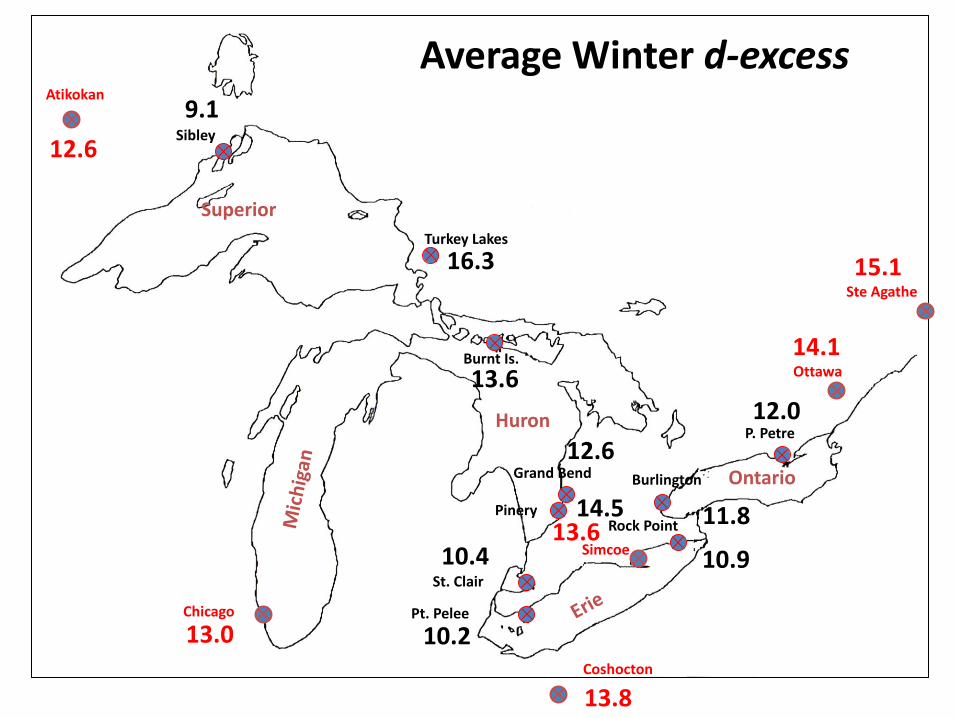
Pt. Pelee
St. Clair
Grand Bend
Rock Point
Burlington
P. Petre
Burnt Is.
Sibley
Turkey Lakes
Chicago
Pinery
Atikokan
Ottawa
Simcoe
Ste Agathe
Coshocton
9.1
16.3
13.6 12.0
11.8
12.6
10.2
14.5
10.9 10.4
12.6
13.0
13.8
13.6
14.1
15.1
Average Winter d-excess
Superior
Huron
Ontario
-56
-50
-58
-58
-55
-60
-73
-91
-81 Superior
Huron
Ontario
-45
-64
-92
-78
-62
-88
-47
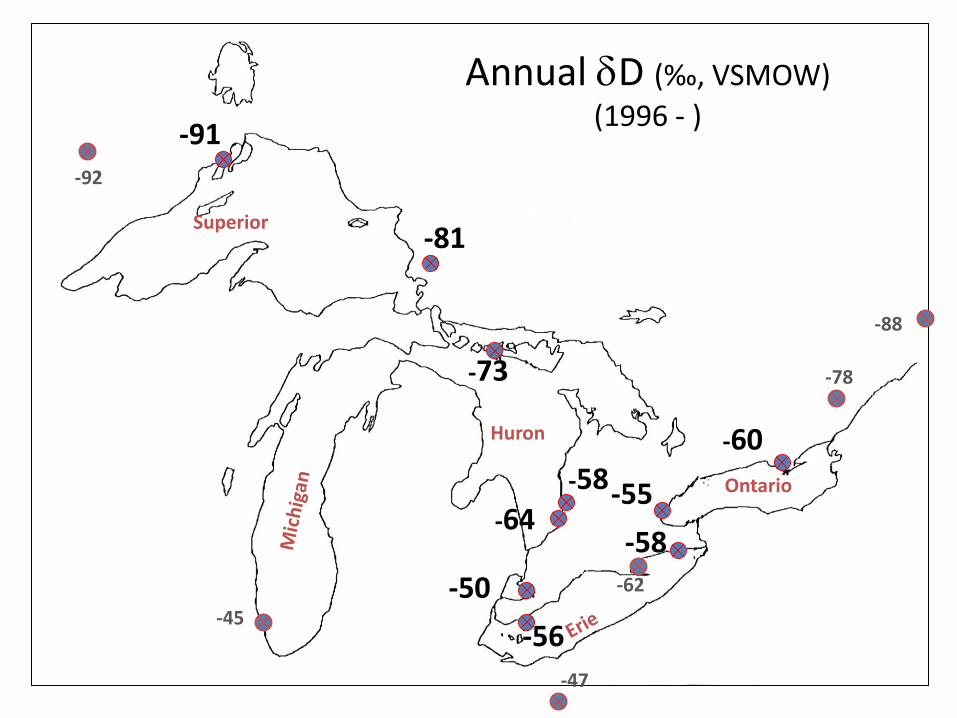
Annual dD (‰, VSMOW)
(1996 - )