the pacific states (ca, wa, or, hi) by: ben vail and marianne needham
Post on 20-Dec-2015
215 views
TRANSCRIPT

The Pacific States(CA, WA, OR, HI)
By: Ben Vail and Marianne Needham
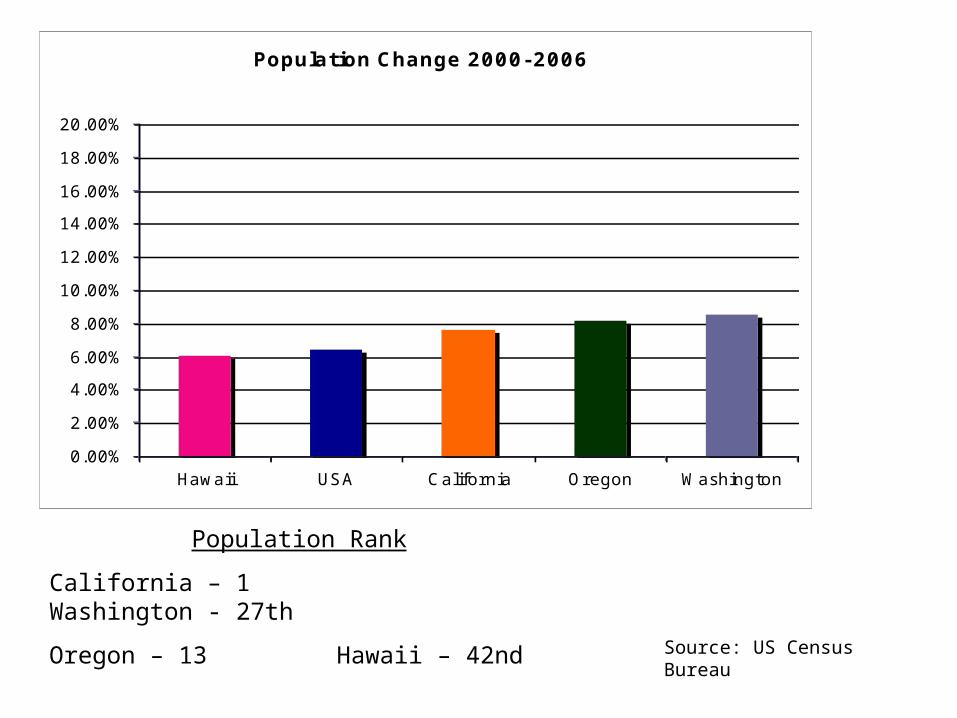
Population Change 2000-2006
0.00%
2.00%
4.00%
6.00%
8.00%
10.00%
12.00%
14.00%
16.00%
18.00%
20.00%
Hawaii USA California Oregon Washington
Population Rank
California – 1 Washington - 27th
Oregon – 13 Hawaii – 42nd Source: US Census Bureau

Population Density

Classification of States
California Moralistic Heterogeneous
Hawaii Individualistic Heterogeneous
Oregon Moralistic Homogeneous
Washington Moralistic/
Individualistic
Homogeneous

Percentage of Hispanics/ Latinos
0.00%
5.00%
10.00%
15.00%
20.00%
25.00%
30.00%
35.00%
40.00%
California USA Oregon Washington Hawaii
Source: US Census Bureau Fact Sheet 2006 American Community Survey

Percentage of Blacks
0.00%
2.00%
4.00%
6.00%
8.00%
10.00%
12.00%
14.00%
USA California Washington Hawaii Oregon
Source: US Census Bureau Fact Sheet 2006 American Community Survey

Percentage of Whites
0.00%10.00%20.00%30.00%40.00%50.00%60.00%70.00%80.00%90.00%
100.00%
Oregon
Washington
USACalifornia
Hawaii
Source: US Census Bureau Fact Sheet 2006 American Community Survey

Racial Makeup of Hawaii
39.90%
26.30%
21.50%
8.70%
2.20%
Asian American
White
Mixed Race
Native Hawaiian
African American
Source: US Census Bureau Fact Sheet 2006 American Community Survey

Measure of State High Tech Economy
Source: The 2002 New State Economy Index
Rank
2. Washington (Score 86.2)
3. California (Score 85.5)
11. Oregon (Score of 68.9)
35. Hawaii (Score of 53.7)

Racial Diversity v. Health Coverage
80.4% 84.1% 80.3% 89.3%
78.8% 76.7% 76.6% 86.4%
Rank 45 Rank 39 Rank 45 Rank 32
13.4% 8.3% 11.8% 6.2%
% of White Mothers receiving Prenatal Care
% of Black Mothers receiving Prenatal Care
Infant Mortality Rate
% Uninsured under the age of 19
Source: Policy Outcomes Excel File and March of Dimes

Racial Diversity v. Personal Wealth
Source: 2006 American Community Survey, US Census Bureau Fact Sheet
$24,418 $26,974 $27,346 $25,267 $27,251
$55,293 $64,563 $63,705 $58,526 $70,277
13.3% 13.1% 11.8% 13.3% 9.3%
Per Capita Income
Median Family Income
Individuals below Poverty Level

Analysis of States
• Hawaii successful state – cohesiveness and diversity. (Mixed Race – common ground) – high health standards, - strong economy (tourism)
• California – high diversity yet lack of integration (Hispanic/White/Black/Asian population)
• Oregon – least successful of group - lack of high tech jobs/economy and diversity.
• Washington – some diversity especially coastal areas and strong high tech economy.

Conclusions
• Racial Diversity is a positive influence on policy outcomes when races are at equal level and can compete yet work together.
• Heterogeneous states have stronger personal wealth and health standards.
• Diversity equals diversity of ideas
• Individualistic v. Moralistic States