the panama canal: modernization and...
TRANSCRIPT

Rodolfo SabongeRodolfo SabongeRodolfo SabongeRodolfo Sabonge
Director, Corporate Planning and MarketingDirector, Corporate Planning and MarketingDirector, Corporate Planning and MarketingDirector, Corporate Planning and Marketing
Panama Canal AuthorityPanama Canal AuthorityPanama Canal AuthorityPanama Canal Authority
The Panama Canal:Modernization and Expansion
The Panama Canal:Modernization and Expansion
26th Annual Summer Ports, Waterways, Freight &International Trade Conference
June 26, 2001Galveston, Texas
26th Annual Summer Ports, Waterways, Freight &International Trade Conference
June 26, 2001Galveston, Texas

! Canal Performance
! Modernization Program
! Expansion Plans
! Canal Performance
! Modernization Program
! Expansion Plans
AgendaAgenda

ATLANTIC OCEAN
PACIFIC OCEAN
CHAGRESRIVER
RIO GRANDE

ATLANTIC OCEAN
PACIFIC OCEAN
CHAGRESRIVER
GRANDE RIVER
GATUNLAKE

COLON CITYCOLON CITY
G ATUNLAKE
PANAM A CITYPANAM A CITY
M ADDEN
RIO CHAG RES
GATUN LOCKS
MIRAFLORES LOCKS
PEDRO MIGUEL LOCKS
ATLANTIC OCEAN
PACIFIC OCEAN

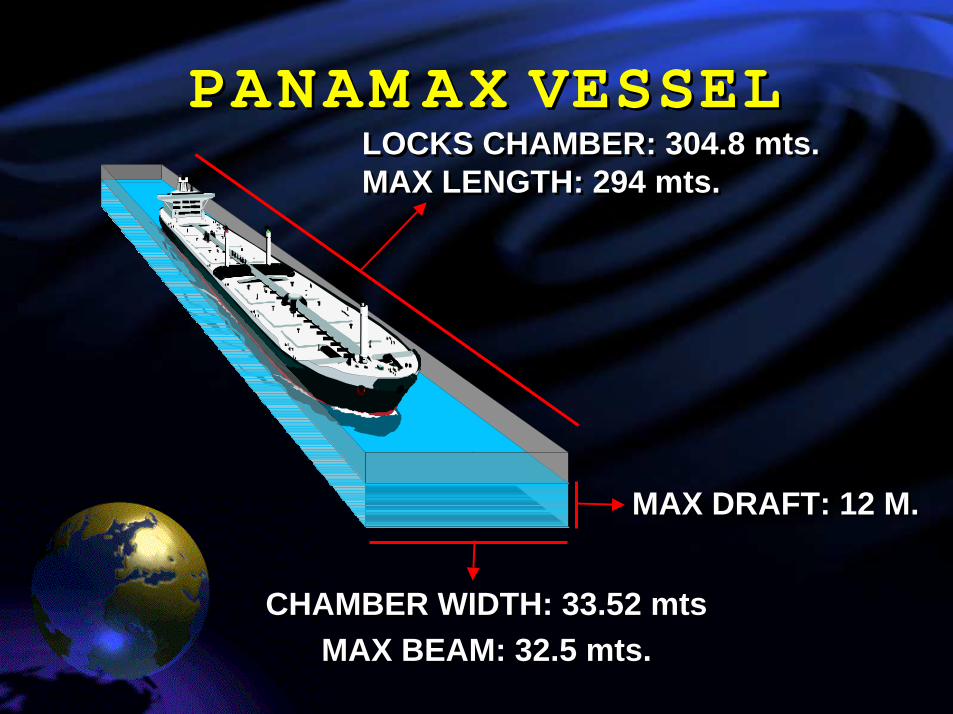
MAX DRAFT: 12 M.MAX DRAFT: 12 M.
CHAMBER WIDTH: 33.52 mtsMAX BEAM: 32.5 mts.
CHAMBER WIDTH: 33.52 mtsMAX BEAM: 32.5 mts.
LOCKS CHAMBER: 304.8 mts.MAX LENGTH: 294 mts.LOCKS CHAMBER: 304.8 mts.MAX LENGTH: 294 mts.
PANAM AX VESSELPANAM AX VESSEL

80 Km8 - 10 hrs TRANSIT TIME
+/- 24 hrs CWT
80 Km8 - 10 hrs TRANSIT TIME
+/- 24 hrs CWT

Kobe, Japan - New YorkKobe, Japan - New York
Saves 2,846 Nautical M ilesSource: Fairplay W orldshipping Encyclopedia 1998
Saves 2,846 Nautical M ilesSource: Fairplay W orldshipping Encyclopedia 1998

Saves 7,366 Nautical M ilesSource: Fairplay W orldshipping Encyclopedia 1998
Saves 7,366 Nautical M ilesSource: Fairplay W orldshipping Encyclopedia 1998
Ecuador - New YorkEcuador - New York

Principal Routes - FY 2000Principal Routes - FY 2000
42.0%42.0%
East Coast U.S. AsiaEast Coast U.S. Asia
COMMODITIES• GRAINS• CONTAINERS• CHEMICALS• FERTILIZERS &
PHOSPHATES• MANUFACTURERS
IRON & STEEL
East Coast U.S. East Coast U.S.
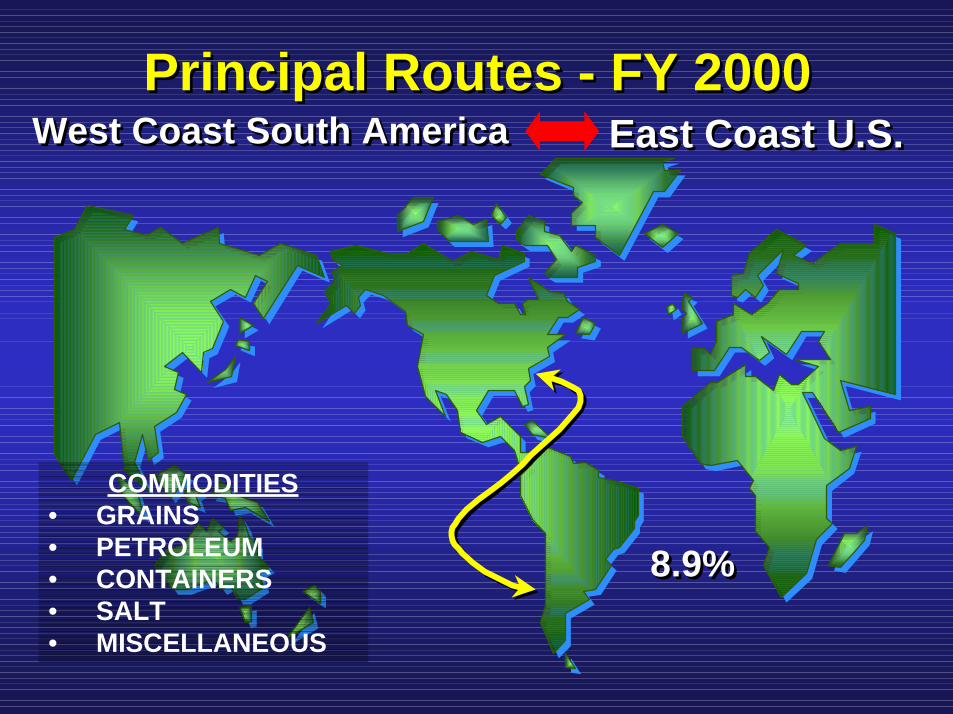
8.9%8.9%
Principal Routes - FY 2000Principal Routes - FY 2000West Coast South AmericaWest Coast South America
COMMODITIES• GRAINS• PETROLEUM• CONTAINERS• SALT• MISCELLANEOUS
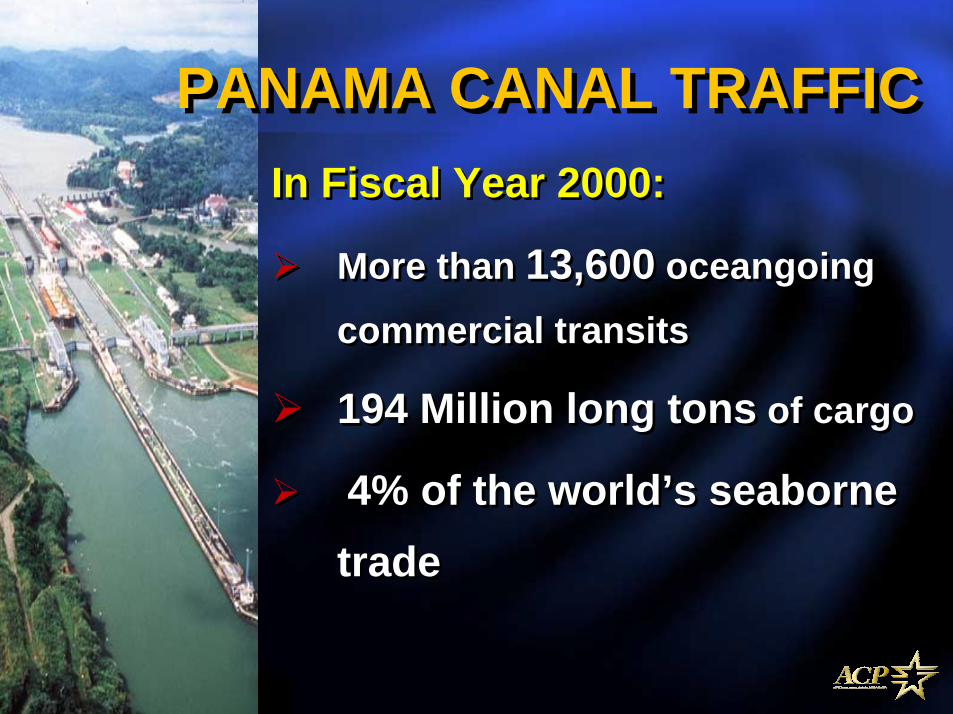
In Fiscal Year 2000:
! More than 13,600 oceangoingcommercial transits
! 194 Million long tons of cargo
! 4% of the world’s seabornetrade
In Fiscal Year 2000:
! More than 13,600 oceangoingcommercial transits
! 194 Million long tons of cargo
! 4% of the world’s seabornetrade
PANAMA CANAL TRAFFICPANAMA CANAL TRAFFIC

Transits by Principal Oceangoing Ship TypesTransits by Principal Oceangoing Ship TypesTransits by Principal Oceangoing Ship TypesTransits by Principal Oceangoing Ship TypesTransits by Principal Oceangoing Ship TypesTransits by Principal Oceangoing Ship TypesTransits by Principal Oceangoing Ship TypesTransits by Principal Oceangoing Ship Types
00
500500
1,0001,000
1,5001,500
2,0002,000
2,5002,500
3,0003,000
3,5003,500
4,0004,000
4,5004,500
Dry Bulk CarriersDry Bulk Carriers 3,8393,839 3,5503,550 3,4703,470 3,2653,265 3,0093,009ContainershipsContainerships 1,7271,727 1,8081,808 2,0692,069 1,9581,958 2,2122,212Refrigerated CargoRefrigerated Cargo 2,4742,474 2,4422,442 2,0182,018 1,9971,997 2,0292,029TankersTankers 2,0382,038 2,0712,071 1,8771,877 1,9291,929 2,0142,014General CargoGeneral Cargo 1,4171,417 1,3691,369 1,3141,314 999999 1,0521,052Vehicle CarriersVehicle Carriers 746746 702702 752752 879879 903903Passenger ShipsPassenger Ships 283283 296296 305305 297297 246246
19961996 19971997 19981998 19991999 20002000
Calendar Year

PC/UMS Net Tons by Principal Oceangoing Ship TypePC/UMS Net Tons by Principal Oceangoing Ship TypePC/UMS Net Tons by Principal Oceangoing Ship TypePC/UMS Net Tons by Principal Oceangoing Ship TypePC/UMS Net Tons by Principal Oceangoing Ship TypePC/UMS Net Tons by Principal Oceangoing Ship TypePC/UMS Net Tons by Principal Oceangoing Ship TypePC/UMS Net Tons by Principal Oceangoing Ship Type
0
10,000
20,000
30,000
40,000
50,000
60,000
70,000
80,000
90,000Th
ousa
nds
of N
et T
ons
Dry Bulk CarriersDry Bulk Carriers 81,91681,916 74,03674,036 71,81371,813 69,30869,308 65,38965,389ContainershipsContainerships 41,16141,161 43,85043,850 51,52451,524 50,90150,901 58,87158,871Vehicle CarriersVehicle Carriers 26,06726,067 24,96024,960 27,62227,622 32,80632,806 36,17136,171TankersTankers 34,49234,492 34,03934,039 31,16031,160 32,16332,163 32,55732,557Refrigerated CargoRefrigerated Cargo 17,56817,568 17,88117,881 14,76414,764 15,25115,251 15,52215,522Passenger ShipsPassenger Ships 7,7427,742 8,9898,989 9,4499,449 9,8729,872 8,7898,789General CargoGeneral Cargo 11,00411,004 10,64510,645 10,25610,256 7,5317,531 8,0148,014Liquid Gas CarriersLiquid Gas Carriers 2,6542,654 2,4552,455 2,2542,254 2,7302,730 2,6492,649
19961996 19971997 19981998 19991999 20002000
Calendar YearCalendar Year

Panama Canal UniversalMeasurement System (PCUMS)Panama Canal UniversalMeasurement System (PCUMS)Current Tolls$ 2.57 /PCUM S (laden)$ 2.04 /PCUM S (ballast)
$ 1.43 /displacem ent ton
Current Tolls$ 2.57 /PCUM S (laden)$ 2.04 /PCUM S (ballast)
$ 1.43 /displacem ent ton
One PCUM S Ton = 100 cubicfeet of cargo carryingcapacity
One PCUM S Ton = 100 cubicfeet of cargo carryingcapacity

Average PC/UMS Net TonnageAverage PC/UMS Net TonnageAverage PC/UMS Net TonnageAverage PC/UMS Net Tonnageof Oceangoing Vessels by Ship Typeof Oceangoing Vessels by Ship Typeof Oceangoing Vessels by Ship Typeof Oceangoing Vessels by Ship Type
Average PC/UMS Net TonnageAverage PC/UMS Net TonnageAverage PC/UMS Net TonnageAverage PC/UMS Net Tonnageof Oceangoing Vessels by Ship Typeof Oceangoing Vessels by Ship Typeof Oceangoing Vessels by Ship Typeof Oceangoing Vessels by Ship Type
0
5,000
10,000
15,000
20,000
25,000
30,000
35,000
40,000
45,000PC
/UM
S N
et T
ons
Vehicle Carriers 34,942 35,556 36,731 37,322 40,057Passenger Ship 27,358 30,369 30,981 33,239 35,729Containerships 23,834 24,253 24,903 25,997 26,614Dry-bulk Carrier 21,338 20,855 20,695 21,227 21,731Tanker 16,925 16,436 16,601 16,674 16,165Liquid-gas carrier 15,078 11,860 11,678 13,652 13,868Refrigerated Cargo 7,101 7,322 7,316 7,637 7,650General Cargo 7,766 7,776 7,805 7,539 7,618
1996 1997 1998 1999 2000
Calendar YearCalendar Year

Cargo Flow by Commodity TypeCargo Flow by Commodity TypeCargo Flow by Commodity TypeCargo Flow by Commodity TypeCargo Flow by Commodity TypeCargo Flow by Commodity TypeCargo Flow by Commodity TypeCargo Flow by Commodity TypeMillions of Long TonsMillions of Long Tons
Calendar Year1996 1997 1998 1999 2000
Grains 42.8 34.4 39.0 41.0 39.6Container cargo 25.8 27.5 28.7 30.4 34.2Petroleum and products 31.5 30.9 30.0 27.8 29.0Nitrates, phosphates and potash 15.6 15.3 14.6 13.3 12.7Manufactures of iron and steel 8.2 8.4 14.7 11.3 11.3Chemicals and petroleum chemicals 11.3 10.4 9.1 12.0 11.0Coal and coke 11.3 11.9 8.8 8.9 9.4Others 51.1 53.9 47.8 47.0 48.8
Total 197.7 192.7 192.7 191.7 195.8
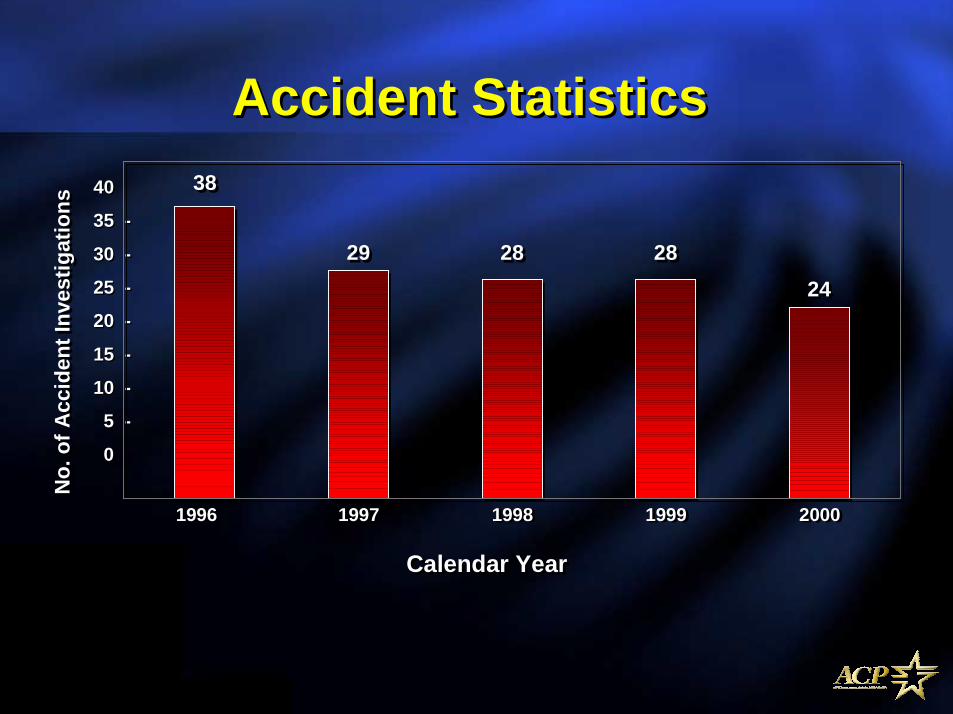
Accident StatisticsAccident Statistics
19971997
2929
19991999
2828
20002000
2424
19981998
2828
19961996
3838
-
-
-
-
-
-
-
-
-
-
-
-
-
-
Calendar YearCalendar Year
40
35
30
25
20
15
10
5
0
40
35
30
25
20
15
10
5
0
No.
of A
ccid
ent I
nves
tigat
ions
No.
of A
ccid
ent I
nves
tigat
ions

31.8
27.7
32
30.9
28.5
25
26
27
28
29
30
31
32
33
1996 1997 1998 1999 2000Year
Can
al W
ater
s Ti
me
in H
ours
Canal Waters TimeCanal Waters Time

TOTAL TRANSITS FY 1915 - 1999TOTAL TRANSITS FY 1915 - 1999
00
55
1010
1515
2020
2525
3030
3535
4040
4545
505019
1519
1519
1919
1919
2319
2319
2719
2719
3119
3119
3519
3519
3919
3919
4319
4319
4719
4719
5119
5119
5519
5519
5919
5919
6319
6319
6719
6719
7119
7119
7519
7519
7919
7919
8319
8319
8719
8719
9119
9119
9519
95
Fiscal YearFiscal Year
Tran
sits
in T
hous
ands
Tran
sits
in T
hous
ands
0.000.00
50.0050.00
100.00100.00
150.00150.00
200.00200.00
250.00250.00
TransitsTransits
1999
1999

TOTAL TRANSITS vs PC/UMS NET FY 1915 - 1999TOTAL TRANSITS vs PC/UMS NET FY 1915 - 1999
00
55
1010
1515
2020
2525
3030
3535
4040
4545
505019
1519
1519
1919
1919
2319
2319
2719
2719
3119
3119
3519
3519
3919
3919
4319
4319
4719
4719
5119
5119
5519
5519
5919
5919
6319
6319
6719
6719
7119
7119
7519
7519
7919
7919
8319
8319
8719
8719
9119
9119
9519
95
Fiscal YearFiscal Year
Tran
sits
in T
hous
ands
Tran
sits
in T
hous
ands
0.000.00
50.0050.00
100.00100.00
150.00150.00
200.00200.00
250.00250.00
PC/U
MS
Net
in M
illio
nsPC
/UM
S N
et in
Mill
ionsTransitsTransits PC/UMS NetPC/UMS Net
1999
1999

FY 1955FY 1955
4,8324,832
FY 1975FY 1975
9,9319,931
FY 2000FY 2000
18,64918,649
AVERAGE PC/UM S NET TO NNAGEAVERAGE PC/UM S NET TO NNAGEOceangoing Commercial VesselsOceangoing Commercial Vessels
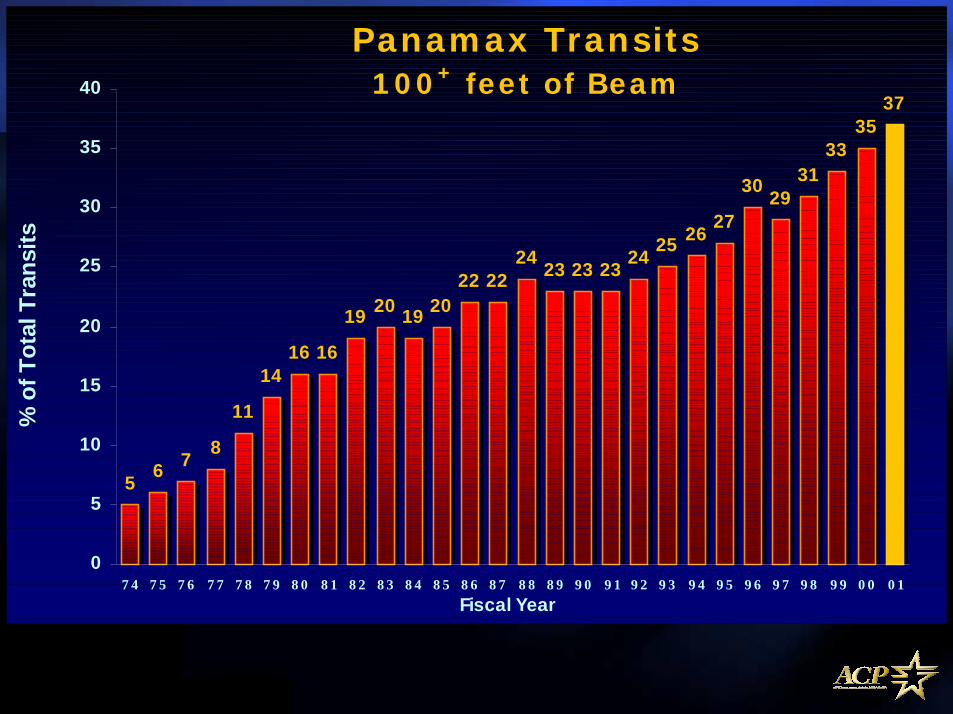
Panamax Transits100+ feet of Beam
5 6 7 8
11
1416 16
19 20 19 2022 22
24 23 23 23 24 25 26 27
30 2931
3335
37
0
5
10
15
20
25
30
35
40
7 4 7 5 7 6 7 7 7 8 7 9 8 0 8 1 8 2 8 3 8 4 8 5 8 6 8 7 8 8 8 9 9 0 9 1 9 2 9 3 9 4 9 5 9 6 9 7 9 8 9 9 0 0 0 1Fiscal Year
% o
f Tot
al T
rans
its

➨ Lockages in half the time➨ 4 locomotives required➨ 3 tug assignments➨ 1 pilot➨ No transit restriction
IMPACT OF VESSEL SIZEIMPACT OF VESSEL SIZE
< 80’ BEAM
➨ 6 or 8 locomotives required
➨ 7 to 10 tug assignments
➨ Minimum of 2 pilots
➨ Restricted to daylight transitPANAMAX

! Canal Performance
! Modernization Program
! Canal Performance
! Modernization Program
AgendaAgenda

ATLANTIC OCEANATLANTIC OCEAN
PACIFIC OCEANPACIFIC OCEAN
PANAM A CITYPANAM A CITY
BalboaBalboa
M IRAFLORES LOCKSM IRAFLORES LOCKS
PEDRO M IGUEL LOCKSPEDRO M IGUEL LOCKS
GAILLARD CUTGAILLARD CUT
M ADEN LAKEM ADEN LAKE
COLONCOLON
GATUN LOCKSGATUN LOCKS
GATUN LAKEGATUN LAKE
REPUBLIC OFPANAM A
REPUBLIC OFPANAM A

$1B Im provem ent andM odernization Program$1B Im provem ent andM odernization Program
CutCut WideningWidening
NewNew TugsTugs
NewNewLocomotivesLocomotives
EVTMSEVTMS
NewNew TrackTrack
LocksLocks MachineryMachinery

Benefits of Modernization ProgramBenefits of Modernization Program
" Increased Canal capacity by 20%" Reduced Canal Waters Time" Reduced impact of lane outages" Improved navigational safety" Reduced maintenance costs" Improved reliability

Total Transits Forecast vs CapacityTotal Transits Forecast vs Capacity
10,00010,000
12,00012,000
14,00014,000
16,00016,000
18,00018,000
20,00020,000
22,00022,000
24,00024,000
26,00026,000
28,00028,000
1995
1995
1998
1998
2001
2001
2004
2004
2007
2007
2010
2010
2013
2013
2016
2016
2019
2019
2022
2022
2025
2025
2028
2028
2031
2031
2034
2034
2037
2037
2040
2040
Tota
l Tra
nsits
Tota
l Tra
nsits
Fiscal YearFiscal Year
Canal CapacityTotal Transits

! Canal Performance
! Modernization Program
! Expansion Plans
! Canal Performance
! Modernization Program
! Expansion Plans
AgendaAgenda

Study Plans
Final DesignFinal Design
ImplementationImplementation
Reaching ConsensusReaching Consensus
Full-FeasibilityFull-Feasibility2001-20022001-2002
ConceptualConceptual
Reconnaissance orPre-feasibility
Reconnaissance orPre-feasibility
1999-20001999-2000
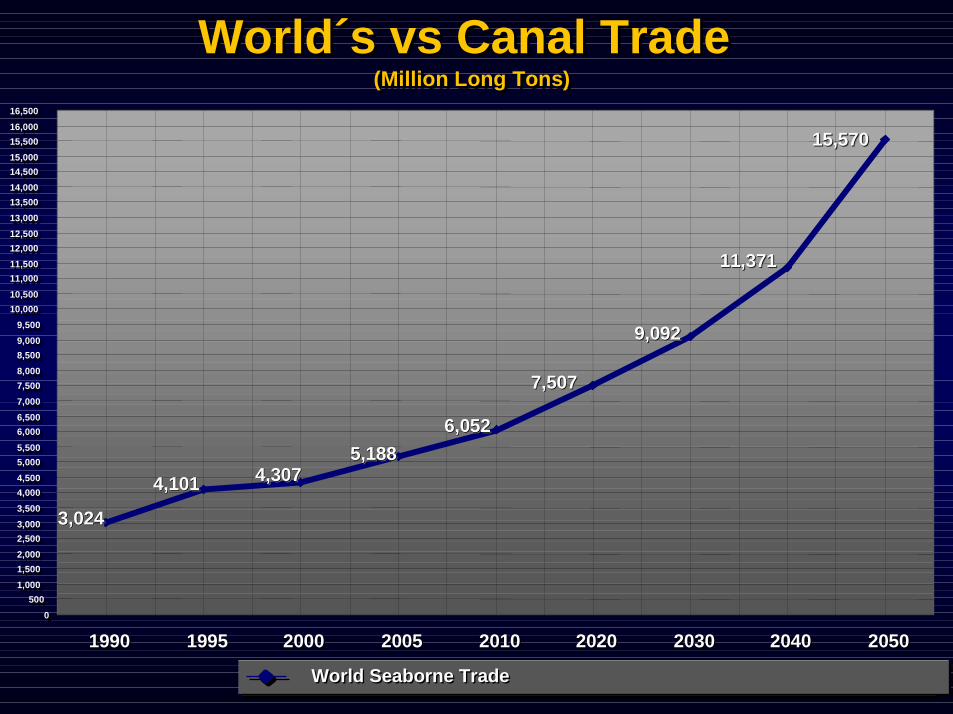
World´s vs Canal Trade World´s vs Canal Trade (Million Long Tons)(Million Long Tons)
11,37111,37111,371
9,0929,0929,092
7,5077,5077,507
6,0526,0526,0525,1885,1885,188
4,3074,3074,3074,1014,1014,101
3,0243,0243,024
15,57015,57015,570
00500500
1,0001,0001,5001,5002,0002,0002,5002,5003,0003,0003,5003,5004,0004,0004,5004,5005,0005,0005,5005,5006,0006,0006,5006,5007,0007,0007,5007,5008,0008,0008,5008,5009,0009,0009,5009,500
10,00010,00010,50010,50011,00011,00011,50011,50012,00012,00012,50012,50013,00013,00013,50013,50014,00014,00014,50014,50015,00015,00015,50015,50016,00016,00016,50016,500
19901990 19951995 20002000 20052005 20102010 20202020 20302030 20402040 20502050
World Seaborne TradeWorld Seaborne Trade

World´s vs Canal Trade World´s vs Canal Trade (Million Long Tons)(Million Long Tons)
11,37111,37111,371
9,0929,0929,092
7,5077,5077,507
6,0526,0526,0525,1885,1885,188
4,3074,3074,3074,1014,1014,101
3,0243,0243,024
15,57015,57015,570
8508508501,3461,3461,346 1,4261,4261,426 1,7831,7831,783
2,1502,1502,150 2,7762,7762,7763,4523,4523,452
4,4624,4624,462
6,3226,3226,322
00500500
1,0001,0001,5001,5002,0002,0002,5002,5003,0003,0003,5003,5004,0004,0004,5004,5005,0005,0005,5005,5006,0006,0006,5006,5007,0007,0007,5007,5008,0008,0008,5008,5009,0009,0009,5009,500
10,00010,00010,50010,50011,00011,00011,50011,50012,00012,00012,50012,50013,00013,00013,50013,50014,00014,00014,50014,50015,00015,00015,50015,50016,00016,00016,50016,500
19901990 19951995 20002000 20052005 20102010 20202020 20302030 20402040 20502050
World Seaborne TradeWorld Seaborne Trade Accessible Market shareAccessible Market share

World´s vs Canal Trade World´s vs Canal Trade (Million Long Tons)(Million Long Tons)
11,37111,37111,371
9,0929,0929,092
7,5077,5077,507
6,0526,0526,0525,1885,1885,188
4,3074,3074,3074,1014,1014,101
3,0243,0243,024
15,57015,57015,570
8508508501,3461,3461,346 1,4261,4261,426 1,7831,7831,783
2,1502,1502,150 2,7762,7762,7763,4523,4523,452
4,4624,4624,462
6,3226,3226,322
157157157 190190190 194194194 207207207 218218218 230230230 241241241 260260260 30830830800
5005001,0001,0001,5001,5002,0002,0002,5002,5003,0003,0003,5003,5004,0004,0004,5004,5005,0005,0005,5005,5006,0006,0006,5006,5007,0007,0007,5007,5008,0008,0008,5008,5009,0009,0009,5009,500
10,00010,00010,50010,50011,00011,00011,50011,50012,00012,00012,50012,50013,00013,00013,50013,50014,00014,00014,50014,50015,00015,00015,50015,50016,00016,00016,50016,500
19901990 19951995 20002000 20052005 20102010 20202020 20302030 20402040 20502050
World Seaborne TradeWorld Seaborne Trade Accessible Market shareAccessible Market share PCBaselinePCBaseline

2,500
4,790
6,000
8,000
2,500
4,790
6,000
8,000
M ILLIONM .T.
M ILLIONM .T.
YEARYEAR
1970
1996
2002
2015
1970
1996
2002
2015
ContainersGeneral cargoDry bulkLiquid bulk
Projections for seaborne commerceProjections for seaborne commerce
WORLD SEABORNE TRADEWORLD SEABORNE TRADE

Fuente: Fairplay Solutions, JUNE 2000-ISSUE No. 45
ContainershipsContainerships Newbuilding orders: 484 Feb. 2001)Newbuilding orders: 484 Feb. 2001)
23%
21%
10%1%
39%
6%
Feeder Feedermax Handy
Sub-Panamax Panamax Post-Panamax
23%
21%
10%1%
39%
6%
Feeder Feedermax Handy
Sub-Panamax Panamax Post-Panamax
Source: Fairplay Solutions, March 2001Source: Fairplay Solutions, March 2001

Fuente: Fairplay Solutions, June 2000 ISSUE No. 45
Newbuildings on order (1,576,896 TEUs Feb 2001)Newbuildings on order (1,576,896 TEUs Feb 2001)Containerships - CapacityContainerships - Capacity
Source: Fairplay Solutions, March 2001Source: Fairplay Solutions, March 2001
18%
6%
9%2%
65%
Feedermax Handy Sub-PanamaxPanamax Post-Panamax
18%
6%
9%2%
65%
Feedermax Handy Sub-PanamaxPanamax Post-Panamax


POST-PANAMAX
POST-PANAMAX
MAX DRAFT:50 FEET
15.2M
MAX DRAFT:50 FEET
15.2M
MAXDRAFT:
39.5 FEET12 M.
MAXDRAFT:
39.5 FEET12 M.
MAX BEAM:180 FEET
53.9M
MAX BEAM:180 FEET
53.9M
MAX BEAM:106 FEET
32.5 M.
MAX BEAM:106 FEET
32.5 M.
MAXLENGTH:
1,265 FEET385.6M
MAXLENGTH:
1,265 FEET385.6M
MAXLENGTH:965 FEET
294 M.
MAXLENGTH:965 FEET
294 M.
PANAMAXPANAMAX

REVENUESREVENUESLEGALSTRUCTURE
LEGALSTRUCTURE
FINANCING STRUCTUREFINANCING
STRUCTUREFINANCIAL
RISKFINANCIAL
RISK
Major Areas of StudyMajor Areas of Study
SOCIO-ECONOMIC
IMPACT
SOCIO-ECONOMIC
IMPACT
PRICINGSGTRATEGY
MARKET
TRAFFIC RISKRISK
COMMUNICATION
STRATEGYCOMMUNICATION
STRATEGY
WATERWATER
LOCKSLOCKS
DRAFTDRAFT
SOCIO-ENVIRONMENTAL
SOCIO-ENVIRONMENTAL

Market Research and AnalysisMarket Research and Analysis• Long-term traffic forecasts, sensitivity and risk
analysis
• Marketing visits to major Canal users, shipowners,shippers, and maritime organizations
• Independent long-term traffic forecast
• Detailed market segments analysis will continue forremainder of this year, along with evaluations oftransportation alternatives

Water Studies
• Reconnaissance studies – withUSACE-Mobile (1998-1999)
Selection ofprojects with
greatest potential5 projects
Final evaluationand ranking19 projects
Initial evaluation30 possibleprojects

Projects that require new dam constructionProjects that require new dam construction

Projects under study and their potential forincreasing the watershed´s available capacityProjects under study and their potential forincreasing the watershed´s available capacity• Coclé del Norte 40+
(with Caño Sucio & Río Indio )• Coclé del Norte 40+
(with tunnel to Río Indio )• Storage/Pumping from 31
Coclé del Norte to Toabré(with Caño Sucio & Río Indio )
• Coclé del Norte at 65M 25(with tunnel to Río Indio )
• Toabré and Caño Sucio 23(with Río Indio )
• Caño Sucio ( Río Indio ) 14• Río Indio 11
• Gatún Lake deepening 6• Lower Trinidad 4• Recycling ponds 4
Gatún Locks• Cirí Grande 3• Salud 2• Raise Gatún Lake level 2• Raise Madden Lake level 1• Lagarto 1• Pacora (potable water) 1• Caimito (potable water) 1• Pumping one lockage 1
of saltwater to Gatún Lake
● Alto Chagres 8* One lockage represents 55 million gallons of water.
Water StudiesWater Studies
● Full-feasibility study of:
➨ the deepening of Gatun Lake toincrease active storage and
➨ a new reservoir at Río Indio
● Full-feasibility study of:
➨ the deepening of Gatun Lake toincrease active storage and
➨ a new reservoir at Río Indio

Elev. 23.5 Elev. 23.5
Phase II(final)
Phase II(final)
5.0’5.0’
78.5’78.5’87.5’87.5’
50.0’50.0’DraftDraft
ShipShip
Elev. 34.0 Elev. 34.0
Phase I(initial)Phase I(initial)
ShipShip
46.0’46.0’
5.0’5.0’
DraftDraft
85.0’85.0’87.5’87.5’
Elev. 37.0 Elev. 37.0
5.0’5.0’
81.5’81.5’87.5’87.5’
CurrentCurrent
ShipShip
Operation LevelsOperation Levels
39.5’39.5’DraftDraft
Gatún Lake Operations

Post-PanamaxVessel and Lock SizesPost-PanamaxVessel and Lock Sizes
Vessel LocksBeam 53.9m (180') 61 m (200')Length 385.6m (1,265') 426.8m (1,400')Draft 15.2m (50') 18.3 m (60')
Post-Panamax Measurements

Vessel Size andPost-Panamax LocksVessel Size andPost-Panamax Locks

New LocksNew Locks
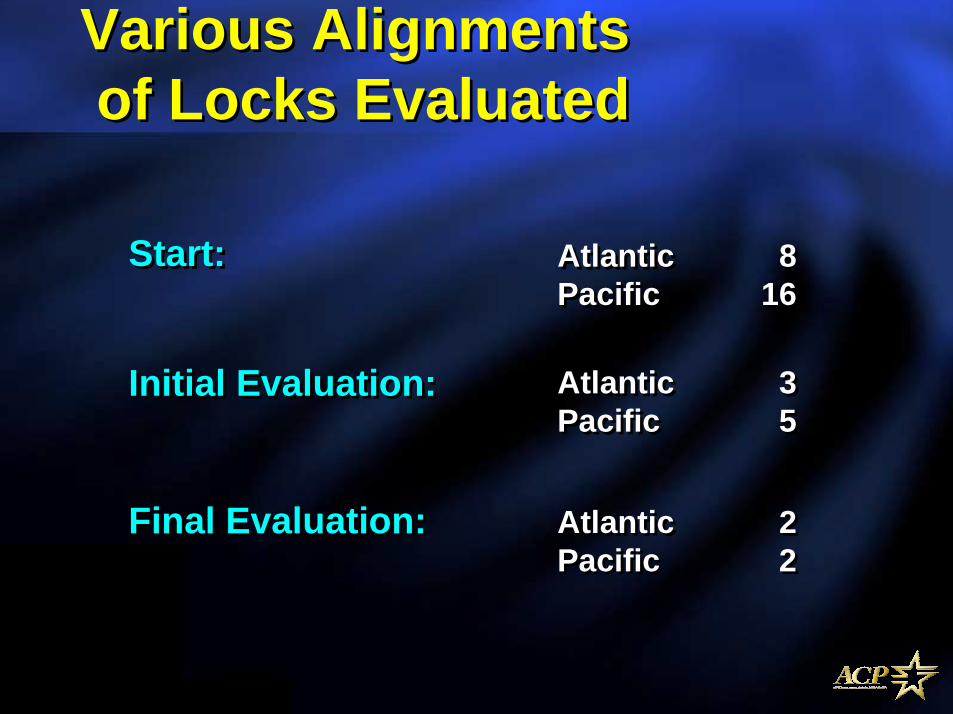
• Analysis of new lock alignment channels wascompleted - reducing potential sites from 24to two on each end of the Canal
• Analysis of new lock alignment channels wascompleted - reducing potential sites from 24to two on each end of the Canal
Various Alignments of Locks EvaluatedVarious Alignments of Locks Evaluated
Start:Start: Atlantic 8Pacific 16Atlantic 8Pacific 16
Initial Evaluation:Initial Evaluation: Atlantic 3Pacific 5Atlantic 3Pacific 5
Final Evaluation:Final Evaluation: Atlantic 2Pacific 2Atlantic 2Pacific 2

Coffer DamCoffer Dam
Excavated Area
Excavated Area
New Locks3 levels
New Locks3 levels
FloodedArea
FloodedArea
FloodedArea
FloodedArea Explosives
AreaExplosives
Area
AlignmentChannel
AlignmentChannel
Miraflores LocksMiraflores Locks
Pedro Miguel Locks
Pedro Miguel Locks
Alignment ChannelsPacific SideAlignment ChannelsPacific Side
• Just one set of locks on the Pacific Side• Takes advantage of the 1939 excavation• Requires a coffer dam in Miraflores Lake
• Just one set of locks on the Pacific Side• Takes advantage of the 1939 excavation• Requires a coffer dam in Miraflores Lake

Alignment ChannelPacific SideAlignment ChannelPacific Side• Just one set of locks on the Pacific Side• Makes use of topography to isolate Miraflores Lake• Just one set of locks on the Pacific Side• Makes use of topography to isolate Miraflores Lake
Auxiliary Dam
Auxiliary Dam
Auxiliary Dam
Auxiliary Dam
Water-Saving Basins
Water-Saving Basins
Third Set of LocksMiraflores- 3 levelsThird Set of LocksMiraflores- 3 levels
Auxiliary Dam
Auxiliary DamFlooded
AreaFlooded Area
PacificOcean
PacificOcean
Miraflores LocksMiraflores LocksPedro Miguel LocksPedro Miguel Locks

Water-Saving BasinsWater-Saving Basins
Third Set of Locks3 Levels
Third Set of Locks3 Levels
French CanalFrench Canal
Gatun LakeGatun Lake
1939 Excavation1939 ExcavationProposed
Third LocksProposed
Third Locks
Gatun LocksGatun Locks
A1A1
A2A2
Alignment ChannelAtlantic SideAlignment ChannelAtlantic Side
• A1 Takes advantage of 1939 excavation• A2 Optimal integration of Canal Operation • A1 Takes advantage of 1939 excavation• A2 Optimal integration of Canal Operation

Type and Size of GatesType and Size of GatesBerendrecht: sea lock at
the Port of Antwerp.
# Berendrecht lockchamber: 500 m by 68m by 13.5 m
# Panama Canal projectlock chamber: 426.7m by 61 m by 18.3 m
Berendrecht: sea lock atthe Port of Antwerp.
# Berendrecht lockchamber: 500 m by 68m by 13.5 m
# Panama Canal projectlock chamber: 426.7m by 61 m by 18.3 m

Type and Size of GatesType and Size of Gates
Model of Sliding Gates in Zeebrugge andBerendrecht, Belgium, showing flotationchambers and construction detail
Model of Sliding Gates in Zeebrugge andBerendrecht, Belgium, showing flotationchambers and construction detail

Type and Size of GatesType and Size of Gates
Closed Gate
Width of chamber: 66 m.
Closed Gate
Width of chamber: 66 m.
Recessed gateEngine Room in
background
Recessed gateEngine Room in
background

Required Maximum Heightsof GatesRequired Maximum Heightsof Gates
Maximum Height of Gate feet meters feet meters
One Level 154 46.95 161 49.09
Two Levels 119 36.28 127 38.72
Three Levels 105 32.01 115 35.06
Atlantic Pacific
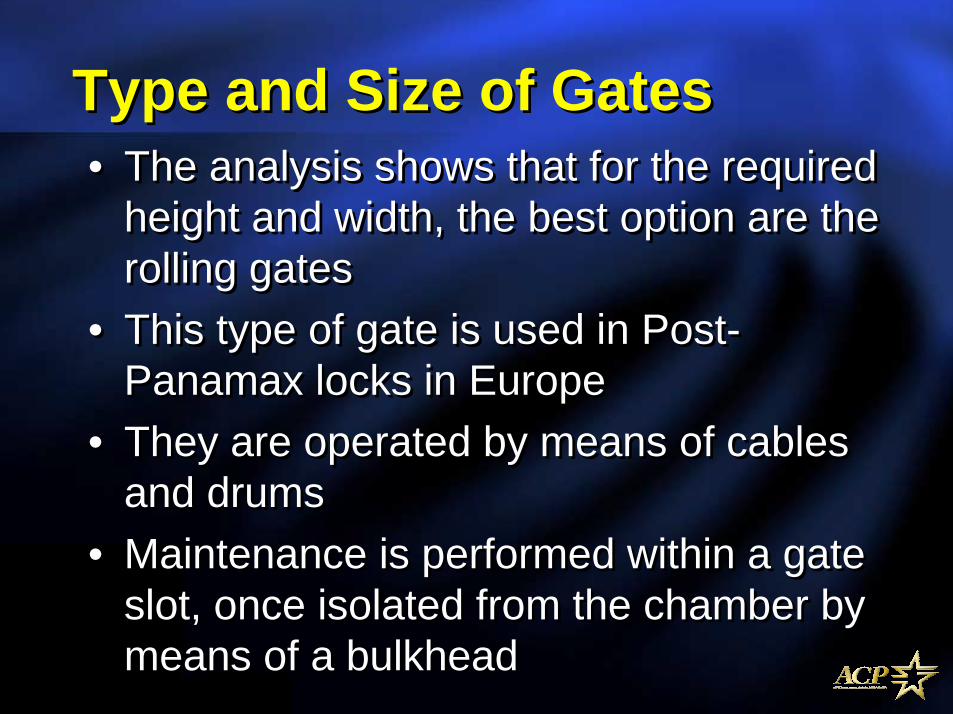
Type and Size of GatesType and Size of Gates• The analysis shows that for the required
height and width, the best option are therolling gates
• This type of gate is used in Post-Panamax locks in Europe
• They are operated by means of cablesand drums
• Maintenance is performed within a gateslot, once isolated from the chamber bymeans of a bulkhead
• The analysis shows that for the requiredheight and width, the best option are therolling gates
• This type of gate is used in Post-Panamax locks in Europe
• They are operated by means of cablesand drums
• Maintenance is performed within a gateslot, once isolated from the chamber bymeans of a bulkhead

Lateral BasinsLateral Basins• Lateral Basins in Germany save on water
use• Lateral Basins in Germany save on water
use

Operation of Water-Savingand Recycling System
Operation of Water-Savingand Recycling System

Navigational ChannelsNavigational Channels
• Initial design parameters defined for vesselswith 45m (150’) beam
• Excavation volumes estimated for 14m (46’)and 15.3m (50’) draft
• Consultations held with largest dredgingcompanies

Environmental andSocio-economic EvaluationsEnvironmental andSocio-economic Evaluations
• Studies for the Western Region of theCanal Watershed with support from theInteramerican Development Bank (IDB)
• Major contracts awarded for thegathering of environmental and socio-economic data

Economic and Financial Issues
• Presentation of ACP´s annual results,market conditions and corporate outlookat the New York and London financialand investment markets
• Market feedback• Developed Economic/financial action plan
• Presentation of ACP´s annual results,market conditions and corporate outlookat the New York and London financialand investment markets
• Market feedback• Developed Economic/financial action plan

Economic and FinancialIssuesEconomic and FinancialIssues• Action plan includes:
– risk mapping– corporate economic value– legal analysis– credit rating– financing plan

REVENUESREVENUESLEGALSTRUCTURE
LEGALSTRUCTURE
FINANCING STRUCTUREFINANCING
STRUCTUREFINANCIAL
RISKFINANCIAL
RISK
Study plansStudy plans
SOCIO-ECONOMIC
IMPACT
SOCIO-ECONOMIC
IMPACT
PRICINGSGTRATEGY
MARKET
TRAFFIC RISKRISK
COMMUNICATION
STRATEGYCOMMUNICATION
STRATEGY
WATERWATER
LOCKSLOCKS
DRAFTDRAFT
SOCIO-ENVIRONMENTAL
SOCIO-ENVIRONMENTAL

Rodolfo SabongeRodolfo SabongeRodolfo SabongeRodolfo Sabonge
Director, Corporate Planning and MarketingDirector, Corporate Planning and MarketingDirector, Corporate Planning and MarketingDirector, Corporate Planning and Marketing
Panama Canal AuthorityPanama Canal AuthorityPanama Canal AuthorityPanama Canal Authority
The Panama Canal:Modernization and Expansion
The Panama Canal:Modernization and Expansion
26th Annual Summer Ports, Waterways, Freight &International Trade Conference
June 26, 2001Galveston, Texas
26th Annual Summer Ports, Waterways, Freight &International Trade Conference
June 26, 2001Galveston, Texas