the partners of the european sustainable phosphorus platform · european sustainable phosphorus...
TRANSCRIPT
European Sustainable Phosphorus Platform SCOPE Newsletter [email protected] I www.phosphorusplatform.eu c/o European Partners for the Environment, av. Tervuren 216, B-1150 Brussels, Belgium
April 2014 n° 103
April 2014 n° 103 page 1
P-recovery and recycling Biorefine Cluster Europe Energy and nutrient cycling for a sustainable economy Interconnecting nutrient and energy cycling projects to contribute economically and environmentally sustainable resource management.
Australia P-recovery technology review Perspectives for P-recycling routes and products from wastewaters in the future
Maize bio-ethanol Myo-inositol and P recovery from corn steep water Enzyme hydrolysis ion exchange resin separation and chromatographic column separation.
Policy and regulation Composts and digestates European EoW criteria finalised but suspended The EU has finalized End-of-Waste criteria for composts and digestates. However, implementation is suspended.
Phosphorus sustainability Who, why and how: an assessment The real drivers for phosphorus sustainability, societal processes and the actors involved.
Sweden Flexible fees and nutrient pollution Swedish NGO proposals for an “import tax” on phosphorus and nitrogen not supported by study report.
Phosphorus sustainability Expert summary of the phosphorus challenge
Willem Schipper, industry consultant, looks at challenges of phosphorus sustainability and possible actions.
Planetary boundaries Eutrophication not resource scarcity limits sustainable P Phosphorus rock reserves should feed the world for a long time but damage to surface water systems from runoff makes current P-use unsustainable
Phosphorus flows Minneapolis – Saint Paul Survey of household nutrient and carbon flows Domestic pets are significant contributors to urban P consumption and so to surface waters and to sewage.
China Nutrient efficiency in the food chain Thesis assesses N and P flows and losses in food production and consumption chain
England Food additives and eutrophication Food additive phosphates estimated to contribute 5-10% of P in domestic sewage in UK
Phosphorus in sewage Different sources of P in domestic sewage Different contributions of P to sewage are estimated, showing the difficulty to derive reliable figures.
Opportunities, Networks,News Horizon 2020, Perspectives for phosphorus futures,
P-recycling Research Report, Projects Agenda
The partners of the European Sustainable Phosphorus Platform
European Sustainable Phosphorus Platform SCOPE Newsletter [email protected] I www.phosphorusplatform.eu c/o European Partners for the Environment, av. Tervuren 216, B-1150 Brussels, Belgium
April 2014 n° 103 page 2
P-recovery and P-recycling
Biorefine Cluster Europe Energy and nutrient cycling for a
sustainable economy
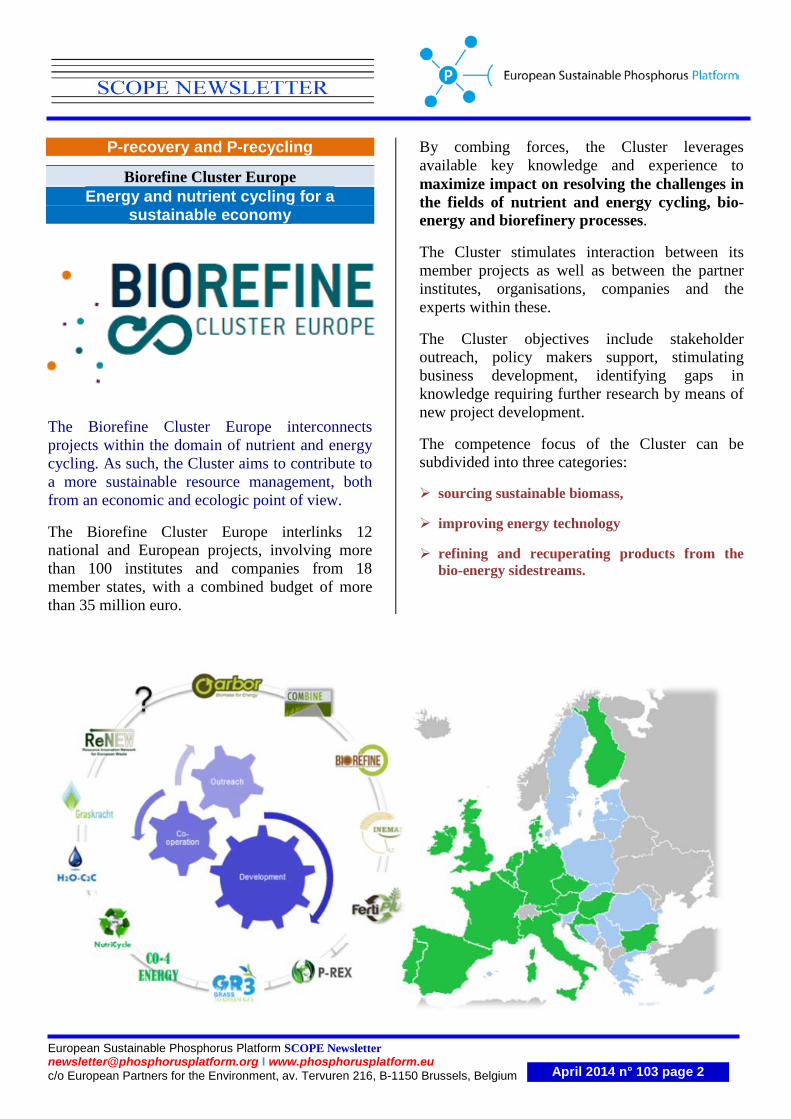
The Biorefine Cluster Europe interconnects projects within the domain of nutrient and energy cycling. As such, the Cluster aims to contribute to a more sustainable resource management, both from an economic and ecologic point of view.
The Biorefine Cluster Europe interlinks 12 national and European projects, involving more than 100 institutes and companies from 18 member states, with a combined budget of more than 35 million euro.
By combing forces, the Cluster leverages available key knowledge and experience to maximize impact on resolving the challenges in the fields of nutrient and energy cycling, bio-energy and biorefinery processes.
The Cluster stimulates interaction between its member projects as well as between the partner institutes, organisations, companies and the experts within these.
The Cluster objectives include stakeholder outreach, policy makers support, stimulating business development, identifying gaps in knowledge requiring further research by means of new project development.
The competence focus of the Cluster can be subdivided into three categories:
sourcing sustainable biomass,
improving energy technology
refining and recuperating products from the bio-energy sidestreams.
European Sustainable Phosphorus Platform SCOPE Newsletter [email protected] I www.phosphorusplatform.eu c/o European Partners for the Environment, av. Tervuren 216, B-1150 Brussels, Belgium
April 2014 n° 103 page 3
Connecting people
In the Cluster and its participating projects, specialists from varying fields of expertise are involved, with a balance of academia, policy makers and industries. By gathering and connecting these individuals, interactions may develop that benefit all people involved together with their projects. In numerous cases, research questions or implementation challenges arising in one project can easily be tackled by using outcomes or expertise from another project.
By putting like-minded consortia into closer contact with each other, new synergies with mutual benefit naturally emerge. In the near future, the Cluster will invest in developing networks to stimulate mobility of experts and interaction between companies and institutes, for example via International Training Networks (Marie Curie), COST Actions, industrial joint PhD systems, industrial innovation voucher systems etc.
Enhancing stakeholder impact
Another advantage of combining forces leading to multiplied rather than summated effects, is the increased impact of jointly organised events (conferences, workshops etc.) or other forms of joint output (reports, position papers, memoranda etc.) versus a single project’s outreach.
Success stories are the international ManuREsource conference (Bruges) and the Renewable Resources and Biorefineries conference (RRB-9 Antwerp). Both took place in 2013 and provided a good representation of projects in the Cluster. Similar support is foreseen for the RRB-10 conference in Spain (June 2014; www.rrbconference.com ) and the second Sustainable Phosphorus Conference (ESPC-2) in Berlin (March 2015 www.phosphorusplatform.eu ).
Additionally, the Cluster can help increase dissemination of news items and deliverables of projects by introducing them in newsletters and news feeds of other projects as well as those from the Cluster itself.
Furthermore, the Cluster website (www.biorefine.eu) expects to generate more visits to each of the member project websites and will offer extended exposure to the member projects beyond the lifetime of the projects themselves.
Finally, the ‘convincing power’ towards policy makers or product end-users is stronger when different projects point in the same direction; e.g. when regulatory changes are required or marketing of products needs to be stimulated.
Stimulating Development and Implementation
The final goal of all Research & Development is (or should be) the actual implementation of innovative technologies or strategies into the market. Clustering forces can lead to more concerted actions in taking away constraints, thus accelerating market implementation. Some projects within the Cluster focus more on regulatory roadmaps, whereas others focus more on industrial pilot demonstration or on academic backing towards topics such as nutrient use efficiency or quality assurances of bio fertiliser P.
Simultaneously, the Biorefine Cluster facilitates the development, application and acquisition of new scientific and industrial projects that can help the circular economy move forward.
European Sustainable Phosphorus Platform SCOPE Newsletter [email protected] I www.phosphorusplatform.eu c/o European Partners for the Environment, av. Tervuren 216, B-1150 Brussels, Belgium
April 2014 n° 103 page 4
What Biorefine Cluster Europe can do for you
The Biorefine Cluster initiative was launched by the NWE Interreg IV.B project BIOREFINE and has already been joined by many projects. The Cluster is currently in full growth, accepting new projects and their consortia, applying for membership at increasing pace. These new projects and consortia will set the groundwork for the activities related to the Cluster. Initial stages will be managed by the International Steering Group, which consists of institutes that coordinate at least one actively running project associated to the Cluster. The aim is to quickly evolve to a more involved community in which other institutes within the framework of the Cluster take the lead in organisation, communication and dissemination.
The Cluster’s final aim is to develop a community of like-minded professionals sharing a common interest in the disciplines involved in biorefinery. People involved in projects or other collaborative settings in the broader scope of bio-energy and biorefineries wanting to join, can contact the Cluster coordinators for more information (see below this article). Likewise, people or institutes with a concept for project development or novel ideas for activities in which the Cluster or participating projects can play a role are also welcome to contact the coordinators.
Authors: Erik Meers, Lies De Clercq, Eva Clymans, Evi Michels, Jeroen Buysse
Cluster coordination: Prof. E. Meers; Prof. J. Buysse, Ghent University, Belgium, Coupure Links 653, 9000 Ghent
www.biorefine.eu Contact person: Eva Clymans.
Acknowledgement:The organisation and communication as relating to the Biorefine Cluster Europe is funded by the INTERREG-NW.E-IV.B. project BIOREFINE.
Australia P-recovery technology review
CSIRO Australia has carried out an extensive review of P-recovery and recycling technologies that will enable resource recovery from wastewater into the future.
NOTE: this article represents the authors views not necessarily those of the SCOPE Newsletter.
The recovery of phosphorus (P) from wastewater cannot be approached in isolation from the competing needs of treating the water to a required quality and recovering additional resources, such as recycled water and energy.
The study showed that there are four key products likely to be recovered increasingly from wastewater using existing or emerging technologies: • Recycled water • Energy through methane capture • Phosphorus recovery through methods such as
crystallisation • Biosolids with improved bioavailability. Whilst wastewater contains significant concentrations of ammonia, its recovery is not currently commercially viable in most instances and requires a step-change in technology for its recovery.
Benchmark Technologies
A series of benchmark technologies for the management of the individual components of wastewater were identified:
• Water: coagulation/flotation, membrane filtration, source control
• Energy: autotrophic bacteria (energy saving), anaerobic digestion (energy production)
• Heat: recovery for heating, improving process efficiency (anaerobic digestion, biosolids improvements, membrane distillation)
• Phosphorus: biological accumulation and release, crystallisation as struvite, source control
• Nitrogen: removal by autotrophic bacteria, incorporation into struvite, source control.
European Sustainable Phosphorus Platform SCOPE Newsletter [email protected] I www.phosphorusplatform.eu c/o European Partners for the Environment, av. Tervuren 216, B-1150 Brussels, Belgium
April 2014 n° 103 page 5
Key synergies which exist between these benchmark technologies were identified: • The separation of C and N in primary wastewater
treatment. This enables the implementation of deammonification technologies for N removal, requiring lower amounts of C for biological denitrification, and enables more C to be used for energy generation using anaerobic digestion.
• The use of membranes in conjunction with anaerobic digestion. This enables greater water recycling, increased solids retention time to increased methane yield, and reduces digester size (capital investment).
• Use of waste heat to improve anaerobic digestion. This enables reduced digester size, increased methane yield and decreased biosolids production.
• The combination of anaerobic digestion with struvite precipitation followed by deammonification to remove ammonia.
• P-adsorbents developed for the polishing of treated wastewater may be incorporated directly into biosolids.
Future Outlook
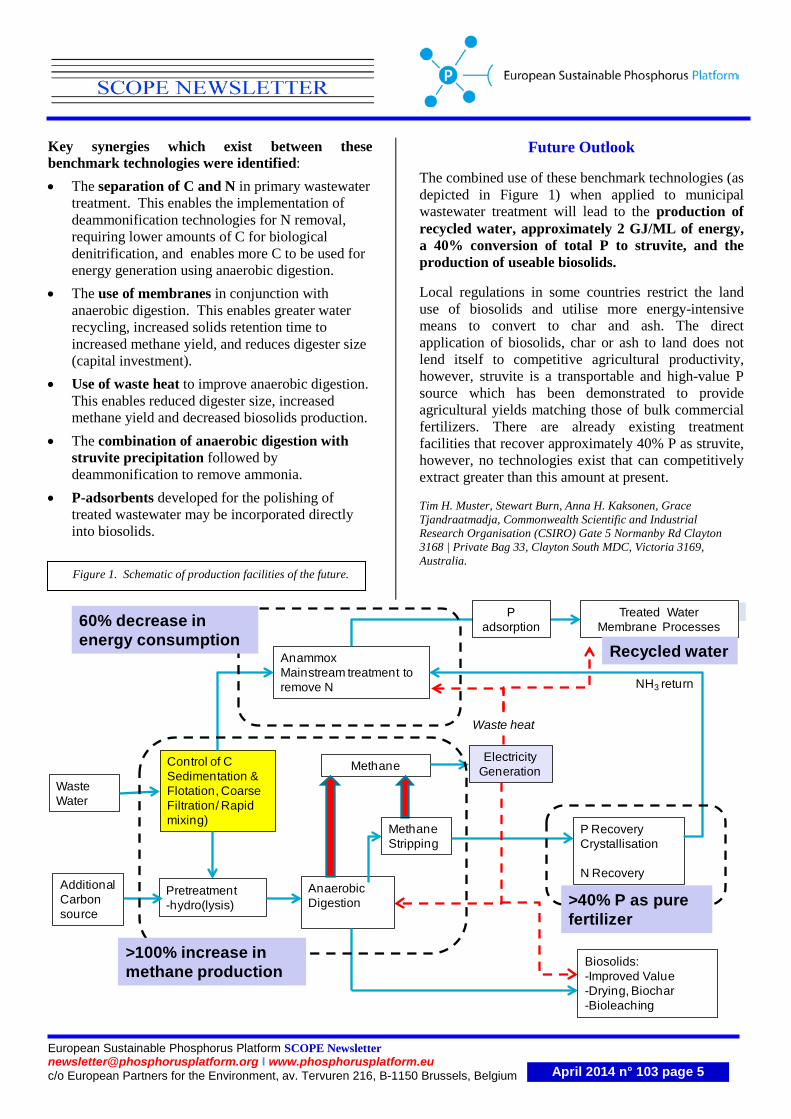
The combined use of these benchmark technologies (as depicted in Figure 1) when applied to municipal wastewater treatment will lead to the production of recycled water, approximately 2 GJ/ML of energy, a 40% conversion of total P to struvite, and the production of useable biosolids.
Local regulations in some countries restrict the land use of biosolids and utilise more energy-intensive means to convert to char and ash. The direct application of biosolids, char or ash to land does not lend itself to competitive agricultural productivity, however, struvite is a transportable and high-value P source which has been demonstrated to provide agricultural yields matching those of bulk commercial fertilizers. There are already existing treatment facilities that recover approximately 40% P as struvite, however, no technologies exist that can competitively extract greater than this amount at present.
Tim H. Muster, Stewart Burn, Anna H. Kaksonen, Grace Tjandraatmadja, Commonwealth Scientific and Industrial Research Organisation (CSIRO) Gate 5 Normanby Rd Clayton 3168 | Private Bag 33, Clayton South MDC, Victoria 3169, Australia.
Figure 1. Schematic of production facilities of the future.
Control of CSedimentation & Flotation, Coarse Filtration/ Rapid mixing)
Pretreatment-hydro(lysis)
Waste Water
Methane
Anaerobic Digestion
AnammoxMainstream treatment to remove N
Methane Stripping
Biosolids:-Improved Value-Drying, Biochar-Bioleaching
Treated Water Membrane Processes
P RecoveryCrystallisation
N Recovery
Electricity Generation
Waste heat
Additional Carbon source
NH3 return
60% decrease in energy consumption
>100% increase in methane production
>40% P as purefertilizer
Recycled water
P adsorption
European Sustainable Phosphorus Platform SCOPE Newsletter [email protected] I www.phosphorusplatform.eu c/o European Partners for the Environment, av. Tervuren 216, B-1150 Brussels, Belgium
April 2014 n° 103 page 6
Maize bio-ethanol Myo-inositol and P recovery from corn
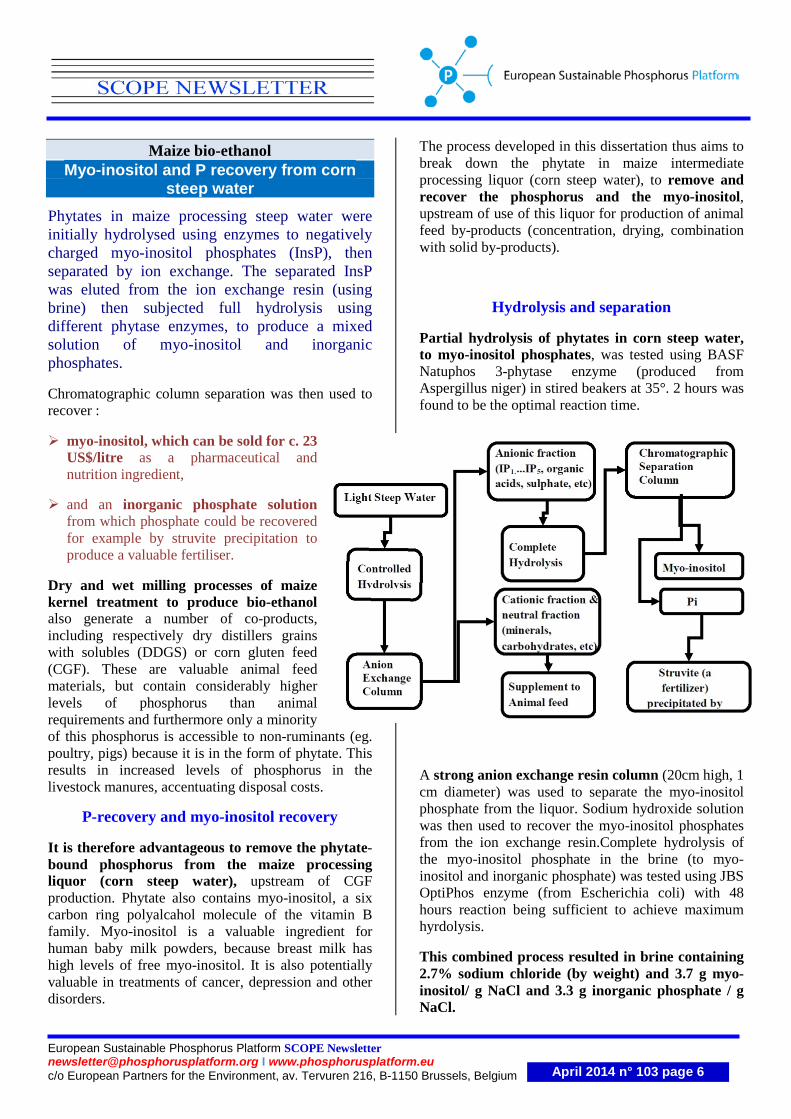
steep water Phytates in maize processing steep water were initially hydrolysed using enzymes to negatively charged myo-inositol phosphates (InsP), then separated by ion exchange. The separated InsP was eluted from the ion exchange resin (using brine) then subjected full hydrolysis using different phytase enzymes, to produce a mixed solution of myo-inositol and inorganic phosphates.
Chromatographic column separation was then used to recover :
myo-inositol, which can be sold for c. 23 US$/litre as a pharmaceutical and nutrition ingredient,
and an inorganic phosphate solution from which phosphate could be recovered for example by struvite precipitation to produce a valuable fertiliser.
Dry and wet milling processes of maize kernel treatment to produce bio-ethanol also generate a number of co-products, including respectively dry distillers grains with solubles (DDGS) or corn gluten feed (CGF). These are valuable animal feed materials, but contain considerably higher levels of phosphorus than animal requirements and furthermore only a minority of this phosphorus is accessible to non-ruminants (eg. poultry, pigs) because it is in the form of phytate. This results in increased levels of phosphorus in the livestock manures, accentuating disposal costs.
P-recovery and myo-inositol recovery
It is therefore advantageous to remove the phytate-bound phosphorus from the maize processing liquor (corn steep water), upstream of CGF production. Phytate also contains myo-inositol, a six carbon ring polyalcahol molecule of the vitamin B family. Myo-inositol is a valuable ingredient for human baby milk powders, because breast milk has high levels of free myo-inositol. It is also potentially valuable in treatments of cancer, depression and other disorders.
The process developed in this dissertation thus aims to break down the phytate in maize intermediate processing liquor (corn steep water), to remove and recover the phosphorus and the myo-inositol, upstream of use of this liquor for production of animal feed by-products (concentration, drying, combination with solid by-products).
Hydrolysis and separation
Partial hydrolysis of phytates in corn steep water, to myo-inositol phosphates, was tested using BASF Natuphos 3-phytase enzyme (produced from Aspergillus niger) in stired beakers at 35°. 2 hours was found to be the optimal reaction time.
A strong anion exchange resin column (20cm high, 1 cm diameter) was used to separate the myo-inositol phosphate from the liquor. Sodium hydroxide solution was then used to recover the myo-inositol phosphates from the ion exchange resin.Complete hydrolysis of the myo-inositol phosphate in the brine (to myo-inositol and inorganic phosphate) was tested using JBS OptiPhos enzyme (from Escherichia coli) with 48 hours reaction being sufficient to achieve maximum hyrdolysis.
This combined process resulted in brine containing 2.7% sodium chloride (by weight) and 3.7 g myo-inositol/ g NaCl and 3.3 g inorganic phosphate / g NaCl.
European Sustainable Phosphorus Platform SCOPE Newsletter [email protected] I www.phosphorusplatform.eu c/o European Partners for the Environment, av. Tervuren 216, B-1150 Brussels, Belgium
April 2014 n° 103 page 7
Quantification and recovery
The author developed a specific high performance liquid chromatography (HPLC) to enable quantification of both myo-inositol and phosphate phosphate in the brine, without interference from salt ions.
A size-exclusion chromatography (SEC) column (internal diameter 0.75, length 150 cm) containing Toyopearl HW-40S resin showed effective separation the myo-inositol and inorganic phosphate from the residual phytase molecules present in the brine. Ion charge exclusion effects also played a role. Shorter columns did not achieve good separation.
53% of the myo-inositol and 70% of the inorganic phosphorous could be separated and recovered. The authors suggest this could possibly be improved by using an even longer column or pressure.
Possible scale-up and implementation are discussed. The corn steep water is generated hot in the maize processing plants, so no energy would be needed to heat the partial hydrolysis step.
The SEC column final separation process would probably be too slow for industrial application. This could be replaced by an initial separation of the phytase enzyme onto a solid support (enabling its recovery and reuse), followed by an anion exchange column to separate the myo-inositol for recovery and an inorganic phosphate containing liquid stream suitable for P-recovery by eg. struvite precipitation (to produce a valuable fertiliser).
“An integrated approach for phytate degradation and recovery of myo-inositol and phosphate as value-added products from the by-products of corn ethanol industry”, J. Dang, [email protected] Chemical & Biomolecular Engineering Dissertation, University of Nebraska-Lincoln, 2010: http://digitalcommons.unl.edu/cgi/viewcontent.cgi?article=1006&context=chemengtheses
Policy and regulation
Composts and digestates EU End-of-Waste criteria final proposal
The EU’s Joint Research Centre (JRC) has finalized and published proposed European End-of-Waste (EoW) criteria for “biodegradable waste subject to biological treatments”, that is principally composts and digestates.
However, implementation of the draft E-W criteria is currently suspended or abandoned, as Member States and stakeholders do not agree. The finalised criteria may now be integrated into the current recast of the EU Fertilisers Regulation.
The final proposal is close to that already circulated last summer (see SCOPE Newsletter n°99 for detail) but includes some changes concerning the input materials acceptable.
The EU proposal sets a “narrow scope” for acceptable input materials, excluding in particular sewage sludges (even after treatment).
It is however specified that member states would under subsidiarity be able to develop (or maintain existing) national EoW criteria for composts or digestates which authorize a wider range of input materials (e.g. France already has End-of-Waste criteria for composts which allow use of sewage biosolids under appropriate constraints). However, products validated under such national EoW criteria would not benefit from recognition in other member states (would be considered waste if they cross a national border).
Narrow range of input materials
The final proposed criteria cover hygienised and stabilized composts produced from: • Separatively collected “bio-wastes’ (defined as
per the Waste Framework Directive: biodegradable park and garden wastes, and food wastes)
• Manures • Living or dead organisms which are either (i)
unprocessed (ii) processed by mechanical or heat systems only or (iii) are certified biodegradable (unless excluded by the Animal By-Products Regulation EC/1069/2009)
• Packaging which is certified biodegradable (as above)
• Any of the above which has been composted or digested
This excludes industrial sludges (e.g. from paper production), sewage biosolids (even after treatment), organic fractions of processed or sorted mixed solid municipal wastes.
European Sustainable Phosphorus Platform SCOPE Newsletter [email protected] I www.phosphorusplatform.eu c/o European Partners for the Environment, av. Tervuren 216, B-1150 Brussels, Belgium
April 2014 n° 103 page 8
The wording “manure” is rather narrow and if it is maintained, then manure slurries will only be acceptable if the other materials present in them are conform to the input materials definition (e.g. straw yes, but lime no ?)
Other changes
Compared to the July 2013 draft, the final proposed EoW criteria specify • Slightly less demanding stability requirements
for compost (unchanged for digestate) • Unchanged limit values for zinc (600 mg/kg dry
weight) and copper (200 mg/kgDW) • The only organic contaminant specified is
PAH16 (sum of 16 PAH compounds, 6 mg/kg DW)
• The testing frequency for PAH16 is somewhat reduced, to limit costs
Consumer information
The final product must specify on packaging if manure or animal by-products have been used as an input material.
The product must also indicate the nutrient content (N, P, K, Mg), organic matter content, alkaline effective matter (CaO content), the content of micronutrients zinc if > 400 mg/kgDW) and copper (if > 100 mg/kgDW), as well as other relevant user information. For digestates, sulphur content and mineral nitrogen content must also be indicated.
Producers are obliged to operate a quality management system.
EU Commission Joint Research Centre, technical proposals for End-of-Waste EoW criteria for biodegradable waste subject to biological treatments (H. Saveyn, P. Eder, 1/2014, EUR number 26425 EN) http://ipts.jrc.ec.europa.eu/publications/pub.cfm?id=6869
ECN (European Compost Network) info paper 1_2014 “Summary of IPTS report EoW criteria for biodegrable waste: Technical proposals” http://www.compostnetwork.info/wordpress/wp-content/uploads/2011/08/140122_ECN_Info-paper_01_2014_EoW.pdf
For further information: see SCOPE Newsletter n°99
Phosphorus sustainability Who, why and how: an assessment
Two published papers and an exchange of scientific comments assess the drivers for phosphorus sustainability, beyond the controversial question of phosphate rock resource scarcity. The societal processes for addressing phosphorus management and the different international initiatives underway are presented.
Ulrich et al. (1, 4) emphasise that although discussion of phosphate resource scarcity has been a starting point for raised awareness about phosphorus management, the different initiatives addressing phosphorus sustainability now take a holistic approach. This includes both the questions addressed by most research in the past (eutrophication issues of phosphorus losses, agricultural phosphorus use) and wider questions such as geopolitics and equity.
The authors present figures indicating that phosphate rock reserves/resources have a longer expected lifetime than 10 other important minerals (oil, gas, coal, several precious metals, cobalt, copper, aluminium, uranium). They also note that new estimates of reserves were published in 2010 (USGS, Van Kauwenbergh). They suggest that concerns about “phosphorus running out … are alarmist”.
Drivers for sustainable phosphorus management
Although the figures for reserves/resources are debated (see e.g. SCOPE Newsletter n°98), comment on this paper (2, 3) published in the same journal agree that other issues are important drivers for more sustainable phosphorus management: • eutrophication and biodiversity impacts of P-
losses, • accumulating P in agricultural soils (legacy or
residual P), • cost of phosphate fertilisers and equity of
access, manure as a resource, interactions with farm management (inc. GMO, organic farming),
• heavy metal contaminants in phosphate rock, • shifts in demand for phosphorus (e.g. relating to
diet changes), • improving urban waste water treatment …
European Sustainable Phosphorus Platform SCOPE Newsletter [email protected] I www.phosphorusplatform.eu c/o European Partners for the Environment, av. Tervuren 216, B-1150 Brussels, Belgium
April 2014 n° 103 page 9
The authors agree with previous publications that there are issues of trust, accuracy and transparency for data about phosphate rock reserves/resources, but note that there will always be uncertainties and that obtaining more or better data may not therefore change the decision making context.
Three key opportunities or limitations
The authors propose three areas identified as likely to be both barriers and limits to transitioning towards sustainable phosphorus management:
- Need for a holistic approach, looking at the full range of drivers and issues, as indicated above. This should include cost-effectiveness comparisons between phosphorus recycling or efficiency measures and resource import dependency
- Inclusive cooperation and integration between stakeholders and science, and between different sectors and disciplines. However, partial representation of industry (e.g. principally the mining industry) or agriculture (e.g. principally intensive animal production) results in a skewed vision and limits exchange.
- New problem solving approaches and mechanisms. Current phosphorus sustainability initiatives are applying systems approaches and trying to build bridges between society and science. Analysis of the effectiveness of these approaches is needed, and also work on enlarging to non-Western, non-democratic and global contexts.
Comments published in reply to this paper (Condron et al. 2, Tiessen 3) suggest that the availability of phosphate rock resources is an issue which should not be ignored. The comments remind that whatever the levels of phosphate reserves/resources it is a strategic resource needed by the whole world for global food production and food security, and argue that resources are limited to few countries. These comments also suggest that access is unequal, with poor farmers in developing countries being unable to fund fertiliser purchase in a global commodity market if prices fluctuate as can be expected.
The different authors emphasise the importance of livestock production as a major phosphorus leakage point, resulting in both inefficient resource uses and environmental pollution. Use of phytase to improve phosphorus availability to livestock is noted as one way forward.
Regarding crop production, opportunities cited include GMOs, organic farming and the use of organic forms of phosphorus as soil amendments (improving soil phosphorus availability). The importance of “legacy phosphorus” (P accumulated in agricultural soils) is underlined. The authors note that this “legacy P” is often poorly available to plants) but contributes to increased soil phosphorus loss, and so eutrophication problems. Farming methods which enable crop use of “legacy P” could considerably improve agricultural phosphorus efficiency. A better understanding of how “legacy P” impacts phosphorus losses and surface water recovery from eutrophication must also be developed, to support environmental protection decision making.
Staekholders in sustainable phosphorus
In (5), Ulrich and Schnug present phosphorus sustainability “movement” which has developed since the peak in world phosphorus prices in 2007. Analysis of publications and communications shows that phosphate rock resources was the key issue which stimulated concern at the time, but with a strong accent also on food, fertiliser, production and soil, suggesting a diverse, broad and relatively balanced approach to the different challenges of the phosphorus cycle.
11 different organisations and initiatives concerning phosphorus management are summarised, 5 national (USA, Australia, Japan, Netherlands) and 6 international (Europe, global).
Analysis of these confirms the authors’ proposition above, that sustainable phosphorus management initiatives motivated initially by concerns about phosphate rock reserves/resources depletion, are increasingly driven by the objective of improving phosphorus management along the value chain.
European Sustainable Phosphorus Platform SCOPE Newsletter [email protected] I www.phosphorusplatform.eu c/o European Partners for the Environment, av. Tervuren 216, B-1150 Brussels, Belgium
April 2014 n° 103 page 10
Challenges and opportunities
From this analysis, the authors identify the following challenges and opportunities:
• An increasing involvement in sustainable phosphorus of a wide range of stakeholders, who recognise that the Phosphorus Challenge is a long-term issue and is “here to stay”
• The inherently global nature of the phosphorus cycle, and so the need for international interaction
• The absence of institutional structures with overall responsibility or competence for phosphorus management, leading stakeholders to establish ad-hoc structures and networks
• Important synergies between phosphorus management and other resource and environment challenges
• Stakeholder cooperation, with an identified need to extend to geographical areas and sectors of activity which are not yet engaged
• The need for better agreement on the key issues (cf. balance between reserves/resources concerns and the many other important drivers for phosphorus sustainability)
• Knowledge generation: there is a need to assess and evaluate the real impact of new approaches linking society to research
• Research management: the multiplication of initiatives and R&D projects, and their scale and complexity, pose questions of duplication and cost-effectiveness. In particular, there is a need for a better inventory and communication of existing knowledge and information
1. “Tackling the phosphorus challenge: time for reflection on three key limitations”, Environmental Development 8, Oct. 2013, p.137-144 http://dx.doi.org/10.1016/j.envdev.2013.08.003
A. Ulrich (a,b), M. Stauffacher (a), P. Krütli (a), E. Schnug (c), E. l Frossard (b). a = Inst. Environmental Decisions (IED), Natural and Social Science Interface, ETH Zurich, Universitätsstrasse 22, 8092 Zurich, Switzerland. b = Inst. Agricultural Sciences, Plant Nutrition, ETH Zurich, Eschikon 33, 8315 Lindau, Switzerland. c = Inst. Crop and Soil Science, Federal Research Center for Cultivated Plants, Julius-Kühn-Institute, Bundesallee 50, 38166 Braunschweig, Germany. [email protected]
2. “Commentary on [1]: Role of legacy phosphorus in improving global phosphorus-use efficiency”, Environmental Development 8, Oct. 2013 p. 147-148 http://dx.doi.org/10.1016/j.envdev.2013.09.003
L. Condron (a), B. Spears (b), P. Haygarth (c), B. Turner (d), A. Richardson (e). a = Lincoln University, Lincoln 7647, Christchurch, New Zealand. b = Freshwater Ecology Group, Centre for Ecology and Hydrology, Edinburgh, Bush Estate, Penicuik, Midlothian, EH26 0QB, UK. c = Lancaster Environment Centre, Lancaster University, Lancaster LA1 4YQ, UK. d = Smithsonian Tropical Research Institute, Apartado 0843-03092, Balboa, Ancon, Panama. e = CSIRO Plant Industry, PO Box 1600, Canberra, ACT, 2601, Australia. [email protected]
3. “Framing a rational debate on phosphate use”, Environmental Development 8, Oct. 2013 p. 145-146 http://dx.doi.org/10.1016/j.envdev.2013.08.004
H. Tiessen, Inter-American Institute for Global Change Research, Uruguay. [email protected]
4. “Response to the comments on Tackling the phosphorus challenge: time for reflection on three key limitations”, Environmental Development 8, Oct. 2013 p. 149-151, authors as (1). http://dx.doi.org/10.1016/j.envdev.2013.09.004
5. “The modern phosphorus sustainability movement: a profiling experiment”, Sustainability 2013, 5, p. 4523-4545; www.mdpi.com/journal/sustainability (Open Access)
A. Ulrich and E. Schnug, as (1)
Sweden Flexible fees and nutrient pollution
The Swedish Sustainable Economy Foundation (SSEF) has a position paper promoting import taxes (or “Flexible Fee Mechanism”) as possible tools for improving phosphorus and nitrogen sustainability, encouraging recycling and reducing losses to the Baltic. However, this is not an operational proposal for implementation: feasibility and impacts of such a “fee” system need to be assessed and aspects of the phosphorus use cycle not considered need to be examined.
SSEF proposes a “flexible fee” on imports of phosphorus, and on both imports and national production of nitrogen compounds.
The proposal is that the fee level would be subject to frequent variation, with decisions being taken by an independent expert committee, and the fee revenue would be used to support P-recycling technologies or given back to consumers (e.g. as a tax rebate) to counteract the impact of increased food prices
European Sustainable Phosphorus Platform SCOPE Newsletter [email protected] I www.phosphorusplatform.eu c/o European Partners for the Environment, av. Tervuren 216, B-1150 Brussels, Belgium
April 2014 n° 103 page 11
(resulting from farmers passing on increased fertiliser prices). SSEF proposes that variations in the fee price would be levelled out by a “futures” market.
Such an import fee would be complex, because it would need to be collected on imported fertilisers, but also on other phosphorus-containing product imports, including on imported foods, on imported animal feeds, and presumably on other products containing phosphorus. The identification of phosphorus levels and the levying of the appropriate level of tax on imported foods and other products would be difficult, as well as posing issues with free trade (EU market, WTO).
The question of phosphorus in imported animal foods is not mentioned in the report.
The effects of such a phosphorus “import tax” on other industries using phosphorus (e.g. imported phosphoric acid could be destined for fertiliser production or used in industrial processes including plastic additives, glues, ceramics …) is not considered but could be significant.
SSEF discusses the resulting price increase on Sweden’s domestic food production, whereas the competitive impacts on other phosphorus using industries would also be considerable.
Reduction of nutrient losses to the Baltic are presented as a key objective of SSEF’s proposed phosphorus “import tax”, but there is at present no estimation to what extent such a phosphorus tax would reduce such losses. In particular, SSEF suggests that farmers would move to use manure or sewage biosolids instead of mineral phosphorus, but unless correctly managed this might not decrease nutrient losses. Farm management actions such as precision fertiliser use, reduced tillage, appropriate crop management, creation of wetlands and vegetation barriers, can also be effective in reducing nutrient losses.
Norden report
The SSEF document refers to a Norden report comparing theoretical principles between two possible pollution tax mechanisms: Flexible Emission Fees (FEF) and Tradable Emission Permits. The vocabulary used in unclear : SSEF refers to a nutrient import/use fee, whereas the Norden report concerns fees on nutrient losses and emissions, not nutrient import/use.
The Norden report concludes that Flexible Emission Fees are adapted to cases where:
• High levels of data and information are readily available: this is not the case for nutrients, where P-flows are known to be difficult and complex to identify and measure. In particular, as indicated above, P-levels in imported products such as human foodstuffs, animal feeds, industrial products, the final use of imported P chemicals, and the losses of P from different farm systems, are all very difficult to monitor and quantify.
• Long term objectives with small environmental damage and high priority to cost minimisation: this is again not the case for nutrients, for which environmental damage in the Baltic is important and cost minimisation may be less of a priority for farmers and the food industry than other objectives (productivity, biodiversity, food quality and food safety …)
• Typical alternative is a ban: this is not an option for nutrients, nor for mineral fertiliser, for which use in modern agriculture is essential and the challenge is to optimise use, improve management and reduce environmental losses, not to ban or phase out
• Possibility to implement fees more rapidly than other policies: this is probably not the case for nutrients, given the complexity of nutrient cycles (see above) and taking into account nutrient loss reduction legislation and policies already in place
The application of these Norden criteria thus appear to suggest that Flexible Emission Fees would be complex to apply as a policy option for sustainable phosphorus or nitrogen management, although both the Norden and SSEF reports suggest that further research work should be carried out.
SSEF (Swedish Sustainable Economy Foundation), briefing paper, January 2014, 20 pages, “Flexible emission fees applied to phosphorous (P) and nitrogen (N)” http://tssef.se/?p=717 and http://tssef.se/wordpress/wp-content/uploads/Brief_PhosphorousRD5.pdf
Norden (Nordic Council of Ministers), report, ISBN 978-92-893-2722-0, 2014, 77 pages, “Two approaches to pricing pollution” http://www.norden.org/en/publications/publikationer/2014-512
European Sustainable Phosphorus Platform SCOPE Newsletter [email protected] I www.phosphorusplatform.eu c/o European Partners for the Environment, av. Tervuren 216, B-1150 Brussels, Belgium
April 2014 n° 103 page 12
Phosphorus sustainability Expert summary of the phosphorus
challenge Willem Schipper’s 4-page overview “Phosphorus: too big to fail” is published as the keynote paper of the European Journal of Inorganic Chemistry special edition, following the International Conference on Phosphorus Chemistry ICPC 2012 www.icpc2014.ie
The essay provides a balanced assessment of the importance of phosphorus in biological systems and to mankind, the issues facing the phosphorus cycle and society’s phosphorus use, and routes for making phosphorus management more sustainable. The different uses of phosphorus in today’s society are summarised, both its principal uses in agriculture and the food industry, but also industrial applications such as in car engine lubricants, crop protection chemicals, lithium ion batteries and fire safety, as well as some possible future developments. The questions around phosphate resources are summarised as are key areas for improving phosphorus use efficiency in crop and livestock production.
P-recycling
Phosphorus recycling is addressed in detail as a key route to improving phosphorus sustainability, covering both agriculture reuse of sewage biosolids and manure through to more technical P-recovery process routes.
Success factors for P-recovery pathways are identified: The product should be familiar to the market
and offer reliable quality and performance Operational and investment costs should be
competitive Maximise P-recovery rates and ensure
environmentally compatible operation, in order to ensure social acceptance
Preferably, recovery process should be compatible with existing infrastructure to facilitate rollout
In Willem Schipper’s view, P-recovery efforts should concentrate on developing and implementing existing methods and technologies which are relatively simple and largely ripe for implementation. Research into highly innovative, high-technology processes is probably tends to ignore the reality of P-recycling, which is dealing with waste streams and
producing a fundamentally low-value product (phosphate).
Mr Schipper also notes that currently much research is repeated, without generating significant new results. He suggests that public funding should concentrate on development and implementation of existing P-recovery and recycling routes, rather than on new research, although there is a need to also clearly identify and address research knowledge gaps.
Further development can be expected in struvite recovery (because of the benefits for biological nutrient removal processes, rather than for the end-value of the recovered phosphate), in manure treatment and processing (intensive livestock production regions with nutrient excesses), in targeted P-recycling for specific industrial waste streams (relatively small volume streams of phosphorus, but specific recycling opportunities, e.g. flame retardants, Witting synthesis of phosphine oxides) and possibly in production of elemental phosphorus from secondary materials.
Public policy
A key to enabling phosphorus reuse and recycling development is that public policies must prevent dilution and landfilling of phosphorus. Public policies which effectively “destroy” secondary phosphorus resources include mixing of sewage sludges from biological nutrient removal sewage works with sludges from iron or aluminium dosing plants, mixing of manure, biosolids or food-wastes with other solid municipal wastes, use of sewage sludge or meat and bone meal in cement production or sending to mixed landfill. Public policies which block such irreversible phosphorus losses are currently being considered in Switzerland (SCOPE Newsletter 102) and Germany (SCOPE Newsletter 99).
Willem Schipper underlines that recycling of glass, plastic and paper are all developed on a wide scale through public policy obligations and support, despite these materials not facing the same non-renewability challenge of phosphorus. Wide scale public policy is now required to implement phosphorus sustainability “starting today, because it is too important to ignore”.
“Phosphorus: Too Big to Fail”, European Journal of Inorganic Chemistry, 1567-1571, 2014 www.eurjic.org Wiley http://onlinelibrary.wiley.com/doi/10.1002/ejic.201400115/abstract
Willem Schipper Consulting, Oude Vlissingseweg 4, 4336 AD The Netherlands, [email protected]
European Sustainable Phosphorus Platform SCOPE Newsletter [email protected] I www.phosphorusplatform.eu c/o European Partners for the Environment, av. Tervuren 216, B-1150 Brussels, Belgium
April 2014 n° 103 page 13
Planetary boundaries Eutrophication not resource scarcity
limits sustainable P Planetary flows of nitrogen and phosphorus are compared to estimates of ‘planetary boundaries’ (i.e., the upper tolerable limits for the elementary ecosystem functions of the planet) for different aspects (food production, agri-food system, world population increase,). The authors estimate that phosphorus loss to freshwaters, causing eutrophication, is the most critical nutrient limit, with current phosphorus use worldwide exceeding sustainable limits by a factor of 8x or more. Nitrogen fertiliser production (energy use) is one third as critical. Phosphorus reserves supply is not assessed to be critical over the 100 year horizon considered.
It is reminded that the study gives estimative world-total indications of planetary boundaries, and conclusions cannot be considered to be applicable to local or regional cases: in particular, impacts of nutrients on surface waters are highly specific to local circumstances.
The authors emphasise that the study considers the current agri-food system, and concludes the need for this to change. Changes in agri-food management of phosphorus, for example reducing food waste and the share of animal products in the diet, and developing recycling and recovering nutrients, in addition to limiting field run-off and avoiding pollution from manures, could significantly reduce phosphorus impacts to surface waters whilst maintaining food production.
Planetary boundaries for phosphorus
Rockström et al. (Nature, 2009) estimated the “planetary boundary” for phosphorus by using as a “critical threshold” the highest level of run-off which would (with a high probability) avoid near-bottom water anoxia (oxygen depletion) in oceans for the next 1000 years.
This was estimated at c. ten times natural P flows. However, Carpenter & Bennett (Environ Res Lett, 2011) revised this proposed “planetary boundary” for P downwards by a factor of 10x by using a threshold of 24 mgP/m3 in freshwaters, considered as a typically
used limit for eutrophication (the mesotrophy-eutrophy boundary) of lakes and reservoirs.
This leads to the conclusion that current phosphorus use exceeds planetary boundaries by a factor of 8x at least.
The authors also assessed the possible limitation on phosphorus use supply by exhaustion of mineral rock resources: on the basis of the current use (2010, 2011) per capita and the projected population growth, they conclude that resource supply would not be an obstacle to food production within this century.
Planetary boundaries and feeding the world
The authors estimate that anthropogenic nitrogen currently exceeds planetary boundaries by a factor of c. 4x. Around one third of the nitrogen used can be considered to be due to combustion of fossil fuels (producing NOx) or to be due to biological nitrogen fixing in agri-food systems, whereas around 2/3 can be considered the result of nitrogen fertiliser (80%) and other industrial nitrogen production.
Phosphorus losses to freshwaters thus appear as the critical planetary boundary in this analysis, and as contradictory to sustainably feeding the current world population in the current agri-food system.
A change to a vegetarian diet combined with elimination of food waste could, according to the authors’ estimates, reduce P use to one quarter. But this would still leave P use 2x higher than the planetary boundary, for the current world population (ignoring population growth).
Reducing phosphorus losses to freshwaters through sewage and manure treatment, precision farming, land management to reduce run off and soil erosion etc. are all necessary but not sufficient. The analysis makes it clear that more significant changes are required. Such changes imply radical dietary shifts, avoidance of losses across the food system, and a thorough nutrient recovery from field soils and water systems, as well as from manure, food waste and sewage. To enable such recycling may require changing the chemistry serving our everyday lives.
Since most phosphorus and nitrogen flows through agri-food systems, transformation of entire food systems are needed to feed the world whilst respecting planetary boundaries for both phosphorus and nitrogen.
European Sustainable Phosphorus Platform SCOPE Newsletter [email protected] I www.phosphorusplatform.eu c/o European Partners for the Environment, av. Tervuren 216, B-1150 Brussels, Belgium
April 2014 n° 103 page 14
“Taking planetary nutrient boundaries seriously: Can we feed the people?”, Global Food Security 3 (2014) 16-21 http://www.sciencedirect.com/science/article/pii/S2211912413000540 (Open Access)
H. Kahiluoto, M. Kuisma, MTT Agrifood Research Finland, Lönnrotinkatu 5, FI-50100 Mikkeli, Finland. A. Kuokkanen, M. Mikkilä, L. Linnanen, Lappeenranta University of Technology, PO Box 20, FI-53851 Lappeenranta, Finland. [email protected]
Phosphorus flows
Minneapolis – Saint Paul Survey of household nutrient and carbon
flows Data from a household questionnaire in the US Twin Cities of Minneapolis – Saint Paul suggest that pets represent over 15% of human food consumption. In this urban context, nearly 1/3 of households owned at least one dog or cat, and these pets consumed 0.6 – 5.7 gP/household/year. The survey assessed household consumption and emissions of carbon, nitrogen and phosphorus.
The survey results are based on a sample of 360 households, selected from over 1 500 which provided full information in response to a questionnaire sent initially to 15 000 homes (2011 and 2012 papers, additional information in 2007 paper).
Household carbon and nitrogen emissions/consumption were significantly skewed, with e.g. 20% of households contributing 75% of air travel and 40% of motor vehicle emissions. Energy consumption was correlated to distance from the city centre and to house size (floor area).
The largest element of household nitrogen flow was human food, with transport-related atmospheric emissions and fertiliser use also significant.
Household phosphorus flows were analysed for three factors only:
detergent use,
human food (both assumed to go to sewage)
pet food.
Detergent use was not assessed by questionnaire, but a literature per capita figure was applied. This will today
be considerably lower as phosphates are no longer used in domestic laundry or dishwasher detergents in the USA.
Phosphate fertilisers are forbidden for domestic use in the Twin Cities so were assumed zero.
Phosphorus in human diet
P consumed in diet was estimated from questionnaire returns indicating the number of household members, gender, height, body mass, level of daily exercise and type of diet (meat based, lacto-ovo, vegetarian or vegan).
In the 2013 presentation, further figures are developed showing the proportion of phosphorus consumed in different foods in the Twin Cities: • around 33% of diet P is in dairy products, • 21% in meat and fish, • 11.5% in wheat flour, • 5.6% in sweeteners (corn syrup, honey, maple
syrup, molasses and beet/cane sugar) • the remaining 29% in other grains, fruit,
vegetables, nuts, oils and fats.
Phosphorus consumed in pet foods
Phosphorus consumed by pets was also estimated based on body mass, average phosphorus content indicated on a number of popular dry dog foods, estimated energy content of the dog foods, and a pet food industry equation for metabolic energy consumption as a function of dog body weight. Flows of elements in food wastes, paper, plastics, garden wastes (leaves, grass clippings) were taken into account.
The survey data showed that pets consume nearly 1/6th of the phosphorus consumed in human diets in the Twin Cities.
Pets furthermore contribute 84% ofof phosphorus load to the landscape. The authors note that it is then likely to be flushed into rivers without treatment, for example in stormwaters.
Phosphorus efficiency for livestock
A phosphorus efficiency flow diagram is developed for livestock production in Minnesota. Phosphorus efficiencies for different livestock are calculated (phosphorus in slaughtered animal / system input):
European Sustainable Phosphorus Platform SCOPE Newsletter [email protected] I www.phosphorusplatform.eu c/o European Partners for the Environment, av. Tervuren 216, B-1150 Brussels, Belgium
April 2014 n° 103 page 15
20% for beef, 35% for dairy products, 47 – 50% for pork and poultry. However, it is also emphasised that (for beef) because half of the phosphorus in an animal carcass is in the bones, and a further 41% is in digestive organs, brain and nerves, offal, hair and hide and other parts, only 9% is consumed in meat (maybe somewhat more if offal is consumed). The figures for turkey are 9%, broiler chickens 12% and pork 16%.
Overall, less than 10% of phosphorus consumed by livestock (fodder and animal feeds) reaches meat and dairy products for human consumption. “Carbon, nitrogen, and phosphorus fluxes in household ecosystems in the Minneapolis-Saint Paul, Minnesota, urban region”, Ecological Applications, 21(3), 2011, pp. 619–639
C. Fissore (1,6), L. Baker (2), S. Hobbie (3), J. King (4), J. McFadden (4), K. Nelson (5), I. Jakobsdottir (1). 1= University of Minnesota, Department of Soil, Water, and Climate, Saint Paul, Minnesota 55108 USA. 2= University of Minnesota, Water Resources Center, Saint Paul, Minnesota 55108 USA. 3= University of Minnesota, Department of Ecology, Evolution, and Behavior, Saint Paul, Minnesota 55108 USA. 4= University of California, Department of Geography, Santa Barbara, California 93106 USA. 5= University of Minnesota, Department of Forest Resources and Department of Fisheries, Wildlife, and Conservation Biology, Saint Paul, Minnesota 55108 USA [email protected]
“The residential landscape: fluxes of elements and the role of household decisions”, Urban Ecosyst (2012) 15:1–18 C. Fissore, S. Hobbie, J. King, J. McFadden, K. Nelson, L. Baker.
“Effect of consumption choices on fluxes of carbon, nitrogen and phosphorus through households”, Urban Ecosyst (2007) 10:97–117, L. Baker, P. Hartzheim (2), S. Hobbie, J. King, K. Nelson
“Quantifying the Upstream Flux of Phosphorus to Minnesota’s Twin Cities Urban Food-shed”, Ecological Society of America, Wednesday, August 7, 2013, http://larrybakerlab.cfans.umn.edu/files/2011/10/Peterson2013_ESA_WEB.pdf
H. Peterson, L. Baker, University of Minnesota, Dept. Bioproducts and Biosystems Engineering
China Nutrient efficiency in the food chain
Lin Ma’s thesis (Wageningen, 2014) analyses nitrogen and phosphorus flows and losses in the food production and consumption chain (crop production, animal production, food processing, human diet) in China, for the 31 provinces of China, and assessing changes from 1980 to 2005.
China currently feeds 22% of the world’s population, with only 9% of its arable land. Population increase and diet change is expected to
result in China’s animal-derived food demand increasing by 80% by 2030. At present, 75% of China’s cultivated area is used to grow cereals.
National grain production increased from 110 to 483 million tonnes, whilst the area used for vegetables and fruit production increased from 4 to 19%. This is the result of introduction of high-productivity varieties, irrigation and increased use of mineral fertilisers (N, P and K).
Phosphorus fertiliser use (P2O5) in China increased from 0.9 million tonnes in 1970 to 12.8 mt in 2009 (5.2 million tonnes P in 2005).
Intensive livestock production
From 1978 to 2008, animal production increased massively, from around 200 million pigs to around 600 million, with similar orders of magnitude increases for dairy and beef cattle and chickens. China is today the world’s biggest meat producer. As a result, feed grain consumption by animals increased from 18 to 120 million tonnes/year, increasing from 19% to 31% of total grain consumption.
Also, livestock production has been increasingly concentrated, with nearly half of China’s cows now raised in CAFO (concentrated animal feeding lots). These are largely disconnected spatially from crop production areas, so that the nutrients in the animal manures are no longer recycled to land. Manure is often stored in lagoons, where the liquids evaporate or infiltrate into subsoil and surface waters. Anaerobic digestion of manures is developing, but the digestate is not recycled back to crop land but generally goes to landfill.
Nutrient efficiencies
The thesis develops a NUFER model (Nutrient flows in Food chain, Environment and Resources use) to assess annual nitrogen and phosphorus flows for China’s 31 provinces.
The food chain is assessed in four compartments, visualised as a pyramid: crop production/soil, animal production, food processing and households (human diet). The model distinguishes between ‘new nutrients’ (inputs from bio-fixation, fertilisers, harvests from natural grassland, fish captures) and ‘recycled’ nutrients (in materials such as manures, crop wastes, sewage …).
European Sustainable Phosphorus Platform SCOPE Newsletter [email protected] I www.phosphorusplatform.eu c/o European Partners for the Environment, av. Tervuren 216, B-1150 Brussels, Belgium
April 2014 n° 103 page 16
Input data came from existing household surveys of diet (urban, rural), existing field surveys in farms, literature contents of nutrients in harvested crops and animal excreta, fertiliser, feed and food import data, etc.
Phosphorus Use Efficiency (PUEf)
Phosphorus Use Efficiency in the food chain (PUEf) is defined as the % of ‘new’ input nutrients contained in the food delivered to households. This is based on the amount of phosphorus calculated to be in foodstuffs purchased by households, restaurants, canteens, etc (that is, after food waste losses in supermarkets and distribution).
This % would be even lower if household, restaurant and canteen food losses were taken into account, that is the amount of phosphorus actually consumed by the human population. The author concludes that China’s Nutrient Use Efficiency for Phosphorus (PUEf) is on average only 7% in 2005 (13 kg of ‘new’ phosphorus are consumed to deliver 1 kg of P in food to households, with further losses occurring through household food wastes).
This shows a significant decrease from 19% PUEf in 1980 to 7% in 2005, the consequence of increasing meat and dairy in diet and agricultural intensification, particularly of livestock production. This is now significantly below the world average of 11%.
Phosphorus PUE in crop production (PUEc) is 36% and in animal production (PUEa) is only 17%.
Nitrogen Nutrient Use Efficiency in the food chain (NUEf) similarly decreased in China from 16% in 1980 to 9% in 2005, and is also significantly lower than the world average of 16%.
Phosphorus losses
‘New’ phosphorus imports into China’s food system (2005) were 5.2 million tonnes P in crop production and 2.6 million tonnes P in animal production. System losses were 3 million tonnes P principally to surface waters and groundwaters, and 3.4 million ton P accumulation in soil.
Regional analysis shows that losses to surface and groundwaters have particularly increased in South, East and Central China, specifically Beijing and Tianjin urban areas, Pealr River Delta, Yangzi River Delta. This is the consequence of concentration of the
human population in urban areas, and of livestock production CAFOs near these urban areas.
The Beijing urban area P and N flows are assessed in detail from 1978 to 2008, showing that only around 50% of nutrients in wastes (crop residues, manures, sewage) were recycled in 2008, contributing to the low Nutrient Use Efficiency for the region. Possible strategies identified to improve Nutrient Use Efficiency in the Beijing region are to decentralise human population into satellite towns, to transfer livestock production back to rural areas where manure can be reused as a fertiliser and to develop waste separation (e.g. food waste) and sewage nutrient recycling systems.
Future scenarios
Possible future scenarios are presented. In the ‘business as usual’ scenario, China’s increasing population and increasing meat and dairy in diet result in further increases of +25% in N and P fertiliser consumption by 2030, resulting in increased N and P losses respectively of 47% and 71%.
Scenario options assessed include: changing diet (lower animal products consumption), increasing imports of animal products, animal feeds, balanced cropland fertilisation, precision livestock feeding, and developing manure nutrient recycling.
The authors conclude that the predicted increase in animal products in China’s population’s diet inevitably results in significantly increased demand to import of animal products and animal feeds, which is of obvious importance for world food security. Modifying the human diet and balanced cropland fertilisation are the two single most effective policy options for improve Nutrient Use Efficiency. Improving manure management is the single most effective option to reduce nutrient losses to the environment.
Overall, management measures (balanced fertilisation, precision livestock feeding, waste and manure nutrient recovery and recycling) could approximately cancel out the otherwise predicted increased nutrient losses in the human diet ‘business as usual’ scenario, as well as improving nutrient efficiency in the food chain.
“Nutrient use efficiency in the food chain of China”, 193 pages, Lin Ma PhDthesis in Wageningen University, Netherlands, March 2014, ISBN: 978-94-6173-844-8
European Sustainable Phosphorus Platform SCOPE Newsletter [email protected] I www.phosphorusplatform.eu c/o European Partners for the Environment, av. Tervuren 216, B-1150 Brussels, Belgium
April 2014 n° 103 page 17
England Food additives and eutrophication
A report for the Environment Agency (EA) for England estimates that food additive phosphates contribute 5-10% of total phosphates in domestic sewage, with implications both for sewage works nutrient removal costs and for water quality. The report recommends that the Agency work with the food and drink industry to review the evidence base and consider alternatives to food phosphate additives, in order to reduce or withdraw their use. The report methodology is based on an estimate that food additive phosphates contribute around 10% of phosphorus in diet.
The EA report is a desk study based on literature and on exchanges with industry (questionnaire and dialogue with food and beverage industry and food additives producers).
Difficulties in identifying reliable data
The report shows an absence of agreement on data on food phosphate use (see discussion of Comber 2012 paper below) and concludes from different available data that food phosphate additives represent an estimated 0.14 gP/person/day, or c. 10% of phosphorus in diet.
Data on phosphorus in diet is also complex. The authors derived an estimated figure of 1.13 gP/person/day (total diet P, overall population per capita average) from National Diet and Nutrition Survey data archives, covering 2008 – 2011. The authors consider that their figures are reliable, because they based on a rolling, cross-sectional survey and on food nutrient contents analysed for 6 000 foods as consumed (so including food phosphate additives where used). Figures published by NDNS in 2003 were 1.3 gP/day (1.5 for mean, 1.1 for women). The difference is related to different age groups covered by the data.
Taking the estimate that food phosphate additives contribute 10% of total diet P, then they would contribute 7-8% of total P in sewage, taking Defra (2009) figures which suggest that 68% of P in sewage comes from human urine and faeces. As detergent P loadings are reduced the relative % contribution to sewage P loadings from food additives will increase.
SCOPE editors’ note: these Defra 2009 figures assume that only 5% of sewage P is estimated to come from small industry and town centre. Other authors have estimated that the contribution of small industries and businesses (eg. abattoirs, food processing industry, metal surface treatment, restaurants, waste treatment, …) as follows: 0.9 – 1.7 gP/person/day (Bernhardt 1978, page 74) or 0.9 – 1.2 gP/person/day (Metzner 2006 citing ATV-DVWK 2003). This would mean that the contribution of phosphate food additives to sewage reaching municipal treatment works would be around 5%.
The Environment Agency estimated total phosphorus reaching UK sewage works at 36 834 tonnes P/year (DEFRA 2009). When compared with estimated UK food phosphate additive consumption of 3210 tP/y (PAPA 2007) this suggests that phosphate food additives contribute <10% of sewage works phosphorus load. However, this assumes that all phosphate food additives used will reach sewage works, whereas in fact around 5% will be lost in food waste (estimate in this report), of which only part will reach sewage works.
Alternatives
The Environment Agency report notes that phosphate food additives are used in a wide range of applications (listed in detail in the report), including processing meat and dairy products, bakery products, beverages. In many cases, the food and drink industry does not have effective alternatives. Some possible alternatives are sodium based, whereas the food industry is trying to reduce sodium content because of concerns about possible health effects (heart disease risk).
In many applications, food phosphate additives extend the shelf lives of processed foods by inhibiting bacterial development, so potentially reducing food waste losses.
Phosphate food additives often combine several food processing functions, adding or restoring functional food properties, and the food industry indicates that their substitution would increase food costs. Because this would increase the price of processed foods only (phosphate food additives are not used in unprocessed foods), the social and health implications of this could be complex.
European Sustainable Phosphorus Platform SCOPE Newsletter [email protected] I www.phosphorusplatform.eu c/o European Partners for the Environment, av. Tervuren 216, B-1150 Brussels, Belgium
April 2014 n° 103 page 18
Conclusions
The Environment Agency report concludes that phosphate food additives contribute 5-10% of total phosphorus in domestic sewage, which could represent a significant cost to municipal sewage works (nutrient removal costs) and contribute to surface water quality problems (failure to achieve Water Framework Directive ‘Good Ecological Status’ for phosphorus for which standards are designed to prevent eutrophication).
The report states that few alternatives are available to substitute phosphate food additives and recommends to work with the food and drink industry to find alternatives and to reduce or withdraw phosphate food additive use.
The report also shows the need for updated, reliable and agreed data on both phosphate food additive use, on possible impact on sewage works operating costs and on the environment, and shows the need for wider debate about the large contribution to sewage phosphorus from the human diet and whether there is any potential to reduce this by linking to current initiatives around more sustainable and healthy diets.,.
DEFRA 2009 “Impact assessment of ban on phosphorus in domestic laundry cleaning products stage: final version: 21 date: 21th Sept 2009” http://www.defra.gov.uk/corporate/consult/detergents-regs2005/clarification-for-IA.pdf
DEFRA 2010 “Defra clarification on aspects of DLCP impact assessment, 20th January 2010”
UK Environment Agency “Phosphorus in food additives” Report EA-14912BH-SB, 2013, 45 pages.
Phosphorus in sewage Different sources of P in domestic sewage A paper by Comber et al. 2013, based on work done for UK Water Industry Research (UKWIR), estimates phosphorus inputs to domestic sewage from different sources including food, phosphate food additives, domestic machine laundry and machine dishwashing detergents, tap water supply phosphate dosing (to counter lead solvency from pipes), personal care products (in particular toothpastes) and food wastes.
Approximate estimates for phosphorus from different sources are based on a range of assumptions. For example, for toothpastes, phosphorus content is identified for 42 different brands of toothpaste and it is then assumed that the market share is equal for all of these brands of toothpaste. In this paper, non-domestic sources of phosphorus to sewage works are not taken into account: e.g. small industry, food-processing industries, run-off from cities (e.g. pet excretions, leaves …), background phosphorus in water …
A figure for intake of phosphate food additives is adopted, derived by taking the sum of figures for intakes of 12 different specified food phosphate additives (table 3 in Comber et al.).
Incorrect references and factor errors
These figures are referenced to HMSO/Henderson 2003 [references 15 = 17], but this is a reference error and the correct reference should be to M. Rahuman, University of Abertay, MSc thesis 2009 (not published). In this thesis, which contains many errors and appears to be unreliable, these figures (table 2.4, p29) are referenced to an HMSO 1993 publication which is not included in the thesis references, but which we have nonetheless identified and obtained.
The thesis (incorrectly, the units are wrong by x1000) concludes that food phosphate additive intake is 0.0006 g of additives/day (p. 27). However, Comber et al. then copy the figures but indicate that this is the intake of phosphorus, not intake of additive compounds: this is an error of at least factor 4x because the phosphorus content of these compounds is somewhat less than 25% [1], so that the correct figure (as derived from these 1983 data) would be 0.15 gP/person/day phosphorus intake from food additives.
The incorrect figure (0.6 gP/day) given by Comber et al. is considered as “unrealistic” by the Environment Agency for England (see above), who discard this figure, and note that it is orders of magnitude higher than any other published figure, and that it would suggest that the UK consumes over 50% of total EU food phosphate additive production.
Comber et al. estimate diet phosphorus intake from the daily intake of different food types multiplied by average phosphorus content, concluding a total 1.3 gP/person/day, which is close to 2003 UK National Diet and Nutrition survey estimates (Henderson 2003: 1.1 gP/day for women, 1.5 gP/day for men).
European Sustainable Phosphorus Platform SCOPE Newsletter [email protected] I www.phosphorusplatform.eu c/o European Partners for the Environment, av. Tervuren 216, B-1150 Brussels, Belgium
April 2014 n° 103 page 19
Other sources of phosphorus to sewage
Other sources of phosphorus to UK domestic sewage estimated by Comber et al. (all figures in gP/person/day) are:
• domestic laundry detergents: 0.16gP/person/day from phosphate (falling with phase-out) plus 0.12 gP from phosphonates
• domestic dishwasher detergents: 0.18gP from phosphates (expected to disappear in 2017) plus 0.0006 gP from phosphonates
• toothpaste: 0.022 gP
• other personal care products (shampoos, soaps): near zero
• water supply phosphate dosing for lead solvency: 0.13 gP
• food wastes going to the sink: 0.1 gP
[1] E.g. the largest intake phosphate listed is sodium diphosphate = tetrasodium pyrophosphate H4O7P2.4Na or hydrated form H4O7P2.4Na.10(H2O), for which P = 23% or 13% of molecular weight respectively
“Domestic source of phosphorus to sewage treatment works”, Environmental Technology, Vol. 34, No. 10, 1349–1358, 2013 http://dx.doi.org/10.1080/09593330.2012.747003
S. Comber, Environmental Science, Plymouth University, Plymouth, UK. M. Gardner, K. Georges, Atkins Limited, Bristol, UK. D. Blackwood, D. Gilmour, Urban Water Technology Centre, University of Abertay, Dundee, UK. [email protected]
Refs. 15 = 17 in Comber et al. 2012: “The National Diet & Nutrition Survey: adults aged 19 to 64 years. Vitamin and mineral intake and urinary analytes”, L. Henderson, K. Irving, J. Gregory, NDNS, 2003 http://www.food.gov.uk/multimedia/pdfs/ndnsv3.pdf
M. Rahuman, University of Abertay, MSc thesis, September 2009 “Source control of phosphates by changing practice in the food production industries” (not published)
HMSO (UK), 1993 “Dietary Intake of Food Additives in the Uk: Initial Surveillance” (Food Surveillance Paper No. 37)
Nutrient Platforms
Europe: www.phosphorusplatform.org
Netherlands: www.nutrientplatform.org
Flanders (Belgium): http://www.vlakwa.be/nutrientenplatform/
Germany: www.deutsche-phosphor-plattform.de
North America Partnership on Phosphorus Sustainability NAPPS [email protected]
US P-RCN (Sustainable Phosphorus Research Coordination Network) [email protected]
P-RCN student network: [email protected]
Opportunities
US & Canada phosphorus networks
North America Partnership on Phosphorus Sustainability NAPPS [email protected]
US P-RCN (Sustainable Phosphorus Research Coordination Network) [email protected]
P-RCN student network: [email protected]
Nutrient Removal Research Report
BlueTech Research’s Nutrient Removal and Recovery Market and Technology Overview Insight Report provides a comprehensive look into the nutrient removal and recovery market, providing key information on market drivers and barriers, technology providers, and the regulatory landscape within major markets, including the European Union, USA and China.
To purchase this Insight Report and learn about other available Insight Reports, please visit http://www.bluetechresearch.com/tools/reports/upcoming-bluetech-insight-report-advanced-nutrient-removal-and-recovery/?utm_source=Scope%20Newsletter&utm_medium=Email&utm_campaign=Scope%20Nutrient
European Sustainable Phosphorus Platform SCOPE Newsletter [email protected] I www.phosphorusplatform.eu c/o European Partners for the Environment, av. Tervuren 216, B-1150 Brussels, Belgium
April 2014 n° 103 page 20
Horizon 2020 funding opportunities The EU’s R&D funding programme Horizon2020 includes areas relevant to P sustainability..
The European Sustainable Phosphorus Platform invites expressions of interest to [email protected] from interested organisations, project consortia. Your information can be circulated to possible partners.
H2020 funding opportunities relevant to phosphorus management identified to date
Please note that the list below may not be complete. It is ESPP’s analysis to date. The presentation made by ESPP of call content may not be accurate, and you are recommended to verify directly with the published call texts and obtain competent advice where useful.
SPIRE-07-2015 – deadline = 19/12/2014 http://ec.europa.eu/research/participants/portal/desktop/en/opportunities/h2020/topics/2166-spire-07-2015.html “Recovery technologies for metals and other minerals”
WASTE 7-2015 - deadline = 16/10/2014 http://ec.europa.eu/research/participants/data/ref/h2020/wp/2014_2015/main/h2020-wp1415-climate_en.pdf “Ensuring sustainable use of agricultural waste, coproducts and byproducts”, includes “nutrient, energy and biochemical recovery from manure and other effluents”
SC5-11(b)-2014 - deadline = 10/3/2015 http://ec.europa.eu/research/participants/data/ref/h2020/wp/2014_2015/main/h2020-wp1415-climate_en.pdf “New solutions for sustainable production of raw materials” (b) 2014 “Flexible processing technologies”
SC5-13(f)-2015 – deadline = 10/3/2015 http://ec.europa.eu/research/participants/data/ref/h2020/wp/2014_2015/main/h2020-wp1415-climate_en.pdf “Coordinating and supporting raw materials research and innovation” “Strategic international dialogues and cooperation with raw materials producing countries and industry”
EIP WG - announced Feb. 2014, expected to be published soon http://ec.europa.eu/agriculture/eip/focus-groups/call-3-announcement_en.pdf European Innovation Partnership (EIP) "Agricultural Productivity and Sustainability", call to set up new Focus Groups – limited action, c 20 experts, funding for a few meetings and a report: “Fertiliser efficiency – focus on horticulture in open field – How to resolve the conflict between crop quality demands and legislative requirements through innovative fertilisation and nutrient recycling.”
KIC Raw Materials – deadline = 10/9/2014 http://eit.europa.eu/newsroom-and-media/article/innovate-join-the-eit-and-spur-innovation-and-entrepreneurship-across-europe/ To address: raw materials – sustainable exploration, extraction processing, recycling and substitution.
ARREAU P-recovery Action Group ARREAU Action Group on resource recovery selected by the EU Water EIP:
ARREA = Accelerating Resource Recovery from Water Cycle, coordinated by KWR Water B.V., The Netherlands
http://www.eip-water.eu/eip-water-keeps-growing-and-welcomes-16-new-action-groups
Raw Materials Covenant approved
The European commission has approved the “Commitment” for a Raw Materials Covenant (RMC) for a Circular Economy, taking local phosphorus recycling, reuse and efficiency as a leading example.
Local sustainable phosphorus management will be a flagship project for the RMC Covenant, and the ESPP (European Sustainable Phosphorus Platform) will assist cities and regions in defining guidelines for local policies, tools and objectives for phosphorus flow assessment, reuse and recycling and use efficiency.
http://ec.europa.eu/eip/raw-materials/en/commitment-detail/410
Call for texts: perspectives for
phosphorus futures Send us your vision for sustainable phosphorus in tomorrow’s world.
Texts should present likely scenarios or perspectives for the coming 10-25 years, combining vision, game-changes, justified realism. The objective is not to address policy proposals or specific actions, but rather to assess structural questions and propose visions for the future.
This special edition SCOPE Newsletter will be circulated to 60 000 decision makers, stakeholders and scientists worldwide, and presented at the 4th world Sustainable Phosphorus Summit, 1 - 3 Sept., Montpellier, France http://SPS2014.cirad.fr
Maximum 500 words. Deadline 15th May 2014 by email to [email protected]
Further details in SCOPE Newsletter n° 102 at http://www.phosphorusplatform.org/downloads.html
European Sustainable Phosphorus Platform SCOPE Newsletter [email protected] I www.phosphorusplatform.eu c/o European Partners for the Environment, av. Tervuren 216, B-1150 Brussels, Belgium
April 2014 n° 103 page 21
Agenda 6 May, 16h-18h, Munich, Germany:
phosphorus recycling conference at IFAT (world trade fair for water, waste and raw materials management) www.ifat.de and programme
4-6 June, Valladolid, Spain: 10th International Renewable Resources and Biorefineries (RBB) (5th June: Nutrient & Energy cycling sessions) www.rrbconference.com
5 June, Brussels, 9h30-15h30 European Sustainable Phosphorus Platform (ESPP) meeting and 16h30, Green Week event Closing the phosphorus cycle www.greenweek2014.eu
18 June, Leeds, England, Closing Nutrient Cycles via Biochar & Composting [email protected]
19 June, Toronto Canada, P Recovery Workshop hosted by the Dutch Consulate, Ryerson University and Ontario Ministry of Agriculture and Food [email protected]
19 June, Leeds, England, Future options for food waste http://www.aquaenviro.co.uk/view-product/Future-Options-for-Food-Waste
23 June, Brussels, Biochar safety, economy, legal harmonisation (REFERTIL) [email protected]
26-28 June, Gödöllö Hungary, ORBIT 2014 Organic Resources and Biological Treatment http://orbit2014.com
29 June – 3 July, Dublin: 20th International Conference on Phosphorus Chemistry www.icpc2014.ie
2-3 July, London: IFS International Fertiliser Society Conference 2014 http://fertiliser-society.org
7 July, Rennes, France, launch meeting France sustainable phosphorus network www.phosphorusplatform.org
8-9 July, Rennes, Brittany, France, EU Commission/regions at work for the bio-economy Converting bio-wastes to fertilisers
13-17 July, Harbin, China: IWA Science Summit on Urban Water http://www.iwahq.org/28f/events/iwa-events/2014/urban-water.html
26-29 August 2014, Montpellier, France: 5th Phosphorus in Soils and Plants symposium http://psp5-2014.cirad.fr/
1 - 3 Sept., Montpellier, France, 4th world Sustainable Phosphorus Summit http://SPS2014.cirad.fr
10-12 September, Basel, Switzerland, P-REX summer school (students, researchers, young professionals): Implementation of P-Recovery from Wastewater - Why and How? www.p-rex.eu
27 Sept. – 1 Oct., New Orleans, WEFTEC2014 (Water Environment Federation) www.weftec.org
30 Sept – 2 Oct, Alkmaar region, Netherlands European Biogas Association Conference http://www.biogasconference.eu/
7-8 Oct., Manchester, UK, 8th European Waste Water Conference. Including: wastewater as a resource, nutrient factory. www.ewwmconference.com
20-24 Oct., Rio de Janiero CIEC World Fertiliser Congress www.16wfc.com
26-30 Oct, Kathmandu, Nepal, IWA: Sustainable Wastewater Treatment and Resource Recovery http://iwa2014nepal.org
3-5 Nov 2014, Long Beach, California ASA, CSSA, SSSA (US & Canada soil and agronomy) meetings, Water Food, Energy, Innovation for a Sustainable World www.acsmeetings.org
17-19th Nov., Manchester UK, 19th European Biosolids & Organic Resources Conference. Session on energy and resource recovery www.european-biosolids.com
11-12 December, Cambridge, England., IFS International Fertiliser Society Conference 2014 http://fertiliser-society.org
5-6 March 2015, Berlin: 2nd European Sustainable Phosphorus Conference www.phosphorusplatform.org
23-25 Mar 2015, Tampa, Florida: Phosphates 2015 (CRU) www.phosphatesconference.com
29 March – 3 April 2015, Australia. Beneficiation of phosphates VII http://www.engconf.org/conferences/environmental-technology/beneficiation-of-phosphates-vii/
4-8 May 2015, Morocco: SYMPHOS (dates to be confirmed) www.symphos.com
1 May – 31 Oct. Expo2015 Feeding the planet, energy for life, Milano http://en.expo2015.org/