the passive treatment of coal mine drainage library/research/coal/ewr/water... · 2 abstract...
TRANSCRIPT
DOE/NETL-2004/1202
George R. Watzlaf1, Karl T. Schroeder1, Robert L. P. Kleinmann1, Candace L. Kairies1, and Robert W. Nairn2
1U.S. Department of Energy National Energy Technology Laboratory
P.O. Box 10940 Pittsburgh, PA 15236
2University of Oklahoma
School of Civil Engineering and Environmental Science 202 West Boyd Street
Norman, OK 73019-0631
The Passive Treatment of Coal Mine Drainage
2
Abstract Passive treatment of mine water uses chemical and biological processes to decrease metal
concentrations and neutralize acidity. Compared to conventional chemical treatment, passive methods generally require more land area, but use less costly reagents, and require less operational attention and maintenance. Currently, the three most common types of passive technologies are aerobic ponds and wetlands, anoxic limestone drains (ALDs), and reducing and alkalinity-producing systems (RAPS). Aerobic wetlands promote mixed oxidation and hydrolysis reactions, and are effective when the raw mine water is net alkaline. Anoxic limestone drains generate bicarbonate alkalinity and can be used to convert water that is net acidic into net-alkaline water for treatment in aerobic ponds and wetlands. RAPS promote reducing conditions and limestone dissolution. They extend the concept of ALDs by pre-treating the water before it contacts the limestone, to eliminate dissolved oxygen and reduce dissolved ferric iron to ferrous iron. These systems can generally be used to treat more acidic water than ALDs, and can better treat water with significant aluminum concentrations.
In passive treatment systems, rates of metal and acidity removal and alkalinity generation have been developed empirically. Aerobic wetlands remove iron from alkaline water at rates of 10 to 20 g m&2 d&1. Anoxic limestone drains add 150 to 300 mg/L of alkalinity in about 15 hours of contact, imparting 5 to 20 mg/L of alkalinity per hour of contact. Reducing and alkalinity-producing systems add 15 to 60 g m&2 d&1 of alkalinity, depending on influent water quality and contact time. Selection and sizing criteria for the design of passive treatment systems are presented in this report.
Acknowledgements The authors would like to thank the technical reviewers whose comments were greatly
appreciated: Arthur W. Rose, Paul L. Younger, Carl S. Kirby and Ben B. Faulkner. Laboratory analyses were conducted by Mark Wesolowski, Joyce Swank, Dennis Viscusi, Harry Williams, Hubert McDonald and Lillian Schlosser Balchus. John Kleinhenz, Randy Woods and John Odoski assisted with field sampling and monitoring. We are indebted to the following individuals who shared information on the construction of many of the passive treatment systems discussed in this report: Doug Kepler, Eric McCleary, Dan Seibert, Margaret Dunn, Tim Danehy, Connie Lyons and Joe Mills.

3
Contents Introduction..................................................................................................................... 6
Treatment of Mine Water............................................................................................ 6 History of Passive Treatment...................................................................................... 7
Background..................................................................................................................... 9 Formation of Polluted Mine Waters ........................................................................... 9 Chemical Characteristics of Mine Drainage............................................................. 11
Passive Treatment Processes ........................................................................................ 18 Limestone Dissolution .............................................................................................. 18 Sulfate Reduction...................................................................................................... 19 Metal Removal Processes ......................................................................................... 19
Materials and Methods.................................................................................................. 31 Collection of Water Samples .................................................................................... 31 Analysis of Water Samples....................................................................................... 31 Flow Rate Measurements.......................................................................................... 31 Analysis of Iron Sludge ............................................................................................ 32
Removal of Contaminants by Passive Unit Operations................................................ 32 Aerobic Wetlands and Ponds .................................................................................... 32 Anoxic Limestone Drains ......................................................................................... 33 Compost Wetlands .................................................................................................... 43 Reducing and Alkalinity-Producing Systems (RAPS) ............................................. 44 Other Types of Water Treatment Systems................................................................ 52
Designing Passive Treatment Systems ......................................................................... 54 Characterizing Mine Drainage Discharges ............................................................... 54 Selecting Unit Operations......................................................................................... 55 Sizing Passive Systems............................................................................................. 57 Constructing Passive Systems .................................................................................. 61 Operation and Maintenance ...................................................................................... 62
Conclusions................................................................................................................... 63 Abbreviations and Acronyms ........................................................................................... 65 References......................................................................................................................... 66

4
Figures Figure 1. Calculated Versus Measured Acidity for Over 150 Coal Mine Discharges ........... 12 Figure 2a. Concentration of Iron and Field pH at the Emlenton Constructed Wetlands, which
Receives Net Acidic Water................................................................................... 22 Figure 2b. Concentration of Iron and Field pH at Cedar Grove Constructed Wetlands which
Receives Net Alkaline Water................................................................................ 23 Figure 3. Dissolved Ferric Iron Concentration Versus pH in Coal Mine Discharge.............. 24 Figure 4. Removal of Ferrous Iron from Acidic and Alkaline Mine Waters in a Laboratory
Experiment............................................................................................................ 25 Figure 5. Mean Concentration of Iron, Manganese and Magnesium at the Morrison Wetland
as the Mine Water Flows Linearly through the System........................................ 28 Figure 6. Changes in the Concentrations of Ferrous Iron and Manganese in (A) the Absence
of the MnOOH and (B) the Presence of MnOOH ................................................ 29 Figure 7. Dissolved Aluminum Concentration Versus pH in Coal Mine Discharges ............ 30 Figure 8. Bromide Concentration Versus Time in the Effluent of the Howe Bridge ALD 1
Resulting from a Pulse Input of a Bromide Tracer ............................................... 36 Figure 9. Alkalinity Concentration as Mine Water Flows through Selected ALD................. 38 Figure 10. Effluent Alkalinity Concentrations of Selected ALDs Over Time ....................... 39 Figure 11. Alkalinity Generation in the Howe Bridge RAPS................................................. 47 Figure 12. Selection of Passive Treatment Unit Operations................................................... 56
Tables Table 1. Federal Effluent Limits for Coal Mine Drainage ....................................................... 6 Table 2. Contributions of Metal Concentration and pH to Acidity for Selected Mine
Discharges............................................................................................................. 13 Table 3. Proton Acidity Contributions at Various pH Values ................................................ 13 Table 4. Chemical Composition of Untreated Mine Waters Containing Alkalinity .............. 14 Table 5. Water Quality from 156 Coal Mine Discharges ....................................................... 17 Table 6. Equilibrium Concentrations of Alkalinity at Various PCO2 Levels........................... 18 Table 7. Solubility Products of Selected Metal Sulfides ........................................................ 20 Table 8. Dimensions, Stone Size and Quality, and Source of Influent Water Quality
Data for ALDs....................................................................................................... 35 Table 9. Tracer Test Data for Two ALDs............................................................................... 37 Table 10. Initial and Current Conditions of ALDs ................................................................. 40 Table 11. Average Water Quality Before and After Contact with the Anoxic Limestone
Drain ..................................................................................................................... 40 Table 12. Additional Water Quality Parameters Before and After Contact with the
Anoxic Limestone Drain....................................................................................... 41 Table 13. Construction Specifications and Quantification of Alkalinity Generation
within RAPS ......................................................................................................... 46 Table 14. Water Quality Before and After Contact with Reducing and Alkalinity
Producing System ................................................................................................. 48 Table 15. Total Amounts of Retained Iron and Aluminum Prior to Flushes at the
DeSale II Site ........................................................................................................ 51

5
Table 16. Amount of Water, Iron, and Aluminum Flushed for the Two RAPS at the DeSale II Site ........................................................................................................ 51
Table 17. Techniques Used for Treating Coal Mine Drainage.............................................. 54 Table 18. Classification of Mine Discharges.......................................................................... 55

6
Introduction
Treatment of Mine Water
In the United States, mining companies commonly treat contaminated drainage using conventional chemical methods. In most conventional treatment systems, metal contaminants are removed through the constantly measured addition of alkaline chemicals (e.g., NaOH, Ca(OH)2, CaO, Na2CO3, or NH3) to meet Federal effluent limits. (See Table 1.) These are maximum concentrations allowed for active coal mining operations. Some operators have much more stringent effluent limits, based on the quality of the receiving stream. The chemicals used in these treatment systems can be expensive, especially when required in large quantities. In addition, there are operation and maintenance costs associated with aeration and mixing devices, and additional costs associated with the disposal of the metal-laden sludge that accumulates in settling ponds. It is not unusual for water treatment costs to exceed $10,000 per year at sites that are otherwise successfully reclaimed. The high cost of water treatment places a serious financial burden on active mining companies, and has contributed to the bankruptcy of many others.
The high cost of conventional chemical systems limit water treatment efforts at abandoned sites. Thousands of miles of streams and rivers in Appalachia are currently polluted by drainage from sites that were mined and abandoned before enactment of effluent regulations. State and Federal reclamation agencies, local conservation organizations, and watershed associations all consider the treatment of contaminated mine discharge to be a high priority. However, insufficient funds are available for chemical water treatment, except in a few watersheds of special value.
Table 1. Federal Effluent Limits for Coal Mine Drainage
Parameter
Maximum for Any One Day
Average of Daily Values for 30 Consecutive Days
Iron, total (mg/L) 6.0 3.0
Manganese, total (mg/L) 4.0 2.0
Total suspended solids (mg/L) 70 35
pH (standard units) between 6.0 and 9.0
During the past 20 years, the possibility that mine water might be treated passively has
developed from an experimental concept to full-scale field implementation at hundreds of sites throughout the world (Younger et al. 2002, Brown et al. 2002). Passive technologies take advantage of the natural chemical and biological processes that ameliorate contaminated water conditions. Ideally, passive treatment systems require no constant input of chemicals, and little maintenance. Passive treatment systems use contaminant removal processes that are slower than conventional treatment and thus require longer retention times and larger areas to achieve similar results. The goal of the passive mine drainage treatment system is to enhance natural ameliorative processes, so that they occur within the treatment system, not in the receiving water body. Two factors that determine whether this goal can be accomplished are the kinetics of the contaminant removal processes, and the retention time of the mine water in the treatment system. The retention time for a particular mine site is often limited by available land area. However, the

7
kinetics of contaminant removal processes can often be affected by manipulating the environmental conditions that exist within the passive treatment system. Efficient manipulation of contaminant removal processes requires an understanding of of each removal process and their respective limitations..
History of Passive Treatment
Passive treatment of mine water can be traced to two independent research projects which showed that natural wetlands were ameliorating mine drainage without incurring any obvious ecological damage. Researchers at Wright State University studied a site in the Powelson Wildlife Area in Ohio where Sphagnum recurvem had volunteered and was growing in pH 2.5 water. As the water flowed through the boggy area, iron, magnesium, calcium, sulfate, and manganese all decreased, while pH increased to 4.6. A natural outcrop of limestone located at the downstream end provided sufficient neutralization to raise the effluent pH to between 6 and 7 (Huntsman et al. 1978). Meanwhile, a similar study was being conducted by a group at West Virginia University, working at a natural Sphagnum-dominated wetland, Tub Run Bog, in northern West Virginia. They were looking at the ecological damage to the wetland as a result of drainage water from an adjoining abandoned mine. They found no adverse ecological effects, and that in fact, within 20 to 50 m of the influent, the pH of the water rose from between 3.05 and 3.55 to 5.45 and 6.05. Sulfate concentrations decreased to 15 mg/L or less, and iron decreased to less than 2 mg/L (Wieder and Lang 1982). These field observations prompted the idea that wetlands might be constructed for the intentional treatment of coal mine drainage. It was thought that the small seeps present at many abandoned mine sites could be passively treated in this manner. Research efforts were initiated by the United States Bureau of Mines, in cooperation with Wright State University (Kleinmann et al. 1983, Kleinmann 1985). Independently, West Virginia University, and subsequently, Pennsylvania State University conducted research as well (e.g., Gerber et al. 1985, Stone and Pesavento 1985).
Initially, most of these experimental wetlands were constructed to mimic the Sphagnum wetlands. However, Sphagnum moss was not readily available, proved difficult to transplant, and tended to accumulate metals to levels that were toxic to the Sphagnum after several months of exposure to mine drainage (Huntsman et al. 1985, Spratt and Wieder 1989). Instead of abandoning the concept, researchers experimented with different kinds of constructed wetlands. Eventually a wetland design evolved that proved tolerant to years of exposure to contaminated mine drainage and was effective at lowering concentrations of dissolved metals. Most of these treatment systems consisted of a series of small wetlands (< 1 ha) that were vegetated with cattails (Typha latifolia) (Girts et al. 1987, Stark et al. 1990). Although neither were as acid tolerant or as effective in removing metals as the Sphagnum systems, the cattail systems proved to be very hardy. We gradually learned that these systems were very cost effective in treating circumneutral and net alkaline mine water, where the primary objective was to precipitate the iron in the wetland, instead of downstream.
Some of these wetlands were constructed with a compost and limestone substrate to provide a favorable environment for the cattails to root. Others were constructed without an exogenous organic substrate; emergent plants were rooted in whatever soil or spoil substrate was available on the site when the treatment system was constructed. Researchers soon realized that the cattails were generally collecting only a small component of accumulated metals internally (Sencindiver and Bhumbla 1988), and that its principal functions were dispersing the flow of the
8
water and filtering out the suspended floc of the precipitated metals (some recent research indicates that plant uptake of iron at low concentrations may be critical to achieving very low residual iron concentrations (Batty and Younger 2002)). Subsequently, some systems were constructed that did not rely at all on the early wetland model . Ponds, ditches, and rock-filled basins were constructed without emergent plants and, in some cases, without soil or organic substrate.
In the late 1980s, two new approaches were developed that extended the treatment capabilities of wetlands to more acidic mine water. In the first case, U. S. Bureau of Mines researchers, assessing the performance of a wetland that had been constructed in an attempt to treat very acidic water, found that in isolated locations, the mine water was being neutralized and iron was being precipitated as a sulfide. Apparently, water was flowing down through the compost/limestone substrate and then back up again, gaining alkalinity in the process (Hedin et al. 1988). An approach was developed to optimize this effect and was evaluated in the field (McIntyre and Edenborn 1990, Nawrot 1990), these anaerobic or compost wetlands added alkalinity, but were not very efficient for iron removal, and required sequential placement of aerobic and anaerobic systems. Currently, these systems are seldom constructed to treat coal mine drainage, however, they can be useful for treatment of metal mine drainage, since they provide a mechanism to remove metals such as cadmium, copper, lead, etc. (Wildeman et al. 1990, Wildeman et al. 1994).
The other new approach involved acidic water in contact with limestone in an anoxic environment before flowing into a settling pond or wetland system. Although limestone had previously been used many times to treat mine water, it typically became coated or “armored” by iron hydroxide. Turner and McCoy (1990) reasoned that if the mine water could be intercepted before it contacted the atmosphere, and was directed into a limestone-filled French drain, the dissolved iron would not oxidize to ferric hydroxide to armor the limestone, and the water would be neutralized. The water could then be discharged into an aeration pond and a wetland. A great number of anoxic limestone drains (ALDs) were subsequently constructed, and soon, sizing guidelines were developed (Hedin et al. 1994b). However, as discussed in more detail later in this manual, these systems also had their limitations. They worked well for mildly acidic water (pH > 4.5) that was anoxic, but more acidic water tended to contain dissolved aluminum, which precipitated in the ALD and reduced permeability, often to the point of failure. In addition, if the pH of the water was below about 3.5, the dissolved iron was often already oxidized (ferric), so that armoring could occur even if no oxygen was present.
To compensate for dissolved oxygen and dissolved ferric iron, the concept of the ALD and compost wetland were combined (Kepler and McCleary 1994, Kepler 1995). Compost was placed up-gradient of the limestone. The bacterial activity in the compost consumed the dissolved oxygen and reduced the ferric iron to ferrous iron, allowing the ALD component to work as intended, even for very acidic water. They referred to these systems as sequential alkalinity-producing systems (SAPS); others have preferred to use the term reducing and alkalinity producing systems (RAPS) to more accurately describe the process, and to include systems that did not put more than one unit in sequence. These systems are also called vertical flow ponds, vertical flow wetlands or vertical flow systems. Aluminum is still retained in these systems, so Kepler and McCleary (1997) suggested a simple gravity-powered flushing mechanism to extend their effective life span.
It is difficult to argue with the long-term success of some of these passive treatment
9
systems. However, failures can be very damaging to the perceived effectiveness of the technology. In general, we have found that the systems that were not effective or failed were undersized, improperly designed, or both. The key is to understand the limitations of each unit’s operation, to have reasonable expectations, and to use conservative sizing criteria to attain specific water quality goals. Even undersized passive systems can be useful, discharging water with significantly lower concentrations of metal contaminants than present in the inflow drainage. These improvements in water quality decrease the costs of subsequent water treatment at active sites, and decrease deleterious impacts that discharges from abandoned sites have on receiving streams and lakes.
Researchers have recently developed additional passive treatment technologies, such as steel slag leach beds (Simmons et al. 2002), which may prove to be useful additions to the passive treatment arsenal. Research is being conducted on semi-passive approaches that have the potential to significantly reduce the land requirements of passive treatment systems. Semi-passive systems fall between conventional chemical treatment, which requires virtually around-the-clock attention, and passive systems that ideally require very little maintenance and attention (Younger et al. 2002). Semi-passive systems have been constructed using gravity-, wind-, and water-powered aeration or neutralization processes, as well as some low-power demanding devices.
Background
Formation of Polluted Mine Waters
The cause of most mine water degradation is the oxidation of iron sulfide minerals, such as pyrite (FeS2). Equal amounts of acidity are produced by the oxidation of the sulfide to sulfate (reaction A), and by the oxidation and hydrolysis of iron (reaction B) (Barnes and Romberger 1968):
FeS2 + 3.5O2 + H2O ÷ Fe2+ + 2SO42-
+ 2H+ (A)
Fe2+ + 2.5H2O + 0.25O2 ÷ Fe(OH)3(s) + 2H+ (B) Iron-oxidizing bacteria accelerate pyrite oxidation by two mechanisms: direct oxidation,
and oxidizing Fe2+ to Fe3+, which in turn oxidizes the sulfide minerals (Beck and Brown, 1968, Duncan et al. 1967, Groudev 1979, Silverman 1967). Direct oxidation is probably most important during initial acidification, when complete hydrolysis of Fe3+ and the resultant precipitation of Fe(OH)3 are too rapid to allow ferric iron to act as an important oxidant.
As the pH decreases, abiotic oxidation of Fe2+ slows down dramatically, according to the rate law:

10
-d (Fe2+) (O2 (aq)) (Fe2+)
= k (C)
dt (H+)2
where (Fe2+), (O2 (aq)), and (H+) are activities, k is the rate constant, and t is time (Stumm and Morgan 1981). Below approximately pH 4 (Kirby et al. 1999), the iron-oxidizing bacteria assume the primary role of oxidizing Fe2+, thereby allowing reaction B to continue producing acidity and ferric hydroxide. Although the reaction stoichiometry remains the same, this is a transition point from the primarily abiotic stage to the partially biological stage (Kleinmann et al. 1981). The pH decline typically continues to a stage where the reaction chemistry changes to a biologically-mediated cycle of reactions D and E (Kleinmann et al. 1981, Temple and Delchamps 1953):
Fe2+ + 0.25O2 + H+ ÷ 0.5Fe3+ + 0.5H2O (D)
FeS2 + 14Fe3+ + 8H2O ÷ 15Fe2+ + 2SO42- + 16H+ (E)
As acidification proceeds and the pH in the immediate vicinity of the pyrite falls to less than 3, the increased solubility of iron, and the decreased rate of Fe(OH)3 precipitation result in increased Fe3+ activity (Silverman,1967). This is significant because as Fe3+ aggressively attacks pyrite, it is reduced to Fe2+ (reaction E) for subsequent reoxidation by iron oxidizing bacteria, such as Acidithiobacillus ferrooxidans (formerly called Thiobacillus ferrooxidans). Oxidation of pyrite by Fe3+ is about an order of magnitude faster than oxidation by equivalent concentrations of dissolved oxygen, apparently because of different reaction mechanisms at the molecular level (Luther 1987). When the pH in the immediate microenvironment of the pyrite falls to approximately 2.5 (often corresponding to a drainage pH of 3.5 to 4.0), bacterial oxidation of Fe2+ and reduction of Fe3+ by the pyrite (reactions D and E) combine to cause a dramatic increase in acidity and iron concentrations (Kleinmann 1979).
As this solution moves through mine workings or spoils, it undergoes secondary reactions that raise pH, decrease concentrations of iron, and increase the concentrations of other cations. Contact with clays and other aluminosilicates releases aluminum, sodium, potassium, and magnesium, while contact with carbonate minerals releases calcium, magnesium, manganese, and additional iron (siderite). The various effects these reactions have on the chemistry of the mine drainage depends on the volume of water, the amount of pyrite oxidized, and the extent and variety of secondary chemical reactions. The secondary reactions can produce a drainage with relatively high sulfate concentrations, butcircumneutral pH (Kleinmann et al. 1983, Stone and Pesavento 1985), is low in metals, and fairly innocuous. Alternatively, the mine water may have circumneutral pH, but contains elevated concentrations of dissolved iron and manganese, and can become acidic (pH ~3) upon oxidation and precipitation of iron. In other cases, the mine drainage is acidic; acid mine drainage often contains high concentrations of dissolved iron, aluminum, and manganese. Both alkaline and acidic mine drainage may contain other metals, namely zinc, nickel, and cobalt.
As contaminated mine drainage flows through receiving systems (streams, rivers, and lakes), its toxic characteristics decrease naturally as a result of chemical and biological reactions, and dilution with uncontaminated waters. Under the aerobic conditions found in most surface waters, iron, aluminum, and manganese precipitate as oxides and hydroxides. Ferrous iron
11
oxidizes to ferric iron, which hydrolyzes and precipitates mainly as iron oxyhydroxides (e.g., FeOOH) or oxyhydroxylsulfates of various composition and crystallinity. These compounds stain the bottom of many streams orange, often accumulating at sufficient depths to suffocate benthic organisms. The rate of iron precipitation at low pH depends on the activity of the same iron-oxidizing bacteria that catalyze pyrite oxidation (e.g., A. ferrooxidans); the abiotic rate increases a hundredfold for every unit increase in pH, and is also dependent on the amount of oxygen dissolved in the water. (See reaction C.)
Aluminum generally hydrolyzes and precipitates as Al(OH)3, which is a white particulate. Other aluminum compounds with silica and sulfate can also form, depending on the environmental conditions. Oxidation is not required, and apparently bacterial activity is not a factor. Precipitation of aluminum requires a pH above 4, and is generally observed at a pH of 4.5 or above. Aluminum solids will become soluble, as Al(OH)4
-, and at pH levels over 8.5. This can occur in conventional chemical treatment systems that must increase pH to these higher levels to remove manganese.
Manganese oxidizes and hydrolyzes to MnOOH or MnO2, and precipitates as a black particulate. Ubiquitous manganese-oxidizing bacteria can influence the rate of removal, since like iron, oxidation generally precedes precipitation. More important however, is that significant oxidation and precipitation of manganese requires a pH greater than 6, and generally only occurs in passive systems after virtually all of the iron has already precipitated. As a result, manganese removal, if necessary, significantly increases the land area required for passive treatment. Manganese precipitation is auto-catalytic; once precipitates form, their presence increases the rate of manganese removal. In conventional chemical treatment systems, the pH is often raised above 9 or 10 to remove manganese to desired levels.
Chemical Characteristics of Mine Drainage
Acidity Acidity is a measurement of the base neutralization capacity of a volume of water. Four
types of acidity exist: organic acidity associated with dissolved organic compounds, carbon dioxide acidity associated with dissolved carbon dioxide and carbonic acid; proton acidity associated with pH (a measure of free H% ions); and mineral acidity associated with dissolved metals (Hem 1985). Mine waters generally have very little dissolved organic carbon, so organic acidity is very low. The amount of dissolved carbon dioxide in mine drainage varies with geologic and environmental conditions and usually only contributes significantly to acidity at pH levels > 5. In addition, carbon dioxide acidity can be thought of as temporary, because CO2-rich waters will degas upon exposure to the atmosphere. The majority of acidity in coal mine drainage arises from free protons (manifested in low pH) and the mineral acidity arising from dissolved iron, aluminum, and manganese. These metals are considered acidic because they can undergo hydrolysis reactions that produce H%.
Fe2+ + 0.25O2 + 1.5H2O ÷ FeOOH + 2H+ (F)
Fe3+ + 2H2O ÷ FeOOH + 3H+ (G)
Al3+ + 3H2O ÷ Al(OH)3 + 3H+ (H)

12
Mn2+ + 0.25O2 + 1.5H2O ÷ MnOOH + 2H+ (I)
These reactions can be used to calculate an estimate of the total acidity of a mine water sample, and to partition the acidity into its various components. The expected acidity of a mine water sample is calculated from its pH and the sum of the milliequivalents of the dissolved acidic metals. For most coal mine drainages, the acidity is calculated as follows,
Acidcalc = 50(2Fe2+/56 + 3Fe3+/56 + 3Al/27 + 2Mn/55 + 1000(10-pH)) (1)
where all metal concentrations are in mg/L, and 50 is the equivalent weight of CaCO3, and thus transforming mg/L of acidity into mg/L as CaCO3 equivalent. Simplifying the equation shows the conversion factors to be applied to each dissolved metal and hydrogen ion concentration (pH):
Acidcalc = 1.79Fe2+ + 2.68Fe3+ + 5.56Al + 1.82Mn + 50,000(10-pH) (2)
Equation 2 accurately characterizes mineral and proton acidity for most samples of actual acid mine drainage. It must be emphasized that only dissolved metals add to acidity, not those already precipitated. Figure 1 shows a very good correlation (R2 = 0.9943 and slope = 1.026) between measured and calculated acidity for mine drainage samples collected at over 150 different sites.
0
2000
4000
6000
8000
10000
0 2000 4000 6000 8000 10000
Measured Acidity, mg/L (CaCO3)
Cal
cula
ted
Aci
dity
, mg/
L (C
aCO
3)
Figure 1. Calculated Versus Measured Acidity for Over 150 Coal Mine Discharges
Equation 2 can be used to partition total acidity into its individual constituents. When the total acidity of contaminated coal mine drainages is partitioned in this manner, the importance of mineral acidity becomes apparent. Table 2 shows a breakdown of the acidic components of

13
three mine drainages. At each site, the acidity arising from protons (pH) was never the largest contributor to total acidity. Only when pH is less than 3.5 does it contribute significantly to acidity. (See Table 3.)
Table 2. Contributions of Metal Concentration and pH to Acidity for Selected Mine Discharges
Howe Bridge Jennings Oven Run E Elklick Value A.C. % Value A.C. % Value A.C. % Value A.C. %
pH
5.38
<1
<1
3.35
22
6
2.74
91
34
5.79
<1
<1
Fe2+
225
402
88
60
107
31
<1
<1
<1
55
98
93
Fe3+
<1
<1
<1
4
11
3
20
54
20
<1
<1
<1
Al3+
<1
<1
<1
30
167
48
18
100
37
<1
<1
<1
Mn2+
29
53
12
22
40
12
13
24
9
4
7
7
pH in standard units. Fe2+, Fe3+, Al3+ and Mn2+ concentrations in mg/L. A.C. is acidity contribution in mg/L as CaCO3.
Table 3. Proton Acidity Contributions at Various pH Values
pH Acidity Equivalent (mg/L as CaCO3)
6.0 0.05 5.0 0.5 4.5 1.6 4.0 5 3.5 16 3.0 50 2.5 158 2.0 500
Alkalinity When mine water pH is greater than 4.5, it has acid neutralizing capacity and is said to
contain alkalinity. Alkalinity can result from hydroxyl ion (OH&), carbonate, silicate, borate, organic ligands, phosphate, and ammonia (Hem 1985). The principal source of alkalinity in mine water is dissolved carbonate, which can exist in bicarbonate (HCO3
&) or carbonate (CO32&)
form. Both can neutralize proton acidity (reactions J and K). In the pH range of most alkaline mine waters, bicarbonate is the principal source of alkalinity (Wieder and Lang 1982, Stone and Pesavento 1985).
2H+ + CO32- ÷ H2O + CO2 (J)

14
H+ + HCO3- ÷ H2O + CO2 (K)
The presence of bicarbonate alkalinity in mine waters with elevated levels of metals is not unusual, particularly in anoxic waters. Table 4 shows the chemical composition of six mine waters in northern Appalachia that contain alkalinity, and are also contaminated with ferrous iron and manganese. None are contaminated with significant levels of dissolved ferric iron or aluminum because the solubilities of these metal hydroxides are low in mine waters with pH greater than 5.0 (Hem 1985, Stumm and Morgan 1981).
Table 4. Chemical Composition of Untreated Mine Waters Containing Alkalinity
pH Alkalinity Fe2+ Fe3+ Al3+ Mn2+ Net Acidity Calculated Acidity
Penn Allegh
6.64
470
76
<1
<1
2
-358
-330
Brinkerton 6.04
168
50
<1
<1
1
-101
-77
Scrubgrass 6.00
165
64
<1
<1
<1
-61
-50
Elklick 5.79
42
54
<1
<1
4
62
62
Howe Bridge
5.38
35
225
<1
<1
37
395
435
Morrison 5.15
23
229
<1
<1
47
373
472
Alkalinity and pH were determined in the field. Metals and net acidity were analyzed in the lab. Calculated acidity was calculated using Equation 2 subtracting field alkalinity. pH in standard units, alkalinity and acidity in mg/L as CaCO3, metal concentrations in mg/L. Negative values of acidity indicate net alkalinity.
Alkalinity and acidity are not mutually exclusive terms. All of the mine waters shown in Table 4 contain both acidity and alkalinity. When water contains both mineral acidity and alkalinity, a comparison of the two measurements results in a determination as to whether the water is net alkaline (alkalinity > acidity) or net acidic (acidity > alkalinity). Net alkaline water contains enough alkalinity to neutralize the mineral acidity represented by dissolved ferrous iron and manganese. As these metals oxidize and hydrolyze, the produced proton acidity is rapidly neutralized by bicarbonate. For waters contaminated with Fe2%, the net reaction for the oxidation, hydrolysis and neutralization reactions is:
Fe2+ + 0.25O2 + 2HCO3- ÷ FeOOH + 0.5H2O + 2CO2 (L)
Reaction L indicates that net alkaline waters contain at least 1.8 mg/L alkalinity for each 1.0 mg/L of dissolved Fe2+. Waters that contain a lesser ratio are net acidic; the oxidation and hydrolysis of the total dissolved iron content results in a net release of protons and a decrease in the pH. For waters containing dissolved Fe2+, accurate determination of alkalinity must be performed in the field, immediately upon the collection of water samples. Laboratory determinations may lead to incorrect conclusions, due to reaction L occurring in the sample bottle, thus decreasing measurable alkalinity concentrations.

15
Interpretation of Laboratory Analyses There has been, and continues to be some confusion interpreting the results of net
alkaline or net acidic laboratory analyses (Kirby 2002). Selection of the most effective passive treatment system design depends on whether the water is net acidic or net alkaline. Interpretation confusion arises from the way laboratories report the acidity and alkalinity values. They report acidity and alkalinity in mg/L as CaCO3. The analytical procedure in Standard Methods (APHA 1998), however, actually measures net acidity for the acidity method, and gross alkalinity for the alkalinity method, and offers no guidance for reporting acidity and alkalinity as a net or gross value, respectively. The 20th edition of Standard Methods instructs the lab to report “the acidity to pH ___ = ___ mg as CaCO3/L” and “the alkalinity to pH ___ = ___ mg as CaCO3/L.” The wording was even less clear in previous editions (APHA 16th edition 1985), which stated “if a negative value is obtained, determine the alkalinity according to [the chapter on alkalinity].” It does not instruct the lab what to do with this negative number. Many labs reported that acidity was zero or left a blank space for the acidity value. Some labs list the acidity value as negative. The labs performed the alkalinity titration and recorded the value obtained as alkalinity. The problem lies with the individual interpretation of these results. For example, the table below shows two different water qualities:
Water pH Potential Acidity as Fe2+
and/or Mn 2+ (mg/L as CaCO3)
Alkalinity (mg/L as CaCO3)
True Net Acidity* (mg/L as CaCO3)
A 6.2 100 105 -5
B 6.1 150 100 50
* Negative numbers denote net alkalinity.
If a laboratory analyzed this water and if they received a negative number for acidity (for water A), they reported it as zero, and their lab sheet would look like this:
Water pH Acidity
(mg/L as CaCO3) Alkalinity (mg/L as CaCO3)
A 6.2 0 105
B 6.1 50 100
For water A, most labs would interpret the results as having a net alkalinity of 105 mg/L (as CaCO3), when, in fact, the water is only barely net alkaline (5 mg/L). If the lab reported acidity simply as negative, there was still confusion about whether the water was net alkaline or net acidic. Most would interpret water B, which is truly net acidic (50 mg/L as CaCO3), as being net alkaline (50 mg/L as CaCO3).
For water B, the important concept to remember is that the value obtained in the acidity titration is a net value. Since the lab reported acidity as 50 mg/L, this indicates that the water is net acidic (of 50 mg/L). For water A, if the laboratory reported the negative number that they actually received for acidity, it would eliminate the confusion. In 1998, authors of Standard Methods recognized this fact, and clarified their instruction in the 20th edition, instructing the reader: “if a negative value is obtained, report the value as negative. The absolute value of this

16
negative value should be equivalent to the net alkalinity.” It is still not clearly stated to report either positive or negative numbers as net acidity.
To complicate matters even further, some laboratories realized that if the water contained alkalinity, that this was consumed in the acidity titration and functioned to lower the value obtained in the titration. They then added the alkalinity value to the value obtained in the acidity titration and entered that for the acidity value. In essence they were listing the true gross values for acidity and alkalinity. For water A, they would list acidity as 100 mg/L asCaCO3 and alkalinity as 105 mg/L as CaCO3. For water B, they would list acidity as 150 mg/L and alkalinity as 100 mg/L as CaCO3. The simple subtraction of these two values would result in the correct interpretation, if the laboratory realized that gross values were being reported. If the laboratory knew that the value for acidity in Standards Methods was typically a net value, they would believe that both water samples were net acidic.
To ensure the correct interpretation of the values that laboratories provide, the laboratory must be contacted to determine what values they reported. Laboratories should report the value of any negative numbers they obtain in the acidity titration. If they follow the procedures outlined in Standard Methods, the value for acidity is the net value with negative numbers indicating net alkalinity, and the alkalinity value is the gross alkalinity.
As stated earlier, to ensure accurate measurement of alkalinity, the analysis should be performed in the field. If ferrous iron is in the sample, oxidation and subsequent hydrolysis can significantly lower alkalinity concentrations.
Concentrations of other constituents in coal mine drainage vary, depending on geologic and environmental conditions. Table 5 lists the mean, median, and ranges of several chemical parameters associated with 156 different coal mine drainage discharges.

17
Table 5. Water Quality from 156 Coal Mine Discharges
Parameter Times Reported
Mean Median Minimum Maximum
Flow 54 601 71.5 5.50 15600
pH 156 4.03 3.37 2.18 7.80
Conductivity 64 2500 2000 320 8140
Alk, field 95 32.0 0 0 470
Acidity 151 909 315 -358 9220
Sulfate 156 1750 1220 67.5 1100
Aluminum 156 68.4 15.6 0 930
Antimony 120 0.006 0 0 0.200
Arsenic 142 0.040 0 0 2.95
Barium 135 0.010 0 0 0.200
Beryllium 140 0.017 0 0 0.270
Cadmium 146 0.006 0 0 0.200
Calcium 156 168 159 6.90 483
Chloride 50 64.1 8.15 0 849
Chromium 155 0.063 0 0 7.18
Cobalt 137 0.646 0.240 0 6.00
Copper 155 0.103 0 0 2.49
Iron, Ferric 140 96.7 4.35 0 2420
Iron, Ferrous 137 150 65.0 0 1610
Iron, Total 156 221 71.9 0 2440
Lead 144 0.009 0 0 0.433
Magnesium 156 104 80.0 2.75 638
Manganese 156 20.6 6.76 0 164
Nickel 150 0.962 0.400 0 10.0
Potassium 143 4.05 3.12 0.04 32.0
Selenium 136 0.013 0 0 0.369
Silver 22 0.0005 0 0 0.010
Sodium 156 45.3 8.70 0.33 712
Vanadium 20 0.115 0.050 0 0.660
Zinc 153 2.64 0.700 0 48.0
All concentrations in mg/L, flow in L/min, pH in standard units, acidity and alkalinity in mg/L as CaCO3, negative acidity indicates net alkalinity.

18
Passive Treatment Processes
Limestone Dissolution
A major source of bicarbonate in many anoxic environments is the dissolution of carbonate minerals, such as calcite.
CaCO3 + H+ ÷ Ca2+ + HCO3- (M)
Carbonate dissolution can result in higher concentrations of bicarbonate in anoxic mine water environments than oxic environments, for two reasons. First, the absence of ferric hydroxide in most anoxic environments limits the formation of FeOOH coatings that may armor carbonate surfaces and inhibit further carbonate dissolution in oxic environments (U.S. EPA 1983). Second, the solubility of carbonate compounds are directly affected by the partial pressure of dissolved CO2 (Stumm and Morgan 1996, Hem 1985, Butler 1991). Anoxic mine water environments commonly contain high CO2 partial pressures due to the decomposition of organic matter and the neutralization of proton acidity. Table 6 shows how the partial pressure of carbon dioxide affects the maximum level of potential alkalinity. At atmospheric levels (~0.0003), only about 60 mg/L of alkalinity (as CaCO3) is capable of being dissolved. However, CO2 levels can be much higher within soil and mine spoil than in the atmosphere, from 0.01 to 0.10. At these CO2 levels, alkalinity concentrations of 220 to 475 mg/L are possible.
Table 6. Equilibrium Concentrations of Alkalinity at Various PCO2 Levels
PCO2 (atm) Alkalinity (mg/L as CaCO2)
0.0003 (~atmospheric) 60 0.01 220 0.05 360 0.10 475 0.20 610 0.50 850 1.00 1085
The observation that limestone dissolution by mine water is enhanced under closed
conditions has resulted in the construction of anoxic limestone treatment systems. The first demonstration of this technology was by Turner and McCoy (1990), who showed that when anoxic acidic mine water was directed through a plastic-covered buried bed of limestone, it was discharged in an alkaline condition.
Since Turner and McCoy described their findings in 1990, dozens of additional limestone treatment systems have been constructed (e.g., Brodie et al. 1991, Skousen and Faulkner 1992). These passive mine water pretreatment systems have become known as anoxic limestone drains (ALDs). In an ALD, mine water is made to flow through a bed of limestone gravel that has been buried to limit contact with atmospheric oxygen. The burial containment also traps CO2 within the treatment system, allowing the development of high CO2 partial pressures, which in turn allows additional limestone dissolution (Nairn et al. 1992).
Under oxic conditions, limestone dissolution may be enhanced by the active generation

19
of acidity (hydrogen ion) by ferric iron and aluminum hydrolysis. However, this process may not lend itself to sustainable treatment systems, due to problems of armoring and clogging.
Sulfate Reduction
When mine water flows through an anaerobic environment that contains an organic substrate, the water chemistry can be affected by bacterial sulfate reduction. In this process, bacteria oxidize organic compounds using sulfate as the terminal electron acceptor and release hydrogen sulfide and bicarbonate,
2CH2O + SO42- ÷ H2S + 2HCO3
- (N)
where CH2O is used to represent organic matter. Bacterial sulfate reduction is limited to certain environmental conditions (Postgate 1984). Bacteria requirea the presence of sulfate, suitable concentrations of low-molecular weight carbon compounds, and the absence of oxidizing agents, such as oxygen, Fe3% and Mn4%. These conditions are commonly satisfied in treatment systems that receive coal mine drainage and are constructed with an organic substrate, such as a compost material. High concentrations of sulfate (> 500 mg/L) are characteristic of contaminated coal mine drainage. The oxygen demand of organic substrates causes the development of anoxic conditions and an absence of oxidized forms of iron or manganese. The low molecular-weight compounds that sulfate-reducing bacteria utilize (lactate, acetate) are common end-products of microbial fermentation processes in anoxic environments. These sulfate reducing and fermentative bacteria are more active above pH ~5, however, they can be very active in drainages with lower pH levels, due to the presence of near-neutral pH microenvironments. These microenvironments allow the sulfate reducing bacteria (SRB) to become established, and because they generate alkalinity, these microenvironments become larger.
Metal Removal Processes
Coal mining can promote pyrite oxidation and result in drainage with high concentrations of iron, manganese, and aluminum, as well as SO4, Ca, Mg, K and Na. The concentrations of iron, manganese, and aluminum are generally very low in natural waters (< 1 mg/L) because of chemical and biological processes that cause their precipitation in surface water environments. The same chemical and biological processes remove iron, manganese, and aluminum from contaminated coal mine drainage, but the metal loadings from abandoned mine sites are often so high that the deleterious effects of these elements persist long enough to result in the pollution of receiving waters.
Passive treatment systems function by retaining contaminated mine water long enough to decrease contaminant concentrations to acceptable levels. The chemical and biological processes that remove contaminants vary among metals and are affected by the mine water pH and oxidation-reduction potential (Eh). Efficient passive treatment systems create conditions that promote the processes that most rapidly remove target contaminants. Thus, the design of passive treatment systems must be based on a solid understanding of mine drainage chemistry and how different passive technologies affect this chemistry.
Reduction Chemical and microbial processes in anaerobic environments differ from those observed
in aerobic environments. Because oxygen is absent, Fe2% and Mn2% do not oxidize, and oxyhydroxide precipitates do not form. Hydroxides of the reduced iron and manganese ions, Fe(OH)2 and Mn(OH)2, do not form because of their high solubility under acidic or

20
circumneutral conditions. In passive treatment systems where mine water flows through anaerobic environments, its chemistry is affected by chemical and biological processes that generate bicarbonate and hydrogen sulfide.
Bacterial sulfate reduction not only improves water quality by the addition of bicarbonate alkalinity, it can also lower the concentrations of dissolved metals, M2+, (e.g., Fe2+, Mn2+, Zn2+, Ni2+, Cu2+, Cd2+, Pb2+) by precipitating them as metal sulfide solids.
M2+ + H2S + HCO3- ÷ MS + 2H2O + 2CO2 (O)
For iron, the formation of iron monosulfide and even pyrite is possible:
Fe2+ + H2S + S0 ÷ FeS2 + 2H+ (P)
The removal of dissolved metals as sulfide compounds depends on pH, the solubility product of the specific metal sulfide, and the concentrations of the reactants. The solubilities of various metal sulfides are shown in Table 7 (Ehrlich 1981). Laboratory studies have verified that metal removal from mine water subjected to inflows of hydrogen sulfide occurs on an order consistent with the solubility products shown in this table (Hammack et al. 1993). The first metal sulfide that forms is CuS, followed by PbS, ZnS, and CdS. FeS is one of the last metal sulfides to form. MnS is the most soluble metal sulfide shown, and is not expected to form. Because of the low solubility of some of these metal sulfides relative to their solubilities as oxides or hydroxides, sulfate reduction can be an important process to lower some metal concentrations to acceptable levels, particularly for treating metal mine drainage.
Table 7. Solubility Products of Selected Metal Sulfides
Metal Sulfide Solubility Product CuS 4.0 x 10-38
PbS 1.0 x 10⁻²⁹
ZnS 4.5 x 10⁻²⁴
CdS 1.4 x 10⁻²³
NiS 3.0 x 10⁻²¹
FeS 1.0 x 10⁻¹⁹
MnS 5.6 x 10⁻¹⁶
For coal mine drainage, where metal contamination is generally limited to iron ,
manganese , and aluminum, the hydrogen sulfide produced by bacterial sulfate reduction primarily affects dissolved iron concentrations. Aluminum does not form any sulfide compounds in wetland environments, and the relatively high solubility of MnS makes its formation unlikely.
The precipitation of metal sulfides in an organic substrate improves water quality by decreasing mineral acidity without causing a parallel increase in proton acidity. Proton-releasing aspects of the H2S dissociation process (H2S ÷ 2H+ % S2&) are neutralized by an equal release of bicarbonate during sulfate reduction. An organic substrate in which 100 percent of the H2S (produced by sulfate reduction precipitated as FeS) would have no effect on the mine water pH or alkalinity (although acidity would decrease). In fact, however, the chemistry of pore water in wetlands constructed with an organic substrate characteristically has pH 6 to 8 and is highly alkaline (Hedin et al. 1988, McIntire and Edenborn 1990). These alkaline conditions result, in

21
part, from reactions involving hydrogen sulfide that result in the net generation of bicarbonate. Hydrogen sulfide is a very reactive compound that can undergo a variety of reactions in a constructed wetland. In most wetlands (constructed and natural), surface waters are aerobic while the underlying pore waters in contact with organic substrate are anaerobic. When sulfidic pore waters diffuse from the organic substrate into zones that contain dissolved ferric iron, dissolved oxygen, or precipitated ironand manganese oxides, the hydrogen sulfide can be oxidized. These reactions affect the mineral acidity and the alkalinity in various manners.
Metal Oxidation and Hydrolysis Oxidation and hydrolysis reactions commonly cause concentrations of Fe2%, Fe3%,
manganese , and Al to decrease when mine water flows through an aerobic environment. Whether these reactions occur quickly enough to lower metal concentrations to an acceptable level depends on the availability of oxygen for oxidation reactions, the pH of the water, the activity of microbial and/or other catalysts and inhibitors, and the retention time of water in the treatment system. The pH is an especially important parameter because it influences both the solubility of metal hydroxide precipitates and the kinetics of the oxidation and hydrolysis processes. The relationship between pH and metal-removal processes in passive treatment systems is complex because it differs among metals and also between abiotic and biotic processes.
The stoichiometries of the major metal removing reactions in passive treatment systems are:
Fe3+ + 3H2O ÷ Fe(OH)3 + 3H + (Q)
Al3+ + 3H2O ÷ Al(OH)3 + 3H + (R)
Fe2+ + 0.25O2 + 2.5H2O ÷ Fe(OH)3 + 2H + (S)
Mn2+ + 0.25O2 + 1.5H2O ÷ MnOOH + 2H + (T)
The first two (Q and R) are simple hydrolysis reactions, which require only the presence of water (and enough alkalinity to neutralize the H+ produced). The last two reactions (S and T) require the presence of oxygen to oxidize the metal prior to hydrolysis. All of the reactions produce acidity, which was discussed previously. The goal of passive treatment systems is to drive these reactions to completion and collect the resulting solids before the water enters a receiving stream.
Iron The most common contaminant of coal mine drainage is ferrous iron. In oxidizing
environments common to most surface waters, ferrous iron is oxidized to ferric iron (reaction S). Ferrous iron oxidation occurs both abiotically and as a result of bacterial activity. The stoichiometry of the reaction is the same for both oxidation processes.
From the stoichiometry, it can be seen that one mole of oxygen can oxidize 4 moles of Fe2+. This corresponds to 7.0 mg of Fe2+ oxidized per mg of O2. The solubility of oxygen in water depends on both pressure and temperature. It can be as high as 13 mg/L (1 atm., < 5 oC) but under field conditions, a maximum practical DO level of 8 mg/L is a better estimate. At this oxygen concentration, only about 55 mg/L of Fe2+ can be oxidized without providing for additional oxygenation of the water.
22
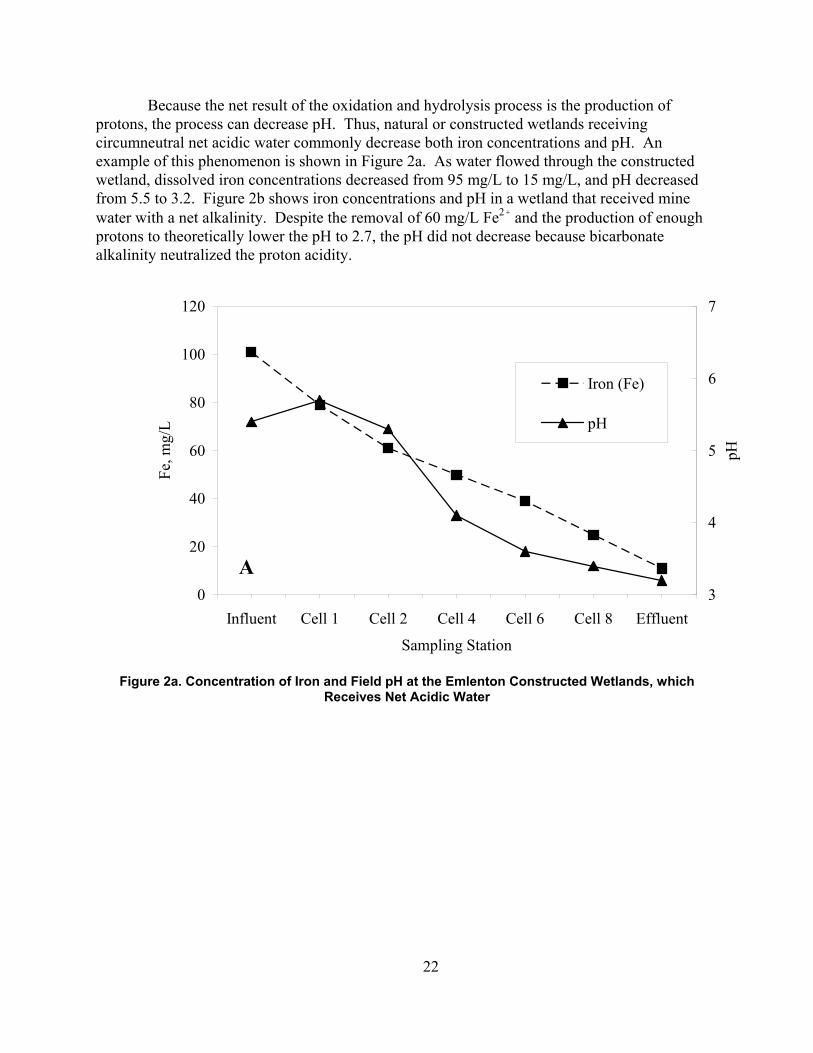
Because the net result of the oxidation and hydrolysis process is the production of protons, the process can decrease pH. Thus, natural or constructed wetlands receiving circumneutral net acidic water commonly decrease both iron concentrations and pH. An example of this phenomenon is shown in Figure 2a. As water flowed through the constructed wetland, dissolved iron concentrations decreased from 95 mg/L to 15 mg/L, and pH decreased from 5.5 to 3.2. Figure 2b shows iron concentrations and pH in a wetland that received mine water with a net alkalinity. Despite the removal of 60 mg/L Fe2% and the production of enough protons to theoretically lower the pH to 2.7, the pH did not decrease because bicarbonate alkalinity neutralized the proton acidity.
0
20
40
60
80
100
120
Influent Cell 1 Cell 2 Cell 4 Cell 6 Cell 8 Effluent
Sampling Station
Fe, m
g/L
3
4
5
6
7
pH
Iron (Fe)
pH
A
Figure 2a. Concentration of Iron and Field pH at the Emlenton Constructed Wetlands, which
Receives Net Acidic Water

23
0
30
60
90
120
150
Influent Cell 1 Cell 3 EffluentSampling Station
Fe, m
g/L
3
4
5
6
7
pH
Iron (Fe)
pH
B
Figure 2b. Concentration of Iron and Field pH at Cedar Grove Constructed Wetlands which
Receives Net Alkaline Water
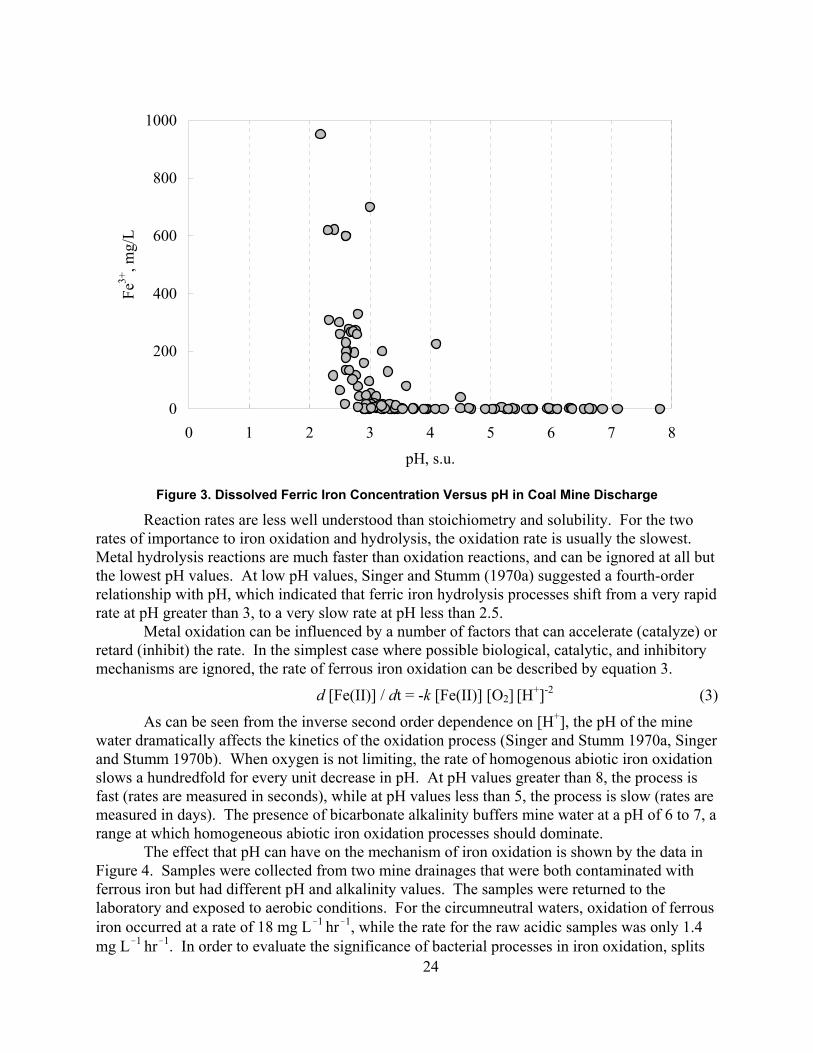
As ferrous iron is converted to ferric iron, it is subject to hydrolysis reactions that can precipitate it as a hydroxide (reaction Q). The hydrolysis reaction occurs abiotically; catalysis of the reaction by microorganisms has not been demonstrated. Under equilibrium conditions, the solubility of the ferric hydroxide solid is very low and little dissolved ferric iron (< 1 mg/L) is predicted to exist, unless the pH of the water is less than 2.5. However, the rate of the hydrolysis reaction is also pH dependent, and significant Fe3% can be found in mine water with a pH above 2.5. Figure 3 shows ferric iron concentrations for over 150 coal mine discharges. Significant dissolved ferric iron is not generally present, unless the pH is less than 4. The highest concentrations of ferric iron occurred when the pH is less than 3.
24
0
200
400
600
800
1000
0 1 2 3 4 5 6 7 8pH, s.u.
Fe3+
, mg/
L
Figure 3. Dissolved Ferric Iron Concentration Versus pH in Coal Mine Discharge
Reaction rates are less well understood than stoichiometry and solubility. For the two rates of importance to iron oxidation and hydrolysis, the oxidation rate is usually the slowest. Metal hydrolysis reactions are much faster than oxidation reactions, and can be ignored at all but the lowest pH values. At low pH values, Singer and Stumm (1970a) suggested a fourth-order relationship with pH, which indicated that ferric iron hydrolysis processes shift from a very rapid rate at pH greater than 3, to a very slow rate at pH less than 2.5.
Metal oxidation can be influenced by a number of factors that can accelerate (catalyze) or retard (inhibit) the rate. In the simplest case where possible biological, catalytic, and inhibitory mechanisms are ignored, the rate of ferrous iron oxidation can be described by equation 3.
d [Fe(II)] / dt = -k [Fe(II)] [O2] [H+]-2 (3)
As can be seen from the inverse second order dependence on [H+], the pH of the mine water dramatically affects the kinetics of the oxidation process (Singer and Stumm 1970a, Singer and Stumm 1970b). When oxygen is not limiting, the rate of homogenous abiotic iron oxidation slows a hundredfold for every unit decrease in pH. At pH values greater than 8, the process is fast (rates are measured in seconds), while at pH values less than 5, the process is slow (rates are measured in days). The presence of bicarbonate alkalinity buffers mine water at a pH of 6 to 7, a range at which homogeneous abiotic iron oxidation processes should dominate.
The effect that pH can have on the mechanism of iron oxidation is shown by the data in Figure 4. Samples were collected from two mine drainages that were both contaminated with ferrous iron but had different pH and alkalinity values. The samples were returned to the laboratory and exposed to aerobic conditions. For the circumneutral waters, oxidation of ferrous iron occurred at a rate of 18 mg L&1 hr&1, while the rate for the raw acidic samples was only 1.4 mg L&1 hr&1. In order to evaluate the significance of bacterial processes in iron oxidation, splits

25
of both samples were filter-sterilized (0.22 µm membrane filter) before the experiment was begun. Removal of bacteria had no effect on the oxidation of ferrous iron for the circumneutral water, but completely inhibited ferrous iron oxidation for the acidic water.
0
10
20
30
40
0 10 20 30 40 50Time, h
Fe2+
, mg/
L
Filtered Unfiltered
A
0102030405060708090
100
0 2 4 6 8 10 12Time, h
Fe2+
, mg/
L
FilteredUnfiltered
B
Figure 4. Removal of Ferrous Iron from Acidic and Alkaline Mine Waters in a Laboratory
Experiment
Untreated mine drainage was collected from the (A) acidic Latrobe site and (B) alkaline Cedar Grove site. Splits of each sample were filter sterilized (0.22 micrometer filter).
In contrast to the uncatalyzed chemical rate, bacterial oxidation of ferrous iron peaks at pH values between 2 and 3, while very little activity occurs at pH values greater than 5 (Nealson 1983a). Waters containing no alkalinity have a pH less than 4.5, and the removal of iron under oxidizing conditions occurs primarily by bacterial oxidation, accompanied by hydrolysis and

26
precipitation (Kirby et al. 1999). Equation 4 gives the rate of loss of ferrous iron via the microbial mechanism. Note that in the microbial case, the rate is directly proportional to the hydrogen ion concentration and contains a term to account for the number of bacteria present, [Bact].
d [Fe(II)] / dt = - kbio [Bact] [H+] [Fe(II)] [O2] (4)
Solid surfaces, in particular the hydrous ferric oxide surface itself, can catalyze the oxidation of ferrous iron that adsorbs to its surface. There have been recent attempts to exploit this mechanism in a recirculated iron oxide reactor in an effort to increase iron removal rates over those obtained in conventional ponds and wetlands (Dietz and Dempsey 2001). The rate of heterogeneous catalysis is given in equation 5. In this case, the rate expression contains a term to account for the amount of oxide present, [Fe(III)], and is proportional to the inverse of the hydrogen ion concentration.
d [Fe(II)] / dt = - khetero [Fe(III)][Fe(II)] [O2] [H+]-1 (5)
Kirby and Elder Brady (1998) list several other factors that have been reported to affect Fe(II) oxidation rate in natural waters: Cu(II), Co(II), anions that form complexes with Fe(III), organic acids, Na+, presence of ferric hydroxide solids, ionic strength, sulfate, light intensity, colloidal silica and aluminum oxide, and bentonite clay are all listed, together with literature citations to the original work. It is likely that except for the presence of ferric hydroxide solids, these other factors are not significant in passive treatment systems. Light intensity, which can influence iron photoreduction (McKnight et al. 2001) may be significant, but conflicting results (Wieder 1994) in the literature demonstrate that further study is needed.
Temperature is known to affect the rate in a number of ways. Because the dissociation constant for water, Kw , depends on temperature, this change must be taken into account during the conversion from pH, the measured parameter, to hydroxide ion concentration, the rate dependent variable. Alternatively, the rate constant can be determined using Equation 3 (often in the integrated form) with the realization that it contains Kw. However, because Kw changes with temperature, the former conversion of pH to [OH-] is preferred when rate constants determined at different temperatures are to be used to determine an activation energy. The temperature affects the Henry’s law constant, used to calculate the molar concentration of oxygen from its partial pressure. However, in many studies, the dissolved oxygen concentration is measured directly.
Rate constants increase with increasing temperature. To quantitatively model the iron loss in a system where the temperature is not constant, the temperature dependence is usually expressed as the exponential given in equation 6 (Kirby et al. 1999, Watzlaf et al. 2001).
-Eact
k = A e RT (6)
Manganese Manganese undergoes oxidation and hydrolysis reactions that result in the precipitation
of manganese oxyhydroxides. The specific mechanism(s) of Mn2% precipitation from aerobic mine water in the absence of chemical additions are uncertain. Mn2% may be oxidized to either a %3 or a %4 valence, either one of which rapidly precipitates. (See reaction T.) If MnOOH precipitates over time it likely oxidizes to the more stable MnO2. In alkaline environments, Mn2% can precipitate as a carbonate (reaction U), which may be oxidized by oxygen to MnO2 via

27
reaction V (Diehl and Stumm 1984).
Mn2+ + HCO3- ÷ MnCO3 + H+ (U)
MnCO3 + 0.5O2 ÷ MnO2 + CO2 (V)
Regardless of the mechanism by which Mn2% is oxidized to Mn4%, the removal of one mole of Mn2% from solution results in the release of two moles of H%, or an equivalent decrease in alkalinity (HCO3
&). The kinetics of Mn2% oxidation reactions are strongly affected by pH. Abiotic oxidation
reactions are very slow at pH less than 8 (Stumm and Morgan 1981). Microorganisms can catalyze Mn2% oxidation, but their activity is limited to aerobic waters with pH greater than 6 (Nealson 1983b).
Although the hydrolysis of manganese produces protons, the precipitation of MnOOH does not result in large declines in pH, which can happen when FeOOH precipitates. This difference between manganese and iron chemistry is due to the fact that no natural mechanism exists to rapidly oxidize Mn2% under acidic conditions. If pH falls below 6, Mn2% oxidation virtually ceases, the proton-producing hydrolysis reaction ceases, and the pH stabilizes.
The oxidation and precipitation of Mn2% from solution is accelerated by the presence of MnO2 and FeOOH (Stumm and Morgan 1981, Davies and Morgan 1989). Both solids reportedly act as adsorption surfaces for Mn2% and catalyze the oxidation mechanism. While additions of FeOOH to water containing manganese might accelerate manganese oxidation, the direct precipitation of FeOOH from mine water that contains Fe2% does not generally stimulate manganese removal processes in passive treatment systems. Figure 5 shows that concentrations of manganese and iron in mine water markedly decreased as it flowed through a constructed wetland. On average, iron decreased from 150 mg/L to less than 1 mg/L, while manganese decreased from 42 mg/L to 11 mg/L. Removal of metals occurred sequentially, not simultaneously. Two-thirds of the decrease in iron concentration occurred between the first and second sampling stations. The wetland substrate in this area was covered with precipitated FeOOH, and the water was turbid with suspended FeOOH. Despite the presence of large quantities of FeOOH, little change occurred in the concentration of manganese between the first and second sampling station. The slight decrease in manganese that occurred was proportionally similar to the change in Mg, suggesting that dilution was the most likely cause of the decrease in manganese concentrations. Between stations 3 and 5, there was little iron present in the water and little visual evidence of FeOOH sludge on the wetland substrate. Most of the observed removal of manganese occurred in this iron-free zone.
The absence of simultaneous precipitation of dissolved iron and manganese from aerobic alkaline waters likely results from the reduction of oxidized forms of manganese by ferrous iron as shown in reaction W, or reaction X.
MnO2 + 2Fe2+ + 2H2O ÷ 2FeOOH + Mn2+ + 2H+ (W)
MnOOH + Fe2+ ÷ FeOOH + Mn2+ (X)

28
Figure 5. Mean Concentration of Iron, Manganese and Magnesium at the Morrison Wetland as the Mine Water Flows Linearly through the System
Figure 6 shows the results of a laboratory study that demonstrates the instability of manganese oxides in the presence of ferrous iron. Water samples and manganese oxides were collected from a wetland that removed iron and manganese in a sequential manner. The wetland influent was alkaline (pH 6.2, 162 mg/L alkalinity) and contaminated with 50 mg/L iron and 32 mg/L manganese . Two flasks of mine water received MnO2 additions, while the controls did not receive MnO2. Concentrations of dissolved iron and manganese were monitored in each flask over a 73-hour period. In all flasks, concentrations of iron decreased to less than 1 mg/L. In the control flasks, concentrations of iron decreased to less than 3 mg/L within 43 hours. In flasks that received MnO2, concentrations of iron decreased to less than 3 mg/L in only 22 hours. No change in concentrations of manganese occurred in the control flasks. Concentrations of manganese in the MnO2 flasks increased by 15 mg/L during the first 22 hours and did not change during the remaining 50 hours of the experiment. The association of accelerated precipitation of iron with solubilization of Mn2% suggests that the MnO2 oxidized Fe2% in a manner analogous to reaction K.
0
25
50
75
100
125
150
175
ALD Ditch Pond Wetland EffluentSampling Station
Fe &
Mg,
mg/
L
0
15
30
45
60
75
Mn,
mg/
L
Fe
Mg
Mn

29
0
10
20
30
40
50
60
0 20 40 60 80 100Time, h
Con
cent
ratio
n, m
g/L
MnFe (II)
A
0
10
20
30
40
50
60
0 20 40 60 80 100Time, h
Con
cent
ratio
n, m
g/L
MnFe (II)
B
Figure 6. Changes in the Concentrations of Ferrous Iron and Manganese in (A) the Absence of the
MnOOH and (B) the Presence of MnOOH
The data presented in Figure 5 and Figure 6 demonstrate important aspects of iron and manganese chemistry in passive treatment systems. Iron oxidizes and precipitates from alkaline

30
mine water much more rapidly than manganese. One reason for the differences in kinetics is that the oxidized manganese solids are not stable in the presence of Fe2%. Concentrations of ferrous iron must decrease to very low levels before Mn2% oxidation processes can result in a stable solid precipitate. In the absence of Fe2%, manganese removal is still a very slow process under laboratory conditions. Conditions in a wetland may either accelerate manganese removal reactions or promote mechanisms that are not simulated in simple laboratory experiments. However, both field and laboratory investigations indicate that, under aerobic conditions, the removal of manganese occurs at a much slower rate than the removal of iron.
Aluminum Aluminum has only one oxidation state in aquatic systems, +3. Oxidation and reduction
processes, which complicate iron and manganese chemistry, do not directly affect concentrations of dissolved aluminum. Instead, concentrations of aluminum in mine waters are primarily influenced by the solubility of Al(OH)3 (Hem 1985, Nordstrom and Ball 1986). At pH levels between 5 and 8, Al(OH)3 is insoluble, and concentrations of dissolved aluminum are usually less than 1 mg/L. At pH values less than 4, Al(OH)3 is highly soluble and concentrations much higher than 2 mg/L are possible. The amount of aluminum found in over 150 different mine drainage samples are show in Figure 7. No significant amounts of dissolved aluminum were found above a pH of 4.5, consistent with the expected behavior, based on solubility. The kinetics of hydrolysis do not appear to play a role.
0
200
400
600
800
1000
0 1 2 3 4 5 6 7 8
pH, s.u.
Al,
mg/
L
Figure 7. Dissolved Aluminum Concentration Versus pH in Coal Mine Discharges
The passage of mine water through highly oxidized or highly reduced environments has no effect on concentrations of aluminum unless the pH also changes. In those cases where the pH of mine water decreases (due to iron oxidation and hydrolysis), concentrations of aluminum can increase because of the dissolution of alumino-silicate clays by the acidic water. When

31
acidic mine water passes through anaerobic environments, the increased pH that can result from carbonate dissolution or microbial activity can cause the precipitation of Al(OH)3. In addition to Al(OH)3, aluminum hydroxysulfate minerals can form when the drainage contains aluminum and SO4
2- at pH levels greater than 4.3 (Nordstrom and Ball 1986). Robbins et al. (1996) found poorly crystalline aluminite [Al2(SO4)(OH)4 . 7H2O] in an
ALD in West Virginia.
Materials and Methods
Collection of Water Samples
Water samples were collected at passive treatment systems from their influent and effluent points, and, if applicable, between unit operations within the system. Raw and acidified (1 to 2 mL of concentrated HCl) water samples were collected in 125 to 250 mL plastic bottles at each sampling point. Acid was added to lower the pH to below 1.0. At sites where particulates were visible in water samples, an additional sample was collected that was filtered through a 0.2 µm membrane filter prior to acidification. Samples were refrigerated in the analytical laboratory at 4EC until analysis. Measurements of pH and temperature were made in the field with a calibrated portable pH/ISE meter. Alkalinity was measured in the field using a pH meter and an Orion Total Alkalinity Test Kit or a Hach Digital Titrator.
Analysis of Water Samples
Concentrations of iron, manganese, aluminum, calcium, magnesium, sodium, cobalt, nickel, and zinc were determined in the acidified samples using Inductively-Coupled Argon Plasma-Atomic Emission Spectroscopy (ICAP-AES) (Instrumentation Laboratory Plasma 100 model or TJA Polyscan 61E). The acidified samples were at times filtered through a 0.45 µm membrane filter to prevent clogging of the small diameter tubing in the system.
Ferrous iron concentrations were determined on acidified samples by the potassium dichromate method (Fales and Kenny 1940). Sulfate concentrations were determined by one of three methods: (1) reaction with barium chloride after first passing the raw sample through a cation exchange resin with Thorin used as the end-point indicator (Kleinmann et al. 1988), (2) ion chromatography, or (3) ICP-AES. The agreement among these methods was found to be very good (within ~2 percent).
Acidity was determined by adding H2O2, heating and titrating the solution with NaOH (American Public Health Assoc. 1985). An auto titrator was used to determine the inflection point in the titration curve (i.e., first derivative mode). Acidity and alkalinity are reported as mg/L CaCO3 equivalent.
For each set of samples for a particular site, a duplicate, standard, and spike were analyzed for quality control purposes. The relative standard deviation for duplicates were less than 5 percent. Recovery for the standards were within 3 percent of the original standard. Spike recoveries were within 5 percent of the expected values.
Flow Rate Measurements
Water flow rates were determined by one of three methods. Whenever possible, flow was determined by the time necessary to collect a known volume of water using a bucket and stopwatch. In all cases, three to five measurements were made at each sampling location, and the mean flow rate of these measurements was reported. Flows were also measured with

32
permanently installed calibrated flumes, and portable calibrated pipe weirs.
Analysis of Iron Sludge
A sample of iron sludge was collected at the Morrison II site. Sludge at this site was selected as a representative of iron sludge precipitated under alkaline conditions. Approximately 60 cm3 of sludge was collected with a spatula and allowed to “drip dry” for about 1 minute before placing it in a 125-mL plastic bottle. After transport back to the laboratory, it remained undisturbed for about 6 weeks. The supernatant liquid was then withdrawn by pipette from the top of the sludge (approximately 15 percent of the total volume). A graduated cylinder was filled with 8.0 mL of distilled, deionized water. Sludge was added to the water until it rose to the 10.0 mL level, thereby collecting 2.0 cm3 of sludge. The sludge/water mixture was transferred into a volumetric flask, and nitric and hydrochloric acid were added to totally dissolve the sludge. Distilled, deionized water was added, resulting in a final volume of 1.0 L. A portion of this solution was analyzed for metal content as outlined above. It was found that this sludge contained 0.17 grams of iron per cm3 of sludge. This is consistent with previous measurements of sludges precipitated from alkaline waters at other sites, and can be used to calculate how fast systems will fill with iron precipitates.
Removal of Contaminants by Passive Unit Operations
Aerobic Wetlands and Ponds
To make reliable evaluations of wetland performance, a measure should be used that allows comparison of contaminant removal between systems that vary in size and the chemical composition and the flow rate of mine water they receive. In the past, concentration efficiency (CE%) was a common measure of performance (Girts et al. 1987, Weider 1989). Using iron concentration as an example, the calculation was:
CE% = [(Fein - Feeff)/Fein] x 100 (7)
where the subscripts “in” and “eff” represented wetland influent and effluent sampling stations, and iron concentrations were in mg/L.
Except in carefully controlled environments, concentration efficiency is a very poor measure of wetland performance. The efficiency calculation results in the same measure of performance for a system that lowers iron concentrations from 300 mg/L to 100 mg/L as one that lowers concentrations from 3 mg/L to 1 mg/L. Neither the flow rate of the drainage nor the size of the treatment system is incorporated into the calculation. As a result, the performance of systems are compared without accounting for differences in flow rate (which vary from < 10 L/min to > 1,000 L/min), or for differences in system size (which vary from < 0.1 ha to > 10 ha) (Weider 1989).
A more appropriate method for measuring the performance of treatment systems calculates contaminant removal from a loading perspective. The daily load of contaminant received by a wetland is calculated from the product of concentration and flow rate data. For iron, the calculation of load in grams per day is:
Fein (g/d) = 1.44 x flow (L/min) x Fein (mg/L) (8)
where 1.44 is the unit conversion factor to convert minutes to days, and milligrams to grams. The daily mass of iron removed by the wetland between two sampling stations,

33
Fe(g/d)rem, is calculated by comparing contaminant loadings at the two points.
Ferem (g/d) = Fein (g/d) - Feeff (g/d) (9)
An area-adjusted daily iron removal rate is then calculated by dividing the load removed by the surface area of the treatment system lying between the sampling points.
Ferem (g d-1 m-2) = Ferem (g/d)/SA (m2) (10)
Using this area-adjusted removal rate as the measure of treatment performance, Hedin et al. (1994a) reported typical removal rates of 10 to 20 g d-1 m-2 for iron, and 0.5 to 1.0 g d-1 m-2 for manganese.
More recently, several groups have attempted to develop models that will more effectively estimate the performance of treatment systems, especially for iron removal. Watzlaf et al. (2001) were able to model a system consisting of an aerobic pond, an aeration cascade, and a wetland using only equations 3 and 6. They found that the overall performance and the performance of certain sections of the system fell within the 10 to 20 g d-1 m-2 range, but that some sections did not. The model indicated that the pH was limiting the rate of removal.
Kirby et al. (1999) used a combination of the abiotic rate expression (equation 3), the biological rate expression (equation 4), and the temperature dependence (equation 6) to model a set of 17 ponds. They found that the relative importance of the biotic and abiotic mechanisms was determined mainly by pH, with the abiotic path predominating at the higher pH values. They suggest that pH and temperature are the most important variables for determining iron oxidation rates, and therefore, iron removal rates. Little can be done to control temperature in a passive treatment. The Kirby et al. (1999) work suggests that increasing pH from 6.1 to 6.4, for example, greatly enhances oxidation, whereas doubling dissolved oxygen (as long as oxygen is sufficiently high stoichiometrically to oxidize metals), pond volume, or retention time has considerable less impact on oxidation rates.
Dempsey et al. (2001) modeled seasonal fluctuations of two systems using a combination of the homogeneous rate (equation 3) and the heterogeneous rate (equation 5). They found that oxygen transfer was rate limiting in one system, and that the amount of catalytic reaction provided by ferric hydroxides was the determining factor at the second site. While heterogeneous catalysis apparently plays a significant role in iron oxidation, it is difficult to increase concentrations of iron solids in a completely passive system. Such catalysis could be quite important in semi-passive or active treatment systems.
No one has yet tried a combination of all three rate expressions to apportion the relative importance of the three mechanisms at a given site, but such studies are undoubtedly underway. Because the three rate expressions contain different parameters (bacteria, ferric oxides) and have different dependencies on the pH, it should be possible, in principle, to differentiate among the three mechanisms.
It appears that the original estimate of Hedin et al. (1994a) of 10 to 20 g d-1 m-2 remains a convenient pre-construction rule-of-thumb for estimating pond and wetlands sizes. Studies undertaken since the publication of Hedin guidelines tend to support them in the majority of cases (Younger et al. 2002).
Anoxic Limestone Drains
All sites are located in western Pennsylvania, with the exception of the Elklick site, which is located in northwestern Maryland. Discharges are associated with Allegheny group

34
coals (mainly the Kittanning and Clarion seams) formed during the Pennsylvanian period.
Site Descriptions Howe Bridge 1 - Mine pool discharge, which occurs through an abandoned gas well, is
captured and piped to the ALD. Influent water is sampled via a well prior to contact with limestone. Four sampling wells are evenly spaced along the length of the drain.
Howe Bridge 2 - Mine pool discharge, which occurs through an abandoned gas well, is treated in an S-shaped ALD. Influent water is sampled via a well as the water flows into the beginning of the ALD. Two sampling wells are located along the length of the ALD.
Morrison - Seepage is intercepted at the toe of the spoil of a reclaimed surface mine. After the ALD was built, another seep, similar in quality to the pre-construction water, was discovered, and is being used to represent influent water quality. Two sampling wells are located along the length of the ALD.
Filson (R and L) - Seepage is intercepted at the toe of the spoil. A seep, located between the ALDs that is similar in quality to the pre-construction raw water, is used to represent influent water quality.
Elklick -Water from an abandoned borehole is collected in a bed (7.0 m x 1.8 m x 0.9 m) of crushed, low-pyrite sandstone at the head of the ALD. Influent water is sampled at a well located in this sandstone. Three sampling wells are equally spaced along the length of the ALD.
REM (R and L) and Schnepp - ALDs were constructed down slope from collapsed underground mine entrances. Influent water quality is based on historical data, which may overestimate contaminant levels, since water quality elsewhere in the watershed has improved significantly over the past decade.
Jennings - An abandoned underground mine discharge was collected in a French drain filled with inert river gravel and piped to the system. Influent water was sampled prior to contact with limestone via a sampling well. The ALD consisted of a series of 6 buried limestone cells. Water flowed into the bottom of each cell and exited through the top before being piped to the next cell.
Detention times (td) were calculated based on ALD volume (V) and average flow (Q), using td = 0.49V/Q. The porosity value was determined using containers of known volume filled with the limestone used in the ALDs. The amount of water it took to fill these limestone-filled containers to the top of the limestone was measured. An average value of 49 percent for porosity was obtained. To confirm these calculated detention times, tracer tests were conducted at two ALDs. The results of these tests are presented below. Additional details on the construction of each ALD are presented in Table 8.

35
Table 8. Dimensions, Stone Size and Quality, and Source of Influent Water Quality Data for ALDs
Limestone Influent Water Quality Data Source
ALD Site ALD Dimensions: Length x Width x Depth, meters
size, cm % CaCO3
Howe Bridge 1 36.6 6.1 1.2 5.1 - 7.6 82 Well
Howe Bridge 2 13.7 4.6 0.9 5.1 - 7.6 82 Well
Elklick 36.6 3.1 0.9 5.1 - 20.3 85 Well
Jennings1 228 1.0 1.0 15.2 90 Well
Morrison 45.7 0.9 0.9 5.1 - 7.6 92 Adjacent Seep
Filson - R 54.9 6.1 0.9 5.1 - 7.6 88 Adjacent Seep
Filson - L 54.9 6.1 0.9 5.1 - 7.6 88 Adjacent Seep
Schnepp 12.2 6.1 0.9 1.9 - 2.5 90 Historical
REM - R 13.7 7.6 0.9 7.6 82 Historical
REM - L 61.0 16.8 0.9 7.6 82 Historical
1 The Jennings ALD is composed of 6 sequential cells, each cell approximately 38 m x 1 m x 1 m.
Tracer Studies To obtain information about the flow characteristics within the ALDs, tracer studies were
undertaken at two of the sites. Known amounts of concentrated sodium bromide solutions were added to the influent flow. Samples were collected at the effluent after selected periodic intervals (1to 8 hrs) using automatic samplers. Bromide concentrations were measured using a specific ion electrode (in the field), and by ion chromatography (samples returned to lab) with suppressed conductivity detection using a standard anion column. In analyzing the tracer data, the effective (or mean) detention time (te) was calculated by te = Σ[(Ct t)∆t]/E(Ct ∆t), where Ct is the bromide concentration at time t, t is the time after tracer addition, and ∆t is the time between samples.
The concentration profile obtained at the Howe Bridge site is shown in Figure 8. The second experiment at the Morrison site, produced a similar profile. The profiles are asymmetrical with rapidly rising concentrations at shorter times and gradually dropping concentrations at longer times. Such profiles may be the result of a number of factors, such as diffusion, channeling, back-mixing, adsorption, and mobile phase saturation, acting simultaneously. In the case of ALDs, the first three factors presumably predominate.

36
5
10
15
20
25
30
Bro
mid
e C
once
ntra
tion
, mg/
L
0 25 50 75 100 125 150 175 200Time, hours
Figure 8. Bromide Concentration Versus Time in the Effluent of the Howe Bridge ALD 1 Resulting
from a Pulse Input of a Bromide Tracer
In Table 9, a number of descriptive statistics that can be used to characterize the flow are compared to the detention time calculated using the drain volume and the aforementioned 49 percent void volume. In both cases, the maximum concentration occurred fairly soon after the first appearance of the bromide in the effluent. The time required for 50 percent of the material to exit the drain—the median detention time—was considerably longer than the time to peak, and most closely matched the calculated detention time. The time-weighted average—(i.e, mean, or effective) —detention time was longer yet. Of these statistics, we consider the median detention time to be the better measure of performance for ALDs. The ratio of the median (50 percent eluted) to the mean (effective) detention time is less than one. This indicates that a disproportionate amount of material is eluting at times earlier than expected for an ideally behaving plug-flow system, and is interpreted as an indication of channeling (i.e., short-circuiting). In addition, concentrations of bromide above background levels continued to be measured in ALD effluent for several days after tracer addition, indicating that more material is eluting at times longer than would be ideally expected. This is taken as an indication that back-mixing or dead areas exist within the drain. Thus, the ALDs appear to provide both shorter and longer detention times than would be expected, based on simple plug-flow. Channeling is of concern because it leads to inefficiencies in calcite dissolution. The longer residence times of some of the mine water is not necessarily beneficial, because the concentration of alkalinity in this water does not increase significantly after 15 hours of contact with the limestone.

37
Table 9. Tracer Test Data for Two ALDs
ALD Howe Bridge 1 Morrison Time to first appearance, hrs 7 4
Time to peak, hrs 16 10
Time for 50% of tracer to elute, hrs 30 61
Effective detention time1, hrs 40 87
Calculated detention time2, hrs 25 47 1Effective detention time (te) calculated by te = Σ[(Ct t)∆t]/E(Ct ∆t), where Ct = bromide concentration at time t, t = time after tracer addition, and ∆t = time between samples. 2Calculated detention time (td), based on limestone volume (V) and average flow rates (Q) by td = 0.49V/Q, using 49% for porosity.
Limestone Dissolution and Alkalinity Production Tables 8 through 12 show data describing the 10 ALDs discussed in this report. These
ALDs intercept flows ranging from about 10 to about 100 L/min. When possible, ALDs were designed to provide a detention time of at least 15 hours. The importance of detention time is seen in Figure 9, where the amount of alkalinity in the effluent ALD water is plotted as a function of the time the water is in contact with the limestone (detention time). These data were obtained at four sites where sampling wells had been installed at regular intervals along the length of the ALD. The mine water increases in alkalinity as it travels through the ALD, until it approaches a maximum after about 15 to 20 hours of contact. As the shape of the plots in Figure 9 show, the ultimate level of alkalinity addition varies by ALD, but the rates at which the alkalinity level increases appear to be nearly first order with a half-life of about 5 hours. A minimum contact time of 15 hours ensures that at least 85 percent of the maximum achievable alkalinity is realized in the ALD.
The variation in the level of alkalinity addition cannot be attributed to the size of the limestone because it was the same for all four ALDs. There is a trend of increasing limestone dissolution with decreasing pH for the data presented; however, the final concentration of alkalinity produced in an ALD depends on factors other than just the pH of the water to be treated. An empirical test has been developed to estimate the alkalinity concentration that will be produced in an ALD using the actual mine water and limestone in collapsible containers (cubitainers) (Watzlaf and Hedin 1993). With this, we can determine limestone consumption rates, the quantity of limestone needed for a desired design life, and whether the ALD will make the mine water net alkaline.

38
0
50
100
150
200
250
300
0 10 20 30 40 50Time (hrs)
Alk
alin
ity G
ener
atio
n (m
g/L
as C
aCO 3
)
ElklickHowe Bridge 1Howe Bridge 2Morrison 1
Figure 9. Alkalinity Concentration as Mine Water Flows through Selected ALD
All of the ALDs successfully add alkalinity, increasing the effluent levels by 50 to 270 mg/L. (See Table 11.) The smallest increases, observed at REM-R and REM-L, are undoubtedly the result of short detention times (7 to 8 hours) afforded by these ALDs. (See Table 10.) At half of the sites, a single ALD was sufficient to convert net acidic to net alkaline drainage. In the other five cases, the acidity produced from iron concentrations in excess of 200 mg/L was greater than the amount of alkalinity generated in the ALD. The increases in the alkalinity measured between the inlet and outlet of each drain correlate with the increase in calcium concentration. The average molar ratio of the increases in calcium and alkalinity, as CaCO3, ((calcium out-calcium in)/(alkalinity out-alkalinity in)) was 1.02 for the seven cases for which all the data were available. This compares well with the expected ratio of 1.00. In general, ALDs receiving water low in aluminum and ferric iron concentrations, that have been designed with detention times greater than 15 hours have generated alkalinity at a consistent rate throughout their existence. (See Figure 10.) The effluent concentrations of alkalinity in the ALDs indicate consistent performance over the past ten years. The significantly higher alkalinity values for the last sample points for Filson R and L in Figure 10 were caused by very high detention times reflecting very low flows caused by the drought of 1999, which affected the entire state of Pennsylvania during that summer and into the fall. Detention times in these ALDs were increased by more than a factor of four during this low flow period. Flows at the other ALDs (Howe Bridge 1 and Elklick) shown in Figure 10 were not significantly affected by the drought. It is also of interest to note that no seasonal variation was observed for these ALDs, presumably because of the fairly narrow range of influent water temperatures, typical of groundwater, and relatively consistent flow rates.

39
0
100
200
300
400
Sep-91 Jan-93 Jun-94 Oct-95 Mar-97 Jul-98 Dec-99 Apr-01 Sep-02
Date
Alk
alin
ity, m
g/L
(as C
aCO 3
)
HB-1 HB-2 Filson-R Filson-L ElklickMorrison-1 Schnepp REM-R REM-L
Figure 10. Effluent Alkalinity Concentrations of Selected ALDs Over Time
The amount of calcium carbonate remaining in these ALDs was calculated using the difference between the influent and effluent net acidity loadings over the period of time the system has been in use. Based on the quantity of limestone remaining, and assuming that the volume of the drain collapses around the shrinking core of limestone (i.e., void volume remains at 49 percent), the current detention times were calculated. As would be expected, detention times become shorter as the limestone is consumed. However, most ALDs are still operating at near maximum efficiency because detention times remain in excess of 15 hours. As an estimate of expected longevity, when the ALD detention time is expected to fall to the 15-hour minimum, the year was calculated from a linear extrapolation of the average rate of limestone consumption to date (last column of Table 9). Over half of the ALDs are still expected to meet or exceed their design life of 30 years. Resource constraints at the site resulted in the undersized construction of three ALDs. The Jennings ALD is no longer in operation because of clogging failure, and is described in more detail below.
Water Quality Changes In addition to increases in calcium and alkalinity, changes in other effluent water quality
parameters (pH, sulfate, and metals) were observed. Influent and effluent water quality analyses for the ALDs are presented in Table 11 and Table 12. At four of the ALDs (Howe Bridge 1, Howe Bridge 2, Elklick, and Jennings), influent samples could be collected immediately before the water flowed into the ALD. At three of the ALDs (Morrison, Filson-R, and Filson-L), seeps in the immediate vicinity were sampled to represent influent water quality. The remaining three ALDs (REM-R, REM-L, and Schnepp), based influent water quality on historical data.

40
Table 10. Initial and Current Conditions of ALDs
ALD Site Year Built
Initial Conditions Avg. Flow
Current Conditions
Year when td = 15 hours
Limestone tonnes
td1
hrs L/min Limestone
tonnes td
1
hrs
Howe Bridge 1 1991 455 27 90.1 392 23 2024 Howe Bridge 2 1993 132 14 49.2 103 11 1993 Elklick 1994 165 25 35.8 147 22 2021 Jennings 1993 365 2 73.4 356 n/a n/a Morrison 1990 65 45 7.8 53 37 2035 Filson-R 1994 590 81 39.0 549 76 2100 Filson-L 1994 635 84 40.3 588 78 2086 Schnepp 1993 130 39 18.0 116 35 2047 REM-R 1992 125 6.0 112 92 4.4 n/a REM-L 1992 125 7.1 94.5 75 4.3 n/a
The term td represents detention time. 1 td based on limestone volume (V) and average flow (Q) using td = V/Q, assuming 49% porosity. n/a - not applicable
Table 11. Average Water Quality Before and After Contact with the Anoxic Limestone Drain
ALD Net Acidity,1 mg/L as CaCO3
Alkalinity, mg/L as CaCO3
Calcium, mg/L
pH, s.u. Sulfate mg/L
In Out In Out In Out In Out In Out
Howe Bridge 1 461 344 33.2 155 154 206 5.72 6.29 1294 1294 Howe Bridge 2 396 265 37.3 161 148 201 5.44 6.45 1171 1175 Elklick 54.1 -59.2 35.2 155 79.4 130 6.01 6.65 338 333 Jennings 280 -33.5 0 139 ND 201 3.23 6.16 633 620 Morrison2 382 55.3 28.4 280 113 222 5.18 6.33 1246 1039 Filson-R2 57.2 -154 48.1 300 69.6 186 5.61 6.41 411 427 Filson-L2 57.2 -168 48.1 323 69.6 175 5.61 6.52 411 401 Schnepp3 307 -22.7 0 165 69.2 199 3.28 6.16 980 768 REM-R3 1148 819 0 56 258 228 4.28 5.41 2825 2338 REM-L3 ND 256 ND 110 ND 202 ND 5.94 ND 1225
1 Negative net acidity values indicate net alkalinity. 2 AIn@ concentrations based on water quality of a nearby seep. 3 AIn@ concentrations based on historical water quality data of the untreated mine drainage prior to construction of the ALD. Numbers are not available for REM-L. ND = Not Determined.
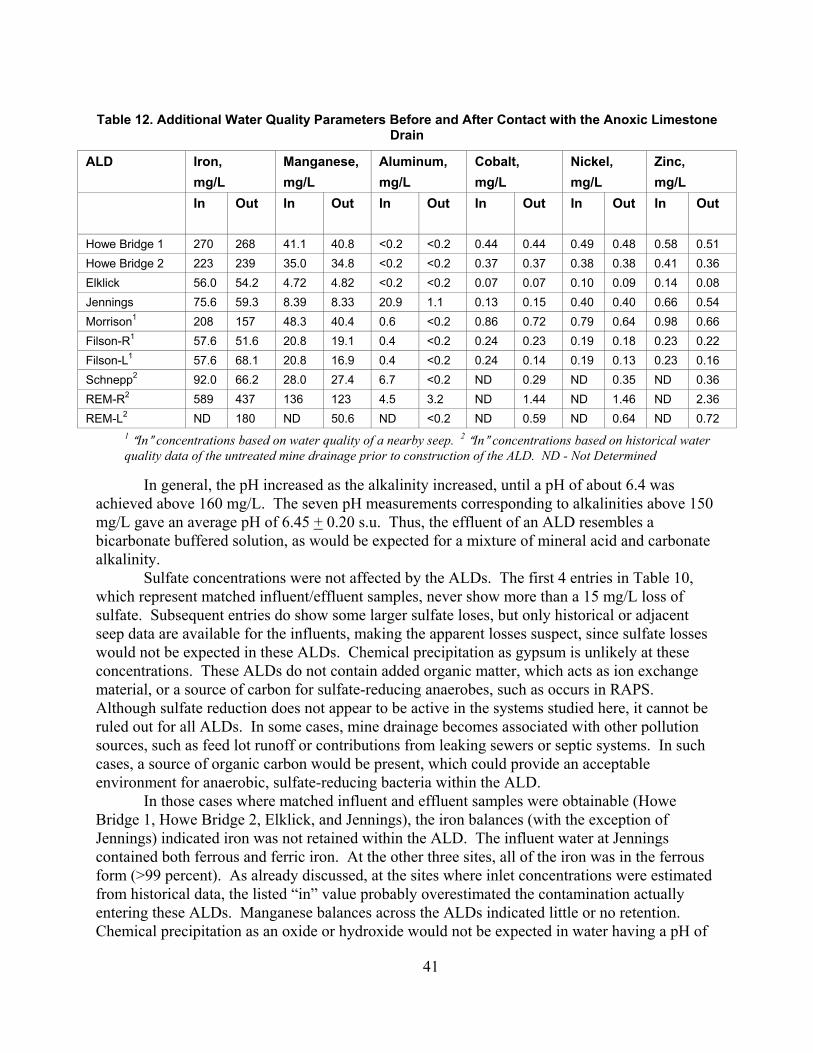
41
Table 12. Additional Water Quality Parameters Before and After Contact with the Anoxic Limestone Drain
ALD Iron, mg/L
Manganese, mg/L
Aluminum, mg/L
Cobalt, mg/L
Nickel, mg/L
Zinc, mg/L
In Out In Out In Out In Out In Out In Out
Howe Bridge 1 270 268 41.1 40.8 <0.2 <0.2 0.44 0.44 0.49 0.48 0.58 0.51 Howe Bridge 2 223 239 35.0 34.8 <0.2 <0.2 0.37 0.37 0.38 0.38 0.41 0.36 Elklick 56.0 54.2 4.72 4.82 <0.2 <0.2 0.07 0.07 0.10 0.09 0.14 0.08 Jennings 75.6 59.3 8.39 8.33 20.9 1.1 0.13 0.15 0.40 0.40 0.66 0.54 Morrison1 208 157 48.3 40.4 0.6 <0.2 0.86 0.72 0.79 0.64 0.98 0.66 Filson-R1 57.6 51.6 20.8 19.1 0.4 <0.2 0.24 0.23 0.19 0.18 0.23 0.22 Filson-L1 57.6 68.1 20.8 16.9 0.4 <0.2 0.24 0.14 0.19 0.13 0.23 0.16 Schnepp2 92.0 66.2 28.0 27.4 6.7 <0.2 ND 0.29 ND 0.35 ND 0.36 REM-R2 589 437 136 123 4.5 3.2 ND 1.44 ND 1.46 ND 2.36 REM-L2 ND 180 ND 50.6 ND <0.2 ND 0.59 ND 0.64 ND 0.72
1 AIn@ concentrations based on water quality of a nearby seep. 2 AIn@ concentrations based on historical water quality data of the untreated mine drainage prior to construction of the ALD. ND - Not Determined
In general, the pH increased as the alkalinity increased, until a pH of about 6.4 was achieved above 160 mg/L. The seven pH measurements corresponding to alkalinities above 150 mg/L gave an average pH of 6.45 + 0.20 s.u. Thus, the effluent of an ALD resembles a bicarbonate buffered solution, as would be expected for a mixture of mineral acid and carbonate alkalinity.
Sulfate concentrations were not affected by the ALDs. The first 4 entries in Table 10, which represent matched influent/effluent samples, never show more than a 15 mg/L loss of sulfate. Subsequent entries do show some larger sulfate loses, but only historical or adjacent seep data are available for the influents, making the apparent losses suspect, since sulfate losses would not be expected in these ALDs. Chemical precipitation as gypsum is unlikely at these concentrations. These ALDs do not contain added organic matter, which acts as ion exchange material, or a source of carbon for sulfate-reducing anaerobes, such as occurs in RAPS. Although sulfate reduction does not appear to be active in the systems studied here, it cannot be ruled out for all ALDs. In some cases, mine drainage becomes associated with other pollution sources, such as feed lot runoff or contributions from leaking sewers or septic systems. In such cases, a source of organic carbon would be present, which could provide an acceptable environment for anaerobic, sulfate-reducing bacteria within the ALD.
In those cases where matched influent and effluent samples were obtainable (Howe Bridge 1, Howe Bridge 2, Elklick, and Jennings), the iron balances (with the exception of Jennings) indicated iron was not retained within the ALD. The influent water at Jennings contained both ferrous and ferric iron. At the other three sites, all of the iron was in the ferrous form (>99 percent). As already discussed, at the sites where inlet concentrations were estimated from historical data, the listed “in” value probably overestimated the contamination actually entering these ALDs. Manganese balances across the ALDs indicated little or no retention. Chemical precipitation as an oxide or hydroxide would not be expected in water having a pH of

42
less than 7 under anoxic conditions. Although manganese carbonate precipitation is a possibility, there was no indication of this at the ALDs in this study.
Only water at three of the sites water contained aluminum in excess of 1 mg/L. The highest aluminum concentration was observed at the Jennings site (21 mg/L) and is most probably the reason for the premature failure of this ALD. The REM-R and Schnepp ALDs received 4.5 and 6.7 mg/L of aluminum (based on historical water quality). The REM-R ALD recently failed after 10 years of treatment, with no water emanating from the effluent pipe. All of the water is bypassing the ALD, presumably the result of a significant reduction in permeability. The Schnepp ALD has continued to operate since 1993. Because the actual influent water samples were unobtainable, the average aluminum concentrations at these two ALDs is uncertain, but is presumed at somewhat less than the original 5 to 7 mg/L. The untreated mine water quality at other sites in this watershed has shown a general and significant improvement over the past ten years. Therefore, using historical data for the influent water quality may bias the data toward the more contaminated water samples analyzed 10 or more years ago.
The concentrations of cobalt, nickel, and zinc were low in these waters and seldom exceeded 1.0 mg/L. Cobalt and nickel do not appear to be retained in the ALDs. The appearance of Zinc diminishes in all of the effluents, but only by 0.1 mg/L or less. Some removal of zinc at higher concentrations (ca. 5 to 10 mg/L) in ALDs has been reported by Nuttall and Younger (2000).
Premature Failure of Two ALDs
Jennings Construction of the ALD at the Jennings site was completed during April 1993.
Although the ALD successfully reduced the acidity of the mine water, the amount of flow passing through it began to decrease after 4 to 5 months, as a small leak developed near the beginning of the third ALD cell. The flow from this leak progressively increased until it accounted for more than 80 percent of the total flow after 9 months of operation.
Analysis of the water quality and flow data provided insight into the possible mechanisms of failure. Essentially 100 percent of the aluminum was retained within the ALD. Most of the ferric iron, which accounted for about 10 percent of the total iron in the mine water, was also retained in the ALD. Nearly 100 percent of these two species were retained with no loss in efficiency, even as the flow deceased towards the end of 1993. Both of these species form stable precipitates under the ambient conditions in the ALD, and are undoubtedly responsible for the decreasing permeability and eventual clogging of the drain. In addition to the constant removal of the two easily precipitated species, there is an initial retention of ferrous iron during the first few months of operation, probably due to oxygen scavenging by the ferrous species, adsorption on limestone surfaces or ion exchange on clay minerals in the limestone. During construction, the air in the drain contains oxygen, which is available for reaction if it is not flushed from the system prior to operation. Up to 40 percent of the iron retained in the drain may have resulted from the oxidation of ferrous iron and the subsequent precipitation of ferric hydroxide.
The total quantity of retained material was calculated at 581 kg of aluminum and 572 kg of iron. Thus, a combination of both iron and aluminum could be responsible for clogging the Jennings ALD. However, it might be argued that aluminum was more important for two reasons.

43
First, given the assumption that about 40 percent of the iron precipitate was caused by oxidation, and some of the remainder by adsorption processes, it probably occurred throughout the ALD, rather than in the one section, where the actual plug developed. Second, the portion of the ALD where the clog was suspected was excavated, revealing the formation of a white gelatinous substance, similar to aluminum precipitates seen elsewhere. Aluminum is thought to be the major cause of failure at this site. In the absence of reducing conditions, such as those generated in RAPS, the ferric iron in the influent may have also contributed to the problem.
REM Construction of the REM ALD was completed in 1992. The ALD produced an average
of 54 mg/L of alkalinity with its 6.8 hours of detention time. About 6 years after construction, water was noted leaking from the ALD. Effluent flow was significantly reduced after 9 years of operation, and the volume of leakage increased. In year 10, the effluent stopped flowing completely.
Only historical influent water quality exists for this site. Prior to construction of the ALD, the mine discharge contained 4.5 mg/L of aluminum. Throughout the 10 years of monitoring this ALD, aluminum floc was observed emanating from the effluent pipe. If the effluent pipe was blocked (by hand) for 30 to 60 seconds, a slug of aluminum precipitates would flow out of the effluent pipe. This indicates that aluminum solids were precipitating within the ALD and were most probably the cause of its eventual failure.
Compost Wetlands
Mine water containing Fe3+, aluminium, or dissolved oxygen (DO) concentrations greater than 1 mg/L has been treated with surface-flow compost wetlands. Compost wetlands generate alkalinity through a combination of bacterial activity and limestone dissolution. The desired sulfate-reducing bacteria requires a rich organic substrate which allow anoxic conditions to develop. Limestone dissolution also occurs readily within this anoxic environment. A substance commonly used in these wetlands is spent mushroom compost, a substrate that is readily available in western Pennsylvania. However, any well-composted equivalent should serve as a good bacterial substrate. Spent mushroom compost has a high CaCO3 content (about 10 percent dry weight), but mixing in more limestone may increase the alkalinity generated by CaCO3 dissolution. Compost substrates that do not have a high CaCO3 content should be supplemented with limestone. The compost depth used in most wetlands is 30 to 45 cm. Typically, a ton of compost will cover about 3.5 square yards about 45 cm thick. Cattails or other emergent vegetation are planted in the substrate to stabilize it, and to provide additional organic matter to “fuel” the sulfate reduction process. As a practical tip, cattail plant/rhizomes should be planted deep into the substrate prior to flooding the wetland cell.
Compost wetlands, in which much or most of the water flows over the surface of the compost, remove acidity (e.g., generate alkalinity) at rates of approximately 2 to 12 g d&1 m&2. This range in performance is largely a result of seasonal variation: acidity removal rates are lower in winter than in summer (Hedin et al., 1991). Hedin et al. (1994a) recommended sizing compost wetlands based on acidity removal rates of 3.5 to 7 g d&1 m&2. Since the beneficial reactions occur in the compost and limestone layers, and not in the surficially flowing water, these systems must be quite large. For the past 5 years or so, reducing and alkalinity-producing systems (RAPS) have been used to treat net acidic water containing ferric iron, aluminum, or DO concentrations greater than 1 mg/L, instead of compost wetlands. However, at sites with

44
sufficient land area and/or minimal elevation difference between the mine discharge and the stream, compost wetlands may be the most appropriate choice.
Reducing and Alkalinity-Producing Systems (RAPS)
RAPS is a generic term that describes the chemistry within a certain type of passive treatment. In addition to producing alkalinity via dissolving limestone, these systems promote reducing conditions by incorporating organic matter. The RAPS design directs water to flow down through organic matter into the limestone. The reducing conditions facilitate sulfate reduction, which generates alkalinity (reaction Y), and may also precipitate some metals to sulfides. Ferric iron can be reduced to ferrous iron, eliminating the precipitation of ferric hydroxide and subsequent clogging and armoring of the limestone.
2 CH2O = SO42- →H2S + 2 HCO3
- (Y)
This type of system was first implemented by Doug Kepler at the Howe Bridge site. These systems were termed successive alkalinity-producing systems (SAPS), indicating that more than one of these units could be used in series to treat very highly acidic water (Kepler and McCleary 1994). Similar systems have also been referred to as vertical flow systems, vertical flow ponds, or vertical flow wetlands. Chemically, biologically, and physically these systems behave similarly, and will be referred to as RAPS in this manual. A layer of limestone (0.6 to 1.2 m thick) is placed on the bottom of an excavated area. A network of perforated pipes is placed in the lower portion of this limestone layer. Organic material (0.15 to 0.61 m thick), which typically has been composted, is placed above the limestone, and serves as the nutrient source for the sulfate reducing bacteria. In Pennsylvania, spent mushroom compost has been the organic material of choice. It roughly consists of composted horse manure (56 percent by weight), hay (22 percent), straw (10 percent), chicken manure (10 percent), and gypsum (2 percent), but can differ between mushroom farms, since each uses its own recipe. Mine water flows down through the system, encountering reducing conditions within the compost before contacting the limestone. In the reducing environment, dissolved oxygen is removed, which prevents ferrous iron oxidation, and any ferric iron already present is reduced to the ferrous state. Thus, RAPS are appropriate for water containing ferric iron, which could armor the limestone in an ALD.
It is thought that RAPS may also be more resistant to plugging by aluminum than ALDs because of their larger cross sectional area and higher available head pressures (Watzlaf and Hyman 1995). The oldest RAPS in this study (Howe Bridge) treated water for 11 years before being replaced. After 11 years, it was still able to pass 50 percent of the influent water through the compost and limestone layers. This system received less that 0.2 mg/L of aluminum. It appeared that the progressive reduction in permeability was due to precipitation of iron hydroxides on top of the compost layer, with an accumulation of iron sludge in excess of 15 cm on top of the compost. Reduced permeability may also result from storm-mobilized silt and other solids, as well as precipitation of metal sulfides within the organic layer. Thus, continued monitoring of the actual performance of these systems is warranted.
In practice, RAPS, ALDs, settling ponds, and aerobic wetlands are used as unit operations in a total remediation system. For example, RAPS are usually preceded by a settling pond/wetland to settle iron and other solids, which could reduce permeability of the system. RAPS and ALDs are followed by settling ponds and aerobic wetlands for oxidation, precipitation, and settling of metals. After these ponds and wetlands, additional RAPS may be

45
used, each separated by a settling pond and wetland, to sequentially improve the water quality when sufficient alkalinity cannot be introduced in the initial ALD or RAPS.
Site Descriptions Howe Bridge - Water flows through a compost wetland (0.14 ha) prior to entering a
RAPS (0.14 ha). The RAPS contains a 0.4-m layer of limestone gravel covered by a 0.2-m layer of spent mushroom compost and about 1.5 m depth of water. Perforated drainage pipes (black plastic corrugated sewer pipe) are placed in a serpentine pattern in the bottom of the limestone layer. These pipes only cover about one-half of the total surface area of the system (~0.07 ha). Influent water is collected prior to the compost wetland.
Oven Run D (#1 and #2) - This system treats discharges from reclaimed surface and daylighted deep mines. Two RAPS are in series, each with a surface area of about 0.15 ha. Both contain a 0.91-m thick layer of limestone and a 0.15-m thick layer of compost covered by 1.5 m of water. a wetland precedes each RAPS with a surface area of 0.11 ha and a depth of 0.076 to 0.152 m of water. Influent water for each RAPS is sampled prior to the wetlands.
Oven Run E (#1 and #2) - Abandoned deep mine drainage is piped to two RAPS in a series. Each RAPS has a surface area of 0.26 ha, and the same thickness of limestone, compost and water as the Over Run D RAPS, outlined above. RAPS #1 is preceded by a 1.8-m deep pond (0.10 ha) and a wetland (0.12 ha). RAPS #2 is preceded by a pond (0.11 ha) and a wetland (0.11 ha).
Jennings - A system of perforated pipes was placed within a 0.31-m thick bed of inert river gravel, which was wrapped with a geotextile fabric. Above the gravel layer is a mixture of limestone and spent mushroom compost that is 0.8 m thick. This mixture consists of 270 tonnes of compost and 345 tonnes of limestone aggregate (9.5 mm x 1 mm (i.e., 3/8 in x 16 mesh)). Influent water is sampled prior to entering the RAPS (Jennings Water Quality Improvement Coalition 1999).
Results While alkalinity is produced solely by limestone dissolution in ALDs, it is produced by
both limestone dissolution and sulfate reduction in RAPS. Table 13 and Table 14 present the data obtained for six RAPS that have been monitored for up to 9 years. Shown in Table 13 are: (1) the alkalinity produced by limestone dissolution (based on increases in calcium, where a 1 mg/L increase stoichiometrically yields 2.497 mg/L of alkalinity as CaCO3); (2) the alkalinity produced by sulfate reduction (based on decreases in sulfate, where a 1 mg/L decrease stoichiometrically yields 1.042 mg/L of alkalinity as CaCO3); (3) the measured total alkalinity generated by the RAPS; and (4) the specific rate of generation of alkalinity calculated as grams per day, per square meter of surface area, measured at the top of the compost layer.
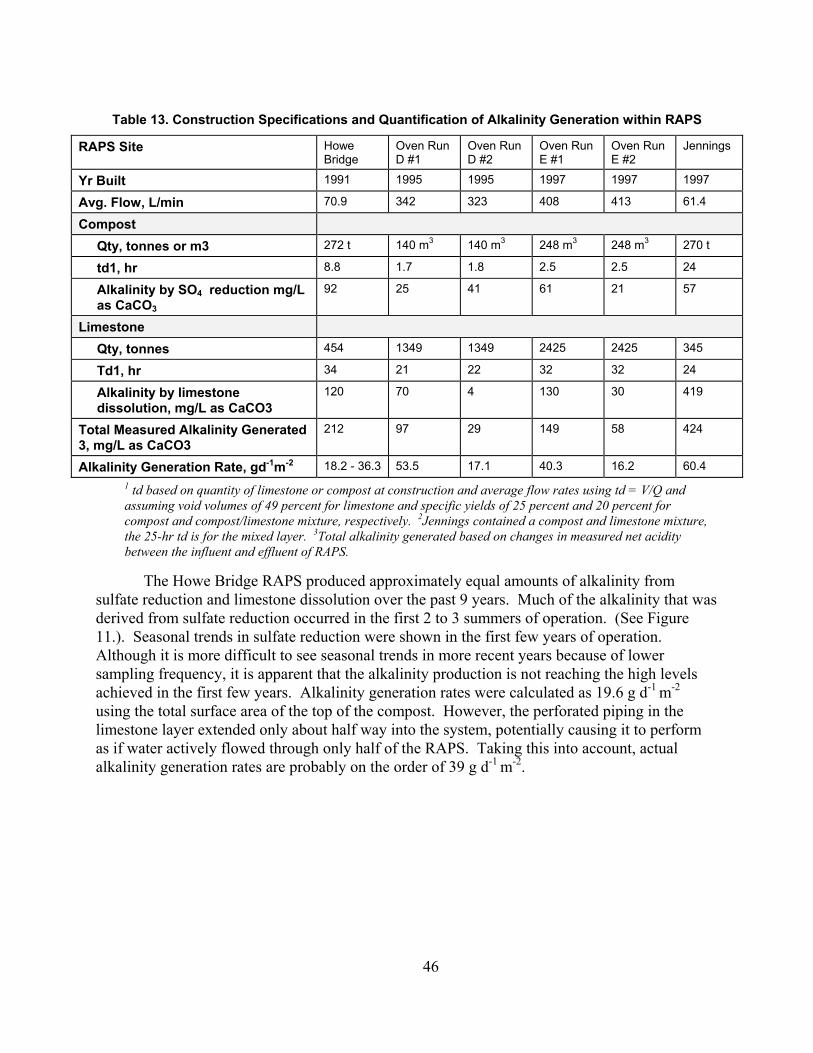
46
Table 13. Construction Specifications and Quantification of Alkalinity Generation within RAPS
RAPS Site Howe Bridge
Oven Run D #1
Oven Run D #2
Oven Run E #1
Oven Run E #2
Jennings
Yr Built 1991 1995 1995 1997 1997 1997
Avg. Flow, L/min 70.9 342 323 408 413 61.4
Compost Qty, tonnes or m3 272 t 140 m3 140 m3 248 m3 248 m3 270 t
td1, hr 8.8 1.7 1.8 2.5 2.5 24
Alkalinity by SO4 reduction mg/L as CaCO3
92 25 41 61 21 57
Limestone Qty, tonnes 454 1349 1349 2425 2425 345
Td1, hr 34 21 22 32 32 24
Alkalinity by limestone dissolution, mg/L as CaCO3
120 70 4 130 30 419
Total Measured Alkalinity Generated 3, mg/L as CaCO3
212 97 29 149 58 424
Alkalinity Generation Rate, gd-1m-2 18.2 - 36.3 53.5 17.1 40.3 16.2 60.4 1 td based on quantity of limestone or compost at construction and average flow rates using td = V/Q and assuming void volumes of 49 percent for limestone and specific yields of 25 percent and 20 percent for compost and compost/limestone mixture, respectively. 2Jennings contained a compost and limestone mixture, the 25-hr td is for the mixed layer. 3Total alkalinity generated based on changes in measured net acidity between the influent and effluent of RAPS.
The Howe Bridge RAPS produced approximately equal amounts of alkalinity from sulfate reduction and limestone dissolution over the past 9 years. Much of the alkalinity that was derived from sulfate reduction occurred in the first 2 to 3 summers of operation. (See Figure 11.). Seasonal trends in sulfate reduction were shown in the first few years of operation. Although it is more difficult to see seasonal trends in more recent years because of lower sampling frequency, it is apparent that the alkalinity production is not reaching the high levels achieved in the first few years. Alkalinity generation rates were calculated as 19.6 g d-1 m-2 using the total surface area of the top of the compost. However, the perforated piping in the limestone layer extended only about half way into the system, potentially causing it to perform as if water actively flowed through only half of the RAPS. Taking this into account, actual alkalinity generation rates are probably on the order of 39 g d-1 m-2.

47
0
100
200
300
400
500
Sep-91 Sep-92 Sep-93 Sep-94 Sep-95 Sep-96 Sep-97 Sep-98 Sep-99 Sep-00
Date
Alk
alin
ity, m
g/L
(as C
aCO 3
)
Sulfate ReductionLS DissolutionSum, SO4 + LSNet Acidity Change
Figure 11. Alkalinity Generation in the Howe Bridge RAPS
Alkalinity from sulfate reduction and limestone (LS) dissolution were calculated from differences in sulfate and calcium, respectively. The sum of these calculated alkalinities is also plotted with actual measured changes in net acidity.
Both Oven Run sites consist of two RAPS in series. The rationale for this was twofold: (1) one system could be put offline for maintenance and (2) during the design life of the two RAPS, the first system was expected to contribute more alkalinity during the first half, and the second system would contribute more alkalinity in the last half. At site D, the first RAPS produced alkalinity at a rate of 57.4 gd-1m-2, and the second at a rate of 20.6 gd-1m-2 over five years of operation. Similarly, at site E, the first RAPS produced alkalinity at a rate of 42.7 gd-
1m-2, and the second at a rate of 15.6 gd-1m-2, over three years of operation. It was difficult to determine any seasonal trends in the alkalinity production at either site because of the low sampling density and extremely variable flow rates at each site (a very wet period, followed by an extended drought period produced a greater than tenfold difference between high and low flows).
For the Jennings RAPS, the compost and limestone were mixed together instead of maintaining two distinct layers. This design was chosen because laboratory tests indicated that the water at Jennings was capable of depleting the calcium carbonate within a 0.7-meter thick layer of spent mushroom compost in about two years (Watzlaf 1997). After the calcium carbonate was depleted in the laboratory tests, sulfate reduction virtually ceased, presumably because of the lower pH environment. At this lower pH, fermentative bacteria, as well as sulfate-reducing bacteria may not be as active. The fermentative bacteria breaks down complex organics into simpler forms that the sulfate reducers can use. The rapid depletion of calcium carbonate was caused by the production of acidity during aluminum precipitation (an aluminum concentration of 23 mg/L will produce 128 mg/L of acidity upon hydrolysis). The Jennings RAPS produced the greatest change in net acidity of any of the systems, attributing over 90

48
percent of the alkalinity production to limestone dissolution. As discussed above, some (128 mg/L) of this change can be attributed to aluminum precipitation. This RAPS displayed no clear seasonal trends.
Table 14 shows changes in the major water quality parameters. The change in calcium and sulfate concentrations were used to estimate the contributions of limestone dissolution and sulfate reduction, respectively, as described above. Net acidity was determined using the peroxide oxidation method, and the change in net acidity between the inlet and outlet is listed as the total alkalinity generated in the second to last column in Table 13. Manganese, which is expected to be conserved in these systems, was present in the influent and effluent at about the same levels. Iron, and aluminum when present, were retained by the systems.
Table 14. Water Quality Before and After Contact with Reducing and Alkalinity Producing System
RAPS Howe Bridge
Oven Run D #1
Oven Run D #2
Oven Run E #1
Oven Run E #2
Jennings
In 314 99.8 6.38 212. 63.2 272 Net Acidity, mg/L as CaCO3 Out 102 2.56 -23.0 63.2 5.3 -152
In 31.3 1.5 N/A 0.0 9.4 0.0 Alkalinity, mg/L as CaCO3 Out 57.8 29.0 31.6 9.4 25.5 204
In 190 300 327 149 201 109 Calcium, mg/L Out 238 328 328 201 213 277
In 189 40.6 1.69 18.6 9.21 68.5 Iron, mg/L Out 72.1 3.41 0.47 9.21 3.93 14.7
In 37.0 28.2 27.3 12.1 11.9 18.6 Manganese, mg/L Out 35.7 27.4 22.0 11.9 11.3 17.6
In <0.2 1.45 1.21 16.4 9.40 24.1 Aluminum, mg/L Out <0.2 0.82 0.32 9.40 4.36 0.84
In 1186 1356 1340 932 873 799 Sulfate, mg/L Out 1098 1332 1301 873 853 744
The majority of these metals were presumably retained in the wetlands that precede the
RAPS, though significant levels of iron may have been removed on top of the compost in the RAPS. However, the Jennings site has no such wetland and retains 85 percent of the iron and all of the aluminum. In some cases, such as the Oven Run E sites, preventative maintenance is performed by periodic high-flow flushing, during which the RAPS pond level is lowered. The results of two flushes are reported below. Additional details of these and other flushes can be found in Watzlaf et al. (2002).
Case Study: Flushing the DeSale II RAPS The DeSale II site is located in Butler County, Pennsylvania within the headwaters of
Seaton Creek, a heavily impacted tributary in the Slippery Rock Creek Watershed. The system consists of an equalization pond, two RAPS, an oxidation pond, wetlands, and a horizontal limestone bed. Each RAPS is approximately 100 m long and 16 m wide and consists of (from the bottom up) 15 cm of limestone for pipe bedding (AASHTO #57), the lower discharge/flush
49
pipes, 60 cm of limestone (AASHTO #1 is approximately 10 cm, 90 percent calcium carbonate), the upper discharge/flush pipes, 60 cm of limestone (AASHTO #1), 15 cm of spent mushroom compost, and 75 to 90 cm of water. Networks of piping drain four quadrants at two different vertical levels (upper and lower) within the system. This more extensive underdrain system was developed in an attempt to optimize both the distribution of flow during normal operation, and the flushing of accumulated iron and aluminum solids. The underdrain was constructed of 10-cm diameter Schedule 40 PVC pipe. Perforated laterals were placed on 1.4-m centers and connected to an unperforated header with a sanitary-type tee. Perforations were hand-drilled with two, 1.3-cm perforations, which were offset approximately 30 o from the top of pipe. The perforation spacing was equal to the lateral spacing (1.4 m). Four separate header pipes were used for each underdrain level, thus dividing the surface area into approximately equal quadrants. The upper and lower underdrain levels effectively divide each RAPS into eight separate cells, four upper and four lower.
In the two years after its completion, the RAPS functioned very effectively, increasing pH from 3.1 to 6.9, adding 370 gm/L of alkalinity, and decreasing iron and aluminum concentrations from 27 to 5 mg/L, and 11 to 0.3 mg/L, respectively.
The right system was flushed nine months after it began treating water. Each of the eight pipes was flushed sequentially at full volume (660 to 1360 L/min per pipe) for nine minutes. A total of 69,700 L of water was removed (~ 4 percent of the total volume of water in the RAPS). Samples were collected at 15, 30, and 45 seconds, then at 30 second intervals from 1 to 5 minutes, and then at 1-minute intervals from 5 to minutes. Dissolved oxygen, temperature, and pH were monitored continuously and recorded at each sample interval. Flows were measured periodically (~ every 1 to 3 minutes) using three different methods: horizontal pipe discharge method, time volumetric method, and water level changes in RAPS. All three flow measurement techniques were in fairly good agreement (within ~ 15 percent). Samples were not filtered and consisted of an unacidified and acidified sample. Samples were analyzed in the laboratory for concentrations of standard and trace mine drainage metals and sulfate.
The left system was flushed after 14 months of treatment. Based on the results of the first flush, it was decided to flush the left system much more aggressively (i.e., to drain the system completely). The pipes draining the four upper quadrants were opened at the same time. After these pipes had drained for 11 hours, the flow had diminished to a trickle. After closing the valves to the upper pipes, the lower flush pipes were opened and drained for an additional 4.5 hours. Flows were measured periodically (every 10 to 20 minutes) using the horizontal pipe discharge method, which had compared favorably to the timed volumetric method and water level changes method during the previous flush. A total of 1,430,000 L of water was removed from the system. Unfiltered samples were collected from each pipe at 10 minute intervals. Temperature, pH and flow measurements were taken between sample collection.
The two RAPS at the De Sale II site are essentially equivalent. They were constructed in parallel, have the same dimensions, contain the same type and amount of media (limestone, compost, etc.) and receive water from a common source.
From available monitoring data, including flow measurements and water quality analyses, it was calculated that the right RAPS had accumulated 780 kg of iron and 312 kg of aluminum during the first nine months of operation. The basic criterion used during this flush was that the water should be allowed to flow until it ran clear. In practice, the flush was actually continued for some additional time. During the flush, a total of 69,700 L of water was removed. The maximum metal concentrations occurred in the first few minutes of flushing when the water

50
was visibly discolored. Both the visual observations and the lab analyses indicate that the initial slug of material was removed from the system within two minutes. After seven minutes of flushing, the iron and aluminum concentrations were the same as the concentration of dissolved metal, indicating that no solid material was eluting.
Integration of the concentration versus time graphs indicated that only 1.4 kg of iron (0.2 percent of the iron retained since construction) and 0.9 kg of aluminum (0.3 percent of the aluminum retained since construction) were flushed from the system. If one assumes that the water flowed into the pipe uniformly from every direction, the range of influence of this flush can be estimated from the pipe dimensions, the gallons flushed, and by assuming a limestone porosity of about 50 percent (Hedin and Watzlaf 1994). It is estimated that the last water through each pipe had been, on average, only 10 cm from the pipe before the flush began. Thus, it is doubtful that much, if any of the metal oxyhydroxide-laden water actually entered the pipes during this limited flush. Our conclusion is that “flushing until the water runs clear” is probably not a sufficient criterion for effective flushing.
The left RAPS was flushed 14 months after it began treating water. From available monitoring data, including flow measurements and water quality analyses, it was calculated that the RAPS had accumulated 948 kg of iron and 499 kg of aluminum during these first 14 months of operation. Because of the low amount of metals removed during the flushing of the right RAPS, the criterion used during this flush was that the water should be allowed to flow as long as possible (i.e., until the system was drained). In practice, the four pipes draining the upper quadrants were flushed until the flow slowed to a trickle, then the pipes draining the lower four quadrants were opened and allowed to flow until the system was totally drained. During the flush, a total of 1,430,000 L of water was removed. To a first approximation, the flows in both the upper and lower sections decrease going from quadrant 4 to quadrant 1. Qualitatively, this is consistent with the pressure drop expected because of the increasing length of 10 cm diameter pipe draining the quadrants. However, it would also be consistent with a clogging mechanism in which the settling of suspended material, such as clays, predominated in the quadrants closest to the RAPS inlet. The flows dropped slowly at first, and then more rapidly after the first 7 to 8 hours. At about 11 hours, the upper quadrants had drained and the valves to the lower quadrants were opened. Flows were higher and longer for the upper quadrants than for the lower quadrants,because these pipes drained, the standing water, the compost water, and the top limestone layer (total of 1.5 m of head), whereas the lower quadrant pipes drained only the bottom limestone layer (0.6 m of head).
The temperature and pH were monitored throughout the flush. The trends for both parameters were the same; both decreased as the cooler, more acidic surface water penetrated the lower strata faster than the chemical and thermal equilibration could occur. At about 7 hours the values began to climb toward their earlier levels. This was at the same point at which the flow sharply decreased (and residence time increased) indicating that the thermal and chemical equilibration rates were now becoming competitive with the flow rate. At a little over 8 hours (where the breaks in the upper quadrant trend lines occur), it was necessary to shut off the flow due to darkness. The next morning, the temperature and pH continued to increase further to near their initial values. The pH actually attained somewhat higher values, perhaps because of the overnight stoppage of flow during which extended contact with the limestone occurred.
The maximum metal concentrations occurred in the first few minutes and corresponded to visibly discolored water similar to what was seen for the right RAPS flush. In total, little additional material was removed from the system even after prolonged flushing. Of the retained
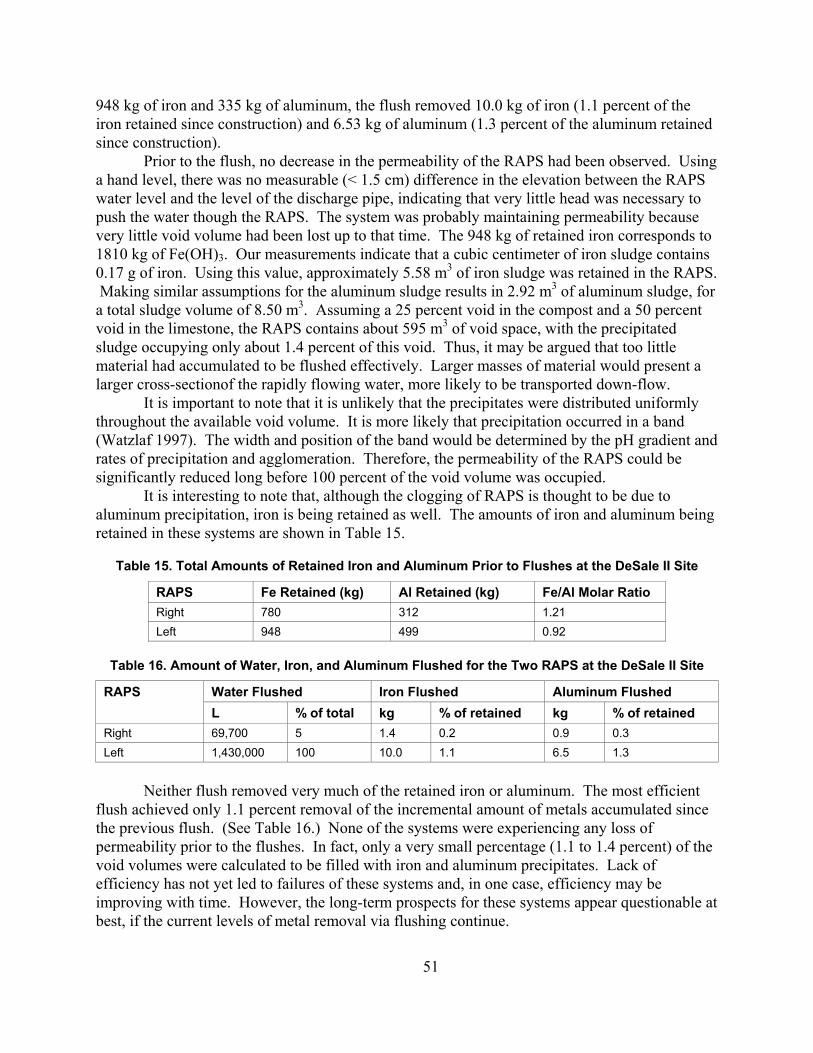
51
948 kg of iron and 335 kg of aluminum, the flush removed 10.0 kg of iron (1.1 percent of the iron retained since construction) and 6.53 kg of aluminum (1.3 percent of the aluminum retained since construction).
Prior to the flush, no decrease in the permeability of the RAPS had been observed. Using a hand level, there was no measurable (< 1.5 cm) difference in the elevation between the RAPS water level and the level of the discharge pipe, indicating that very little head was necessary to push the water though the RAPS. The system was probably maintaining permeability because very little void volume had been lost up to that time. The 948 kg of retained iron corresponds to 1810 kg of Fe(OH)3. Our measurements indicate that a cubic centimeter of iron sludge contains 0.17 g of iron. Using this value, approximately 5.58 m3 of iron sludge was retained in the RAPS. Making similar assumptions for the aluminum sludge results in 2.92 m3 of aluminum sludge, for a total sludge volume of 8.50 m3. Assuming a 25 percent void in the compost and a 50 percent void in the limestone, the RAPS contains about 595 m3 of void space, with the precipitated sludge occupying only about 1.4 percent of this void. Thus, it may be argued that too little material had accumulated to be flushed effectively. Larger masses of material would present a larger cross-sectionof the rapidly flowing water, more likely to be transported down-flow.
It is important to note that it is unlikely that the precipitates were distributed uniformly throughout the available void volume. It is more likely that precipitation occurred in a band (Watzlaf 1997). The width and position of the band would be determined by the pH gradient and rates of precipitation and agglomeration. Therefore, the permeability of the RAPS could be significantly reduced long before 100 percent of the void volume was occupied.
It is interesting to note that, although the clogging of RAPS is thought to be due to aluminum precipitation, iron is being retained as well. The amounts of iron and aluminum being retained in these systems are shown in Table 15.
Table 15. Total Amounts of Retained Iron and Aluminum Prior to Flushes at the DeSale II Site
RAPS Fe Retained (kg) Al Retained (kg) Fe/Al Molar Ratio Right 780 312 1.21 Left 948 499 0.92
Table 16. Amount of Water, Iron, and Aluminum Flushed for the Two RAPS at the DeSale II Site
Water Flushed Iron Flushed Aluminum Flushed RAPS L % of total kg % of retained kg % of retained
Right 69,700 5 1.4 0.2 0.9 0.3 Left 1,430,000 100 10.0 1.1 6.5 1.3
Neither flush removed very much of the retained iron or aluminum. The most efficient
flush achieved only 1.1 percent removal of the incremental amount of metals accumulated since the previous flush. (See Table 16.) None of the systems were experiencing any loss of permeability prior to the flushes. In fact, only a very small percentage (1.1 to 1.4 percent) of the void volumes were calculated to be filled with iron and aluminum precipitates. Lack of efficiency has not yet led to failures of these systems and, in one case, efficiency may be improving with time. However, the long-term prospects for these systems appear questionable at best, if the current levels of metal removal via flushing continue.
52
Other Types of Water Treatment Systems
There are several other types of systems treating coal mine drainage, ranging from purely passive, to semi-passive, to active. Table 17 lists many of these technologies with their electricity requirement, the presence of moving parts, the required frequency of minor and major maintenance, frequency of chemical addition, and estimated design life. Brief descriptions of some of the widely used systems are given below (including the systems already discussed in this paper). Further description and a listing of additional types of systems can be found elsewhere (USEPA 1983, Younger et al. 2002, Brown et al. 2002, EPA 1983, PIRAMID Consortium 2003).
Aerobic Wetlands — Effective for the treatment of net alkaline mine drainage, aerobic wetlands typically consist of an aeration structure (riprapped ditch, waterfall), a deep unvegetated pond (1.2 to 2.4 m deep) and a shallow wetland (~0.15 m deep) that usually contains cattails (typically Typha latifolia). The deeper ponds are designed to hold precipitated iron oxides, while the cattail wetland is used to remove remaining dissolved and suspended iron.
Anoxic Limestone Drains — Buried beds of limestone are designed to intercept mine water in an anoxic state and add bicarbonate alkalinity. The presence of aluminum and ferric iron will result in precipitation of these metal hydroxides within the ALD and could lead to premature failure by limiting the reactivity of limestone and/or clogging with these precipitates. Aerobic wetlands are used after these systems for the precipitation and collection of metal precipitates.
Compost (anaerobic) Wetlands — These systems typical contain limestone and composted organic matter in a vegetated substrate. Typical vegetation includes cattails. Most flow is surficial. Sulfate reduction and limestone dissolution occurs within these systems.
Limestone Beds — Beds of limestone that are exposed at the surface. Water level within the beds are below the exposed surface of the limestone. Water flows horizontally through these beds. They are designed for use after iron is removed from the water and are intended to remove manganese by encouraging conditions beneficial for biological manganese oxidation. Usually placed at the end of treatment systems, and can also add additional alkalinity (Rose et al. 2003).
Limestone Ponds — Constructed over upwellings of mine drainage; water flows upward through the limestone. Function similarly to ALDs. Generally used when water has low DO and contains low levels of aluminum and ferric iron.
Open Limestone Channels — Channel or ditch lined with limestone. Usually placed on a slope so the flowing water scours the limestone surface and voids to keep “clean”. This system takes into account that limestone may armor with ferric hydroxides, but relies on the premise that armored limestone will continue to dissolve at a slower rate. If a large settling pond is not used at the end of these systems, metal precipitates can enter and damage the watershed (Ziemkiewicz et al. 2003).
Diversion Wells — Cylindrical structures in which a split of a contaminated stream water flows upward through a bed of limestone at a velocity capable of fluidizing the bed. The agitation of the limestone functions to keep the surfaces from armoring. In addition, the limestone fines are generated and carried out of the system into the receiving stream, where they may continue to dissolve and add alkalinity; hence a length of the stream may be sacrificed for downstream improvement in water quality. This system must be filled with the proper size and amount of stone, or bed will collapse and lose effectiveness. Stone must be replenished every few days.

53
Limestone Sands — This technology utilizes several, large, strategically placed piles of fine limestone within streambeds of a contaminated watershed. Some alkalinity is added during base flow conditions. During storm flow conditions the limestone is transported throughout the watershed where it is incorporated in the stream sediments and dissolved to add alkalinity. Again, a length of the stream may be sacrificed for downstream improvement in water quality. The piles must be replaced at periodic intervals.
RAPS — A reducing and alkalinity producing system . consists of a layer of limestone overlain by a layer of composted organic matter. A drainage system is placed within the limestone layer to force the mine water to flow downward through the compost and limestone. The compost removes dissolved oxygen and reduces ferric iron to ferrous iron to minimize armoring of the limestone. Typically the design includes 2 m of head between the water surface in the RAPS, and the subsequent unit operation accounts for any loss of permeability. These systems are commonly flushed periodically in an attempt to remove precipitated metals and maintain permeability. RAPS are preceded with a pond to for allow precipitation of metals within the pond and not in the RAPS. Aerobic wetlands are used after these systems for the precipitation and collection of metal precipitates.
ReRAPS — Recirculating RAPS, in which alkaline water produced by the RAPS (see above) is mixed with the influent water in a pond to raise pH high enough to precipitate aluminum outside of the RAPS. This water is then pumped to the RAPS. System has been used to treat coal pile runoff where influent water flow is intermittent (Garrett et al. 2002).
Water-Powered Devices — These devices use available head pressure at the site to move some type of device (e.g., wheel, drum, tipping bucket) that meters out an alkaline material. Aerobic wetlands are used after these systems for the precipitation and collection of metal precipitates.
Windmills — These are typically used for aeration by using the power generated from the windmill to pump air through tubing into the mine water. They can also use power to meter out alkaline materials as in water-powered devices.
Sodium Carbonate Briquettes — Na2CO3 pressed into briquettes, commonly referred to as soda ash, are placed in a gravity dispenser (hopper) and allowed to dissolve in flowing mine water. Ponds are used after these systems for the precipitation and collection of metal precipitates.
Liquid Sodium Hydroxide — A 20 to 50 percent solution of NaOH, sometimes referred to as “caustic soda”, is stored in a large tank and gravity fed into the mine water. Ponds are used after these systems for the precipitation and collection of metal precipitates.
Hydrated Lime — Calcium hydroxide (Ca(OH)2), usually in powdered form, is added to mine water via a screw feeder. Ponds are used after these systems for the precipitation and collection of metal precipitates.
Quick Lime — Calcium oxide (CaO), requires water to make up slurry (called milk of lime) prior to adding to mine water. Ponds are used after these systems for the precipitation and collection of metal precipitates.

54
Table 17. Techniques Used for Treating Coal Mine Drainage
Maintenance Frequency
Technology Electricity Moving Parts
Minor Major
Frequency of Chemical Addition
Design Life (years)
Aerobic Wetlands Anoxic Limestone Drains Compost Wetlands Limestone Beds Limestone Ponds Open Limestone Channels
N
N monthly none anticipated
none 20 - 30
Diversion Wells N N weekly none weekly 20 - 30
Limestone Sands N N 6 months 6 months 6 months 6 months
RAPS N N monthly 6 months none 20 - 30
RERAPS Y Y monthly none none 20 - 30
Water-Powered Devices Windmills
N Y weekly weekly-yearly none - monthly 5 - 10
Sodium Carbonate Briquettes Liquid Sodium Hydroxide
N N daily weekly - monthly
daily - monthly 5 - 10
Hydrated Lime Quick Lime
Y Y daily weekly - monthly
daily - monthly 5 - 10
Designing Passive Treatment Systems
Characterizing Mine Drainage Discharges
In order to select the most effective passive treatment unit operations and to size them properly, the untreated mine water must be well characterized. The quality and quantity of some mine discharges are very consistent, while other discharges may vary by orders of magnitudes in both contaminant concentrations and flow. At an absolute minimum, water quality and quantity data should be collected during high and low flow periods. It is recommended that the discharge be monitored periodically (e.g., monthly) for a complete water year. It is best to select the monitoring dates in advance, and follow through on the monitoring regardless of weather. Both the flow rate and chemical composition of a discharge can vary seasonally and in response to storm events. If the passive treatment system is expected to operate during all weather conditions, then the discharge flow rates and water quality should be measured in different seasons and under representative weather conditions.
One of the most important measurements in sizing each passive unit is to obtain an accurate measurement of the total flow of the mine discharge(s) or seep(s). Water samples should be collected at the discharge or seepage point for chemical analysis, which should include pH, alkalinity, iron, manganese, aluminum, and hot acidity (H2O2 method) measurements. If an anoxic limestone drain is being considered, and the pH is less than 5, iron concentrations should be speciated into ferric and ferrous. At pH levels above 5, one can assume that all dissolved iron is in the ferrous form. The samples should be analyzed for other ions that are usually present in

55
significant concentrations in coal mine drainage: calcium, magnesium, potassium, sodium, cobalt, nickel, zinc, and sulfate. A cation/anion balance can be calculated to help verify the laboratory analyses (see Chemical Characteristics of Mine Drainage on page 12).
In addition, pH, alkalinity, and dissolved oxygen should be measured in the field. If the pH is greater than 4.5, a simple test for determining whether the water is net alkaline should be performed: after recording the pH of the water, collect a sample , and add hydrogen peroxide ; then stir or shake the sample and measure the pH again. If the pH drops below 4.5, the water is net acidic. If the pH remains above 4.5, the water is net alkaline. Very inexpensive hydrogen peroxide (3 percent solution), purchased at a pharmacy or grocery store, can be used. The amount of hydrogen peroxide added to the sample is not critical, 5 to 10 mL per 100 mL of sample is adequate.
Selecting Unit Operations
Water quality for a given discharge will determine the unit operations for designing the most effective passive treatment systema. Table 18 shows three major classifications of mine water quality. Each classification is appropriate for a particular unit operation. Examples of class I (net alkaline) discharges are Penn Allegh, Brinkerton, and Scrubgrass; examples of class II discharges are Elklick, Howe Bridge, and Morrison. (See Table 4.) Class III discharges are Jennings, Schnepp, and REM-R. (See Table 11 and Table 12.)
Table 18. Classification of Mine Discharges
Water Quality Parameter* Classification I II III pH > 4.5 - - H2O2 pH > 4.5 < 4.5 < 4.5 Net Acidity < 0 > 0 > 0 Ferric Iron - < 1 - Aluminum - < 1 - Dissolved Oxygen - < 1 - Appropriate Unit Operations
Aerobic Pondsand Wetlands
Anoxic Limestone Drains
Reducing and Alkalinity ProducingSystems
* pH in standard units, concentrations in mg/L, acidity in mg/L as CaCO3
Currently, there are several types of unit operations for the treatment of coal mine drainage; however, three of the most effective are aerobic ponds and wetlands, anoxic limestone drains, and reducing and alkalinity-producing systems. In aerobic ponds and wetlands, oxidation reactions occur and metals precipitate primarily as oxides and hydroxides. Most aerobic wetlands contain cattails that grow in a clay or spoil substrate. However, plantless systems (i.e., ponds) have also been constructed and function similarly to those that contain plants. It is recommended that net alkaline water be aerated to the maximum extent possible, conveyed to an aerobic pond and polished with an aerobic wetland.
The ALD is a buried bed of limestone intended to add alkalinity to the mine water. The limestone and mine water are kept anoxic so that dissolution can occur without ferric oxyhydroxides armoring the limestone. ALDs are only intended to generate alkalinity, and must be followed by an aerobic system in which metals are removed through oxidation and hydrolysis

56
reactions. A RAPS consists of layers of limestone and compost. The water flows down through the
compost to remove oxygen and to reduce ferric iron to ferrous iron. The limestone adds alkalinity. Most systems are designed to facilitate the periodic removal of aluminum and iron precipitates by flushing water through the system.
Each of these three passive technologies is appropriate for a particular type of mine water problem, but they are most effectively used in combination with each other. Figure 12 can be used to determine the selection and sequence of unit operations for an effective passive treatment system.
Figure 12. Selection of Passive Treatment Unit Operations

57
Sizing Passive Systems
The size of the passive treatment system depends on the loading rate of contaminants. Calculate contaminant (iron, manganese, acidity) loads by multiplying contaminant concentrations by the flow rate. If the concentrations are mg/L and flow rates are L/min, the calculation is:
Load (g/day) = Flow (L/min) x Concentration (mg/L) x 1.44 (g min/mg day) (11)
Aerobic Ponds and Wetlands Sizing criteria for abandoned mined land (AML) uses 20 g d&1 m&2 for iron, and 1.0 g d&1
m&2 for manganese. These are intended to cost-effectively decrease contaminant concentrations (Hedin et. Al. 1994a). In many situations at abandoned mined lands, the goal is to improve water quality, not consistently achieve a specific effluent concentration. The AML sizing criteria are based on measurements of contaminant removal by existing constructed wetlands. Most of the removal rates were measured for treatment systems (or parts of treatment systems) that did not consistently lower contaminants to federal effluent standards. In particular, the iron sizing factor for alkaline mine water (20 g d&1 m&2) is based on data from six sites, only one of which lowers iron concentrations to compliance.
It is possible that iron removal rates are a function of iron concentration (i.e., as concentrations decrease, the size of the system necessary to remove a unit of iron contamination (e.g., 1 g/d) increases). To account for this possibility, we have provided a more conservative sizing value for systems where the effluent must meet regulatory guidelines. (See Table 1.) We refer to these as “compliance criteria.” The sizing value for iron (10 g d&1 m&2) is in agreement with the findings of Stark et al. (1990) for a constructed compost wetland in Ohio that receives marginally acidic water. This rate is still larger, by a factor of 2, than the iron removal rate reported by Brodie et al. (1991) for aerobic systems in southern Appalachia that are regularly in compliance.
The manganese removal rate used for compliance (0.5 g d&1 m&2) is based on the performance of five treatment systems, three of which consistently lower manganese concentrations to compliance levels. A higher removal value (1 g d&1 m&2), is suggested for AML sites. Because the toxic effects of manganese at moderate concentrations (< 50 mg/L) are generally not significant, except in very soft water (Kleinmann and Watzlaf 1988), and the size of wetland necessary to treat water that contains manganese is so large, AML sites with iron problems should receive a higher priority than those with only manganese problems.
Net alkaline water contains enough alkalinity to buffer the acidity produced by metal hydrolysis reactions. The metal contaminants (iron and manganese) will precipitate, given enough time. The generation of additional alkalinity is unnecessary, so incorporation of limestone or an organic substrate into the passive treatment system is also unnecessary. The goal of the treatment system is to aerate the water and promote metal oxidation processes. In many existing treatment systems where the water is net alkaline, the removal of iron appears to be limited by dissolved oxygen concentrations and pH. Standard features that can aerate the drainage, such as waterfalls or riprap ditches, should be followed by quiescent areas. Aeration only provides enough dissolved oxygen to oxidize about 50 mg/L Fe2%. AML with higher concentrations of Fe2% may require a series of aeration structures and wetland basins. The wetland cells allow time for iron oxidation and hydrolysis to occur, and space in which the iron

58
floc can settle out of suspension. The entire system can be sized based on these iron removal rates. If manganese removal is desired, base the system’s size on manganese removal rates. Removal of iron and manganese occurs sequentially in passive systems; if both iron and manganese removal are necessary, add the two wetland sizes together.
Anoxic Limestone Drains (ALD) The primary chemical factor believed to limit the utility of an ALD is the presence of
ferric iron (Fe3%), aluminum (Al3%) and dissolved oxygen. When acidic water containing any Fe3% or Al3% contacts limestone, metal hydroxide particulates (FeOOH or Al(OH)3) will form. No oxygen is necessary. Ferric hydroxide will precipitate on and around limestone, limiting further dissolution. It has not been determined if precipitation of aluminum hydroxides limit limestone dissolution. The buildup of both precipitates within the ALD can eventually decrease the drain permeability and cause plugging. The presence of dissolved oxygen in mine water will promote the oxidation of ferrous iron to ferric iron, and the precipitation of solids that may limit limestone dissolution and reduce permeability in the ALD. While the short-term performance of ALDs that receive water containing elevated levels of Fe3%, Al3% or DO can be spectacular (total removal of the metals within the ALD) (Nairn et al. 1991), the long-term performance of these ALDs is not good. (See Premature Failure of Two ALDs on page 43.)
Mine water that contains very low concentrations of DO, Fe3% and Al (all < 1 mg/L) is ideally suited for pretreatment with an ALD. As concentrations of these parameters rise above 1 mg/L, the risk that the ALD will fail prematurely also increases. The length of time an ALD operates before failing is a function of these contaminant concentrations; the amount of initial void volume in the ALD, the cross-section of the ALD perpendicular to the flow, and the dissolution rates of limestone (creation of new void volume).
In some cases, the suitability of using an ALD to treat mine water can be evaluated by the type of discharge, and field measurements of pH. Net acidic mine waters that seep from spoils and flooded underground mines and have a field pH ofgreater than 5, characteristically have concentrations of DO, Fe3%, and Al that are all less than 1 mg/L. Such sites are generally excellent candidates for treatment with an ALD. Mine waters that discharge from open drift mines or have pH of less than 5 must be analyzed for Fe3% and Al. Mine waters with pH of greater than 5 can contain dissolved Al and Fe3%. In northern Appalachia, for example, most mine drainages with a pH of less than 3 contain significant concentrations of Fe3% and Al, rendering them inappropriate for treatment with an ALD.
The mass of limestone required to neutralize a certain discharge for a specified period of time (Mt) can be readily calculated from the mine water flow rate and assumptions about the alkalinity-generating performance of the ALD (equations 12 and 13). Research indicates that approximately 15 hours of contact time between mine water and limestone in an ALD is necessary to achieve a maximum concentration of alkalinity. In order to achieve 15 hours of contact time within an ALD, 2,800 kg of limestone is required for each L/min of mine water flow (equation 12). In equation 13, Mc represents the mass of limestone consumed over a period of time. For example, an ALD that discharges water with 300 mg/L of alkalinity (the maximum sustained concentration thus far observed in an ALD effluent), dissolves 1,750 kg of limestone (90 percent calcium carbonate) in ten years, per each L/min of mine water flow. Equations 12 and 13 must be summed to construct an ALD that contains sufficient limestone (90 percent calcium carbonate) to ensure a 15-hour retention time throughout a 20-year period. Therefore, a limestone bed should contain 6,200 kg of limestone for each L/min of flow, which is equivalent
59
to 26 tons of limestone for each gallon per minute of flow. The calculation assumes that the ALD is constructed with 90 percent CaCO3 limestone rock that has a porosity of 49 percent. The calculation also assumes that original mine water does not contain ferric iron or aluminum. The presence of these ions could result in faster rates of limestone dissolution through the generation of acidity during hydrolysis. More importantly, they have the potential to limit limestone dissolution and cause a significant reduction in permeability that could very well lead to failure (as previously discussed). For a more detailed discussion of limestone dissolution rates, see Cravotta and Watzlaf (2002).
Mt = (flow x bulk densityLS x td) / void ratio (12)
Mc = (flow x alkalinity concentration x design lifetime) / CaCO3 content (13)
There are still some concerns about the ability of ALDs to maintain unchanneled flow for a prolonged period of time, how much of the CaCO3 content of the limestone can be expected to dissolve, whether the ALDs will collapse after significant dissolution of the limestone, and whether inputs of DO that are not generally detectable with standard field equipment (0 to 1 mg/L) might eventually result in armoring the limestone with ferric hydroxides. However, the long-term effectiveness of several of the ALDs discussed here seems to indicate that the above calculations are valid.
The anoxic limestone drain is just one component of a passive treatment system. When an ALD operates ideally, its only effect on mine water chemistry is to raise (or keep) pH to (at) circumneutral levels, and increase concentrations of calcium and alkalinity. Dissolved Fe2% and manganese should be unaffected by flow through the ALD. The ALD must be followed by a settling basin or wetland system in which metal oxidation, hydrolysis and precipitation can occur. The type of post-ALD treatment system depends on the acidity of the mine water and the amount of alkalinity generated by the ALD. If the ALD generates enough alkalinity to transform the acid mine drainage to a net alkaline condition, then the ALD effluent can be treated with an aerobic pond and wetland. If possible, the water should be aerated as soon as it exits the ALD and directed into a settling pond. An aerobic wetland should follow the pond. The total post-ALD system should be sized according to the criteria provided earlier for net alkaline mine water. At this time, it appears that mine waters with acidity concentrations less than 150 mg/L are readily treated with an ALD and aerobic wetland system.
If the mine water is contaminated with only Fe2% and manganese, and the acidity exceeds 300 mg/L, it is unlikely that an ALD constructed using current practices will discharge net alkaline water. When this partially neutralized water is treated aerobically, the iron will precipitate rapidly, but the absence of sufficient buffering can result in a discharge with low pH. Building a second ALD to recharge the mine water with additional alkalinity after it flows out of the aerobic system is currently not feasible because of the high dissolved oxygen content of water flowing out of aerobic systems. If the treatment goal is to neutralize all of the acidity passively, then a RAPS should be built to generate additional alkalinity. Such a treatment system thus contains all three passive technologies. The mine water flows through an ALD, into an aerobic pond and wetland, and then into a RAPS, followed by another pond and wetland.
If the mine water is contaminated with ferric iron (Fe3%) or aluminum, higher concentrations of acidity can be treated with an ALD than when the water is contaminated with only Fe2% and manganese. This enhanced performance results from a decrease in mineral acidity due to the hydrolysis and precipitation of Fe3% and aluminum within the ALD. These metal-

60
removing reactions decrease the mineral acidity of the water. ALDs constructed to treat mine water contaminated with Fe3% and aluminum and having acidity greater than 1,000 mg/L have discharged net alkaline water. The long-term prognosis for these metal-retaining systems is not good. However, even if calculations of system longevity (as described above) are inaccurate for waters contaminated with Fe3% and aluminum, their treatment with an ALD maybe cost-effective in some instances, when compared to chemical alternatives (Skousen and Faulkner 1992).
When a mine water is contaminated with Fe2% and manganese and has an acidity between 150 mg/L and 300 mg/L, the ability of an ALD to discharge net alkaline water will depend on the concentration of alkalinity produced by the limestone system. The amount of alkalinity generated by a properly constructed and sized ALD depends on the chemical characteristics of the mine water. An experimental method has been developed that results in an accurate assessment of the amount of alkalinity being generated when a particular mine water contacts a particular limestone (Watzlaf and Hedin 1993). The method involves the anoxic incubation of the mine water in a container (cubitainer) filled with limestone gravel. This cubitainer test may be used in the design of passive systems, as outlined in Figure 12. The cubitainer test can determine if the ALD will impart sufficient alkalinity to allow for the ALD effluent to be treated with ponds and wetlands, or if the water needs additional treatment (RAPS) to add alkalinity. In experiments at two sites, the concentration of alkalinity that developed in these containers after 48 hours correlated very well with the concentrations of alkalinity measured in the ALD effluents.
Reducing and Alkalinity-Producing Systems (RAPS) Based on the results of this study, RAPS were found to remove 40 g d-1 m-2 of acidity for
the initial system, and 15 g d-1 m-2 for the second RAPS in series. It is important to note that these values were obtained from systems of similar construction, having compost layers about 0.2 m thick and limestone layers 0.4 to 0.9 m thick. If thinner layers were used, these surface area-based acidity removal rates may not be applicable. It is reasonable to expect that alkalinity production will be dependent on influent water quality. Jage et al. (2000) found that alkalinity production in RAPS significantly correlated with detention time, influent total iron concentrations, and non-manganese acidity concentrations. Rose and Dietz (2002) found positive correlations between alkalinity production and influent iron and hydrogen ion concentrations, and detention time in the compost. They also found acidity removal rates of 25 - 50 g d-1 m-2 for the 12 systems that they studied, and suggested using 25 g d-1 m-2 as a design criteria for RAPS. Thomas and Romanek (2002) found alkalinity generation rates averaged 88 gd-1m-2 in pilot scale studies using compost amended with fine-grained limestone (~1.2 mm). Based on these findings, it is probably prudent to use a sizing criteria of 25 - 30 g d-1 m-2 for the first RAPS in a series, and 15 g d-1 m-2 for a subsequent system. It is also recommended that the limestone layer contain enough limestone to theoretically retain the water for 15 hours throughout the design life of the system (6,200 kg of limestone per L/min of flow), the same sizing criteria used for an ALD.

61
Constructing Passive Systems
Aerobic Ponds/Wetlands A typical aerobic wetland is constructed by planting cattail rhizomes in soil or alkaline
spoil obtained onsite. Some systems have been planted simply by spreading cattail seeds, with good plant growth after two years. The depth of the water in a typical aerobic system is 10 to 50 cm. Ideally, a cell should not be of a uniform depth, but should include shallow and deep marsh areas and a few deep (1 to 2 m) spots. Note that common rooted aquatic vegetation cannot tolerate water depths greater than 50 cm, and require shallower depths for propagation.
Typically, a pond is situated before the wetland to remove a majority of the iron hydroxides. This pond is usually sized for an 8 to 24 hour retention time and is typically 1.5 to 2.5 m deep. To account for accumulations of iron, the value 0.17 g of iron per cm3 can be used so that the required detention time will be available for a predetermined time (i.e., its design life). It is recommended that the freeboard of aerobic wetlands/ponds be constructed at about 1 m for the removal of iron. Observations of sludge accumulation in existing wetlands suggest that a 1-m freeboard should be adequate to hold 20 to 25 years of FeOOH accumulation. We have achieved good success when the pond and wetland have similar surface areas. This allows for future removal of iron oxides from the pond without disturbing the vegetated wetland. Recently iron oxides have been characterized for potential recycling (e.g., as pigments) (Kairies et al. 2001, Hedin 2002).
Often, several wetland cells and/or ponds are connected by flow through a v-notch weir, lined railroad tie steps, or down a ditch. Use of multiple cell/ponds can limit the amount of short-circuiting, and aerates the water at each connection. If there are elevation differences between the cells, the interconnection design should dissipate kinetic energy to avoid erosion and/or the mobilization of precipitates. Spillways should be designed to pass the maximum probable flow. Spillways should consist of wide cuts in the dike with side slopes no steeper than 2H:1V, be lined with non-biodegradable erosion control fabric and a coarse riprap, if high flows are expected (Brodie 1991). Proper spillway design can preclude future maintenance costs associated with erosion and/or failed dikes. If pipes are used, small diameter (< 30 cm) pipes should be avoided, because they can plug with litter and FeOOH deposits. Pipes should be made of PVC, PE or coated for long-term stability. More details on the construction of aerobic wetland systems can be found in Hammer’s Creating Freshwater Wetlands, (1992) .
The floor of the wetland cell may be sloped up to a 3 percent grade. If a level cell floor is used, then the water level and flow are controlled by the downstream dam spillway and/or adjustable riser pipes.
As discussed previously, some of the aerobic systems that have been constructed to treat alkaline mine water have little emergent plant growth and are better termed ponds than wetlands. Metal removal rates in these plantless, aerobic systems appear to be similar to what is observed in aerobic systems that contain plants. However, plants may provide value not reflected in measurements of contaminant removal rates. For example, plants can facilitate the filtration of particulates, prevent flow channelization and provide wildlife benefits that are valued by regulatory and environmental groups.
ALDs In an ALD, alkalinity is produced when the acidic water contacts the limestone in an
anoxic, closed environment. Limestone with higher CaCO3 content (> 80 percent) has been

62
shown to dissolve faster than limestone with a higher MgCO3 or CaMg(CO3)2 content (~50 percent CaCO3) (Watzlaf and Hedin 1993). The limestone used in most successful ALDs have 80 to 95 percent CaCO3 content. Most effective systems have used 5- to 20-cm-sized limestone. Some systems constructed with fine and small gravel limestone have failed, apparently because of plugging problems. The ALD must be sealed so that the inputs of atmospheric oxygen are minimized, and the accumulation of carbon dioxide within the ALD is maximized. This is usually accomplished by burying the ALD under 1 to 3 m of clay. Plastic is sometimes placed between the limestone and clay as an additional gas barrier. In some cases, the ALD has been completely wrapped in plastic before burial (Skousen and Faulkner 1992). This can also help keep clay and dirt from getting into the pore volume from the bottom and sides of the excavation. The ALD should be designed to inundate the limestone with water at all times. Clay dikes within the ALD or riser pipes at the outflow of the ALD will help ensure inundation.
The dimensions of existing ALDs vary considerably. (See Table 7.) Narrower ALDs have the advantage of minimizing short-circuiting, but present a small cross-section perpendicular to the flow that may be more prone to clogging. Wider ALDs may be less likely to suffer significant permeability reductions (clogging) but may allow short circuiting to occur. In the end, however, site conditions will often dictate the dimensions of the ALD.
RAPS RAPS are commonly constructed with a 1-m thick layer of limestone. A network of
perforated pipes is placed in the bottom of this limestone layer. On top of the limestone, a layer of organic matter is placed that is typically 15 to 60 cm thick. Spent mushroom compost, which is readily available and affordable in and around Pennsylvania, is an often used organic material. Most spent mushroom compost consists of horse manure, hay, straw, chicken manure and gypsum. Mine water flows down through the system, encountering the reducing environment of the compost before contacting the limestone. The compost layer is intended to remove the dissolved oxygen and convert any ferric iron to the ferrous state to avoid armoring of the limestone. It is thought that RAPS may be less prone to aluminum plugging than ALDs because of their larger cross-section (perpendicular to flow paths) and higher available head pressures. The systems are generally constructed to allow for at least 2 m of head to be utilized, if needed, to overcome losses in permeability. Alkalinity generation rates for these systems range from 40 to 60 g per day per m2 of surface area for the first RAPS, and from 15 to 20 g per day per m2 of surface area for a second RAPS, when two RAPS are used in series (Watzlaf et al. 2000). Both iron and aluminum are removed within these systems. Most are periodically flushed to extend the life of these systems. No guidelines have yet been developed to guide the frequency, duration, or intensity of the flushes.
A pond should be used to oxidize, precipitate and settle iron before the water enters the RAPS to minimize the accumulation of iron precipitates (and other settleable solids) on top of the compost layer in the RAPS. This pond will also serve as an equalization basin. The size of this pond is site specific, but should be larger at sites where the pH of influent water is above 3.5. Once the pH drops below ~ 3.0, iron is removed much more slowly from mine drainage.
Operation and Maintenance
Operational problems with passive treatment systems can be attributed to inadequate design, unrealistic expectations, pests, inadequate construction methods, or natural problems. If properly designed and constructed, a passive treatment system can be operated with a minimum

63
amount of attention and money. Probably the most common maintenance problem is stability in the dike and spillway.
Reworking slopes, rebuilding spillways, and increasing freeboard can all be avoided by proper design and construction using existing guidelines for such construction.
Pests can plague wetlands with operational problems. Muskrats will burrow into dikes, causing leakage and potentially catastrophic failure problems, and can also uproot significant amounts of cattails and other aquatic vegetation. Muskrats can be discouraged by lining dikes and slopes with chain link fence or riprap to prevent burrowing (Brodie 1990). Beavers dams cause water level disruptions and can seriously damage vegetation. They are very difficult to control once established. Small diameter pipes traversing wide spillways (three-log structure) and trapping have had limited success in beaver control. Large pipes with 90-degree elbows on the upstream end have been used as discharge structures in beaver-prone areas (Brodie 1991). Otherwise, shallow ponds with dikes and shallow slopes toward wide, riprapped spillways may be the best design to deter beaver populations.
Insects, such as the armyworm, with their appetite for cattails, have devastated monocultural wetlands (Hedin, et al. 1994a). The use of various plants in a system will minimize such problems. Mosquitos can breed in wetlands where mine water is alkaline. In southern Appalachia, mosquito fish (Gambusia affinis) have been introduced into alkaline-water wetlands to control mosquito populations.
Conclusions Characterization of influent water quality and quantity, including seasonal variation, is
important prior to the selection and development of a passive treatment system (Hyman and Watzlaf 1995.). The presence or absence of periodic events, such as spring flushes of deposited metal salts from within the mine area, may influence the selection and sizing of passive systems.
Aerobic ponds and wetlands can be very effective for the removal of iron from net alkaline mine water. It appears that the original estimate of Hedin et al. (1994a) of 10 to 20 g d-1 m -2 remains a convenient pre-construction rule-of-thumb for estimating pond and wetlands sizes. Recent studies have provided insight into the factors that control the overall processes, and these approaches may be used to fine-tune sizing criteria. Modeling has concluded that aeration to sparge carbon dioxide and increase pH can significantly increase iron oxidation rates, thereby reducing the size of aerobic ponds and wetlands needed for iron removal.
ALDs can effectively treat net acidic mine water. The ideal influent water quality for an ALD is net acidic water with a pH above 5.0. At this pH, neither ferric iron nor aluminum are soluble in significant quantities. Intercepted ground water is typically low in dissolved oxygen, and often contains partial pressures of carbon dioxide higher than atmospheric levels, which allows for development of alkalinity concentrations greater than 100 mg/L as CaCO3. Near maximum levels of alkalinity (usually between 150 and 300 mg/L) can be achieved with 15 hours or more of contact time. ALDs are tolerant of both ferrous iron and manganese, because they remain soluble within the ALD. However, the presence of ferric iron, and particularly aluminum, can reduce permeability of the ALD by precipitation of these metals within the voids in the limestone. This has been documented in an ALD (Jennings) that received 21 mg/L of aluminum and clogged within eight months. In the absence of ferric iron and aluminum, ALDs have continued to perform well with no obvious seasonal variation or long-term reduction in effectiveness.

64
Tracer studies indicated that while ALDs approximate plug-flow systems, some short circuiting occurs, and dead areas do exist. Calculated detention times, using 49 percent porosity, were in fairly good agreement with the median detention times of the tracer tests.
Water quality data determine the applicability of an ALD and flow data provide the basis for sizing an effective ALD for the desired design life. At mine sites where the appropriate water quality criteria were met and the ALD was sized properly, effective treatment of mine drainage occurred, provided that the ALD was followed by ponds and/or wetlands for iron oxidation, precipitation, and settling. At these sites, it is projected that the ALD will be effective for the designed lifetime of 25 to 30 years and, in some cases, well beyond.
ALDs offer an effective means of introducing alkalinity into net acidic waters that contain neither ferric iron nor aluminum. The presence of either of these ions will reduce permeability of the ALD by precipitation, which will cause premature failure by clogging. In the absence of these ions, ALDs have continued to perform well with no obvious seasonal variation nor long-term degradation. Near maximum levels of alkalinity (usually between 150 and 300 mg/L) can be achieved with 15 hours or more of contact time. ALDs are tolerant of both ferrous iron and manganese. ALDs must be viewed as a unit operation, not a standalone remediation technique, and must be followed by a pond and wetland for iron oxidation, precipitation, and settling.
Alkaline addition in a RAPS is dominated by the limestone dissolution pathway. The acid neutralization potential afforded by a RAPS ranges from 35 to over 400 mg/L CaCO3. Sulfate reduction contributed an average of 28 percent (with a range of 5 to 51 percent) of the total alkalinity produced in the system. The rate of alkaline addition for a single RAPS is about 40 to 60 g d-1 m-2. Rates for the second RAPS in a series fall off to about 1/2 to 1/3 of the rate of the first system. Much of the variability in performance can be attributed to influent water quality and detention time. As with ALDs, RAPS should be viewed as unit operations, not stand-alone technologies. They must be preceded by a pond/wetland to precipitate iron and other settleable solids. As with ALDs, RAPS must also be followed by a pond and wetland for iron oxidation, precipitation, and settling.
Care should be taken to obtain sufficient water quality data of the target drainage, including seasonal variation, before desiging and developing a passive treatment system. Site and funding constraints may limit the applicability of passive techniques for some mine drainages. However, for those drainages with appropriate water quality and land availability, passive treatment systems continue to perform very well.

65
Abbreviations and Acronyms ALD anoxic limestone drain
AML abandoned mined land
AASHTO American Association of State Highway and Transportation Officials
atm atmosphere
Eh oxidation-reducing potential
Ha hectare
ICAP-AES inductively-coupled argon plasma –atomic emission spectroscopy
ISE ion selective electrode
L liter
L/min liters per minute
mL mililiter
mg/L miligram per liter
RAPS reducing and alkalinity-producing systems
SRB sulfate reducing bacteria
s.u. standard units
µm micrometer

66
References American Public Health Association. 1985. Standard Methods for the Examination of Water
and Wastewater. Washington, DC: American Public Health Association. 1,268 pp.
American Public Health Association. 1998. Standard Methods for the Examination of Water and Wastewater. Washington, DC: American Public Health Association. 1,162 pp.
Barnes, H. L. and S. B. Romberger. 1968. Chemical Aspects of Acid Mine Drainage. J. Water Pollution Control Federation. 40:370-384.
Batty, L. C. and P. L. Younger. 2002. Critical Role of Macrophytes in Achieving Low Iron Concentrations in Mine Water Treatment Wetlands. Envir. Sci. Technol. 36:3,997-4,002.
Beck, J. V. and D. G. Brown. 1968. Direct Sulfur Oxidation in the Solubilization of Sulfide Ores by Thiobaccillus Ferrooxidans. J. Bacteriology. 96:1,433-1,434.
Brodie, G. A., Britt, C. R., Tomaszewski, T. M., and H. N. Taylor. 1991. Use of Passive Anoxic Limestone Drains to Enhance Performance of Acid Drainage Treatment Wetlands. Proceedings of Reclamation 2000: Technologies for Success (Durango, CO). pp. 211-222.
Brodie, G. A. 1990. Treatment of Acid Drainage Using Constructed Wetlands: Experiences of the Tennessee Valley Authority. Proceedings of the 1990 National Symposium on Mining (Lexington, KY). pp. 77-83.
Brodie, G. A. 1991. Achieving Compliance with Staged Aerobic Constructed Wetlands to Treat Acid Drainage. Proceedings of the 1991 National Meeting of the American Society of Surface Mining and Reclamation (Princeton, WV). pp. 151-174.
Brown, M., Barley, B., and H. Wood. 2002. Minewater Treatment: Technology, Application and Policy. Dorchester, United Kingdom: IWA Publishing. 453 pp.
Butler, J. N. 1991. Carbon Dioxide Equilibria and Their Applications. Chelsea, MI: Lewis Publishers. 259 pp.
Cravotta, C. A. III and G. R. Watzlaf. 2002. Design and Performance of Limestone Drains to Increase pH and Remove Metals from Acidic Mine Drainage. In: Handbook of Groundwater Remediation Using Permeable Reactive Barriers.USA: Elsevier Science. pp. 19-66.
Davies, S. H. and J. J. Morgan. 1989. Manganese (II) Oxidation Kinetics on Metal Oxide Surfaces. J. Colloid and Interface Science. 129:63-77.
Dempsey, B. A., Roscoe, H. C., Ames, R., Hedin, R., and B.-H. Jeon. 2001. Ferrous Oxidation Chemistry in Passive Abiotic Systems for Treatment of Mine Drainage. Geochemistry: Exploration, Environment and Analysis. 1(1):81-88.
Diehl, D. and W. Stumm. 1984. Is Dissolved Mn2% Being Oxidized by O2 in Absence of Mn-Bacteria or Surface Catalysts. Geochemica et. Cosmochimica Acta. 48:1,571-1,573.
Dietz, J. M. and B. A. Dempsey. 2001. Treatment of Mine Drainage Ising Recirculated Iron Oxides in a Complete Mix Reactor. Proceedings of the 2001 Annual Conference of the National Association of Abandoned Mine Land Programs (Athens, Ohio). pp. 1-14.

67
Duncan, D., Landesman, J. and C. Walden. 1967. Role of Thiobaccillus Ferrooxidans in the Oxidation of Sulfide Minerals. Canadian J. Microbiology. 13:377-403.
Ehrlich, H. L. Geomicrobiology. New York: Dekker. 1981, 393 pp.
Fales, H. A. and F. Kenny. 1940. Inorganic Quantitative Analysis. New York: D. Appleton Century Co. 713 pp.
Garrett, W. E., A. A. Bartolucci, Pitt, R. R. and M. E. Vermace. 2002. Recirculating – Reducing and Alkalinity Producing System (RERAPS) for the Treatment of Acidic Coal Pile Runoff. Proceedings of the 2002 National Meeting of the American Society of Mining and Reclamation (Lexington, KY). pp. 539 - 557.
Gerber, D. W., Burris, J. E. and R. W. Stone. 1985. Removal of Dissolved Iron and Manganese Ions from Water by a Sphagnum Moss System. Proceedings of Wetlands and Water Management on Mined Lands (University Park, PA). pp. 365-372.
Girts, M. A., Kleinmann, R. L. P. and P. M. Erickson. 1987. Performance Data on Typha and Sphagnum Wetlands Constructed to Treat Coal Mine Drainage. Proceedings of the 8th Annual Surface Mine Drainage Task Force Symposium (Morgantown, WV).
Groudev, S. 1979. Mechanism of Bacterial Oxidation of Pyrite. Mikrobiologija. (16)75-87.
Hammack, R. W., Dvorak, D. H. and H. M. Edenborn. 1993. The Use of Biogenic Hydrogen Sulfide to Selectively Recover Metals from a Severely Contaminated Mine Drainage. In: Proceedings of the International Biohydrometallurgy Symposium (Jackson Hole, WY).
Hammer, D. A. 1992. Creating Freshwater Wetlands. Boca Raton, FL: Lewis Publishers. 298 pp.
Hedin, R. S., Hyman, D. M. and R. W. Hammack. 1988. Implications of Sulfate Reduction and Pyrite Formation Processes for Water Quality in a Constructed Wetland: Preliminary Observations. U.S. Bureau of Mines IC 9183. pp. 382-388.
Hedin, R. S., Dvorak, D. H., Gustafson, S. L., Hyman, D. M., McIntire, P. E., Nairn, R. W., Neupert, R. C., Woods, A. C., and H. M. Edenborn. 1991. Use of a Constructed Wetland for the Treatment of Acid Mine Drainage at the Friendship Hill National Historic Site, Fayette County, PA. Interagency Agreement #4000-5-0010. 128 pp.
Hedin, R. S., Nairn, R. W. and R. L. P. Kleinmann. 1994a. Passive Treatment of Coal Mine Drainage. U.S. Bureau of Mines IC 9389. 35 pp.
Hedin, R. S. and G. R. Watzlaf. 1994. The Effects of Anoxic Drains on Mine Water Chemistry. Proceedings of the International Land Reclamation and Mine Drainage Conference and the Third International Conference of the Abatement of Acidic Drainage, Volume 1 (Pittsburgh, PA). U.S. Bureau of Mines Special Publication SP 06B-94. pp. 185-194.
Hedin, R. S., Watzlaf, G. R. and R. W. Nairn. 1994. Passive Treatment of Acid Mine Drainage with Limestone. J. Environmental Quality. 23(6):1,338-1,345.
Hedin, R.S. 2002. Recovery of Marketable Iron Oxide from Mine Drainage. Proceedings of the 2002 National Meeting of the American Society of Mining and Reclamation (Lexington, KY). pp. 517 – 526.

68
Hem, J. D. 1985. Study and Interpretation of the Chemical Characteristics of Natural Water, 3rd Edition. U.S. Geological Survey Water Supply Paper 2254. 263 pp.
Huntsman, B. E., Solch, J. G. and M. D. Porter. 1978. Utilization of Sphagnum Species Dominated Bog for Coal Acid Mine Drainage Abatement. Abstracts from the Geological Society of America 91st Annual Meeting (Toronto, Ontario, Canada). p. 322.
Huntsman, B. E., Kleinmann, R. L. P. and T. O. Tiernan. 1985. Hydrologic and Geochemical Considerations in Maintaining Man-Made Wetlands Constructed for Acid Mine Drainage Abatement. Presented at Wetlands and Water Management on Mined Lands (Penn State University, University Park, PA).
Hyman, D. M. and Watzlaf. 1995. Mine Drainage Characterization for the Successful Design and Evaluation of Passive Treatment Systems. Proceedings of the 17th Annual Association of Abandoned Mine Lands Conference. (French Lick, IN). pp. 170-185.
Jage, C. R., Zipper, C. E., and A. C. Hendricks. 2000. Factors Affecting Performance of Successive Alkalinity-Producing Systems. Proceedings of the 2000 National Meeting of the American Society of Surface Mining and Reclamation (Tampa, FL). pp. 451-458.
Jennings Water Quality Improvement Coalition. 1999. Passive Treatment of Acid Mine Drainage, Vertical Flow System. Final Report for Project 18 of US EPA FY96 Section 319 Grant.
Kairies, C. L., Watzlaf, G. R., Hedin, R. S., and R. C. Capo. 2001. Characterization and Resource Recovery Potential of Precipitates Associated with Abandoned Coal Mine Drainage. Proceedings of the 2001 National Meeting of the American Society for Surface Mining and Reclamation (Albuquerque, NM). pp. 278-279.
Kepler, D. A. and E. C. McCleary. 1994. Successive Alkalinity-Producing Systems (SAPS) for the Treatment of Acid Mine Drainage. Proceedings of the International Land Reclamation and Mine Drainage Conference and the Third International Conference of the Abatement of Acidic Drainage, Volume 1 (Pittsburgh, PA). U.S. Bureau of Mines Special Publication SP 06B-94. pp. 195-204.
Kepler, D. A. 1995. Successive Alkalinity-Producing Systems (SAPS). Proceedings of the West Virginia Surface Mine Drainage Task Force Symposium (Morgantown, WV).
Kepler, D. A. and E. C. McCleary. 1997. Passive Aluminum Treatment Successes. Proceedings of the West Virginia Surface Mine Drainage Task Force Symposium (Morgantown, WV).
Kirby, C. S., and J. A. Elder Brady. 1998. Field Determination of Fe2+ Oxidation Rates in Acid Mine Drainage Using a Continuously Stirred Tank Reactor. Applied Geochemistry. 13:509-520.
Kirby, C. S., H. M. Thomas, G. Southman and R., Donald. 1999. Relative Contributions of Abiotic and Biological Factors in Fe(II) Oxidation in Mine Drainage. Applied Geochemistry. 14:511-530.
Kirby, C. S. 2002. Problems in acidity and alkalinity measurements in mine drainage. Proceedings of the 2002 National Meeting of the American Society of Mining and Reclamation. (Lexington, KY), pp. 1068 - 1071.

69
Kleinmann, R. L. P. 1979. The Biogeochemistry of Acid Mine Drainage and a Method to Control Acid Formation. PhD Thesis, Princeton University. 104 pp
Kleinmann, R. L. P. 1985. Treatment of Acidic Mine Water by Wetlands. U.S. Bureau of Mines IC 9027. pp. 48-52.
Kleinmann, R. L. P., Crerar, D. A., and R. R. Pacelli. 1981. Biochemistry of Acid Mine Drainage and a Method to Control Acid Formation. Mining Engineering. 33:300-306.
Kleinmann, R. L. P. and G. R. Watzlaf. 1988. Should the Effluent Limits for Manganese be Modified? In: Proceedings of the Mine Drainage and Surface Mine Reclamation Conference, Volume II: Mine Reclamation, Abandoned Mine Lands and Policy Issues (Pittsburgh, PA). U.S. Bureau of Mines IC 9184. pp. 305-310.
Kleinmann, R. L. P., Jones, J. R. and P. M. Erickson. 1988. An Assessment of the Coal Mine Drainage Problem. Proceedings of the 10th Annual Conference of the Association of Abandoned Mine Land Programs (Wilkes-Barre, PA). pp. 1-9.
Kleinmann, R. L. P., Tiernan, T. O., Solch, J. G. and R. L. Harris. 1983. A Low-Cost, Low-Maintenance Treatment System for Acid Mine Drainage Ising Sphagnum Moss and Limestone. Proceedings of the 1983 Symposium on Surface Mining, Hydrology, Sedimentology and Reclamation (University of Kentucky, Lexington, KY). pp. 241-245.
Luther, G. W. III. 1987. Pyrite Oxidation and Reduction: Molecular Orbital Theory Considerations. Geochemica et Cosmochimica Acta. 53:3,193-3,200.
McIntire, P. E. and H. M. Edenborn. 1990. The Use of Bacterial Sulfate Reduction in the Treatment of Drainage from Coal Mines. Proceedings of the 1990 Mining and Reclamation Conference and Exhibition (West Virginia University, Morgantown, WV). pp. 409-415.
McKnight, D. M., B. A. Kimbell and R. L. Runkel. 2001. pH Dependence of Iron Photoreduction in a Rocky Mountain Stream Affected by Acid Mine Drainage. Hydrological Processes. 15:1,979-1,992.
Nairn, R. W., Hedin, R. S. and G. R. Watzlaf. 1992. Generation of Alkalinity in an Anoxic Limestone Drain. Achieving Land Use Potential Through Reclamation. (Proc. Conf. of the 9th National American Society for Surface Mining and Reclamation Meeting, Princeton, WV). pp. 206-219.
Nairn, R. W., Hedin, R. S. and G. R. Watzlaf. 1991. A Preliminary Review of the Use of Anoxic Limestone Drains in the Passive Treatment of Acid Mine Drainage. Proceedings of the 12th Annual West Virginia Surface Mine Drainage Task Force Symposium (Morgantown, WV).
Nawrot, J. 1990. Mine Drainage Treatment through Enhanced Biological Sulfate Reduction within Wetlands. Proceedings of the 1990 Mining and Reclamation Conference and Exhibition. Vol. II. pp. 353-364.
Nealson, K. H. 1983a. The Microbial Iron Cycle. Microbial Geochemistry, W. E. Krumbein, Ed. Boston, MA: Blackwell Scientific. , pp. 159-190.
Nealson, K H. 1983b. The Microbial Manganese Cycle. Microbial Geochemistry. W. E. Krumbein, Ed. Boston, MA: Blackwell Scientific. pp. 159-190.

70
Nordstrom, D. K. and J. W. Ball. 1986. The Geochemical Behavior of Aluminum in Acidified Surface Waters. Science. 232:54-56.
Nuttall, C. A, and P. L. Younger. 2000. Zinc Removal from Hard, Circum-Neutral Mine Waters Using a Novel Closed-Bed Limestone Reactor. Water Research. 34:1,262-1,268.
PIRAMID Consortium. 2003. Engineering Guidelines for the Passive Remediation of Acidic and/or Metalliferous Mine Drainage and Similar Wastewaters. Report European Commission 5th Framework RTD Project No. EVK1-CT-1999-000021. University of Newcastle Upon Tyne, Newcastle Upon Tyne UK. 166 pp.
Postgate, J. R. 1984. The Sulphate-Reducing Bacteria. 2nd d. NY: Cambridge University Press. 208 pp.
Robbins E.I., Nord, G. L. Jr., Savela, C. E., Eddy, J. L., Livi, K. J., Gullett, C. D., Nordstrom, D. K., Chou, I. M. and K. M. Briggs. 1996. Microbial and Mineralogical Analysis of Aluminum-Rich Precipitates that Occlude Porosity in a Failed Anoxic Limestone Drain, Monongalia County, West Virginia. Proceedings of the 13th Annual International Pittsburgh Coal Conf, Volume 2. (Pittsburgh, PA). p. 761-765
Rose, A. W. and J. M. Dietz. 2002. Case Studies of Passive Treatment Systems: Vertical Flow Systems. Proceedings of the 2002 National Meeting of the American Society of Mining and Reclamation (Lexington, KY). pp. 776-797.
Rose, A. W., P. J. Shah and B. Means. 2003. Case Studies of Limestone-Bed Passive Systems for Manganese Removal from Acid Mine Drainage. Proceedings of the 2003 National Meeting of the American Society for Mining and Reclamation (Billings, MT). pp. 1,059-1,078.
Sencindiver, J. C. and D. K. Bhumbla. 1988. Effects of Cattails (Typha) on Metal Removal from Mine Drainage. 1988 Mine Drainage and Surface Mine Reclamation, Volume I: Mine Water and Mine Waste. U.S. Bureau of Mines IC 9183. pp. 359-369.
Silverman, M. P. 1967. Mechanisms of Bacterial Pyrite Oxidation. J. Bacteriology. 94:1,046-1,051.
Simmons, J., Ziemkiewicz, P. and D. C. Black. 2002. Use of Steel Slag Leach Beds for the Treatment of Acid Mine Drainage. Mine Water and the Environment. 21(2):91-99.
Singer, P. C. and W. Stumm. 1970a. Oxygenation of Ferrous Iron. Water Pollution Control Research Series. Federal Water Quality Administration. 14010-06169. 183 pp.
Singer, P.C. and W. Stumm. 1970b. Acidic Mine Drainage: the Rate Determining Step. Science. 167:1,121-1,123.
Skousen, J. and B. Faulkner. 1992. Preliminary Results of Acid Mine Drainage Treatment with Anoxic Limestone Drains in West Virginia. Proceedings of the 13th Annual West Virginia Surface Mining Drainage Task Force Symposium (Morgantown, WV).
Spratt, A. K. and R. K. Wieder. 1988. Growth Responses and Iron Uptake in Sphagnum Plants and their Relations to Acid Mine Drainage (AMD) Treatment. Mine Drainage and Surface Mine Reclamation, Volume I: Mine Water and Mine Waste. U.S. Bureau of Mines IC 9183. pp. 279-286.

71
Stark, L., E. Stevens, H. Webster and W. Wenerick. 1990. Iron Loading, Efficiency, and Sizing in a Constructed Wetland Receiving Mine Drainage. Paper in Proceedings of the 1990 Mining and Reclamation Conference and Exhibition: Volume II, J. Skousen, J. Sencindiver and D. Samuel, Eds. pp. 393-401.
Stone, R. W and B. J. Pesavento. 1985. Micro- and Macro-Biological Characteristics of Wetlands Removing Iron and Manganese.Proceedings of Wetlands and Water Management on Mined Lands (Pennsylvania State University, University Park, PA). p. 373.
Stumm, W. and J. Morgan. 1981. Aquatic Chemistry.New York: Wiley-Interscience. 583 pp.
Stumm, W. and J. Morgan. 1996. Aquatic Chemistry.New York: Wiley & Sons. 1,022 pp.
Temple, K. G. and E. W. Delchamps. 1953. Autotrophic Bacteria and the Formation of Acid in Bituminous Coal Mines. Applied Microbiolog., 1:255-258.
Thomas, R. C. and C. S. Romanek. 2002. Acid Rock Drainage in a Vertical Flow Wetland I: Acidity Neutralization and Alkalinity Generation.Proceedings of the 2002 National Meeting of the American Society of Mining and Reclamation (Lexington, KY).
Turner, D. and D. McCoy. 1990. Anoxic Alkaline Drain Treatment System, a Low Cost Acid Mine Drainage Treatment Alternative. Proceedings of the National Symposium on Mining. (University of Kentucky, Lexington, KY). pp. 73-75.
United States Environmental Protection Agency. 1983. Design Manual: Neutralization of Acid Mine Drainage. Office of Research and Development, Industrial Environmental Research Laboratory. 231 pp.
Watzlaf, G. R. 1997. Passive Treatment of Acid Mine Drainage in Down-Flow Limestone Systems. Proceedings of the 1997 National Meeting of the American Society for Surface Mining and Reclamation (Austin, TX).
Watzlaf, G. R. and R.S. Hedin. 1993. A Method for Predicting the Alkalinity Generated by Anoxic Limestone Drains. Proceedings of Fourteenth Annual West Virginia Surface Mine Drainage Task Force Symposium (Morgantown, WV).
Watzlaf, G. R. and D. M. Hyman. 1995. Limitations of Passive Systems for the Treatment of Mine Drainage. Proceedings of the 17th Annual Association of Abandoned Mine Lands Conference. (French Lick, IN). p. 186-199.
Watzlaf, G. R., Schroeder, K. T. and C. L. Kairies. 2000. Long-Term Performance of Alkalinity-Producing Passive Systems for the Treatment of Mine Drainage. Proceedings of the 2000 National Meeting of the American Society for Surface Mining and Reclamation (Tampa, FL). pp. 262-274.
Watzlaf, G. R., Schroeder, K.T ., and C. L. Kairies. 2001. Modeling of Iron Oxidation in a Passive Treatment System. Proceedings of the 2001 National Meeting of the American Society for Surface Mining and Reclamation (Albuquerque, NM). pp. 626-638.
Watzlaf, G. R., Kairies, C. L., and K. T. Schroeder. 2002. Quantitative Results from the Flushing of Four Reducing and Alkalinity-Producing Systems. Proceedings of the 23rd West Virginia Surface Mine Drainage Task Force Symposium (Morgantown, WV).
Wieder, R. K. 1989. A Survey of Constructed Wetlands for Acid Coal Mine Drainage Treatment
72
in the Eastern United States. Wetlands. 9(2):299-315.
Wieder, R. K. 1994. Diel Changes in Iron (III)/Iron (II) in Effluent from Constructed Acid Mine Drainage Treatment Wetlands. Journal of Environmental Quality. 23(4):730-738.
Wieder, R. K. and G. E. Lang. 1982. Modification of Acid Mine Drainage in a Freshwater Wetland. Proceedings of the Symposium on Wetlands of the Unglaciated Appalachian Region, West Virginia University, Morgantown, WV, B. R. McDonald, Ed. pp. 43-53.
Wildeman T., Machener, S., Klusman, R., Cohen, R. and P. Lemke. 1990. Metal Removal Efficiencies from Acid Mine Drainage in the Big Five Constructed Wetland. Proceedings of the 1990 Mining and Reclamation Conference and Exhibition, Vol. II. pp. 425-433.
Wildeman T. R., Spotts, E., Schafer, W. and J. Gusek. 1994. Characterization, Management and Treatment of Water for Metal-Mining Operations. Short Course at the 1994 Meeting of the American Society for Surface Mining and Reclamation (Pittsburgh, PA), 1994.
Younger, P. L., Banwart, S. A., and R. S. Hedin. 2002. Mine Water: Hydrology, Pollution, Remediation. Dordrecht: Kluwer Academic Publishers. 442 pp.
Ziemkiewicz, P. F., J. G. Skousen and J. Simmons. 2003. Long-Term Performance of Passive Acid Mine Drainage Treatment Systems. Mine Water and the Environment. 22:118-129.