the pennsylvania lottery: historical data and interstate ... 8 lafleur’s fast facts 2013. four...
TRANSCRIPT

Independent Fiscal Office
The Pennsylvania Lottery:
Historical Data and Interstate Comparisons
January 2014 Special Report 2014-1


About the Independent Fiscal Office
The Independent Fiscal Office (IFO) provides revenue projections for
use in the state budget process along with impartial and timely analysis
of fiscal, economic and budgetary issues to assist Commonwealth resi-
dents and the General Assembly in their evaluation of policy decisions.
In that capacity, the IFO will not support or oppose any policies it ana-
lyzes, and will disclose all methodologies, data sources and assumptions
used in published reports and estimates.
Independent Fiscal Office
Rachel Carson State Office Building, 2nd
Floor
400 Market Street
Harrisburg, PA 17105
Telephone: 717-230-8293
E-mail: [email protected]
Website: www.ifo.state.pa.us
Staff Contacts: Matthew Knittel, Director
Mark Ryan, Deputy Director
___________________________________________________________
The Independent Fiscal Office was created
by the Act of Nov. 23, 2010 (P.L.1269, No.120).
___________________________________________________________

- This page was intentionally left blank. -

INDEPENDENT FISCAL OFFICE
Second Floor, Rachel Carson State Office Building
400 Market Street
Harrisburg, Pennsylvania 17105
January 30, 2014
The Honorable Members of the General Assembly:
The Pennsylvania Lottery generates considerable funds that benefit elderly residents of the Common-
wealth. For FY 2012-13, Pennsylvania Lottery sales yielded $1.1 billion of profits or net revenues. Those
revenues provided property tax and rent relief, subsidized transportation and prescription drug purchases
and nursing home services for elderly residents. Pennsylvania is the only state that dedicates all lottery
proceeds to programs that benefit senior citizens.
For recent fiscal years, Pennsylvania Lottery sales and profits have displayed impressive growth. Since
FY 2009-10, sales have increased at an average rate of 6.5 percent per annum, and profits have increased
by 5.2 percent per annum. Demographic projections suggest that demand for programs and services fund-
ed by lottery revenues will grow at a rate that exceeds the expansion of the Pennsylvania economy. There-
fore, an important issue for policymakers is whether lottery revenues can maintain recent growth rates so
they will be sufficient to meet those demands. This report provides data to assist policymakers in those
deliberations.
The Independent Fiscal Office would like to thank Pennsylvania Lottery staff for their assistance regard-
ing the clarification of various technical issues related to lottery games and operations. Questions and
comments can be submitted to [email protected].
Sincerely,
MATTHEW KNITTEL
Director

- This page was intentionally left blank. -

Lottery Data and Comparisons
Independent Fiscal Office Page 1
Introduction
Since 1964, states have utilized lotteries to gen-
erate funds for education, economic develop-
ment, services for the elderly and other general
needs. Currently, 44 states and the District of
Columbia operate a lottery system or participate
in a multistate lottery. The lottery remains the
only form of commercial gaming that most
adults report having played during the past
year.1
For fiscal year (FY) 2012-13, the Pennsylvania
Lottery (hereafter referred to as the Lottery)
generated $1.1 billion of net revenues or profits
that provided tax relief and services for elderly
residents. Demographic projections suggest that
the demand for programs funded by lottery prof-
its will likely outpace general economic growth
over the next decade. An important issue for
policymakers is whether lottery revenues will be
sufficient to support future demands. If they are
not, then policymakers may need to reduce ser-
vices or seek alternative sources of funding.
This report provides a brief historical analysis of
lottery sales, profits and expenditures from the
Lottery Fund. It compares state lotteries using
common industry metrics, such as per capita
sales. The interstate comparison allows policy-
makers to gauge the relative performance of the
Lottery. The metrics are also useful to assess the
rate of lottery penetration in the state and the
potential for future expansion. The final section
discusses short and long-term challenges the
Lottery will confront as it attempts to expand in
a highly competitive marketplace. The report
concludes with a brief analysis of possible lot-
tery expansion through Keno.
1 Barnes et al. “Gambling on the Lottery: Sociodem-
ographic Correlates Across the Lifespan.” Journal of
Gambling Studies. (2011) 27: 575-586.
The remainder of this section provides back-
ground on state lottery systems and the products
sold by those systems.
A Brief History of State Lotteries
Lotteries have a long history in the U.S. All
original 13 colonies and many public and private
schools, colleges and universities used lotteries
to fund construction projects throughout the
1700s and 1800s.2 As the nation expanded and
lotteries proliferated, corruption became more
prevalent. By 1895, all state governments had
abolished state-sanctioned and private lotteries
due to recurring lottery scandals and moral con-
cerns.
The lottery ban remained effective until 1964,
when New Hampshire amended its constitution
to establish the first state lottery. New York
(1967) and New Jersey (1970) soon followed
New Hampshire’s lead. By 1971, total sales of
these three lottery systems surpassed $100 mil-
lion. By 1976, Pennsylvania (March 1972) and
nine other states had established lottery systems,
and total sales surpassed $1 billion. Lotteries
continued to expand rapidly throughout the
1980s (18 new states) and the 1990s (6 new
states). Currently, 44 states and the District of
Columbia operate a lottery; only six states
(Alaska, Alabama, Hawaii, Mississippi, Nevada
and Utah) do not operate a lottery system.
For FY 2012-13, state lottery sales totaled $68.8
billion and transfers to state governments (i.e.,
profits) totaled $18.6 billion.3 For most states,
lotteries provide a relatively small, but meaning-
2 The historical timeline used in this section is from
the National Association of State and Provincial Lot-
teries. See www.NASPL.org. 3 LaFleur’s Fast Facts 2013. Includes net revenues
(wagers less payouts) from non-traditional games
such as video lottery terminals.

Lottery Data and Comparisons
Page 2 Independent Fiscal Office
ful, source of funds, typically one to three per-
cent of own-source (i.e., non-federal) funds at
the state level. However, lottery revenues can
comprise a significant source of funds for states
with small populations such as Delaware (5.7
percent of own-source funds), West Virginia
(7.3 percent) and Rhode Island (8.0 percent).4
Lottery Products
Like other retailers, state lotteries continually
update and expand their product lines to meet
consumer demands and attract new customers.
Lottery products have evolved over time in re-
sponse to a market that is highly competitive for
entertainment dollars.
State lotteries sell or manage seven types of
products or games. They are as follows (listed in
chronological order):
Raffles - The most basic lottery product is a raf-
fle. A raffle is game where players purchase a
ticket with a pre-determined number and wait an
extended period of time to see if a ticket with a
matching number is drawn at random. The Lot-
tery offered its first 50 cent raffle ticket on
March 7, 1972. Drawings were weekly and the
grand prize was $1 million.5 Currently, 27 state
lotteries sell raffle tickets. Raffles comprise a
very small portion of total lottery sales.6
Instant Tickets - In 1974, Massachusetts became
the first state to sell instant scratch-off tickets.
Compared to other lottery products, instant tick-
ets have smaller prizes but higher odds of win-
4 U.S. Census Bureau, State Government Finances.
Own-source revenues include all licenses and fees.
Figures based on latest available data for FY 2010-
11. For Pennsylvania, lottery net revenues comprised
1.9 percent of total own-source funds. 5 See the Pennsylvania Lottery website for a product
timeline: http://www.palottery.state.pa.us/About-PA-
Lottery/History-of-PA-Lottery.aspx. 6 LaFleur’s 2012-13 Unaudited Lottery Fiscal Sales
Report. For FY 2012-13, raffle sales totaled $20.4
million and comprised 0.6 percent of Pennsylvania
Lottery sales. For all state lotteries, the raffle share
was 0.2 percent of total sales.
ning, and payout rates typically range from 65 to
75 percent of sales. The Lottery offered its first
instant ticket game in May 1975.
Numbers Games – Numbers games allow parti-
cipants to select a combination of three, four or
five numbers that range from 0 to 9. Payout rates
typically range from 48 to 52 percent of sales.
The Lottery offered its first numbers game (the
Daily Number) on March 1, 1977.
Lotto Games – Lotto games can be in-state (i.e.,
only one state lottery sells tickets) or multi-state.
Players select (or are randomly assigned) five or
six numbers that could range from 1 to 75. In
many games, an extra number is added, and as-
signed a special name or colored ball. Lotto
jackpots are normally much larger than daily
numbers games, but the drawings are less fre-
quent. In-state lotto (e.g., Cash 5, Match 6) jack-
pots are typically predetermined but will roll
over if no player matches all numbers.7 Multi-
state lotto jackpots (e.g., Powerball and Mega
Millions) are much larger and the odds of win-
ning much smaller. Payout rates generally range
from 48 to 56 percent for lotto games. The Lot-
tery’s first lotto game (Pennsylvania Lotto) de-
buted on April 16, 1982. Players picked six
numbers ranging from 1 to 40 and the starting
jackpot was $1 million.
Keno – Keno games can take many forms. Typi-
cally, players select 10 numbers from 1 to 80.
Twenty numbers are then drawn at random.
Payouts are based on the share of selected num-
bers that match those drawn randomly. Draw-
ings can occur frequently (every four to five
minutes) and payout rates typically range from
62 to 68 percent of gross wagers. Keno is of-
fered in bars, taverns, restaurants and certain
convenience stores. Some states (e.g., West Vir-
ginia and Maryland) also offer Keno-type games
that allow players to select horses that partici-
pate in a simulated race.
7 The starting jackpot is $125,000 for Cash 5 (50 per-
cent payout) and $500,000 for Match 6 (58 percent
payout).

Lottery Data and Comparisons
Independent Fiscal Office Page 3
Video Lottery Games - A more recent gaming
option offered by state lotteries is electronic
gaming or video lottery terminals (VLTs). These
electronic games are managed by a lottery au-
thority or gaming control board, depending on
the state. The games include slot-type games,
video poker and other games of chance. The
games usually reside within a casino, although
certain states allow them to be housed in restau-
rants and taverns (e.g., West Virginia). For FY
2012-13, eight state lotteries generated $5.8 bil-
lion in net machine income (gross wagers less
payouts).8
8 LaFleur’s Fast Facts 2013. Four state lotteries (West
Virginia, Maryland, Delaware and New York) also
provide oversight for table games.
Sports Betting – Delaware is currently the only
state that offers sports betting through the state
lottery. Players must be of legal age and physi-
cally located within the state. Wagers can only
be placed on National Football League games.
For FY 2012-13, sports betting generated $25.4
million of gross revenues (4.0 percent of Dela-
ware lottery sales) and $3.7 million of profits.

Lottery Data and Comparisons
Page 4 Independent Fiscal Office
- This page was intentionally left blank. -

Lottery Data and Comparisons
Independent Fiscal Office Page 5
Pennsylvania Lottery Sales and Profits
This section presents historical data for lottery
sales, profits and expenditures from the Lottery
Fund. All data are from the Executive Budget or
financial statements posted on the Lottery’s
website. Relevant explanatory footnotes can be
found at the bottom of the tables.
Lottery Sales
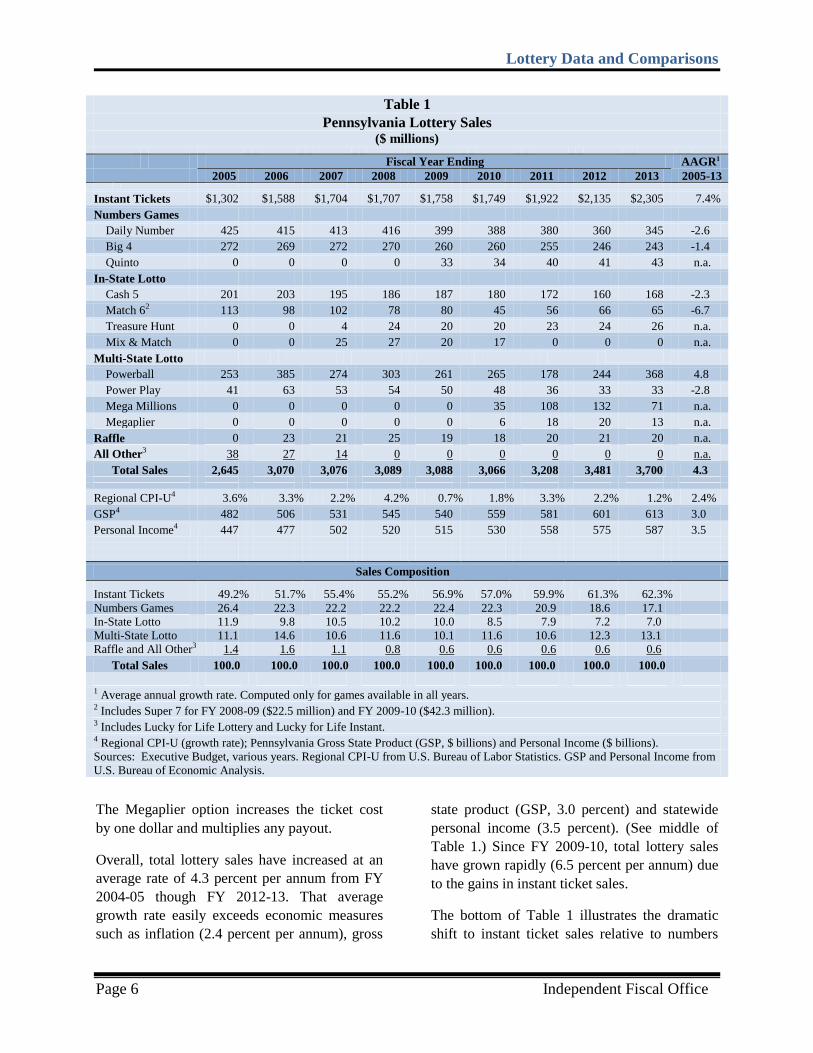
Table 1 displays lottery sales from FY 2004-05
through FY 2012-13. Historically, instant ticket
sales have comprised more than half of total
sales. The Lottery sells instant tickets at $1, $2,
$3, $5, $10 and $20 price points. Instant ticket
sales increased dramatically from FY 2004-05
($1.3 billion) through FY 2012-13 ($2.3 billion),
an average increase of 7.4 percent per annum.
Since the latest recession, sales growth has been
even more impressive, increasing at an average
rate of 9.6 percent per annum (not shown in ta-
ble). The robust growth of instant ticket sales is
due to successful marketing campaigns, an ex-
panding retailer network and the installation of
numerous instant ticket vending machines
(ITVMs) and PlayCentral Terminals (PCTs) in
various retail, eating and drinking establish-
ments.9
The next largest product in terms of dollar sales
is numbers games. Numbers games use a com-
bination of numbers that range from 0 to 9. The
Daily Number game uses a three number combi-
nation, Big 4 uses four numbers and Quinto uses
five numbers. Over time, numbers games have
become less popular. Since FY 2004-05, the
Daily Number (-2.6 percent growth per annum)
and Big 4 (-1.4 percent) games have registered
sales reductions, and that trend has accelerated
since the 2008-09 recession. Although a portion
of the trend reduction is due to the introduction
9 For FY 2012-13, the Lottery had deployed 4,425
ITVMs and 1,772 PCTs throughout the state.
of Quinto (2009), the inclusion of Quinto does
not reverse the long-term decline in sales of
numbers games.
In-state lotto games use a combination of num-
bers that range from 1 to 49: Cash 5 uses five
numbers from 1 to 43, Treasure Hunt uses five
numbers from 1 to 30 and Match 6 uses six
numbers from 1 to 49. From FY 2004-05 to FY
2012-13, Cash 5 (-2.3 percent per annum) and
Match 6 (-6.7 percent) sales have declined.10
Treasure Hunt debuted in 2007 and likely cap-
tured some sales from other lotto games. How-
ever, the inclusion of Treasure Hunt does not
reverse the long-term decline in sales of in-state
lotto games.
Multi-state lotto games have the same structure
as in-state lotto games, but have larger jackpots
due to higher sales volume and lower odds of
winning. Powerball uses a five number combina-
tion from 1 to 59 and an extra Powerball number
from 1 to 35. The Power Play option allows
players to increase payouts for an additional dol-
lar wager.
Powerball sales have held steady over the past
decade. Sales for FY 2012-13 were unusually
strong due to a high number of very large jack-
pots, which induces greater purchases. Sales for
the first half of FY 2013-14 were weaker, but
considerably higher than the first half of FY
2011-12. Mega Millions uses a five number
combination from 1 to 75 and one mega ball
number from 1 to 15. Mega Millions debuted in
Pennsylvania during FY 2009-10, and it is likely
that a portion of its sales were shifted away from
Powerball and in-state lotto and numbers games.
10
For the first six months of FY 2013-14, in-state
lotto game sales increased by 7.8 percent over the
prior year.
Lottery Data and Comparisons
Page 6 Independent Fiscal Office
The Megaplier option increases the ticket cost
by one dollar and multiplies any payout.
Overall, total lottery sales have increased at an
average rate of 4.3 percent per annum from FY
2004-05 though FY 2012-13. That average
growth rate easily exceeds economic measures
such as inflation (2.4 percent per annum), gross
state product (GSP, 3.0 percent) and statewide
personal income (3.5 percent). (See middle of
Table 1.) Since FY 2009-10, total lottery sales
have grown rapidly (6.5 percent per annum) due
to the gains in instant ticket sales.
The bottom of Table 1 illustrates the dramatic
shift to instant ticket sales relative to numbers
Table 1
Pennsylvania Lottery Sales ($ millions)
Fiscal Year Ending AAGR1
2005 2006 2007 2008 2009 2010 2011 2012 2013 2005-13
Instant Tickets $1,302 $1,588 $1,704 $1,707 $1,758 $1,749 $1,922 $2,135 $2,305 7.4%
Numbers Games
Daily Number 425 415 413 416 399 388 380 360 345 -2.6
Big 4 272 269 272 270 260 260 255 246 243 -1.4
Quinto 0 0 0 0 33 34 40 41 43 n.a.
In-State Lotto
Cash 5 201 203 195 186 187 180 172 160 168 -2.3
Match 62 113 98 102 78 80 45 56 66 65 -6.7
Treasure Hunt 0 0 4 24 20 20 23 24 26 n.a.
Mix & Match 0 0 25 27 20 17 0 0 0 n.a.
Multi-State Lotto
Powerball 253 385 274 303 261 265 178 244 368 4.8
Power Play 41 63 53 54 50 48 36 33 33 -2.8
Mega Millions 0 0 0 0 0 35 108 132 71 n.a.
Megaplier 0 0 0 0 0 6 18 20 13 n.a.
Raffle 0 23 21 25 19 18 20 21 20 n.a.
All Other3 38 27 14 0 0 0 0 0 0 n.a.
Total Sales 2,645 3,070 3,076 3,089 3,088 3,066 3,208 3,481 3,700 4.3
Regional CPI-U4 3.6% 3.3% 2.2% 4.2% 0.7% 1.8% 3.3% 2.2% 1.2% 2.4%
GSP4 482 506 531 545 540 559 581 601 613 3.0
Personal Income4 447 477 502 520 515 530 558 575 587 3.5
Sales Composition
Instant Tickets 49.2% 51.7% 55.4% 55.2% 56.9% 57.0% 59.9% 61.3% 62.3%
Numbers Games 26.4 22.3 22.2 22.2 22.4 22.3 20.9 18.6 17.1
In-State Lotto 11.9 9.8 10.5 10.2 10.0 8.5 7.9 7.2 7.0
Multi-State Lotto 11.1 14.6 10.6 11.6 10.1 11.6 10.6 12.3 13.1
Raffle and All Other3 1.4 1.6 1.1 0.8 0.6 0.6 0.6 0.6 0.6
Total Sales 100.0 100.0 100.0 100.0 100.0 100.0 100.0 100.0 100.0
1 Average annual growth rate. Computed only for games available in all years. 2 Includes Super 7 for FY 2008-09 ($22.5 million) and FY 2009-10 ($42.3 million). 3 Includes Lucky for Life Lottery and Lucky for Life Instant. 4 Regional CPI-U (growth rate); Pennsylvania Gross State Product (GSP, $ billions) and Personal Income ($ billions).
Sources: Executive Budget, various years. Regional CPI-U from U.S. Bureau of Labor Statistics. GSP and Personal Income from
U.S. Bureau of Economic Analysis.

Lottery Data and Comparisons
Independent Fiscal Office Page 7
and lotto games. Instant tickets have higher pay-
out rates and lower profit margins, so a higher
level of sales must occur to generate the same
amount of profits.
Lottery Profits
Table 2 displays the Lottery’s income statement
for FY 2004-05 through FY 2012-13. Lottery
net revenues or profits are equal to total sales
less vendor and retailer commissions (i.e., the
cost to produce and sell lottery products), prize
payouts, operating expenses plus miscellaneous
revenues such as investment income. The bot-
tom of Table 2 displays some common perfor-
mance metrics for state lotteries. An analysis of
the income statement reveals:
The moderately strong total sales growth
(4.3 percent per annum) is attributable to in-
stant ticket sales, which more than offsets
the decline in numbers games.
Vendor commissions have declined relative
to sales. Commissions pay for market re-
search, the printing of tickets and daily
drawings.
Retailer commissions comprise a relatively
constant share of total lottery sales (5.3 per-
cent).
Prize payouts comprise an increasing share
of total sales. That trend is due to the strong
growth of instant tickets, which have higher
payouts than draw games.
Total operating expenses (2.3 percent per
annum) have grown at a rate roughly equal
to inflation and have declined as a share of
total sales.
Net revenues or profits (2.9 percent per an-
num) have expanded at a rate roughly equal
to the Pennsylvania economy (GSP, 3.0 per-
cent per annum). Since FY 2009-10, profits
have grown by 5.2 percent per annum.
Certain state lotteries must ensure that net reve-
nues or profits exceed a specified share of total
sales. Prior to 2009, the Pennsylvania Lottery
was required to return 30 percent of sales as net
revenues. Act 53 of 2008 reduced the minimum
required return to 27 percent through FY 2010-
11. Act 23 of 2011 extends the reduced mini-
mum through FY 2014-15. The lower minimum
return allows the Lottery to pursue instant ticket
sales to facilitate sales and profit growth.11
Lottery Fund Expenditures
Table 3 displays expenditures made from the
Lottery Fund. The Lottery Fund receives reve-
nues from lottery sales (gross sales less field
paid prizes and commissions) plus transfers
from other gaming activities (slots).12,13
By stat-
ute, all lottery net revenues must be used to ben-
efit elderly residents. Programs funded and ex-
penses paid by the Lottery Fund include:
PennCARE - Provides funds that enable elderly
residents to receive healthcare services outside
of a nursing home. Funds are distributed to 52
regional Area Agencies on Aging that provide
coverage to all counties. The agencies must use
55 percent of funds for in-home services; residu-
al funds may be used in a discretionary manner.
Services include adult day care, home delivered
meals, legal assistance, personal care and senior
centers.
Pharmaceutical Assistance - Includes the PACE
(Pharmaceutical Assistance Contract for the El-
derly) and PACENET (Pharmaceutical Assis-
tance Contract for the Elderly Needs Enhance-
ment Tier) programs. These programs subsidize
the purchase of generic and brand name pre-
scription drugs by eligible participants.
11
For FY 2012-13, five other states mandated a min-
imum return from lottery operations: Delaware (30
percent), Louisiana (35 percent), Oklahoma (35 per-
cent), Tennessee (35 percent) and New Jersey (30
percent). 2012 NASPL Resource Index. 12
Prizes of $2,500 or less can be paid by lottery re-
tailers (referred to as field paid prizes). 13
For FY 2012-13, the transfer from the Gaming
Fund (slots revenue) through the Property Tax Relief
Fund to the Lottery Fund was $166.8 million.

Lottery Data and Comparisons
Page 8 Independent Fiscal Office
Table 2
Pennsylvania Lottery Income Statement ($ millions)
Fiscal Year Ending AAGR1
2005 2006 2007 2008 2009 2010 2011 2012 2013 2005-13
Instant Tickets $1,302 $1,588 $1,704 $1,707 $1,758 $1,749 $1,922 $2,135 $2,305 7.4%
Numbers Games 697 685 685 686 693 683 674 646 631 -1.2
All Other 646 798 688 696 638 635 612 700 763 2.1
Total Gross Sales 2,645 3,070 3,076 3,089 3,088 3,066 3,208 3,481 3,700 4.3
Vendor and Retailer Commissions
Vendor Online 51 54 51 52 40 29 31 34 38 -3.6
Vendor Instant 29 33 35 26 18 18 22 22 24 -2.3
Retailer 138 171 166 170 165 160 169 184 196 4.5
Subtotal 218 258 253 248 224 207 221 240 258 2.1
Total Payouts 1,529 1,805 1,833 1,845 1,853 1,867 1,958 2,121 2,299 5.2
Gross Revenues 898 1,007 991 996 1,012 992 1,029 1,120 1,142 3.1
Operating Expenses
Advertising 30 25 30 32 32 41 37 37 37 -3.7
Expanded Sales2 15 19 23 28 18 17 0 0 0 n.a.
Personnel 11 12 12 12 12 13 18 19 19 14.7
Operating 8 7 10 11 12 9 14 14 17 21.7
Fixed Assets 0 0 0 0 6 0 5 4 4 n.a.
Augmentations 0 0 0 0 0 -4 0 0 0 n.a.
Subtotal 64 64 75 82 79 76 74 73 77 2.3
Other Revenues 18 32 33 14 -28 0 6 14 2 n.a
Net Revenues 852 975 949 928 905 916 961 1,061 1,067 2.9
Expenses and Net Revenues Relative to Sales
Vendor Commissions 2.3% 2.1% 2.1% 1.5% 1.0% 1.0% 1.1% 1.0% 1.1%
Retailer Commissions 5.2 5.6 5.4 5.5 5.3 5.2 5.3 5.3 5.3
Prize Payouts 57.8 58.8 59.6 59.7 60.0 60.9 61.0 60.9 62.1
Operating Expenses 2.4 2.1 2.4 2.6 2.6 2.5 2.3 2.1 2.1
Net Revenues 32.2 31.8 30.9 30.0 29.3 29.9 29.9 30.5 28.8
Minimum Return3 30.0 30.0 30.0 30.0 27.0 27.0 27.0 27.0 27.0
1 Average annual growth rate.
2 An expanded sales appropriation was established in FY 2003-04 to pay for costs required to increase lottery sales to $2.6 billion.
A key part of the plan was the expansion of the retail network. For FY 2003-04, 45 new lottery positions were created; for FY
2004-05, 12 new positions were created. Expanded sales include the cost to fund those new positions and to service new retailers.
Beginning with FY 2008-09, those costs were shifted to general operations.
3 Act 53 of 2008 reduced the required minimum return from 30% to 27% through FY 2010-11. Act 23 of 2011 extends the 27%
minimum return through FY 2014-15.
Source: Pennsylvania Lottery Income Statement, see www.palottery.state.pa.us.

Lottery Data and Comparisons
Independent Fiscal Office Page 9
Long-Term Care - Provides funds for certain
nursing home services. Also provides funds that
allow Medical Assistance recipients to obtain
services that enable them to live outside of a
nursing home.
Property Tax and Rent Rebate - Provides for the
refund of property tax or rental payments for
persons (or spouses) who are at least 65 years
old, widows and widowers age 50 or older and
the permanently disabled age 18 or older based
on certain income thresholds. The maximum
rebate is $650.14
Public Transportation Trust Fund - Transfer
from the Lottery Fund to the Public Transporta-
tion Trust Fund.
14
However, certain residents may qualify for en-
hanced rebates based on the city of residence and the
share of income paid in property tax.
Shared-Ride - Seniors age 65 or older qualify to
use Shared-Ride, a door-to-door transportation
service, at a discounted rate equal to 15 percent
of the existing fare; lottery proceeds pay the re-
maining 85 percent.
All Other - For FY 2012-13, expenditures in-
clude pre-admission assessment ($10.7 million),
caregiver support ($12.1 million), Alzheimer’s
outreach ($0.3 million), general government op-
erations ($53.7 million), vendor commissions
($56.3 million), payment of certain prize monies
($414.7 million, not paid in the field) and lottery
advertising ($37.0 million).15
15
General government operations include expendi-
tures for the administration of the Property Tax Rent
Rebate program.
Table 3
Lottery Fund Expenditures ($ millions)
Fiscal Year Ending
2005 2006 2007 2008 2009 2010 2011 2012 2013
PENNCARE $212 $220 $228 $236 $240 $241 $243 $249 $248
Pharmaceutical Assistance Fund 300 400 204 278 255 200 200 200 190
Medical Asst. – Long Term Care 0 0 249 249 301 178 178 178 309
Property Tax and Rent Assistance 127 124 120 245 276 278 283 285 286
Public Transportation Trust Fund 52 52 50 80 82 87 88 90 91
Older Pennsylvanians – Shared Rides 71 72 72 77 78 80 73 79 81
Fixed Route Transportation 0 17 21 0 0 0 0 0 0
All Other1 378 553 500 520 517 498 479 522 592
Total 1,139 1,438 1,443 1,685 1,749 1,562 1,545 1,602 1,797
1 Includes appropriations for the Departments of Revenue, Treasury and Aging that are not itemized above.
Source: Executive Budget, various years.

Lottery Data and Comparisons
Page 10 Independent Fiscal Office
- This page was intentionally left blank. -
Lottery Data and Comparisons
Independent Fiscal Office Page 11
Interstate Comparisons
This section compares lottery sales and profits
across states. The interstate comparison uses
states that have established lottery systems lo-
cated in the Mid-Atlantic (PA, NJ, NY, DE,
MD, VA), Midwest (IA, OH, IL, IN, MI, WE,
MN, MO), populous New England states (MA,
CT) and certain southern states that have signifi-
cant lottery operations (NC, TN, KY, GA, FL).16
These general comparisons do not control fac-
tors that may drive lottery sales in a particular
state such as demographic composition, intensity
of advertising and retailer participation.17
The analysis makes separate interstate compari-
sons for instant tickets and numbers and lotto
games.18
The interstate comparison uses two
common industry metrics: (1) per capita sales
and (2) sales relative to state personal income.
Analysts use these metrics to measure lottery
performance, the penetration rate of lottery
sales, and to assess the potential for higher sales
via increased lottery penetration rates. Most data
are from LaFleur’s for the most recent fiscal
year (FY 2012-13).19
However, certain data
available only for FY 2011-12 are from the Na-
tional Association of State and Provincial Lot-
teries (NASPL).20
Sources are noted at the bot-
tom of the tables.
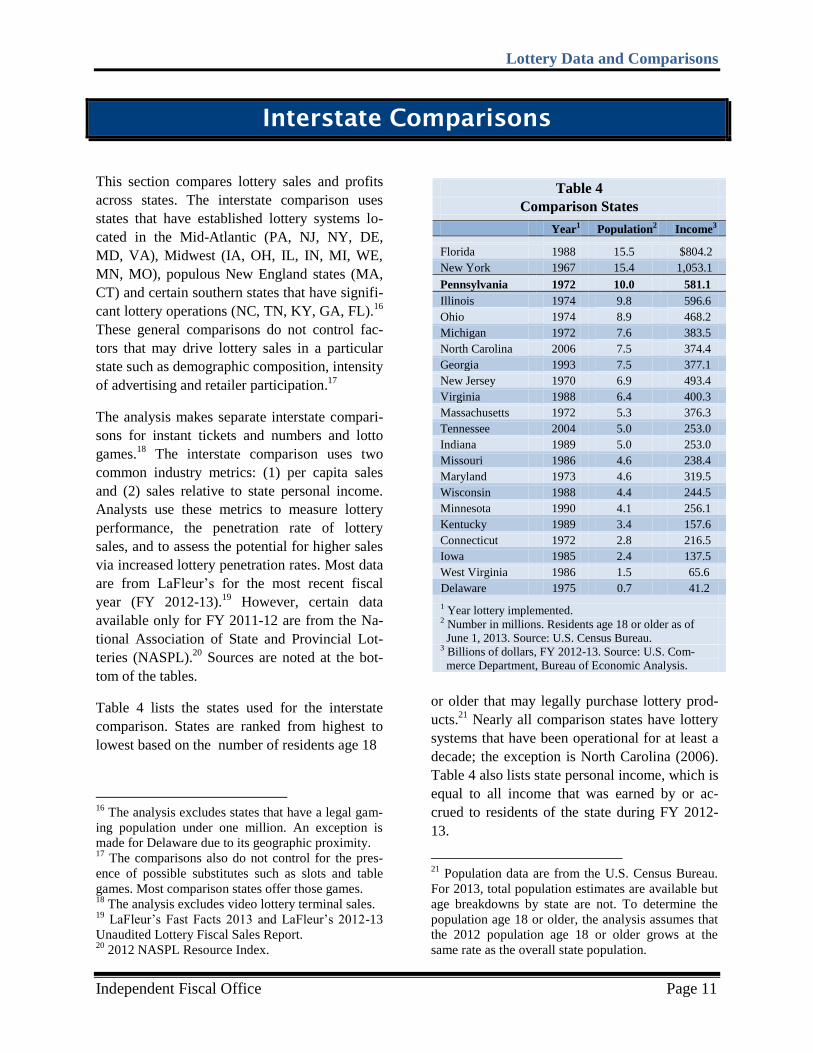
Table 4 lists the states used for the interstate
comparison. States are ranked from highest to
lowest based on the number of residents age 18
16
The analysis excludes states that have a legal gam-
ing population under one million. An exception is
made for Delaware due to its geographic proximity. 17
The comparisons also do not control for the pres-
ence of possible substitutes such as slots and table
games. Most comparison states offer those games. 18
The analysis excludes video lottery terminal sales. 19
LaFleur’s Fast Facts 2013 and LaFleur’s 2012-13
Unaudited Lottery Fiscal Sales Report. 20
2012 NASPL Resource Index.
or older that may legally purchase lottery prod-
ucts.21
Nearly all comparison states have lottery
systems that have been operational for at least a
decade; the exception is North Carolina (2006).
Table 4 also lists state personal income, which is
equal to all income that was earned by or ac-
crued to residents of the state during FY 2012-
13.
21
Population data are from the U.S. Census Bureau.
For 2013, total population estimates are available but
age breakdowns by state are not. To determine the
population age 18 or older, the analysis assumes that
the 2012 population age 18 or older grows at the
same rate as the overall state population.
Table 4
Comparison States
Year1 Population2 Income3
Florida 1988 15.5 $804.2
New York 1967 15.4 1,053.1
Pennsylvania 1972 10.0 581.1
Illinois 1974 9.8 596.6
Ohio 1974 8.9 468.2
Michigan 1972 7.6 383.5
North Carolina 2006 7.5 374.4
Georgia 1993 7.5 377.1
New Jersey 1970 6.9 493.4
Virginia 1988 6.4 400.3
Massachusetts 1972 5.3 376.3
Tennessee 2004 5.0 253.0
Indiana 1989 5.0 253.0
Missouri 1986 4.6 238.4
Maryland 1973 4.6 319.5
Wisconsin 1988 4.4 244.5
Minnesota 1990 4.1 256.1
Kentucky 1989 3.4 157.6
Connecticut 1972 2.8 216.5
Iowa 1985 2.4 137.5
West Virginia 1986 1.5 65.6
Delaware 1975 0.7 41.2
1 Year lottery implemented.
2 Number in millions. Residents age 18 or older as of
June 1, 2013. Source: U.S. Census Bureau. 3 Billions of dollars, FY 2012-13. Source: U.S. Com-
merce Department, Bureau of Economic Analysis.

Lottery Data and Comparisons
Page 12 Independent Fiscal Office
Instant Tickets
Table 5 displays instant ticket sales, the average
payout rate for instant tickets, per capita sales
and profits and sales and profits relative to state
personal income. Profit measures are used in
addition to sales because average payout rates
range from 62.2 percent (Iowa) to 76.2 percent
(Massachusetts) and higher payout rates will
increase sales, but reduce profit margins. For
most states, lottery authorities determine average
payout rates, subject to any mandated minimum
return. Average payout rates will also vary based
on the mix of tickets sold (i.e., price points,
which range from $1 to $20 per ticket); tickets
with higher price points generally have higher
payout rates.22
For the purpose of this comparison, the term
“profit” represents the residual amount after
payout, and does not reflect amounts needed to
cover remaining fixed and variable costs or re-
tailer commissions. The metric that measures
sales relative to state personal income represents
the share of average income that was spent on
instant tickets during FY 2012-13.
22
For the Pennsylvania Lottery, the $1 instant ticket
payout rate is 58.5 percent, the $5 payout rate is 69.3
percent and the $20 payout rate is 73.6 percent.
LaFleur’s Fast Facts 2013.
Table 5
Instant Ticket Sales and Profits FY 2012-13
Total Payout Per Capita Share of Personal Income
Sales1 Rate2 Sales Rank Profit3 Rank Sales Rank Profit3 Rank
Florida $3,029 69.0% $195.4 8 $60.5 8
0.38% 5 0.12% 5
New York 3,724 69.0 242.4 3 75.1 3
0.35 6 0.11 7
Pennsylvania 2,305 69.7 229.8 5 69.6 7
0.40 4 0.12 4
Illinois 1,768 72.8 180.0 9 49.0 11
0.30 12 0.08 13
Ohio 1,430 68.4 160.7 11 50.8 10
0.31 10 0.10 9
Michigan 819 68.1 107.4 16 34.3 16
0.21 16 0.07 16
North Carolina 1,012 67.5 134.2 14 43.6 14
0.27 13 0.09 12
Georgia 2,631 73.0 351.4 2 94.8 2
0.70 2 0.19 2
New Jersey 1,474 66.7 214.8 7 71.6 6
0.30 11 0.10 8
Virginia 887 68.2 138.9 13 44.2 13
0.22 15 0.07 15
Massachusetts 3,343 76.2 632.9 1 150.6 1
0.89 1 0.21 1
Tennessee 1,089 66.9 218.0 6 72.2 5
0.43 3 0.14 3
Indiana 615 68.5 123.7 15 39.0 15
0.24 14 0.08 14
Missouri 759 70.7 163.8 10 48.0 12
0.32 8 0.09 11
Maryland 486 68.1 106.2 17 33.8 17
0.15 18 0.05 19
Wisconsin 324 64.9 73.2 20 25.7 20
0.13 21 0.05 20
Minnesota 364 67.7 88.0 18 28.4 19
0.14 20 0.05 21
Kentucky 522 66.4 154.8 12 52.0 9
0.33 7 0.11 6
Connecticut 667 69.3 238.3 4 73.2 4
0.31 9 0.09 10
Iowa 202 62.2 85.6 19 32.3 18
0.15 19 0.06 17
West Virginia 109 67.2 73.1 21 24.0 21
0.17 17 0.05 18
Delaware 48 65.0 67.8 22 23.7 22
0.12 22 0.04 22
All States4 27,607 70.1 198.2 n.a. 59.3 n.a.
0.34 n.a. 0.10 n.a.
1 Millions of dollars. Source: LaFleur’s 2012-13 Unaudited Lottery Fiscal Sales Report. 2 Average share of instant ticket sales paid out as prizes. Source: LaFleur’s 2012-13 Unaudited Lottery Fiscal Sales Report. 3 Profit is equal to the residual amount after payout. Excludes miscellaneous costs and commissions.
4 Comparison states only.

Lottery Data and Comparisons
Independent Fiscal Office Page 13
An interstate comparison for instant ticket sales
reveals:
In terms of per capita sales and profits,
Pennsylvania ranked 5th and 7
th highest re-
spectively. The rank using personal income
was slightly higher (4th).
Massachusetts and Georgia have very high
penetration rates using either metric. The
high penetration rate for Massachusetts may
be due to the large influx of non-residents
who work and visit the state. Both states
have high payout rates.
Compared to the weighted average for all
comparison states (bottom of Table 5),
Pennsylvania has a somewhat higher pene-
tration rate using either the per capita or per-
sonal income metric.
Numbers and Lotto Games
For Pennsylvania, numbers and lotto games
comprise slightly more than one-third of total
lottery sales. This category includes the Daily
Number, Big 4, Cash 5, Quinto, Match 6, Treas-
ure Hunt, Powerball, Power Play, Mega Millions
and Megaplier.
Table 2 from the previous section illustrates the
long-term trend decline of both numbers and in-
state lotto games. This trend generally holds for
most states. Lottery consumers have shifted to-
wards instant tickets due to the quick gratifica-
tion, multi-tiered prize structure and high payout
rates. In addition, new players are more inclined
to make impulse buys of instant tickets or play
multi-state lotto games that offer very large
jackpots.
The sales shift to instant tickets has a dispropor-
tionate impact on lottery profit margins because
the payout rates are considerably higher com-
pared to numbers and lotto games. For compari-
son states, the weighted average payout rate was
70.1 percent for instant tickets. For numbers and
lotto games, it was 51.6 percent. (See bottom of
Tables 5 and 6.)
An interstate comparison of numbers and lotto
games reveals (see Table 6):
Pennsylvania ranked 7th in per capita sales
($137.0) and 6th in profits ($68.9). Similar
results were obtained using the personal in-
come metric.
Three states adjacent to Pennsylvania rank
highest in per capita sales: New York
($180.6), New Jersey ($196.3) and Mary-
land ($167.3).
For some states, the personal income metric
can change relative rankings. For example,
Connecticut ranks 4th using the per capita
metric, but 11th or 12
th using the personal in-
come metric. The choice of metric does not
affect Pennsylvania.
Compared to the weighted average for all
comparison states, Pennsylvania has some-
what higher penetration rates using the per
capita and personal income metrics.
All Lottery Games
Table 7 combines the data from Tables 5 and 6
to derive total lottery sales by state. The table
also includes Keno and other miscellaneous lot-
tery games that are unique to certain states.23
For
ease of exposition, the analysis only uses the per
capita sales and profit metrics. For the purpose
of this comparison, profits are the net revenues
or government transfers reported by state lotter-
ies in their income statement and aggregated by
LaFleur’s. The profit margin is equal to total
profits divided by total sales. The profit margin
is a function of the types of games offered by
state lotteries, payout rates, mandated minimum
returns and efficiency of operations.
23
Video lottery terminals and table games are ex-
cluded from all sales and profit tabulations.

Lottery Data and Comparisons
Page 14 Independent Fiscal Office
An interstate comparison of total sales and prof-
its reveals:
The inclusion of other lottery games and
products such as Keno does not alter
Pennsylvania’s relative ranking.
Pennsylvania recorded the 7th highest
profit margin.
Massachusetts and Georgia rank highest in
per capita sales due to the large volume of
instant ticket sales. These two states also
have the highest instant ticket payout rate.
Pennsylvania per capita sales ($368.8) and
profits ($106.4) are somewhat higher than
the weighted averages for all comparison
states.
Although Table 7 ranks states based on profit
margin, a high rank need not signal efficient op-
erations or an optimal game portfolio. Most state
lotteries have discretion over payout rates, espe-
cially for instant tickets. In theory, lottery au-
thorities could adjust payout rates to maximize
net revenues. Data are not available to determine
whether states have adjusted payout rates to
achieve that outcome. In many cases, a lower
profit margin will yield a higher level of dollar
profits.
Table 6
Numbers and Lotto Games Sales and Profits FY 2012-13
Total Payout Per Capita
Share of Personal Income
Sales1 Rate2 Sales Rank Profit3 Rank
Sales Rank Profit3 Rank
Florida $1,985 49.6%
$128.0 9 $64.5 9
0.25% 5 0.12% 5
New York 2,775 51.0
180.6 2 88.5 2
0.26 4 0.13 4
Pennsylvania 1,374 49.7
137.0 7 68.9 6
0.24 7 0.12 6
Illinois 1,073 48.0
109.2 13 56.8 11
0.18 14 0.09 12
Ohio 972 53.8
109.2 12 50.5 12
0.21 9 0.10 10
Michigan 1,099 53.8
144.1 5 66.6 8
0.29 1 0.13 3
North Carolina 678 50.0
89.9 15 44.9 14
0.18 13 0.09 13
Georgia 1,076 51.7
143.7 6 69.4 5
0.29 2 0.14 1
New Jersey 1,347 50.1
196.3 1 98.0 1
0.27 3 0.14 2
Virginia 786 50.1
123.0 11 61.4 10
0.20 11 0.10 9
Massachusetts 662 60.0
125.3 10 50.1 13
0.18 15 0.07 15
Tennessee 272 50.4
54.4 20 27.0 18
0.11 19 0.05 18
Indiana 275 52.2
55.4 18 26.5 19
0.11 18 0.05 19
Missouri 313 56.6
67.5 16 29.3 16
0.13 16 0.06 16
Maryland 766 56.0
167.3 3 73.6 3
0.24 6 0.11 8
Wisconsin 216 50.4
48.7 21 24.2 21
0.09 21 0.04 21
Minnesota 186 48.9
45.0 22 23.0 22
0.07 22 0.04 22
Kentucky 313 55.6
92.8 14 41.2 15
0.20 10 0.09 14
Connecticut 425 51.6
151.8 4 73.5 4
0.20 12 0.10 11
Iowa 137 53.0
58.0 17 27.2 17
0.10 20 0.05 20
West Virginia 81 55.0
54.7 19 24.6 20
0.12 17 0.06 17
Delaware 96 50.0
134.4 8 67.2 7
0.23 8 0.12 7
All States4 16,904 51.6
121.4 n.a. 58.8 n.a.
0.21 n.a. 0.10 n.a.
1 Millions of dollars. Includes 3, 4, and 5 digit numbers games, raffles and all in-state and multi-state lottery games. Source:
LaFleurs’s 2012-13 Unaudited Lottery Fiscal Sales Report. 2 Based on FY 2011-12 payout rates. Source: 2012 NASPL Resource Index.
3 Profit is equal to the residual amount after payout. Excludes miscellaneous expenses and commissions.
4 Comparison states only.

Lottery Data and Comparisons
Independent Fiscal Office Page 15
Table 7
All Lottery Games1
FY 2012-13
Instant Numbers All Total
Total Profit
Per Capita
Tickets & Lotto Keno Other2 Sales
Profits3 Margin Rank
Sales Rank Profits Rank
Florida $3,029 $1,984 $0 $0 $5,013
$1,417 28.3% 11
$323.4 9 $91.4 9
New York 3,724 2,775 580 30 7,109
2,165 30.5 5
462.6 3 140.9 2
Pennsylvania 2,305 1,374 0 20 3,700
1,067 28.9 7
368.8 7 106.4 7
Illinois 1,768 1,073 0 0 2,841
804 28.3 10
289.3 11 81.9 11
Ohio 1,430 972 250 43 2,695
748 27.7 13
303.0 10 84.1 10
Michigan 819 1,099 553 0 2,471
749 30.3 6
324.0 8 98.1 8
North Carolina 1,012 678 0 0 1,690
480 28.4 9
224.1 16 63.6 16
Georgia 2,631 1,076 190 16 3,912
928 23.7 21
522.5 2 123.9 4
New Jersey 1,474 1,347 0 0 2,821
925 32.8 3
411.1 4 134.8 3
Virginia 887 786 0 17 1,689
487 28.8 8
264.5 13 76.2 12
Massachusetts 3,343 662 825 1 4,832
952 19.7 22
914.7 1 180.2 1
Tennessee 1,089 272 0 0 1,361
340 25.0 18
272.4 12 68.0 14
Indiana 615 275 0 44 934
225 24.0 20
187.9 18 45.2 19
Missouri 759 313 65 4 1,141
289 25.3 16
246.3 15 62.3 17
Maryland 486 766 345 160 1,756
550 31.3 4
383.9 5 120.2 5
Wisconsin 324 216 0 26 566
145 25.6 15
127.9 22 32.8 21
Minnesota 364 186 0 10 560
135 24.1 19
135.6 20 32.7 22
Kentucky 522 313 0 11 847
224 26.4 14
250.9 14 66.3 15
Connecticut 667 425 0 30 1,123
312 27.8 12
400.9 6 111.5 6
Iowa 202 137 0 0 339
85 25.0 17
143.6 19 35.9 20
West Virginia 109 81 6 0 196
68 34.6 1
131.7 21 45.5 18
Delaware 48 96 2 0 146
50 34.3 2
205.7 17 70.6 13
All States4 27,607 16,904 2,817 414 47,742
13,142 27.5 n.a.
342.8 n.a. 94.4 n.a.
1 Numbers are millions of dollars, except per capita measures. 2 Includes raffles, certain regional games and miscellaneous games. 3 Excludes profits from video lottery terminals and table games. Profits are net of all expenses and commissions. 4 Comparison states only.
Source: LaFleur’s FY 2012-13 Unaudited Lottery Fiscal Sales Report.

Lottery Data and Comparisons
Page 16 Independent Fiscal Office
Lottery Retailers
All state lotteries partner with retailers to display
and sell lottery products. Retail outlets may in-
clude gas stations, convenience stores, grocery
and liquor stores, restaurants, bars and depart-
ment stores. Retailers receive a commission
based on total dollar sales. In general, more ex-
tensive retail operations will increase lottery
penetration rates or per capita sales. Other im-
portant factors include the mix of retail outlets,
the placement and visual appeal of lottery dis-
plays and the utilization of automated technolo-
gy such as ITVMs and PCTs.
Table 8 displays the number of residents age 18
or older per retailer, average retailer sales and
retailer commissions. An interstate comparison
reveals:
For FY 2011-12 (latest data available),
Pennsylvania ranked 15th in retailer penetra-
tion, with one retailer per 1,103 residents
age 18 or older. States with strong instant
tickets sales (e.g., Massachusetts and Geor-
gia) ranked high.
In terms of average dollar sales volume,
Pennsylvania retailers rank 6th highest. The
average retailer reported $383,000 in total
sales.
Table 8
Retailer Data FY 2011-12
Number Residents
Total Average
Commission
Retailers Per Retailer Rank
Sales1 Sales Rank
Sales2 Cashing
Florida 13,939 1,099 13
$4,450 319,214 8
5.0% 1.0%
New York 17,100 895 4
7,013 410,099 5
6.0 n.a.
Pennsylvania 9,087 1,103 15
3,481 383,063 6
5.0 n.a.
Illinois 9,153 1,072 12
2,671 291,773 10
5.0 1.0
Ohio 9,400 945 7
2,738 291,273 11
5.5 1.0
Michigan 10,879 700 1
2,413 221,846 17
6.0 n.a.
North Carolina 6,789 1,100 14
1,597 235,186 15
7.0 n.a.
Georgia 8,518 872 3
3,835 450,188 2
6.0 n.a.
New Jersey 6,700 1,021 10
2,759 411,776 4
5.0 1.3
Virginia 5,125 1,235 19
1,616 315,317 9
5.0 1.0
Massachusetts 7,400 709 2
4,725 638,509 1
5.0 1.0
Tennessee 4,983 996 8
1,311 263,135 14
6.5 n.a.
Indiana 3,935 1,257 20
856 217,427 18
6.0 1.0
Missouri 4,938 935 6
1,098 222,256 16
5.0 2.0
Maryland 4,260 1,066 11
1,795 421,336 3
5.0 3.0
Wisconsin 3,674 1,200 18
544 148,127 21
6.0 n.a.
Minnesota 3,123 1,314 21
520 166,516 19
5.5 1.0
Kentucky 2,835 1,186 17
824 290,494 12
6.2 1.0
Connecticut 3,041 920 5
1,082 355,719 7
5.0 n.a.
Iowa 2,350 1,001 9
311 132,272 22
6.4 n.a.
West Virginia 1,287 1,143 16
206 160,202 20
7.0 1.0
Delaware 500 1,424 22
133 265,296 13
5.0 1.0
All States3 139,016 997 n.a.
45,975 330,718 n.a.
5.7 n.a.
1 Millions of dollars. Includes instant ticket, numbers, lotto and miscellaneous games and Keno. Excludes video lottery terminal
sales. 2 Base sales commission only. Effective commission for Pennsylvania is 5.28% if all retailer incentives included.
3 Comparison states only.
Source: 2012 NASPL Resource Index and LaFleur’s Fast Facts 2013.

Lottery Data and Comparisons
Independent Fiscal Office Page 17
The base retailer commission is 5.0 percent
for Pennsylvania, which is on the lower end
of the commission range. Many states also
offer a 1.0 percent (or higher) cashing com-
mission; Pennsylvania does not. Higher
commissions encourage retailer participa-
tion, but reduce net profits on sales.24
24
A cashing commission is a payment to compensate
retailers for redeeming prizes under certain dollar
thresholds.

Lottery Data and Comparisons
Page 18 Independent Fiscal Office
- This page was intentionally left blank. -

Lottery Data and Comparisons
Independent Fiscal Office Page 19
Lottery Outlook
Lottery profits support many programs for elder-
ly residents of Pennsylvania such as property tax
and rent rebates, pharmaceutical subsidies and
free transportation. Demographic data suggest
that the demand for these programs will grow
quickly over the next decade. The Pennsylvania
State Data Center projects that the number of
residents age 65 or older will increase by 20.7
percent from 2013 to 2020 (2.7 percent per an-
num).25
If the cost to provide services increases
by 2.0 percent per annum and residents who
need services grow at the same rate as demo-
graphic projections, then expenditures must in-
crease by roughly 4.7 percent per annum to
maintain current levels of service.
Hence, an important issue for policymakers is
whether lottery profits will be sufficient to sup-
port future needs. Since FY 2004-05, the data
from Table 1 show that net revenues have in-
creased at an average rate of 2.9 percent per an-
num. Since FY 2009-10, the average growth rate
has been higher (5.2 percent per annum). To
maintain current levels of service, the Lottery
must raise penetration rates and reproduce the
strong growth achieved the past three years.
Whether that type of growth is achievable re-
mains unclear. Certain challenges will need to
be overcome. The subsection that follows out-
lines these challenges. The second subsection
concludes with a brief analysis of potential lot-
tery expansion through Keno.
Challenges to Sales and Profit Growth
Six challenges exist that may restrain future lot-
tery sales and profit growth. They are as follows:
25
For demographic projections, see Pennsylvania’s
Economic and Budget Outlook: FY 2013-14 to FY
2018-19, Independent Fiscal Office, November 2013.
Lottery prices do not increase automatically over
time.
Unlike other goods and services, most prices of
lottery products generally do not change over
time; they do not increase automatically due to
inflation. Therefore, any sales gain from higher
prices must arise from customers who migrate to
higher price points (e.g., the purchase of a $5
instant ticket instead of a $2 ticket), but do not
simultaneously compensate by reducing their
volume of purchases.
Due to the lack of automatic inflationary price
gains, lottery sales growth must rely more on
higher volume compared to other products. It
may prove difficult to continually increase sales
volume because long-term factors that motivate
volume growth are beyond the Lottery’s control.
For example, if per capita sales or penetration
rates do not change, then dollar sales should in-
crease by the growth of the resident population
age 18 or older, roughly 0.6 percent per annum.
Higher levels of disposable income due to an
expanding economy may increase sales another
1.0 percent per annum (discussed below), for
total growth of 1.6 percent per annum. That
baseline growth rate is motivated by broad eco-
nomic and demographic trends beyond the con-
trol of the Lottery.
In order to generate sales growth above that lev-
el, the Lottery must increase the intensity of play
by new and current customers (i.e., they spend a
larger share of their disposable income on lottery
products) or a higher proportion of residents
must play the lottery. The interstate comparison
from the previous section suggests that the Lot-
tery can achieve higher penetration rates, but it
is also likely that higher rates will be incremen-
tally harder to achieve.

Lottery Data and Comparisons
Page 20 Independent Fiscal Office
The long-term decline of higher profit numbers
and in-state lotto games.
Similar to other states, sales of numbers and in-
state lotto games have declined during the past
decade, while instant ticket sales have increased
dramatically. The Lottery reports that the aver-
age payout for instant tickets is roughly 70 per-
cent, while the average payout for numbers and
lotto games is closer to 50 percent. As shown by
Table 1, instant tickets comprise an increasing
share of total sales, and the share has increased
by approximately one percent per annum for
recent years. If lottery sales continue to shift in
this manner, then sales must increase at a faster
rate to achieve the same growth in net revenues.
Small Games of Chance (House Bill 1098 of
2013).
It is unclear whether the recent expansion of
small games of chance to bars, restaurants and
taverns will have an impact on lottery sales. The
products may be sufficiently different so that
any impact will be relatively minor. However,
many bars, restaurants and taverns also sell lot-
tery products, and some sales shift seems plausi-
ble. For FY 2014-15, the Department of Reve-
nue estimates that small games of chance will
generate $156 million of revenues for the Com-
monwealth due to the 60 percent tax levied on
gross wagers ($260 million). If the impact in-
cludes a ten percent sales shift from lottery
products, then that implies a $26 million reduc-
tion in lottery sales. Currently, it is unclear how
small games of chance will affect lottery sales.
Demographic trends.
Research finds that the share of adults who pur-
chase lottery products generally peaks for adults
age 35 to 54. Participation rates decline modest-
ly for the 55 to 64 year age cohort, but then de-
cline rapidly for individuals age 65 or older.26
26
Barnes et al. “Gambling on the Lottery: Sociodem-
ographic Correlates Across the Lifespan,” Journal of
Hence, the aging of the baby boom generation
may place additional pressure on lottery sales.
On the opposite side of the age spectrum, some
lottery officials have noted that it has become
increasingly difficult to entice young adults to
participate in the lottery.
Lower incremental gains from retail expansion.
Over the past decade, the deployment of ITVMs
and PCTs throughout the state has been a major
factor in the strong growth of instant ticket sales.
Pennsylvania is at the forefront of states that use
automated technology to sell lottery products.
However, as penetration rates increase over
time, it becomes more likely that new place-
ments of machines will generate lower incre-
mental sales gains compared to existing ma-
chines. Although productive placements remain,
prior placements are likely to yield higher aver-
age returns. If new machines yield lower incre-
mental gains, then it becomes more difficult to
replicate recent growth rates.
Modest growth of disposable income.
Like other goods and services, lottery purchases
generally increase with disposable (i.e., after
tax) income. Research finds that lottery purchas-
es at the national level are an “inelastic” good: if
disposable income increases by one percent,
then lottery purchases will increase by less than
one percent.27
To confirm this finding for Pennsylvania, the
Independent Fiscal Office used a regression
analysis to estimate how per capita lottery sales
have responded to changes in per capita or aver-
age disposable income. The regression analysis
controls for the number of retailers and the gen-
eral increase in residents over time, but it cannot
Gambling Studies, (2011) 27; 575-586 and “Demo-
graphic Survey of Texas Lottery Players 2011,” Uni-
versity of Houston, Hobby Center for Public Policy. 27
Grote, Kent and Victor Matheson. “The Economics
of Lotteries: A Survey of the Literature,” College of
the Holy Cross, Department of Economics Faculty
Research Series, Paper No. 11-09. August 2011.

Lottery Data and Comparisons
Independent Fiscal Office Page 21
control for factors such as the popularity of
games or advertising campaigns.28
The analysis
suggests that a 1.0 percent increase in per capita
disposable income increases per capita lottery
sales by roughly 0.2 to 0.4 percent. These find-
ings are generally consistent with studies of lot-
tery sales for the U.S.
Currently, the forecast projects that average or
per capita disposable income will increase at a
rate of 4.0 percent per annum through 2020. If
the results from the regression analysis hold,
then lottery sales would increase by roughly one
quarter of that rate, or 1.0 percent per annum,
solely due to higher disposable income. Normal
population growth (i.e., the gain from a larger
pool of potential players due to new players
reaching legal purchase age and migration into
the state) would further increase total sales
growth to roughly 1.6 percent per annum. As
noted, sales growth above that level must origi-
nate from higher intensity of sales to new and
current players (i.e., they spend a larger share of
their disposable income on lottery products) or a
higher proportion of residents must play the lot-
tery.
Potential Expansion through Keno
During the past decade, the Lottery has em-
ployed various methods to increase sales. Suc-
cessful methods include the expansion of the
retailer network, the deployment of ITVMs and
28
The equation uses per capita sales as the dependent
variable and number of residents per retailer and per
capita disposable income as explanatory variables.
The time frame is 2003 Q3 to 2013 Q4.
PCTs, the upgrade of vendor displays, advertis-
ing campaigns and new game offerings. Another
possible method to augment sales is the expan-
sion of the lottery product line to Keno.
Currently, 15 states and the District of Columbia
offer some form of Keno. In order to gauge the
potential for Keno sales in the Commonwealth,
Table 9 compares sales of lottery products for
Pennsylvania and select comparison states that
offer Keno. Dollar amounts represent gross sales
before prize payouts. Notable results include:
For FYs 2007-13 (pre-recession start) and
FYs 2010-13 (post-recession start), the aver-
age growth rate of Pennsylvania lottery sales
compares favorably to the five comparison
states that offer Keno.
For comparison states, Keno comprises
roughly 10 to 30 percent of total sales.29
Keno is sufficiently different than other lot-
tery products so that it has unique growth
rates. Unlike some instant ticket and draw
games, Keno recorded positive sales growth
across all states despite the severe recession.
For FY 2012-13, Maryland lottery officials
noted that casino openings harmed lottery
sales (including Keno). Instant ticket and
draw games also recently declined in Ohio
due to casino openings, but Keno growth
remained robust.
29
Maryland data include Racetrax and Racetrax Bo-
nus. Racetrax is a computer animated monitor game
where players select one of 12 horses to win. The
game is played in a social environment with drawings
held every four to five minutes. The game is included
with Keno due to the game environment and the fre-
quency of drawings.

Lottery Data and Comparisons
Page 22 Independent Fiscal Office
Table 9
Total Lottery Sales1
($ millions)
Fiscal Year Ending AAGR2
2007 2008 2009 2010 2011 2012 2013 2007-13 2010-13
Massachusetts
Instant Tickets $3,066 $3,341 $3,069 $3,016 $3,008 $3,252 $3,343 1.4% 3.5%
Draw Games 617 612 612 635 631 676 683 1.7 2.5
Keno 777 755 762 773 789 814 825 1.0 2.2
Total 4,461 4,709 4,443 4,424 4,428 4,742 4,851 1.4 3.1
Maryland
Instant Tickets 425 514 507 491 494 507 486 2.3 -0.3
Draw Games 690 700 708 724 724 766 777 2.0 2.4
Keno 462 460 483 492 497 522 494 1.1 0.1
Total 1,577 1,673 1,698 1,707 1,715 1,795 1,756 1.8 1.0
Michigan
Instant Tickets 718 734 749 751 739 772 827 2.4 3.3
Draw Games 1,134 1,069 1,108 1,118 1,100 1,116 1,115 -0.3 -0.1
Keno 491 527 520 491 501 526 534 1.4 2.9
Total 2,343 2,330 2,378 2,359 2,340 2,413 2,476 0.9 1.6
New York
Instant Tickets 3,602 3,594 3,666 3,611 3,546 3,579 3,724 0.6 1.0
Draw Games 2,605 2,635 2,605 2,758 2,788 2,931 2,805 1.2 0.6
Keno 445 444 424 412 424 502 580 4.5 12.1
Total 6,652 6,673 6,695 6,781 6,758 7,012 7,109 1.1 1.6
Ohio
Instant Tickets 1,354 1,365 1,349 1,379 1,463 1,508 1,428 0.9 1.2
Draw Games 906 960 969 991 980 1,022 1,018 2.0 0.9
Keno 0 0 100 121 158 210 252 n.a. 27.8
Total 2,259 2,325 2,418 2,490 2,601 2,739 2,698 3.0 2.7
Pennsylvania
Instant Tickets 1,704 1,707 1,758 1,749 1,922 2,135 2,305 5.2 9.6
Draw Games 1,373 1,383 1,331 1,317 1,286 1,346 1,395 0.3 1.9
Keno 0 0 0 0 0 0 0 n.a. n.a.
Total 3,076 3,089 3,088 3,066 3,208 3,481 3,700 3.1 6.5
1 Excludes video lottery terminals and table games. Draw games include all games except instant tickets and Keno. 2 Average annual growth rate.
Source: State lottery income statements, various years.
Lottery Data and Comparisons
Independent Fiscal Office Page 23
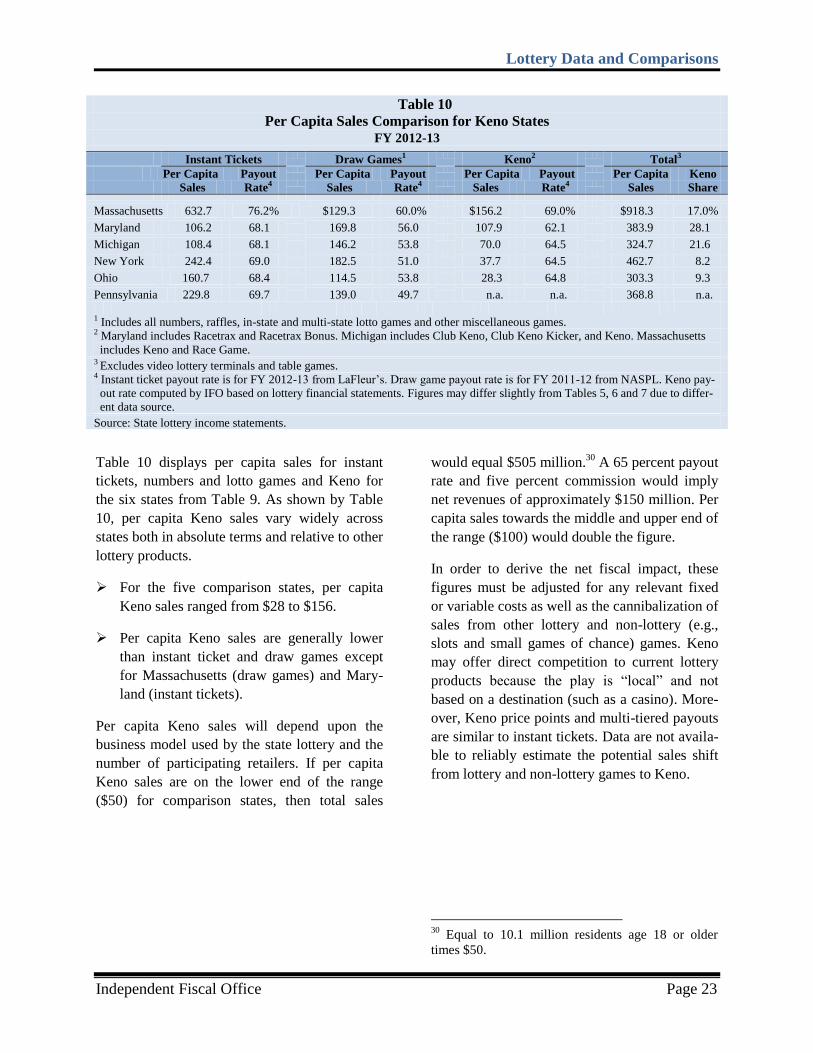
Table 10 displays per capita sales for instant
tickets, numbers and lotto games and Keno for
the six states from Table 9. As shown by Table
10, per capita Keno sales vary widely across
states both in absolute terms and relative to other
lottery products.
For the five comparison states, per capita
Keno sales ranged from $28 to $156.
Per capita Keno sales are generally lower
than instant ticket and draw games except
for Massachusetts (draw games) and Mary-
land (instant tickets).
Per capita Keno sales will depend upon the
business model used by the state lottery and the
number of participating retailers. If per capita
Keno sales are on the lower end of the range
($50) for comparison states, then total sales
would equal $505 million.30
A 65 percent payout
rate and five percent commission would imply
net revenues of approximately $150 million. Per
capita sales towards the middle and upper end of
the range ($100) would double the figure.
In order to derive the net fiscal impact, these
figures must be adjusted for any relevant fixed
or variable costs as well as the cannibalization of
sales from other lottery and non-lottery (e.g.,
slots and small games of chance) games. Keno
may offer direct competition to current lottery
products because the play is “local” and not
based on a destination (such as a casino). More-
over, Keno price points and multi-tiered payouts
are similar to instant tickets. Data are not availa-
ble to reliably estimate the potential sales shift
from lottery and non-lottery games to Keno.
30
Equal to 10.1 million residents age 18 or older
times $50.
Table 10
Per Capita Sales Comparison for Keno States
FY 2012-13
Instant Tickets
Draw Games1
Keno2
Total3
Per Capita Payout
Per Capita Payout
Per Capita Payout
Per Capita Keno
Sales Rate4
Sales Rate4
Sales Rate4
Sales Share
Massachusetts 632.7 76.2%
$129.3 60.0%
$156.2 69.0%
$918.3 17.0%
Maryland 106.2 68.1
169.8 56.0
107.9 62.1
383.9 28.1
Michigan 108.4 68.1
146.2 53.8
70.0 64.5
324.7 21.6
New York 242.4 69.0
182.5 51.0
37.7 64.5
462.7 8.2
Ohio 160.7 68.4
114.5 53.8
28.3 64.8
303.3 9.3
Pennsylvania 229.8 69.7
139.0 49.7
n.a. n.a.
368.8 n.a.
1 Includes all numbers, raffles, in-state and multi-state lotto games and other miscellaneous games.
2 Maryland includes Racetrax and Racetrax Bonus. Michigan includes Club Keno, Club Keno Kicker, and Keno. Massachusetts
includes Keno and Race Game. 3 Excludes video lottery terminals and table games.
4 Instant ticket payout rate is for FY 2012-13 from LaFleur’s. Draw game payout rate is for FY 2011-12 from NASPL. Keno pay-
out rate computed by IFO based on lottery financial statements. Figures may differ slightly from Tables 5, 6 and 7 due to differ-
ent data source.
Source: State lottery income statements.