the perfect investment - nyupages.stern.nyu.edu/~iag/presentations/2006-2007/gcm.pdf · –open pit...
TRANSCRIPT
1
Presented by Krish Daftary
TSX: GCM, Pink Sheets: GEMCF
The Perfect Investment
Operational momentum
Long-term business sustainability, predictability, and visibility
Price that allows for a significant margin of safety
2
Understanding the Business
What does Gemcom do?
Provides software solutions that help its customers
manage the lifecycle of their mining operations
including:
• Drill-hole data entry in exploration phase
• Mining design & planning
• Mine operations & production management

3
How Does Mining Work?
• Two main types:– Open pit mining
– Underground Mining
• Extract tons of ore from the ground
• Extract tiny bits of precious/base metals– i.e. 1 g/ton
• Timing & efficiency matter!
Revenue Sources
• License fees: one-time in nature
• Professional Services
• Update Service & Technical Support (USTS): recurring in nature, renewed semi-annually or annually
BREAKDOWN TO COME
4
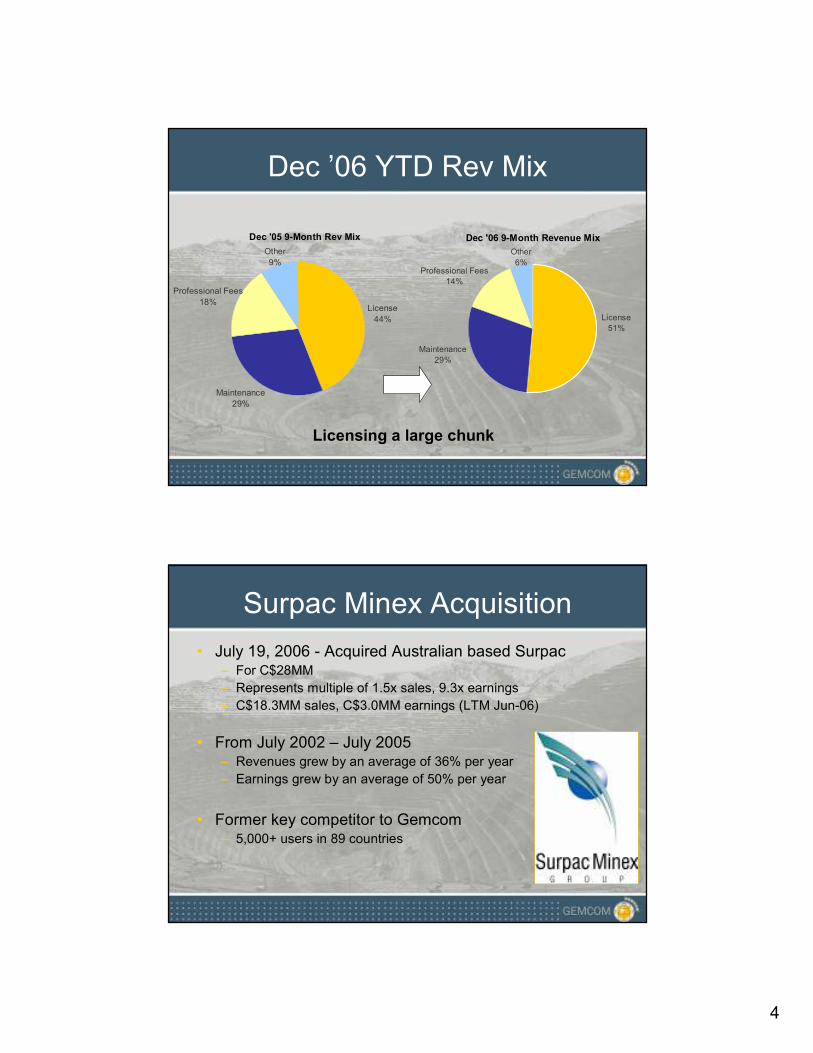
Dec ’06 YTD Rev Mix
Dec '06 9-Month Revenue Mix
Maintenance
29%
Professional Fees
14%
Other
6%
License
51%
Licensing a large chunk
Dec '05 9-Month Rev Mix
License
44%
Maintenance
29%
Professional Fees
18%
Other
9%
Surpac Minex Acquisition
• July 19, 2006 - Acquired Australian based Surpac– For C$28MM
– Represents multiple of 1.5x sales, 9.3x earnings
– C$18.3MM sales, C$3.0MM earnings (LTM Jun-06)
• From July 2002 – July 2005– Revenues grew by an average of 36% per year
– Earnings grew by an average of 50% per year
• Former key competitor to Gemcom– 5,000+ users in 89 countries
5
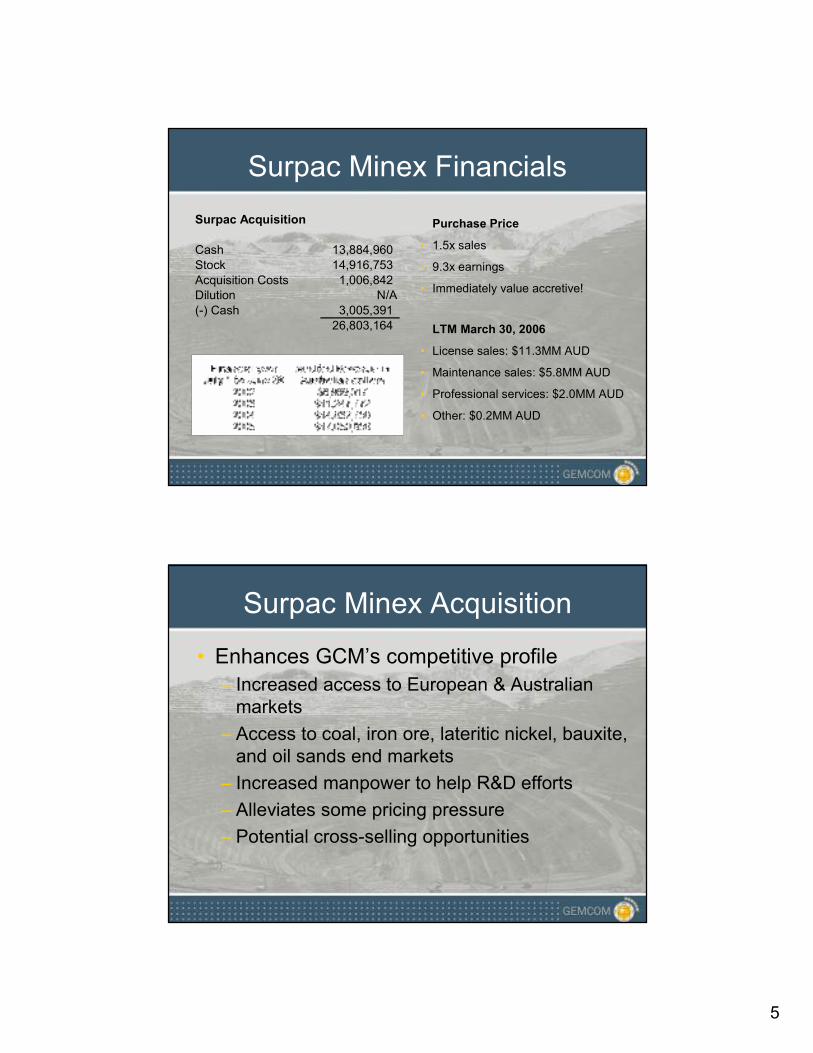
Surpac Minex Financials
LTM March 30, 2006
• License sales: $11.3MM AUD
• Maintenance sales: $5.8MM AUD
• Professional services: $2.0MM AUD
• Other: $0.2MM AUD
Surpac Acquisition
Cash 13,884,960
Stock 14,916,753
Acquisition Costs 1,006,842Dilution N/A
(-) Cash 3,005,391
26,803,164
Purchase Price
• 1.5x sales
• 9.3x earnings
• Immediately value accretive!
Surpac Minex Acquisition
• Enhances GCM’s competitive profile
– Increased access to European & Australian markets
– Access to coal, iron ore, lateritic nickel, bauxite, and oil sands end markets
– Increased manpower to help R&D efforts
– Alleviates some pricing pressure
– Potential cross-selling opportunities
6
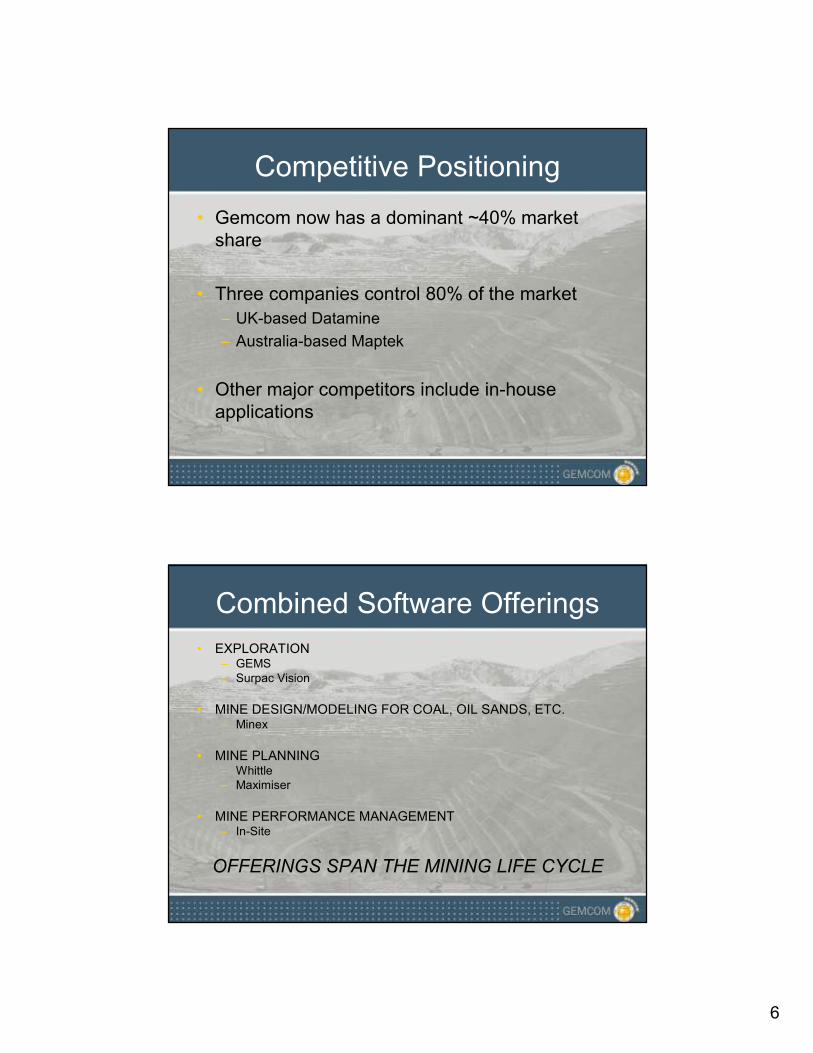
Competitive Positioning
• Gemcom now has a dominant ~40% market share
• Three companies control 80% of the market
– UK-based Datamine
– Australia-based Maptek
• Other major competitors include in-house applications
Combined Software Offerings
• EXPLORATION– GEMS– Surpac Vision
• MINE DESIGN/MODELING FOR COAL, OIL SANDS, ETC.– Minex
• MINE PLANNING– Whittle– Maximiser
• MINE PERFORMANCE MANAGEMENT– In-Site
OFFERINGS SPAN THE MINING LIFE CYCLE

7
Visuals
MineSched
Minex
Major Customers Covered
$15B
$20B$14B
$17B$25B
$139B

8
Mining Industry Overview
Gold Pricing

9
Silver Pricing
Copper Pricing
10
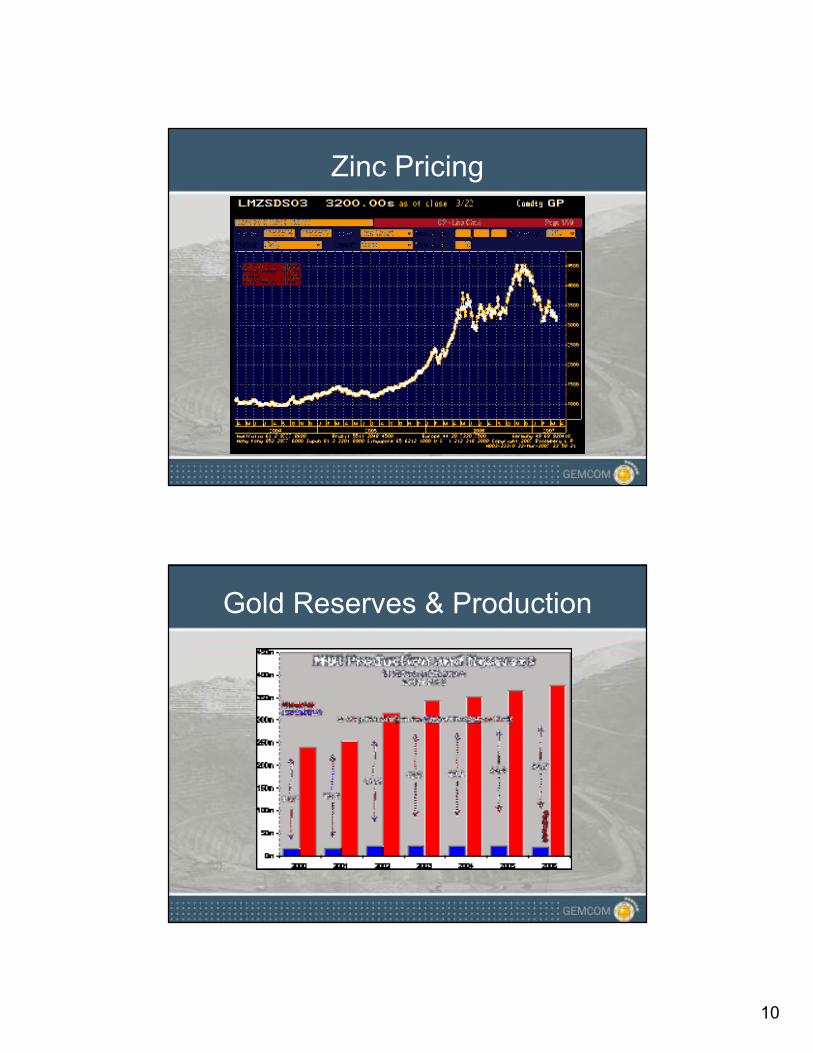
Zinc Pricing
Gold Reserves & Production
11
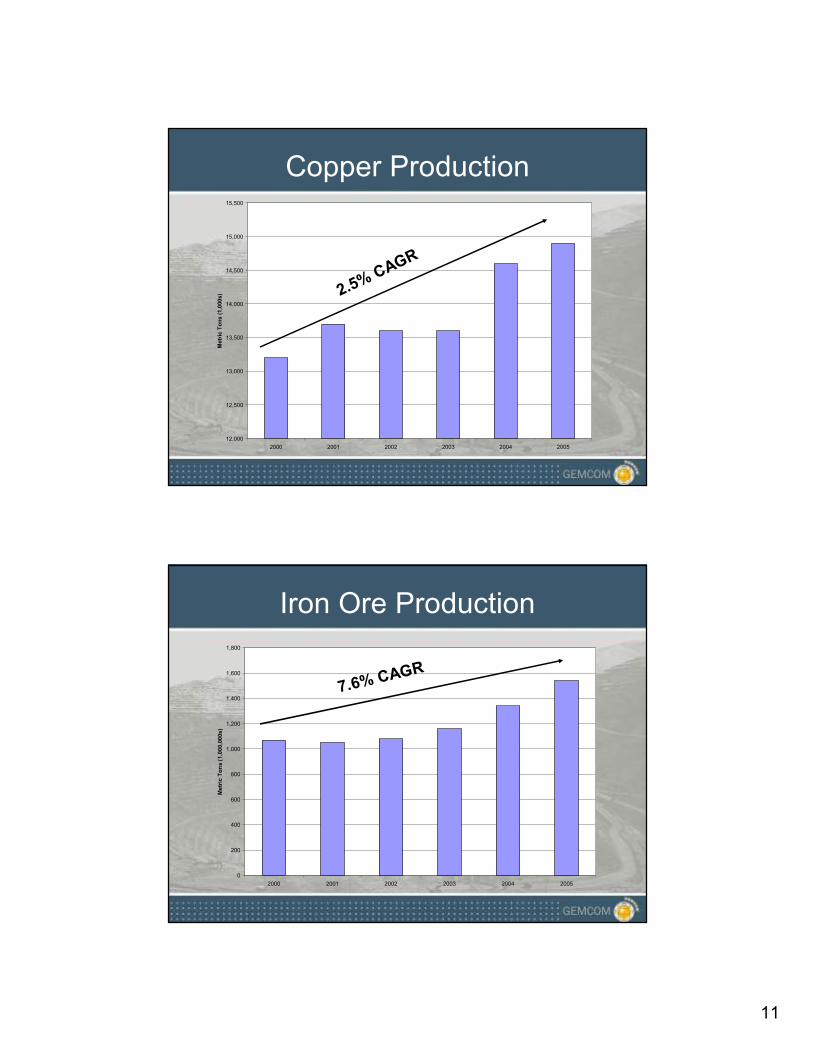
Copper Production
12,000
12,500
13,000
13,500
14,000
14,500
15,000
15,500
2000 2001 2002 2003 2004 2005
Metric Tons (1,000s) 2.5
% CA
GR
Iron Ore Production
0
200
400
600
800
1,000
1,200
1,400
1,600
1,800
2000 2001 2002 2003 2004 2005
Metric Tons (1,000,000s)
7.6% CAG
R

12
Pricing/Production: GoldGold Price vs. Production 1970-2005
0
500
1,000
1,500
2,000
2,500
3,000
1970 1975 1980 1985 1990 1995 2000 2005
0
5,000,000
10,000,000
15,000,000
20,000,000
25,000,000
Production
Price ($/t)
Pricing/Production: CopperCopper Price vs. Production 1970-2005
0
2,000,000
4,000,000
6,000,000
8,000,000
10,000,000
12,000,000
14,000,000
16,000,000
1970 1975 1980 1985 1990 1995 2000 2005
0
500
1000
1500
2000
2500
3000
3500
4000
Production
Price ($/t)

13
Pricing/Production: Iron OreIron Ore Price vs. Production 1970-2005
0
200,000,000
400,000,000
600,000,000
800,000,000
1,000,000,000
1,200,000,000
1,400,000,000
1,600,000,000
1,800,000,000
1970 1975 1980 1985 1990 1995 2000 2005
0
5
10
15
20
25
30
35
40
45
50
Production
Price ($/t)
Financial Metrics

14
Price of GCM
Price/share 2.00Shares Outstanding 50,401,412
(+) Dilution 3,827,562Total Shares Outstanding 54,228,974
Market Capitalization 108,457,948
(-) Cash 10,224,370(+) Debt 260,234(+) Minority Interest 23,975
Enterprise Value 98,517,787
Last Q Gangbuster
• Acquisition accounted for 62% of growth
• Organic growth accounted for remaining 38% of increase in revenue
• Implies 56.2% organic
growth rate!
• Annualized, Surpac revenue totals C$16.9MM
3 Months
Dec-06 Dec-05
Revenue:
Products and services 11,055,990 4,575,348
Third-party products 360,596 30,108Total revenue 11,416,586 4,605,456
% Growth 147.9%
Cost of revenue 2,273,780 739,315Gross margin 9,142,806 3,866,141
% Margin 80.1% 83.9%
Research and development 2,491,167 1,007,355
Sales and marketing 3,873,253 1,821,495
General and administration 416,672 327,382EBITDA 2,549,758 860,052
% Margin 22.3% 18.7%
% Growth 196.5%
BreakdownLicense 6.2 2.1 % Growth 195.2%
Maintenance 3.1 1.3 % Growth 138.5%Professional Fees 1.6 0.7
% Growth 128.6%Other 0.5 0.5 % Growth 0
Total 16.0 4.6 % Growth 248.3%
15
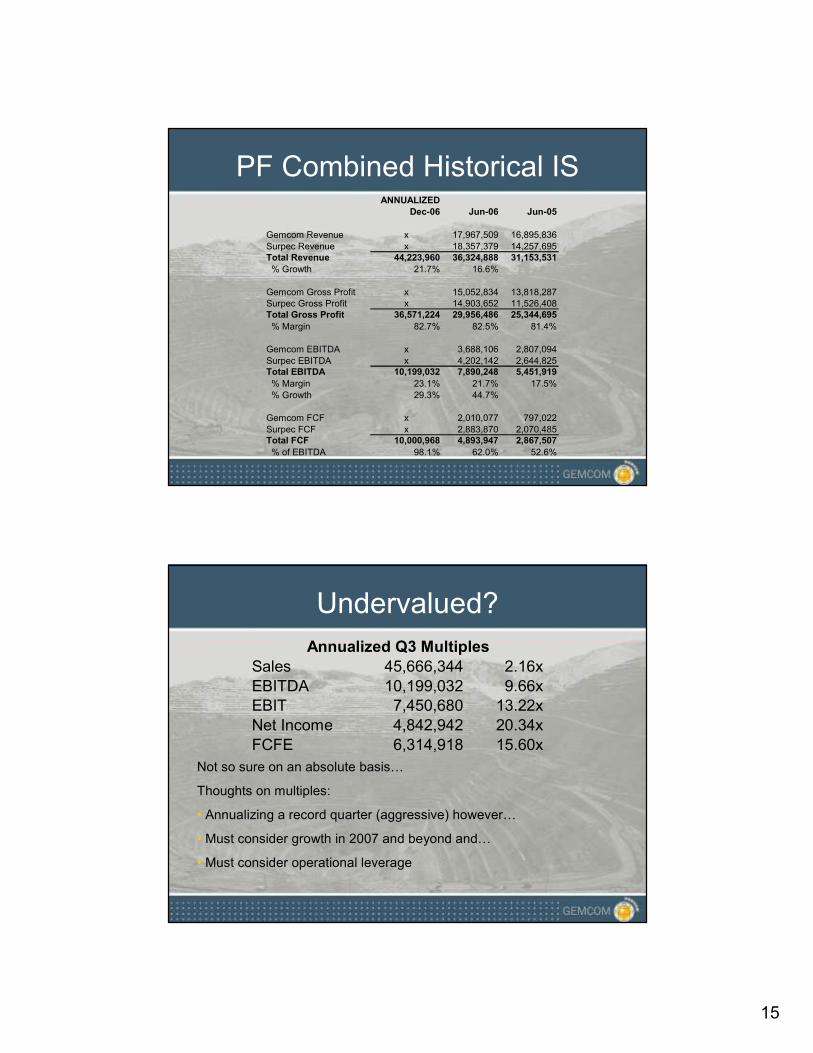
PF Combined Historical ISANNUALIZED
Dec-06 Jun-06 Jun-05
Gemcom Revenue x 17,967,509 16,895,836
Surpec Revenue x 18,357,379 14,257,695Total Revenue 44,223,960 36,324,888 31,153,531
% Growth 21.7% 16.6%
Gemcom Gross Profit x 15,052,834 13,818,287Surpec Gross Profit x 14,903,652 11,526,408Total Gross Profit 36,571,224 29,956,486 25,344,695
% Margin 82.7% 82.5% 81.4%
Gemcom EBITDA x 3,688,106 2,807,094
Surpec EBITDA x 4,202,142 2,644,825Total EBITDA 10,199,032 7,890,248 5,451,919
% Margin 23.1% 21.7% 17.5%
% Growth 29.3% 44.7%
Gemcom FCF x 2,010,077 797,022
Surpec FCF x 2,883,870 2,070,485Total FCF 10,000,968 4,893,947 2,867,507
% of EBITDA 98.1% 62.0% 52.6%
Undervalued?
Annualized Q3 Multiples
Sales 45,666,344 2.16x
EBITDA 10,199,032 9.66xEBIT 7,450,680 13.22x
Net Income 4,842,942 20.34x
FCFE 6,314,918 15.60x
Not so sure on an absolute basis…
Thoughts on multiples:
• Annualizing a record quarter (aggressive) however…
• Must consider growth in 2007 and beyond and…
• Must consider operational leverage

16
Relative: EV/S
Slightly undervalued
2006 2007E 2008E
EV EV/R EV/R EV/R
Autodesk Inc. (NasdaqNM:ADSK) 10,123 6.0x 4.9x 4.3xBusiness Objects SA (NasdaqNM:BOBJ) 3,658 2.2x 1.9x 1.7x
Cognos Inc. (NasdaqNM:COGN) 3,532 3.0x 2.7x 2.5x
Dassault Systemes SA (ENXTPA:DSY) 6,695 3.8x 3.2x 2.6xHyperion Solutions Corp. (NasdaqNM:HYSL) 2,977 3.1x 2.7x 2.4x
Matrikon Inc. (TSX:MTK) 83 1.1x 1.0x ???
Open Text Corp. (NasdaqNM:OTEX) 1,611 3.6x 2.5x 2.2x
Average 4,097 3.3x 2.7x 2.6x
Median 3,532 3.1x 2.7x 2.5x
Gemcom Software International Inc. (TSX:GCM) 99 3.4x 2.2x ???
Relative: EV/EBITDA
Slightly undervalued
2006 2007E 2008E
EV TEV/EBITDA TEV/EBITDA TEV/EBITDA
Autodesk Inc. (NasdaqNM:ADSK) 10,123 17.8x 14.9x 12.9x
Business Objects SA (NasdaqNM:BOBJ) 3,658 11.3x 8.6x 7.7x
Cognos Inc. (NasdaqNM:COGN) 3,532 15.7x 11.7x 10.1xDassault Systemes SA (ENXTPA:DSY) 6,695 12.3x 10.7x 9.6x
Hyperion Solutions Corp. (NasdaqNM:HYSL) 2,977 14.2x 11.2x 9.5xMatrikon Inc. (TSX:MTK) 83 8.5x 6.3x ???
Open Text Corp. (NasdaqNM:OTEX) 1,611 13.2x 8.0x 6.9x
Average 4,097 13.3x 10.2x 9.4x
Median 3,532 13.2x 10.7x 9.5x
Gemcom Software International Inc. (TSX:GCM) 99 15.7x 9.7x ???

17
Relative: P/E
In-line
2006 2007E 2008E
EV P/E P/E P/E
Autodesk Inc. (NasdaqNM:ADSK) 10,123 31.6x 25.7x 20.7xBusiness Objects SA (NasdaqNM:BOBJ) 3,658 21.2x 16.7x 13.8x
Cognos Inc. (NasdaqNM:COGN) 3,532 24.7x 18.8x 16.2x
Dassault Systemes SA (ENXTPA:DSY) 6,695 22.6x 20.2x 17.2xHyperion Solutions Corp. (NasdaqNM:HYSL) 2,977 30.3x 25.1x 21.1x
Matrikon Inc. (TSX:MTK) 83 19.0x 17.1x ???
Open Text Corp. (NasdaqNM:OTEX) 1,611 23.3x 17.6x 13.8x
Average 4,097 24.7x 20.2x 17.1x
Median 3,532 23.3x 18.8x 16.7x
Gemcom Software International Inc. (TSX:GCM) 99 36.0x 22.4x ???
Relative: Growth Rates
Grossly undervalued
EV 1-Yr Revenue G 1-Yr EBITDA G Est. LT G Rate
Autodesk Inc. (NasdaqNM:ADSK) 10,123 24.25 21.74 16.80
Business Objects SA (NasdaqNM:BOBJ) 3,658 16.40 23.14 16.15
Cognos Inc. (NasdaqNM:COGN) 3,532 7.63 (2.49) 13.73
Dassault Systemes SA (ENXTPA:DSY) 6,695 23.89 14.19 9.85
Hyperion Solutions Corp. (NasdaqNM:HYSL) 2,977 15.12 29.02 13.09
Matrikon Inc. (TSX:MTK) 83 1.49 (20.02) NA
Open Text Corp. (NasdaqNM:OTEX) 1,611 12.59 48.36 10.00
Average 4,097 14.48 16.28 13.27
Median 3,532 15.12 21.74 13.41
Gemcom Software International Inc. (TSX:GCM) 99 16.60 44.72 ???
18
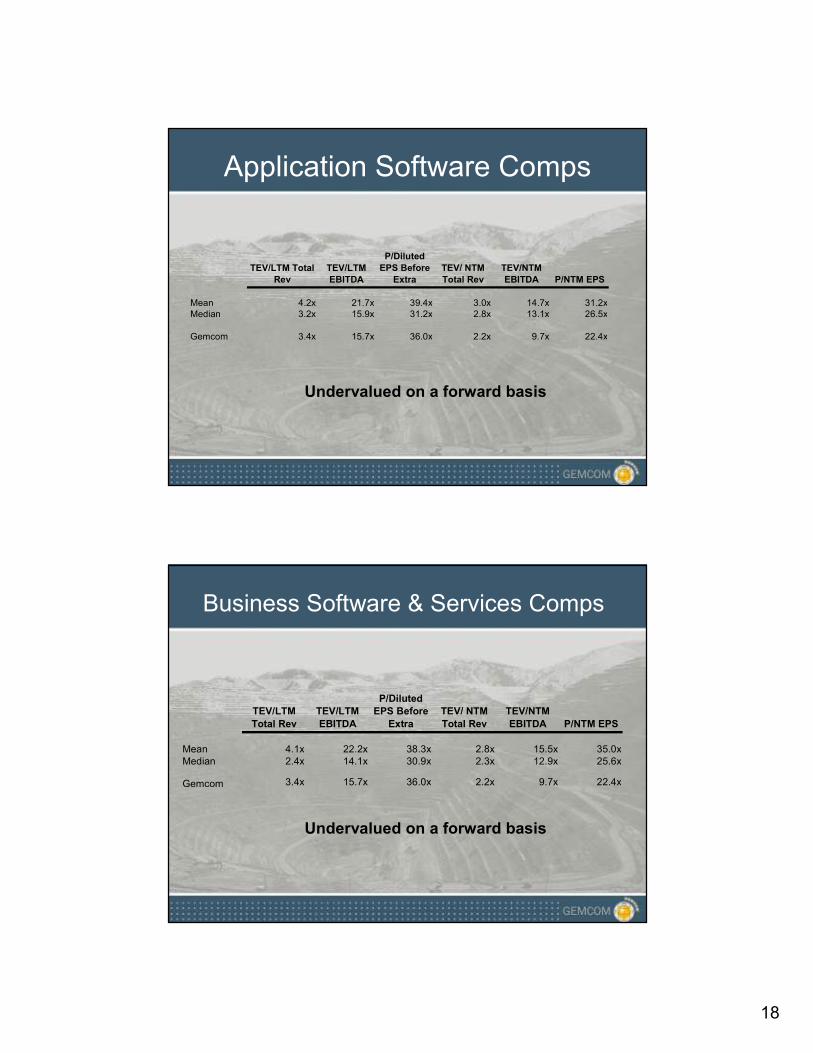
Application Software Comps
TEV/LTM Total
Rev
TEV/LTM
EBITDA
P/Diluted
EPS Before
Extra
TEV/ NTM
Total Rev
TEV/NTM
EBITDA P/NTM EPS
Mean 4.2x 21.7x 39.4x 3.0x 14.7x 31.2xMedian 3.2x 15.9x 31.2x 2.8x 13.1x 26.5x
Gemcom 3.4x 15.7x 36.0x 2.2x 9.7x 22.4x
Undervalued on a forward basis
Business Software & Services Comps
TEV/LTM
Total Rev
TEV/LTM
EBITDA
P/Diluted
EPS Before
Extra
TEV/ NTM
Total Rev
TEV/NTM
EBITDA P/NTM EPS
Mean 4.1x 22.2x 38.3x 2.8x 15.5x 35.0xMedian 2.4x 14.1x 30.9x 2.3x 12.9x 25.6x
Gemcom 3.4x 15.7x 36.0x 2.2x 9.7x 22.4x
Undervalued on a forward basis
19
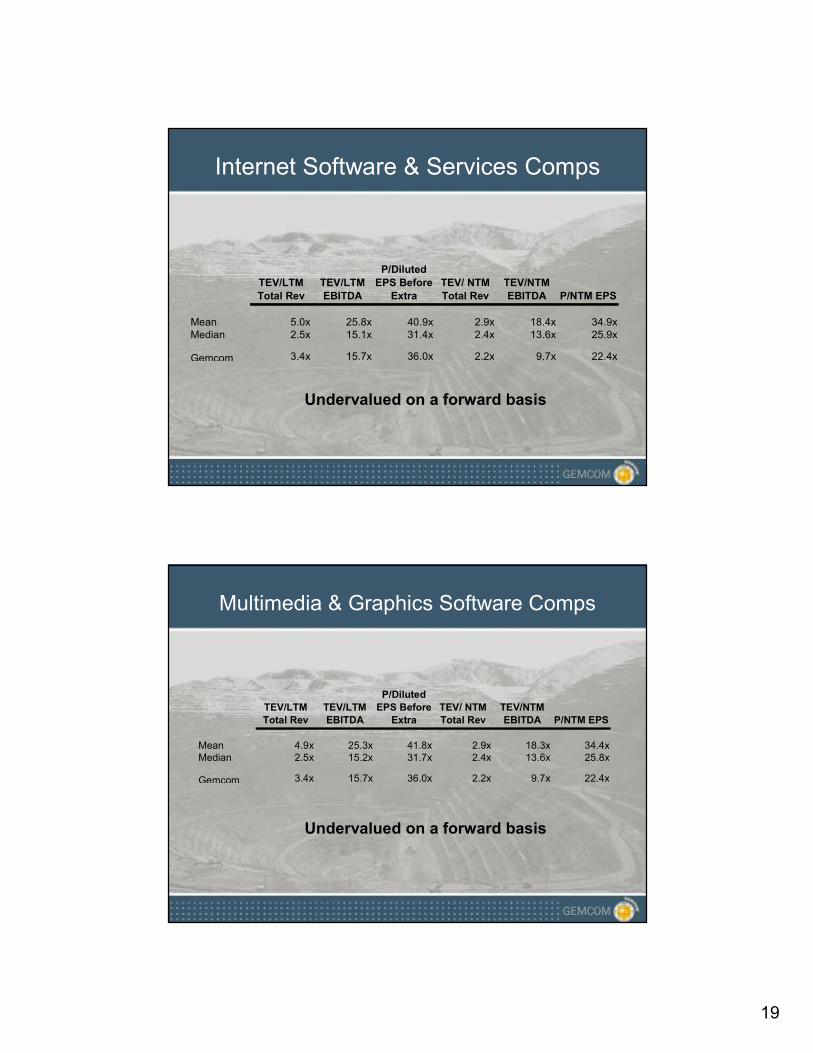
Internet Software & Services Comps
TEV/LTM
Total Rev
TEV/LTM
EBITDA
P/Diluted
EPS Before
Extra
TEV/ NTM
Total Rev
TEV/NTM
EBITDA P/NTM EPS
Mean 5.0x 25.8x 40.9x 2.9x 18.4x 34.9xMedian 2.5x 15.1x 31.4x 2.4x 13.6x 25.9x
Gemcom 3.4x 15.7x 36.0x 2.2x 9.7x 22.4x
Undervalued on a forward basis
Multimedia & Graphics Software Comps
TEV/LTM
Total Rev
TEV/LTM
EBITDA
P/Diluted
EPS Before
Extra
TEV/ NTM
Total Rev
TEV/NTM
EBITDA P/NTM EPS
Mean 4.9x 25.3x 41.8x 2.9x 18.3x 34.4xMedian 2.5x 15.2x 31.7x 2.4x 13.6x 25.8x
Gemcom 3.4x 15.7x 36.0x 2.2x 9.7x 22.4x
Undervalued on a forward basis

20
Security Software & Services Comps
TEV/LTM
Total Rev
TEV/LTM
EBITDA
P/Diluted
EPS Before
Extra
TEV/ NTM
Total Rev
TEV/NTM
EBITDA P/NTM EPS
Mean 5.0x 24.7x 41.0x 2.9x 18.1x 34.3xMedian 2.6x 15.2x 31.5x 2.4x 13.6x 25.8x
Gemcom 3.4x 15.7x 36.0x 2.2x 9.7x 22.4x
Undervalued on a forward basis
Technical & System Software Comps
TEV/LTM
Total Rev
TEV/LTM
EBITDA
P/Diluted
EPS Before
Extra
TEV/ NTM
Total Rev
TEV/NTM
EBITDA P/NTM EPS
Mean 4.9x 24.8x 43.0x 2.9x 17.8x 35.4xMedian 2.7x 15.3x 32.4x 2.4x 13.5x 25.7x
Gemcom 3.4x 15.7x 36.0x 2.2x 9.7x 22.4x
Undervalued on a forward basis
21
Reasons to Hate the Stock
Why I’m Hesitant
• Valuation may be rich
• Business ever changing, relies heavily on R&D
• Half of revenue stream dependent on bulky license sales
• Strengthening CAD
• Dilutive warrants, options could suppress stock in short-term
• Business difficult to understand
• No catalysts
• Integration risk
• Transaction comp
• 52-week highs

22
Missed the Boat?
…or more room to run?
GARP?