the perfect storm - putting america’s health care …...the perfect storm - putting america’s...
TRANSCRIPT

The Perfect Storm - Putting America’s Health Care in Peril
American Health Care Act + President’s Budget
May 24, 2017 CBO AHCA AnalysisDaniel Derksen, M.D., Director
University of Arizona Center for Rural Health
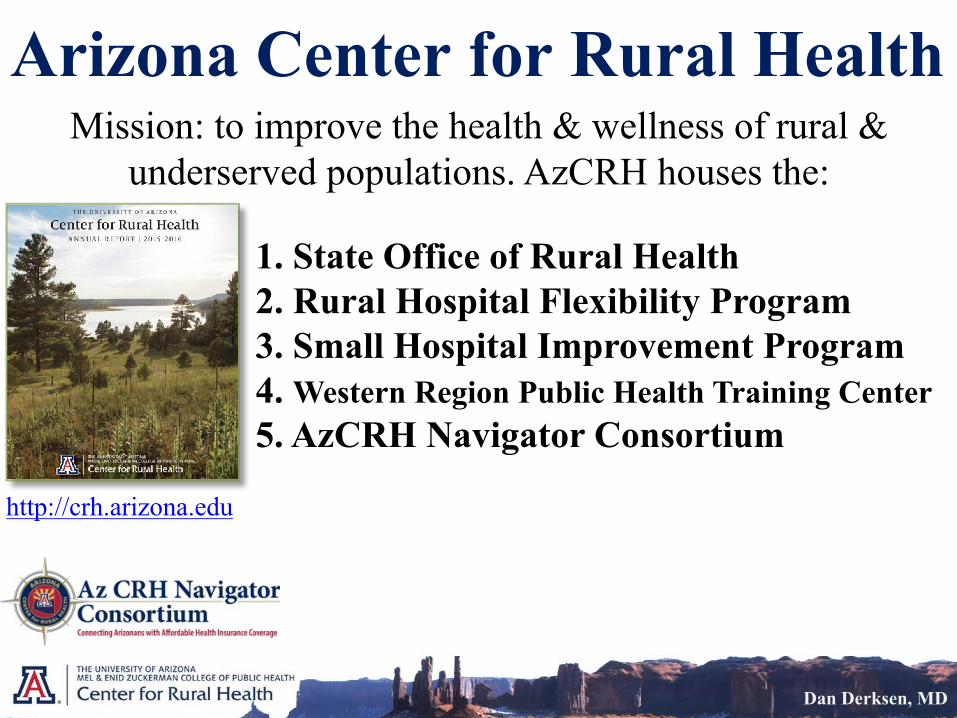
Arizona Center for Rural HealthMission: to improve the health & wellness of rural &
underserved populations. AzCRH houses the:
1. State Office of Rural Health2. Rural Hospital Flexibility Program3. Small Hospital Improvement Program4. Western Region Public Health Training Center5. AzCRH Navigator Consortium
http://crh.arizona.edu
Dan Derksen, MD

American Health Care Act
Dan Derksen MD
1. American Health Care Act Accessed 05/24/2017 at: https://housegop.leadpages.co/healthcare/2. CBO-JCT Cost and Coverage Estimates of the American Health Care Act, 05/24/2017: https://www.cbo.gov/system/files/115th-congress-2017-2018/costestimate/hr1628aspassed.pdf
CBO: AHCA over 10 years would: • Cut $1.5 Trillion in federal funding • Cut $830 Billion Medicaid funding to States• Cut $665 B in fed subsidies for individuals• Increase uninsured Americans by 23 million
Dan Derksen MD
1. Accessed 05/24/2017 at: https://www.hhs.gov/sites/default/files/fy2018-budget-in-brief.pdf 2. NYT Accessed 05/24/2017: https://www.nytimes.com/interactive/2017/05/23/us/politics/trump-budget-
details.html?q=medicaid
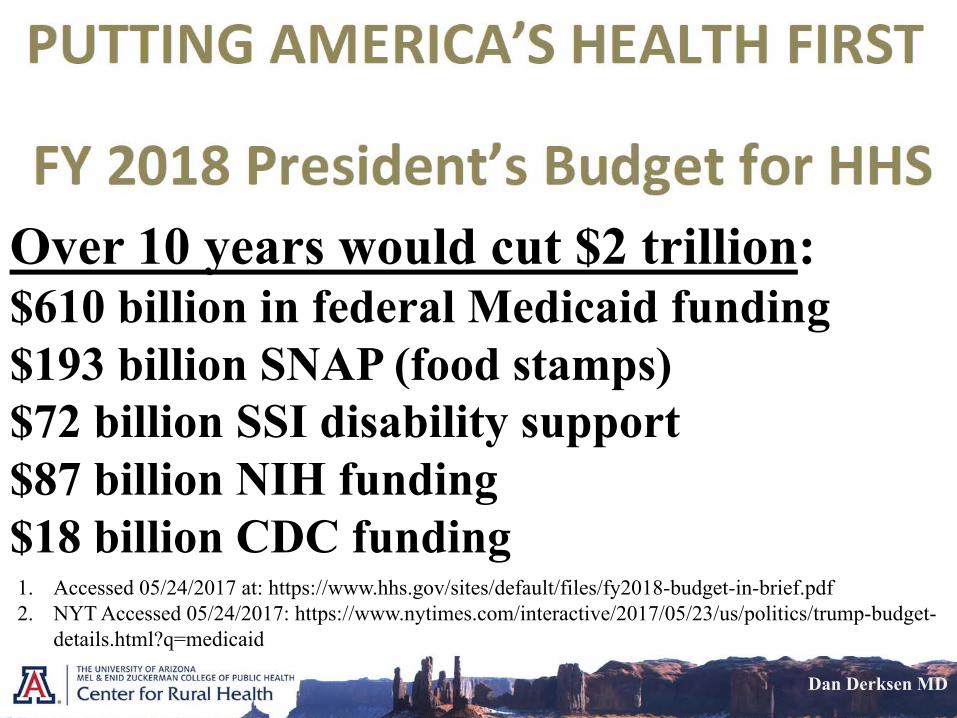
Over 10 years would cut $2 trillion:$610 billion in federal Medicaid funding $193 billion SNAP (food stamps)$72 billion SSI disability support$87 billion NIH funding$18 billion CDC funding

American Health Care Act
Dan Derksen MD
•Eliminates fed. min. 50% of total Medicaid costs•Shifts FMAP to per capita amt. or block grant•Bases cap/grant on 2016 state’s total expenses •Adjusts annually based on CPI-M•Cuts $830B over 10 yrs Medicaid funding to states1. CBO-JCT Cost and Coverage Estimates of the American Health Care Act, 05/24/2017: https://www.cbo.gov/system/files/115th-congress-2017-2018/costestimate/hr1628aspassed.pdf2. American Health Care Act Accessed 05/24/2017 at: https://housegop.leadpages.co/healthcare/

Rural, Elderly, & Disabled at RiskNurse, Physician, Hospital, Clinic - Charity Care Taxes
“You don’t save money throwing
people off coverage –that just shifts costs to individuals, families, & health providers -and it worsens health
outcomes” Dan Derksen, MD
Dan Derksen MD

Physician& Clinic
20%Rx
26%
DentalNursing
Home
33% Private Insurance
Medicare 20%
Medicaid 17%
Other 10%Out of Pocket 11%
2015 U.S. Health Spending$3.2 Trillion
Dan Derksen, MD
Accessed 03/10/2017 at: http://content.healthaffairs.org/content/36/1/166.full.pdf+html

Medicaid Cuts in AHCA:
Accessed 05/23/17: 1. http://content.healthaffairs.org/content/36/1/166.full.pdf+html2. https://www.cbo.gov/system/files/115th-congress-2017-2018/costestimate/hr1628aspassed.pdf
Dan Derksen, MD
Medicaid Spending in 2015 was1: $545 billion = $200 state + 345 fed Federal Medicaid cuts2 2017-26: $830B (>$150B/yr by 2026)Medicaid Enrollment2: -14M
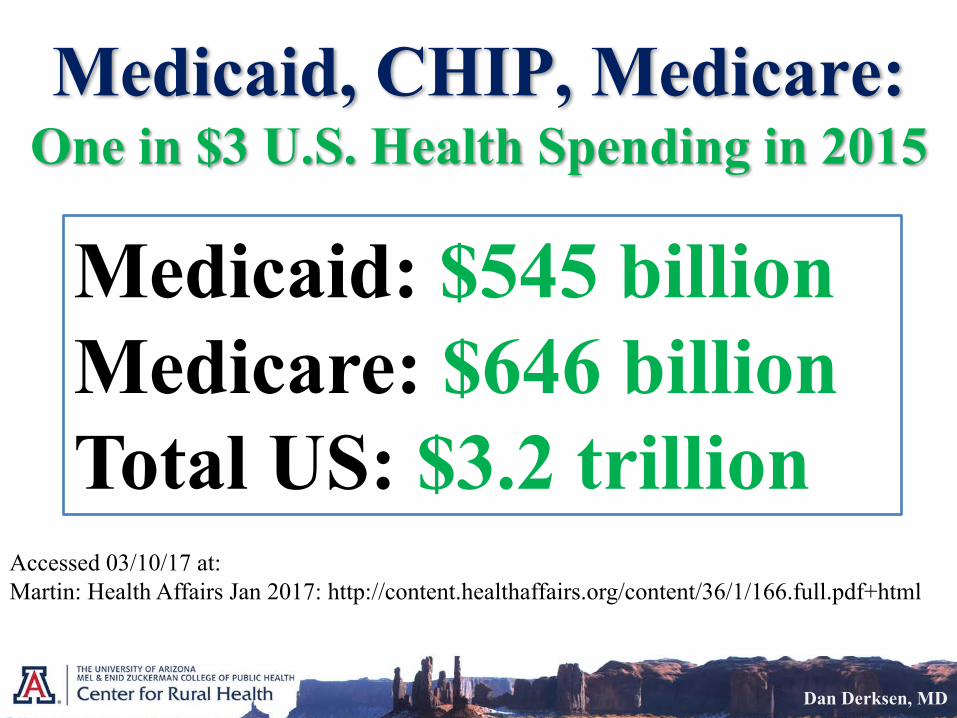
Medicaid, CHIP, Medicare: One in $3 U.S. Health Spending in 2015
Accessed 03/10/17 at: Martin: Health Affairs Jan 2017: http://content.healthaffairs.org/content/36/1/166.full.pdf+html
Dan Derksen, MD
Medicaid: $545 billion Medicare: $646 billion Total US: $3.2 trillion

2016 Publicly Sponsored Insurance Medicaid + CHIP + Medicare
Dan Derksen, MD
38% US pop (123M/323M)75 Million=Medicaid 70M + CHIP 5M
57 Million on Medicare9 M dual on both Medicaid + Medicare
CHIP = Children’s Health Insurance Program
Accessed 05/24/17 at: http://content.healthaffairs.org/content/36/1/166.full.pdf+htmlhttps://aspe.hhs.gov/system/files/pdf/255516/medicaidexpansion.pdfhttps://www.medicaid.gov/medicaid/program-information/medicaid-and-chip-enrollment-data/report-highlights/index.html

Marketplace3
+10.4 MillionEffectuated Enrollment
(paid premiums)
Medicaid + Marketplace Gain Post-ACA Enrollment Gain from Sept 2013 thru 2016
UNITED STATESMedicaid+CHIP1
+16.8 Million
Dan Derksen, MD
Accessed 05/17/2017:1. Medicaid + CHIP Report thru Mar 2017: https://www.medicaid.gov/medicaid/program-information/medicaid-and-chip-enrollment-data/report-highlights/index.html2. Coverage gains 2010-2016 due to the ACA US DHHS: https://aspe.hhs.gov/sites/default/files/pdf/187551/ACA2010-2016.pdf3. Effectuated Marketplace Enrollment: https://www.cms.gov/Newsroom/MediaReleaseDatabase/Fact-sheets/2016-Fact-sheets-items/2016-10-19.html
91.4% Americans with health insurance 201620 Million Gained Coverage2 since 20108.6% or 27 Million Uninsured in 2016
https://www.cdc.gov/nchs/data/nhis/earlyrelease/insur201609.pdf
Age <26 Parents’ Plan2
+2.3 Million

é16.8M Medicaid/CHIP Enrollees 2013-16
31 States + DC Expanded Medicaid
Dan Derksen, MD
>Half (16) That Expanded Are in Republican Governor States:
AZ, AR, IL, IA, IN, KY, MD, MA, MI, ND, NH, NJ, NM, NV, OH, VT
https://www.medicaid.gov/medicaid/program-information/medicaid-and-chip-enrollment-data/report-highlights/index.html

Medicaid FMAP: Federal Medical Assistance Percentage:
Accessed 03/10/17:FMAP by state: kff.org/medicaid/state-indicator/federal-matching-rate-and-multiplier/?currentTimeframe=0&sortModel=%7B%22colId%22:%22Location%22,%22sort%22:%22asc%22%7D
Congress Research Service Medicaid FMAP released 02/09/2016 at: https://fas.org/sgp/crs/misc/R43847.pdf
Dan Derksen, MD
FMAP is the federal share of Medicaid costs, based on a
state’s per capita income (PCI) compared to US PCI

Dan Derksen, MD
50% Statutory Minimum Federal Cost ShareFMAP Share Averages 57% in the 50 States
Example: Arizona 2018 FMAP = 69%
Medicaid FMAP
2018 FMAP by State: http://kff.org/medicaid/state-indicator/federal-matching-rate-and-multiplier/?currentTimeframe=0&sortModel=%7B%22colId%22:%22Location%22,%22sort%22:%22asc%22%7D

Federal Per Capita Medicaid Enrollee Spending by State, 2017
0
2,000
4,000
6,000
8,000
10,000
12,000
DC NY
WV RI
CT
OR VT MOMSDE KY MN AR TN MT
OHND PA ME
MA ID LA MD IA IN US AK NC UT
NM KS SC AL WI
CA
WY
WA
OK TX MI
NJ
GA FL VA AZ NESD HI
CO NV IL NH
•Data: J. Holahan and M. Buettgens, Block Grants and Per Capita Caps: The Problem of Funding Disparities Among States, Urban Institute, Sept. 2016, available at http://www.urban.org/research/publication/block-grants-and-capita-caps.
Rosenbaum S Commonwealth Fund Mar 2017: http://www.commonwealthfund.org/publications/issue-briefs/2017/jan/medicaids-future-aca-repeal
Arizona #8 lowest
Arizona would be punished by the proposed AHCA and the President’s budget because Arizona expanded
AHCCCS coverage, and is cost efficient

“Weigh the evidence and do the math”
$2 billion per year20,000 jobs
250,000 uninsured covered
Governor Brewer – Medicaid Expansion
http://www.huffingtonpost.com/2013/01/14/arizona-medicaid-expansion_n_2474726.html
Governor Brewer restored Medicaid coverage to 100% FPL for childless
adults in 2014, and expanded it from 100% to 138% FPL as the ACA allows
Dan Derksen MD

Dan Derksen, MD
Adapted by Dan Derksen, MD
Payer Source # Arizonans %AZ PopEmployer Sponsored Insurance 3,300,000 50.7%
Medicaid (AHCCCS)/CHIP (KidsCare) 1,200,000 18.5%Medicare 800,000 12.3%
Uninsured 1,200,000 18.5%Total Pop. Arizona 6,500,000 100.0%
Pre-ACA 2012 AZ Health Coverage

AHCCCS – AZ Medicaid<138% FPL ($33,948 for a Family of 4)
July-Sep 2013 to Oct 2016 Net Gain
+600,000
AZ MARKETPLACE133-400% FPL ($33,948 - $98,400 Family of 4)
OE-3 Effectuated Enrollment* Mar 31, 2016
+180,000AZ <26 Parents’ Plan
+70,000
How Arizona Cut Its Uninsured 2013-16
*Effectuated enrollment are those enrolled and paying premiums.CHIP = Children’s Health Insurance Program, called KidsCare in Arizona
Accessed 04/26/17 at: 1. AZ KidsCare/CHIP: https://www.azahcccs.gov/Resources/Downloads/PopulationStatistics/2017/Mar/AHCCCS_Population_Highlights.pdf2. AHCCCS/Medicaid: https://www.azahcccs.gov/Resources/Reports/population.html 3. Effectuated Enrollment (pd premium): https://www.cms.gov/Newsroom/MediaReleaseDatabase/Fact-sheets/2016-Fact-sheets-items/2016-06-30.html
Arizona Total: +850,000KidsCare/CHIP restored 09/2016: +15,000
Eligible Arizona Children Age <19 years with family incomes between 138-200% FPL
Dan Derksen, MD

YES from 2016-17 Premiums Doubled (ex. 25 y.o. Non-Smoker, Silver Plan AZ)
2017 AZ Marketplace Plan Rates: https://insurance.az.gov/sites/default/files/documents/files/2017%20Individual%20QHP%20Min%20Max%20Average%20Sample%20Rates.pdf
2016 AZ Marketplace Plan Rates: https://insurance.az.gov/sites/default/files/documents/files/INDIVIDUAL_PPO_HMO_Minimum_Maximum_Average_Premiums.pdf
Dan Derksen, MD
AZ County 2016 2017 Avg. Monthly Rate Increase
Average %Increase
Maricopa $206 $386 $180 87%Pima $190 $274 $84 44%
Gila, Pinal $219 $453 $234 107%Apache, Navajo,
Coconino, Mohave $275 $501 $226 82%Yavapai $294 $586 $292 99%
Yuma, La Paz $261 $593 $332 127%Santa Cruz $190 $395 $200 108%
Cochise, Graham, Greenlee $238 $486 $248 104%

Total # Selected Market Plans
Avg. TtlPrem/Mo (Insurer
Gets)
AvgAPTC
Mo (Fed Subsidy
Pays)
AvgPrem Mo
after APTC
(Enrollee Pays)
#Received APTC
Subsidies(% of TtlEnrollees)
#Received APTC +
CSR Subsidies
(% TtlEnrollees)
# Paid Full Premium(% Total Enrollees)
AZ 2016 203,066 $324/mo $204/mo $120/mo 150,269
(74%)94,463(47%)
52,797(26%)
AZ 2017 196,291 $611/mo $521/mo $104/mo 155,754
(79%)100,316(51%)
40,537(20%)
US 2016 11,081,330 $397/mo $291/mo $106/mo 9,389,609
(85%)6,400,000
(57%)1,691,721
(15%)US
2017 12,216,000 $476/mo $383/mo $106/mo 10,101,808(83%)
7,500,000 (61%)
2,114,192 (17%)
But low-income Arizonans were shielded from total premium increases because of the ACA subsidies!
APTC = Advance Premium Tax Credit SubsidyCSR = Cost Sharing Reduction Subsidy
Dan Derksen MD

4% enrollment increase 2016 to 2017 in those getting APTC 6% enrollment increase for those getting APTC + CSR
23% enrollment decrease for those not receiving subsidies
APTC = Advance Premium Tax Credit SubsidyCSR = Cost Sharing Reduction Subsidy
Dan Derksen MD
Low income Arizonans shielded from total premium increases because of the ACA subsidies
Sharply cutting subsidies for the poor, by $1.5 trillion over 10 years as per the AHCA, will increase the
uninsured, shift costs to individuals, families, & health providers, and worsen health outcomes

If the American Health Care Act were enacted as is, it would…
•End Medicaid/AHCCCS for 380,000 in AZ •Cut $2.5 billion in federal funding to Arizona•Shift $0.5 billion/yr federal costs to AZ to cover 300,000 childless adults (<100% FPL)•Force 80,000 off AHCCCS (100-138% FPL)• Increase Arizona uninsured to pre-ACA levels (to 1.2 million uninsured from 750,000)
05/24/2017 Bob Christie AP, Arizona Daily Star published 03/18/17: http://tucson.com/news/state-and-regional/analysis-arizonans-may-lose-medicaid/article_404d3ae0-0bef-11e7-bd41-5b4190aad6d3.html
Dan Derksen MD