the performance of social pensions in india: the...
TRANSCRIPT

NO. 0834S P D I S C U S S I O N P A P E R
The Performance ofSocial Pensions in India:The Case of Rajasthan
Puja Vasudeva Dutta
July 2008

___________ This study was carried out by Philip O’Keefe and Puja Vasudeva Dutta (SASHD - Social Protection) with guidance from Mansoora Rashid (SASHD - Social Protection). The author is grateful to Rinku Murgai (SASPR), Juan Munoz (Consultant), Oleksiy Sluchynskyy and Robert Palacios (SASHD - SP), Mrs. Asha Singh (Principal Secretary, Social Welfare, Government of Rajasthan), Mr. Derashri (Director, Social Welfare GoR), Mr. R. Mehrishi (Principal Secretary, Finance, GoR) for very helpful comments and to Tanusree Talukdar for logistic support. The survey was conducted by ORG Pvt. Ltd. Comments from one internal and one external referee are gratefully acknowledged. The findings, interpretations, and conclusions expressed in this paper are entirely those of the author and do not necessarily reflect the views of the Board of Executive Directors of the World Bank or the governments they represent. * South Asia Social Protection Unit (SASHD-SP), The World Bank, 70 Lodi Estate, New Delhi 110003, India. Tel: +91(11) 41479156, Fax: +91(11)24619393, E-mail: [email protected].
The Performance of Social Pensions in India:
The Case of Rajasthan
Puja Vasudeva Dutta*
July 2008
PENSION
REFORM
PRIMERrē-for´m
v.t. & i. 1. make (institution, procedure
etc.) better by removal or abandonment
of imperfections, faults or errors
prīmer n. 1. elementary book to
equip person with information
pe´nsion n.
1. perio
dic paym
ent
made esp. by g
overnment or em
ployer
on retirem
ent or to pers
on above
specified
age
3
ABSTRACT
The Government of India has recently announced a dramatic expansion of social pension
schemes both in terms of coverage and benefit levels. Yet relatively little is known about
how these programs are administered or how well they achieve their objectives. This
paper assesses the performance of a social pension scheme in the Indian state of
Rajasthan. In particular, we review the experience with respect to program awareness,
coverage, targeting and leakage as well as delivery mechanisms. The overall assessment
is positive and holds broader lessons for social assistance in India. Thus, transaction
costs once pensions are sanctioned are low, disbursements are largely as per schedule,
leakage in the form of shortfalls in benefits is generally low and satisfaction levels with
the social pension scheme are high. At the same time there are clear areas for
improvement on both the policy and administration side. There is evidence of under-
coverage and high transaction costs associated with the application process. Though
targeting is generally progressive, especially for old age and widow pensions though less
so for disability pensions, targeting is far from perfect and the eligibility criteria are not
strictly enforced. There is a strong case for relaxing, rationalizing and clarifying some of
the existing criteria. On the administration front, several basic issues relating to
implementation need to be addressed, particularly with respect to transaction costs in the
sanction of pensions, wide inter-district variations in performance within the state and
inadequate record-keeping and monitoring.
JEL Classification: H2, H55, I32, J14, J26 Keywords: public pensions, social pensions, poverty among the elderly, old age income security, expanding coverage

4
Table of Contents
A. Introduction.................................................................................................................... 6 B. Social pensions in Rajasthan .......................................................................................... 8 C. Rajasthan Social Pensions Survey................................................................................ 11 D. Performance of the program ........................................................................................ 13
1. Awareness ................................................................................................................. 13 2. Coverage ................................................................................................................... 15 3. Targeting ................................................................................................................... 18 4. Participation .............................................................................................................. 27 5. Usage of pension benefits ......................................................................................... 30
E. Administration of the scheme....................................................................................... 31 1. Application process................................................................................................... 31
(a) The application process on paper and in practice............................................. 31 (b) Time taken for sanctioning pensions................................................................. 33 (c) Level of complexity and transparency in the process and associated costs...... 34 (d) Costs incurred in the application process.......................................................... 36
2. Disbursement process ............................................................................................... 37 (a) Mode of disbursement ........................................................................................ 37 (b) Delays in payment .............................................................................................. 38
3. Leakage ..................................................................................................................... 41 4. Record-keeping ......................................................................................................... 43
F. Conclusions and recommendations .............................................................................. 46 Appendix I: Rajasthan Social Pensions Survey - Sampling Design ........................... 50 Appendix II: Rajasthan Social Pensions Survey – Profile of respondents ................ 53

5
List of Tables Table 1: Panel A: Eligibility criteria for social pensions as of 2007 ................................ 10 Table 2: Coverage using the Rajasthan social pension’s survey ...................................... 17 Table 3: Ration card holding across the asset distribution, 2004/05 ................................ 19 Table 4: Percentage of actual and potential beneficiaries................................................. 21 Table 5: Targeting of pensioners ...................................................................................... 24 Table 6: Probit regression model of participation............................................................. 28 Table 7: Mode of disbursement of pensions ..................................................................... 38 Table 8: Distribution of pensioners reporting shortfalls in pension payments ................. 42 Table 9: % GPs that maintain records of pensioners ........................................................ 45
List of Figures
Figure 1: Trends in coverage of social pensions in Rajasthan, 1998/99 to 2005/06 ........ 11 Figure 2: Awareness of social pension schemes............................................................... 14 Figure 3: Coverage by caste.............................................................................................. 22 Figure 4: Coverage by income class ................................................................................. 23 Figure 5: Coverage by ration card holdings...................................................................... 24 Figure 6: Typical use of pension benefits (% households) ............................................... 30 Figure 7: % of Group A households reporting verification visit ...................................... 33 Figure 8: Time taken for sanctioning of pension application ........................................... 34 Figure 9: Main problems faced by current pensioners in the application process,........... 35 Figure 10: Main deterrents to applying for pensions ........................................................ 36 Figure 11: Frequency of pension’s payments as reported by pensioners ......................... 39 Figure 12: Irregular disbursements ................................................................................... 41 Figure 13: Problems in pensions....................................................................................... 41 Figure 14: Average shortfall (Rs.), by district .................................................................. 43

6
A. Introduction
India’s national and state social pension schemes aim to alleviate chronic poverty through
regular cash transfers to destitute elderly, widows and disabled people who have no
regular means of subsistence from their own sources of income or through financial
support from family members or other sources. Until the recent introduction of the
National Rural Employment Guarantee Act, social pensions were the most significant
cash-only social protection transfer In India and remain a critical source of support for
vulnerable groups. The scope of this scheme is about to expand dramatically following a
recent central government initiative to significantly increase the amount of the transfer
and expand coverage. The 2006/07 budget doubled the existing benefit to Rs. 200 per
month per old age pensioner. In addition, the centre encouraged states to match this
contribution so that the total benefit accruing to pensioners would amount to Rs.400 per
month. Ministry of Rural Development reports and interviews with the state government
counterparts reveal that Rajasthan is among the states that have increased the overall
benefit amount to Rs. 400 in response to this announcement. In addition, there is an
intention to expand coverage of the central program to all destitute elderly. On the
process side, there was a stated intention in the budget speech to ensure all benefit
payments are made through post office or bank accounts over a period of two years and
state governments are currently debating this issue. This policy change enhancing the
scope of this program implies that it is vital to assess the performance of the program on
the ground and to identify areas for improvement before expanding the scheme.
This study examines the performance of this program in the Indian state of Rajasthan.
The focus is on program awareness, coverage, targeting, and a range of implementation
issues including transaction costs, disbursement process, leakage and administration.
Rajasthan is a large, relatively poor state in western India with a population of about 61
million and an annual per capita income of about $400. The state is overwhelmingly
rural, with over-three-quarters of the population living in rural areas. Rajasthan has one
of the highest proportions of scheduled caste (17 percent) and scheduled tribe (13

7
percent)1 populations in the country. The state has inherited a feudal legacy but has
developed fairly rapidly since the late 1980s. Though poverty incidence is moderate,
frequent droughts in this water-scarce state imply that social protection issues are highly
relevant for Rajasthan. In general, the track record of the state’s anti-poverty programs is
fairly good, with spending on the main programs (including social pensions, public food
grain distribution system, public works, and rural credit programs) accounting for about
0.5 percent of the state Gross State Domestic Product. However, there is room for
improvement through better implementation, broader coverage, improved targeting and
better monitoring and evaluation of some schemes.2
This paper finds that, in Rajasthan, the overall story is a positive one and there is a strong
case for considering social pensions as the model for social assistance. Though there is
high transaction costs associated with the application process, the majority of pensioners
report no problems once the pension is sanctioned. Disbursements are largely as per
schedule and leakage in the form of shortfalls in the pension amount is low. Satisfaction
levels with the social pension scheme are also high – with both beneficiaries and officials
rating social pensions as better or at least as good as other anti-poverty programs on
various aspects including regularity and level of benefits, targeting and transfers in cash
rather than food. However, there are wide variations across districts with some districts
emerging as particularly poor performers on all fronts.
At the same time there are clear areas for improvement on both the policy and
administration side. For the state as a whole, there is evidence that actual coverage is
lower than what is implied by what is reported in the official statistics. It is also lower
than what would be suggested by the central government guidelines as well as the state’s
own rural poverty figures. Though targeting is generally progressive, though less so for
disability pensions, it is far from perfect and the criteria are not strictly enforced. There is
a strong case for rationalizing or relaxing the criteria and for formulating clearer
eligibility criteria for disability pensions. In light of the central initiative to expand
1 These terms are derived from a government schedule for positive discrimination for these groups. 2 World Bank (2006).

8
coverage, it could also be possible to move towards full coverage of the destitute elderly
population.
On the administration front, several basic issues relating to implementation need to be
addressed. These include high transaction costs associated with the complicated and
costly process of application, verification and sanction of pensions, multiple
disbursement schedules and modes of payment, delays in payments and leakages in some
problem districts and inadequate record-keeping and monitoring of the program overall.
There is a strong case for moving towards a single system of automated disbursements
through money orders or directly into bank or post office accounts paid out according to a
uniform schedule.
In light of the recent initiative to expand the coverage of NOAPS, it is encouraging that
the analysis in this paper finds that the social pension scheme in Rajasthan functions
relatively well. There is room for improvement with respect to both policy (eligibility
criteria) and the administration of these schemes. Evidence from a comparable study of
social pensions in Karnataka and other studies in Himachal Pradesh also suggest that this
is a well-performing scheme that could be scaled up effectively provided these issues are
addressed.
B. Social pensions in Rajasthan
The National Old Age Pension Scheme (NOAPS) was launched in 1995 as part of the
National Social Assistance Programme. The NOAPS is a centrally sponsored scheme that
transfers funds to state governments in order to provide cash transfers to the destitute
elderly. However, eligibility criteria to determine destitution are those specified by the
state government. At the central government level, NOAPS is administered by the
Ministry of Rural Development. States have the flexibility to implement the scheme
through any department. In Rajasthan, both NOAPS and the state social pension scheme
are administered by the state Department of Social Welfare and Social Security. In
practice, this transfer of program implementation to states from 2002/03 has resulted in
weak ownership at the Central Ministry level and hence, in poor monitoring at the centre
9
and, in some states, diversion of transfer for other purposes or in payment delays.3
The stated objective of NOAPS is to provide financial assistance to the elderly with little
or no regular means of support.4 States are free to augment the transfer through their own
budgets, cover additional beneficiaries or reduce the age for eligibility.5 The central
government contribution was originally Rs. 75 and was later increased to Rs. 100 and
most recently to Rs. 200 in 2006-07. The central contribution for NOAPS is released
directly to the districts in two installments during the year. Like many other states,
Rajasthan augments the central contribution for old age pension under NOAPS, initially
by Rs. 125 and later by Rs. 100 to bring the total benefit to Rs. 200 per month. The
pension for elderly couples is Rs. 300 per month.
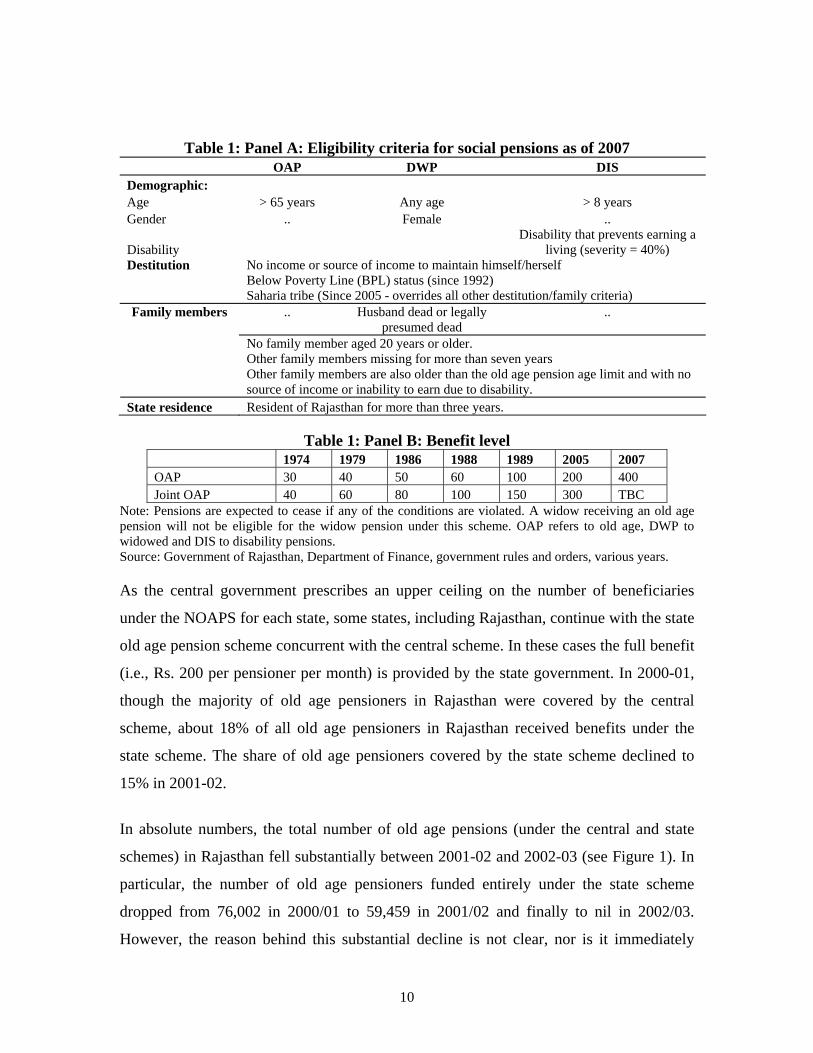
In addition, Rajasthan has had a state social pension scheme since 1974 with the aim of
providing cash assistance to the elderly aged more than 55 years for women and 58 for
men. This assistance was later extended to widows aged 45 years and above in 1980.
Similarly, disabled people aged eight or more have also been included in the state social
pension scheme over time. There have been several subsequent amendments in the rules
with respect to eligibility criteria and the level of benefits (see Table 1). Currently,
destitute elderly (aged 65 and above), widows of any age and disabled individuals older
than 8 years are eligible for social pensions. In addition, persons with disabilities are
required to produce a doctor’s certificate verifying at least 40 percent severity of
disability (such that the nature of the disability does not allow the individual to earn a
living). This “40 percent” is not clearly defined anywhere the Department of Social
Welfare guidelines and interviews in field suggest that criteria such as the loss of or
inability to use one or more limb, blindness in both eyes, etc. are used in practice.
3 Saxena 2005; World Bank 2007. 4 National Social Assistance Program Guidelines, Ministry of Rural Development. 5 In fact, many state governments had instituted social pension schemes prior to NOAPS.
10
Table 1: Panel A: Eligibility criteria for social pensions as of 2007 OAP DWP DIS Demographic: Age > 65 years Any age > 8 years Gender .. Female ..
Disability Disability that prevents earning a
living (severity = 40%) Destitution No income or source of income to maintain himself/herself
Below Poverty Line (BPL) status (since 1992) Saharia tribe (Since 2005 - overrides all other destitution/family criteria)
..
Husband dead or legally presumed dead
..
Family members
No family member aged 20 years or older. Other family members missing for more than seven years Other family members are also older than the old age pension age limit and with no source of income or inability to earn due to disability.
State residence Resident of Rajasthan for more than three years.
Table 1: Panel B: Benefit level 1974 1979 1986 1988 1989 2005 2007 OAP 30 40 50 60 100 200 400 Joint OAP 40 60 80 100 150 300 TBC
Note: Pensions are expected to cease if any of the conditions are violated. A widow receiving an old age pension will not be eligible for the widow pension under this scheme. OAP refers to old age, DWP to widowed and DIS to disability pensions. Source: Government of Rajasthan, Department of Finance, government rules and orders, various years. As the central government prescribes an upper ceiling on the number of beneficiaries
under the NOAPS for each state, some states, including Rajasthan, continue with the state
old age pension scheme concurrent with the central scheme. In these cases the full benefit
(i.e., Rs. 200 per pensioner per month) is provided by the state government. In 2000-01,
though the majority of old age pensioners in Rajasthan were covered by the central
scheme, about 18% of all old age pensioners in Rajasthan received benefits under the
state scheme. The share of old age pensioners covered by the state scheme declined to
15% in 2001-02.
In absolute numbers, the total number of old age pensions (under the central and state
schemes) in Rajasthan fell substantially between 2001-02 and 2002-03 (see Figure 1). In
particular, the number of old age pensioners funded entirely under the state scheme
dropped from 76,002 in 2000/01 to 59,459 in 2001/02 and finally to nil in 2002/03.
However, the reason behind this substantial decline is not clear, nor is it immediately

11
apparent whether these pensioners had their pensions permanently discontinued or were
subsequently absorbed into the central scheme. The absolute number and coverage of
pension for widows and disabled persons, on the other hand, has increased steadily since
the late 1990s.
Figure 1: Trends in coverage of social pensions in Rajasthan, 1998/99 to 2005/06
0
2
4
6
8
10
12
14
1998-99 1999-2000 2000-01 2001-02 2002-03 2003-04 2004-05 2005-06
Cov
erag
e (%
)
Old age pensions Widow ed pensions Disabled pensions
Old age
Source: Administrative data from the Department of Social Welfare, Government of Rajasthan, Census. Notes: Coverage rates refer to the share of old age, widowed or disabled pensioners in the relevant population using administrative data for the number of pensioners and drawing on the 2001 Census and NSSO survey information for projected (rural and urban) population for the relevant groups. OAP coverage is obtained using the total number of old age pensions as a share of elderly population; DWP coverage as the number of widow pensions as a share of the widowed female population (obtained by applying the share of widows in Rajasthan using the NSS survey to the projected female population from the 2001 Census); disabled pension coverage as the number of disability pensions as a share of the disabled population (obtained by applying the share of persons with disabilities in Rajasthan from the 2001 Census).
C. Rajasthan Social Pensions Survey
While the administrative data give some indication of the scale of the program, more
information is required to assess the performance of the program on the ground. In
particular, issues of coverage as reported by households (rather than administrative
figures), targeting and delivery mechanisms are critical in assessing performance.
However, administrative data are inadequate for this purpose and specially designed
household surveys are necessary.
The empirical analysis in this paper draws on the Rajasthan Social Pensions Survey
(RSPS). This survey was administered to about 2140 households spread across 20 blocks
in 8 districts during May-July 2006. The districts and blocks were selected with
12
probability proportional to size (pps) of the old age pensioners of the district or block.
Three blocks were selected in the four districts with a high number of old age pensioners
(Ajmer, Dungarpur, Ganganagar and Jalore) and two blocks were selected in the four
districts with a low number of old age pensioners (Bundi, Jhalawar, Jaisalmer,
Jhunjhunu). Within each block, four Gram Panchayats6 were chosen with equal
probability and, after a listing exercise within each panchayat, approximately 30
households selected with probability proportional to size of the relevant population.
These households were split into two groups:
• Group A: households with at least one current beneficiary of the social pension
scheme; and
• Group B: households with at least one member who is potentially eligible for a social
pension but does not currently receive one.
As our population of interest in this survey is households that are currently or potentially
eligible for a social pension, households without any current, former or potential
beneficiary of the social pension schemes are explicitly excluded. The appendix describes
the sampling strategy and the construction of weights for the survey in more detail.
A short questionnaire was administered to both groups of households. Both were asked a
common set of questions on the household roster and other characteristics (including
asset ownership, expenditure, social networks, exposure to shocks, etc.). In addition, two
separate modules on the social pension schemes were administered to a single current or
potential pensioner.7 For Group A households, this module focused on eligibility criteria,
application process, level of benefits and associated transaction costs. For Group B
households, this module focused on the level of awareness, eligibility criteria, as well as
information on the application process. There was also a separate village questionnaire
6 Gram Panchayats are the lowest administrative and political unit in India. Typically in Rajasthan, a GP consists of about 7-8 villages, all of which have a single elected Sarpanch or headman and other GP officials. The role of GPs has been become increasingly important in recent years with several functions related to implementing anti-poverty programs, including social pension schemes, being decentralized to the GP level. 7 A small proportion of Group A households had more than one current beneficiary (about 2.75% overall) – e.g., among Group A households where old age pensioners were interviewed, 1.7% also had a widowed pensioner and 0.5% had a disabled pensioner.

13
that collected information on panchayat-level characteristics, including information on
the elected headman (Sarpanch), the revenue villages comprising the Gram Panchayat
(GP), and record-keeping as related to the social pension scheme.
This was supplemented by qualitative information obtained through focused group
discussions with both groups of households as well as interviews with panchayat, block
and district-level functionaries involved in the sanctioning of beneficiaries and delivery
of benefits. These include the Sarpanch at the panchayat-level, Block Development
Officer at the block-level and Treasury Officer at the district-level. These interviews and
group discussion findings help in understanding in greater detail the main issues in
program implementation.
The profile of the sample respondents is given in detail in Appendix II. Briefly, the
sample respondents in the RSPS are largely from disadvantaged groups with low levels
of literacy and limited or no means of income. Though rates of co-residence are high,
there is a significant proportion of elderly (18%) and widows (13%) living alone (or with
other elderly or widows). A smaller share of persons with disabilities (3%) also lives
alone (largely older PWDs). The demographic profile of the actual and potential
pensioners is the following: the average age of the sample respondents is 55 years, about
46% are male and 27% are disabled (of which the majority are have an orthopedic
disability or are blind). In general, pension recipients tend to have worse socio-economic
characteristics than non-recipients suggesting that pensioners come from more needy
families.
D. Performance of the program
This section examines the performance of the social pension program in Rajasthan with
respect to the level of awareness and coverage among the target population, the targeting
of the program on paper and in practice as well as the usage of pension benefits by
current pensioners.
1. Awareness
Awareness of the social pension scheme is fairly high even among the potential
14
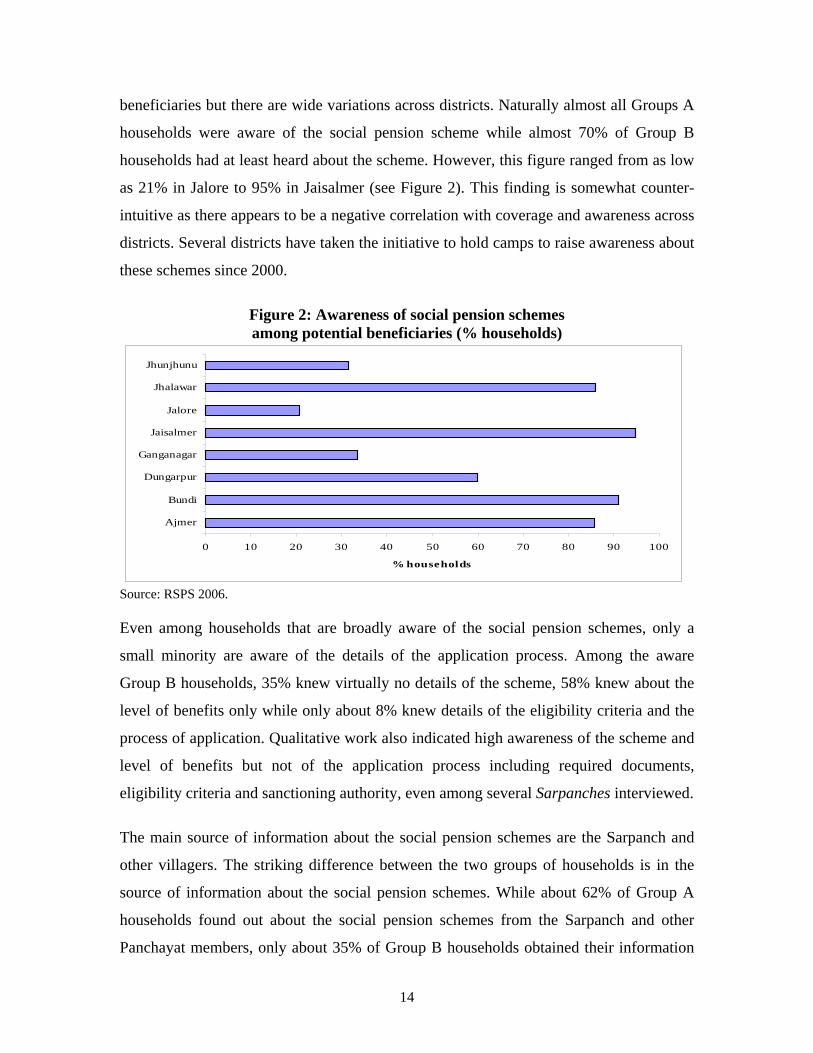
beneficiaries but there are wide variations across districts. Naturally almost all Groups A
households were aware of the social pension scheme while almost 70% of Group B
households had at least heard about the scheme. However, this figure ranged from as low
as 21% in Jalore to 95% in Jaisalmer (see Figure 2). This finding is somewhat counter-
intuitive as there appears to be a negative correlation with coverage and awareness across
districts. Several districts have taken the initiative to hold camps to raise awareness about
these schemes since 2000.
Figure 2: Awareness of social pension schemes among potential beneficiaries (% households)
0 10 20 30 40 50 60 70 80 90 100
Ajmer
Bundi
Dungarpur
Ganganagar
Jaisalmer
Jalore
Jhalawar
Jhunjhunu
% households
Source: RSPS 2006. Even among households that are broadly aware of the social pension schemes, only a
small minority are aware of the details of the application process. Among the aware
Group B households, 35% knew virtually no details of the scheme, 58% knew about the
level of benefits only while only about 8% knew details of the eligibility criteria and the
process of application. Qualitative work also indicated high awareness of the scheme and
level of benefits but not of the application process including required documents,
eligibility criteria and sanctioning authority, even among several Sarpanches interviewed.
The main source of information about the social pension schemes are the Sarpanch and
other villagers. The striking difference between the two groups of households is in the
source of information about the social pension schemes. While about 62% of Group A
households found out about the social pension schemes from the Sarpanch and other
Panchayat members, only about 35% of Group B households obtained their information

15
from this source. The reverse is true for information through informal network of friends,
relatives and other villagers – only about 30% of Group A households compared to 56%
of Group B households relied on this source.
2. Coverage
A recent study estimates coverage of social pension schemes by state using nationally
representative data from the NCAER HDPI survey for 2004/05.8 This study estimates
that the old age pension scheme reaches about 5.3% of the elderly population (aged 65
and above) in India, while state schemes for widow pensions reach about 6.6% of the
widow population. The coverage figures for Rajasthan are close to the national average
for old age pensions at 5.3% of the elderly population but slightly lower for widow
pensions at 5.3% of the widow population. In addition, about 0.3% of all households
receive disability pensions all-India compared to 0.5% of households in Rajasthan. The
estimates of coverage obtained from the RSPS for old age pensions are comparable to
those obtained in the national study, but higher for widow and disability pensions,
possibly due to the fact that this survey was purposively designed to capture this
population whereas the HDPI survey is a more general nationally representative sample.
Coverage rates from the RSPS imply lower coverage than what is reported in
administrative data. More importantly, coverage is lower than would be expected given
the poverty headcount rate for rural Rajasthan as well as for the allocation formula used
by the central government for making the NOAPS transfer. Old age pensions cover about
6% of the elderly, widow pensions cover about 12% of widows and disability pensions
about 9% of the disabled population (see Table 2).
• These coverage rates are all lower than the rural poverty rate in Rajasthan - 20%
of the population in rural Rajasthan was below the poverty line in 2004/05. While
there is some evidence nationally from NSS survey data that poverty rates among
the elderly and widows are similar or slightly lower than that among the general
population.9 However, disabled households in rural areas have much higher than
8 Ajwad 2006. 9 Pal and Palacios (2008) find no difference between headcount poverty ratios among households with and without a member aged 65+.

16
average poverty rates than that among the general population.10 As a result, even
if the program was perfectly targeted and all actual pensioners were poor, low
coverage implies significant exclusion errors, particularly among the disabled
population. Imperfect targeting implies even higher exclusion errors as not all
pensioners are destitute (see the next section on targeting).
• In addition, the old age pension coverage rates imply significantly lower coverage
than that mandated under the NOAPS guidelines. Under NOAPS, central funding
is allocated on the basis that old age pensions would cover 50% of the elderly
population that is below the poverty line. Using updated population estimates for
2006 and assuming similar poverty rates among the elderly as among the general
population, this would imply coverage of at least 10% of the elderly population.
• Overall, the survey-based coverage rates are lower than those obtained using
administrative data on the number of pensions as a share of the relevant
population (using the shares of elderly and widows in the rural or total female
population estimates11 respectively). While some of these differentials could be
due to the fact that the administrative figures are crudely estimated, at least some
portion is likely to be due to duplication and/or ghost pensioners. For instance, in
Dungarpur, the coverage of old age pensions according to administrative figures
is about ten percentage points higher than that estimated from the survey data. A
recent exercise conducted by the district administration revealed several instances
of fake pension records, leading to cancellation of about 1300 pensions in 2006.
At the same time, it is possible that, in districts where the survey-based estimates
of coverage of widowed pensions are higher than the administrative estimates,
elderly widowed pensioners are classified as old age pensioners (OAP) rather than
widow pensioners (DWP) by the administration even though the pensioners report
themselves as widowed pensioners. There is an incentive to classify elderly
widowed pensioners as old age pensioners as these benefit from a central
government contribution for these pensions. However, since the administrative
data is not computerized, it is not possible to check this supposition.
10 World Bank (a, forthcoming). 11 Using 2006 projected population derived from the 2001 Census.

17
• About one-fourth of the old age pensions are combined pensions for elderly
couples (where there is a joint pension order and total benefit of Rs. 300 per
month rather than Rs. 200 per person per month on separate pension orders).
Table 2: Coverage using the Rajasthan social pension’s survey
RSPS estimates (rural) Admn. estimates
OAP as % elderly population
DWP as % widow population
DIS as % disabled population
OAP as % elderly
population
DWP as % widow
population
Rural poverty headcount (2004/05)
All 5.79 11.93 9.43 9.78 12.86 20.07 Ajmer 8.42 19.19 17.29 8.34 17.85 13.5 Bundi 9.2 23.47 23.79 8.87 22.14 11.7 Dungarpur 33.45 23.17 24.64 45.45 20.5 37.8 Ganganagar 12.09 12.95 10.67 13.58 12.64 24.7 Jaisalmer 0.96 2.45 1.44 1.67 4.3 24.7 Jalore 17.69 13.34 11.98 22.55 9.71 24.7 Jhalawar 14.78 28.98 9.41 11.66 13.55 11.7 Jhunjhunu 4.01 13.89 11.25 5.6 7.29 13.5
Source: RSPS (2006); Administrative data from Dept. of Social Welfare, GoR, NSSO 61st round. Note: a\ Survey-based coverage rates were estimated as follows: OAP as % of elderly estimated as the number of rural pensions as a share of the rural elderly population (obtained from the weighted sample of actual and potential pensioners). Administrative coverage rates estimated as explained in notes to Figure 1. b\ Rural poverty headcount ratios are estimated for the four agro-climatic regions in Rajasthan – western (Ganganagar, Jaisalmer, Jalore), south-eastern (Bundi, Jhalawar), southern (Dungarpur) and north-eastern (Ajmer, Jhunjhunu) – using NSSO data for 2004/05. However, coverage rates also vary widely by district depending on pension type (see
Table 2). At one extreme is Jaisalmer with very low coverage while at the other extreme
is Dungarpur with high coverage of all three types of pensions. Comparing this against
the rural headcount ratio for the agro-climatic regions in which these districts fall
suggests instances of over-coverage in some districts – Jhalawar for old age pensions,
Ajmer, Bundi, Jhalawar and Jhunjhunu for widow pensions, and Ajmer and Bundi for
disability pensions. However, with the exception of Bundi and Jhalawar, survey-based
coverage rates are lower than the administrative figures. It should be noted, however, that
the administrative figures are obtained using rough estimates of the elderly and widows
in projected population estimates. Even taking this into account however, the variation in
the ratio of actual to reported beneficiaries varies greatly.
The most notable outlier is Jaisalmer with almost negligible coverage of any pension,
particularly abysmal given the high poverty incidence in the district. While coverage in

18
all other districts is at least half or two-thirds of poverty incidence, in Jaisalmer coverage
of any pension is less than 10% of poverty incidence. Findings from the survey
(discussed in the next section) reveal that the administration of the scheme is also
particularly poor in Jaisalmer relative to the other districts in the sample. One, the
application process is costly with high transport costs, long application periods and high
out-of-pocket expenses, and two, even after pensions are sanctioned; there are more
problems of irregular disbursements and leakage in Jaisalmer compared to other districts.
This suggests that coverage in this district may be exceptionally low not only because of
poor capacity to administer this scheme (and associated problems of outreach), but also
due to the lack of incentive among potentially eligible pensioners to apply for a scheme
that has a costly and difficult application procedure and yields uncertain and irregular
benefits once sanctioned.
There are also large fluctuations in the administrative data on the aggregate numbers at
the district-level in the last couple of years between 2004/05 and 2005/06. The reasons
behind these fluctuations are not clear and it would be useful to analyze the
administrative records to understand the factors behind some of the dramatic changes in
the number of pensions by district and hence in coverage.
3. Targeting
This section examines how well these programs target the poor. In particular, the focus is
on whether these criteria are actually enforced in practice and how well they identify the
poor.
(a) Who is eligible? Social pension schemes in India are designed to reach destitute elderly, widows and
persons with disabilities who have no regular means of subsistence from their own
sources of income or through financial support from family members or other sources.
Thus, the key eligibility criteria are age, widowhood and destitution. An additional
criterion for disability pensions is a doctor’s certificate verifying at least 40% severity of
disability (such that the nature of the disability does not allow the individual to earn a

19
living). There have been several changes in the age and destitution criteria over time that
can sometimes result in confusion in the field among the implementing officers (see
Section B and Table 1). In particular, there seems to be some confusion regarding the use
of Below Poverty Line or BPL status (as per the BPL census conducted by the Ministry
of Rural Development) – this appears to be an over-riding criteria as per Department of
Social Welfare guidelines but these may not be reflected in the Department of Finance
rules. However, interviews with Sarpanches indicate that the most commonly used
destitution criteria in all eight districts is the possession of a BPL or AAY ration card12 or
some combination of BPL card, income and land criteria.
There is some evidence that the use of BPL status to identify pension beneficiaries is
likely to lead to significant exclusion and inclusion errors in Rajasthan. Examining the
pattern of ration card holding13 across the asset distribution in Rajasthan indicates that
about 70% of the poorest quintile did not have BPL/AAY card while 13% of the richest
quintile possessed either BPL or AAY card (see Table 3). There are concerns about the
use of this method nationally as well.
Table 3: Ration card holding across the asset distribution, 2004/05
BPL card AAY card APL card No card Poorest quintile 27.1 3.1 62.4 7.4 Q2 27.6 3.7 62.1 6.6 Q3 23.2 2.6 70.0 4.2 Q4 16.6 4.5 76.3 2.6 Richest quintile 9.2 4.1 83.0 3.6 Total 20.9 3.7 70.5 4.9
Source: Ajwad 2006 using the 2004/05 NCAER Human Development Profile of India survey. Note: The figures in bold italics indicate inclusion and exclusion errors. Additionally, interviews with implementing officers and focus group discussions with
actual and potential pensioners strongly suggest that these criteria may be unnecessarily
stringent and instrumental in excluding the destitute. For instance, qualifying for the
disabled pension requires a doctor’s certificate verifying severity of disability as 40%.
12 AAY refers to the Antodyaya Anna Yojna, a food grain distribution program targeted at the poorest of the poor. 13 See World Bank (b, forthcoming) for a discussion. Note that ration cards are issued by the Department of Food and Civil Supplies for access to the public (food) distribution system (PDS) and are not necessarily identical to the BPL status. The latter is assigned on the basis of a BPL census conducted by the Department of Rural Development conducted every five years. However, ration cards in Rajasthan are

20
Department of Social Welfare guidelines specifically mention “pensions to physically
handicapped, blind and disabled persons”. As a result, among disabled pensioners, the
share of blind pensioners is higher than their population share, while that of deaf or
mentally ill or mentally retarded persons is much lower than their population share. This
could be related to the ease of physical verifiability with respect to the disability
certificate, suggesting that in practice blindness in particular would be more likely to be
reflected. Interviews in field also suggest that criteria such as the loss of or inability to
use one or more limb, blindness in both eyes, etc. are used to indicate disability to the
extent that it hinders the person’s ability to earn a living. There is a strong case for
making the destitution criteria clearer and to rationalize/relax the family member criteria.
In particular, the 40% severity of disability criteria needs to be clearly defined so that an
operational definition can be used uniformly in the field.14
(b) How well are these criteria enforced in practice? The survey data suggest that the demographic criteria are followed strictly with almost
100% of beneficiaries satisfying the age, widowhood or disability criteria in the three
pension schemes. The average age of old age pensioners is 71 years, 99% of widowed
pensioners are widowed (a tiny proportion are elderly male), and almost 100% of
disabled pensioners are disabled. About a third of old age pensioners are widows (see
Table 4). The few discrepancies appear to be a case of misclassification of the pension
received. For instance, the five old age pensioners that do not meet the age criteria of the
old age pension scheme are widowed. Similarly, the sole disabled pensioner who does
not report any disability is 78 years old.
issued broadly on the basis of the BPL census and there is likely to be a large overlap between the two. 14 See World Bank (a, forthcoming) on the challenges of identification and certification of disability.

21
Table 4: Percentage of actual and potential beneficiaries
satisfying the eligibility criteria Overall Group A Group B % who satisfy demographic criteria Elderly 99.81 99.59 99.83 Widows 99.84 98.79 100.00 Disabled 99.98 99.80 100.00 % who satisfy demographic and BPL/AAY card criteria Elderly 38.12 57.65 35.85 Widows 47.57 50.88 47.07 Disabled 41.65 41.96 41.61 % who satisfy demographic, BPL/AAY card and adult son/grandson criteria Elderly 18.42 30.46 17.02 Widows 20.33 32.86 18.44 % who satisfy demographic and income criteria Elderly 57.22 68.50 55.90 Widows 60.91 70.22 59.50 Disabled 43.73 43.77 43.73 % who satisfy demographic, income and adult son/grandson criteria Elderly 29.16 43.29 27.51 Widows 33.78 55.29 30.54
Source: RSPS 2006. Note: Income criteria is defined here as monthly household income less than or equal to Rs. 1000. The official poverty line for rural Rajasthan defines a household as poor if the monthly per capita consumption is less than Rs. 374.57. The average household size in the RSPS is 3.79, implying monthly household consumption of Rs. 1420. This maps roughly into the RSPS question on monthly income classes (less than Rs. 500 and Rs. 510-Rs.1000; where income excludes gifts and money from friends and relatives). However, only about 31% of old age and 33% of widowed pensioners meet all applicable
eligibility criteria – demographic, destitution (BPL) and no family members – and it
appears that the eligibility criteria are not strictly enforced in practice. About 44% of
disabled beneficiaries also satisfy the demographic and destitution criteria. However, it
was not possible to examine whether these pensioners also met the additional criteria of a
disability certificate. These certificates are typically given by assessment and certification
teams at district hospitals. In addition to the physical and financial cost of going to
district hospitals, there is some evidence that vacancies for essential medical posts at
districts facilities in Rajasthan have led to major problems with certification. In light of
this, some disability NGOs now monitor doctors’ attendance and completion of
certification in district hospitals on specified days. Alternatively, special camps are
organized to raise awareness of social pensions where disability identification and

22
certification are done on the spot. This is a more accessible approach, but it still faces
major challenges in both scale of outreach and human resource capacity to go to scale.15
(c) How well do these criteria target the poor? Targeting is generally progressive with respect to caste, income class and asset ownership
for old age and widow pensions though less so for disability pensions.
• Coverage of old age and widow pensions is highest among ST and SC
population. ST and SC households are very heavily represented among old
age and widowed pensioners, especially the former, with the proportion of
these households among beneficiaries higher than that in the population.
Among disabled pensioners, SC households are also proportionally over-
represented but so are OBC households (see Figure 3 for coverage amongst
the relevant populations).
Figure 3: Coverage by caste
0
5
10
15
20
Elderly Widow Disabled
Pension type
Cov
erag
e
ST
SC
OBC
General
Note: Coverage rates among the elderly population for old age pensioners, among widow population for widowed pensioners and among disabled population for disabled pensioners
• Old age and widow pensions also appear to be reasonably well targeted with
respect to income, but the disability pensions are less so (being almost flat
across the income distribution). The highest old age pension coverage rates
are among the poorest households with income less than Rs. 500 per month
(see Figure 4). Widow pensions do reach the poor but do not target the poorest
15 World Bank (a, forthcoming).
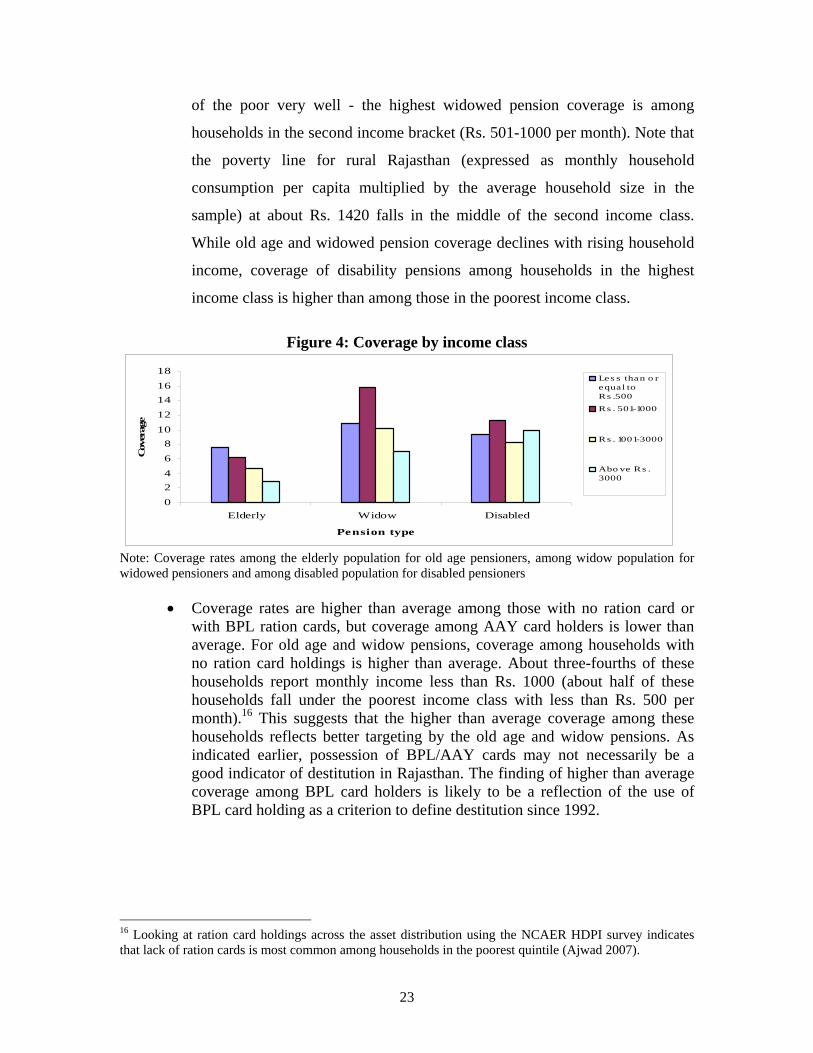
23
of the poor very well - the highest widowed pension coverage is among
households in the second income bracket (Rs. 501-1000 per month). Note that
the poverty line for rural Rajasthan (expressed as monthly household
consumption per capita multiplied by the average household size in the
sample) at about Rs. 1420 falls in the middle of the second income class.
While old age and widowed pension coverage declines with rising household
income, coverage of disability pensions among households in the highest
income class is higher than among those in the poorest income class.
Figure 4: Coverage by income class
02468
10
12141618
Elderly Widow Disabled
Pension type
Cov
erag
e
Les s than o requal toRs .500
Rs . 501-1000
Rs . 1001-3000
Abo ve Rs .3000
Note: Coverage rates among the elderly population for old age pensioners, among widow population for widowed pensioners and among disabled population for disabled pensioners
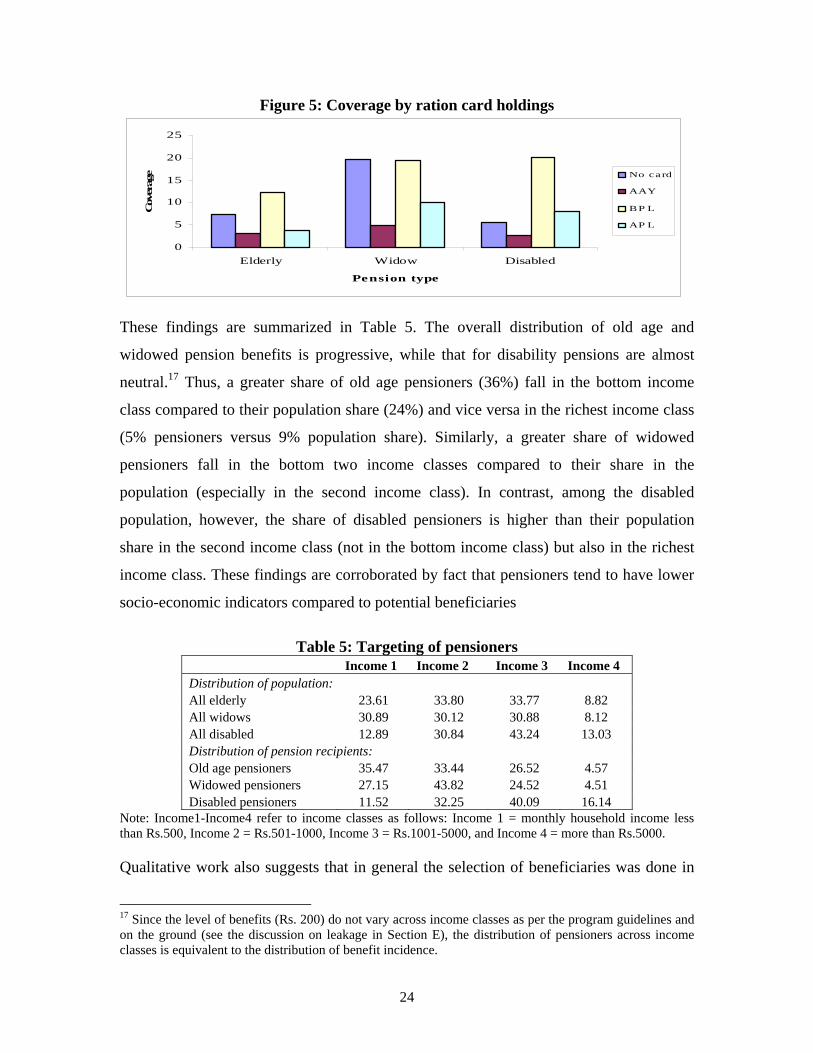
• Coverage rates are higher than average among those with no ration card or with BPL ration cards, but coverage among AAY card holders is lower than average. For old age and widow pensions, coverage among households with no ration card holdings is higher than average. About three-fourths of these households report monthly income less than Rs. 1000 (about half of these households fall under the poorest income class with less than Rs. 500 per month).16 This suggests that the higher than average coverage among these households reflects better targeting by the old age and widow pensions. As indicated earlier, possession of BPL/AAY cards may not necessarily be a good indicator of destitution in Rajasthan. The finding of higher than average coverage among BPL card holders is likely to be a reflection of the use of BPL card holding as a criterion to define destitution since 1992.
16 Looking at ration card holdings across the asset distribution using the NCAER HDPI survey indicates that lack of ration cards is most common among households in the poorest quintile (Ajwad 2007).
24
Figure 5: Coverage by ration card holdings
0
5
10
15
20
25
Elderly Widow Disabled
Pension type
Cov
erag
e No card
AAY
BP L
AP L
These findings are summarized in Table 5. The overall distribution of old age and
widowed pension benefits is progressive, while that for disability pensions are almost
neutral.17 Thus, a greater share of old age pensioners (36%) fall in the bottom income
class compared to their population share (24%) and vice versa in the richest income class
(5% pensioners versus 9% population share). Similarly, a greater share of widowed
pensioners fall in the bottom two income classes compared to their share in the
population (especially in the second income class). In contrast, among the disabled
population, however, the share of disabled pensioners is higher than their population
share in the second income class (not in the bottom income class) but also in the richest
income class. These findings are corroborated by fact that pensioners tend to have lower
socio-economic indicators compared to potential beneficiaries
Table 5: Targeting of pensioners
Income 1 Income 2 Income 3 Income 4 Distribution of population: All elderly 23.61 33.80 33.77 8.82 All widows 30.89 30.12 30.88 8.12 All disabled 12.89 30.84 43.24 13.03 Distribution of pension recipients: Old age pensioners 35.47 33.44 26.52 4.57 Widowed pensioners 27.15 43.82 24.52 4.51 Disabled pensioners 11.52 32.25 40.09 16.14
Note: Income1-Income4 refer to income classes as follows: Income 1 = monthly household income less than Rs.500, Income 2 = Rs.501-1000, Income 3 = Rs.1001-5000, and Income 4 = more than Rs.5000. Qualitative work also suggests that in general the selection of beneficiaries was done in
17 Since the level of benefits (Rs. 200) do not vary across income classes as per the program guidelines and on the ground (see the discussion on leakage in Section E), the distribution of pensioners across income classes is equivalent to the distribution of benefit incidence.

25
accordance with at least the demographic eligibility criteria but that the criteria
themselves may be unnecessarily stringent and instrumental in excluding the destitute.
Interviews with the Sarpanch indicate no evidence of ceilings on the maximum number
of pensions in the GP and no political pressure with respect to the selection of
beneficiaries. This was reinforced by the focus group discussions in that only in a few
GPs in some of the sample districts were there cases of ineligible persons receiving social
pensions while eligible persons were unable to get pensions sanctioned. Overall, there is
not much evidence of political pressure or barriers to selection. In fact, the single most
important factor for getting pension sanctioned as cited by actual and potential
beneficiaries in focus group discussions is meeting the eligibility criteria. Interviews with
the Sarpanch indicate that the most commonly used destitution criteria in all eight
districts is the possession of a BPL or AAY ration card or some combination of BPL
card, income and land criteria. However, these criteria may be unnecessarily stringent,
leading to the exclusion of the poorest. There is a strong case for making the destitution
criteria clearer and to rationalize/relax the family member criteria. In particular, BPL
status is not necessarily a good indicator of destitution and the 40% severity of disability
criteria needs to be clearly defined so that an operational definition can be used uniformly
in the field.
These findings are broadly consistent with other studies examining social pensions in
various states, including a recent evaluation of old age and widow pension in Karnataka
(Murgai 2007), an eight-state evaluation of the national social assistance program
(including NOAPS) conducted in 1998 by ORG (see also Saxena 2005), a Helpage
(1999) study in Uttar Pradesh and an assessment of social pensions in Himachal Pradesh
(Government of HP, 2005). Though the ORG report is now dated and does not cover
Rajasthan, it is nevertheless interesting to see the similarities in the findings of this report
and the current study in Rajasthan. The ORG report finds that NOAPS coverage among
SC/ST, landless, illiterate households is high, about 40-60% of NOAPS beneficiaries
were women, more than 95% of NOAPS beneficiaries met the age criteria. Thus, NOAPS
appears to be fairly well targeted but may still not adequately reach the poorest of the
poor. The majority of these states had adopted the BPL criteria for defining destitution.
However, in Orissa and Kerala destitution is defined using an annual income ceiling and
26
in Gujarat and MP destitution is defined using some measure of the number of adult
members in the family. Karnataka and Himachal Pradesh also have an annual income
ceiling. Rajasthan follows the earning member criteria and the more recently introduced
BPL criteria. The ORG report finds that in all cases establishing the destitution criteria is
problematic and the onus of authenticating destitution in these eight states was on the
Panchayat or village functionaries. However, awareness of the destitution criteria among
these functionaries was low. Interviews with Sarpanches in the sample GPs indicate that
awareness of eligibility and the application process is low in Rajasthan as well. With
respect to the findings on administration, the Himachal study also finds that there are
high transaction costs in the application process, but the administration of the scheme is
fairly smooth once pensions are sanctioned. For instance, the application process in HP
was fairly lengthy with only 25% sanctioned within six months and the average time
taken is slightly over a year. An interesting innovation in HP relates to selection of
pensioners – this is done almost entirely through the gram sabha (village-level meeting)
in the majority of districts, though also through the tehsil office in some districts. Once
pensions are sanctioned, payments are largely timely. There are high satisfaction levels
with the scheme, particularly with respect to selection procedure and regular payments
but the amount is perceived as insufficient (the benefit amount at the time of the HP study
was approximately Rs.100 depending on pension type).
Similarly, these findings are consistent with those of a comparable study in Karnataka
conducted in 2006.18 This study also finds largely pro-poor targeting of benefits and
remarkably low leakages of public funds, but with considerable variation within the state.
Like Rajasthan, transaction costs in application are high in Karnataka but once pensions
are sanctioned, the delivery of benefits works smoothly with minimal costs imposed on
the beneficiaries. One significant difference is with respect to coverage - Karnataka has
substantially higher coverage of old age (17% of the elderly population) and widowed
(27% of the widowed population) pensions compared to Rajasthan. The other significant
difference between the two states relates to the administration of the scheme (discussed in
18 Murgai 2007.

27
the next section) - in contrast to full computerization in Karnataka, record-keeping in
Rajasthan is poor and only partially computerized.
4. Participation
Participation in these social pension schemes is an outcome of the following two factors –
one, the demand for pensions from potential recipients (in turn, contingent on awareness
of the scheme, complexity of the application procedure and perceived benefits) and two,
the supply of pensions (linked to possible rationing of pensions by area, depending on the
availability of funds and/or on administrative capacity). In addition, administrative
capacity could also influence expressed demand – for instance, complex and lengthy
procedures may discourage potentially eligible individuals to apply for pensions. This is
discussed at length in the Section E. In particular, given the nature of targeting,
participation would be contingent on satisfying the above-mentioned administrative
criteria.
In this section, we explore the determinants of participation using probit regression
models of the probability of receiving a pension (see Table A2 in Appendix II for the full
regression models). The explanatory variables include individual characteristics
(including age, gender, literacy, disability, marital status, employment status) and
household characteristics (such as social group, household size, adult son or grandson,
village development index and district controls). Different specifications also include
criteria to capture destitution, including monthly income and ration card holding (see
Table 6 below for the models using ration card holding as a measure of destitution).
These factors largely have the expected effects and the models explain a fair amount of
the variation (for old age and widowed pensions at least).19 For instance, the probability
of receiving old age and disability pensions is higher among older individuals while men
have a lower probability of receiving old age pensions. These findings are probably due
to the fact that elderly widows tend to get covered under the partially centrally-funded old
age pensions instead of the state-funded widowed pensions. Among persons with
disabilities, the probability of receiving a disability pension is higher for older
19 Estimating these probit regression models separately by district (results available with the author) indicate that the same factors determine participation in the program across districts.

28
individuals, men and for blind persons relative to any other form of disability.
Table 6: Probit regression model of participation
Dependent variable: whether or not the individual is an old-age, widow or disabled pensioner OAP DWP DIS Age (years) 0.0163*** -0.0076*** 0.0022* (0.0042) (0.0015) (0.0013) Male -0.4382*** .. 0.0931** (0.0332) .. (0.0451) Literate -0.1098 -0.1595** 0.0464 (0.0703) (0.0705) (0.0471) Scheduled tribe 0.0775 -0.0966 0.0094 (0.0722) (0.0720) (0.0781) Scheduled caste 0.1216* -0.0589 0.0643 (0.0646) (0.0624) (0.0675) Other backward caste 0.0360 -0.1016* 0.0699 (0.0643) (0.0595) (0.0625) AAY ration card 0.1654** 0.1554** 0.1066 (0.0657) (0.0655) (0.0928) BPL ration card 0.2431*** 0.2026*** 0.0532 (0.0425) (0.0413) (0.0437) No ration card 0.1267 -0.0236 -0.0190 (0.1068) (0.0942) (0.1321) HH size -0.0300*** -0.0209** 0.0014 (0.0093) (0.0086) (0.0086) Adult son/grandson -0.1096** -0.2509*** -0.0184 (0.0466) (0.0425) (0.0510) Knows local officials 0.1754* 0.2495*** 0.1071 (0.0964) (0.0666) (0.0712) Village development index 0.0043 0.0306*** 0.0132 (0.0117) (0.0119) (0.0114) Pseudo_R2 0.2352 0.1724 0.0683 Log-Likelihood -393.3106 -464.3385 -334.7857 Observations 751 815 574
Note: *, ** and *** denote the level of significance – 10%, 5% and 1% respectively. Standard errors in parenthesis. Marginal effects are computed at the mean for continuous variables and as impact effects for dummy variables. The village development index is a cumulative score derived from presence of village school, health facility, anganwadi center, electricity, post office, bank, black top road, irrigation and water facilities). Controls for district included in all and for nature of disability included for modeling participation in disability pensions. In general, the probability of being an old age or widow pension recipient is somewhat
higher among disadvantaged individuals – pensioners are more likely to be illiterate and
belong to a scheduled tribe or caste (old age pensioners only). Similarly linked to the
eligibility criteria, possession of an AAY or BPL card significantly increases the

29
probability of receiving old age and widowed pensions.20 Similarly, for old age and
widowed pensions, the existence of an adult son or grandson has a significantly negative
effect on the probability of receiving these pensions. For disability pensions, in contrast,
none of these factors have a significant effect. Thus, these models suggest that the
destitution and family member criteria for eligibility are not rigidly enforced in the case
of disability pensions. This is not to argue that that the current criteria should necessarily
be rigidly enforced as the existing criteria may be too stringent, as discussed in the
previous section.
The role of administrative capacity is captured to some extent in the district dummies (see
Table A2 in the Appendix). Thus, the probability of receiving a pension of any kind is
significantly lower if the potential beneficiary resides in district Jaisalmer (and in Jalore
for receiving a disability pension) relative to the base, Jhunjhunu. This is reflected in the
poor performance of Jaisalmer with respect to implementation of the scheme as examined
in Section E.
Probit regression models to examine delays of more than three months from the time of
application to sanction of pensions among current pensioners also suggest a stronger role
for administrative factors rather than individual characteristics.21 Thus, the district
dummy variables are jointly significant in explaining delays longer than three months,
with the probability of delays being higher in some districts than others, indicating
differences in administrative capacity to implement the scheme. Among widow pensions,
the village development index is a significant determinant of delay – the more developed
a village (as measured by the presence of various public facilities), the lower the
probability of a delay longer than three months. Possibly, such villages have been more
successful in obtaining public amenities and facilities and residents benefit from these
better links with the state. On the other hand, for old age and widow pensions, social
20 Alternative specifications (see Table A2 in the Appendix) also suggest that the probability of receiving an old age or widow pension is higher among low income households (less than Rs.500 for old age pensioners and less than Rs.1000 for widowed pensioners). In contrast, the probability of receiving a disability pension is lowest among individuals with the lowest household income (less than Rs.500 per month) relative to those in the highest income bracket (more than Rs.5000 per month). 21 Results of these and OLS regression models (with the time taken for sanctioning pensions) are available from the author.

30
status does not significantly influence whether or not the pensioner had to wait longer
than three months to get the pension sanctioned. In contrast, for disability pensions, social
status (caste and tribal affiliation) as well as economic status (as captured by ration card
holding) is a significant determinant of delay, with more disadvantaged groups waiting
longer for pensions. It could be that the source of this delay lies in difficulties in
understanding and proving eligibility – the most common problem reported by
pensioners, particularly disabled pensioners, in accessing this scheme (see Section E). It
is likely that this is more of a problem among disadvantaged groups such as BPL and
SC/ST.
5. Usage of pension benefits
Pension benefits are the primary source of support for three-fourths of the beneficiaries,
while further 21% pensioners cite these are their second main source of support.22 Half
the current pensioners report spending the pension benefits on their own needs while 39%
report sharing these benefits with their families (see Figure 6). Only a small proportion
hand over the entire amount to the family to spend and very few pensioners are in a
position to save.
Figure 6: Typical use of pension benefits (% households)
Source: RSPS 2006.
22 The reliance on pension benefits is naturally higher among the small proportion of households with more than one current pensioner (2.75% among Group A households) – 82% of pensioners in these households cite pension benefits as their main source of support.
Primary source of support
0 2 0 40 6 0 80
PanchayatNone
TempleRelatives
Co mmunityOther g ov. p ro g
Pens ion
% ho us e ho ld s
Typical use of pension money
52%39%
5% 2% 2%
s pent fully o n s e lf s ha re pa rtly with familyto ta l amo unt to family s ave and s hare pa rt with familys ave and s pent pa rt o n s e lf

31
E. Administration of the scheme
This section examines the administration of the social pension scheme, with respect to the
application process as it proceeds in practice, the disbursement process and leakages with
respect to shortfalls in the pension payments, and finally on record-keeping and
monitoring aspects.
1. Application process
(a) The application process on paper and in practice On paper. The application process is somewhat cumbersome, requiring a fair amount of
documentation. Application forms are available free of cost at the office of the Gram
Panchayat, Tehsil and District Treasury. There is a provision to accept applications on
plain paper as well in case printed forms are not available. Supporting documents
required for proof of age include any one of the following (in the order of preference) -
school certificate, register of birth (maintained by the GP), latest electoral roll or
certificate of age granted by the Block Development Officer or Tehsildar on receipt of a
written statement supported by two witnesses. Widowed applicants are also required to
submit a copy of the death certificate of the deceased husband and disabled applicants are
required to submit a doctor’s certificate verifying disability. The completed forms can be
submitted to the Gram Panchayat or Tehsil office. The forms are forwarded to the
enquiry officer (typically the village patwari). The enquiry officer verifies eligibility with
respect to age, widowhood, local residence, family members, income or sources of
livelihood and disability criteria. In particular, the enquiry officer checks the family
ration card. Verification should as far as possible be completed within a month from the
date of receipt of the application. These verified applications are sent to the sanctioning
officer – the Block Development Officer. Once the decision to sanction the pension has
been taken, the applicant is asked to submit two photographs attested by MP/MLA,
Sarpanch of Panchayat Samiti, Zilla Pramukh or a gazetted officer of the state
government. Once the BDO approves, the Treasury issues pension sanction orders.
Once a pension has been sanctioned, the District Treasury Officer or Sub-Treasury

32
Officer is responsible for payment of pensions. The pension is payable with effect from
the date of the sanction and ceases on the death of the pensioner or on the date on which
s/he ceases to fulfil the eligibility criteria (e.g., male son or grandson attains the age of
20). The pension also ceases during episodes of migration, though it may be resumed
following a personal visit to the Treasury or Sub-Treasury officer on the pensioner’s
return. For pensioners to receive money order payments rather than personal cash
collection, the Treasury or Sub-Treasury officer may instigate enquiries directly or
through the post office in case money order acknowledgement receipts are delayed by
more than a month. If a money order is returned three months in succession, the
pensioner’s account is suspended by the treasury. Pensioner receiving money order
payments must submit additional documents including a “Life Certificate” authorized by
specified local authorities every six months to the Treasury or Sub-Treasury Officer. In
case of doubt, the officer can request physical verification before releasing the amount of
the pension. In addition, annual verification is required for all pensioners through a
physical visit to the Treasury or Sub-Treasury office in April. In practice. Applications are overwhelming submitted to the Gram Panchayat
functionaries, as per the guidelines. Overall, about three-fourths of all applications (both
successful applications by Group A households and pending applications by Group B
households) are submitted to the Sarpanch or Gram Panchayat member. A further 9-11%
are submitted to either the Gram Panchayat or block-level Panchayat Samiti office and a
smaller proportion directly to the district-level Tehsildar office and the village patwari.
There are variations across districts – though the vast majority of applications are
submitted to the Sarpanch or Panchayat members, a higher than average share of
applications is submitted directly to the village patwari (e.g., Dungarpur) or the Tehsildar
(e.g., Ganganagar).
Physical verification of living conditions of applicants in order to verify whether they
meet the destitution criteria is not done in the majority of cases. Only just over a third of
current pensioners had received a visit from a government official (meant to be the
village patwari as per the guidelines) in order to verify their application and check the
eligibility criteria (see Figure 7). However, there are wide variations across the districts,

33
ranging from a high of 70-80% in Jalore and Jhalawar to a low of 19-23% in Ajmer,
Bundi, Ganganagar and Jaisalmer. Similarly, only a third of current pensioners report
regular visits by a government official once the pension has been sanctioned, with the
same pattern across districts as in the case of verification visits at the time of application.
Only 3% of potential pensioners received a visit from a government official in connection
with their application.
Figure 7: % of Group A households reporting verification visit
by a government official
0 10 20 30 40 50 60 70 80 90
Ajmer
BundiDungarpurGanganaga
JaisalmerJalore
Jhalawar
Jhunjhunu
% households
(b) Time taken for sanctioning pensions The average time taken for sanctioning pensions is about six months, with some variation
across districts. The bulk – 81% - of successful pension applications (i.e., among actual
beneficiaries in Group A households) were processed in six months or less, while 36%
were sanctioned in three months or less. A further 13% were sanctioned between six
months and a year. There is some variation across districts (see Figure 8) – 93% of
applications in Jhalawar are sanctioned within six months, while the corresponding figure
for Ajmer is 56%. Some applications - ranging from 3% in Dungarpur to about 10% in
Jalore - took up to two years to get sanctioned, while a small proportion of applications in
four districts took more than two years to get sanctioned. 72% of current pensioners were
successful in getting a pension in the first attempt while 22% submitted two applications
before getting a pension sanctioned. It should be noted that only part of these delays can
be attributed to bureaucratic inefficiencies as some of the waiting period could arise from
the imposition of quotas on the number of pensioners by geographic/administrative unit.

34
It is not possible to isolate these intrinsic waiting-list delays from the survey data.
However, interviews with district and block officials suggested that quotas are not
imposed in practice. This seems reasonable given that program coverage in the state is
just about at par with that mandated under NOAPS.
Figure 8: Time taken for sanctioning of pension application
0102030405060708090
100
Ajmer
Bund
i
Dunga
rpur
Ganga
naga
Jaisa
lmer
Jalore
Jhala
war
Jhun
jhunu
% h
ouse
hold
s
Three months or less 3 - 6 months 6 months-1 year > 1 year
(c) Level of complexity and transparency in the process and associated costs Both qualitative and quantitative data indicate that the process of approval, verification
and sanction is complex and costly. These problems are compounded by the lack of
awareness of these procedures among households as well as local village level
functionaries.
• About 60% of current pensioners reported one or more major difficulty in
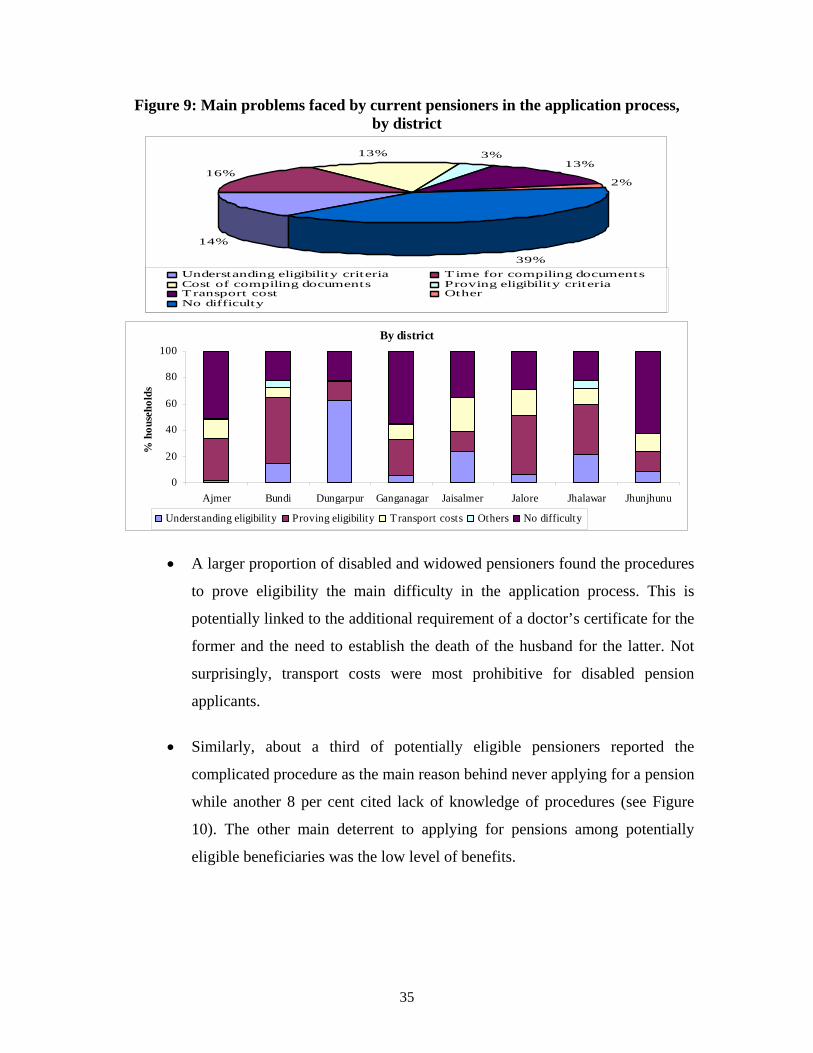
getting their pensions sanctioned (see Figure 9).
• Among those who did face difficulties, the main problems relate to
understanding the eligibility rules, the time and cost of compiling the
necessary documentation for proving eligibility and the transportation costs
involved in the application process (see Figure 9). Again, there are variations
across districts – e.g., a much smaller proportion of households in high
coverage districts (with the exception of Dungarpur) cited understanding the
eligibility criteria as a major problem.
35
Figure 9: Main problems faced by current pensioners in the application process, by district
14%
16%
13% 3%13%
2%
39%Understanding eligibility criteria T ime for compiling documentsCost of compiling documents Proving eligibility criteriaTransport cost OtherNo difficulty
By district
0
20
40
60
80
100
Ajmer Bundi Dungarpur Ganganagar Jaisalmer Jalore Jhalawar Jhunjhunu
% h
ouse
hold
s
Understanding eligibility Proving eligibility Transport costs Others No difficulty
• A larger proportion of disabled and widowed pensioners found the procedures
to prove eligibility the main difficulty in the application process. This is
potentially linked to the additional requirement of a doctor’s certificate for the
former and the need to establish the death of the husband for the latter. Not
surprisingly, transport costs were most prohibitive for disabled pension
applicants.
• Similarly, about a third of potentially eligible pensioners reported the
complicated procedure as the main reason behind never applying for a pension
while another 8 per cent cited lack of knowledge of procedures (see Figure
10). The other main deterrent to applying for pensions among potentially
eligible beneficiaries was the low level of benefits.

36
Figure 10: Main deterrents to applying for pensions
as cited by potential pensioners Group B HHs: Reasons for never applying
0 10 20 30 40
Other
Too complicated
Don't know how
Not eligible
Benefit too lit t le
Too costly
% households
A common complaint by both village officials and applicants was that the process was
not transparent, especially with respect to information on the status of applications and
reasons for rejection at the sanctioning authority level. 60 per cent of applicants whose
application had been rejected were not aware of the reason. Similarly, interviews with
Sarpanches also indicated that they did not know why applications were rejected at
higher levels or even the status of applications in the system. However, where the reasons
were known these usually related to incomplete or incorrect application form or
ineligibility of the applicant. This is reflection of the low level of awareness among the
applicants and, more worryingly, among the Sarpanches on the eligibility criteria and
necessary supporting documentation for the application. In this context, there have been
some reported instances of applicants, with the help of NGOs in urban centers, using the
Right to Information Act in order to discover the status of their pension applications.23
However, it is unlikely that applicants in rural areas will adopt this approach, nor should
it be necessary – the process of application, verification and sanction should be
transparent.
(d) Costs incurred in the application process The average expenditure incurred in the application process (including costs of obtaining
documents, transport costs, unofficial payments or bribes) is not insignificant at Rs.151
per pensioner, i.e., about three-quarters of the monthly pension benefit.
• The average cost of applying for an old age and widow pension is somewhat
23 http://www.rtiindia.org/forum/443-citizen-uses-rti-get-elusive-pension.html

37
comparable at Rs.131 and Rs.150 per pensioner, but the expenditure incurred
in applying for a disabled pension is considerably higher at Rs.211 per
pensioner. The higher cost for disability pensions could be related to the
additional criteria for a doctor’s certificate or higher transport costs.
• The average expenditure varies across districts – ranging from a low of Rs.93
in Dungarpur to Rs.527 in Jaisalmer. Jaisalmer is a notable outlier – the
average expenditure across the remaining seven districts amounts to Rs.126,
with Dungarpur, Ganganagar, Jalore, Jhalawar and Jhunjhunu clustering
around Rs.100 and Ajmer and Bundi clustering around Rs.185. The high cost
of applying for a pension in Jaisalmer is most probably linked to the high
transport costs given the large distances between villages and even block
headquarters.24 This is supported by the fact that, in Jaisalmer, the average
expenditure incurred during the application process is the highest for those
households that cite transport costs as the largest difficulty in getting pensions
sanctioned.
2. Disbursement process
(a) Mode of disbursement Disbursement of pension is through a mix of money orders and cash - two-thirds of social
pensions are disbursement through money orders and the remaining one-third are
collected by pensioners in person from the district Treasury office.
• Payments in Ajmer, Jhunjhunu, Jaisalmer and Jalore districts are almost entirely
through money orders dispatched through the postal system (see Table 7). The
reverse is the case in Dungarpur and Jhalawar where about 90% of pensions are
disbursed through cash paid out at the district Treasury office. Consistent with what
households report, interviews with the Treasury officers in all eight districts also
indicate a dual system of payments.
• Not surprisingly, the disbursement of pensions through money orders is highly
24 The average distance between the sample villages and the block headquarters in Jaisalmer is 83 km compared to 26 km in the remaining seven districts.
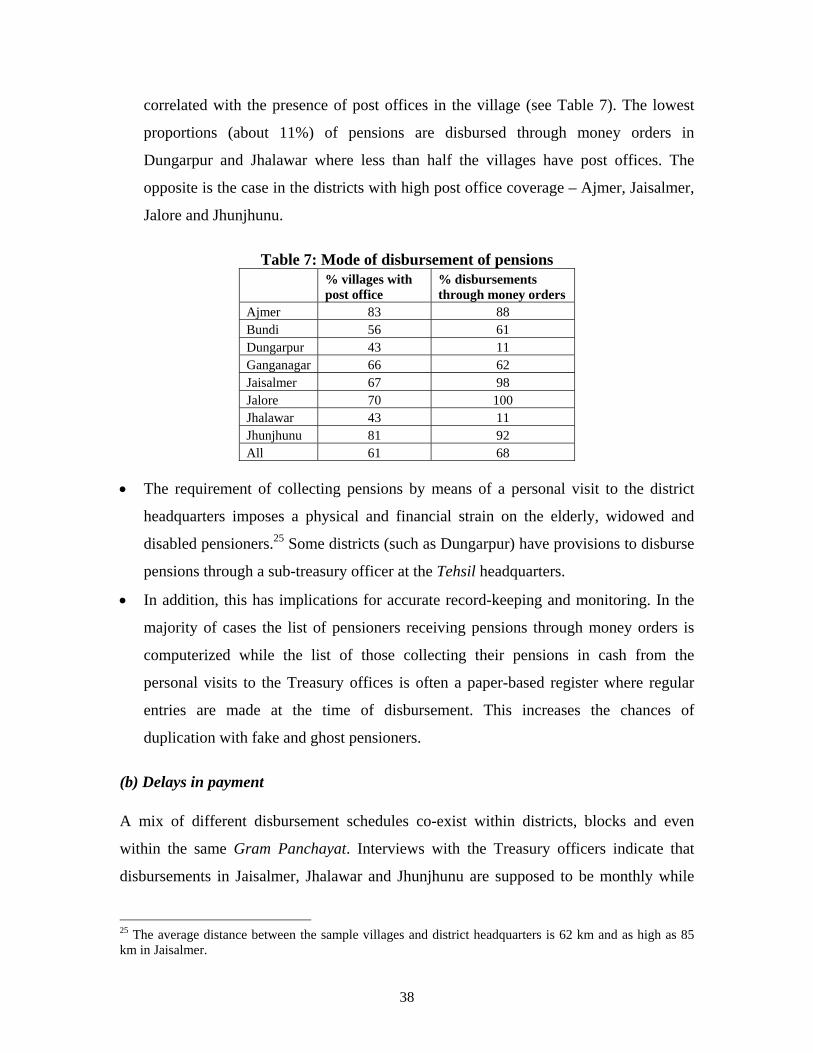
38
correlated with the presence of post offices in the village (see Table 7). The lowest
proportions (about 11%) of pensions are disbursed through money orders in
Dungarpur and Jhalawar where less than half the villages have post offices. The
opposite is the case in the districts with high post office coverage – Ajmer, Jaisalmer,
Jalore and Jhunjhunu.
Table 7: Mode of disbursement of pensions
% villages with post office
% disbursements through money orders
Ajmer 83 88 Bundi 56 61 Dungarpur 43 11 Ganganagar 66 62 Jaisalmer 67 98 Jalore 70 100 Jhalawar 43 11 Jhunjhunu 81 92 All 61 68
• The requirement of collecting pensions by means of a personal visit to the district
headquarters imposes a physical and financial strain on the elderly, widowed and
disabled pensioners.25 Some districts (such as Dungarpur) have provisions to disburse
pensions through a sub-treasury officer at the Tehsil headquarters.
• In addition, this has implications for accurate record-keeping and monitoring. In the
majority of cases the list of pensioners receiving pensions through money orders is
computerized while the list of those collecting their pensions in cash from the
personal visits to the Treasury offices is often a paper-based register where regular
entries are made at the time of disbursement. This increases the chances of
duplication with fake and ghost pensioners.
(b) Delays in payment A mix of different disbursement schedules co-exist within districts, blocks and even
within the same Gram Panchayat. Interviews with the Treasury officers indicate that
disbursements in Jaisalmer, Jhalawar and Jhunjhunu are supposed to be monthly while
25 The average distance between the sample villages and district headquarters is 62 km and as high as 85 km in Jaisalmer.

39
the remaining five districts make bi-monthly disbursements. However, this is not entirely
consistent with the frequency reported by pensioners themselves and with the actual
pattern of payments reported over the previous three months. The survey data suggest
that a mix of different frequencies of pension payments co-exist within even the same
Gram Panchayat so that pensioners within the same district, block or even Gram
Panchayat may receive pension payments at different intervals. At the district-level, we
find that disbursement is almost entirely on a monthly basis in Ajmer and Jhalawar and
largely so in Jaisalmer, but largely on a bi-monthly basis in Bundi and Ganganagar (see
Figure 11). The remaining three districts have a mix of different disbursement schedules
ranging from monthly, bi-monthly to quarterly. There are also significant problems of
irregular or no pension payments in two districts - Jaisalmer and Jalore (discussed
below).
Figure 11: Frequency of pension’s payments as reported by pensioners
Disbursement schedules
0102030405060708090
100
Ajmer Bundi Dungarpur Ganganagar Jaisalmer Jalore Jhalawar Jhunjhunu
% h
ouse
hold
s
Monthly Bi-monthly Quarterly Irregular No payments
Though disbursements are largely as per schedule in the state as a whole, there are a few
problem districts with instances of either no payments, irregular disbursement schedules
as reported by the households or significant instances of delays in payments from the
usual schedule.
• Interviews with block and district-level officials indicate that transfer of funds
from the state to the district treasury offices are timely.26
26 In some states the change in the transfer of NOAPS funds to the state treasuries rather than directly to the district rural development authority (DRDA), combined with weak monitoring of the program by the centre, has resulted in instances of diversion of funds for other uses and consequent delays in transfers to districts for pension payments. See Saxena 2005.

40
• Though for the state as a whole only 2% of pensioners report receiving pensions
on an irregular basis (i.e., with no fixed schedule but with the pattern of actual
payments suggesting payments only once in four months or even once a year),
this is a serious problem in two districts – Jaisalmer and Jalore (see Figure 11
above).
• Equally of concern is the significant proportion of pensioners who report not only
no fixed disbursement schedule but have also received no payments in the
pervious three months in these two districts – 12% in Jaisalmer and 2% in Jalore –
as well as another 3% in Bundi (see Figure 11 above).
• Another source of irregular payments as reported by households is deviation from
the usual schedule (see Figure 12 below). About 9% of pensioners who are
supposed to receive monthly payments report delays in actual payments. Again
Jaisalmer and Jalore are the worst performers along with Ganganagar. Overall,
delays in payments are less commonly reported by those who are supposed to
receive pension payments once in two or three months, again with the exception
of Jaisalmer.
• Irregular payments either as a result of no fixed schedule or due to delays in
payments even though there is a fixed disbursement schedule are much more
common in the cases where pensions are paid through money orders rather than
cash. 97% of pensioners reporting no payments in the three months preceding the
survey and 66% of those reporting delays in payments receive their pensions
through money orders. Interviews with the state and district treasury officials
indicated that the capacity of post offices to handle a large volume of money
orders is a key constraint and this might be one of the reasons behind the large
proportion of delays in money order payments, particularly when the payments
are supposed to be made on a monthly basis. However, these findings could be
driven by the high incidence of delays in Jaisalmer and Jalore, both of which
disburse pensions almost entirely through money orders, and could be a reflection
of specific district administrative capacity rather than problems in the postal
system.

41
Figure 12: Irregular disbursements % payments not disbursed as per schedule
0
10
20
30
40
50
Ajmer Bundi Dungarpur Ganganagar Jaisalmer Jalore Jhalawar Jhunjhunu
% h
ouse
hold
s
Monthly Bi-monthly Quarterly The majority (three-quarters) of pensioners report no problems in receiving their pension.
Among those who do, however, 13% pensioners report delays in payments as the single
biggest problem. This is particularly significant in three high-coverage districts –
Dungarpur, Ganganagar and Jalore (see Figure 13). A further 2% of pensioners cite
regular verification visits to the district treasury offices as the second largest problem.
Figure 13: Problems in pensions
0
20
40
60
80
100
Ajmer Bundi Dungarpur Ganganaga Jaisalmer Jalore Jhalawar Jhunjhunu
% h
ouse
hold
s
Delay in payment Info rmal payment to po s tman Info rmal payments to o ffic ia ls
Verifica tio n pro blems Others No difficulty
3. Leakage
Overall, leakage appears to be low. However, this represents lower bound estimates as
leakages arising from duplicate or fake pensioners in administrative records are not taken
into account here. Leakage could take many forms including the incidence of duplicates
in the administrative records, fictitious or ghost pensioners (either due to fake entries in
the administrative records or the non-suspension or continuation for those who have died
or moved or are no longer eligible), and through bribes or theft. The next section

42
discusses the features of the current system of record-keeping that makes the first two
sources of leakage likely. However, as information on detailed administrative records is
not available, this note focuses on the third source of leakage – i.e., shortfalls in the
pension amount due to amounts paid to the postman, Sarpanch or officials involved in
implementation.
The majority of pensioners report receiving exactly the full amount of the pension
amount, but there were some problem districts, especially in the case of combined old age
pensions. About 87% of those receiving single pensions and 84% of those receiving joint
old age pensions received exactly the right amount - Rs. 200 and Rs. 300 per month -
over the three months preceding the survey (see Table 8). However, there are significant
variations across districts, with Jaisalmer emerging as the worst performer with 22%
reporting no payments at all and only 53% reporting receiving the full amount of Rs. 200.
In two districts – Jaisalmer and Ganganagar, a substantial proportion of pensioners report
receiving exactly Rs. 150 or Rs. 100 per month. Similarly, among the joint-old age
pensioners, a further 15% reported receiving exactly Rs. 200 per month. This suggests
that there might be additional problems in updating the benefit level for older pension
orders at least in some cases.
Table 8: Distribution of pensioners reporting shortfalls in pension payments
Old age, widow and disability pensions Joint old age pensions
Rs. 200
Rs. 150
Rs. 100
< Rs. 100
> Rs. 200
No payments Rs. 300 Rs. 200
< Rs. 200
No payments
All 87 4 3 2 1 3 84 15 1 0 Ajmer 99 1 0 0 0 0 .. .. .. .. Bundi 90 1 4 1 0 4 97 3 0 0 Dungarpur 94 0 0 1 3 2 81 19 0 0 Ganganagar 74 10 8 6 3 0 85 12 2 0 Jaisalmer 53 12 5 8 0 22 .. .. .. .. Jalore 91 2 4 1 0 2 .. .. .. .. Jhalawar 98 0 0 0 2 0 100 0 0 0 Jhunjhunu 90 5 2 0 3 0 .. .. .. ..
Note: Sample sizes for joint old age pensioners were zero or not eligible in Ajmer, Jaisalmer, Jalore and Jhunjhunu. With the exception of two districts – Jaisalmer and Ganganagar - pension payments are
clustered around the correct amount – Rs.200 per month for individual pensions and Rs.
300 per month for joint old age pensions. Ajmer emerges as the district with the least
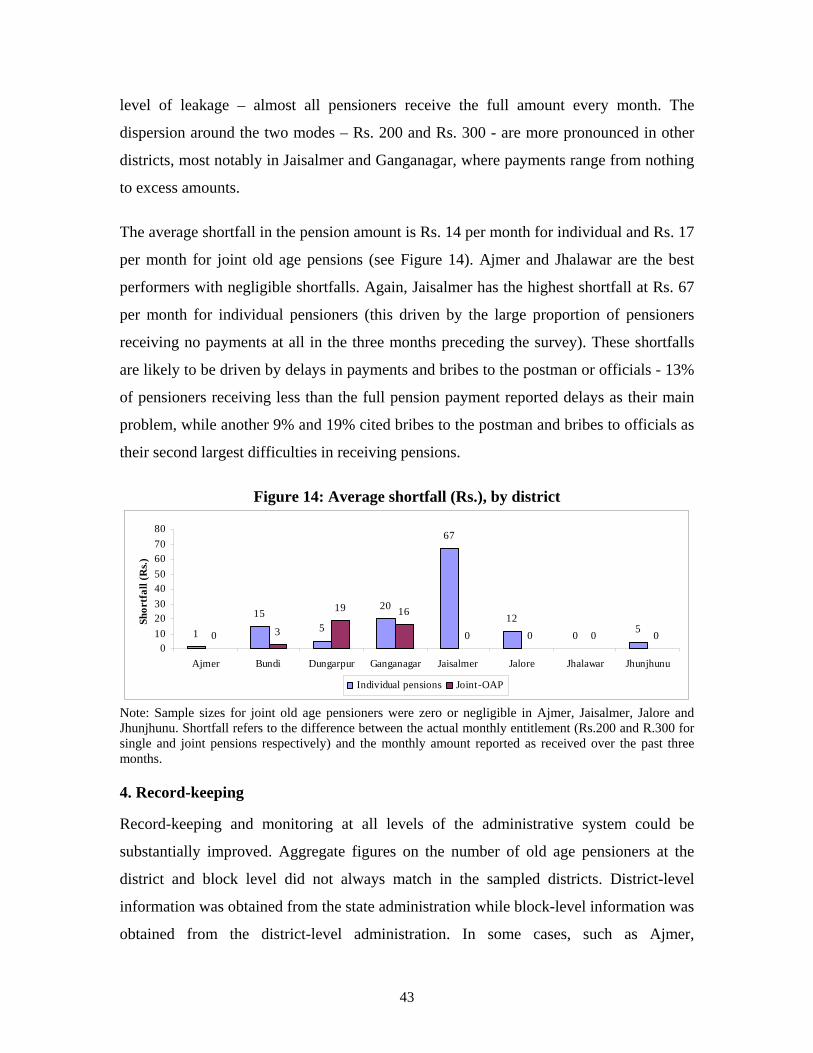
43
level of leakage – almost all pensioners receive the full amount every month. The
dispersion around the two modes – Rs. 200 and Rs. 300 - are more pronounced in other
districts, most notably in Jaisalmer and Ganganagar, where payments range from nothing
to excess amounts.
The average shortfall in the pension amount is Rs. 14 per month for individual and Rs. 17
per month for joint old age pensions (see Figure 14). Ajmer and Jhalawar are the best
performers with negligible shortfalls. Again, Jaisalmer has the highest shortfall at Rs. 67
per month for individual pensioners (this driven by the large proportion of pensioners
receiving no payments at all in the three months preceding the survey). These shortfalls
are likely to be driven by delays in payments and bribes to the postman or officials - 13%
of pensioners receiving less than the full pension payment reported delays as their main
problem, while another 9% and 19% cited bribes to the postman and bribes to officials as
their second largest difficulties in receiving pensions.
Figure 14: Average shortfall (Rs.), by district
1
155
20
67
120 50 3
19 16
0 0 0 00
1020304050607080
Ajmer Bundi Dungarpur Ganganagar Jaisalmer Jalore Jhalawar Jhunjhunu
Shor
tfal
l (R
s.)
Individual pensions Joint-OAP
Note: Sample sizes for joint old age pensioners were zero or negligible in Ajmer, Jaisalmer, Jalore and Jhunjhunu. Shortfall refers to the difference between the actual monthly entitlement (Rs.200 and R.300 for single and joint pensions respectively) and the monthly amount reported as received over the past three months. 4. Record-keeping
Record-keeping and monitoring at all levels of the administrative system could be
substantially improved. Aggregate figures on the number of old age pensioners at the
district and block level did not always match in the sampled districts. District-level
information was obtained from the state administration while block-level information was
obtained from the district-level administration. In some cases, such as Ajmer,
44
Ganaganagar and Jaisalmer where a substantial share of the population is urban, this is
discrepancy can largely be ascribed to the fact that the block-level figures relate to rural
old age pensions only and hence, are lower than the total district-level figure. In the
remaining five districts, the number of old age pensioners obtained at the district-level is
actually less than the total number obtained by adding up the block-level information.
There is an urgent need to reconcile the aggregate figures, both with respect to the large
fluctuations over time and the level of administration, and to computerize the record-
keeping system.
Records are only partially computerized at the block and district level, making it more
difficult to control problems of ghost and duplicate beneficiaries. Interviews with the
Block Development Officers in all 20 blocks in the sample revealed that there is only
partial computerization of records. The District Treasury Officers also indicated that
pensions were disbursed through both cash collection at the treasury office or through
money orders. Separate lists were usually maintained for these – usually a manual list for
the former mode of disbursement and a computerized one for the latter. There did not
seem to be any system of reconciling these two lists to minimize duplication of names in
both lists. Anecdotal evidence suggests that there are indeed some instances of ghost
pensioners where pensions are being paid out either to fake names or even after the death
of the pensioner. In Dungarpur, for instance, the district administration cancelled about
1300 pensions in 2006 as these were found to be fake. A recent study of social pensions
in Karnataka found that is a significant source of leakage where 6% of elderly and widow
pension records were duplicates and 9% of pensioners could not be traced at their given
address due to movement or death.27
In the absence of computerized records, the current requirement of annual physical
verification of the pensioner at the treasury office is not sufficient to check the incidence
of fake pensioners. One of the features of the social pension scheme in Rajasthan is the
requirement of annual verification of current pensioners by means of a physical visit to
the district or sub-district Treasury office in order to ensure continued disbursement.
Another tool to check fraud is the requirement for re-verification through a visit to the
45
treasury if the money order is returned undelivered from the address of the pensioner. In
practice, about 61% of current pensioners report having had to get their eligibility
verified in the past year. This figure was exceptionally low for Bundi (10%) and Ajmer
(21%) but more than 75% in the remaining six districts. While this is useful in reducing
the incidence of ghost and fake pensioners, it comes at a potentially high cost to the
elderly, widowed and disabled beneficiaries, often living at some distance from the
district headquarters.28
Record-keeping at the Gram Panchayat level is also very poor. Overall, only about 30%
of panchayats maintain lists of pensioners (see Table 9). Of these panchayats, about
three-fourths keep separate registers for old age, widowed and disabled pensioners.
Again, there is variation by district. Bundi does particularly well in this respect with
about 85% of panchayats keeping separate registers by type of pension. On the other
hand, none of the panchayats in Jhalawar and Jhunjhunun, keep any records of
pensioners. Computerization, not surprisingly, is not common at the panchayat-level and
only one panchayat in Ganganagar maintains computerized records of pensioners. The
separation of registers by pension type is fairly recent – the majority of panchayats
separated lists between 2002 and 2005.
Table 9: % GPs that maintain records of pensioners
A register of pensioners
Separate registers by pension type
All 29.17 76.91 Ajmer 16.64 100 Bundi 85.29 100 Dungarpur 4.71 0 Ganganagar 36.04 23.09 Jaisalmer 35.20 71.03 Jalore 43.96 23.08 Jhalawar 0 0 Jhunjhunu 0 0 Source: RSPS 2006
A well-designed and computerized system of record-keeping and monitoring is essential.
For an effective monitoring system, every level of administration should be able to
27 Murgai 2006. 28 The average distance between the sample villages and district headquarters is 62 km and as high as 85 km in Jaisalmer.

46
generate accurate and consistent aggregate figures at any level of disaggregation and
details even at the lowest level of disaggregation (i.e., the individual pensioner) should be
readily available to authorized users. Once such a system is in place, it would be possible
to link this with the register of births and deaths in order to check the possibility of old
age pensions being disbursed even after the death of the pensioner. It could also be used
as a platform to link into other state schemes to expand social security, for instance
through the ongoing state life insurance scheme to provide survivor benefits to BPL
households or the recently launched national initiative to provide subsidized health
insurance for BPL households through the Rashtrya Swasthya Bima Yojna.
F. Conclusions and recommendations
Social pension schemes in India are about to expand dramatically following a recent
central government initiative to significantly expand coverage and increase benefits. This
policy change enhancing the scope of this program makes it imperative to assess the
performance of the program on the ground and to identify areas for improvement before
expanding the scheme. This paper examines the performance and administration of these
schemes in the Indian state of Rajasthan with respect to program awareness, coverage,
targeting and leakage as well as delivery mechanisms.
The overall assessment is a positive one and there is a strong case for considering social
pensions as the model for social assistance. Overall, satisfaction levels with the social
pension scheme are high – with both beneficiaries and officials rating social pensions as
better or at least as good as other anti-poverty programs on various aspects including
regularity and level of benefits, targeting and transfers in cash rather than food. Though
there is high transaction costs associated with the application process, the majority of
pensioners report no problems once the pension is sanctioned. Disbursements are largely
as per schedule and leakages in the form of shortfalls in the pension amount are low.
These shortfalls may be due to bribery or theft or because the benefit level for older
pension orders is not updated. Note that this represents lower bound estimates as leakages
arising from duplicate or fake pensioners in administrative records are not taken into
account here. Also, there are wide variations across districts with some districts emerging

47
as particularly poor performers on all fronts. The reason for this inter-district variation is
not clear. There appear to be no significant differences in household or pensioner
characteristics across districts and the factors determining participation follow a similar
pattern across districts, implying differential administrative capability on the supply-side
rather than issues on the demand-side. Some districts in particular would need special
attention to address inter-related problems of very low coverage, high leakage and large
delays in payments.
At the same time there are clear areas for improvement on both the policy and
administration side. There is evidence of under-coverage and there is high transaction
costs associated with the application process. Though targeting is reasonably
progressively targeted, though less so for disability pensions, targeting is far from perfect
and the eligibility criteria are not strictly enforced. There is a strong case for relaxing,
rationalizing and clarifying some of the existing criteria. Taking this further, it would be
useful to move towards universal pensions for these social categories given the greater
vulnerability of households headed by the elderly, widows or disabled persons as well as
the possibility of intra-household discrimination against these groups in co-resident
households. In 2006/07, the central government also announced its intention of
expanding social security coverage to the unorganized sector through subsidized
contribution from BPL and other workers. In this context, social assistance through the
social pension program can be considered an integral component of old age security
provisions.
On the administration front, several basic issues relating to implementation need to be
addressed, particularly with respect to transaction costs in the sanction of pensions, wide
inter-district variations in performance within the state and inadequate record-keeping
and monitoring. Thus, there are high transaction costs associated with the complicated
and costly process of application, verification and sanction of pensions. These problems
are compounded by the lack of awareness of these procedures among households as well
as local village level functionaries and the lack of transparency in the sanctioning
process. There is no uniform mode or frequency of disbursement even within the same
village, with a third of pensions being collected by pensioners in person from the treasury

48
or sub-treasury office. This is both inconvenient and time-consuming and this imposes a
physical and financial strain on the elderly, widowed and disabled pensioners.
Disbursements are largely as per schedule in the state as a whole, there are a few problem
districts with instances of either no payment, irregular disbursement schedules as reported
by the households or significant instances of delays in payments from the usual schedule.
Since pension benefits are the main source of support for about 75% of pensioners,
delays in payments or payments at a less than monthly frequency could have serious
negative consequences.
Record-keeping and monitoring at all levels of the administrative system could be
substantially improved. There is an urgent need to reconcile the aggregate figures, both
with respect to the large fluctuations over time and the level of administration, and to
computerize the record-keeping system at least the treasury level. Lists of pensioners
need to be maintained at the Gram Panchayat level as well. The maintenance of separate
lists for pensioners receiving pensions through money orders and cash – the former is
computerized while the latter is paper-based - increases the chances of duplication with
fake and ghost pensioners. A well-designed and computerized system of record-keeping
and monitoring is essential. There is a strong case for moving towards a single system of
automated disbursements through money orders or directly into bank or post office
accounts paid out accordingly to a uniform schedule. While this is naturally related to the
coverage of post offices in the district and their capacity to process money orders, this
could be managed by staggering the disbursement date of payments in accordance with
post office capacity.
In light of the recent initiative to expand the coverage of NOAPS, it is encouraging that
the analysis in this paper finds that social pension scheme in Rajasthan is largely a well-
functioning scheme. Evidence from a comparable study of social pensions in Karnataka
and other independent studies in Himachal Pradesh also suggest that this is well-
performing scheme that could be scaled up effectively, especially if the policy and
implementation issues identified in these assessments can be addressed.

49
References Ajwad, M. I. (2007) “Performance of Social Safety Net Programs in Uttar Pradesh”,
Social Protection Discussion Paper No. 0714, World Bank.
Deaton, A and C. Paxson (1997) “Poverty among Elderly and Children in Developing
Countries.” Manuscript.
Government of Himachal Pradesh (2005). Evaluation Study of Beneficiaries under Old
Age, National Old Age and Widow Pension Scheme, Project Report, Department of
Economics and Statistics, Government of Himachal Pradesh.
Government of Rajasthan, Department of Finance, Government rules and orders, various
years.
Murgai, R. (2006) “Do Public Funds Reach the Destitute? Assessment of Leakages and
Targeting of Social Pension Programs in Karnataka”, manuscript.
Pal, S. and R. Palacios (2006) “Old Age Poverty in the Indian States: What the
Household Data can Say? Draft.
Palacios, R. and O. Sluchynsky (2006) “The Role of Social Pensions”, Pension Reform
Primer, World Bank.
Saxena, N.C. (2005) “Rural Poverty Reduction through Centrally Sponsored Schemes.”
Background Paper prepared for World Bank India Safety New Review.
World Bank (2006), Rajasthan – Closing the Development Gap, World Bank.
World Bank (a, forthcoming), People with Disabilities in India: From Commitments to
Outcomes, World Bank.
World Bank (b, forthcoming), Social Protection for a Changing India, World Bank.

50
Appendix I: Rajasthan Social Pensions Survey - Sampling Design The empirical analysis in this note draws on the Rajasthan Social Pensions Survey
(RSPS) commissioned for this study. This survey was administered to about 2140
households spread across 20 blocks in 8 districts during May-July 2006.
Districts: The districts were selected with probability proportional to size (pps), using the
total number of the old age pensioners in the district as a measure of size. These figures
are from administrative data on rural and urban pensions obtained from the Department
of Social Justice, GoR).29 The probability of district d being selected:
s
dd OAP
OAPp ×= 8
where the subscript d stands for the selected district, the subscript s for the state and OAP
for old age pensions.
Blocks: Next, blocks were selected with probability proportional to size (pps) of the old
age pensioners in the block. Three blocks were selected in the four districts with a high
number of old age pensioners (Ajmer, Dungarpur, Ganganagar and Jalore) and two
blocks were selected in the four districts with a low number of old age pensioners (Bundi,
Jhalawar, Jaisalmer, Jhunjhunu). The probability of block b being selected in district d:
( )d
bbdbd OAP
OAPnpp ××=
where subscript b stands for the selected block and bn for the number of blocks per
district (2 and 3 in districts with low and high number of old age pensioners respectively).
The total number of pensioners in the block were obtained from the district
administration and refer only to rural pensions.
Gram Panchayats: Within each block, four Gram Panchayats were chosen with equal
probability of selection. The probability of GP g in block b in district d being selected is:
29 Note that Jaipur and Udaipur were explicitly excluded from the sample as these were largely urban centers while the focus of this study was on rural areas.

51
( )g
bdgbd Npp 4
×=
where subscript g stands for the selected GP and gN is the total number of GPs in the
block.
Households: Lastly, a listing exercise was conducted within each GP enquiring about the
presence of actual and potential beneficiaries of the social pensions scheme. Two groups
of households were sampled:
• Group A: households with at least one current beneficiary of the social pension
scheme; and
• Group B: households with at least one member who is potentially eligible for a social
pension but does not currently receive one.
As our population of interest in this survey is households that are currently or potentially
eligible for a social pension, households without any current, former or potential
beneficiary of the social pension schemes are explicitly excluded.
First, a sample of disabled actual and potential pensioners was drawn. In order to obtain a
sufficient sample of this population, these households were over-sampled and the weights
are constructed accordingly. In each group (group A - actual beneficiaries of disability
pensions and group B - potential beneficiaries of disability pensions), five households
were selected with equal probability. However, not all GPs had even 5 households that
were actual or potential beneficiaries of disability pensions. In these villages, all the
actual or potential disabled beneficiary households were selected:
( ) ⎟⎟⎠
⎞⎜⎜⎝
⎛×=
dis
disgbdhgbd N
App
…in each group (A and B); where the subscript h stands for household, dis for disabled and disN is the total disabled
population in the GP in that group; disA is the actual number of disabled households
sampled if 5<disN and five otherwise.

52
Next, in both group of actual and potential beneficiaries of old age and widow pensions,
ten households each are selected with equal probability. In cases where the disabled
pensioners (actual or potential) are less than five, then 15 less the total number of
disability pensions ( disA ) were selected from the population of the actual and potential
beneficiaries of old age and widow pensions:
( ) ⎟⎟⎠
⎞⎜⎜⎝
⎛ −×=
+dwpoap
disgbdhgbd N
Npp
15
…in each group (A and B); where dwpoapN + is the total population of OAP and DWP beneficiaries in the GP in that
group. In case even the OAP and DWP coverage was low, then all such households were
selected:
( ) 1×= gbdhgbd pp …if 10;5 << +dwpoapdis NN
In all, approximately 30 households were selected with probability proportional to size of
the relevant population in the GP.
53
Appendix II: Rajasthan Social Pensions Survey – Profile of respondents The sample respondents in the RSPS are largely from disadvantaged groups with low
levels of literacy and limited or no means of income (see Table A1). Only 18% of the
sample are literate and almost half (48%) are unable to work due to old age or other
reasons. Those that are engaged in some form of economic activity are largely employed
in casual labor. More than a quarter belong to a scheduled caste, another 18% to a
scheduled tribe and 38% to other backward castes. Almost a quarter of the households
report monthly incomes of less than Rs. 500 over the last six months while over half
(53%) possess BPL or AAY ration cards. Though rates of co-residence are high, there is
a significant proportion of elderly (18%) and widows (13%) living alone (or with other
elderly or widows). A smaller share of persons with disabilities (3%) also live alone
(largely older PWDs).
The demographic profile of the actual and potential pensioners is the following: the
average age of the sample respondents is 55 years, about 46% are male and 27% are
disabled (of which the majority are have an orthopedic disability or are blind). Pension
recipients tend to have worse socio-economic characteristics than non-recipients
suggesting that pensioners come from more needy families. Pensioners belong to
households in a lower income bracket - about 69% of Group A households report
monthly household income of Rs.1000 or less compared to about 56% of Group B
households. Note that the monthly household income for Group A households could
include income from pensions and so would be even lower if this amount is excluded.
Compared to non-recipients, pensioners are more likely to be from a scheduled caste or
tribe, more likely to possess BPL or AAY ration cards (though this is most likely to be a
reflection of the use of BPL card holding as a criteria to define destitution), and are more
likely to be engaged in casual labor. The main source of livelihood for Group A
households is less secure than for Group B households – 19% of Group A households are
engaged in casual wage employment compared to 14% of Group B households.
Conversely, a larger proportion of Group B households are engaged in regular wage
work. Among Group A households, households with a disabled pensioner appear to be
better-off with respect to livestock ownership, household income, larger household size
compared to the old age and widow pension beneficiaries.

54
Table A1: Profile of respondents
Overall Group A - Actual
pensioners Group B - Potential
pensioners OAP DWP DIS OAP DWP DIS Demographics Age (years) 55.02 71.01 50.41 36.65 69.40 59.39 35.42 % Male 46.21 61.56 0.45 80.33 94.19 0.00 69.31 % Widow 46.12 34.43 98.43 3.83 0.00 100.00 6.65 % Literate 18.36 5.66 10.29 45.90 14.37 8.42 41.18 % Disabled 27.15 0.94 0.89 99.45 0.00 0.00 100.00
of which: Orthopedic 69.47 75.64 73.62 Blindness 13.16 7.95 9.66 Others 17.37 16.40 16.72
Social group % ST 18.32 23.11 17.23 12.57 17.43 18.75 17.39 % SC 27.90 30.66 29.31 29.51 24.77 26.36 26.60 % OBC 37.52 34.43 35.57 44.26 40.67 37.77 37.08 % others 16.26 11.79 17.90 13.66 17.13 17.12 18.93 HH economic status % in following income class:
Less than Rs.500 22.80 33.02 24.83 13.11 20.80 22.83 15.60 Rs. 501-1000 39.53 40.09 46.31 42.62 40.67 32.34 35.55 Rs. 1001-3000 30.28 22.17 24.38 29.51 30.89 36.41 39.90 Above Rs. 3000 7.38 4.72 4.47 14.75 7.65 8.42 8.95
% BPL/AAY ration card 53.41 66.75 63.76 49.73 42.20 45.92 45.27 % no ration card 3.41 2.36 4.25 2.19 2.75 5.71 2.56 Living arrangements % Elderly only 17.57 40.09 11.19 2.73 25.69 14.67 3.32 % Widow only 12.71 14.15 27.96 0.00 0.00 21.74 1.79 % Disabled only 2.57 0.24 0.45 11.48 0.00 0.00 7.93 Household size 4.00 3.25 3.39 4.58 4.50 4.15 4.71 % Has adult son/grandson 46.73 54.95 35.57 22.40 68.20 66.85 25.06 % Receive support from sons.. 44.89 41.90 46.30 30.11 48.85 57.14 31.98 Economic activity Self employed 7.99 8.02 4.47 13.66 12.84 2.45 10.49 Regular wage work 2.90 1.65 2.91 1.09 4.59 2.72 3.84 Casual agricultural labor 6.68 3.77 11.19 2.19 6.42 8.15 5.63 Other casual labor 10.19 4.95 23.04 6.01 8.26 10.87 4.09 Did not work 1.07 0.71 1.12 2.19 0.00 1.09 1.79 Attended domestic duties 19.63 10.85 34.23 12.57 3.36 37.50 12.53 Unable to work due to old age 47.62 70.05 22.37 53.01 63.61 35.87 47.31 Attending educational institutions 2.62 0.00 0.00 8.20 0.00 0.00 10.49 Others 1.31 0.00 0.67 1.09 0.92 1.36 3.84

Table A2: Probit regression model of participation (marginal effects) Dependent variable: Whether or not the individual is OAP, DWP or DIS pension recipient
OAP OAP OAP DWP DWP DWP DIS DIS DIS Age (years) 0.0169*** 0.0161*** 0.0163*** -0.0109*** -0.0078*** -0.0076*** 0.0023* 0.0023* 0.0022* (0.0041) (0.0042) (0.0042) (0.0014) (0.0015) (0.0015) (0.0012) (0.0013) (0.0013) Male -0.4290*** -0.4400*** -0.4382*** 0.1005** 0.0941** 0.0931** (0.0329) (0.0328) (0.0332) (0.0447) (0.0451) (0.0451) Literate -0.1354** -0.1586** -0.1098 -0.1246* -0.1576** -0.1595** 0.0331 0.0286 0.0464 (0.0675) (0.0682) (0.0703) (0.0680) (0.0694) (0.0705) (0.0475) (0.0476) (0.0471) Orthopedic disability 0.0080 0.0110 0.0061 (0.0543) (0.0548) (0.0552) Blind 0.1573* 0.1572* 0.1495 (0.0929) (0.0932) (0.0919) Scheduled tribe 0.1186* 0.1028 0.0775 -0.0809 -0.0496 -0.0966 0.0042 0.0137 0.0094 (0.0676) (0.0700) (0.0722) (0.0688) (0.0707) (0.0720) (0.0775) (0.0789) (0.0781) Scheduled caste 0.1626*** 0.1528** 0.1216* -0.0473 -0.0367 -0.0589 0.0730 0.0721 0.0643 (0.0609) (0.0625) (0.0646) (0.0603) (0.0615) (0.0624) (0.0679) (0.0681) (0.0675) Other backward caste 0.0659 0.0629 0.0360 -0.0834 -0.0803 -0.1016* 0.0759 0.0707 0.0699 (0.0619) (0.0631) (0.0643) (0.0573) (0.0587) (0.0595) (0.0625) (0.0628) (0.0625) HH monthly inc < Rs. 500 0.2028** 0.0165 0.2189*** 0.0528 -0.1656*** -0.1839*** (0.0826) (0.1043) (0.0746) (0.0981) (0.0616) (0.0669) HH inc Rs. 501-1000 0.1268 -0.0133 0.1825** 0.0792 -0.0808 -0.0948 (0.0870) (0.0980) (0.0770) (0.0885) (0.0664) (0.0709) HH inc Rs. 1001-5000 0.0793 0.0357 0.0167 -0.0068 -0.1618*** -0.1650*** (0.0881) (0.0940) (0.0809) (0.0842) (0.0626) (0.0634) AAY ration card 0.1654** 0.1554** 0.1066 (0.0657) (0.0655) (0.0928) BPL ration card 0.2431*** 0.2026*** 0.0532 (0.0425) (0.0413) (0.0437) No ration card 0.1267 -0.0236 -0.0190 (0.1068) (0.0942) (0.1321) HH size -0.0321*** -0.0300*** -0.0193* -0.0209** -0.0056 0.0014 (0.0102) (0.0093) (0.0103) (0.0086) (0.0099) (0.0086)

56
OAP OAP OAP DWP DWP DWP DIS DIS DIS Son/grandson above 18 years -0.1186*** -0.1096** -0.2348*** -0.2509*** -0.0175 -0.0184 (0.0459) (0.0466) (0.0428) (0.0425) (0.0513) (0.0510) Knows local officials 0.1575* 0.1754* 0.2270*** 0.2495*** 0.0922 0.1071 (0.0955) (0.0964) (0.0675) (0.0666) (0.0738) (0.0712) Village development index 0.0017 0.0043 0.0294** 0.0306*** 0.0130 0.0132 (0.0114) (0.0117) (0.0117) (0.0119) (0.0115) (0.0114) Ajmer 0.0362 0.0868 0.0525 0.0586 0.1296* 0.1216* -0.0576 -0.0505 -0.0628 (0.0890) (0.0872) (0.0914) (0.0699) (0.0704) (0.0713) (0.0676) (0.0686) (0.0672) Bundi 0.0027 0.0370 0.0527 0.0112 0.0158 0.0755 -0.0540 -0.0526 -0.0510 (0.0926) (0.0941) (0.0951) (0.0821) (0.0853) (0.0842) (0.0733) (0.0746) (0.0747) Dungarpur 0.0780 0.1043 0.0296 -0.1437* -0.0896 -0.0925 -0.0760 -0.0436 -0.0596 (0.0791) (0.0824) (0.0883) (0.0798) (0.0871) (0.0886) (0.0791) (0.0890) (0.0872) Ganganagar 0.0032 0.0422 0.0459 -0.0900 -0.0320 0.0044 -0.0264 0.0010 0.0023 (0.0801) (0.0811) (0.0817) (0.0802) (0.0850) (0.0846) (0.0727) (0.0773) (0.0764) Jaisalmer -0.2579** -0.2534** -0.2685** -0.2287*** -0.2102** -0.2278** -0.2987*** -0.2879*** -0.2989*** (0.1051) (0.1098) (0.1125) (0.0872) (0.0951) (0.0981) (0.0368) (0.0407) (0.0403) Jalore 0.1298* 0.1463* 0.1402* 0.0219 0.0255 0.0418 -0.1053 -0.0954 -0.0810 (0.0766) (0.0772) (0.0791) (0.0764) (0.0793) (0.0785) (0.0661) (0.0676) (0.0687) Jhalawar -0.0605 -0.0451 -0.0792 0.0151 0.0367 0.0602 -0.1989*** -0.1801*** -0.1813*** (0.0922) (0.0955) (0.0983) (0.0846) (0.0893) (0.0894) (0.0587) (0.0641) (0.0636) Pseudo_R2 0.1771 0.2059 0.2352 0.1050 0.1521 0.1724 0.0736 0.0778 0.0683 Log-Likelihood -423.1749 -408.3870 -393.3106 -502.1861 -475.7364 -464.3385 -332.8746 -331.3590 -334.7857 Observations 751 751 751 815 815 815 574 574 574
Note: *, ** and *** denote the level of significance – 10%, 5% and 1% respectively. Standard errors in parenthesis. Marginal effects are computed at the mean for continuous variables and as impact effects for dummy variables. The village development index is a cumulative score derived from presence of village school, health facility, anganwadi center, electricity, post office, bank, black top road, irrigation and water facilities).

Social Protection Discussion Paper Series Titles No. Title 0834 The Performance of Social Pensions in India: The Case of Rajasthan by Puja Vasudeva Dutta, July 2008 (online only) 0833 Labor Regulations in Developing Countries: A Review of the Evidence and
Directions for Future Research by Tito Boeri, Brooke Helppie, Mario Macis, October 2008 (online only) 0832 The Incentives to Invest in Job Training: Do Strict Labor Codes Influence this
Decision? by Rita K. Almeida and Reyes Aterido, October 2008 (online only) 0831 Reforming the Pension Reforms: The Recent Initiatives and Actions on
Pensions in Argentina and Chile by Rafael Rofman, Eduardo Fajnzylber and German Herrera, May 2008
(online only) 0830 Community-based Risk Management Arrangements: An Overview and
Implications for Social Fund Programs by Ruchira Bhattamishra and Christopher B. Barrett, October 2008 0829 Work History and the Access to Contributory Pensions in Uruguay: Some
Facts and Policy Options by Marisa Bucheli, Alvaro Forteza and Ianina Rossi, May 2008 (online only) 0828 A Theory of Contribution Density and Implications for Pension Design by Salvador Valdés-Prieto, July 2008 (online only) 0827 On the Financial Sustainability of Earnings-Related Pension Schemes with
“Pay-As-You-Go” Financing by David A. Robalino and András Bodor, July 2008 (online only) 0826 An Ex-Ante Evaluation of the Impact of Social Insurance Policies on Labor
Supply in Brazil: The Case for Explicit Over Implicit Redistribution by David A. Robalino, Eduardo Zylberstajn, Helio Zylberstajn and Luis
Eduardo Afonso, July 2008 (online only) 0825 The Portability of Pension Rights: General Principals and the Caribbean Case by Alvaro Forteza, May 2008 (online only) 0824 Pension Systems and Reform Conceptual Framework
by Robert Holzmann, Richard Paul Hinz and Mark Dorfman, September 2008 (online only)

0823 Mandated Benefits, Employment, and Inequality in a Dual Economy
by Rita Almeida and Pedro Carneiro, August 2008 (online only) 0822 The Return to Firm Investments in Human Capital by Rita Almeida and Pedro Carneiro, June 2008 (online only) 0821 Population Aging and the Labor Market: The Case of Sri Lanka by Milan Vodopivec and Nisha Arunatilake, August 2008 (online only) 0820 China: Improving Unemployment Insurance
by Milan Vodopivec and Minna Hahn Tong, July 2008 (online only) 0819 Management Information Systems in Social Safety Net Programs: A Look at
Accountability and Control Mechanisms by Cesar Baldeon and Maria D. Arribas-Baños, August 2008 (online only)
0818 Guidance for Responses from the Human Development Sectors to Rising
Food Prices by Margaret Grosh, Carlo del Ninno and Emil Daniel Tesliuc, June 2008
(Revised as stand-alone publication) 0817 Levels and Patterns of Safety Net Spending in Developing and Transition
Countries by Christine Weigand and Margaret Grosh, June 2008 (online only)
0816 Labor Regulation and Employment in India’s Retail Stores by Mohammad Amin, June 2008 (online only) 0815 Beyond DALYs: Developing Indicators to Assess the Impact of Public
Health Interventions on the Lives of People with Disabilities by Daniel Mont and Mitchell Loeb, May 2008 0814 Enforcement of Labor Regulation and Firm Size
by Rita Almeida and Pedro Carneiro, May 2008 (online only) 0813 Labor Markets Lending and Analytical Work at the World Bank: FY2002-
2007 by Milan Vodopivec, Jean Fares and Michael Justesen, May 2008 0812 Risk and Vulnerability Analysis in the World Bank Analytic Work: FY2000-
2007 by Valerie Kozel, Pierre Fallavier and Reena Badiani, May 2008

0811 Pension Lending and Analytical Work at the World Bank: FY2002-2007 by Richard Hinz, Melike Egelmelzer and Sergei Biletsky, May 2008 (online
only) 0810 Social Safety Nets Lending and Analytical Work at the World Bank:
FY2002-2007 by Margaret Grosh and Annamaria Milazzo, May 2008 0809 Social Funds as an Instrument of Social Protection: An Analysis of Lending
Trends - FY2000-2007 by Samantha De Silva and June Wei Sum, July 2008 0808 Disability & Development in the World Bank: FY2000-2007 by Jeanine Braithwaite, Richard Carroll, and Karen Peffley, May 2008 0807 Migration, Labor Markets, and Integration of Migrants: An Overview for
Europe by Rainer Münz, April 2008 (online only) 0806 Is the Window of Opportunity Closing for Brazilian Youth? Labor Market
Trends and Business Cycle Effects by Michael Justesen, April 2008 0805 Disability and Poverty: A Survey of World Bank Poverty Assessments and
Implications by Jeanine Braithwaite and Daniel Mont, February 2008 0804 Poverty Traps and Social Protection by Christopher B. Barrett, Michael R. Carter and Munenobu Ikegami,
February 2008 0803 Live Longer, Work Longer: Making It Happen in the Labor Market by Milan Vodopivec and Primoz Dolenc, February 2008 (online only) 0802 Disability in Kazakhstan: An Evaluation of Official Data by Ai-Gul S. Seitenova and Charles M. Becker, February 2008 (online only) 0801 Disability Insurance with Pre-funding and Private Participation: The Chilean
Model by Estelle James, Augusto Iglesias and Alejandra Cox Edwards, January
2008 0719 The Life-Course Perspective and Social Policies: An Issues Note by A.L. Bovenberg, November 2007

0718 Social Safety Nets and Targeted Social Assistance: Lessons from the European Experience
by Chris de Neubourg, Julie Castonguay and Keetie Roelen, November 2007 (online only)
0717 Informality and Social Protection: Preliminary Results from Pilot Surveys in
Bulgaria and Colombia by Franco Peracchi, Valeria Perotti and Stefano Scarpetta, October 2007
(online only) 0716 How Labor Market Policies can Combine Workers’ Protection with Job
Creation: A Partial Review of Some Key Issues and Policy Options by Gaëlle Pierre and Stefano Scarpetta, October 2007 (online only) 0715 A Review of Interventions to Support Young Workers: Findings of the Youth
Employment Inventory by Gordon Betcherman, Martin Godfrey, Susana Puerto, Friederike Rother,
and Antoneta Stavreska, October 2007 0714 Performance of Social Safety Net Programs in Uttar Pradesh by Mohamed Ihsan Ajwad, October 2007 0713 Are All Labor Regulations Equal? Assessing the Effects of Job Security,
Labor Dispute and Contract Labor Laws in India by Ahmad Ahsan and Carmen Pagés, June 2007 0712 Convention on the Rights of Persons with Disabilities: Its Implementation
and Relevance for the World Bank by Katherine Guernsey, Marco Nicoli and Alberto Ninio, June 2007 0711 Reaching the Poor and Vulnerable: Targeting Strategies for Social Funds and
other Community-Driven Programs by Julie Van Domelen, May 2007 0710 The Macedonia Community Development Project: Empowerment through
Targeting and Institution Building by Caroline Mascarell, May 2007 0709 The Nuts and Bolts of Brazil’s Bolsa Família Program: Implementing
Conditional Cash Transfers in a Decentralized Context by Kathy Lindert, Anja Linder, Jason Hobbs and Bénédicte de la Brière, May
2007 (online only) 0708 Globalization and Employment Conditions Study by Drusilla K. Brown, April 2007

0707 The Kosovo Pension Reform: Achievements and Lessons by John Gubbels, David Snelbecker and Lena Zezulin, April 2007 (online
only) 0706 Measuring Disability Prevalence by Daniel Mont, March 2007 0705 Social Safety Nets in World Bank Lending and Analytic Work: FY2002-
2006 by Annamaria Milazzo and Margaret Grosh, March 2007 (online only) 0704 Child Labor and Youth Employment: Ethiopia Country Study by Lorenzo Guarcello and Furio Rosati, March 2007 0703 Aging and Demographic Change in European Societies: Main Trends and
Alternative Policy Options by Rainer Muenz, March 2007 (online only)
0702 Seasonal Migration and Early Childhood Development
by Karen Macours and Renos Vakis, March 2007 0701 The Social Assimilation of Immigrants by Domenico de Palo, Riccardo Faini and Alessandra Venturini, February
2007 (online only) 0616 Pension Systems in Latin America: Concepts and Measurements of Coverage by Rafael Rofman and Leonardo Lucchetti, September 2008 (online only).
Also available in Spanish. 0615 Labor Market Outcomes of Natives and Immigrants: Evidence from the
ECHP by Franco Peracchi and Domenico Depalo, November 2006 (online only) 0614 The Relative Merits of Skilled and Unskilled Migration, Temporary and
Permanent Labor Migration, and Portability of Social Security Benefits by Johannes Koettl under guidance of and with input from Robert Holzmann
and Stefano Scarpetta, November 2006 (online only) 0613 The Limited Job Prospects of Displaced Workers: Evidence from Two Cities
in China by Gordon Betcherman and Niels-Hugo Blunch, October 2006 0612 Unemployment Insurance in Chile: A New Model of Income Support for
Unemployed Workers by Germán Acevedo, Patricio Eskenazi and Carmen Pagés, October 2006

0611 Evaluating Social Fund Impact: A Toolkit for Task Teams and Social Fund Managers
by Sarah Adam, October 2006 0610 Risk and Vulnerability Considerations in Poverty Analysis: Recent Advances
and Future Directions by Carlo Cafiero and Renos Vakis, October 2006 0609 Comparing Individual Retirement Accounts in Asia: Singapore, Thailand,
Hong Kong and PRC by Yasue Pai, September 2006 (online only) 0608 Pension System Reforms by Anita M. Schwarz, September 2006 (online only) 0607 Youth Labor Market in Burkina Faso: Recent Trends by Daniel Parent, July 2006 0606 Youth in the Labor Market and the Transition from School to Work in
Tanzania by Florence Kondylis and Marco Manacorda, July 2006 0605 Redistributing Income to the Poor and the Rich: Public Transfers in Latin
America and the Caribbean by Kathy Lindert, Emmanuel Skoufias and Joseph Shapiro, August 2006
(online only) 0604 Uninsured Risk and Asset Protection: Can Conditional Cash Transfer
Programs Serve as Safety Nets? by Alain de Janvry, Elisabeth Sadoulet, Pantelis Solomon and Renos Vakis,
June 2006 0603 Examining Conditional Cash Transfer Programs: A Role for Increased Social
Inclusion? by Bénédicte de la Brière and Laura B. Rawlings, June 2006 (online only) 0602 Civil-service Pension Schemes Around the World by Robert Palacios and Edward Whitehouse, May 2006 (online only) 0601 Social Pensions Part I: Their Role in the Overall Pension System by Robert Palacios and Oleksiy Sluchynsky, May 2006 (online only)
To view Social Protection Discussion papers published prior to 2006, please visit www.worldbank.org/sp.

The Government of India has recently announced a dramatic expansion ofsocial pension schemes both in terms of coverage and benefit levels. Yetrelatively little is known about how these programs are administered or howwell they achieve their objectives. This paper assesses the performance of asocial pension scheme in the Indian state of Rajasthan. In particular, wereview the experience with respect to program awareness, coverage, targetingand leakage as well as delivery mechanisms. The overall assessment is positiveand holds broader lessons for social assistance in India. Thus, transactioncosts once pensions are sanctioned are low, disbursements are largely as perschedule, leakage in the form of shortfalls in benefits is generally low andsatisfaction levels with the social pension scheme are high. At the same timethere are clear areas for improvement on both the policy and administrationside. There is evidence of under-coverage and high transaction costs associatedwith the application process. Though targeting is generally progressive,especially for old age and widow pensions though less so for disabilitypensions, targeting is far from perfect and the eligibility criteria are not strictlyenforced. There is a strong case for relaxing, rationalizing and clarifying someof the existing criteria. On the administration front, several basic issues relatingto implementation need to be addressed, particularly with respect to transactioncosts in the sanction of pensions, wide inter-district variations in performancewithin the state and inadequate record-keeping and monitoring.
HUMAN DEVELOPMENT NETWORK
About this series...Social Protection Discussion Papers are published to communicate the results of The World Bank’swork to the development community with the least possible delay. The typescript manuscript of thispaper therefore has not been prepared in accordance with the procedures appropriate to formallyedited texts. The findings, interpretations, and conclusions expressed herein are those of the author(s),and do not necessarily reflect the views of the International Bank for Reconstruction and Development/ The World Bank and its affiliated organizations, or those of the Executive Directors of The World Bankor the governments they represent. The World Bank does not guarantee the accuracy of the dataincluded in this work. For free copies of this paper, please contact the Social Protection AdvisoryService, The World Bank, 1818 H Street, N.W., Room G7-703, Washington, D.C. 20433-0001.Telephone: (202) 458-5267, Fax: (202) 614-0471, E-mail: [email protected] or visit theSocial Protection website at www.worldbank.org/sp.