the personality assessment inventory, … personality assessment inventory, women, and poverty:...
TRANSCRIPT

!
THE PERSONALITY ASSESSMENT INVENTORY, WOMEN, AND POVERTY:
PSYCHOMETRIC PROPERTIES AND CLINICAL UTILITY
By
JUSTIN DONALDSON
(Under the Direction of Linda Campbell)
ABSTRACT
The current study seeks to examine significant differences in
Personality Assessment Inventory (PAI) scale scores of a community,
adult, female sample with low SES as compared to scores of a census-
matched norm sample (PAI; Morey, 1991). The scales of interest
include Anxiety (ANX), Anxiety-related Disorders (ARD), Depression
(DEP), Nonsupport (NON), and Stress (STR) and were chosen based on
clinical relevance and connections with the conditions of poverty in
existing literature. The results of the study indicate that there were
significant differences between the current sample of community adult
females with low-SES as compared to Morey’s (1991) community adult
female norm sample on each of the five PAI scales of interest. When
comparing the Caucasian and African American groups within the current
sample, significant differences were found only on the Stress scale.
INDEX WORDS: PAI, Poverty, Social Services, Personality
Inventory, Females

!
THE PERSONALITY ASSESSMENT INVENTORY, WOMEN, AND POVERTY:
PSYCHOMETRIC PROPERTIES AND CLINICAL UTILITY
By
JUSTIN DONALDSON
B.A., University of North Carolina at Asheville, 2003
M.Ed. University of Georgia, 2005
A Dissertation Submitted to the Graduate Faculty of The
University of Georgia in
Partial Fulfillment of the Requirements for the Degree
DOCTOR OF PHILOSOPHY
ATHENS, GEORGIA
2010

!
© 2010
JUSTIN DONALDSON
All rights reserved

!
THE PERSONALITY ASSESSMENT INVENTORY, WOMEN, AND POVERTY:
PSYCHOMETRIC PROPERTIES AND CLINICAL UTILITY
By
JUSTIN DONALDSON
Major Professor: Linda F. Campbell
Committee: Edward Delgado-Romero
Brian Glaser
V. Gayle Spears
Electronic Version Approved:
Maureen Grasso
Dean of the Graduate School
University of Georgia
May 2010

! iv!
For Peggy, my life’s illumination.

! v!
ACKNOWLEDGEMENTS
I would like to dedicate this dissertation to my family.
Your boundless support over the course of my life and education
has enabled me to go farther that I could have imagined. I will
forever be grateful for your patience, love, and encouragement.
I am thankful to Dr. Meredith Mayer, who played a
significant role in getting started on this project, provided
invaluable support amidst some of my greatest challenges, and
has had a profound impact on my professional identity and
trajectory.
I would especially like to thank Dr. Linda Campbell, my
major professor, for her consistent and guidance throughout this
process. In addition, I would like to thank Drs. Brian Glaser,
and Edward Delgado-Romero for their support and generosity
throughout my education. I extend my warmest thanks and
gratitude to Dr. V. Gayle Spears, who served as a great mentor
over the past six years and was dependable throughout the many
ups and downs of graduate school.

! vi!
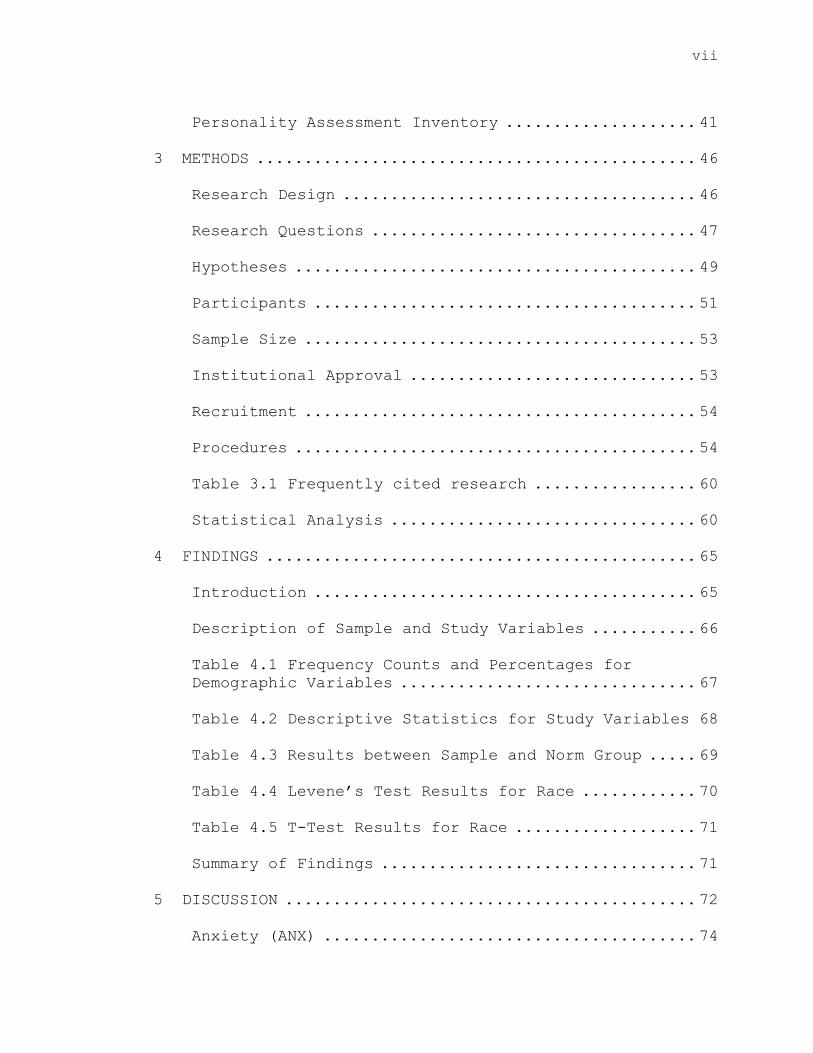
TABLE OF CONTENTS
ACKNOWLEDGEMENTS ...............................................v
CHAPTER
1 INTRODUCTION ............................................1
Significance of the Study ............................ 2
Purpose of the Study .................................3
Temporary Assistance for Needy Families (TANF) ......4
Program
Personality Assessment .............................. 10
Social Justice in Counseling Psychology .............11
Personality Assessment Inventory ....................15
Theoretical Framework ............................... 17
Definition of Terms .................................18
Research Questions ..................................18
2 REVIEW OF LITERATURE ...................................20
Conditions of Poverty ............................... 20
Socioeconomic Status and Mental Health ..............21
History of Personality Assessment ...................23
Personality Assessment and African Americans ........26
Minnesota Multiphasic Personality Inventory .........29
Other Personality Inventories .......................31
Projective Measures of Personality ..................35
Role of Personality Assessment in Treatment
Considerations ......................................36
! vii!
Personality Assessment Inventory ....................41
3 METHODS ..............................................46
Research Design .....................................46
Research Questions ..................................47
Hypotheses ..........................................49
Participants ........................................51
Sample Size .........................................53
Institutional Approval .............................. 53
Recruitment .........................................54
Procedures ..........................................54
Table 3.1 Frequently cited research .................60
Statistical Analysis ................................ 60
4 FINDINGS .............................................65
Introduction ........................................65
Description of Sample and Study Variables ...........66
Table 4.1 Frequency Counts and Percentages for
Demographic Variables ............................... 67
Table 4.2 Descriptive Statistics for Study Variables 68
Table 4.3 Results between Sample and Norm Group .....69
Table 4.4 Levene’s Test Results for Race ............70
Table 4.5 T-Test Results for Race ...................71
Summary of Findings .................................71
5 DISCUSSION ...........................................72
Anxiety (ANX) .......................................74

! viii!
Anxiety-related Disorders (ARD) .....................75
Depression (DEP) ....................................76
Nonsupport (NON) ....................................78
Stress (STR) ........................................78
Racial Subgroup Comparison .......................... 79
Significance within Counseling Psychology ...........83
Limitations .........................................84
Recommendations for Future Research .................86
Conclusion ..........................................87
REFERENCES ...............................................89
APPENDIX 1: PAI Scale T-scores of total Low-SES sample and
Census-matched Sample .............................. 100
!
1!
CHAPTER 1
Introduction
The United States Census Bureau reported a national poverty
rate of 12.1 percent in 2002. Within that broader number,
subset groups were disproportionately represented; 28.8 percent
of persons in female headed households, 24.1 percent for African
Americans, and 16.7 percent for those residing in urban areas
(U.S. Census Bureau, 2003). Of particular consideration for
psychologists among the complex issues faced by those of lower
socio-economic status (SES) is a thoroughly documented,
statistically significant increased risk of mental illness
(Hudson, 2005). Women with low socioeconomic status have been
found to experience more frequent, more threatening, and more
unmanageable life events than other individuals in the general
population (Brown et al., 1975; Makosky, 1982).
In recent decades psychologists have emphasized a need for
personality assessment as essential in developing appropriate
treatment plans (Million & Davis, 1996). The Personality
Assessment Inventory (PAI; Morey, 1991) offers several pragmatic
advantages over the field standard Minnesota Multiphasic
Personality Inventory, 2nd Edition (MMPI-2) such as reading
level, administration time (number of items), and additional
2!
clinical data, such as substance abuse and treatment indicators.
The current study explores the use of this measure with low SES
populations by comparing scaled scores on the PAI with a female
community sample with low socioeconomic status to a census-
matched community norm sample, addresses a general dearth of
research addressing the use of personality inventories with low
SES populations, and seeks to improve the quality of mental
health referrals and dispositions within a social services
agency.
Significance of the Study
Throughout the history of counseling psychology, the
identity of the field has developed through a series of tenants
agreed upon during early conferences (Super, 1955). One of the
unique identities attributed to counseling psychology is the
commitment to vocational counseling, which includes the
theoretical knowledge as well as the application of that
knowledge through assessment and counseling (Swanson & Fouad,
2009). This philosophical tenant of professional identity can
be found in the early vocational testing efforts following the
Great Depression in the 1930s. Super (1955) described these
efforts as a mix of public governmental and private employment
agency initiatives designed to match the mass of unemployed
American workers with appropriate jobs. Of the more notable

3!
governmental efforts, The Minnesota Employment Stabilization
Institute utilized psychological tests in their efforts to get
adults back into the labor force (Super, 1955).
The work of counseling psychology continued after veterans
returned from World War II, when counseling psychologists took
on the task of helping veterans readjust to civilian life. As a
part of this advocacy for veterans, counseling psychologists
lobbied for veterans to receive educational benefits after
returning home (Fouad, et al., 2005). Over time, the roles of
counseling psychologists and methods of intervention they have
employed have continued to be diverse, and have consistently
made use of testing and psychological evaluation as
interventions and as data for treatment planning.
Purpose of Study
The current study seeks to examine significant differences
in PAI scale scores of a community, adult, female sample with
low SES as compared to scores of a census-matched norm sample
(PAI; Morey, 1991). The scales of interest include Anxiety
(ANX), Anxiety-related Disorders (ARD), Depression (DEP),
Nonsupport (NON), and Stress (STR) and were chosen based on
clinical relevance to the assessment project and being often
described in the literature as symptoms connected with the
conditions of poverty.

4!
In addition, within the current sample approximately half
of the participants identified as “African American” and half
identified as “White”. The PAI scale scores previously discussed
will be compared between the two groups to explore differences
between the groups based on this self identified demographic
variable. The subject of racial comparisons in personality
assessment is an important and complex issue that requires
considerable attention. This comparison is intended to gather
important information on the intersection between low SES and
the potential mental health effects of racism and
discrimination, which could be captured by a personality
assessment. This issue must be discussed thoroughly, and will be
revisited in subsequent chapters.
Temporary Assistance for Needy Families (TANF) Program
The data in this study was collected from a separate
ongoing assessment project within the Department of Family and
Children’s Services. This project provided assessments to be
used by caseworkers involved with clients who were applicants
and participants in the Temporary Assistance for Needy Families
(TANF) program. These comprehensive psychological evaluations
were designed to provide information for caseworkers and
5!
applicants about the mental health and career interests for
individuals to construct a more well-informed treatment plan.
The U.S. Congress enacted the Temporary Assistance for
Needy Families (TANF) program during the Clinton Administration
as a part of the reform of traditional welfare policies. It
provides monthly cash supplements to families who meet
qualifications for poverty established at the federal level and
have at least one child under the age of 18. TANF is available
to one and two-parent homes, and need is established by a
combination of income, assets, and number of children. TANF
guidelines impose a four-year lifetime limit for each family
collecting benefits, which can be extended when circumstances
for hardship, including domestic violence or physical or mental
incapacity, are met. Work and work-related experience is the
major component of TANF. Adults with children over the age of 1
year are required to participate in a work activity. Examples of
work activities include putting in job applications,
volunteering to gain work-related experience, job searching, or
participating in job training. This must occur at least 30 hours
every week in order to maintain benefits. The goal of
participation in work-related experience is to help individuals
gain the experience to become self-sufficient and find a long-
term job.
6!
In order to receive benefits, applicants must apply for and
accept any other public benefits that may be available to them,
such as worker’s compensation, supplemental security insurance,
child support, and unemployment compensation. For some parents,
this requires establishing paternity of a child and then going
through the formalized process of filing to receive child
support. Applicants must also be able to demonstrate that their
child or children are “deprived” in at least one of three ways:
1. Continued absence of at least one parent from the home (i.e.,
single parent home); 2. Physical or mental incapacity of at
least one parent or; 3. In a two-parent family in which both
parents are able-bodied, deprivation can be demonstrated if one
parent has a “recent connection to the workforce” (i.e., recent
unemployment of at least one of the parents).
Assistance units countable are used to establish the amount
of need demonstrated and therefore the amount of benefits that
may be collected. Income must be below established federal
criteria, and the family must have less than $1,000 in assets.
The federal poverty line for an individual is $10,830 per year.
Each additional dependent family member increases the poverty
line by $3,740. For a family of three (one parent and two
children), the family income must gross less than $784 a month.

7!
All children of school age must be enrolled and attending school
as a part of the agreement.
In the state of Georgia, statistics on the number of
families receiving TANF are available through 2003, when the
last comprehensive review was undertaken. As of June, 2003,
137,279 families were receiving assistance through TANF (103,858
children and 33,421 adults). This number of recipients reflects
a 49% decrease from 1997. This decrease is quite striking, and
requires further scrutiny to fully understand. Under federal
law, states are required to have a specific “work participation
rate” in their TANF programs. This is a specific ratio of the
number of adult TANF recipients who are working or in work
related activities to the number of families with adults who are
receiving assistance through TANF. Georgia’s work participation
rate has increased dramatically from 11% in 2003 to 65% in 2006.
This is primarily due to a significant decline in TANF cases.
However, there is extensive data to show that the number of
families who need assistance is dramatically increasing, while
the number of families who receive assistance is dramatically
decreasing (Schott & Levinson, 2008).
In 2004 a series of policies were put into place that
likely have had the effect of discouraging needy families from
applying (Schott & Levinson, 2008). Data shows that most

8!
families that leave Georgia’s TANF program are not working, in
fact, less than one-third of the case closures between 2004 and
2006 were due to family no longer needing assistance (Georgia
Department of Human Resources, 2006). Of the TANF applications
denied in the first third of 2006, approximately one-third were
denied because of the withdrawal of the application by the
family, approximately one-third were denied because the families
failed to cooperate with the eligibility process (which can
involve several meetings and the development of an employment
plan before any determination is made or benefits received). In
2006, only 7% of those applications were denied because of a
family failing to meet standards for poverty (Schott, 2008).
These results suggest quite strongly that while the statistical
outcomes and work participation rate seem adequate, there may be
many families in Georgia who are not receiving benefits that
could help them, even though they qualify.
It is important to examine the possibility of eligible
families being overlooked, given the historical and current
evidence for the marginalization of individuals and families in
poverty. Racially and ethnically, Georgia is a diverse state. As
of 2005, Georgia has an estimated population of 9,072,576, which
is a 10% increase since the 2000 census. Racially and
ethnically, the state is 62.6% Caucasian, 28.7% African
9!
American, 5.3% Hispanic/Latino, 2.1% Asian, 1.4% Multiracial,
and .3% Native American. Of those individuals within Georgia
receiving TANF, 77.3% of the recipients self identified as
African American, 20.1% were identified as Caucasian, 2.1%
identified as Hispanic/Latino, and .5% were identified as
“other”.
These statistics are consistent with other findings that
suggest minority individuals are at a significantly higher risk
for being of low SES. It is important to note that legal
immigrants to the United States made up 0.8% of those receiving
public assistance through TANF. The average family size of TANF
applicants in Georgia was 3 individuals (most often one mother
and two children), the average cash benefit was $225 per month,
while the maximum benefit for a family of three would be $280
per month. The cash benefit of $225 per month is not given
freely; the client must be participating in at least 30 hours
per week of work-related experience in order to maintain
eligibility. These averages demonstrate that TANF gives cash
benefit approximately equal to minimum wage.
The establishment of the University of Georgia – Georgia
Department of Family and Children’s Services assessment project
provided the opportunity to further explain and explore positive
characteristics and experiences, as well as explain barriers to

10!
sustained employment through a scientifically validated and
culturally well-informed assessment. Evaluators were Ph.D.
students from a large southeastern state university who had
training in psychological assessment and were under the
supervision of a licensed psychologist. Participants were
clients who met all qualifications for TANF and were either in
the application process or were receiving benefits. They had
also been identified by the caseworkers as potentially having
“barriers” to sustaining employment. The purpose of the
assessments was to formulate more appropriate case plans based
on the characteristics, needs, and abilities of the clients with
the goal of gaining and sustaining long-term employment.
Personality Assessment
Personality assessment has a clearly delineated role in the
history as well as the future of psychology, and counseling
psychology in particular. Maurish (1994) identified that the
appropriate use of personality assessment provides and ensures
continuous quality improvement through more adequate treatment
planning and outcome processes. Personality assessment can
provide vital objective information to guide treatment
decisions. The issue of the study of personality in psychology
has existed in some form for the last 100 years. Scholars
debate the beginning of psychological assessment in the United

11!
States between Lightner Witmer’s clinic to study children’s
academic prowess and difficulties in 1896 at the University of
Pennsylvania, and the work of Cattell who coined the term
“mental test” and advocated utilizing them in order to study
individual differences (Anastasi, 1988). Personality testing
developed concurrently with counseling psychology, and both
experienced explosive growth around WWII. Both were able to grow
dramatically through the vast expansion of the clinical services
provided by the Veterans Administration during this time. It was
during WWII that the clinical battery test approach was first
utilized to present a comprehensive picture of an individual.
Social Justice in Counseling Psychology
Social justice has long been a value and central tenant of
counseling psychology, equal to the emphasis on vocational
psychology and assessment (Fouad, et al., 2005). In fact,
counseling psychology often utilized vocational psychology as a
vehicle to promote social equity because the access to
employment and education were intimately tied to the
distribution of resources (Fouad, et al., 2005). The identity of
counseling psychologists to function as change agents has been
seen throughout the history of the profession. Historically, the
emphasis has been on empowering the individual to confront
oppression. However, over time the concept of empowerment

12!
evolved into the encouragement of counseling psychologists to
work towards broad level social change. This was seen in the
advocacy for veteran educational benefits after WWII, the
encouragement of counseling psychologists to become involved in
“movements that have to do with desegregation, voting rights,
housing, and minimum wages” (Samler, 1964 p. 66). The focus of
social justice efforts advanced with advocacy for equal pay for
women in the 1970s; prison reform in the 1980s; and gay,
lesbian, bisexual, and transgender (GLBT) rights in the 1990s,
and the new millennium.
Counseling psychology’s growing commitment to social
justice warrants ongoing reexamination of many areas of
professional practice, including psychological assessment and
testing. As psychological assessments became more complex, they
began to be examined for equity with respect to women, and
racial and ethnic minorities. In the early 1970’s Schlossberg
and Pietrofesa (1973) examined the ways in which vocational
inventories stereotyped occupations for women. Similarly,
Williams (1971) pointed out the blatant misuse of cognitive
testing instruments for African American students. Williams’
argument continues to this day with the work of Helms (2004),
among others, who continue to identify the inequity of cognitive
testing for determining access to educational resources, given
13!
the differences in cultural experiences within the United
States.
These differences exist not only in the realm of cognitive
and educational testing, but also with respect to personality
testing. This is particularly important because the use of
personality testing has the ability to further marginalize or
pathologize behavior based on individuals’ responses to the
instrument. Psychological assessment and social justice have
been and continue to be vital components of the identity of
counseling psychology. Throughout history, counseling
psychologists have utilized a variety of methods in diverse
professional work environments to assist individuals in locating
and developing personal and social resources and adaptive
tendencies to assist the individual in utilizing the resources
more effectively (Super, 1955). Over time, the roles of
counseling psychologists and methods of intervention they have
employed have continued to be diverse, and have consistently
made use of testing and psychological evaluation as
interventions and as data for treatment planning.
The history of psychology shows many instances in which
personality assessments were used to further marginalize racial
groups (Hall 2001). Since this study will be utilizing a racial

14!
comparison as a part of the research, this issue must be
discussed within the context of social justice.
The goals of social justice are complex. On one hand,
efforts to advance and explore social justice constructs and
values, even in rudimentary form, are important to advance. On
the other hand operationally defining and valid measures are
also important. For example, Suzuki and Ponterotto (2008) posit
that ongoing updates to data with diverse population samples are
important for the future of culturally valid norms.
Psychologists committed to more rigorous validity and
operational definition (Franklin-Jackson & Carter, 2007; Delgado
Romero et al., 2005; Dana, 2002) advocate for more thorough
measure of the constructs of race and ethnicity. Thus,
researchers may be challenged to make unique contributions of
data with underserved populations while attempting to optimally
and validly describe their underlying demographic constructs.
The APA’s Guidelines on Multicultural Education, Training,
Research, Practice and Organizational Change for Psychologists
(2002) specifically address the nature of this in their section
on research. They note several examples in which psychologists
have utilized a culture centered perspective as an integral part
of their interpretation of the results of their study. They
noted examples from Kwan (1999) and Reid (2001) when after
attaining results that in previous research could have been used

15!
to pathologize populations, instead took the perspective of
examining the results within the cultural context of the
individuals in the study. Therefore, as an essential component
of this study, all results will be examined within the specific
cultural contexts. Realizing that the measure of race is
imperfect at best, and that there is great heterogeneity even
within seemingly similar racial and SES groups, interpretations
must be approached with caution.
Personality Assessment Inventory
In recent years the Personality Assessment Inventory (PAI;
Morey, 1991) has been increasingly used in a variety of clinical
settings. Support for the instrument over the field standard
MMPI include shorter administration time; the assessment of
additional clinical information, such as substance abuse,
personality structure, that includes a potential for risk of
violence; and suitability for psychotherapy. Despite an
increase in use, research involving the PAI is lacking in
several areas (Pietrowski, 2000). Studies to support its use
have been conducted with male and female forensic populations,
veteran populations, chronic pain populations, college students,
among others. There is a general dearth of research regarding
the use of the PAI with community populations with lower socio-
economic status (SES).
16!
Individuals from diverse backgrounds who have low SES have
an increased risk for misdiagnosis and receive fewer services
that are often of lower quality (Hudson, 2005). Counseling
psychologists have concerned themselves in recent years with
issues of social justice in treatment of lower-SES populations.
Counseling psychologists are attempting to address systemic
inequities experienced by those from marginalized and devalued
groups in our society (D’Andrea & Heckman, 2008). Multicultural
assessment literature has frequently described the issues and
problems with using standardized instruments with diverse
populations (Ponterotto, et al., 2001). In Guideline 5 of the
American Psychological Association’s Multicultural Guidelines
(2002), psychological researchers are urged to consider
culturally sensitive assessment techniques, data-generating
procedures, and standardized instruments whose validity,
reliability, and measurement equivalence have been tested across
culturally diverse sample groups, particularly the target
research groups. Psychologists are encouraged to present
reliability, validity, and cultural equivalence data for use of
instruments across diverse populations. Instrument selection
should draw from a variety of data sources available from test
developers, seminal articles in the field, and other texts
addressing the latest developments in research and practice.
Suzuki and Ponterotto (2008) posit that ongoing updates to

17!
reliability and validity data are critical in examining how a
given instrument functions with respect to diverse population
samples. Research that examines the use of popular instruments
such as the PAI with these specific populations is needed to
determine appropriateness and degree of clinical utility.
Theoretical Framework
The Personality Assessment Inventory (PAI; Morey, 1991) was
constructed using rational test construction theory (Loevinger,
1957). Individual item constructs were derived from expert
opinion based on current nosology compatible with the Diagnostic
and Statistical Manual of Mental Disorders, 4th Edition Text
Revision (DSM IV-TR, 2000).
Recent discussion of culturally relevant psychological
assessment has considered etic versus emic measures (Ponterotto
et al., 2001). The terms etic and emic were first coined by
Pike (1967), an anthropologist and linguist, in Language in
relation to a unified theory of structure of human behavior.
Though originally applied to structures of language, Goodenough
used the terms under modified definitions to describe and
explain human behavior (1971). Etic measures are those that
seek to measure universal behaviors that transcend nations and
cultures, such as biological processes. Emic measures are used
within a non-generalizable sociocultural context or group, such

18!
as measuring religiosity within a single religion. Given
challenges associated with entirely removing cultural context
from tests and assessments, most may instead be more accurately
termed “pseudo-etic”, or somewhat universal.
Definition of Terms
Poverty- the condition of deprivation of basic human needs,
financial resources, and assets
Socioeconomic status- an individual’s hierarchical status within
a social structure
Psychological assessment- refers to a test or group of tests
used to produce clinical data to answer a referral question
Personality assessment- the measurement of the characteristic,
relatively stable, and predictable way an individual thinks,
feels, and behaves, including attitudes, tendencies, and values
Social justice- values related to the distribution of relative
advantages and disadvantages within a society; also incorporates
efforts to address discrepancies within this distribution
Research Questions
RQ1a: Are there differences in the Anxiety (ANX) t-scores
between the current sample and census-matched norm group?
19!
RQ1b: Are there differences in the Anxiety related
disorders (ARD) t-scores between the current sample and census-
matched norm group?
RQ1c: Are there differences in the Depression (DEP) t-
scores between the current sample and census-matched norm group?
RQ1d: Are there differences in the Stress (STR) t-scores
between the current sample and census-matched norm group?
RQ1e: Are there differences in the Nonsupport (NON) t-
scores between the current sample and census-matched norm group?
RQ2a: Are there differences in the Anxiety (ANX) t-scores
between White and African American participants in the current
sample?
RQ2b: Are there differences in the Anxiety related
disorders (ARD) t-scores between White and African American
participants in the current sample?
RQ2c: Are there differences in the Depression (DEP) t-
scores between White and African American participants in the
current sample?
RQ2d: Are there differences in the Stress (STR) t-scores
between White and African American participants in the current
sample?
RQ2e: Are there differences in the Nonsupport (NON) t-
scores between White and African American participants in the
current sample?

20!
CHAPTER 2
Review of Literature
Conditions of Poverty
The impact of poverty on the mental health of an individual
is complex and multifaceted. Increased levels of financial
stress are added while social support is likely to be reduced.
Women in particular with low socioeconomic status have been
found to experience more frequent, more threatening, and more
uncontrollable life events that others among the general
population (Brown et al., 1975; Makosky, 1982). It is important
to acknowledge both these acute events, but also the smaller but
more persistent daily slights that poverty imposes. Women with
lower SES are more likely to experience environmental stressors
such as inadequate housing, violent or crowded neighborhoods,
and financial budgets with little flexibility to absorb
unexpected expenses. These environmental stressors present
consistent and pervasive amounts of stress that may be more
impactful than larger events (Brown et al., 1975).
Women of color face the additional stress of racism and
discrimination, of particular significance since minority women
are overrepresented in lower socioeconomic strata (U.S. Census

21!
Bureau, 2003). The persisting experience of discrimination
maintains inequalities, pushes women toward lives of weakened
vocational and economic security, and exposes them to unmerited
judgement.
Socioeconomic Status and Mental Health
The negative relationship between socioeconomic status and
mental health has been consistently described across research in
the social sciences (Hudson, 2005). A 1991 Epidemiological
Catchment Area study found that, controlling for age and sex,
the six-month prevalence rate for any DSM-IV disorder is 2.86
times higher in the lowest socioeconomic group than in the
highest group. Researchers have defined mental illness using
different criteria, including any diagnosis meeting DSM
criteria, to state laws for meeting disability status on the
basis of mental illness, to psychiatric hospitalization. A vast
majority of the approaches include a minimum of meeting criteria
for DSM diagnosis of psychiatric disorder (Robins & Regier,
1991).
Recent and historic research has consistently supported
that as SES lowers, an individual’s risk of mental illness
increases (Faris & Dunham, 1939; Hollingshead & Redlich, 1958;
Srole et al., 1977). Important theoretical constructs regarding
the causal direction between low SES and being at a higher risk

22!
for mental illness remains unsettled (Dohrenwend et al., 1992;
Fox, 1990). Dohrenwend et al. examined the role of social
causation (hardship and stress) against social selection (e.g. a
“downward drift” based on genetic predisposition) in Israelis of
North African and European descent and reached few generalizable
conclusions (1992). Hudson (1988) identified, through a meta-
analysis, that the relationship between poverty and mental
illness is consistent regardless of which parameters were used
to describe socioeconomic status (income, education, employment)
or the type of mental illness described (DSM diagnosis). This
is an important link in describing the relationship between the
stress associated with poverty and all levels of severity in
mental illness. Hudson's (2005) findings also suggested that
symptoms of mental illness were exacerbated by the level of
poverty experienced.
The current experimental design will not address the oft-
debated issues surrounding causality; whether the conditions of
low SES predispose individuals to mental illness, or those
dealing with mental illness are at greater risk of experiencing
adverse socioeconomic conditions (Fox, 1990). Patterns of
movement in social classes within a single-family generation
have been examined in large-scale epidemiological studies to
further glean insight into mechanisms behind these transitions.

23!
For individuals with serious mental illness, there is a
consistent pattern of moving downward in social class. This
tendency, often labeled as downward drift, is an individual’s
downward intragenerational social mobility after the onset of
serious mental illness (Fox, 1990). Those with mental illness
were found to be more downwardly mobile and less upwardly mobile
in social class than a control group from the general
population; higher classes become poorer and lower classes
remain static or become poorer as compared to census matched
control individuals (Fox, 1990). In Fox’s study, age was not
found to mediate downward drift after psychiatric
hospitalization.
History of Personality Assessment
The inception of psychological testing grew out of a number
of experiences early in the life of psychology with the goal to
measure differences between individuals (Anastasi, 1988). In
some cases, as in the case of personality assessment, the
difference in reactions between two individuals in the same
situation, or the difference between reactions of one individual
in different situations. The actual beginnings of testing can be
debated (DuBois, 1966). While some acknowledge the civil service
examinations of the Chinese empire as the dawn of testing,
others turn to the Socratic method in Greece as the emphasis on

24!
testing as a tool for teaching as the birth of testing. However,
the beginning of the nineteenth century witnessed the beginning
of psychological testing to determine individual differences,
primarily for the identification of individuals with mental
retardation (DuBois, 1966).
Psychological testing was first used to differentiate
between the mentally retarded and the insane, and then make
further determinations within those broad categories (Anastasi,
1988). Alfred Binet was essential in the development of
assessments for children within the public educational system.
In contrast, the first experimental psychologists regarded
individual difference as a form of error, rather than a point of
interest to be further explored. The first tests were largely
designed to measure intelligence, and did so through an
assessment of sensory awareness and discrimination exercises.
The concept of personality assessment was much later to develop.
Early personality assessments could further be subdivided
into performance or situational tests. These tests more
specifically attempted to understand and predict an individual’s
behavior in ambiguous situations with socially subtle cues. The
purpose of the testing was often disguised to the individual and
interpretation was often subjective. An example of such testing
can be found the 1920s and 1930s with the work of Hartshorne and

25!
May (1928, 1929, 1930). They developed and applied tests that
related common daily life situations into the test and were
concerned with the measurement of behaviors such as lying,
cheating, stealing, cooperativeness, and persistence.
In A survey of the science of psychology, Kantor (1933)
described personality as a “reactional biography” (p. 116) made
up of traits, types, abnormalities, and correlates between
personality and biological character. Kantor suggested that the
psychological study of personality address three domains;
personality analysis, discovery of traits, and measurement of
traits.
Subsequent writings in the 1960’s and 70’s challenged the
importance of (and the existence of) persisting, static,
measurable personality traits and have highlighted the
importance of context and state in observable behaviors. The
personality analysis domain has remained of central importance
in personality assessment, even during more recent trends of not
only understanding the individual, but the individual in context
over time (Anastasi, 1988).
The approaches and major procedures involved in personality
inventory construction and development have largely defined the
major categories of tests over time. The Woodworth Personal
Data sheet was prototypical of the content-related validation

26!
method. Authors developed the test as means of standardizing a
psychiatric interview and adapting a procedure suitable for mass
administration during World War I. The items were formulated
from the common neurotic and preneurotic symptoms described in
interviews with psychiatrists and in the psychiatric literature
of the time. This method of content-related validation involved
a relatively literal interpretation of questionnaire items
(Anastasi, 1988). The Woodworth Personal Data sheet was
originally designed as a screening tool to identify seriously
disturbed men and discourage their participation in military
service. The Personal Data Sheet asked about a number of
commonly reported symptoms of psychopathology, which respondents
were asked to endorse or deny. Shortly after the end of the war,
it began to serve as a model for emotional adjustment
inventories in general.
Personality Assessment and African Americans
The history of personality assessment with diverse
populations, particularly African Americans, is rife with
problems. Previous research has noted the tendency of
researchers to misinterpret, misrepresent, or even pathologize
responses non-White individuals (Hall, 2001; Rogler, 1999; D.W.
Sue at al., 1998, Sue & Sue, 1999). This systemic bias towards
pathologizing minorities, in particular African Americans, was

27!
born of the structure of personality assessments which were
built on the responses of White individuals whose responses were
then considered “normal”. The misapplication of these White
norms to diverse populations led to several studies that further
misrepresented and pathologized minority groups. For example, in
1922 the Will Downey Temperament Test (McFadden and Dashiell,
1922) was used in a cross-cultural study that concluded that
African Americans, Native Americans, Mexicans, Chinese and
Japanese were inferior to Whites in the personality traits of
kindness, integrity, and refinement (Butcher, 2002). Despite a
number of improvements in recent decades, the psychological
assessment of and mental health services for African Americans
have been biased, incomplete, and deficient because similarities
to White Americans have been emphasized while differences were
largely ignored (Dana, 2002).
Many personality measures continue to be widely criticized
as potentially biased in predicting psychopathology in racial
minorities (Aponte & Johnson, 2000). In order to address the
concerns of potentially pathologizing racial minorities, many
personality assessments have chosen to increase the sample size
of representative norm groups and utilized factor analysis to
detect systemic biases that may be present within an individual
measure (Butcher, 2002). Objective personality instruments such
as the MMPI-2 have made improvements in norm sampling to address

28!
well documented problems in previous versions (MMPI; Butcher &
Williams, 1992). The restandardization sample provides a more
current and representative sample than previous samples (Schinka
& LaLone, 1997). The appropriateness of using the MMPI with
minority populations has been often visited both in terms of
racial and gender differences in scale elevations (Stukenberg,
Brady, & Klinetob, 2000). Timbook & Graham (1994) found that
African American women scored significantly higher on
psychopathic deviance, and mania as compared to a matched group
of Whites in the MMPI-2 normative group. More recent articles,
such as Stukenberg, Brady, and Klinetob (2000) found that
averaged profiles of the African Americans as compared to Whites
to be homogenous when compared across gender and race based
demographic variables. The authors attribute the absence of
scale mean differences to the census match norm updates of the
MMPI-2. Given the heterogeneity within African American
populations, the measurement of racial identity has been
recommended as a moderator to standard personality measure (such
as the MMPI-2) scores since historically many group differences
have been otherwise attributed to psychopathology (Dana, 2002).
Newer personality measures, such as the Personality
Assessment Inventory (PAI; Morey, 1991) have shown promise as
more appropriate measures of personality for racial minorities,
particularly African Americans. While more research is still

29!
needed on its cultural appropriateness, there is evidence that
the PAI may have avoided some of the common pitfalls of the
previous personality instruments such as the MMPI. The
development of the PAI used a more rigorous item selection
process to reduce item content bias and increased efforts to
utilize more representative norm samples in regard to ethnic and
racial identity (Morey, 2007). A study by Todd (2005) made
comparisons between African American and White college students
using multivariate analyses of variance (MANOVA) and exploratory
factor analysis to compare scores between the groups. The author
found that the magnitude of scale score differences was not
consistent with the conclusion of test bias. Therefore early
efforts in the examination of psychometric properties do not
suggest evidence of test bias by racial identity for this
population. Further research is needed to establish these
findings with other populations (such as low-SES females).
Minnesota Multiphasic Personality Inventory
Later approaches to personality inventory development
sought to go beyond such a literal interpretation and instead
treated items as diagnostic or symptomatic of a larger criterion
behavior. This method, empirical criterion-keying, was the
primary method used in constructing the Minnesota Multiphasic

30!
Personality Inventory (MMPI; 1943). A primary advantage of
empirical criterion-keying meant that the individual's
perception of reality could be used as a viable source of
clinical data.
The MMPI was one of the first tests to utilize separate
clinical scales, originally including; Hypochondriasis,
Depression, Hysteria, Psychopathic deviate, Masculinity-
femininity, Paranoia, Psychasthenia, Hypomania, and Social
introversion. Item response choices on the original basic form
included “true”, “false”, and “cannot say”. The original 550
items were initially printed on individual cards and presented
one at a time during test administration, but were later
compiled into a group testing format that used a test booklet
which contained items and a response sheet. The items
comprising 8 of these 10 scales differentiated between clinical
and normal control group samples from visitors to the University
of Minnesota hospital and individuals from the surrounding
Minneapolis metropolitan area (Hathaway & McKinley, 1943).
Clinical scales were developed empirically by criterion-keying
items (based on psychiatric diagnosis).
In addition to clinical scales, the MMPI was one of the
first instruments to employ validity scales, which are not based
in psychometric qualities of validity but serve as a check for

31!
carelessness, misunderstanding, malingering, and test-taking
attitude. Protocols with 30 or more combined blank or “cannot
say” responses were considered signs of uncooperativeness or
defensiveness, rendering the protocol invalid (Anastasi, 1988).
The MMPI has undergone several revisions and it’s most
current form, the Minnesota Multiphasic Personality Inventory,
2nd Revision (MMPI-2; Butcher, Dahlstrom, Graham, et. al., 1989).
The original version is widely considered to be the most
frequently used objective personality test in clinical practice
and training (Lubin, Larzen, & Mattarrazo, 1984). This second
major revision included updates to norm groups, which was a
frequent critique of the original version. The 2,500
individuals comprising the MMPI-2 sampled groups were from 6
different regions of the United States and attempts were made to
balance the sample’s gender and ethnicity composition to reflect
census data.
Other Personality Inventories
Several other personality instruments have enjoyed
considerable popularity in personality research. The California
Personality Inventory (CPI), Personality Research Form (PRF), 16
PF Questionnaire, and NEO Personality Inventory, Revised (NEO-
PI-R) were designed to provide a structure and understanding of
32!
“normal” personality, rather than previously designed measures
of personality that were based on measuring deviance.
The California Personality Inventory (CPI; Gough and
Bradley, 1996) is a 434 item multi-scale self-report personality
inventory that yields 18 scales. The scales of the CPI are
referred to as folk concept scales; a reference to the authors’
assertion that the constructs are pseudo-etic, and can be
measured (to varying degrees) across cultures. Half of the
CPI’s items were taken from the original MMPI. The scales are
grouped into four classes: measures of poise, ascendancy, self-
assurance, and interpersonal adequacy; measures of
socialization, responsibility, intrapersonal values, and
character; measures of achievement potential and intellectual
efficiency; and measures of intellectual modes and interest
modes (Gough and Bradley, 1996). The CPI’s norm groups were
non-clinical populations, which has contributed to its use in
research and limited its usefulness to clinicians.
The NEO-PI-R is a standard questionnaire of personality
based on the Five Factor Model (FFM). The FFM provides a
description of the five major domains of personality
(extraversion, agreeableness, conscientiousness, neuroticism,
and openness to experience). The NEO-PI-R provides a measurement
of these five major domains as well as the six traits or facets

33!
that define each domain. The five domain scales and six traits
form 30 facet scales that provide a detailed assessment of
normal adult personality. The NEO-PI-R is based on factor
analytic research. The profile generated from the instrument
provides a clear and concise description that summarizes
emotional, interpersonal, experiential, attitudinal, and
motivational styles of the individual (Costa & McCrae, 1992).
The 16PF Questionnaire is a multiple choice personality
questionnaire that measures sixteen primary traits (e.g.,
Dominance, Sociability, Self-Acceptance, Empathy,
Responsibility) and five higher order traits, now known as the
“Big Five”. The 16PF recently came out with its fifth edition
that contains 185 multiple-choice items written at a fifth grade
reading level. Approximately 76% of items were rewritten from
earlier versions of the assessment. This instrument was designed
by Cattell and utilized factor analysis in order to discover and
measure the core traits of personality (Cattell, 1946). Reports
are generated and provide descriptions of the second order
traits, which offer more global descriptions and the sixteen
factors that provide more precise trait information. Because
this test has over 60 years of use, it has a number of empirical
studies from which to draw. The goal of the assessment is to
provide a rich and in-depth integrated picture of an

34!
individual’s whole personality. The interpretation is based on
Cattell’s theory of individual differences.
The Personality Research Form (PRF) is a 352-item measure
of normal personality based on Murray’s Framework of
personality. Murray’s framework of personality is based on
twenty-eight social needs that an individual strives to meet in
a number of ways. Within the instrument itself, twenty-two
subscales (e.g., abasement, cognitive structure, dominance,
aggression, etc.) generate an overall picture of personality.
Norms are based on separate samples of male and female college
students in North America. Norms for other groups, including
clinical populations, are available but were not incorporated
into original test construction. These norms notwithstanding,
median internal consistency reliabilities are around .70. Test-
retest reliability are between .80 and .96 for a two-week
interval. The PRF is one of the most highly utilized and cited
personality assessments in use today (Jackson, 1997).
Unlike the CPI, PRF, 15PF Questionnaire, and NEO PI-R, the
authors of the PAI point out that the instrument was not
constructed to provide a comprehensive assessment of the domains
of normal personality, but instead is intended to be utilized as
a clinical tool for assessment and treatment planning (Morey,
2007).

35!
Projective Measures of Personality
Another major category of personality assessment involves
projective techniques. In such techniques, clients are given
unstructured tasks to complete. The underlying assumption is
that the individual will project his or her own characteristics
into the response to the task. Projective techniques are
disguised for their purposes, similarly to performance and
situational tests. Examples of projective tests include free-
association techniques, sentence completion, neutral stimulus
interpretation, and other elements of dramatic play (Anastasi,
1988).
Projective techniques of personality assessment have
carried documented psychodiagnostic bias to the detriment of
those of lower-SES status (Trachtman, 1971). As construct
validity has transitioned from a consideration to a requirement
that is expected of all instruments projective measures have
been consistently critiqued for lack of construct validity
(Smith, 2005).
A major challenge in the development of personality tests
is that the literature base is not comparable to aptitude and
36!
intelligence testing. However, many attribute this to a lack of
sufficient effort on the part of researchers (Anastasi, 1988).
This is in part because of the desire to develop and
scientifically validate instrumentation based on specific
statistical principles, which has been difficult given the large
variance in individual differences, especially in terms of
personality. However, some developers of personality tests such
as the MMPI and the PAI have developed large norm group samples
that have served to establish the scientific validity of the
overall test.
Role of Personality Assessment in Treatment Considerations
The primary goal of personality assessment in clinical
settings is to optimize treatment effectiveness. In recent
decades several psychologists have highlighted the need for
personality assessment as essential in developing appropriate
treatment plans (Million & Davis, 1996). Norcross and Goldfried
(1992) furthered this idea by saying that the inclusion of
careful personality assessment through objective means
highlights recent integrative approaches and puts an empirically
supported layer between the theory in which a clinician was
trained and the understanding or framing of a particular type of
psychopathology.
37!
Personality assessment plays an important role in all
stages of clinical treatment including diagnosis, treatment
planning, treatment compliance, and therapeutic alliance (Ben-
Porath, 1997). Assessment of personality provides an
empirically validated means for identifying and quantifying
clients’ needs, which in turn suggests appropriate intervention
modalities, documenting in a reliable manner their initial level
of functioning, and providing a baseline which can be followed
over time (Griffith, 1998). Butcher (2002) made a strong
argument for the use of personality assessment in the all stages
of treatment. In particular, Butcher (2002) and Finn (1996)
noted the importance of the initial shaping of the treatment
planning, in tracking effectiveness of ongoing treatment, and in
evaluating eventual treatment outcomes. This argument comes out
of pragmatism and references both theory and case examples to
highlight the importance. Personality assessments have the
ability to simultaneously identify characterological issues and
traits, life circumstances, and current symptomology in a way
that interviews and clinical data cannot (Butcher, 2002). When
a clinician is given all of this information within the initial
stages of treatment, they are better able to make a plan that
addresses the needs of the client based on the information
gathered. Barriers to treatment, including characterological
considerations and readiness for change, may be identified

38!
through comprehensive personality assessment (Ben-Porath, 1997).
As treatment progresses, personality assessments can be used to
identify improvements and possibly to inform changes as a part
of the process.
Rouse et al. (1997) conducted a meta-analysis that found
that the MMPI-MMPI-2 were widely used by marriage and family
therapists. The study found that typically researchers used
repeated testing with the MMPI-2 to measure change in
psychological functioning before and after the intervention.
Thus further validating the argument that personality assessment
can be used to plan and monitor the outcomes of interventions.
Other studies examined within the Rouse et al. (1997) article
established the use of personality assessment to determine
readiness for change. The authors found over 100 studies that
examined the ability of a personality assessment to provide
information on client traits that have previously been
established at predicting psychotherapeutic outcomes. Some
articles have utilized personality assessment to predict client
responsiveness to various psychotropic medications (Rouse et
al., 1997).
It is interesting to note that although personality
assessment as a means for treatment planning has been firmly
established as being beneficial, third party payers and managed

39!
care are often reluctant to reimburse for this cost, even in
light of its many established benefits (Ben-Porath, 1997). The
deference to clinical data and interviews over formalized
assessment is interesting given recent trends towards
empirically supported treatments that often favor
standardization and manualization of treatment. Cost is seen as
a major prohibitor of the use of personality assessments in
treatment, which is of particular relevance to social services
agencies where budgetary concerns are everpresent. Evidence for
the importance of relying on personality assessment data in
treatment planning is clearly established (Maurish, 1994).
Objective personality assessment through empirically validated
means provides significant accountability within the treatment
planning and therapeutic process (Moreland, Fowler, and Honaker,
1994). Tillet (1996) described in his article the importance of
assessment especially in light of increasingly common brief
therapy, which often requires that interventions begin quickly
within the process, therefore relying more heavily on initial
assessments, including personality assessments. Collins and
Thompson (1993) described the ways in which personality
assessment data can be integrated with a traditional behavioral
interview in client-treatment matching. In particular, the PAI
has been identified as providing treatment-relevant information,
as has the Million Clinical Multiaxial Inventory (MCMI; Morey

40!
and Glutting, 1994; Morey, 1991; Million and Davis, 1996). This
increase in popularity for briefer, symptom-oriented assessment,
is considered by some (Pietrowski, 2000) to be part of a larger
movement away from exhaustive measures of comprehensive
personality. Some psychologists have gone so far as to say the
benefits of personality assessment in therapy are so positive
that to not utilize formalized personality assessments may in
fact hinder the therapeutic process (Butcher, 1997).
Ben-Porath (1997) outlined several major advantages to the
utilization of standardized personality assessment as a part of
all therapeutic processes. In particular he noted that
assessment data is more reliable than data collected through an
interview given interviewer differences and biases they may be
interpreting information quite differently. He reported that
they are also more valid than traditional means of data
gathering. Clinical interviews have demonstrated repeatedly to
yield less valid information when compared with standardized
measures (Dawes, Faust, & Meehl, 1989; Grove & Meehl, 1996).
Ben-Porath also postulated that the use of standardized
personality measurement in treatment lends itself to automated
interpretation, reducing clinician error and improving
efficiency (1997). Finally, he concluded that assessment
gathered on the process and outcomes of therapy increase

41!
accountability and can quantify progress in treatment. Given
these advantages, as well as the ability of personality
assessment to be used in all phases of treatment, the role of
personality assessment in treatment considerations is firmly
established as necessary and beneficial within the literature.
Personality Assessment Inventory
The Personality Assessment Inventory (PAI; Morey, 1991) is
a multi-scale, self-report instrument designed for the objective
assessment of psychopathology symptoms, personality traits,
interpersonal problems, and treatment indicators. The full form
contains 344 items that are answered on a 4-point Likert scale.
According to Morey (2007), the decision about the number of
items sought to maximize psychometric sophistication and to
minimize client or patient fatigue and administration time. The
4-point scale seeks to avoid a dichotomous style of response,
while eliminating a central choice. Items were written on a 4th
grade reading level (Flesch-Kincaid grade level; Klare, 1984),
which maximizes its utility with individuals with limited
educational backgrounds and those with lower levels of cognitive
functioning. The PAI was designed to be administered in 45 to
75 minutes (Morey, 2007).
The PAI was developed using rational test construction
theory (Loevinger, 1957), and drawing from rational and
42!
empirical methods of scale development. Loevinger (1957)
describes the rational-theoretical approach to personality test
construction as a method utilizing expert opinion to identify
traits. Traits are then used to construct individual items.
The method often utilizes empirical or mathematical rules (e.g.
factor analysis), but in conjunction with or preceded by expert
opinion. The first questionnaire used as a measure of
personality (the Personal Data Sheet) was developed by Robert
Woodworth using the rational-theoretical model in 1917, and some
estimate that 90% of scales currently in use were based on the
rational-theoretical method (Anastasi, 1986; Jackson, 1970,
1973).
Since it’s creation in 1991, the PAI has earned increasing
acceptance and popularity. Fraunhoffer and others did not
include the PAI in the top 30 most popular tests used by
clinicians in assessments in the mid-1990’s (1995). Four years
later Bocaccini and Brodsky found it to be ranked in the top 10
in legal cases involving emotional injury (1999) and ranked
fourth among objective personality tests by internship training
directors (Piotrowski & Belter, 1999). According to Lally
(2003) the PAI was one of few instruments endorsed by experts
(ABFB diplomates) across forensic and psycholegal applications
including risk for violence, risk for sexual violence,

43!
competency to stand trial, and malingering pathology. Rapid
adoption and growing popularity across clinical applications
have caused some to question how rigorously the instrument has
been researched (Pietrowski, 2000).
Items load onto 22 non-overlapping full scales under four
domains: validity (4 scales), clinical (11 scales), treatment
consideration (5 scales), and interpersonal style (2 scales).
Scales were designed to include constructs most relevant to a
general assessment of a clinical disorder. Morey (1991)
intended scales to address five major constructs; validity of an
individual’s responses, clinical syndromes, interpersonal style,
treatment complications, and characteristics of the individual’s
environment.
Research exploring the use of the PAI with lower-SES
populations is difficult to find. One of few using the PAI that
has addressed racial and socioeconomic differences, Alterman and
others (1995) compared individuals from a lower-SES, ethnically
diverse sample to Morey’s (1991) clinical reference sample.
Participants in Alterman et al.’s study held a lower valid
response rate than those of previous studies (70 percent,
compared to 80 to 85 percent). Notably, participants in the
study were methadone maintenance patients and volunteered for
participation while in heroin dependence treatment. Researchers

44!
reported statistically significant differences from the general
clinical population described in Morey’s clinical norm sample
(1991), including lower scores on the ANX, DEP, ALC, and SUI,
and higher scores on MAN, PAR, ANT, DRG, AGG, DOM, and WRM
scales. No significant gender differences were reported in the
study.
Research suggests that treatment scale scores of the PAI
may be able to predict treatment dropout (Hopwood, Ambwani, &
Morey, 2007; Hopwood, et al., 2008). In Hopwood et al.’s 2007
study, the PAI was used to operationalize predictors of
treatment suitability as measured by the TPI (treatment
amenability) scale. Results of the study suggested that the PAI
effectively predicted premature psychotherapy termination in
individuals that were motivated (as measured by the RXR scale)
for treatment (Hopwood, Ambwani, & Morey, 2007).
The PAI has shown initial promise in use with African
American populations. Preliminary research has examined racial
differences between African American and White college students
and factor structure of group scores in college populations and
forensic populations (Todd, 2005; Lalley, 2003). Studies have
concluded a lack of test bias, but more research is needed with
non-clinical community samples to examine the utility of this
instrument with African Americans in different settings. Results

45!
must be interpreted cautiously and within cultural contexts so
as to ethically and sensitively explore potential differences.

46!
!
!
CHAPTER 3
Methods
Research Design
The quantitative ex post facto design will be used for this
study since the objective is to determine whether there are
differences between the sample and norm group of subjects as
well as if there is a difference between White and African
American participants. With the ex post facto design the level
or categories for the independent variable will be already
defined or classified. In the context of social and educational
research, ex post facto research is used as a retrospective
study, in which cause-and-effect relationships are assessed by
using existing conditions or state of affairs (Cohen, Manion &
Morrison, 2000). Ex post facto research looks back in time to
determine any possible causes for the particular outcomes of
interest. Additionally, the ex post facto design is appropriate
when the events or treatments have already occurred and cannot
be manipulated by the researcher (Cohen, Manion & Morrison).
Because the data was collected during another study phase, the
researcher does not have the ability to manipulate any of the
data used in the analysis.
47!
The quantitative research approach will be used for the
proposed study rather than a qualitative design because with a
qualitative design the researcher would not be able to compare
groups of subjects with one another, since data is based on
open-ended questions in qualitative studies (Creswell, 2009).
The responses in qualitative studies have to be interpreted and
coded to identify trends or themes in the responses of
qualitative research designs. Moreover, qualitative research
addresses different questions, such as the how and why questions
of research (Yin, 2003). This is not the purpose of the proposed
study. The purpose of the proposed study is to determine if
there are differences between the sample and norm group of
subjects in terms of their t-scores from the Personality
Assessment Inventory (PAI) scales. Similarly, White and African
American participants t-scores from the Personality Assessment
Inventory (PAI) scales will be compared with one another to
determine if there was a significant difference between the two
groups.
Research Questions
The research questions were posed so that several different
comparisons could be made. The comparisons that will be made in
the proposed study will be based on information collected during
the proposed study as well as the Normed values as indicated by
the PAI manual (Morey, 2007). Scores of the Anxiety, Anxiety-

48!
related Disorders, Depression, Stress, and Nonsupport scales of
the current female sample will be compared to the norm female
sample. Using the same five scales, scores of the African
American group from the current sample will be compared to the
White group from the current sample.
RQ1a: Are there differences in the Anxiety (ANX) t-scores
between the current sample and census-matched norm group?
RQ1b: Are there differences in the Anxiety related
disorders (ARD) t-scores between the current sample and census-
matched norm group?
RQ1c: Are there differences in the Depression (DEP) t-
scores between the current sample and census-matched norm group?
RQ1d: Are there differences in the Stress (STR) t-scores
between the current sample and census-matched norm group?
RQ1e: Are there differences in the Nonsupport (NON) t-
scores between the current sample and census-matched norm group?
RQ2a: Are there differences in the Anxiety (ANX) t-scores
between White and African American participants in the current
sample?
RQ2b: Are there differences in the Anxiety related
disorders (ARD) t-scores between White and African American
participants in the current sample?

49!
RQ2c: Are there differences in the Depression (DEP) t-
scores between White and African American participants in the
current sample?
RQ2d: Are there differences in the Stress (STR) t-scores
between White and African American participants in the current
sample?
RQ2e: Are there differences in the Nonsupport (NON) t-
scores between White and African American participants in the
current sample?
Hypotheses
H01a: There are no differences in the Anxiety (ANX) t-scores
between the current sample and census-matched norm group.
HA1a: There are differences in the Anxiety (ANX) t-scores
between the current sample and census-matched norm group.
H01b: There are no differences in the Anxiety related
disorders (ARD) t-scores between the current sample and census-
matched norm group.
HA1b: There are differences in the Anxiety related disorders
(ARD) t-scores between the current sample and census-matched
norm group.
H01c: There are no differences in the Depression (DEP) t-
scores between the current sample and census-matched norm group.
HA1c: There are differences in the Depression (DEP) t-scores
between the current sample and census-matched norm group.

50!
H01d: There are no differences in the Stress (STR) t-scores
between the current sample and census-matched norm group.
HA1d: There are differences in the Stress (STR) t-scores
between the current sample and census-matched norm group.
H01e: There are no differences in the Nonsupport (NON) t-
scores between the current sample and census-matched norm group.
HA1e: There are differences in the Nonsupport (NON) t-scores
between the current sample and census-matched norm group.
H02a: There are no differences in the Anxiety (ANX) t-scores
between the current sample and census-matched norm group.
HA2a: There are differences in the Anxiety (ANX) t-scores
between the current sample and census-matched norm group.
H02b: There are no differences in the Anxiety related
disorders (ARD) t-scores between the current sample and census-
matched norm group.
HA2b: There are differences in the Anxiety related disorders
(ARD) t-scores between the current sample and census-matched
norm group.
H02c: There are no differences in the Depression (DEP) t-
scores between the current sample and census-matched norm group.
HA2c: There are differences in the Depression (DEP) t-scores
between the current sample and census-matched norm group.
H02d: There are no differences in the Stress (STR) t-scores
between the current sample and census-matched norm group.
51!
HA2d: There are differences in the Stress (STR) t-scores
between the current sample and census-matched norm group.
H02e: There are no differences in the Nonsupport (NON) t-
scores between the current sample and census-matched norm group.
HA2e: There are differences in the Nonsupport (NON) t-scores
between the current sample and census-matched norm group.
Participants
Protocols from participants (n=105) came from an existing
database from social services agencies within a ten county
region in a large southeastern state. Of the larger pool, 84
protocols met validity criteria described in the PAI manual
(Morey, 2007). Validity scales were utilized to determine
appropriately valid profiles. The validity scales were developed
to provide an assessment of potential influences of certain
response tendencies on PAI test performance. Two of the scales,
Inconsistency (ICN) and Infrequency (INF) are useful in
determining random responses as the source of profile
distortion. ICN is measured with 10 pairs of items with related
content. Cutoff for ICN is determined at roughly a raw score of
10 (64T). Infrequency is useful for indentifying random
responding by identifying respondents who answer questions in an
atypical way. The items in INF were selected on the basis of
very low endorsement frequencies in both normal and clinical

52!
respondents. The cutoff score is roughly equal to a raw score
of 8 (71T) (Morey, 2007).
Negative Impression (NIM) reflects the degree to which the
PAI profile is likely to be distorted in a negative or
pathological direction. The NIM scale is likely to be elevated
when a respondent is malingering or feigning. The cutoff, or
identification as “fake bad”, is characterized by very high
scores on NIM or a mean T score of 118. Positive Impression
(PIM) reflects the degree to which the PAI profile is likely to
be distorted in a positive direction. It would be expected to be
elevated in the presence of defensiveness or denial, or when a
respondent has poor insight. For PIM, a raw score of 23 (68T)
corresponds to an elevation of two standard deviations above the
mean, and therefore a cutoff.
Participants’ ages ranged from 18 to 44 years (M = 22
years, SD = 6.45 years). Participants identified their racial
or ethnic background in the beginning of the clinical interview
phase of evaluation and many also provided a written response in
the personal information section on the PAI protocol. 52% (N =
55) of the sample identified as Black or African American, 47%
(N = 48) identified as White or Caucasian, 1% (N = 2) as
biracial or multiracial, and no participants failed to provide a
response.

53!
Sample Size
The minimum sample size required for the proposed study was
calculated by using an a priori estimate. The a priori estimate
was based on three factors which included the power of the
study, the effect size and the level of significance. The power
selected for the proposed study was .80, while a large effect
size of d = .80 was selected. The level of significance for the
proposed study was set equal to .05. Based on this information,
the minimum sample size required for the proposed study was 52.
This was calculated in G*Power using a power of .80, a large
effect size, and a level of significance of .05 for a two-tailed
independent samples t-test.
Institutional Approval
Prior to the conduct of this research, approval was
obtained from the county directors of the participating
counties. The University of Georgia Institutional Review Board
also approved the protocol associated with this study. Members
of the research team were involved in the original collection of
data and low cost brief psychological evaluations of clients
within this social services agency region. All research team
members held a terminal Master’s Degree in Counseling or related
fields and were in their second year, or later, of training in
the Counseling Psychology doctoral program. All evaluators had
previously completed a minimum of three administrations of the
54!
PAI. Educational background, previous training, and association
with the assessment project assured that all members of the
research team were able to attend to inquiries and address
clinical crises associated with the evaluations, report writing,
and feedback with the clients and case workers.
Recruitment
Given the archival nature of data used in the current
study, participants were not formally recruited, nor were they
compensated in any way. The protocols were used from a database
from a collaborative project between a large public university
and a state social services agency. The PAI was used in concert
with other instruments in a battery used to produce brief
psychological reports for adult participants of a federal
welfare to work program. At the time of evaluation participants
completed an informed consent document citing the intents and
purposes of the assessment, potential uses of data derived from
the evaluations, and the limits to confidentiality.
Procedures
The data in this study was collected from a separate
ongoing assessment project within the social services agency.
This project provided assessments for caseworkers involved with
clients who were applicants in the Temporary Assistance for
Needy Families (TANF) program. These comprehensive

55!
psychological evaluations were designed to provide information
for caseworkers and applicants about the mental health and
career interests for individuals so that a more well-informed
treatment plan may be formulated to suit an individual client’s
needs and interests.
Instruments
Personality Assessment Inventory (PAI; Morey, 1991). The
PAI is a multi-scale self-report instrument designed for the
objective assessment of psychopathology symptoms, personality
traits, interpersonal problems, and treatment indicators in
adults 18 years and older. The full form consists of 344 items.
Items are scored on a 4-point Likert scale and contribute to 22
non-overlapping scales. Response choices include “totally
false”, “slightly true”, “mainly true”, “very true”. Items were
written at a 4th grade reading level (Flesch-Kincaid scale;
Klare, 1984). When used as a clinical instrument the PAI
purports to provide data relevant to clinical diagnosis,
treatment planning, and screening for psychopathology. The
authors point out that the instrument was not constructed to
provide a comprehensive assessment of the domains of normal
personality (Morey, 2007).
Authors of the instrument assert that the clinical
syndromes assessed by the PAI were chosen based on their
historical significance within the psychiatric nosology of the

56!
mental health field and their modern diagnostic relevance in
clinical practice (Morey, 2007).
Validity Scales. The Personality Assessment Inventory
(PAI) includes four validity scales: Inconsistency (ICN),
Infrequency (INF), Negative impression (NIM), and Positive
impression (PIM). The ICN scale monitors 10 pairs of highly
correlated items to indicate how consistently a client responds
to similar items. The INF scale is made up of 8 neutral
(unrelated to psychopathology) items that seek to identify
response patterns that may be careless, random, or
idiosyncratic. The NIM scale is comprised of 9 items that
suggest the portrayal of an overly unfavorable picture or
malingering. The PIM scale seeks to identify response patterns
that present an overly positive portrayal or reluctance to
endorse minor flaws. Significant elevations on these scales may
impair the clinician’s ability to interpret other scales,
thereby rendering the protocol invalid.
Clinical Scales. The instrument’s 11 clinical scales are
comprised of Somatic complaints (SOM), Anxiety (ANX), Anxiety
related disorders (ARD), Depression (DEP), Mania (MAN), Paranoia
(PAR), Schizophrenia (SCZ), Borderline features (BOR),
Antisocial features (ANT), Alcohol problems (ALC), and Drug
problems (DRG). Apart from the ALC and DRG scales, the other
clinical scales each contain three subscales.

57!
The Anxiety (ANX) scale is made up of 24 items that focus
on the phenomenology and objective signs of anxiety across
response modalities. Each subscale contains 8 items. The
Cognitive (ANX-C) subscale items assess for ruminative worry and
concern about current issues that result in impaired
concentration and attention. The Affective (ANX-A) subscale
focuses on the experience of tension, difficulty with
relaxation, and the presence of fatigue as a result of perceived
stress. The Physiological (ANX-P) subscale focuses on
physiological signs of tension and stress (e.g. sweaty palms,
trembling hands, tachycardia, shortness of breath).
The 24-item Anxiety-related Disorders (ARD) scale focuses
on symptoms and behaviors of anxiety disorders, particularly
specific phobias, trauma-related stress, and obsessive-
compulsive symptoms. Each subscale is equally made up of 8
items. The Obsessive-Compulsive (ARD-0) subscale examines
intrusive thoughts and behaviors, rigidity, indecision,
perfectionism, and affective constriction. The Phobias (ARD-P)
subscale focuses on common phobic fears, such as social
situations, public transportation, heights, enclosed spaces, and
other specific objects. The Traumatic Stress (ARD-T) subscale
focuses on the experience of traumatic events that cause ongoing
distress and are perceived as having left the client changed or
damaged in some fundamental way.

58!
The Depression (DEP) scale has 24 items related to the
phenomenology and symptom of depressive disorders. Subscales of
the DEP scale each contain 8 items. The Cognitive (DEP-C)
subscale focuses on thoughts of worthlessness, hopelessness, and
personal failure, as well as indecisiveness and problems with
concentration. The Affective (DEP-A) subscale measures feelings
of sadness, loss of interest in normal activities, and
anhedonia. The Physiological (DEP-P) subscale focuses on
physical functioning and the areas of energy, activity, sleep,
appetite, and changes in weight.
Treatment Scales. There are five treatment scales that
include Aggression (AGG), Suicidal ideation (SUI), Stress (STR),
Nonsupport (NON), and Treatment rejection (RXR).
The 8 items of the STR scale measure the relative impact of
recent stressors on major life areas.
The Nonsupport (NON) scale is made up of 8 items that
measure the lack of perceived social support and consider the
level and quality of available support.
Scale scores are presented in the form of linear T scores
that have a mean score of 50T and a standard deviation of 10T.
T-score transformations are calibrated based on a national
census-matched community sample of 1,000 adults stratified by
age, race, and gender using United States census projections for
the year 1995. Extensive data also were gathered for
59!
representative samples of clinical individuals (N = 1,246) and
college students (N = 1,051) (Morey, 1991; 2007).
Data from protocols were entered by three individual
doctoral student-clinicians and scored using the PAI
computerized scoring program sold by the instrument’s publisher
(PAR Inc.).
Current Research
Research has long connected mental illness with poverty and
low SES. Several articles have found mental illness related to
specific disorders, symptoms, and diagnoses (Table 1).
Consistent with previous research, comparisons for the current
study will use the Anxiety, Anxiety-related Disorders, and
Depression clinical scales of the PAI for the current female
low-SES sample.

60!
Table 3.1
Frequently cited research connecting SES and mental illness
Author(s) Year Finding Times cited
(EBSCO
databases)
Diagnoses/ Symptom(s)
Ansseau, et al. 2008 Higher incidence in low SES
populations
8 Generalized anxiety
disorder, Major
depressive disorder
Boydell, van Os,
MacKenzie, &
Murray
2004 Higher incidence in low SES
populations
20 Psychosis
Dohrenwend et
al.
1992 Higher incidence in low SES
populations
85 Schizophrenia,
Substance abuse,
Depression,
Antisocial
personality
Hudson 2005 Higher incidence in low SES
populations across
diagnoses
55 Schizophrenia,
Affective disorders,
Depression,
Adjustment disorders
Kessler et al. 1994 Higher incidence in low SES
populations
7024 Affective disorder,
Anxiety disorder,
Substance abuse
Mowbray et al. 2004 Higher incidence in low SES
populations, diagnoses
unequally distributed by
race
14 Depression,
Schizoaffective,
Schizophrenia
Miech, Caspi,
Moffitt, Wright,
& Silva
1999 Higher incidence in low SES
populations, different
diagnoses may be
differently related to SES
164 Anxiety, Depression,
Antisocial
personality disorder
Simmons et al. 2008 Higher incidence in low SES
populations
4 Depression
Warheit, Holzer,
& Arey
1975 SES is a better predictor
of mental illness diagnosis
than race, refutes previous
race comparative research
97 Phobia, Depression,
Anxiety
Statistical Analysis
For the purpose of this proposed study, the data will be
imported into SPSS Version 16.0® for analysis. Descriptive
statistics and independent samples t-tests will be conducted to
assess the stated hypotheses. Descriptive statistics will
include frequency distributions, which indicate the number and
percentage of participants who belong to a particular group or
category. Frequency distributions will be calculated for the
categorical variables included in the study. Summary statistics,

61!
including means, standard deviations, minimum and maximum values
will be calculated to illustrate the distribution of the
continuous variables included in the study. The summary
statistics will examine the distribution of the variables in
order to determine if the variables are normally distributed.
Independent samples t-tests will be conducted to address
each of the hypotheses of the proposed study. The independent
samples t-test will be used because two groups of subjects will
be compared with one another. The two groups that will be
compared with one another are those who are in the sample and
those who are in the norm group. By using the independent
samples t-test it will be determined if there was a significant
difference between the current sample and census-matched norm
groups when it comes to the scores received on the PAI scales.
The average PAI scale scores for each group will be compared
with one another to determine if there was a significant
difference. The resulting test statistic is based on a t-
statistic, which means that if the test statistic exceeds the
critical value from the t-distribution then the null hypothesis
will be rejected (Moore & McCabe, 2006). For the purpose of this
proposed study, the level of significance will be .05, where any
p-values lower than .05 will be considered to be significant.
To assess the hypothesis that there are differences in the
Anxiety (ANX) t-scores between the sample and norm group, an

62!
independent samples t-test will be conducted. The independent
variable will be the sample and groups. The dependent variable
will be the Anxiety (ANX) variable.
To assess the hypothesis that there are differences in the
Anxiety related disorders (ARD) t-scores between the sample and
norm group, an independent samples t-test will be conducted. The
independent variable will be the sample and groups. The
dependent variable will be the Anxiety related disorders (ARD)
variable.
To assess the hypothesis that there are differences in the
Depression (DEP) t-scores between the sample and norm group, an
independent samples t-test will be conducted. The independent
variable will be the sample and groups. The dependent variable
will be the Depression (DEP) variable.
To assess the hypothesis that there are differences in the
Stress (STR) t-scores between the sample and norm group, an
independent samples t-test will be conducted. The independent
variable will be the sample and groups. The dependent variable
will be the Stress (STR) variable.
To assess the hypothesis that there are differences in the
Nonsupport (NON) t-scores between the sample and norm group, an
independent samples t-test will be conducted. The independent
variable will be the sample and groups. The dependent variable
will be the Nonsupport (NON) variable.
63!
To assess the hypothesis that there are differences in the
Anxiety (ANX) t-scores between the African American group and
the White group in the current sample, an independent samples t-
test will be conducted. The independent variable will be the
groups. The dependent variable will be the Anxiety (ANX)
variable.
To assess the hypothesis that there are differences in the
Anxiety related disorders (ARD) t-scores between the African
American group and the White group in the current sample, an
independent samples t-test will be conducted. The independent
variable will be the groups. The dependent variable will be the
Anxiety related disorders (ARD) variable.
To assess the hypothesis that there are differences in the
Depression (DEP) t-scores between the African American group and
the White group in the current sample, an independent samples t-
test will be conducted. The independent variable will be the
groups. The dependent variable will be the Depression (DEP)
variable.
To assess the hypothesis that there are differences in the
Stress (STR) t-scores between the African American group and the
White group in the current sample, an independent samples t-test
will be conducted. The independent variable will be the groups.
The dependent variable will be the Stress (STR) variable.
64!
To assess the hypothesis that there are differences in the
Nonsupport (NON) t-scores between the African American group and
the White group in the current sample, an independent samples t-
test will be conducted. The independent variable will be the
groups. The dependent variable will be the Nonsupport (NON)
variable.

65!
CHAPTER 4
Findings
Introduction
The main objective of the current study was to examine
significant differences in PAI scale scores of a two non-
clinical adult female samples. To this end, two sets of
research questions were formulated:
RQ1a: Are there differences in the Anxiety (ANX) t-scores
between the current sample and census-matched norm group?
RQ1b: Are there differences in the Anxiety related
disorders (ARD) t-scores between the current sample and census-
matched norm group?
RQ1c: Are there differences in the Depression (DEP) t-
scores between the current sample and census-matched norm group?
RQ1d: Are there differences in the Stress (STR) t-scores
between the current sample and census-matched norm group?
RQ1e: Are there differences in the Nonsupport (NON) t-
scores between the current sample and census-matched norm group?

66!
RQ2a: Are there differences in the Anxiety (ANX) t-scores
between White and African American participants in the current
sample?
RQ2b: Are there differences in the Anxiety related
disorders (ARD) t-scores between White and African American
participants in the current sample?
RQ2c: Are there differences in the Depression (DEP) t-
scores between White and African American participants in the
current sample?
RQ2d: Are there differences in the Stress (STR) t-scores
between White and African American participants in the current
sample?
RQ2e: Are there differences in the Nonsupport (NON) t-
scores between White and African American participants in the
current sample?
To answer the two sets of research questions, t-test
procedures were conducted. The results of the t-tests
procedures are presented in the section after the descriptive.

67!
Description of Sample and Study Variables
Description of the Sample
The frequency counts and percentages for race are presented
in Table 1. There were slightly more African American
respondents (52.4%) as compared to Whites (47.6%).
Table 4.1
Frequency Counts and Percentages for Demographic Variables (N =
84)
Frequency Percent
Race
African
American
44 52.4
White 40 47.6
Description of the Study Variables
The mean, standard deviation, and skew values of the
continuous variables used in the study are presented in Table 2.
The findings indicate that all the study variables were normally
distributed. The skew values either fell within the acceptable
range of -1 to +1 or were sufficiently near the acceptable
range.

68!
Table 4.2
Descriptive Statistics for Study Variables
Census-matched
Sample (Morey, 1991)
Current Sample
Scale N Mean Std.
Dev.
N Mean Std.
Dev.
Skewness
Std.
Error
ANX 520 50.75 9.65 84 56.99 13.47 1.08 .26
ARD 520 50.97 9.89 84 59.21 14.58 .71 .26
DEP 520 50.19 9.86 84 59.31 14.19 1.11 .26
STR 520 50.22 9.91 84 66.23 10.80 .04 .26
NON 520 48.71 9.75 84 55.20 12.45 .16 .26
T-Test Results between Sample and Norm Group
One-sample t-tests were conducted to determine if there are
significant differences between the current sample and the
census-matched norm group in terms of Anxiety (ANX), Anxiety
related disorders (ARD), Depression (DEP), Stress (STR), and
Nonsupport (NON) scores. The t-test results are presented in
Table 3. It was observed that there were significant differences
between the current sample and the census-matched norm group in
terms of Anxiety (ANX), Anxiety related disorders (ARD),
Depression (DEP), Stress (STR), and Nonsupport (NON) scores,
since all the p-levels were less than 0.05.

69!
Table 4.3
T-Test Results between Sample and Norm Group
95% Confidence
Interval of the
Difference
t df
Sig. (2-
tailed)
Mean
Difference Lower Upper
ANX 4.24 83 .00 6.24 3.31 9.16
ARD 5.18 83 .00 8.24 5.08 11.41
DEP 5.89 83 .00 9.12 6.04 12.20
STR 13.58 83 .00 16.01 13.66 18.35
NON 4.78 83 .00 6.49 3.79 9.19
T-Test Results for Race
Independent samples t-tests were conducted to determine if
there are significant differences between the White and African
American groups in terms of Anxiety (ANX), Anxiety related
disorders (ARD), Depression (DEP), Stress (STR), and Nonsupport
(NON) scores. Prior to the t-test, Levene’s test for equality of
variances was conducted to determine the variance assumption.
Levene’s test results are presented in Table 4 and the t-test
results are presented in Table 5. It was observed that there
were significant differences between White and African American
groups only in terms of Stress (STR) scores, since its p-level

70!
was less than 0.05. There were no significant difference between
the two races in terms of Anxiety (ANX), Anxiety related
disorders (ARD), Depression (DEP), and Nonsupport (NON) scores,
since their p-levels were greater than 0.05.
Table 4.4
Levene’s Test Results for Race
Levene's Test for Equality
of Variances
Variance Assumption
Scale F Sig.
ANX 4.97 .03 Unequal Variances Assumed
ARD 4.63 .03 Unequal Variances Assumed
DEP .77 .38 Equal Variances Assumed
STR 2.82 .10 Equal Variances Assumed
NON .00 .99 Equal Variances Assumed
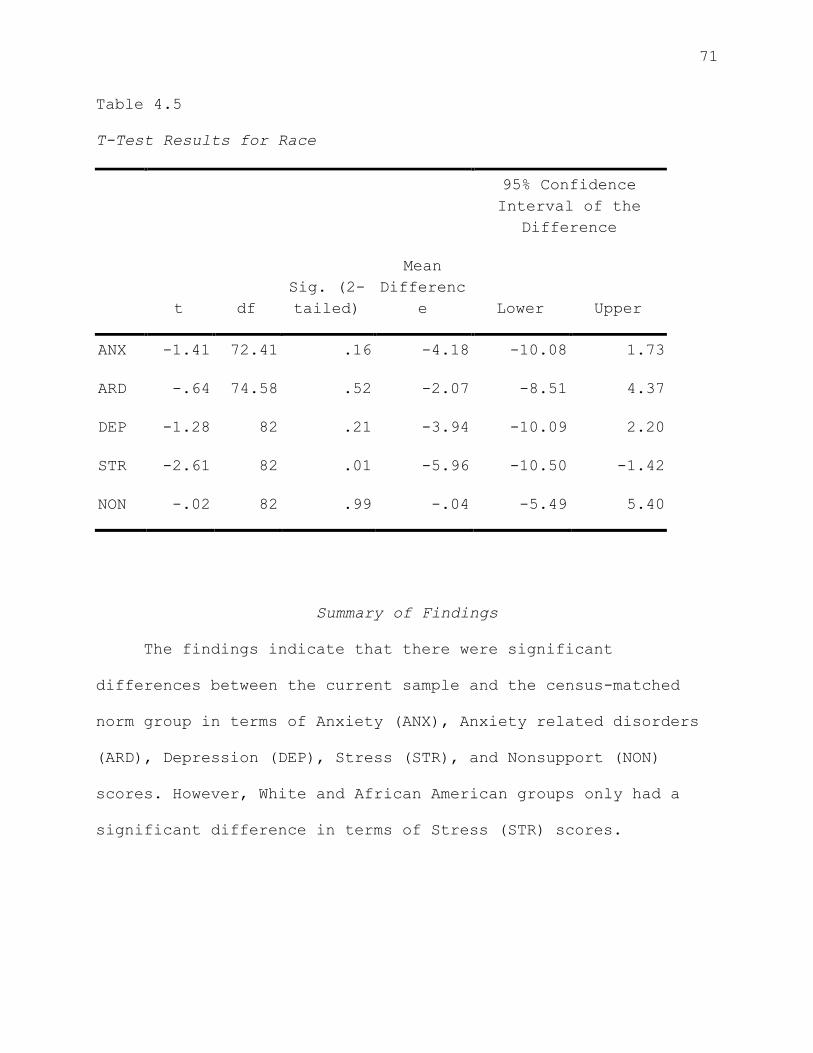
71!
Table 4.5
T-Test Results for Race
95% Confidence
Interval of the
Difference
t df
Sig. (2-
tailed)
Mean
Differenc
e Lower Upper
ANX -1.41 72.41 .16 -4.18 -10.08 1.73
ARD -.64 74.58 .52 -2.07 -8.51 4.37
DEP -1.28 82 .21 -3.94 -10.09 2.20
STR -2.61 82 .01 -5.96 -10.50 -1.42
NON -.02 82 .99 -.04 -5.49 5.40
Summary of Findings
The findings indicate that there were significant
differences between the current sample and the census-matched
norm group in terms of Anxiety (ANX), Anxiety related disorders
(ARD), Depression (DEP), Stress (STR), and Nonsupport (NON)
scores. However, White and African American groups only had a
significant difference in terms of Stress (STR) scores.

72!
CHAPTER 5
Discussion
Research offers the best and most long lasting impact when
it is taken from and then applied back to real world settings.
The current study sought to utilize archival data from a large
assessment project working with women in poverty and synthesize
that data to contribute to the understanding of the mental
health of those women in poverty as compared to the census-
matched norm sample from which the instrument was developed. The
primary goal of this research is to measure several important
mental health indicators (as measured by PAI scale scores) of
women in poverty, and to question to what degree instruments
used for this type of clinical inquiry, in this case the
Personality Assessment Inventory (PAI; Morey, 1991), are
appropriate for use within this population. This type of
research is essential within clinical and assessment practice
because it allows for the expansion of norms beyond those
identified by the developer of the instrument. SES and its
impact are often neglected as an important factor deserving of
unique intentional examination. Although the challenges of
poverty are clearly documented, SES has not often acquired
enough attention within personality inventory research. This

73!
research sought to focus on this important demographic variable
in order to glean further insight into the relationship between
mental health and SES for the current population. In line with
the greater goals of social justice, this study sought to
contribute to the literature highlighting the needs and
reporting the symptomology of an otherwise often marginalized
population, with the eventual goal of advocacy and change in
both individual client cases and with implications for broader
systemic policies within the social services agency.
An important goal of this study is to be able to provide
information which can then be incorporated into treatment
planning in a way which is meaningful and will help women in
this low SES population gain more access (and of higher quality)
to well needed services. This research is seen as a first step
to advocate for the allocation of resources for mental health
services for this population, which has been documented as being
significantly underserved.
The selected scales focus on several aspects of mental
health functioning that were selected through several means of
established relevance. The selection included information
gathered from caseworkers and graduate student evaluators
utilizing historical evidence to suggest which scales would be
most relevant within this population. A review of the literature
74!
then supported some of the initial ideas posited by the
caseworkers and evaluators. Through ongoing recommendations by
the social services agency and an examination of research in the
area, the ideas were then distilled into a refined choice of PAI
scales to be targeted for study and further evaluation. The
scales selected represent the most common clinical symptomolgy
reported by clients in the TANF population, according to
caseworkers and graduate student evaluators and those that have
been associated with individuals struggling with poverty. This
type of research ideally represents the dynamic process that can
take place between research and practice when both are used to
inform and improve one another.
The results of the study indicate that, as predicted, there
were significant differences between the current sample of
community adult females with low-SES as compared to Morey’s
(1991) community adult female norm sample on each of the five
PAI scales of interest (RQ1a-RQ1e).
Anxiety (ANX)
Significantly higher scores on the ANX scale suggest that
members of the low-SES group endorsed experiencing higher rates
of cognitive, affective, and physiological symptoms of anxiety.
This scale captures the phenomenological experience of anxiety,
e.g., the physical symptoms such as racing heart beat, sweating,
heavy breathing, the cognitive symptoms such as rumination and

75!
racing thoughts and the affective component such as fear, worry,
and exasperation. These symptoms generally contribute to global
level of distress across major life areas, which can impact
ability to cope. This higher average level of anxiety symptoms
is of clinical interest to caseworkers and psychotherapists in
the development of appropriate treatment planning. Individuals
who score highly on this scale are likely to report some somatic
symptoms as a part of their presentation. It may be important
for clinicians to understand this implication and make referrals
to psychiatrists for medication when appropriate. Clinicians and
caseworkers may wish to carefully evaluate clients for symptoms
associated with anxiety, and incorporate building coping skills
and relaxation techniques into treatment plans.
Anxiety-related Disorders (ARD)
Differences on the ARD scale indicate that members of the
low-SES group report experiencing higher rates of phobic,
trauma-related, and obsessive-compulsive symptoms of anxiety.
This is separate from the physiological, cognitive, and
affective components of anxiety; instead it refers specifically
to a more detailed diagnostic indicator of anxiety-related
disorders. Research on the conditions of poverty has suggested
that women living in more dangerous or volatile environments may
face increased exposure to violence and traumatic events. Past
research has shown that in adaptation to trauma and violence
76!
exposure, individuals often respond with hypervigilance and
increased awareness and suspicion of one’s surroundings
(Makosky, 1982). In addition, obsessive thoughts and re-
experiencing may occur after trauma. All of these factors could
lead to higher endorsement of items on this scale by the members
of the low-SES sample (Fox, 1990). Clinicians and caseworkers
must be aware of these differences as it may offer insight and
inform diagnoses in the treatment process. For example,
hypervigilance for a survivor of violent crime who remains in a
violent neighborhood, may both exist as a clinical symptom and
an adaptive response to an environmental reality. Differences
on the ARD scale may also help differentiate a clinical syndrome
from a more global reaction to stress, which has been well
documented within impoverished populations. This is essential
for caseworkers to recognize when making referrals for
appropriate treatments for their clients, because the potential
cost of overlooking evidence of PTSD and OCD symptoms is to
undermine case management objectives and to miss out on
opportunities for appropriate referrals for other mental health
services.
Depression (DEP)
Higher scores on the DEP scale are reflective of
experiencing increased cognitive, affective, and physiological
symptoms of depression. Though causal inferences have not been
77!
determined, depressive symptoms are well documented to coincide
with stressful life events like those associated with the
conditions of poverty. For example, chronic uncertainty, which
has implications for pessimistic explanatory style or limited
prospects that is associated with certain kinds of hopelessness
(Beck et al., 1979). The correlation between depressive symptoms
and stressful life events was found to be present in initial
depressive episodes and in subsequent episodes (Kessler, 1997).
The finding is consistent with a study by Myers et al. (2002)
who found SES to be an important predictor of the severity of a
given depressive episode in a racially diverse female sample.
They found that the severity of depression was often mitigated
by stressful life events that could usually be attributed to low
SES (i.e., problems in obtaining resources for education or
employment and the corresponding impact on relationships).
Increases in depressive symptoms are often theoretically
associated with locus of control and explanatory style (Beck, et
al., 1979). Women of low SES, and particularly minority women,
experience high levels of oppression interpersonally and
institutionally, which may lead to the attribution or belief
that many life circumstances are beyond the control of the
individual. It is important for caseworkers to keep these
factors in mind when interacting with clients and to emphasize
the power that the individual can have over her situation. For

78!
example, it may be important to stress that a client cannot
determine the level of his or her benefits, but they can be
responsible for turning in all requisite paperwork and keeping
in contact with a social worker, such that their case has the
best chance of meeting approval.
Nonsupport (NON)
Significantly higher scores on the NON scale suggest that
member of the low-SES group perceived having less social
support, and the support available less adequate and
consistently available. This finding is consistent with
existing research that has suggested that systemic realities of
poverty often present simultaneous levels of increased stress
and decreased social support (Makosky, 1982). The frequent moves
and interpersonal stressors can make establishing consistent and
long term supportive relationships more difficult. Unpredictable
and inflexible work schedules can be an additional difficulty in
establishing support networks. It is this scale in particular
that offers the greatest opportunity for caseworkers,
psychologists, and others to have the greatest impact, simply by
acting as a consistent source of support.
Stress (STR)
Significant differences found on the STR scale indicate
that the low-SES group endorsed more impactful recent stressors
across major life areas. The most evident of stressors for

79!
those in the low-SES group is financial stress. Financial
stress has been described to be highly correlated with
environmental stressors such as inadequate housing, frequent
moves, unsafe neighborhoods, and chronic uncertainty about being
able to afford the basic essentials, such as food, clothing, and
utilities (Brown et al., 1975).
The observation of significant differences on these five
scales between the two non-clinical female samples is quite
consistent and with many of the often described themes of the
conditions of poverty in existing research, such as financial
uncertainty, hopelessness, helplessness, and lack of continuity
across major life areas. These more general themes are thought
to coincide with interpersonal, relational, and vocational
stressors (e.g. the existence of some groups of stressors make
it more likely that other types of stressors will also be
present) (Hudson, 2005), which help explain a higher endorsement
of symptoms in the five PAI scales of interest in the current
study.
Racial subgroup comparison
The archival nature of the data collected and limited
access to this particular community population presented
challenges in operationalizing the construct of race.
Counseling psychologists have noted several dangers of racially
comparative research, particularly when one of the groups of

80!
comparison is made up of White (i.e. Caucasian, of European-
descent) Americans. This concern stems from the implication
that the White group has been often considered the "normal"
group, thereby relegating any other group to a "not normal",
other, or lesser status, thus perpetuating racial inequities
(Delgado-Romero, et al., 2005).
It is important to note that the purpose of considering
differences between the two groups of the current sample is
based on research that has suggested that even within the
marginalized status of having low-SES, women of racial minority
groups are further marginalized through racism and oppression
(Hudson, 2005). Comparing the groups offers the potential to
observe differences (as measured by the PAI scales) and confirm
or refute the association described in previous research between
mental health symptoms, SES, gender, and race (Fox, 1990;
Hudson, 2005). Though defining this construct by self-
identification of race into a nominal group is less than ideal,
exploring these differences with the demographic information
available is meritorious due to the potential for new insight
into the PAI's use with a population that has been rarely
considered (non-clinical, low-SES adult females).
Among the five comparisons between the African American and
White subgroups of the low-SES sample (RQ2a-RQ2e), only scores
on the Stress (STR) were found to be significantly different.

81!
The absence of significant differences on the Nonsupport (NON)
scale is of note because it is inconsistent with the differences
in perceived social support between African American women and
White women previously described in research (Myers et al.,
2002).
Significantly higher scores on the STR scale in the African
American subgroup of the current sample is conceptually
consistent with previous research describing higher levels of
stress associated with the effects of acute and chronic
indicators of discrimination (Williams et al., 1997). However,
the relative differences between racial groups in mental health
symptoms (as measured by the ANX, ARD, and DEP scales of the
PAI) that would have also been predicted by previous research
were not observed in the current study. Some researchers have
recommended measuring and considering racial identity as a
precursor to understanding race-related stress (Franklin-Jackson
& Carter, 2007).
Implications
Results of the current study concurs with much of existing
literature that has connected poverty and mental illness
symptoms (Hudson, 2005). Within existing literature on the PAI,
few have formally acknowledged or measured SES.
The current study, though a preliminary step, contributes
data to the PAI’s use with nonclinical adult females with low-
82!
SES. Clinicians and researchers alike are ethically obligated
to seek out existing relevant data when considering appropriate
instrument selection (APA Multicultural Guidelines, 2002). In
efforts toward social justice counseling psychologists have
advocated for the inclusion of and focus on underrepresented
groups in clinical research (Suzuki & Ponterotto, 2008). The
current study contributes to available data on the use of the
PAI with non-clinical adult women with low-SES, but makes
compromises in other areas of interest for social justice such
as the definition of racial and ethnic identity status of the
subjects in the study. Negotiating these nuances in goals and
ideals of social justice in counseling psychology is likely to
be an ongoing significant challenge to researchers. In line
with APA’s Multicultural Guidelines (2002) this study sought to
interpret all results cautiously and with respect to the
subjects’ individual cultural contexts. Utilizing culture-
centered perspectives as an integral part of the interpretation
of results was essential in the study’s adherence to the goals
of social justice.
Alterman et al. (1995) reported the low-SES of their
racially diverse methadone maintenance sample. The study
reported significantly lower rates of valid protocol completion
(70% valid; compared to 85-88% reported by Morey, 1991). In the
83!
study Alterman et al. consider SES as an attribution for the
lower valid completion rate. The current low-SES sample’s valid
protocol completion rate was much closer to norm sample data
(Morey, 1991) at 80%, despite having a lower average educational
background (10.5 years) than previously reported samples (Morey,
2007).
Significance within Counseling Psychology
Previous literature has noted that individuals from diverse
backgrounds who have low SES have an increased risk for
misdiagnosis and receive fewer services that are often of lower
quality (Hudson, 2005). Counseling psychologists are attempting
to address systemic inequities experienced by those from
marginalized and devalued groups in our society (D’Andrea &
Heckman, 2008). The PAI presents several potential advantages
over comparable personality inventories for use in diagnosis and
treatment planning such as shorter administration time, lower
required reading level, and additional content scales.
Researchers have emphasized the importance of establishing data
and research on the reliability, validity, and other properties
of psychological instruments to be used with diverse populations
(Suzuki & Ponterotto, 2008) and have advocated for the use of
personality assessment in the development of appropriate
treatment plans (Million & Davis, 1996).
Limitations
84!
The present study has certain limitations that should to be
taken into account when considering the study and its relative
contributions.
1. Sample size
The overall sample size and sample size of each of the two
subgroups were relatively small, which limited the number of
analyses that could be completed. A larger sample would also
allow for additional scale and subscale comparisons with less of
a reduction in power.
2. Geographic region
The current sample was taken from a 10 county region in a
large southeastern state. This could limit generalizability to
other geographic locations. Morey’s female census-matched sample
(1991) was taken from 10 regions across the United States,
therefore geographic differences between the samples could
explain some of the observed differences in the current study
(RQ1a-RQ1e). Additionally, the current sample is not a
consistent representation of the overall state TANF demographic
composition. The current sample is an overrepresentation of
White participants and an underrepresentation of African
American participants, which may limit the generalizability to
this greater TANF state population.
3. Self-report measures

85!
The PAI, like most self-report measures of personality, may
be subject to the effects of social desirability and
acquiescence (Anastasi, 1988). Though no explicit compensation
was offered or implied, these effects may also be influenced by
the environmental factors of compliance within a social services
agency program.
4. Measurement of race
In the current study racial identity was self-reported by
participants by nominal category (i.e. fill in the blank).
Though preferable to a “forced choice” method, this method does
not represent an accurate measurement of racial identity based
in a theory of racial identity development (e.g. The Cross
Racial Identity Attitude Scale; Cross, 1995).
5. Differences in time
The first set of comparisons compared data from 2007 to
Morey’s original norm sample data from 1991. We cannot be sure
that some portion of the observed scale score differences are
not due to differences in time.
Recommendations for Future Research
Unique to the current sample was the combination of low-SES
status and non-clinical status; most similar research involving
the PAI involves a clinical or forensic female population. More
research is needed when considering the relative merits of the

86!
Personality Assessment Inventory used with female low-SES
populations. Considerably larger sample sizes would enable the
use of factor analytic techniques that could provide more
detailed information about the psychometric properties of the
PAI with this population. Additionally, larger samples might
further break down the clinical scales by subscale to examine
relationships between more specific symptoms, such as the DEP-C
(cognitive), DEP-A (affective), and DEP-B (behavioral) symptoms
of depression. The higher detailed information about symptoms
would be useful for treatment planning. Researchers might make
a more formal measurement of race through racial identity
instruments (such as the CRIS; Cross, 1995) in concurrence with
using the PAI with female low-SES populations.
In the second set of comparisons between subgroups of the
current sample, no significant differences were found on the
ANX, ARD, DEP, and NON scales. Future studies might define
clinical symptomology more broadly, and therefore include more
of the PAI’s clinical scales.
Conclusion
The current study compared five scale scores of an adult
female community low-SES sample to the adult female census
matched norm sample (Morey, 1991). A second set of comparisons
examined differences between two subgroups of the current sample

87!
(African American and White females). Although causal
relationships cannot be established between the significant
elevations found across ANX, ARD, DEP, NON, and STR scales of
the PAI, the current study supports the body of research
correlating a higher occurrence of related symptoms of
psychopathology in adult female low-SES populations (Hudson,
2005).
As counseling psychologists continue efforts to address
systemic inequities experienced by those from marginalized and
devalued groups in our society (D’Andrea & Heckman, 2008) they
must consider the importance of establishing data and research
on the reliability, validity, and other properties of
psychological instruments to be used with diverse populations.
Armed with more available and relevant data to their population,
clinicians are more likely and able to construct and implement
appropriate diagnoses and treatment plans. Such increases in
the quality of mental health services to diverse women of low-
SES, are an important step in addressing previously well-
documented service disparities (Fox, 1990) which is in line with
the goals of social justice.
The PAI presents several potential advantages that are
relevant to populations with low-SES or limited educational
background. The current study contributes data to what is known

88!
about use of the PAI with this population, and highlights the
need for further study with this instrument and population.
Findings of the current study are of interest for future
research using the PAI with similar populations and for
caseworkers and clinicians utilizing the PAI in diagnosis and
treatment planning.
!
!
!
!
!
!
!
89!
!
!
REFERENCES
Alterman, A. I., Zaballero, A. R., Lin, M. M., & Siddiqui, N.
(1995). Personality Assessment Inventory (PAI) scores of
lower-socioeconomic African American and Latino methadone
maintenance patients. Assessment, 2(1), 91-100.
American Psychiatric Association. (2000). Diagnostic and
statistical manual of mental disorders (Revised 4th ed.).
Washington, DC: Author.
American Psychological Association (2003). Guidelines on
Multicultural Education, Training, Research, Practice, and
Organizational Change for Psychologists. American
Psychologist, 58(5), 377–402.
Anastasi, A. (1988). Psychological Testing (6th ed.) NY:
Macmillan.
Anastasi, A. (1986). Psychological testing (5th ed.) NY:
Macmillan.
Ansseau, M., Fischler, B., Dierick, M., Albert, A., Leyman, S.,
& Mignon, A. (2008). Socioeconomic correlates of
generalized anxiety disorder and major depression in
primary care: The GADIS II Study (Generalized Anxiety and
Depression Impact Survey II). Depression and Anxiety,
25(6), 506-513.
Ashton, M., Jackson, D., Helmes, E. & Sampo. V. (1998). Joint
Factor Analysis of the Personality Research Form and the
Jackson Personality Inventory: Comparisons with the Big
Five. Journal of Research in Personality, 32(2), 243-250.
Baer, R. A., & Wetter, M. W. (1997). Effects of information
about validity scales on underreporting of symptoms on the
Personality Assessment Inventory. Journal of Personality
Assessment, 68(2), 402-413.
Beck, A.T., Rush, A.J., Shaw, B.F., & Emery, G. (1979).
Cognitive Therapy of Depression. New York, NY: The Guilford
Press.

90!
Belle, D. (1990). Poverty and women's mental health. American
Psychologist, 45(3), 385-389.
Ben-Porath, Y. (1997). Use of Personality Assessment Instruments
in Empirically Guided Treatment Planning. Psychological
Assessment, 9(4), 361-367.
Boccaccini, M. T., & Brodsky, S. L. (1999). Diagnostic test
usage by forensic psychologists in emotional injury cases.
Professional Psychology: Research and Practice, 30, 253-259.
Boydell, J., van Os, J., McKenzie, K., & Murray, R.M. (2004).
The association of inequality with the incidence of
schizophrenia: An ecological study. Social Psychiatry and
Psychiatric Epidemiology, 39(8), 597-599.
Brown, G., Bhrolchain, M., & Harris, T. (1975). Social class and
psychiatric disturbance among women in an urban population.
Sociology, 9, 225-254.
Butcher, J.N. (2002). How to use computer based reports. In J.N.
Butcher (ed.). Clinical Personality Assessment. (2nd ed.,
pp. 109-125). New York: Oxford University Press.
Butcher, J. N. (1997). Assessment and treatment in the era of
managedcare. In J. N. Butcher (Ed.), Objective
psychological assessment in managed health care: A
practitioner's guide. (pp. 3-12) New York: Oxford
University Press.
Butcher, J., Dahlstrom, W. Graham, J. Tellegan, A., Kraemmer, B.
(1989). MMPI-2 : Manual for Administration and Scoring.
Minneapolis: Minnesota University Press.
Cattell, R. B. (1949). Test of "g": Culture fair. Savoy, IL:
Institute for Personality and Ability Testing.
Cattell, R.B. (1946). The description and measurement of
personality. New York: World Book.
Cattell, R.B., Cattell, A.K., & Cattell, H.E.P. (1993). 16PF
Fifth Edition Questionnaire. Champaign, IL: Institute for
Personality and Ability Testing.
Cohen, L., Manion, L., & Morrison K. (2000). Research Methods
in Education. London, England: RoutledgeFalmer.

91!
Collins, F. L., & Thompson, J. K. (1993). The integration of
empirically derived personality assessment data into a
behavioral conceptualization and treatment plan: Rationale,
guidelines, and caveats. Behavior Modification, 17, 58-71.
Costa, P. P. Jr. & R. R. Macrae. (1992). Revised NEO Personality
Inventory (NEO PI-R) and NEO Five Factor Inventory (NEO-
FFI) Professional Manual. Odessa, FL: Psychological
Assessment Resources.
Creswell, J.W. (2009). Research design: Qualitative,
quantitative, and mixed methods approaches. Thousand Oaks,
CA: Sage Publications.
Cross, W.E., Jr. (1995). The psychology of nigrescence: Revising
the Cross model. In J.G. Ponterrotto, J.M. Casas, L.A.
Suzuki, & C.M. Alexander (Eds.), Handbook of Multicultural
counseling (2nd ed., 371-393). Thousand Oaks, CA: Sage.
D'Andrea, M., & Heckman, E. F. (2008). Contributing to the
ongoing evolution of the multicultural counseling movement:
An introduction to the special issue. Journal of Counseling
& Development, 86(3), 259-268.
Dana, R.H. (2002). Mental Health Services for African
Americans: A Cultural/Racial Perspective. Cultural
Diversity and Ethnic Minority Psychology, 8(1), 3-18.
Dawes, R., Faust, D., & Meehl, P. E. (1989). Clinical versus
actuarial judgment. Science, 243, 1668-1674.
Deisinger, J. A., Cassisi, J. E., & Whitaker, S. L. (2003).
Relationships between Coping Style and PAI Profiles in a
Community Sample. Journal of Clinical Psychology, 59(12),
1315-1323.
Delgado-Romero, E.A., Galvan, N., Maschino, P., & Rowland, M.
(2005). Race and ethnicity in empirical counseling and
counseling psychology research: A 10-year review. The
Counseling Psychologist, 33(4), 419-448.
Dohrenwend, B. P., Levav, I., Shrout, P. E., & Schwartz, S.
(1992). Socioeconomic status and psychiatric disorders: The
causation-selection issue. Science, 255(5047), 946-952.

92!
DuBois, P. H. (1966). Test dominated society: China 1155 BC-1905
AD. In A. Anastasi (Ed.), Testing problems in perspective
(pp. 29-36). Washington, DC: American Council on Education.
Faris, R. & Dunham, H. (1939). Mental Disorders in Urban Areas.
Chicago: University of Chicago Press.
Finn, S. E. (1996). Manual for using the MMPI-2 as a therapeutic
intervention. Minneapolis: University of Minnesota Press.
Fouad, N.A., Roysircar, G., Toporek, R., & Gerstein, L. (2005).
Handbook for Social Justice in Counseling Psychology:
Leadership, Vision, and Action. Thousand Oaks, CA: Sage
Publications.
Fox, J. W. (1990). Social class, mental illness, and social
mobility: The social selection-drift hypothesis for serious
mental illness. Journal of Health and Social Behavior,
31(4), 344-353.
Franklin-Jackson, D., & Carter, R.T. (2007). The relationships
between race-related stress, racial identity, and mental
health for Black Americans. Journal of Black Psychology,
33(1), 5-26.
Frauenhoffer, D., Ross, M. J. Gfeller. I., Searight, H. R., &
Piotrowski, C. (1998). Psychological test use among licensed
mental health practitioners: a multidisciplinary survey.
Journal of Psychological Practice, 4(1), 28-33.
Goodenough, W. H. (1971). Culture, language, and society.
Reading, MA: Addison-Wesley.
Gough, H.G., & Bradley, P. (1996). Manual for the California
Psychological Inventory, Third Edition. Palo Alto, CA:
Consulting Psychologists Press
Griffith, L. F. (1998). Surveying no-frills mental health care:
The future of psychological assessment. Journal of
Practical Psychiatry and Behavioral Health!"!!3, 255–258.
Grove, W. M., & Meehl, P. E. (1996). Comparative efficiency of
informal (subjective, impressionistic) and formal
(mechanical, algorithmic) prediction procedures: The
clinical-statistical controversy. Psychology,Public Policy,
and Law, 2, 293-323.

93!
Groves, J. A., & Engel, R. R. (2007). The German adaptation and
standardization of the Personality Assessment Inventory
(PAI). Journal of Personality Assessment, 88, 49-57.
Hall, G. C. N. (2001). Psychotherapy research with ethnic
minorities: Empirical, ethical, and conceptual issues.
Journal of Consulting and Clinical Psychology, 69, 502–
510.
Hartshorne, H. & May, M.A. (1928). Studies in the nature of
character, Vol. 1 Studies is deceit, New York: Macmillian
Hartshorne, H. & May, M.A., Maller, M. (1929). Studies in the
nature of character, Vol. 2 Studies in service and self
control, New York: Macmillian
Hartshorne, H. & May, M.A. (1930) Studies in the nature of
character, Vol. 3, studies in the organization of
character, New York: Macmillian
Hathaway, S. R., & McKinley, J. C. (1940). The MMPI manual. New
York: Psychological Corporation.
Helfritz, L. E., & Stanford, M. S. (2006). Personality and
psychopathology in an impulsive aggressive college sample.
Aggressive Behavior, 32(1), 28-37.
Helms, Janet E. (2003). A pragmatic view of social justice.
Counseling Psychologist, 31(3), 305-313.
Hildreth, P. M., & Kimble, C. (2004). Knowledge networks :
innovation through communities of practice. Hershey, PA:
Idea Group Pub.
Holden, R. R., & Jackson, D. N. (1979). Item subtlety and face
validity in personality assessment. Journal of Consulting
and Clinical Psychology, 47(3), 459-468.
Hollingshead, A.B. & Redlich, F.C. (1958). Social Class and
Mental Illness. Hoboken, NJ: John Wiley & Sons, Inc.
Hopwood, C., Ambwani, S., & Morey, L. (2007). Predicting
nonmutual therapy termination with the Personality
Assessment Inventory. Psychotherapy Research, 17(6), 706-
712.

94!
Hopwood, C.J., Creech, S.K., Clark, T.S., Meagher, M.W., &
Morey, L.C. (2008). Predicting the completion of an
integrative and intensive outpatient chronic pain treatment
with the Personality Assessment Inventory. Journal of
Personality Assessment, 90(1), 76-80.
Hopwood, C.J., Morey, L.C., Rogers, R., & Sewell, K. (2007).
Malingering on the Personality Assessment Inventory:
Identification of specific feigned disorders. Journal of
Personality Assessment, 88, 43-48.
Hoyle, R.H. (1995). The structural equation modeling approach:
Basic concepts and fundamental issues. In R. H. Hoyle
(Ed.), Structural equation modeling: Concepts, issues, and
applications. (pp. 1-15). Thousand Oaks, CA: Sage.
Hu, L. & Bentler, P.M. (1999). Cutoff criteria for fit indexes
in covariance structure analysis: Conventional criteria
versus new alternatives. Structural Equation Modeling.
6(1), 1-55.
Hudson, C.G. (2005). “Socioeconomic status and mental illness:
Tests of the social causation and selection hypotheses”.
American Journal of Orthopsychiatry, 75 (1), pp. 3-18.
Hudson, C.G. (1988). Socioeconomic status and mental
illness: Implications of the research for policy and
practice. Journal of Sociology and Social Welfare, 15(1),
27–54.
Jackson, D. N. (1973). Structured personality assessment. In B.
B. Wolman (Ed.), Handbook of general psychology (pp. 775-
792). Englewood Cliffs, NJ: Prentice-Hall.
Jackson, D. N. (1970) A sequential system for personality scale
development. Current Topics in Clinical and Community
Psychology, 2. 61-96.
Kantor, J. R. (1933). Psychological personality A survey of the
science of psychology. (pp. 116-135). Bloomington, IN US:
Principia Press.
Karlin, B. E., Creech, S. K., Grimes, J. S., Clark, T. S.,
Meagher, M. W., & Morey, L. C. (2005). The personality
assessment inventory with chronic pain patients:
Psychometric properties and clinical utility. Journal of
Clinical Psychology, 61(12), 1571-1585.

95!
Kessler, R.C. (1997). The Effects of Stressful Life Events on
Depression. Annual Review of Psychology, 2(48), 191-214.
Kessler, R.C., McGonagle, K.A., Zhao, S., Nelson, C.B., Hughes,
M., Eshleman, S., Wittchen, H., & Kendler, K.S. (1994).
Lifetime and 12-Month Prevalence of DSM-III-R Psychiatric
Disorders in the United States. Archives of General
Psychiatry, 51(8), 8-19.
Klare, G.P. "Readibility." In Handbook of Reading Research, ed.
P.D. Pearson. White Plains, NY: Longman, 1984.
Kurtz, J. E., & Blais, M. A. (2007). Introduction to the special
issue on the Personality Assessment Inventory. Journal of
Personality Assessment, 88(1), 1-4.
Kwan, K.L.K. (1999). MMPI and MMPI-2 performance of the
Chinese cross-cultural applicability. Professional
Psychology: Research and Practice, 30, 260–268.
Lally, S. J. (2003). What tests are acceptable for use in
forensic evaluations? A survey of experts. Professional
Psychology: Research and Practice, 34(5), 491-498.
Loevinger, J. (1957). Objective tests as instruments of
psychological theory. Psychological Reports, 3, 635-694.
Lubin, B., Larsen, R. M. & Matarazzo, J. (1984). Patterns of
psychological test usage in the United States 1935—1982.
American Psychologist, 39, 451-454.
Makosky, V. P. 1982. "Sources of Stress." In Lives in Stress,
edited by D. Belle, pp. 35-53. Beverly Hills, CA: Sage
Publications.
Maurish, M. E. (1994). The use of psychological testing for
treatment planning and outcome assessment. Hillsdale, NJ:
Erlbaum.
McDevitt-Murphy, M. E., Weathers, F. W., Adkins, J. W., &
Daniels, J. B. (2005). Use of the Personality Assessment
Inventory in Assessment of Posttraumatic Stress Disorder in
Women. Journal of Psychopathology and Behavioral
Assessment, 27(2), 57-65.

96!
McFadden, S.J and Dashiell, J.F. (1922). Racial Differences as
measured by the Downey Well-Temperment Individual Test.
Journal of Applied Psychology, 7, 30-53.
Miech, R.A., Caspi, T.E., Wright, B.R., & Silva, P.A. (1999).
Low Socioeconomic Status and Mental Disorders: A
Longitudinal Study of Selection and Causation during Young
Adulthood. American Journal of Sociology, 104(4), 1096-
1131.
Millon, X, & Davis, D. (1995). Putting humpty dumpty together
again: Using the MCMI in psychological assessment. In L. E.
Beutler & M. R. Barren (Eds.), Integrative assessment of
adult personality (pp. 240-279). New York: Guilford Press.
Moore, D. S., & McCabe, G. P. (2006). Introduction to the
practice of statistics. New York, NY: W.H. Freeman.
Moreland, K. L., Fowler, R. D., & Honaker, L. M. (1994). Future
directions in the use of psychological assessment for
treatment planning and outcome assessment: Predictions and
recommendations. In M. E. Maruish (Ed.), The use of
psychological testing for treatment planning and outcome
assessment (pp. 581 -602). Hillsdale, NJ: Erlbaum.
Morey, L. C. (1991). The Personality Assessment Inventory
professional manual. Odessa, FL: Psychological Assessment
Resources.
Morey, L. C. (1996). An interpretative guide to the Personality
Assessment Inventory (PAI). Odessa, FL: Psychological
Assessment Resources.
Morey, L. C. (2003). Essentials of PAI assessment. Hoboken, NJ
US: John Wiley & Sons Inc.
Morey, L. C., & Glutting, J. H. (1994). The Personality
Assessment Inventory and the measurement of normal and
abnormal personality constructs. In S. Strack & M. Lorr
(Eds.), Differentiating normal and abnormal personality
(pp. 402-424). New York: Springer.
Morey, L. C., Hopwood, C. J., & Strack, S. (2006). The
Personality Assessment Inventory and the Measurement of
Normal and Abnormal Personality Constructs Differentiating
normal and abnormal personality (2nd ed.). (pp. 451-471).
New York, NY US: Springer Publishing Co.

97!
Morey, L. C., Quigley, B. D., Sanislow, C. A., Skodol, A. E.,
McGlashan, T. H., Shea, M. T., et al. (2002). Substance or
style? An investigation of the NEO-PI-R Validity scales.
Journal of Personality Assessment, 79, 583-599.
Morey, L. C., Warner, M. B., Hopwood, C. J., & Goldstein, A. M.
(2007). The Personality Assessment Inventory: Issues in
Legal and Forensic Settings Forensic psychology: Emerging
topics and expanding roles. (pp. 97-126). Hoboken, NJ US:
John Wiley & Sons Inc.
Myers, H.F., Lesser, I., Rodriguez, N., Mira, C.B., Hwang, W. ,
Anderson, C.C.D., Erickson, L., & Wohl, M. (2002). Ethnic
Differences in Clinical Presentation of Depression in Adult
Women. Cultural Diversity and Ethnic Minority Psychology.
8(2), 138-156.
Norcross, J. C., & Goldfried, M.R. (Eds.). (1992), Handbook of
psychotherapy integration. New York: Basic Books.
Piotrowski, C. (2000). How popular is the Personality Assessment
Inventory in practice and training? Psychological Reports,
86, 65-66.
Piotrowski C., Belter R. W. (1999). Internship training in
psychological assessment: has managed care had an impact?
Assessment, 6(4):381-90.
Pike, K. L. 1967. "Etic and emic standpoints for the description
of behavior." ! In Donald C. Hildum (ed.), Language and
thought: an enduring problem in psychology, 32-39.
Princeton, NJ: D. Van Norstrand Company.
Ponterotto, J. G., Casas, J. M., Suzuki, L. A., & Alexander, C.
M. (2001). Handbook of multicultural counseling (2nd ed.).
Thousand Oaks, CA US: Sage Publications, Inc.
Reid, P. T. (2002). Multicultural psychology: Bringing together
gender and ethnicity. Cultural Diversity and Ethnic Minority
Psychology, 8, 103–114.
Riggs, M. M. (1950). Review of Personality development and
assessment. The Journal of Abnormal and Social Psychology,
45(4), 788-790.
Robins, L. N., Regier, D. N. (Eds.). (1991), Psychiatric

98!
Disorders in America: The Epidemiologic Catchment Area Study,
New York, NY: The Free Press.
Rogler, L. H. (1999). Methodological sources of cultural
insensitivity in mental health research. American
Psychologist, 54, 424–433.
Rouse, S., Taylor, J., & Sullivan, J. (1997). Treatment-oriented
MMPI/MMPI-2 studies. In J. N. Butcher (Ed.), Objective
psychological assessment in managed health care: A
practitioner's guide (pp. 201-246). New York: Oxford
University Press.
Samler, J. (1964).Where do counseling psychologists work? What
do they do? What should they do? In A.S. Thompson & D.E.
Super (Eds.), The professional preparation of counseling
psychologists (pp. 43-68). New York: Teachers College Press.
Schinka, J., & LaLone, L. (1997). MMPI-2 norms: Comparisons with
a census matched subsample. Psychological Assessment, 9, 307-
311.
Schlossberg, N.K. and Pietrofesa, J.J. (1973). Perspectives on
counseling bias: Implications for counselor education. The
Counseling Psychologist, 4(1), 44-54.
Schott, L. and Levinson, Z. (2008). TANF Benefits are Low and
Have Not Kept Pace With Inflation. Washington, DC: Center on
Budget and Policy Priorities, http://www.cbpp.org/11-24-
08tanf.pdf (accessed March 3, 2009).
Simmons, L., Braun, B., Charnigo, R., Havens, J., & Wright, D.
(2008). Depression and poverty among rural women: A
relationship of social causation or social selection? The
Journal of Rural Health. 24(3), 292-298.
Smith, G. T. (2005). On Construct Validity: Issues of Method and
Measurement. Psychological Assessment. 17(4), 396-408.
Srole, L., Langner, T. S., Michael, S. T., Kirkpatrick, P.,
Opler, M., & Rennie, T.A.C. (1977). Mental health in the
metropolis: The Midtown Manhattan Study. New York: Harper &
Row.
Stein, M.B., Pinker-Aspen, J. H., & Hilsenroth, M.J. (2007).
Borderline pathology and the Personality Assessment

99!
Inventory (PAI): An evaluation of criterion and concurrent
validity. Journal of Personality Assessment, 88, 100-106.
Sue, D. W., Carter, R. T., Casas, J. M., Fouad, N. A., Ivey, A.
E., Jensen, M., et al. (1998). Multicultural counseling
competencies: Individual and organizational development.
Thousand Oaks, CA: Sage.
Sue, D. W., & Sue, D. (1999). Counseling the culturally
different: Theory and practice (3rd ed.). New York: Wiley.
Stukenberg, K., Brady, C., & Klinetob, N. (2000). Psychiatric
Inpatients and the MMPI-2: Providing Benchmarks. Journal of
Clinical Psychology, 56(6), 747-756.
Super, Donald E. Opportunities in psychology. New
York: Vocational Guidance Manuals, 1955. Pp. 96.
Suzuki, L. A., & Ponterotto, J. G. (Eds.). (2008). Handbook of
multicultural assessment: Clinical, psychological, and
educational applications (3rd ed.). San Franciso: Jossey-
Bass.
Swanson, J.L. & Fouad, N.A. (2009). Career Theory and Practice:
Learning through case studies second edition. Thousand
Oaks, CA: Sage Publications
Tillet, R., (1996). Therapy: The Science and Practice of Working
with Families. Psychotherapy Assessment and Treatment
Selection. British Journal of Psychiatry, 168, 10–15.
Todd, W. R. (2005). Race/ethnicity and the Personality
Assessment Inventory (PAI): The impact of culture on
diagnostic testing in a college counseling center.
Dissertation Abstracts International: Section B: The
Sciences and Engineering, 65(10-B), 2005. pp. 5425.
Trachtman, J. P. (1971). Socio-economic class bias in rorschach
diagnosis: Contributing psychosocial attributes of the
clinician. Journal of Personality Assessment, 35(3), 229-
240.

100!
U.S. Bureau of the Census (2003). Poverty in the United States:
2002. Current Population Reports, Series pp. 60–222.
Washington, DC: U.S. Government Printing Office.
Warheit, G.J., Holzer, C.E., & Arey, S.A. (1975). Race and
mental illness: An epidemiological update. Journal of
Health and Social Behavior, 16(3), 243-256.
Williams, D.R., Yu, Y., Jackson, J.S., & Anderson, N.B. (1997).
Racial Differences in Physical and Mental Health. Journal
of Health Psychology. 2(3), 335-351.
Williams, R. L. (1971). Abuses and misuses in testing Black
children. The Counseling Psychologist, 2, 62-73.
Yin, R.K. (2003). Grounded theory research: design and methods.
Thousand Oaks, CA: Sage Publications, Inc.
!

101!
Appendix 1
PAI Scale T-scores of total Low-SES sample and Census-matched
Sample (Morey, 1991)
!
*Census-matched sample (Morey, 1991)
!