the philippines in the global trading environment: looking
TRANSCRIPT
25
For comments, suggestions or further inquiries please contact:
Philippine Institute for Development StudiesSurian sa mga Pag-aaral Pangkaunlaran ng Pilipinas
The PIDS Discussion Paper Seriesconstitutes studies that are preliminary andsubject to further revisions. They are be-ing circulated in a limited number of cop-ies only for purposes of soliciting com-ments and suggestions for further refine-ments. The studies under the Series areunedited and unreviewed.
The views and opinions expressedare those of the author(s) and do not neces-sarily reflect those of the Institute.
Not for quotation without permissionfrom the author(s) and the Institute.
Service through policy research
1977197719771977197720022002200220022002
November 2002
The Research Information Staff, Philippine Institute for Development Studies3rd Floor, NEDA sa Makati Building, 106 Amorsolo Street, Legaspi Village, Makati City, PhilippinesTel Nos: 8924059 and 8935705; Fax No: 8939589; E-mail: [email protected]
Or visit our website at http://www.pids.gov.ph
DISCUSSION PAPER SERIES NO. 2002-15
The Philippines in the GlobalTrading Environment:
Looking Back and the Road Ahead
Myrna S. Austria

i
THE PHILIPPINES IN THE GLOBAL TRADING ENVIRONMENT Looking Back and the Road Ahead
Abstract The government has implemented substantial trade and investment policy reforms during the last two decades following a three-track approach involving unilateral, regional and multilateral modalities towards freer trade and investment. The reforms resulted to improvements in domestic resource allocation, increased productivity, increased competitiveness of manufacturing industries, expansion of exports and the increased integration of the country in the global market. Yet the growth of the industry sector, particularly manufacturing, has not been as robust as many had expected, leading some sectors to question the reforms. This requires some hard thinking but at the same time pose a great challenge to policymakers.
The experience of the country during the past two decades shows that getting the most out of international trade is not just a matter of shift away from exports of primary commodities to exports of manufactures. This paper argues that the effect of international trade on the country’s economic growth depends largely on how much of that trade is linked to the domestic economic activity. In effect, the fundamental policy issue for the government is not one of more or less trade liberalization, but how best to extract from the country’s participation in the global trading system the elements that will promote economic development, especially now that the global trading environment is becoming much more complex than what it was two decades ago. This paper addresses this issue, including the opportunities as well as the challenges that lie ahead for the country under the emerging more complex global trading environment.
Keywords: trade and investment, globalization, international trade, industrial policy, regional trading arrangements, economic integration, market positioning, regional cooperation, regionalism

ii
Table of Contents
Page
Abstract i Table of Contents ii List of Tables iii List of Figures v List of Appendices vi List of Boxes vii 1. Introduction
1
2. Philippine Industrial Policy Environment, 1977-2001
2
3. Impact of Policy Reforms
10
4. The Emerging Global Trade Policy Environment
25
5. The Road Ahead: Challenges and Opportunities for the Philippines
36
6. Summary and Conclusions
41
References 42
iii
List of Tables Table Title Page 1 Frequency distribution of tariff rates, 1980-2004 3 2 Average nominal tariff rate, 1975-2004 (%) 4 3 Regulated commodities, 1991 and 1996 4 4 MFN and preferential tariff rates, Philippines, 1993-2001 7 5 Scope of binding, WTO and AFTA, 1996-2001 (%) 8 6 Scope and level of tariff bindings in the WTO, by product group, 8
Philippines 7 Average effective protection rates, 1985-2004 (%) 12 8 Resource allocation and efficiency, 1983, 1988 and 1994 12 9 Percentage distribution and growth rate of merchandise exports, 14 1975-80, 1980-90 and 1990-2000 10 Revealed comparative advantage based on factor intensity, 15 Philippines, 1975,1980,1985,1990, 1995 and 1998. 11 Manufactured products which the Philippines has comparative 15 advantage, 1980-1999 (based on estimates of RCA) 12 Market positioning of manufactured exports, ASEAN, 1991- 16 1999 (%) 13 Market positioning of manufactured exports, Philippines, 17 1991-1999 14 TFP growth rate, by industrial regime 18 15 Share of Philippines in intra-ASEAN and intra-APEC trade (%) 20 16 Intra-industry trade index for manufactures, Philippines with 21 ASEAN and APEC, 1990, 1995 and 1999 17 Distribution of GDP, by sector, 1975-2000 (%) 22 18 Distribution of value-added, manufacturing, 1975-2000 (%) 24
iv
19 Bilateral and regional trading arrangements in East Asia 29 20 Import-weighted MFN average tariffs of selected developed economies, 31 by product group (%) 21 Bound tariffs on industrial products by stage of processing, selected 32 developed economies 22 Initiation of anti-dumping investigations by level of development of 33 reporting and affected economies, 1995-1999 23 Initiation of anti-dumping investigations, Philippines, 1993-1999 33 24 Non-tariff barriers to Philippine exports of manufactures 33
v
List of Figures Figure Title Page 1 Ratio of international transactions to GDP, 1975-2001 13 2 Composition of exports, 1975-2000 (%) 14 3 Philippine trade with ASEAN and APEC, 1991-1999 19 4 Annual growth rate of GDP, by sector, 1975-2000 (1985 prices) 22 5 Manufactured exports and imports and manufacturing value- 23 added, Philippines, Malaysia and Thailand, 1975-1998 6 Ratio of exports in manufactures and value-added in manufacturing 25 to GDP, Philippines, Malaysia and Thailand, 1975-1998 (%) 7 Garments imports of US and Canada from the Philippines and Mexico, 30 1991-1999 8 Distribution of Philippine exports, by destination (1985-1999) 36 9 How to respond to RTAs? 40

vi
List of Boxes
Box Title Page 1 Market positioning classification 16 2 The evolution of economic integration 28
vii
List of Appendices
Appendix Title 1 Scope of bindings, average bound and applied rates, industrial products, Selected WTO members 2 Revealed comparative advantage of manufactured exports, Philippines, 1977-
1999 3 World market shares, major manufactured exports, Philippines, 1991 and 1999
(%) 4 Share of Philippines in China’s imports of SITC Codes 751-778, 1995-1999
(%) 5 Intra-industry trade index by commodity, by partner countries, Philippines,
1990, 1995, and 1999 (%) 6 Import-weighted MFN average tariffs of selected developing economies, by
product group (%) 7 Bound tariffs on industrial products by stage of processing, selected developing
economies

1
The Philippines in the Global Trading Environment: Looking Back and the Road Ahead*
Myrna S. Austria** 1. Introduction
The government has implemented substantial trade and investment policy reforms geared towards opening up the economy during the past two decades. It has also pursued an outward-oriented industrialization strategy by promoting exports in the world market. Economic theory says that liberalization stimulates economic activity, fosters competition, promotes efficiency through better allocation of resources, and increases productivity. More economic activity means more jobs and increase in income. Increase in efficiency and productivity means lower costs of production that translates to lower prices.
The reforms have succeeded in delivering some of the promised benefits. However, they have not produced a significant change in industrial growth. In particular, the growth of the manufacturing sector has not been as robust as many has expected. The contribution of the sector to the country’s gross domestic product hardly changed at 25 percent for the periods 1980-1990 and 1990-2000. This is a big contrast to the experience of other developing economies where industrial reforms resulted to the expansion of the manufacturing sector. Such a sluggish performance for the country, despite the reforms, has indeed become a question and a puzzle to many. This requires some hard thinking but at the same time pose a great challenge to policymakers.
Opening up the economy has not been without costs nor has it been painless.
Industries that have not been able to adjust to the new environment have been marginalized. But this is not surprising as there will always be losers and gainers in the process of global integration. Getting out of the system, as those who have questioned the wisdom of the policy reforms have suggested, is not the solution either. The challenge now for the government is how best to extract from the country’s participation in the global trading system the elements that will promote economic development, especially now that the global trading environment is becoming much more complex than what it was two decades ago.
The objectives of this paper are as follows: (i) to review the industrial policy
environment during the past twenty-five years; (ii) to analyze the impacts of the policy reforms on the economy; (iii) to analyze the emerging global trading environment; and (iv) to identify the challenges as well as the opportunities that lie ahead for the country under the emerging global trading environment.
* Paper presented during the Perspective Paper Symposium Series on Competition Policy, Trade and Regional Cooperation held 10 September 2002. The scope of the paper is limited only to trade in industrial goods. Trade in agriculture is dealt with in a separate paper in this series of forum. ** Senior Research Fellow, Philippine Institute for Development Studies and at the same time Director, Philippine APEC Study Center Network (PASCN) Secretariat. The author would like to acknowledge the excellent research assistance provided by Dorothea Lazaro and Michael Diza.

2
The paper is organized as follows. Section 2 reviews the industrial policy environment during the past twenty-five years. This is followed by an analysis of the impacts of the policy reforms in Section 3. Section 4 discusses the emerging global trading environment, focusing in particular on the major issues confronting developing countries, like the Philippines, that could affect their trade policy framework in this new millennium. Section 5 identifies the challenges as well as the opportunities for the country under the much more complex emerging global trading environment. Section 6 presents the summary and conclusions. 2. Philippine Industrial Policy Environment, 1977-2001 Industrialization has always been a major development goal for the Philippines since its independence. This goal was carried out through trade and investment policies. The country has in fact undergone several trade and investment policy regimes in its pursuit of industrialization. In the 1950s up to the 1970s, trade and investment policies have been highly restrictive and protectionist in support of the country’s inward-looking import-substitution industrialization strategy. High tariffs and import controls were the main policy instruments to protect domestic industries from foreign competition. At the same time, the exchange rate was highly overvalued. Investment incentives, on the other hand, came in the form of tax exemptions, tax credits and tax deductions. The pattern of protection was highly uneven with high protection for finishing/assembly operation and low protection for raw materials, intermediate goods and capital goods production. This adversely affected the efficient allocation of resources by creating bias in favor of import-competing manufacturing industries over exports and agriculture, and consumer goods over capital and intermediate goods. The end result was an imperfectly competitive industry structure characterized by unrealized scale economies and poor economic performance. Unable to keep pace with the fast growing economies in the region, there were mounting pressures, both from internal and external sources, for the country to undergo industrial restructuring. This prompted the government to undertake major reforms beginning in the 1980s, signaling a major paradigm shift toward greater openness and outward-oriented industrialization strategy. Trade and investment policies have since been made gradually liberal and open. This was carried out in various stages involving unilateral, regional and multilateral liberalization. Unilateral Liberalization
Trade liberalization. Since 1981, the country has been implementing a
progressive reduction in tariffs through the Tariff Reform Program (TRP) to reduce the overall level of protection and the dispersion of tariff protection within and across sectors and industries. The reform was aimed at improving the efficiency in the allocation of resources, attaining global competitiveness and sustaining economic growth. As Medalla (2002:140) puts it,
“By ridding the market distortions, trade liberalization would espouse greater reliance on the market, foster competition, and provide an even playing field which would encourage the development of industries with real comparative advantage”.
3
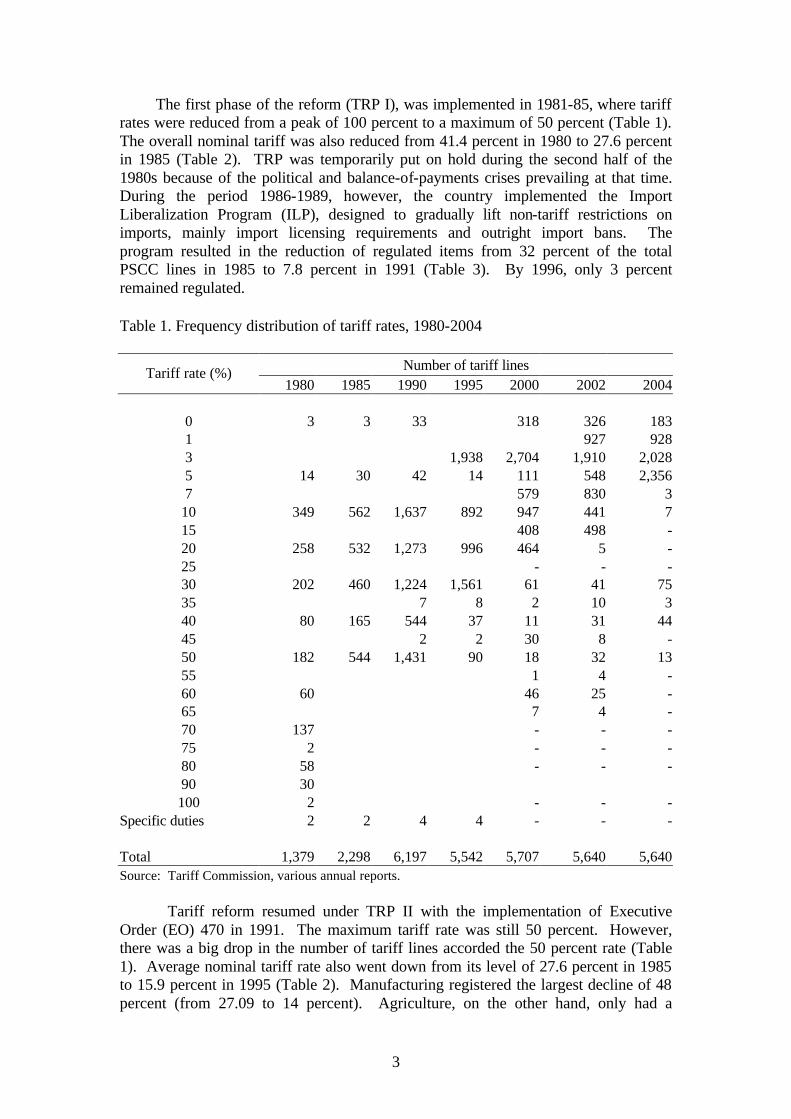
The first phase of the reform (TRP I), was implemented in 1981-85, where tariff rates were reduced from a peak of 100 percent to a maximum of 50 percent (Table 1). The overall nominal tariff was also reduced from 41.4 percent in 1980 to 27.6 percent in 1985 (Table 2). TRP was temporarily put on hold during the second half of the 1980s because of the political and balance-of-payments crises prevailing at that time. During the period 1986-1989, however, the country implemented the Import Liberalization Program (ILP), designed to gradually lift non-tariff restrictions on imports, mainly import licensing requirements and outright import bans. The program resulted in the reduction of regulated items from 32 percent of the total PSCC lines in 1985 to 7.8 percent in 1991 (Table 3). By 1996, only 3 percent remained regulated. Table 1. Frequency distribution of tariff rates, 1980-2004
Number of tariff lines Tariff rate (%) 1980 1985 1990 1995 2000 2002 2004
0 3 3 33 318 326 183 1 927 928 3 1,938 2,704 1,910 2,028 5 14 30 42 14 111 548 2,356 7 579 830 3
10 349 562 1,637 892 947 441 7 15 408 498 - 20 258 532 1,273 996 464 5 - 25 - - - 30 202 460 1,224 1,561 61 41 75 35 7 8 2 10 3 40 80 165 544 37 11 31 44 45 2 2 30 8 - 50 182 544 1,431 90 18 32 13 55 1 4 - 60 60 46 25 - 65 7 4 - 70 137 - - - 75 2 - - - 80 58 - - - 90 30 100 2 - - -
Specific duties 2 2 4 4 - - -
Total 1,379 2,298 6,197 5,542 5,707 5,640 5,640 Source: Tariff Commission, various annual reports.
Tariff reform resumed under TRP II with the implementation of Executive Order (EO) 470 in 1991. The maximum tariff rate was still 50 percent. However, there was a big drop in the number of tariff lines accorded the 50 percent rate (Table 1). Average nominal tariff rate also went down from its level of 27.6 percent in 1985 to 15.9 percent in 1995 (Table 2). Manufacturing registered the largest decline of 48 percent (from 27.09 to 14 percent). Agriculture, on the other hand, only had a
4
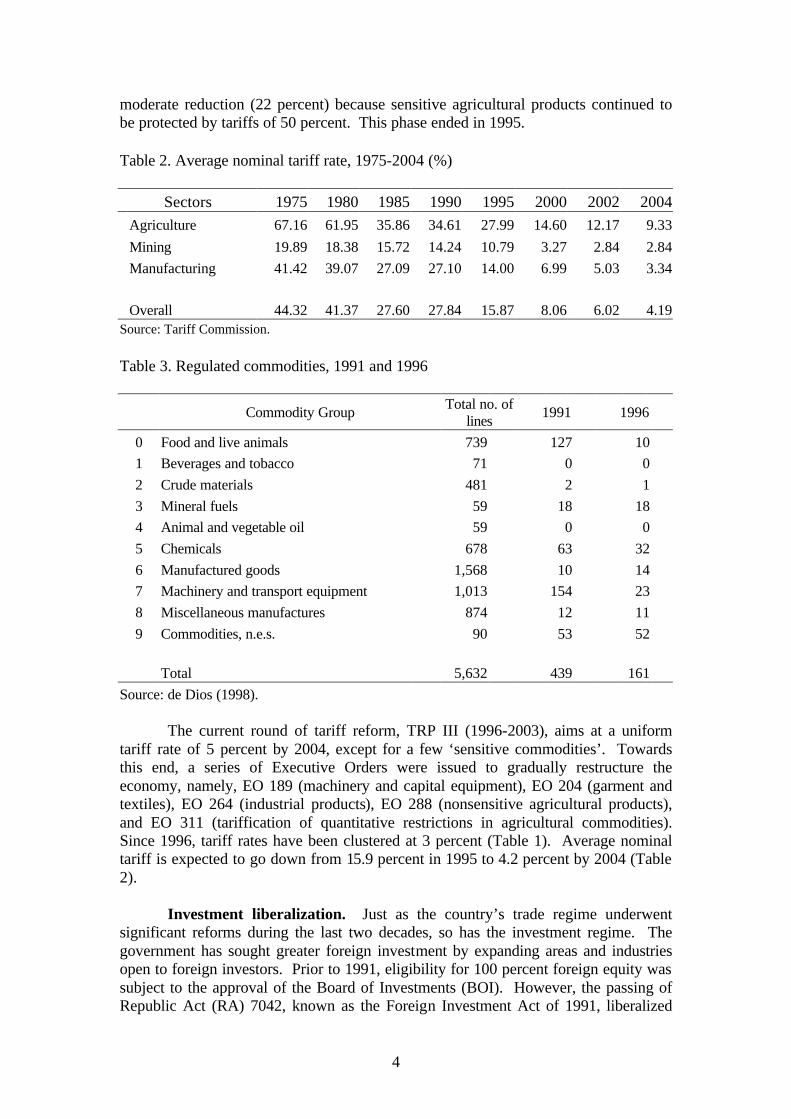
moderate reduction (22 percent) because sensitive agricultural products continued to be protected by tariffs of 50 percent. This phase ended in 1995. Table 2. Average nominal tariff rate, 1975-2004 (%)
Sectors 1975 1980 1985 1990 1995 2000 2002 2004 Agriculture 67.16 61.95 35.86 34.61 27.99 14.60 12.17 9.33
Mining 19.89 18.38 15.72 14.24 10.79 3.27 2.84 2.84
Manufacturing 41.42 39.07 27.09 27.10 14.00 6.99 5.03 3.34 Overall 44.32 41.37 27.60 27.84 15.87 8.06 6.02 4.19 Source: Tariff Commission. Table 3. Regulated commodities, 1991 and 1996
Commodity Group Total no. of
lines 1991 1996
0 Food and live animals 739 127 10
1 Beverages and tobacco 71 0 0
2 Crude materials 481 2 1
3 Mineral fuels 59 18 18
4 Animal and vegetable oil 59 0 0
5 Chemicals 678 63 32
6 Manufactured goods 1,568 10 14
7 Machinery and transport equipment 1,013 154 23
8 Miscellaneous manufactures 874 12 11
9 Commodities, n.e.s. 90 53 52
Total 5,632 439 161
Source: de Dios (1998).
The current round of tariff reform, TRP III (1996-2003), aims at a uniform tariff rate of 5 percent by 2004, except for a few ‘sensitive commodities’. Towards this end, a series of Executive Orders were issued to gradually restructure the economy, namely, EO 189 (machinery and capital equipment), EO 204 (garment and textiles), EO 264 (industrial products), EO 288 (nonsensitive agricultural products), and EO 311 (tariffication of quantitative restrictions in agricultural commodities). Since 1996, tariff rates have been clustered at 3 percent (Table 1). Average nominal tariff is expected to go down from 15.9 percent in 1995 to 4.2 percent by 2004 (Table 2).
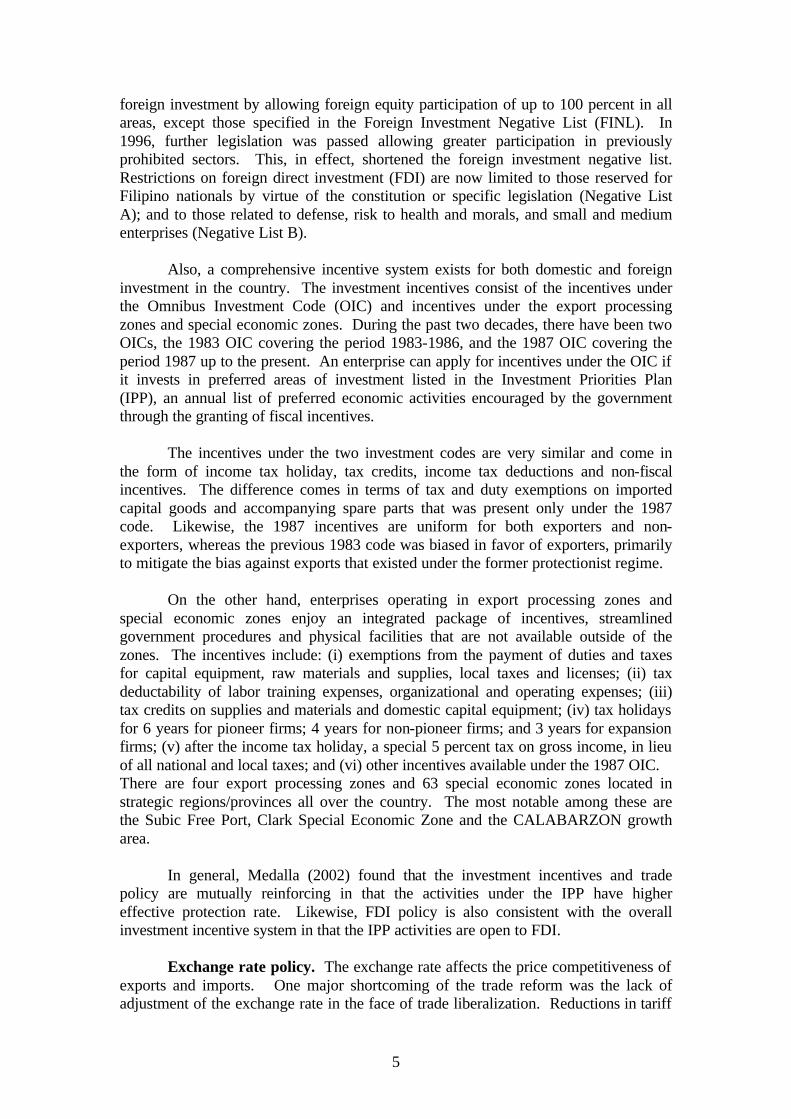
Investment liberalization. Just as the country’s trade regime underwent
significant reforms during the last two decades, so has the investment regime. The government has sought greater foreign investment by expanding areas and industries open to foreign investors. Prior to 1991, eligibility for 100 percent foreign equity was subject to the approval of the Board of Investments (BOI). However, the passing of Republic Act (RA) 7042, known as the Foreign Investment Act of 1991, liberalized
5
foreign investment by allowing foreign equity participation of up to 100 percent in all areas, except those specified in the Foreign Investment Negative List (FINL). In 1996, further legislation was passed allowing greater participation in previously prohibited sectors. This, in effect, shortened the foreign investment negative list. Restrictions on foreign direct investment (FDI) are now limited to those reserved for Filipino nationals by virtue of the constitution or specific legislation (Negative List A); and to those related to defense, risk to health and morals, and small and medium enterprises (Negative List B).
Also, a comprehensive incentive system exists for both domestic and foreign investment in the country. The investment incentives consist of the incentives under the Omnibus Investment Code (OIC) and incentives under the export processing zones and special economic zones. During the past two decades, there have been two OICs, the 1983 OIC covering the period 1983-1986, and the 1987 OIC covering the period 1987 up to the present. An enterprise can apply for incentives under the OIC if it invests in preferred areas of investment listed in the Investment Priorities Plan (IPP), an annual list of preferred economic activities encouraged by the government through the granting of fiscal incentives.
The incentives under the two investment codes are very similar and come in the form of income tax holiday, tax credits, income tax deductions and non-fiscal incentives. The difference comes in terms of tax and duty exemptions on imported capital goods and accompanying spare parts that was present only under the 1987 code. Likewise, the 1987 incentives are uniform for both exporters and non-exporters, whereas the previous 1983 code was biased in favor of exporters, primarily to mitigate the bias against exports that existed under the former protectionist regime. On the other hand, enterprises operating in export processing zones and special economic zones enjoy an integrated package of incentives, streamlined government procedures and physical facilities that are not available outside of the zones. The incentives include: (i) exemptions from the payment of duties and taxes for capital equipment, raw materials and supplies, local taxes and licenses; (ii) tax deductability of labor training expenses, organizational and operating expenses; (iii) tax credits on supplies and materials and domestic capital equipment; (iv) tax holidays for 6 years for pioneer firms; 4 years for non-pioneer firms; and 3 years for expansion firms; (v) after the income tax holiday, a special 5 percent tax on gross income, in lieu of all national and local taxes; and (vi) other incentives available under the 1987 OIC. There are four export processing zones and 63 special economic zones located in strategic regions/provinces all over the country. The most notable among these are the Subic Free Port, Clark Special Economic Zone and the CALABARZON growth area. In general, Medalla (2002) found that the investment incentives and trade policy are mutually reinforcing in that the activities under the IPP have higher effective protection rate. Likewise, FDI policy is also consistent with the overall investment incentive system in that the IPP activities are open to FDI.
Exchange rate policy. The exchange rate affects the price competitiveness of exports and imports. One major shortcoming of the trade reform was the lack of adjustment of the exchange rate in the face of trade liberalization. Reductions in tariff
6
protection and import restrictions have not been complemented by a consistent exchange rate policy that favors (or is neutral to) exports. The real effective exchange rate depreciated by 31.1 percent during the period 1982-1988; and this helped enhance the competitiveness of the export sector during the early phase of the reforms. However, from 1989 to 1996, the real effective exchange rate continuously appreciated because of the increase in foreign investment. The overvaluation of the currency was inconsistent with the adjustment called for by trade liberalization. It penalized exports and encouraged the growth of imports. Although the ASEAN economies all experienced an appreciation of their currency, the Philippines appreciated the most in the 1990s resulting in the loss of its competitiveness vis-à-vis its major competitors in the region (Intal 1997). The major depreciation experienced by the ASEAN economies in 1997 and 1998 was a long overdue correction of the appreciation of the Philippine peso.
The government has also lifted several restrictions on the foreign exchange.
Prior to the foreign exchange deregulation in 1992, exporters are required to remit their foreign exchange earnings through the domestic banking system and could only retain 2 percent of their receipts. After deregulation, however, exporters were no longer required to sell their foreign exchange receipts to banks and could retain them 100 percent. Moreover, foreign exchange can now be freely sold and purchased outside of the banking system, in the parallel foreign exchange market.
Regional and Multilateral Liberalization The country’s commitment to greater trade and investment liberalization and opening up the economy is further manifested in its membership in multilateral and regional trading arrangements in the 1990s, namely the World Trade Organization (WTO), the ASEAN Free Trade Area (AFTA), and the Asia Pacific Economic Cooperation (APEC). The country’s move towards regional and multilateral liberalization came as a response to the growing integration of economies around the world. It should be emphasized that the unilateral liberalization efforts that started in the 1980s made it possible for the country to enter this phase of its international trade policy. That is, by fostering domestic efficiency where resources are allocated according to the country’s comparative advantage, the unilateral liberalization policies enable the industries to prepare for global competition. This is important as economic integration presupposes that participating economies have already attained a high level of competitiveness and maturity in their production structure (Onguglo and Cernat 2000). As industries become competitive, they require bigger markets to realize economies of scale. Multilateral and regional trading arrangements then become important as they provide the country greater market access. At the same time, however, they pose greater challenge for industries to become globally competitive.
World Trade Organization (WTO). The country’s accession to the WTO
was ratified by the Senate in 1994. More than market access, the benefits to the country from its membership to the WTO come in terms of fair competition, and transparency, stability and predictability of the global trading system. Fair competition is promoted by the most-favored nation (MFN) principle, where trading partners are not allowed to discriminate between their trading partners, and national treatment principle, where domestic and foreign products, services and nationals are

7
treated equally. Transparency is promoted by requiring all members to notify the WTO of their policies and practices. Finally, predictability and stability are promoted by the binding of members of their commitments.
In terms of market access, there is really no further liberalization
accomplished under WTO since the country committed to bind tariffs at rates higher than what was accomplished under TRP (Table 4). A bound tariff refers to the tariff level that a WTO member commits not to exceed. The applied rate however is lower than TRP, because sensitive agricultural products were excluded from the WTO.
Table 4. MFN and preferential tariff rates, Philippines, 1993-2001
TRPa WTOb APECb AFTA-CEPT Year Unilateral Boundc Appliedd Appliedd Preferentiale
1993 23.50 1994 19.72 1995 15.87 1996 15.55 1997 13.43 32.50 12.11 12.11 9.07 1998 10.69 31.85 9.44 9.44 7.34 1999 9.98 30.05 9.05 9.05 6.83 2000 8.06 27.59 6.92 6.92 4.53 2001 7.71 27.53 6.70 6.70 3.87
Notes: abased on average nominal tariff rate; bbased on MFN rates; cbased on simple average bound tariff rate;d based on simple average applied tariff rate excluding sensitive agricultural products; e based on simple average applied preferential tariff rates. Source: Tariff Commission.
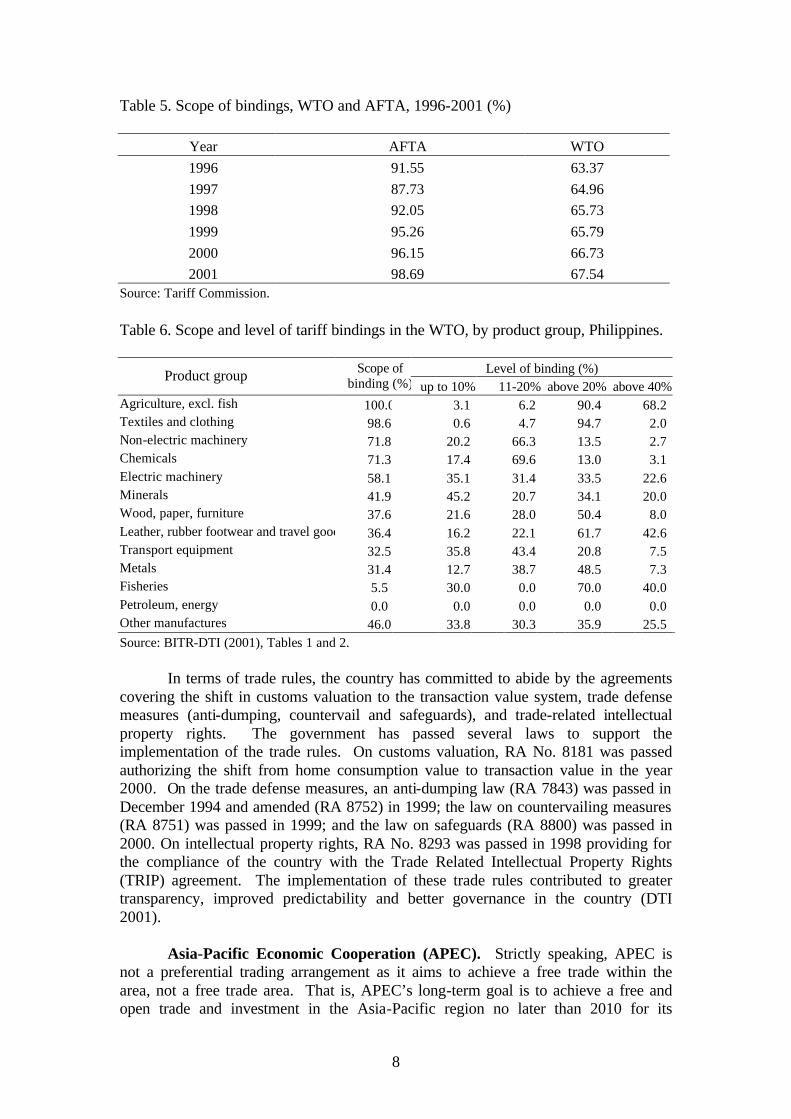
Over the years, the overall scope of bindings has gone up reaching 67.5
percent in 20011 (Table 5). Across products, the scope of bindings differs considerably (Table 6). All tariff lines under agriculture were bound. Scope of bindings for textiles and clothing, non-electrical machinery and chemicals were also relatively large but very low for fisheries. Industrial products like construction-related materials, petrochemicals, passenger automobiles and automotive parts, and pulp and paper were not committed for binding.
The level of bindings was also relatively high, with agriculture having the
highest (Table 6). The binding rate for industrial products was set at 10 percentage points above the 1995 applied rate. For information technology products, the country committed, under the WTO Information Technology Agreement (ITA), to bind tariffs at zero for 188 IT product lines by 2000 and 47 product lines by 2005.
In terms of industrial products, the country had the smallest percentage of
bound tariff lines among the ASEAN although the country’s average bound rate is well within the range of these countries (Appendix Table 1). Likewise, the country’s average applied tariff rate of 6.7 percent is not far compared with some countries in Asia, although much lower compared to some African and Latin American countries.
1 Scope of bindings refers to the percentage of tariff lines bound in the WTO.
8
Table 5. Scope of bindings, WTO and AFTA, 1996-2001 (%)
Year AFTA WTO
1996 91.55 63.37
1997 87.73 64.96
1998 92.05 65.73
1999 95.26 65.79
2000 96.15 66.73
2001 98.69 67.54 Source: Tariff Commission. Table 6. Scope and level of tariff bindings in the WTO, by product group, Philippines.
Level of binding (%) Product group Scope of binding (%) up to 10% 11-20% above 20% above 40%
Agriculture, excl. fish 100.0 3.1 6.2 90.4 68.2 Textiles and clothing 98.6 0.6 4.7 94.7 2.0 Non-electric machinery 71.8 20.2 66.3 13.5 2.7 Chemicals 71.3 17.4 69.6 13.0 3.1 Electric machinery 58.1 35.1 31.4 33.5 22.6 Minerals 41.9 45.2 20.7 34.1 20.0 Wood, paper, furniture 37.6 21.6 28.0 50.4 8.0 Leather, rubber footwear and travel goods 36.4 16.2 22.1 61.7 42.6 Transport equipment 32.5 35.8 43.4 20.8 7.5 Metals 31.4 12.7 38.7 48.5 7.3 Fisheries 5.5 30.0 0.0 70.0 40.0 Petroleum, energy 0.0 0.0 0.0 0.0 0.0 Other manufactures 46.0 33.8 30.3 35.9 25.5 Source: BITR-DTI (2001), Tables 1 and 2.
In terms of trade rules, the country has committed to abide by the agreements covering the shift in customs valuation to the transaction value system, trade defense measures (anti-dumping, countervail and safeguards), and trade-related intellectual property rights. The government has passed several laws to support the implementation of the trade rules. On customs valuation, RA No. 8181 was passed authorizing the shift from home consumption value to transaction value in the year 2000. On the trade defense measures, an anti-dumping law (RA 7843) was passed in December 1994 and amended (RA 8752) in 1999; the law on countervailing measures (RA 8751) was passed in 1999; and the law on safeguards (RA 8800) was passed in 2000. On intellectual property rights, RA No. 8293 was passed in 1998 providing for the compliance of the country with the Trade Related Intellectual Property Rights (TRIP) agreement. The implementation of these trade rules contributed to greater transparency, improved predictability and better governance in the country (DTI 2001).
Asia-Pacific Economic Cooperation (APEC). Strictly speaking, APEC is
not a preferential trading arrangement as it aims to achieve a free trade within the area, not a free trade area. That is, APEC’s long-term goal is to achieve a free and open trade and investment in the Asia-Pacific region no later than 2010 for its

9
developed member economies and 2020 for its developing member economies through a three-pillar agenda of trade and investment liberalization, trade and investment facilitation and economic and technical cooperation. Its institutional arrangement follows market initiatives as exemplified by its principle of open regionalism. In its narrow sense, open regionalism means that the region will not introduce measures that will discriminate countries and regions outside of APEC (Soesastro 2002). Hence, APEC is consistent with and supportive of the framework of the multilateral trading system under the WTO.
Open regionalism is best illustrated by APEC’s concerted unilateralism
approach to liberalization. Under the scheme, each member economy prepares its own liberalization program and implement them according to its own pace or schedule and domestic rules. However, member economies watch the implementation of each other’s liberalization program and this builds pressure for each member to implement its own program. The program is implemented through the Individual Action Plans (IAPs) and the Collective Action Plan (CAP). These mechanisms map out concrete steps and actions towards the achievement of APEC’s goal. As such, they promote transparency in the liberalization process.
On market access, the country did not commit beyond its WTO commitments
(Table 4). On investment, the country has committed to the APEC’s Non-binding Investment Principles (NBIP), which covers more investment measures compared to the narrow range of operational restrictions brought under the discipline of the WTO’s Agreement on Trade-Related Investment Measures (TRIMs)2 (Austria 2001). APEC’s Menu of Options, which the government refers to when updating its IAP, also covers more areas not included in the WTO’s General Agreement of Trade in Services (GATS) and Agreement on Trade-Related Intellectual Property Rights (TRIPs)3. APEC has made a difference in promoting investment liberalization and in facilitating the flow of investment in the country. This can be seen from the improved levels of transparency and openness of the country’s investment regimes. The country has also participated in economic and technical cooperation programs, like trainings, organized by APEC to build the government’s capacity to implement its WTO commitments.
ASEAN Free Trade Area (AFTA). The country is one of the six original
ASEAN signatories to AFTA when it was established in 1992. The objective of AFTA is to increase ASEAN’s competitive edge as a production base for the world market. The mechanism for achieving this is through the Common Effective Preferential Tariff (CEPT) scheme, where intraregional tariffs will be reduced to 0-5 percent within a 15-year time period beginning in 1993.
Over the years, however, AFTA has taken significant leaps towards its goal
(Austria and Avila 2001). First, the deadline has been continuously accelerated from
2APEC’s Non-binding Investment Principles are principles for strengthening the efficiency of investment administration, eliminating investment obstacles, and establishing a free and open investment environment in the region. They are non-binding in nature and absent of customary provisions that specify procedures with respect to exceptions and reservations. 3The Menu of Options is a list of policy measures from which member economies may voluntarily select a number of options for inclusion in their IAPs in order to advance towards creating a free and open investment regime.
10
the original date of 2008 to 2003 and finally to 2002 (with later implementation dates for its newer members: Vietnam, Burma, Laos and Cambodia). Second, the coverage of the CEPT has been widened, by including into the scheme products that were originally excluded, like unprocessed agricultural products. Third, AFTA has also widened its scope beyond the CEPT scheme by including other measures to complement and supplement the removal of tariffs and other barriers to trade. These initiatives include harmonization of standards, reciprocal recognition of tests and certification of products, and removal of barriers to foreign investment. Finally and the most important, AFTA’s original goal of 0-5 percent ending tariff rates was deepened by targeting a zero ending tariff rates on all products by 2010 for the original six members and by 2015 for the four new members. This new goal of zero tariffs will indeed make the region a free trade area.
AFTA has enhanced the country’s trade policy thrust since the CEPT commitments are lower than TRP (Table 4). As a result of the integration of more products into the CEPT, the country’s inclusion list has substantially expanded since the inception of CEPT in 1993. Almost 99 percent of the country’s tariff lines are already included into the scheme in 2001 (Table 5).
To conclude Section 2 of the paper, the liberalization process has not been easy. Advocates of free trade had always lobbied for a liberalized regime. On the other hand, the business class whose interests had always been safeguarded during the protectionist regime naturally resented the move for reforms. Until now, there are sectors that are aggressively lobbying for exemption from or postponement of the tariff reductions. One good feature of the series of trade reforms, however, was the commitment of the government, under various administrations, to the reform process. Fear of policy reversals during the various crises the country went through did not materialize. There were tariff adjustments but these were temporary4. The country’s commitments to the WTO, APEC and AFTA are a big factor in this regard. The country’s commitments enabled the government to “lock in” domestic economic reforms. The legal commitments as well as the rules and disciplines governing the regional trading arrangements as well as the multilateral trading system have prevented the country from taking protectionist measures and policy reversals in times of crisis and difficult economic periods.
3. Impact of Policy Reforms Trade and investment policies influence relative prices, and hence the allocation of resources and pattern of production. With liberalization, resources are shifted away from protected import-substituting industries to export oriented industries, thereby increasing the size of the traded goods sectors relative to the rest of the economy. As a result, the share of international trade (exports and imports) in domestic output increases. The reallocation of resources according to comparative advantage is expected to yield efficiency gains, and ultimately an increase in income. 4 For example, tariffs were temporarily raised in 1999 (EO 63) to alleviate the difficulties faced by domestic industries adversely affected by the financial crisis in 1997-1998. The applied tariff rates of some 694 tariff lines (for chemicals, textiles, metals and machinery) were raised to a level at or below those bound in the WTO in 1999, after which they were reverted back to their old rates (WTO 1999).

11
The relationship between trade, industrialization and economic growth, however, is more complex than what is described above. Whether or not the expansion of trade and the closer integration of an economy to the global trading system result to faster economic growth depend on a host of factors. The development experience of successful economies, like the newly industrializing economies (NIEs)5, points to the importance of the dynamism of the product traded in the world market and the link of trade in domestic economic activity. Trade in products that have strong link in domestic economic activity (i.e. high value added) and at the same time have the potential for global demand expansion (i.e. dynamic) leads to faster growth and income. After two decades of trade and investment policy reforms, different sectors in the economy still ask whether the reforms had been beneficial to the country. What has been the impact of the reforms? Several studies have been done on the issue. The most notable of these are the studies done by Medalla and Power (1986), Medalla, et.al. (1995 and 1996), Pineda (1997), Tan (1994 and 1997) de Dios (1998) and Medalla (2002). These studies focused on the impact of the reforms during the 1980s up to the early 1990s. This section of the paper highlights the findings of these studies and offer additional insights on the impact of the reforms, particularly during the 1990s.
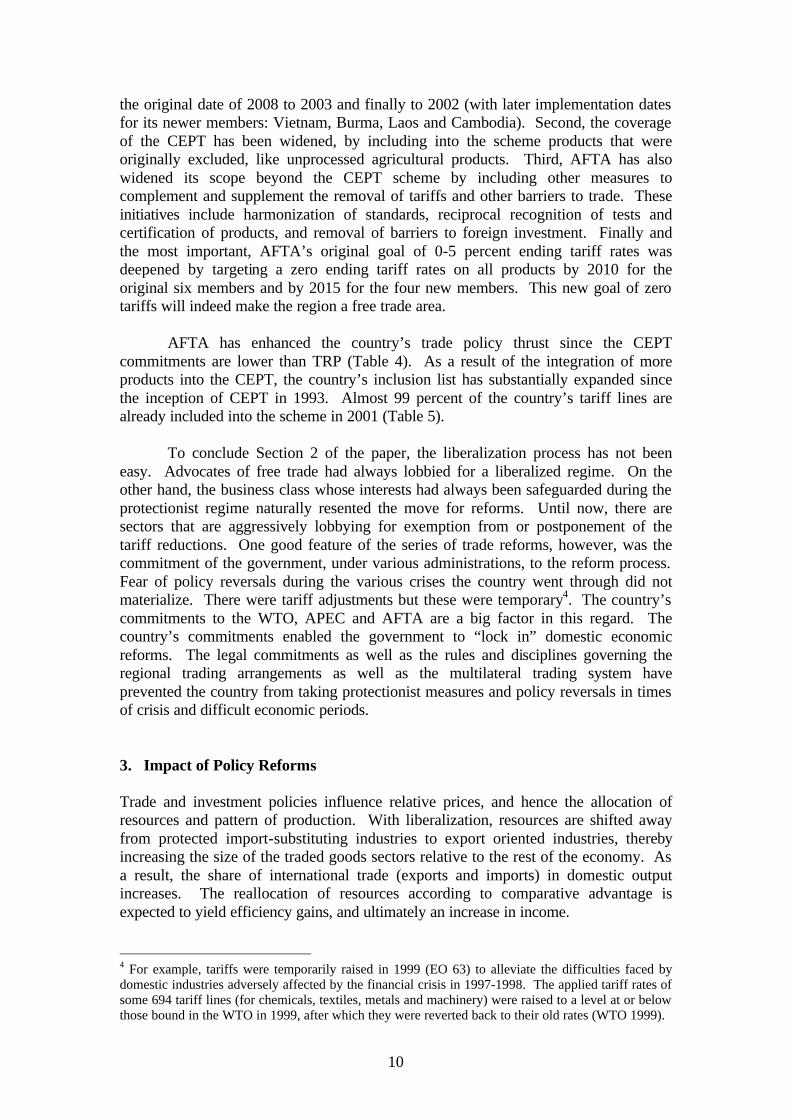
Resource allocation and efficiency. The series of trade reforms improved the structure of protection (Table 7). The average level of effective protection rate (EPR)6 declined significantly from 38 in 1985 to 14.1 in 2001. This is expected to go down further to 10.8 by 2004. The gap in EPR between agriculture and manufacturing has narrowed down in 2000. However, because of the tariffication of quantitative restrictions in agricultural products, the EPR for agriculture will increase by 5 percentage points by 2004, making the sector more protected than manufacturing. The studies by Tan (1994 and 1997) also showed that the gap in EPR between exportables and importables has also been significantly reduced.
One significant impact of the trade reforms is the increase in the overall competitiveness of the manufacturing industry, as measured by the ratio of the domestic resource cost with the shadow exchange rate (DRC/SER)7. The DRC/SER ratio went down from 1.7 in 1983 to 1.2 in 1994 (Table 8). Furthermore, the share of the highly efficient and efficient firms in the value of production went up substantially from 1983 to 1994, indicating a better allocation of resources. 5 The NIEs include South Korea, Taiwan, Singapore and Hong Kong. 6 Effective protection rate (EPR) is defined as the percentage excess of domestic value added at protected prices over value added at free trade prices. 7 DRC measures the social cost of domestic resources used per unit of foreign exchange earned or saved by an activity. SER, on the other hand, represents the opportunity cost of domestic resources used in all activities producing tradable goods, or the social cost of earning foreign exchange. The DRC/SER ratio, therefore, measures an activity’s efficiency in earning or saving foreign exchange. A ratio of 1 or less than 1 indicates efficiency since the activity is using domestic resources whose cost is lower than the value of the net foreign exchange it earned. The lower the ratio, the higher the efficiency is.
12
Table 7. Average effective protection rates, 1985-2004 (%)
Sectors 1985 1990 1995 2000 2001 2002 2003 2004 Agriculture 9.20 23.63 22.00 14.84 15.68 20.76 20.60 20.08
Mining 6.10 1.67 1.43 0.43 0.36 0.33 0.39 0.42
Manufacturing 55.90 31.02 23.09 17.78 14.31 12.41 11.26 9.94
Overall 38.00 27.86 21.91 16.30 14.10 12.62 11.77 10.76 Note: EPR are weighted average based on book rates. Source: Tariff Commission. Table 8. Resource allocation and efficiency, 1983, 1988 and 1994
Share in production value (%)
Share in number of establishments DRC/SER Efficiency classification
1983 1988 1994 1983 1988 1994
0 DRC/SER < 1.0 Highly efficient 18.8 39.5 41.6 19.6 30.2 22.4 1.0 < DRC/SER < 1.5 Efficient to mildly inefficient 28.7 22.8 37.9 17.2 27.7 40.5
1.5 < DRC/SER < 2.0 Inefficient 12.3 14.7 7.6 14.2 13.0 16.3 DRC/SER > 2.0 Highly inefficient 39.6 21.8 12.9 46.0 26.6 20.8
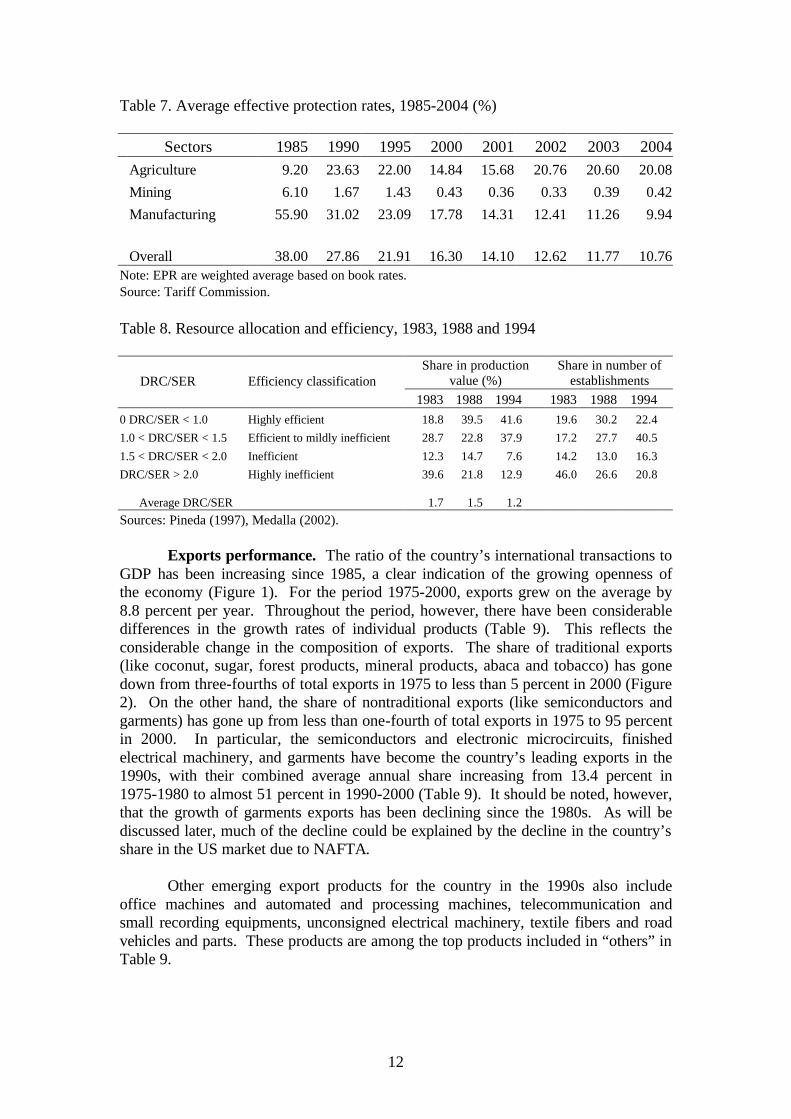
Average DRC/SER 1.7 1.5 1.2 Sources: Pineda (1997), Medalla (2002). Exports performance. The ratio of the country’s international transactions to GDP has been increasing since 1985, a clear indication of the growing openness of the economy (Figure 1). For the period 1975-2000, exports grew on the average by 8.8 percent per year. Throughout the period, however, there have been considerable differences in the growth rates of individual products (Table 9). This reflects the considerable change in the composition of exports. The share of traditional exports (like coconut, sugar, forest products, mineral products, abaca and tobacco) has gone down from three-fourths of total exports in 1975 to less than 5 percent in 2000 (Figure 2). On the other hand, the share of nontraditional exports (like semiconductors and garments) has gone up from less than one-fourth of total exports in 1975 to 95 percent in 2000. In particular, the semiconductors and electronic microcircuits, finished electrical machinery, and garments have become the country’s leading exports in the 1990s, with their combined average annual share increasing from 13.4 percent in 1975-1980 to almost 51 percent in 1990-2000 (Table 9). It should be noted, however, that the growth of garments exports has been declining since the 1980s. As will be discussed later, much of the decline could be explained by the decline in the country’s share in the US market due to NAFTA. Other emerging export products for the country in the 1990s also include office machines and automated and processing machines, telecommunication and small recording equipments, unconsigned electrical machinery, textile fibers and road vehicles and parts. These products are among the top products included in “others” in Table 9.

13
Figure 1. Ratio of international transactions to GDP, 1975-2001
Source: National Income Accounts, NSCB.
Table 9. Percentage distribution and growth rate of merchandise exports, 1975-80, 1980-90, 1990-2000.
Growth rate (1985 prices, %) Average annual share (%) Product 1975-80 1980-90 1990-00 1975-80 1980-90 1990-00
MERCHANDISE EXPORTS 21.0 2.0 9.9 100.0 100.0 100.0 Principal Merchandise Exports 11.6 3.7 9.7 70.8 68.5 66.5 Semiconductors and electric microcircuits
64.0 8.9 10.2 5.6 17.6 27.9
Finished electrical machinery 7.8 Garments 41.4 13.1 3.7 7.8 14.9 14.7 Crude coconut oil 11.6 0.9 2.9 12.6 7.4 2.6 Gold from copper ores -3.1 -5.1 19.4 2.5 2.3 1.2 Bars, rods of copper 5.8 1.9 1.7 Banana and plaintains 2.2 -1.0 6.8 2.5 1.5 1.3 Centrifugal sugar 9.8 -19.0 5.0 13.1 2.9 0.6 Shrimps and prawns 9.7 25.7 -6.8 0.5 1.9 1.4 Canned pineapple 13.2 -0.6 1.7 1.7 1.2 0.6 Iron agglomerates 1.5 -2.1 2.4 2.9 0.5 Dessicated coconut 3.1 -0.4 0.2 2.1 1.5 0.5 Copra oil, cake & meal 12.5 1.1 -1.2 1.8 1.6 0.3 Prepared tuna 147.6 14.9 -8.2 0.3 1.2 0.4 Copper concentrates 2.7 -9.8 -15.0 9.2 2.8 0.8 Others 41.3 -0.1 10.3 29.2 31.5 39.9 Note: Among the top products included in "others" are: (1) office machines and automated and processing machines; (2) telecommunication and small recording equipment; (3) textile fibers; (5) road vehicle and parts.
source: National Accounts of the Philippines, NSCB
0.00 0.20 0.40 0.60 0.80 1.00 1.20 1.40 1.60 1.80 2.00
1975 1980 1985 1990 1995 2000
Ratio
Export/ GDP Import/ GDP Total trade/ GDP

14
Figure 2. Composition of exports, 1975-2000 (%)
Source: Philippine Statistical Yearbook, various issues
The changing composition of exports is also reflected in the shifts in revealed comparative advantage (RCA). In terms of factor intensity, the country had a comparative advantage in agriculture-intensive products in the 1970s and 1980s, as shown by the RCA indicator8 of greater than 1 (Table 10). However, over the years, the country has been losing its comparative advantage in these products, as the RCA indicator has been consistently declining. On the other hand, the country has slowly gained a comparative advantage in labor-intensive products, as shown by the increasing RCA indicator. By the second half of the 1990s, these are the only types of products for which the country has a comparative advantage.. Table 10. Revealed comparative advantage based on factor intensity, Philippines,
1975,1980,1985,1990,1995 and 1998.
1975 1980 1985 1990 1995 1998 Agriculture Intensive 3.825 2.890 2.342 1.724 1.277 0.687 Capital Intensive 0.052 0.142 0.152 0.173 0.241 0.156 Labour Intensive 0.219 0.515 0.613 0.825 1.728 2.071 Minerals Intensive 0.653 0.726 0.547 0.691 0.616 0.206 Note: RCA >1 indicates comparative advantage while RCA <1 indicates the opposite.
Source: NAPES database
In general, the comparative advantage of manufactured exports is increasing (Table 11). In terms of specific products, the country’s comparative advantage is in wood (SITC 63), pottery (SITC 66), office machines, electrical and non-electrical machinery (SITC 71 and 72), clothing (SITC 84), developed cinema film (SITC 86), and travel goods and handbags (SITC 83). What is worrisome though are the falling RCAs of most of these products since 1995. A number of factors could explain the change in the composition of exports and comparative advantage. The relatively low-income elasticity of demand for primary products played a major role in the steady decline in the share of agricultural
8 RCAij = (xij/Xij) / (Xiw/Xww), where xij refers to product i exported by country j; Xij refers to country j’s total exports; Xiw refers to the total world exports of product i; and Xww refers to total world exports. In other words, RCA is the share of specific product in total exports of a country relative to the share of the same product in world trade. A ratio of greater than 1 indicates that a country has a comparative advantage in that product while a ratio of less than 1 indicates the opposite.
AVERAGE % Traditional Non-traditional
1975-80 66.6 33.4
1980-85 45.1 54.9
1985-90 23.5 76.5
1990-95 14.2 85.8
1995-00 7.1 92.9
0%
10%
20%
30%
40%
50%
60%
70%
80%
90%
100%
1975 1980 1985 1990 1995 2000
Non-traditional exports Traditional exports
15
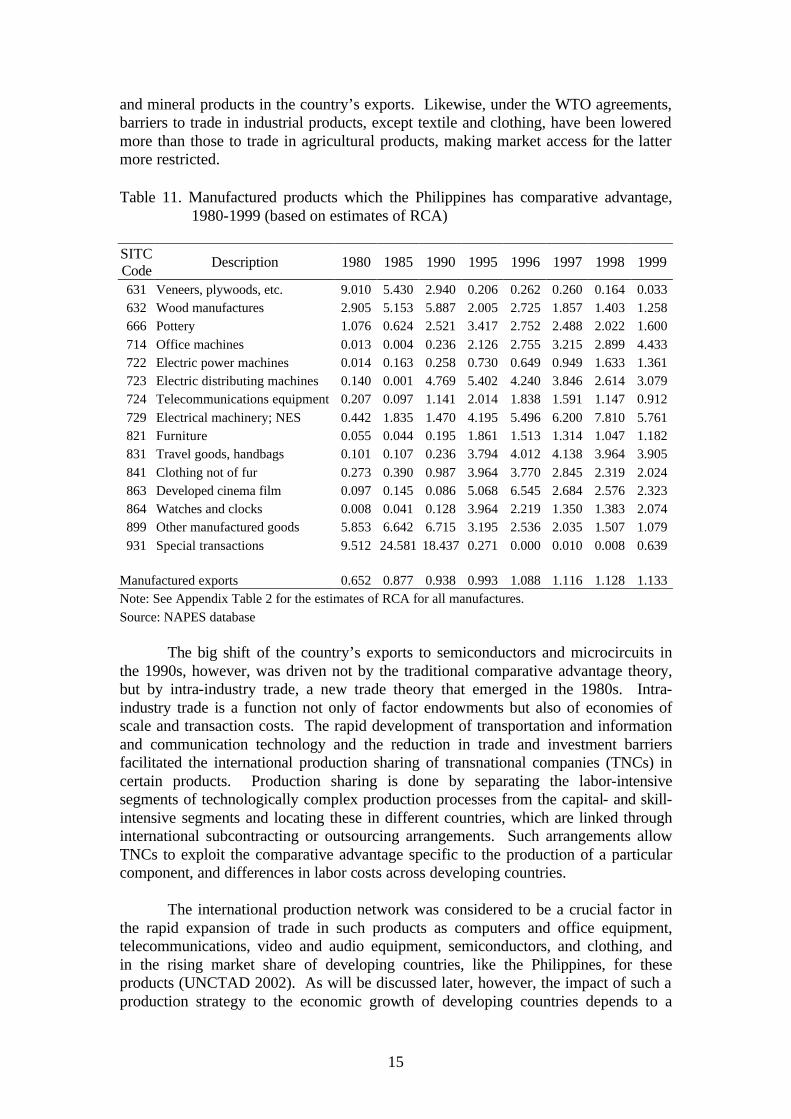
and mineral products in the country’s exports. Likewise, under the WTO agreements, barriers to trade in industrial products, except textile and clothing, have been lowered more than those to trade in agricultural products, making market access for the latter more restricted. Table 11. Manufactured products which the Philippines has comparative advantage,
1980-1999 (based on estimates of RCA) SITC Code
Description 1980 1985 1990 1995 1996 1997 1998 1999
631 Veneers, plywoods, etc. 9.010 5.430 2.940 0.206 0.262 0.260 0.164 0.033 632 Wood manufactures 2.905 5.153 5.887 2.005 2.725 1.857 1.403 1.258 666 Pottery 1.076 0.624 2.521 3.417 2.752 2.488 2.022 1.600 714 Office machines 0.013 0.004 0.236 2.126 2.755 3.215 2.899 4.433 722 Electric power machines 0.014 0.163 0.258 0.730 0.649 0.949 1.633 1.361 723 Electric distributing machines 0.140 0.001 4.769 5.402 4.240 3.846 2.614 3.079 724 Telecommunications equipment 0.207 0.097 1.141 2.014 1.838 1.591 1.147 0.912 729 Electrical machinery; NES 0.442 1.835 1.470 4.195 5.496 6.200 7.810 5.761 821 Furniture 0.055 0.044 0.195 1.861 1.513 1.314 1.047 1.182 831 Travel goods, handbags 0.101 0.107 0.236 3.794 4.012 4.138 3.964 3.905 841 Clothing not of fur 0.273 0.390 0.987 3.964 3.770 2.845 2.319 2.024 863 Developed cinema film 0.097 0.145 0.086 5.068 6.545 2.684 2.576 2.323 864 Watches and clocks 0.008 0.041 0.128 3.964 2.219 1.350 1.383 2.074 899 Other manufactured goods 5.853 6.642 6.715 3.195 2.536 2.035 1.507 1.079 931 Special transactions 9.512 24.581 18.437 0.271 0.000 0.010 0.008 0.639
Manufactured exports 0.652 0.877 0.938 0.993 1.088 1.116 1.128 1.133 Note: See Appendix Table 2 for the estimates of RCA for all manufactures. Source: NAPES database
The big shift of the country’s exports to semiconductors and microcircuits in the 1990s, however, was driven not by the traditional comparative advantage theory, but by intra-industry trade, a new trade theory that emerged in the 1980s. Intra-industry trade is a function not only of factor endowments but also of economies of scale and transaction costs. The rapid development of transportation and information and communication technology and the reduction in trade and investment barriers facilitated the international production sharing of transnational companies (TNCs) in certain products. Production sharing is done by separating the labor-intensive segments of technologically complex production processes from the capital- and skill-intensive segments and locating these in different countries, which are linked through international subcontracting or outsourcing arrangements. Such arrangements allow TNCs to exploit the comparative advantage specific to the production of a particular component, and differences in labor costs across developing countries.
The international production network was considered to be a crucial factor in
the rapid expansion of trade in such products as computers and office equipment, telecommunications, video and audio equipment, semiconductors, and clothing, and in the rising market share of developing countries, like the Philippines, for these products (UNCTAD 2002). As will be discussed later, however, the impact of such a production strategy to the economic growth of developing countries depends to a
16
large extent on how much of the activities of the TNCs are linked to domestic economic activity.
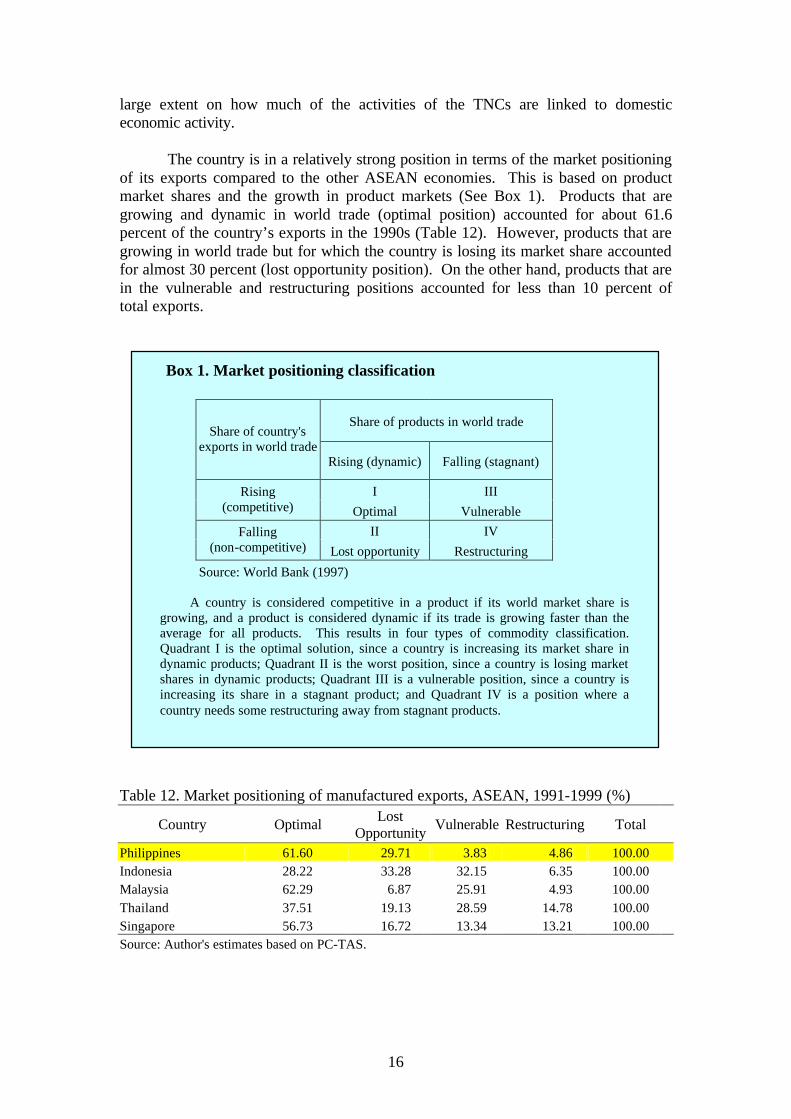
The country is in a relatively strong position in terms of the market positioning of its exports compared to the other ASEAN economies. This is based on product market shares and the growth in product markets (See Box 1). Products that are growing and dynamic in world trade (optimal position) accounted for about 61.6 percent of the country’s exports in the 1990s (Table 12). However, products that are growing in world trade but for which the country is losing its market share accounted for almost 30 percent (lost opportunity position). On the other hand, products that are in the vulnerable and restructuring positions accounted for less than 10 percent of total exports.
Table 12. Market positioning of manufactured exports, ASEAN, 1991-1999 (%)
Country Optimal Lost Opportunity
Vulnerable Restructuring Total
Philippines 61.60 29.71 3.83 4.86 100.00 Indonesia 28.22 33.28 32.15 6.35 100.00 Malaysia 62.29 6.87 25.91 4.93 100.00 Thailand 37.51 19.13 28.59 14.78 100.00 Singapore 56.73 16.72 13.34 13.21 100.00 Source: Author's estimates based on PC-TAS.
Box 1. Market positioning classification
Share of products in world trade
Share of country's exports in world trade
Rising (dynamic) Falling (stagnant)
I III
Rising (competitive) Optimal Vulnerable
II IV
Falling (non-competitive) Lost opportunity Restructuring
Source: World Bank (1997) A country is considered competitive in a product if its world market share is
growing, and a product is considered dynamic if its trade is growing faster than the average for all products. This results in four types of commodity classification. Quadrant I is the optimal solution, since a country is increasing its market share in dynamic products; Quadrant II is the worst position, since a country is losing market shares in dynamic products; Quadrant III is a vulnerable position, since a country is increasing its share in a stagnant product; and Quadrant IV is a position where a country needs some restructuring away from stagnant products.

17
Most of the products that fall under the “optimal and lost opportunity” positions (Table 13) are included in the world’s most dynamic products in 1980-1998 based on the UNCTAD (2002) report9. The same UNCTAD report (2002) shows that most of the dynamic products in world trade are also the ones most affected by the global production process through the international production networks. As shown in Appendix Table 3, the country has indeed increased its share in the world market for semiconductor products (SITC 75, 76, 77) between 1991 and 1999.
The country could improve its position in the world market by increasing its
share in dynamic products for which it is losing its market share. The country actually has a comparative advantage in some of the products under the “lost opportunity” position. Such products account for about 30 percent and 15 percent of total exports in 1991 and 1999, respectively. In particular, the country has a comparative advantage in clothing (Table 11), but the country’s share in the world market went down substantially between 1991 and 1999 (Appendix Table 3).
Productivity. Past studies have shown that total factor productivity (TFP)
growth in the country has been low compared to that of other ASEAN members. The country experienced positive productivity growth in the early 1950s but this has been declining and even registered negative growth in some periods (See for example the studies by Sanchez (1983), Patalinghug (1984), Austria (1992) and Cororaton and Caparas (1999). Part of the reason for the poor productivity performance was attributed to the inward looking industrial policies of the country that prevented the efficient allocation of resources.
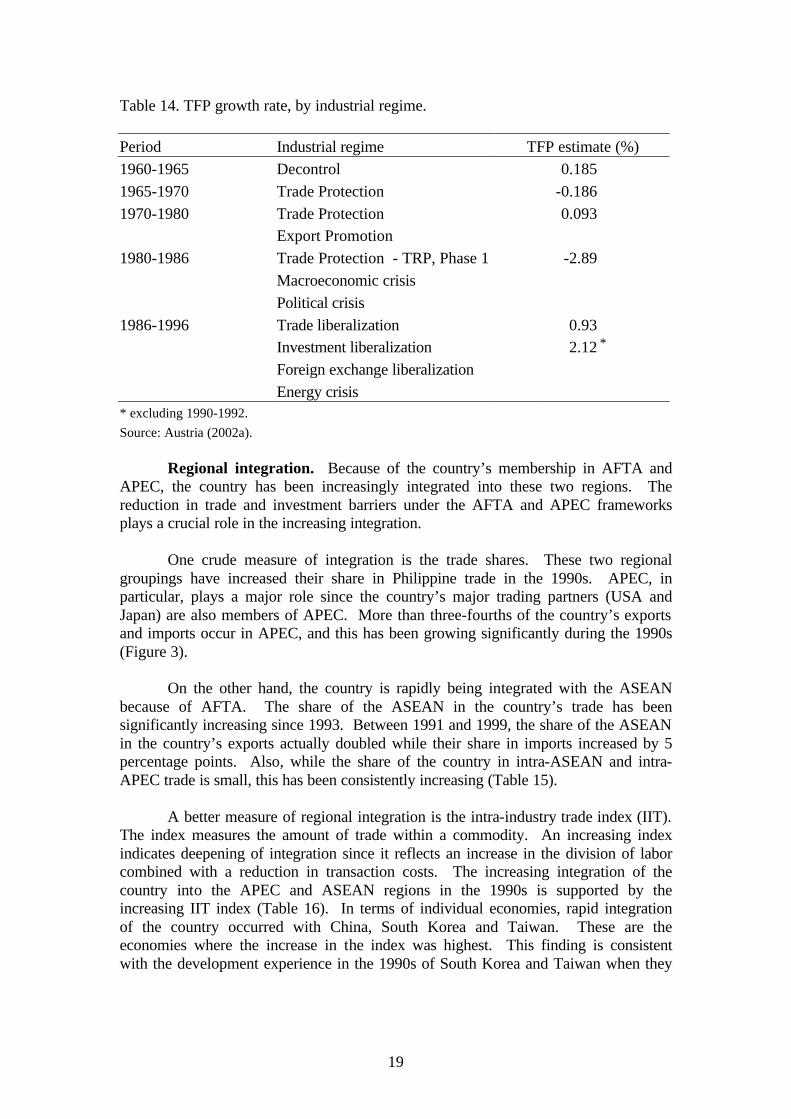
However, recent estimates of productivity growth show that performance improved during the policy reform period (Table 14). Productivity growth was negative during the trade protectionist regime of 1965-1970. It improved during the period 1970-1980, partly because of the export promotion efforts in the late 1970s. The productivity growth worsened again during the period 1980-1986. While this period covered the first phase of the Tariff Reform Program, it was also a period of macroeconomic and political crises for the country. The crisis brought uncertainty to the trade regime and unpredictability to the incentive structure. Such uncertainty caused industries to be reluctant to incur the sunk cost of adjustments and hence, failed to adjust their productive capacity and production strategies to the new trading environment.
The trade and investment liberalization period of 1986-1996, on the other
hand, is characterized by a significant improvement in TFP growth. TFP growth is much higher, however, if the energy crisis period of 1990-1992 is excluded. Although the period 1986-1996 covered two government administrations, the commitment for trade and investment reforms was more credible and stable. Hence, these paved the ways for an environment where firms and industries adjusted their productive capacities in response to the emerging trading environment, both local and international (Austria 2002a).
9 The most dynamic products in world trade fall into four categories, namely: (i) electronic and electrical goods (SITC 75, 76, 77); (ii) textiles and clothing (SITC 61,65,84); (iii) products characterized by high R&D expenditures and high technological complexity (SITC 5, 86); and (iv) primary commodities, non-alcoholic beverages and cereals (SITC 261, 111, 048).

Table 13. Market positioning of manufactured exports, Philippines, 1991-1999
Code Product DescriptionAverage annual
valueCode Product Description
Average annual value
Code Product DescriptionAverage annual
valueCode Product Description
Average annual value
075 SPICES 419.0 071 COFFEE AND COFFEE SUBSTITUTES 3,708.5 016 MEAT AND EDIBLE MEAT OFFAL, SALTED 65.0 012 OTHER TYPE OF MEAT 483.5 098 EDIBLE PRODUCTS AND PREPARATIONS 30,488.0 091 MARGARINE AND SHORTENING 544.0 017 MEAT AND EDIBLE MEAT OFFAL, PRESERVED 400.0 037 FISH AND OTHER AQUATIC INVERTEBRATES 100,905.0 533 PIGMENTS, PAINTS, ETC 4,146.5 111 NONALCOHOLIC BEVERAGES 3,237.0 022 MILK , CREAM AND MILK PRODUCTS 948.5 056 VEGETABLES, ROOTS AND TUBERS 2,705.0 551 ESSENTIAL OILS AND FLAVOR MATERIALS 1,667.0 422 FIXED VEGETABLE FATS AND OILS 321,352.5 023 BUTTER; FATS AND OILS DERIVED FROM MILK 8.5 058 FRUIT PRESERVED, AND FRUIT PREPARATIONS 131,034.0 553 PERFUMERY, COSMETICS, OR TOILETTRIES 11,357.0 431 ANIMAL OR VEGETABLE FATS AND OILS 10,720.5 024 CHEESE AND CURD 273.0 059 FRUIT JUICES 44,701.5 579 WASTE, PARINGS AND SCRAP, OF PLASTICS 1,608.0 515 ORGANO-INORGANIC COMPOUNDS, ETC 267.0 025 BIRDS' EGGS AND EGG YOLKS 74.0 061 SUGARS, MOLASSES, AND HONEY 103,577.5 581 TUBES, PIPES AND HOSES OF PLASTICS 377.0 524 INORGANIC CHEMICALS 493.0 047 CEREAL MEALS AND FLOURS 55.0 062 SUGAR CONFECTIONERY 14,036.5 621 MATERIALS OF RUBBER 2,599.5 541 MEDICINAL AND PHARMACEUTICAL PRODUCTS 1,058.0 048 CEREAL PREPARATIONS; STARCH 15,950.0 072 COCOA 14,690.5 629 ARTICLES OF RUBBER 10,055.5 542 MEDICAMENTS 13,848.0 054 VEGETABLES, ROOTS, ETC 18,686.0 081 FEEDING STUFF FOR ANIMALS 43,005.5 657 SPECIAL YARNS, TEXTILE FABRICS, ETC 24,914.0 554 SOAP, CLEANSING AND POLISHING PREPS 18,072.5 073 CHOCOLATE AND OTHER FOOD PREPARATIONS 453.0 112 ALCOHOLIC BEVERAGES 10,532.0 699 MANUFACTURES OF BASE METAL 31,808.5 562 FERTILIZERS 79,979.5 074 TEA AND MATE 219.0 121 TOBACCO, UNMANUFACTURED/REFUSE 37,243.0 713 INTERNAL COMBUSTION ENGINES AND PARTS 14,589.5 574 POLYACETALS AND OTHER RESINS 357.5 511 HYDROCARBONS AND THEIR DERIVATIVES 118.5 122 TOBACCO, MANUFACTURED 21,384.5 714 ENGINES AND MOTORS, NONELECTRIC 12,952.0 593 EXPLOSIVES AND PYROTECHNIC PRODUCTS 5,480.5 523 METALLIC SALTS AND PEROXYSALTS 2,518.0 411 ANIMAL OILS AND FATS 751.5 718 POWER GENERATING MACHINERY AND PARTS 178.0 598 MISCELLANEOUS CHEMICAL PRODUCTS 30,979.5 531 SYNTHETIC ORGANIC COLORING MATTER 676.0 512 ALCOHOLS, DERIVATIVES 43,338.0 743 AIR OR GAS COMPRESSORS PUMPS AND FANS 12,072.5 612 MANUFACTURES OF LEATHER 959.0 571 POLYMERS OF ETHYLENE, IN PRIMARY FORMS 2,155.0 513 CARBOXYLIC ACIDS AND ANHYDRIDES DERIVATIVES 1,522.0 752 AUTOMATIC DATA PROCESSING MACHINES 1,662,405.0 634 VENEERS, PLYWOODS 30,191.0 573 POLYMERS OF VINYL CHLORIDE ETC 1,795.5 514 NITROGEN-FUNCTION COMPOUNDS 1,819.0 759 OFFICE MACHINES PARTS AND ACCESSORIES 594,535.5 635 WOOD MANUFACTURES 122,801.5 575 PLASTICS, IN PRIMARY FORMS 9,149.5 516 ORGANIC CHEMICALS 520.0 771 ELECTRIC POWER MACHINERY AND PARTS 41,964.5 642 PAPER AND PAPERBOARD 27,358.5 591 INSECTICIDES AND SIMILAR PRODUCTS 3,280.5 522 INORGANIC CHEMICAL ELEMENTS ETC 33,647.5 772 SWITCHING ELECTRICAL APPARATUS ETC 352,240.0 655 KNITTED OR CROCHETED FABRICS 8,927.5 592 STARCHES, INULIN AND WHEAT GLUTEN 1,582.0 532 DYEING AND TANNING EXTRACTS ETC 267.5 773 EQUIPMENT FOR DISTRIBUTING ELECTRICITY 361,914.0 658 MADE-UP ARTICLES, OF TEXTILE MATERIALS 58,740.5 597 PREPARED ADDITIVES FOR MINERAL OILS ETC 642.5 572 POLYMERS OF STYRENE, IN PRIMARY FORMS 1,983.0 778 ELECTRICAL MACHINERY AND APPARATUS 53,438.5 664 GLASS 17,932.5 625 RUBBER TIRES, TUBES 33,227.5 582 PALSTIC PLATES, SHEETS, FILM ETC 25,705.5 783 ROAD MOTOR VEHICLES 1,804.5 671 PIG IRON AND SPIEGELEISEN ETC 6,524.0 641 PAPER AND PAPERBOARD 20,330.5 611 LEATHER 2,957.0 785 MOTORCYCLES AND CYCLES 32,365.5 694 NAILS, SCREWS, NUTS AND SIMILAR ARTICLES 4,901.5 651 TEXTILE YARN 31,704.5 652 COTTON FABRICS, WOVEN 5,240.5 831 TRUNKS, SUITCASES ETC 104,279.0 696 CUTLERY 2,755.0 653 WOVEN FABRICS OF MANMADE TEXTILE MAT'LS 20,416.0 656 TULLES, LACE, EMBROIDERY, RIBBONS, ETC 18,808.5 871 OPTICAL INSTRUMENTS AND APPARATUS 11,030.0 716 ROTATING ELECTRIC PLANT AND PARTS 2,576.0 654 WOVEN FABRICS OF OTHER TEXTILE MATERIALS 1,581.0 659 FLOOR COVERINGS, ETC. 4,990.5 873 METERS AND COUNTERS 963.5 749 MACHINERY NONELECTRIC PARTS ETC 9,242.0 661 LIME, CEMENT CONSTRUCTION MATERIALS 12,977.5 662 CLAY CONSTRUCTION MATERIALS A 2,206.5 884 OPTICAL GOODS 16,818.5 764 TELECOMMUNICATIONS EQUIPMENT 443,914.5 663 MINERAL MANUFACTURES 5,248.0 667 PEARLS, PRECIOUS AND SEMIPRECIOUS STONES 10,024.5 893 ARTICLES OF PLASTICS 57,591.5 776 VALVES AND TUBES; SEMICONDUCTOR DEVICES 2,687,532.0 665 GLASSWARE 5,689.0 673 IRON OR NONALLOY STEELPRODUCTS 9,448.0 931 SPECIAL TRANSACTIONS AND COMMODITIES 8,964,875.0 781 MOTOR CARS AND OTHER MOTOR VEHICLES 263.0 666 POTTERY 41,961.5 675 ALLOY STEEL FLAT-ROLLED PRODUCTS 68.0 971 GOLD, NONMONETARY 83,271.5 811 PREFABRICATED BUILDINGS 30,188.5 674 IRON AND NONALLOY STEEL PRODUCTS 2,302.0 679 IRON AND STEEL TUBES 17,350.0
813 LIGHTING FIXTURES AND FITTINGS 10,785.5 676 IRON AND STEEL BARS 169.5 693 WIRE PRODUCTS AND FENCING GRILLS 279.5 821 FURNITURE AND PARTS THEREOF 266,408.5 678 IRON AND STEEL WIRE 37.0 695 TOOLS FOR USE IN THE HAND OR IN MACHINES 2,323.0 841 MEN'S APPAREL OF WOVEN TEXTILE FABRICS 277,302.5 691 METAL STRUCTURES AND PARTS 7,006.5 711 STEAM OR VAPOR GENERATING BOILERS 3,655.0 842 WOMEN'S APPAREL OF WOVEN TEXTILES 380,424.0 692 METAL CONTAINERS FOR STORAGE 3,536.0 712 STEAM OR VAPOR TURBINES 394.0 843 MEN'S APPAREL KNITTED OR CROCHETED 144,764.0 697 HOUSEHOLD EQUIPMENT OF BASE METAL 17,792.5 721 AGRICULTURAL MACHINERY 175.5 844 WOMEN'S APPAREL KNITTED OR CROCHETED 152,834.5 722 TRACTORS 102.5 733 MACHINE TOOLS FOR WORKING METAL 547.5 845 ARTICLES OF APPAREL,TEXTILE FABRICS 452,661.0 723 CIVIL ENGINEERING PLANT AND EQUIPMENT 4,586.5 763 SOUND RECORDERS OR REPRODUCERS 11,104.5 846 CLOTHING ACCESSORIES, TEXTILE FABRICS 41,391.0 724 TEXTILE AND LEATHER MACHINERY, AND PARTS 3,296.5 774 MEDICAL ELECTRO-DIAGNOSTIC APPARATUS 111.5 872 INSTRUMENTS FOR MEDICAL PURPOSES 5,744.5 725 PAPER MACHINERY, PARTS 952.0 786 TRAILERS AND SEMI-TRAILERS 5,882.0 881 PHOTOGRAPHIC APPARATUS AND EQUIPMENT 9,426.0 726 PRINTING AND BOOKBINDING MACHINERY 209.5 792 AIRCRAFT AND ASSOCIATED EQUIPMENT 7,710.5 894 BABY CARRIAGES, TOYS ETC 160,638.0 727 FOOD-PROCESSING MACHINES 1,910.5 848 ARTICLES OF APPAREL NOT OF TEXTILE FABRICS 61,974.5 899 MISCELLANEOUS MANUFACTURED ARTICLES 180,516.5 728 MACHINERY AND EQUIPMENT SPECIALIZED 20,323.0 851 FOOTWEAR 106,725.0
731 MACHINE TOOLS 499.0 883 CINEMATOGRAPHIC FILM 2,606.5 735 PARTS AND ACCESSORIES FOR MACHINE TOOLS 8,040.0 885 WATCHES AND CLOCKS 32,754.5 737 METALWORKING MACHINERY 812.5 897 JEWELRY, SMITHS' WARES 36,011.0 741 HEATING AND COOLING EQUIPMENT AND PARTS 27,561.0 898 MUSICAL INSTRUMENTS, PARTS 9,535.5 742 PUMPS FOR LIQUIDS 2,922.5 744 MECHANICAL HANDLING EQUIPMENT 3,152.5 745 NONELECTRICAL MACHINERY AND TOOLS 626.0 746 BALL OR ROLLER BEARINGS 27.5 747 TAPS, COCKS, VALVES AND SIMILAR APPLIANCES 3,764.0 748 TRANSMISSION SHAFTS AND CRANKS ETC 1,707.5 751 OFFICE MACHINES 15,789.0 761 TV RECEIVERS 38,654.0 762 RADIO-BROADCAST RECEIVERS 74,344.0 775 HOUSEHOLD TYPE EQUIPMENT 19,687.5 782 MOTOR VEHICLES 212.5 784 PARTS AND ACCESSORIES FOR MOTOR VEHICLES 226,165.5 793 SHIPS, BOATS AND FLOATING STRUCTURES 28,701.0 812 SANITARY, PLUMBING AND HEATING FIXTURES 12,696.0 874 MEASURING, CHECKING APPARATUS 6,035.0 882 PHOTOGRAPHIC SUPPLIES 155.5 891 ARMS AND AMMUNITION 4,240.5 892 PRINTED MATTER 5,772.5 895 OFFICE AND STATIONERY SUPPLIES 491.5 896 WORKS OF ART, ANTIQUES 386.5 961 COIN, NOT BEING LEGAL TENDER 38.5
12,498,728.5 6,027,801.0 776,891.0 986,736.0
% Distribution 61.60 29.71 3.83 4.86
Note: Manufactured exports includes processed food. Source: Author's estimates based on PC-TAS.
RESTRUCTURING
Average Annual Value of Exports ('000 US$)
OPTIMAL LOST OPPPORTUNITY VULNERABLE
19
Table 14. TFP growth rate, by industrial regime.
Period Industrial regime TFP estimate (%) 1960-1965 Decontrol 0.185 1965-1970 Trade Protection -0.186 1970-1980 Trade Protection 0.093 Export Promotion 1980-1986 Trade Protection - TRP, Phase 1 -2.89 Macroeconomic crisis Political crisis 1986-1996 Trade liberalization 0.93 Investment liberalization 2.12 *
Foreign exchange liberalization Energy crisis * excluding 1990-1992.
Source: Austria (2002a).
Regional integration. Because of the country’s membership in AFTA and APEC, the country has been increasingly integrated into these two regions. The reduction in trade and investment barriers under the AFTA and APEC frameworks plays a crucial role in the increasing integration.
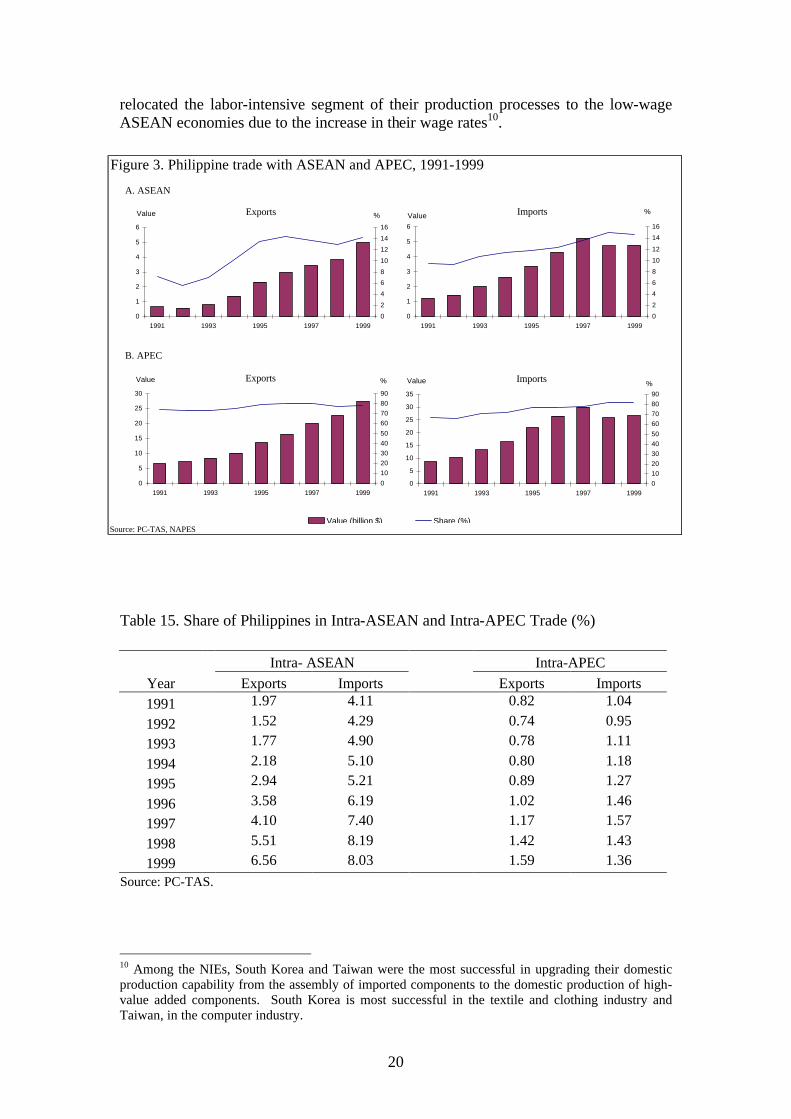
One crude measure of integration is the trade shares. These two regional
groupings have increased their share in Philippine trade in the 1990s. APEC, in particular, plays a major role since the country’s major trading partners (USA and Japan) are also members of APEC. More than three-fourths of the country’s exports and imports occur in APEC, and this has been growing significantly during the 1990s (Figure 3).
On the other hand, the country is rapidly being integrated with the ASEAN because of AFTA. The share of the ASEAN in the country’s trade has been significantly increasing since 1993. Between 1991 and 1999, the share of the ASEAN in the country’s exports actually doubled while their share in imports increased by 5 percentage points. Also, while the share of the country in intra-ASEAN and intra-APEC trade is small, this has been consistently increasing (Table 15).
A better measure of regional integration is the intra-industry trade index (IIT). The index measures the amount of trade within a commodity. An increasing index indicates deepening of integration since it reflects an increase in the division of labor combined with a reduction in transaction costs. The increasing integration of the country into the APEC and ASEAN regions in the 1990s is supported by the increasing IIT index (Table 16). In terms of individual economies, rapid integration of the country occurred with China, South Korea and Taiwan. These are the economies where the increase in the index was highest. This finding is consistent with the development experience in the 1990s of South Korea and Taiwan when they
20
relocated the labor-intensive segment of their production processes to the low-wage ASEAN economies due to the increase in their wage rates10.
Table 15. Share of Philippines in Intra-ASEAN and Intra-APEC Trade (%) Intra- ASEAN Intra-APEC
Year Exports Imports Exports Imports
1991 1.97 4.11 0.82 1.04
1992 1.52 4.29 0.74 0.95
1993 1.77 4.90 0.78 1.11
1994 2.18 5.10 0.80 1.18
1995 2.94 5.21 0.89 1.27
1996 3.58 6.19 1.02 1.46
1997 4.10 7.40 1.17 1.57
1998 5.51 8.19 1.42 1.43
1999 6.56 8.03 1.59 1.36 Source: PC-TAS.
10 Among the NIEs, South Korea and Taiwan were the most successful in upgrading their domestic production capability from the assembly of imported components to the domestic production of high-value added components. South Korea is most successful in the textile and clothing industry and Taiwan, in the computer industry.
Figure 3. Philippine trade with ASEAN and APEC, 1991-1999
A. ASEAN
B. APEC
Source: PC-TAS, NAPES
Exports
0
1
2
3
4
5
6
1991 1993 1995 1997 1999
Value
0
2
4
6
8
10
12
14
16
%
Imports
0
5
10
15
20
25
30
35
1991 1993 1995 1997 1999
Value
0
10
20
30
40
50
60
70
80
90
%Exports
0
5
10
15
20
25
30
1991 1993 1995 1997 1999
Value
0
10
20
30
40
50
60
70
80
90
%
Imports
0
1
2
3
4
5
6
1991 1993 1995 1997 1999
Value
0
2
4
6
8
10
12
14
16
%
Value (billion $) Share (%)
21
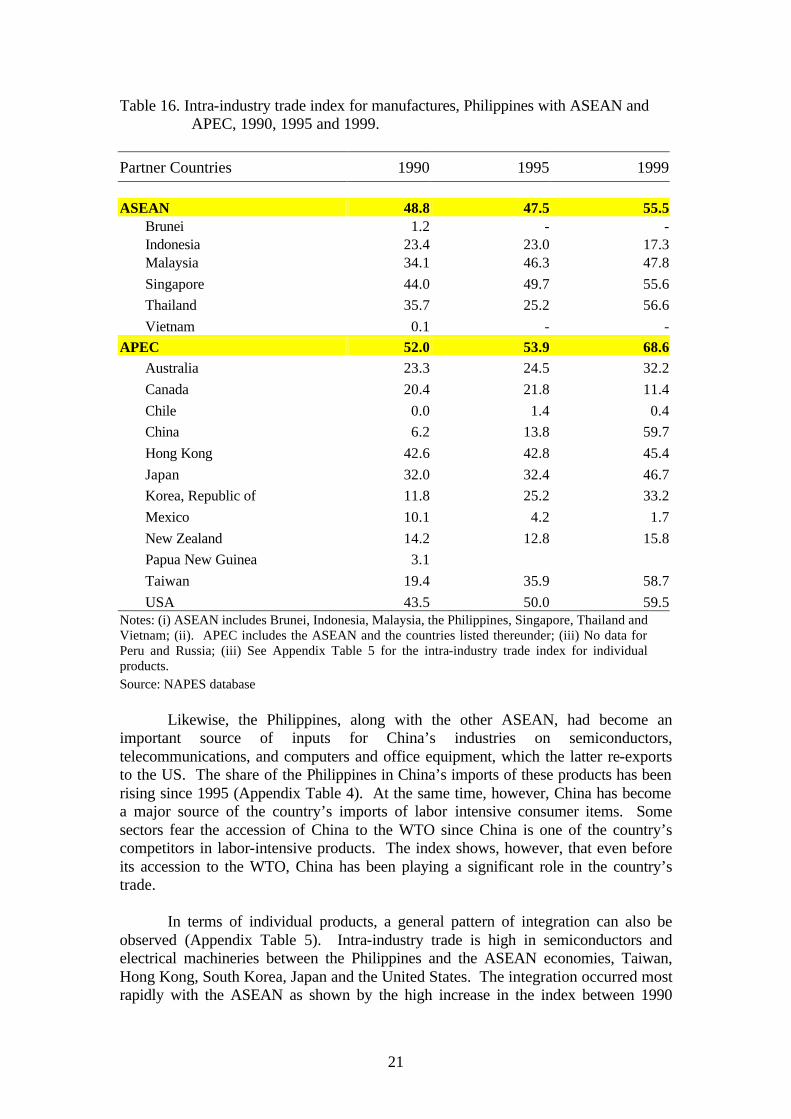
Table 16. Intra-industry trade index for manufactures, Philippines with ASEAN and APEC, 1990, 1995 and 1999.
Partner Countries 1990 1995 1999 ASEAN 48.8 47.5 55.5
Brunei 1.2 - - Indonesia 23.4 23.0 17.3 Malaysia 34.1 46.3 47.8
Singapore 44.0 49.7 55.6
Thailand 35.7 25.2 56.6
Vietnam 0.1 - -
APEC 52.0 53.9 68.6
Australia 23.3 24.5 32.2
Canada 20.4 21.8 11.4
Chile 0.0 1.4 0.4
China 6.2 13.8 59.7
Hong Kong 42.6 42.8 45.4
Japan 32.0 32.4 46.7
Korea, Republic of 11.8 25.2 33.2
Mexico 10.1 4.2 1.7
New Zealand 14.2 12.8 15.8
Papua New Guinea 3.1
Taiwan 19.4 35.9 58.7
USA 43.5 50.0 59.5 Notes: (i) ASEAN includes Brunei, Indonesia, Malaysia, the Philippines, Singapore, Thailand and Vietnam; (ii). APEC includes the ASEAN and the countries listed thereunder; (iii) No data for Peru and Russia; (iii) See Appendix Table 5 for the intra-industry trade index for individual products. Source: NAPES database
Likewise, the Philippines, along with the other ASEAN, had become an important source of inputs for China’s industries on semiconductors, telecommunications, and computers and office equipment, which the latter re-exports to the US. The share of the Philippines in China’s imports of these products has been rising since 1995 (Appendix Table 4). At the same time, however, China has become a major source of the country’s imports of labor intensive consumer items. Some sectors fear the accession of China to the WTO since China is one of the country’s competitors in labor-intensive products. The index shows, however, that even before its accession to the WTO, China has been playing a significant role in the country’s trade. In terms of individual products, a general pattern of integration can also be observed (Appendix Table 5). Intra-industry trade is high in semiconductors and electrical machineries between the Philippines and the ASEAN economies, Taiwan, Hong Kong, South Korea, Japan and the United States. The integration occurred most rapidly with the ASEAN as shown by the high increase in the index between 1990
22
and 1999. Since 1995, intra-industry trade between the Philippines and China has also been increasing in these same products.
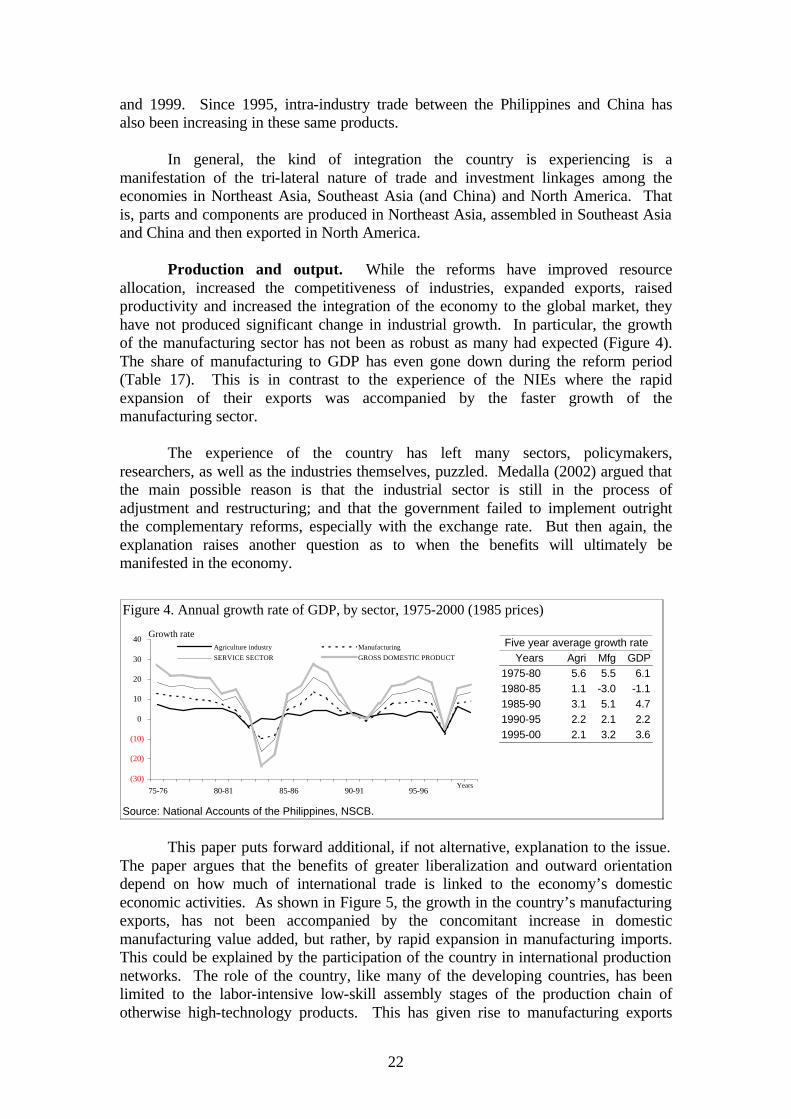
In general, the kind of integration the country is experiencing is a manifestation of the tri-lateral nature of trade and investment linkages among the economies in Northeast Asia, Southeast Asia (and China) and North America. That is, parts and components are produced in Northeast Asia, assembled in Southeast Asia and China and then exported in North America. Production and output. While the reforms have improved resource allocation, increased the competitiveness of industries, expanded exports, raised productivity and increased the integration of the economy to the global market, they have not produced significant change in industrial growth. In particular, the growth of the manufacturing sector has not been as robust as many had expected (Figure 4). The share of manufacturing to GDP has even gone down during the reform period (Table 17). This is in contrast to the experience of the NIEs where the rapid expansion of their exports was accompanied by the faster growth of the manufacturing sector.
The experience of the country has left many sectors, policymakers,
researchers, as well as the industries themselves, puzzled. Medalla (2002) argued that the main possible reason is that the industrial sector is still in the process of adjustment and restructuring; and that the government failed to implement outright the complementary reforms, especially with the exchange rate. But then again, the explanation raises another question as to when the benefits will ultimately be manifested in the economy.
This paper puts forward additional, if not alternative, explanation to the issue.
The paper argues that the benefits of greater liberalization and outward orientation depend on how much of international trade is linked to the economy’s domestic economic activities. As shown in Figure 5, the growth in the country’s manufacturing exports, has not been accompanied by the concomitant increase in domestic manufacturing value added, but rather, by rapid expansion in manufacturing imports. This could be explained by the participation of the country in international production networks. The role of the country, like many of the developing countries, has been limited to the labor-intensive low-skill assembly stages of the production chain of otherwise high-technology products. This has given rise to manufacturing exports
Figure 4. Annual growth rate of GDP, by sector, 1975-2000 (1985 prices)
Years Agri Mfg GDP1975-80 5.6 5.5 6.11980-85 1.1 -3.0 -1.11985-90 3.1 5.1 4.71990-95 2.2 2.1 2.21995-00 2.1 3.2 3.6
Source: National Accounts of the Philippines, NSCB.
Five year average growth rate
(30)
(20)
(10)
0
10
20
30
40
75-76 80-81 85-86 90-91 95-96Years
Growth rateAgriculture industry Manufacturing
SERVICE SECTOR GROSS DOMESTIC PRODUCT

23
that are highly import-dependent and hence, the domestic value added is minimal11. Going back to Table 13, the bulk of the country’s manufactured exports belong to these types of products. Table 17. Distribution of GDP, by sector, 1975-2000 (%)
INDUSTRY 1975-80 1980-85 1985-90 1990-95 1995-00 AGRI.FISHERY,FORESTRY 24.31 23.24 23.73 22.41 20.49
Agriculture industry 20.66 21.05 22.17 21.85 20.31 INDUSTRY SECTOR 39.74 39.35 35.11 34.82 35.19
Manufacturing 27.86 26.34 25.30 25.16 24.98 SERVICE SECTOR 35.95 37.40 41.16 42.77 44.32 Source: National Accounts of the Philippines, NSCB
While the country is producing dynamic products whose trade is rapidly expanding in the world market, their link to domestic activity is very limited. Of particular concern is SITC 931 (special transaction and commodities not classified in kind). These include products that are manufactured from materials imported on consignment basis.
Semiconductors and electrical machinery, which contributed an average of
35.7 percent per year in total exports during the 1990s (Table 9), contributed only 6.7
11 An important part of the value added accrues to foreign owners of capital, know-how and management.
Source: World Bank, World Development Indicator
added, Philippines, Malaysia and Thailand, 1975-1998 (million dollars)Figure 5. Manufactured exports and imports and manufacturing value-added,Philippines,
PHILIPPINES
0
10,000
20,000
30,000
40,000
50,000
60,000
70,000
1975
1976
1977
1978
1979
1980
1981
1982
1983
1984
1985
1986
1987
1988
1989
1990
1991
1992
1993
1994
1995
1996
1997
1998
MALAYSIA
0
10,000
20,000
30,000
40,000
50,000
60,000
70,000
1975
1976
1977
1978
1979
1980
1981
1982
1983
1984
1985
1986
1987
1988
1989
1990
1991
1992
1993
1994
1995
1996
1997
1998
THAILAND
0
10,000
20,000
30,000
40,000
50,000
60,000
70,000
1975
1976
1977
1978
1979
1980
1981
1982
1983
1984
1985
1986
1987
1988
1989
1990
1991
1992
1993
1994
1995
1996
1997
1998
Manufacturing Exports Manufacturing Imports Value-Added
24
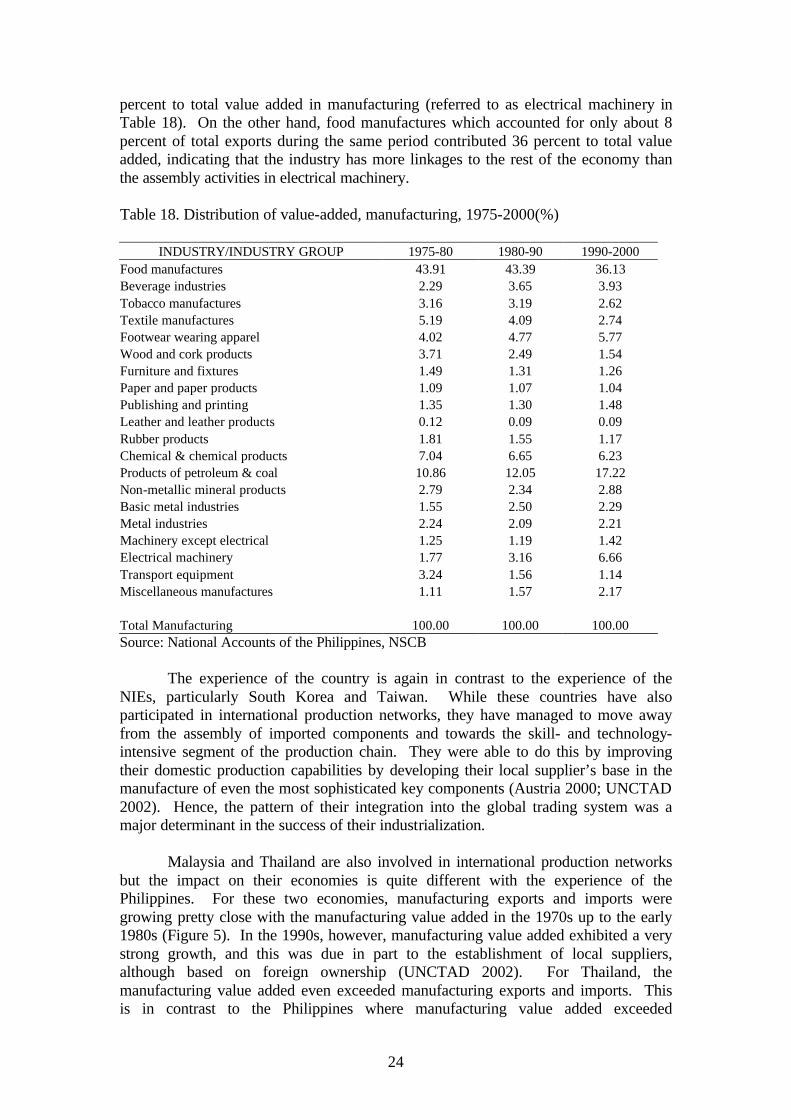
percent to total value added in manufacturing (referred to as electrical machinery in Table 18). On the other hand, food manufactures which accounted for only about 8 percent of total exports during the same period contributed 36 percent to total value added, indicating that the industry has more linkages to the rest of the economy than the assembly activities in electrical machinery. Table 18. Distribution of value-added, manufacturing, 1975-2000(%)
INDUSTRY/INDUSTRY GROUP 1975-80 1980-90 1990-2000 Food manufactures 43.91 43.39 36.13 Beverage industries 2.29 3.65 3.93 Tobacco manufactures 3.16 3.19 2.62 Textile manufactures 5.19 4.09 2.74 Footwear wearing apparel 4.02 4.77 5.77 Wood and cork products 3.71 2.49 1.54 Furniture and fixtures 1.49 1.31 1.26 Paper and paper products 1.09 1.07 1.04 Publishing and printing 1.35 1.30 1.48 Leather and leather products 0.12 0.09 0.09 Rubber products 1.81 1.55 1.17 Chemical & chemical products 7.04 6.65 6.23 Products of petroleum & coal 10.86 12.05 17.22 Non-metallic mineral products 2.79 2.34 2.88 Basic metal industries 1.55 2.50 2.29 Metal industries 2.24 2.09 2.21 Machinery except electrical 1.25 1.19 1.42 Electrical machinery 1.77 3.16 6.66 Transport equipment 3.24 1.56 1.14 Miscellaneous manufactures 1.11 1.57 2.17 Total Manufacturing 100.00 100.00 100.00 Source: National Accounts of the Philippines, NSCB
The experience of the country is again in contrast to the experience of the NIEs, particularly South Korea and Taiwan. While these countries have also participated in international production networks, they have managed to move away from the assembly of imported components and towards the skill- and technology-intensive segment of the production chain. They were able to do this by improving their domestic production capabilities by developing their local supplier’s base in the manufacture of even the most sophisticated key components (Austria 2000; UNCTAD 2002). Hence, the pattern of their integration into the global trading system was a major determinant in the success of their industrialization.
Malaysia and Thailand are also involved in international production networks
but the impact on their economies is quite different with the experience of the Philippines. For these two economies, manufacturing exports and imports were growing pretty close with the manufacturing value added in the 1970s up to the early 1980s (Figure 5). In the 1990s, however, manufacturing value added exhibited a very strong growth, and this was due in part to the establishment of local suppliers, although based on foreign ownership (UNCTAD 2002). For Thailand, the manufacturing value added even exceeded manufacturing exports and imports. This is in contrast to the Philippines where manufacturing value added exceeded
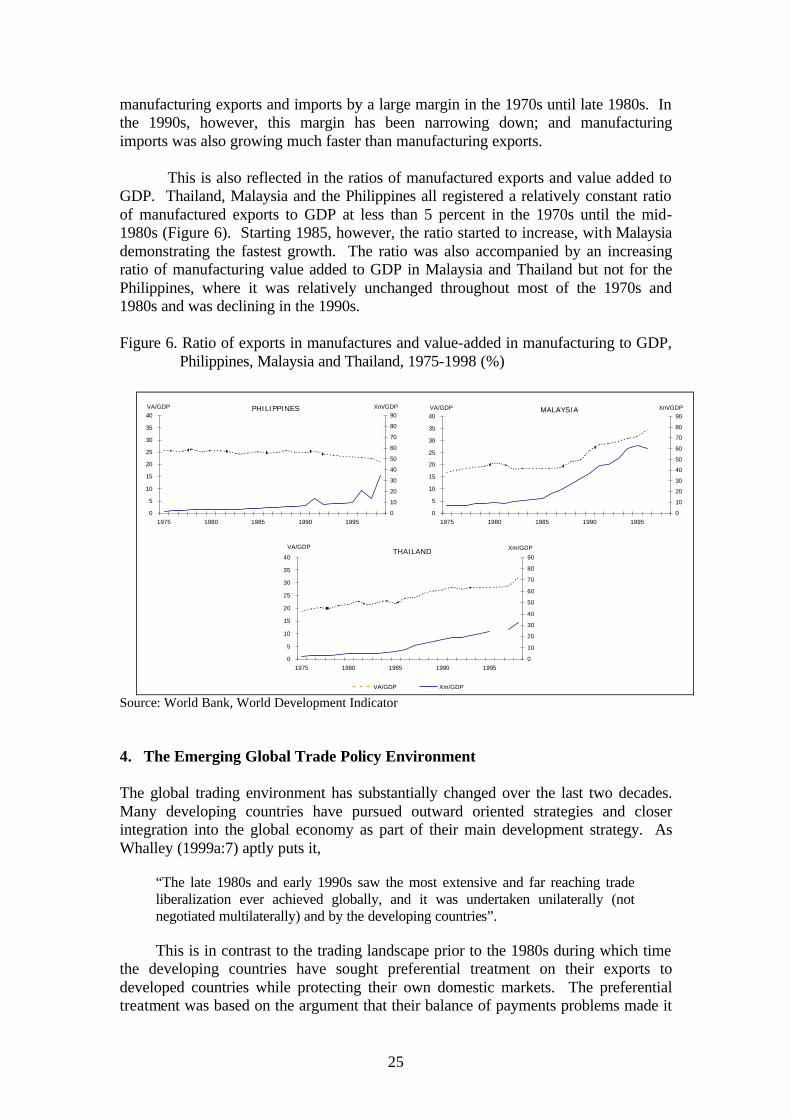
25
manufacturing exports and imports by a large margin in the 1970s until late 1980s. In the 1990s, however, this margin has been narrowing down; and manufacturing imports was also growing much faster than manufacturing exports.
This is also reflected in the ratios of manufactured exports and value added to GDP. Thailand, Malaysia and the Philippines all registered a relatively constant ratio of manufactured exports to GDP at less than 5 percent in the 1970s until the mid-1980s (Figure 6). Starting 1985, however, the ratio started to increase, with Malaysia demonstrating the fastest growth. The ratio was also accompanied by an increasing ratio of manufacturing value added to GDP in Malaysia and Thailand but not for the Philippines, where it was relatively unchanged throughout most of the 1970s and 1980s and was declining in the 1990s. Figure 6. Ratio of exports in manufactures and value-added in manufacturing to GDP,
Philippines, Malaysia and Thailand, 1975-1998 (%)
Source: World Bank, World Development Indicator 4. The Emerging Global Trade Policy Environment
The global trading environment has substantially changed over the last two decades. Many developing countries have pursued outward oriented strategies and closer integration into the global economy as part of their main development strategy. As Whalley (1999a:7) aptly puts it,
“The late 1980s and early 1990s saw the most extensive and far reaching trade liberalization ever achieved globally, and it was undertaken unilaterally (not negotiated multilaterally) and by the developing countries”. This is in contrast to the trading landscape prior to the 1980s during which time
the developing countries have sought preferential treatment on their exports to developed countries while protecting their own domestic markets. The preferential treatment was based on the argument that their balance of payments problems made it
PHILIPPINES
0
5
10
15
20
25
30
35
40
1975 1980 1985 1990 1995
VA/GDP
0
10
20
30
40
50
60
70
80
90Xm/GDP MALAYSIA
0
5
10
15
20
25
30
35
40
1975 1980 1985 1990 1995
VA/GDP
0
10
20
30
40
50
60
70
80
90Xm/GDP
THAILAND
0
5
10
15
20
25
30
35
40
1975 1980 1985 1990 1995
VA/GDP
0
10
20
30
40
50
60
70
80
90
Xm/GDP
VA/GDP Xm/GDP

26
impossible for them to liberalize their trade regimes, as liberalization would only widen their trade deficits (Whalley 1999b; Grether and Olarreaga 1998). This is commonly referred to as the “special and differential treatment” provision of the GATT. Developing countries also used this provision in pursuing a common negotiating strategy as a group as a way of addressing their common problems, which they argued are unique of their developing country status.
In the late 1980s, however, there has been a change in mindset for most of the developing countries as they have pursued unilateral liberalization. Hence, during the Uruguay round negotiations, there was a shift away from the common negotiating position strategy as developing countries pursued their own individual country interests, even if these run counter to other developing countries’ interests12. Trade liberalization resulted to the expansion of trade of developing countries and to their closer integration in the global economy during the past two decades.
After two decades, the global trade environment is yet again seeing a sharp
change. This section of the paper discusses the major policy areas that are shaping the global trading environment, which the developing countries, like the Philippines, are confronted with in this new millennium.
The rise of regionalism. While the world is becoming increasingly integrated because of the intensive trade liberalization in different parts of the globe, regional trading agreements (RTAs) are also on the rise (WTO 2000; WTO 2001a; Das 2001; Whalley 1999a). RTA is not actually something new for it has always been a feature of the post-war global trading system. Article XXIV of the GATT and Article V of the GATS permit the formation of RTAs, where parties to the agreement grant each other preferential tariff treatment on a reciprocal basis provided that certain conditions are met13. By its nature, such arrangement discriminates against non-members. RTAs are therefore exceptions to the most-favored nation (MFN) principle of the WTO14.
The first wave of regionalism came in the 1950s and 1960s and is said to have
first occurred with the formation of the European Free Trade Area (EFTA) in 1959 following the formation of the European Economic Community. Soon after, developing countries of Latin America and Africa formed their own RTAs. However, these RTAs did not succeed, except for the EFTA, primarily because the USA, the largest trading economy, was originally opposed to regionalism and promoted instead multilateral free trade through the GATT.
12 An example is when Argentina argued for the global liberalization in grains and beef, and Thailand in rice, even if net importing developing countries were opposed to it (Whalley 1999a). 13 The conditions for the formation of RTA under Article XXIV includes: (i) the establishment of a free trade area among members within a reasonable period of time; (ii) the reduction of tariffs to zero and the elimination of other restrictive regulations on substantially all trade between the participants; and (iii) duties and other regulations to third countries are not raised. On the other hand, the conditions under Article V of GATS include: (i) substantial sector coverage (in terms of number of sectors, volume of trade affected and modes of supply with no a priori exclusion of any modes); and (ii) absence or elimination of substantially all discrimination through elimination of existing discriminating measures and/or prohibition of new of more discriminatory measures. 14 The most favored nation (MFN) principle means that member countries of the WTO cannot discriminate between their trading partners. A favor, say a lower tariff rate for a particular product, that is granted to one member have to be granted to all the other members.

27
Regionalism came into force again in the late 1980s with the formation of the EU’s Single Market and with the US abandoning its anti-regionalism stance and formed the US-Canada Free Trade Area and North American Free Trade Area (NAFTA). The formation of the EU and NAFTA created a domino effect reviving old RTAs and forming new ones in Latin America and Africa (like Mercusor, Andean Community). The Asia-Pacific came in quite late with the formation of AFTA in 1992 and APEC in 1989.
However, the first and second waves of regionalism are very distinct in
character. The first was inward-looking and shallow integration, involving mostly tariff reductions. The second wave, on the other hand, is outward-looking seeking for greater and faster liberalization; involves deeper integration, going beyond tariff reductions; and non-exclusive, as one country can simultaneously be a member of more than one RTAs (Box 2). The slow progress of the multilateral negotiation at the WTO, in fact, is said to have contributed to the rise of the new regionalism. And recently, the failure to launch a new WTO round at the Seattle Ministerial Meeting in 1999, and the failure of the Early Voluntary Sectoral Liberalization (EVSL) initiative of APEC, also in 1999, strengthened the formation of RTAs almost everywhere around the globe15.
Most WTO members are party to at least one regional trading agreement. As of July 2000, there were 204 RTAs, 70 percent of which are currently in force. Intra-RTA trade accounts for about 43 percent of world trade in 2000 (WTO 2001a). Major developments occurred in the past 2 or 3 years. These include the launch of negotiations for the formation of the Free Trade Agreement of the Americas (FTAA), linking the North and South American economies; and EU forging free trade agreements (FTAs) with Africa, Latin America and the emerging economies of Europe and Central Asia. East Asia has also been caught with regionalism in recent years. Table 19 shows the proliferation of bilateral trading arrangement initiatives across the region in various stages of formation.
The proliferation of RTAs has raised concerns over their effects on the trade environment as well as on the trading system. The usual question of whether RTAs are building blocs or stumbling blocs to the rules-based multilateral trading system under the WTO have been greatly debated in the literature16. Whether an RTA brings about a gain in welfare or not depends on the balance between trade diversion and trade creation. Trade diversion occurs when an inefficient firm inside the RTA is able to gain market access because of the preferential agreement, at the expense of an efficient firm from a non-member of the RTA. On the other hand, trade is created when efficient firms inside the RTA are able to expand their market shares at the expense of inefficient firms from non-members. The overall impact depends on the net effect of trade creation and trade diversion.
However, there is a general consensus that RTAs of the second wave offer
faster and deeper liberalization than is possible at the multilateral level; and that,
15 The study by Grether and Olarreaga (1998) supports the argument that countries that engage in RTAs are seeking for faster liberalization. The study shows that countries that engaged in preferential trade in the 1980s and early 1990s were relatively closed economies while countries with a large share in preferential trade in the 1990s are relatively more open. 16 See for example Krueger (1999), Laird (1999), Ethier (1998), Baldwin (1997), and Bhagwati (1992).

28
liberalization at the regional level can serve as a prerequisite or an aid to achieving multilateral consensus at the WTO. As Baldwin (1997) has said, “regionalism is half of the wheel of liberalization going around the globe”. The Information Technology Agreement (ITA) best illustrates this where it was initially launched in APEC before it was brought to the WTO17.
However, as one country can be a member of more than one RTA, the
overlapping RTAs can increase the risk of inconsistencies in trading rules among the RTAs that can lead to implementation problems18 (WTO 2001a). Such inconsistencies can cause systemic risk on the functioning of the WTO by rendering future efforts to develop consistent multilateral rules difficult, if not impossible. The different rules of origin among RTAs best illustrate this point. 17 The Information Technology Agreement (ITA) provides for the elimination of tariffs on IT products by 2000, with extended transition for some products. 18 The ground rules under Article XXIV of the GATT and Article V of the GATS suffer from systemic issues rendering them ineffective in imposing discipline in the RTAs.
Box 2. The Evolution of Economic Integration
Sources: Low (2000); Das (2001) Regional trading arrangements (RTAs) can take various forms, either as
preferential trade area, free trade areas, custom unions, common market or economic union. Under preferential trade area, trading partners grant partial preferential tariff reductions to each other. In a free trade area, members eliminate all tariffs and non-tariff barriers among themselves, but each member can set its own tariff rates on non-members. Customs union is free trade area but members adopt a common external tariff on non-members. Common market goes beyond custom union by allowing free movements of factors of production. Finally, economic union involves integrating national economic policies, like fiscal and monetary policies.
RTAs differ in configuration, either bilateral (agreement between two parties)
or plurilateral (agreement among three or more parties). More complex agreements occur when one (or more) of the parties is an RTA itself or all parties are themselves distinct RTAs.
RTAs also differ in scope. The simplest form takes the exchange of
preferences on a number of limited products among the parties. The more complex ones go beyond tariff elimination to include services, investment, competition policy, government procurement, intellectual property rights, etc.
Free Trade Area – all trade barriers in goods
removed among members but each
retains own barriers with the rest of the
world
Preferential Trading Area – lower trade
barriers among members
Customs Union-free trade among
members and adopt common external trade
policies
Common Market -customs union
status plus free movement of labour
and capital
Economic Union -
common market status plus
harmonization of fiscal and
monetary policies
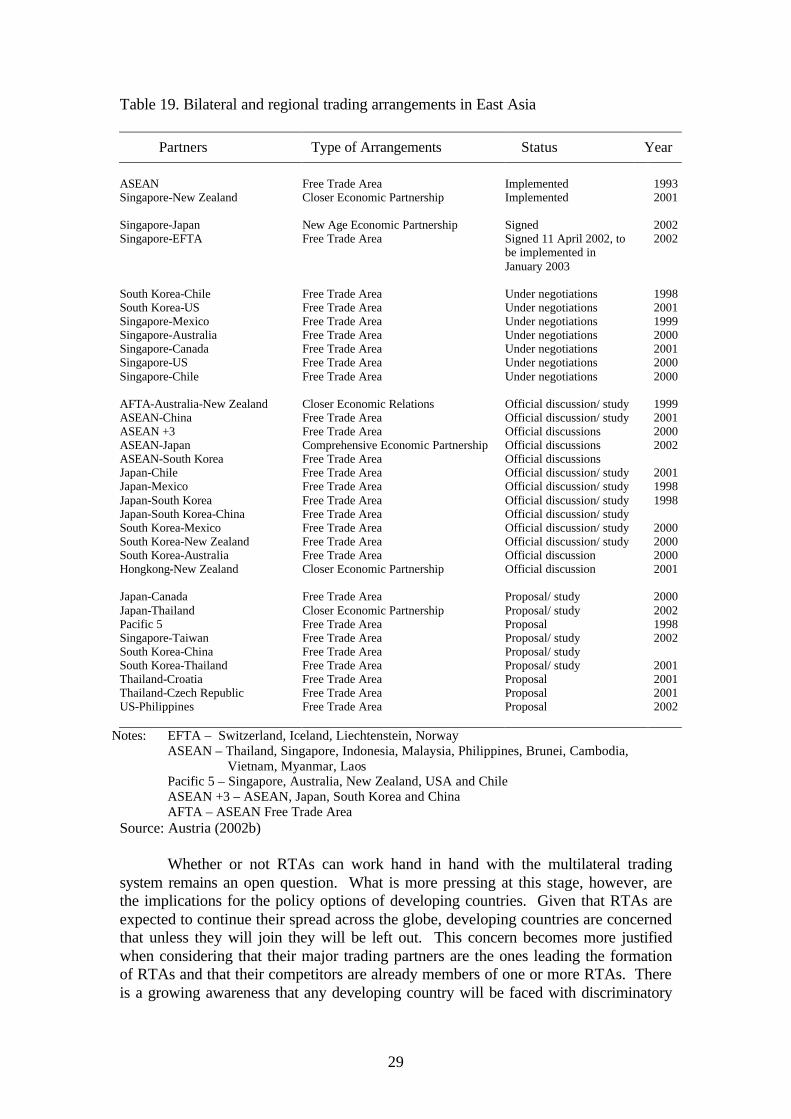
29
Table 19. Bilateral and regional trading arrangements in East Asia
Partners Type of Arrangements Status Year
ASEAN Free Trade Area Implemented 1993 Singapore-New Zealand Closer Economic Partnership Implemented 2001 Singapore-Japan New Age Economic Partnership Signed 2002 Singapore-EFTA Free Trade Area Signed 11 April 2002, to
be implemented in January 2003
2002
South Korea-Chile Free Trade Area Under negotiations 1998 South Korea-US Free Trade Area Under negotiations 2001 Singapore-Mexico Free Trade Area Under negotiations 1999 Singapore-Australia Free Trade Area Under negotiations 2000 Singapore-Canada Free Trade Area Under negotiations 2001 Singapore-US Free Trade Area Under negotiations 2000 Singapore-Chile Free Trade Area Under negotiations 2000 AFTA-Australia-New Zealand Closer Economic Relations Official discussion/ study 1999 ASEAN-China Free Trade Area Official discussion/ study 2001 ASEAN +3 Free Trade Area Official discussions 2000 ASEAN-Japan Comprehensive Economic Partnership Official discussions 2002 ASEAN-South Korea Free Trade Area Official discussions Japan-Chile Free Trade Area Official discussion/ study 2001 Japan-Mexico Free Trade Area Official discussion/ study 1998 Japan-South Korea Free Trade Area Official discussion/ study 1998 Japan-South Korea-China Free Trade Area Official discussion/ study South Korea-Mexico Free Trade Area Official discussion/ study 2000 South Korea-New Zealand Free Trade Area Official discussion/ study 2000 South Korea-Australia Free Trade Area Official discussion 2000 Hongkong-New Zealand Closer Economic Partnership Official discussion 2001 Japan-Canada Free Trade Area Proposal/ study 2000 Japan-Thailand Closer Economic Partnership Proposal/ study 2002 Pacific 5 Free Trade Area Proposal 1998 Singapore-Taiwan Free Trade Area Proposal/ study 2002 South Korea-China Free Trade Area Proposal/ study South Korea-Thailand Free Trade Area Proposal/ study 2001 Thailand-Croatia Free Trade Area Proposal 2001 Thailand-Czech Republic Free Trade Area Proposal 2001 US-Philippines Free Trade Area Proposal 2002
Notes: EFTA – Switzerland, Iceland, Liechtenstein, Norway
ASEAN – Thailand, Singapore, Indonesia, Malaysia, Philippines, Brunei, Cambodia, Vietnam, Myanmar, Laos
Pacific 5 – Singapore, Australia, New Zealand, USA and Chile ASEAN +3 – ASEAN, Japan, South Korea and China AFTA – ASEAN Free Trade Area
Source: Austria (2002b)
Whether or not RTAs can work hand in hand with the multilateral trading system remains an open question. What is more pressing at this stage, however, are the implications for the policy options of developing countries. Given that RTAs are expected to continue their spread across the globe, developing countries are concerned that unless they will join they will be left out. This concern becomes more justified when considering that their major trading partners are the ones leading the formation of RTAs and that their competitors are already members of one or more RTAs. There is a growing awareness that any developing country will be faced with discriminatory
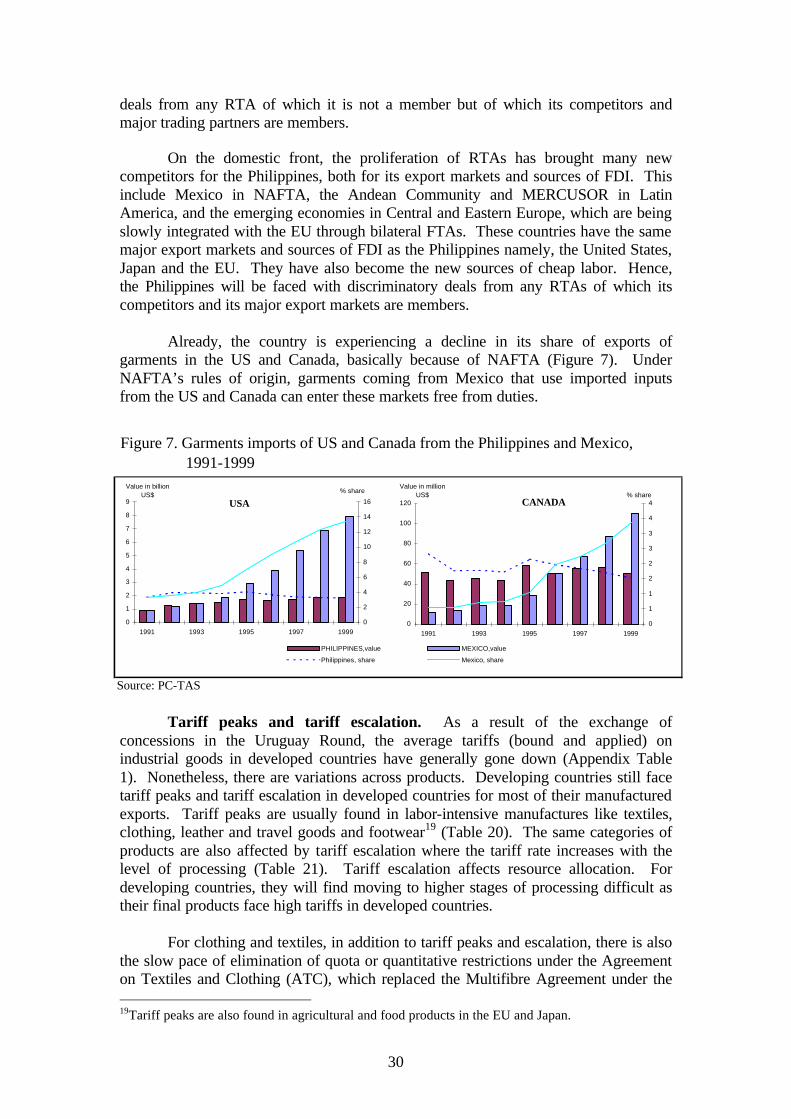
30
deals from any RTA of which it is not a member but of which its competitors and major trading partners are members.
On the domestic front, the proliferation of RTAs has brought many new competitors for the Philippines, both for its export markets and sources of FDI. This include Mexico in NAFTA, the Andean Community and MERCUSOR in Latin America, and the emerging economies in Central and Eastern Europe, which are being slowly integrated with the EU through bilateral FTAs. These countries have the same major export markets and sources of FDI as the Philippines namely, the United States, Japan and the EU. They have also become the new sources of cheap labor. Hence, the Philippines will be faced with discriminatory deals from any RTAs of which its competitors and its major export markets are members.
Already, the country is experiencing a decline in its share of exports of garments in the US and Canada, basically because of NAFTA (Figure 7). Under NAFTA’s rules of origin, garments coming from Mexico that use imported inputs from the US and Canada can enter these markets free from duties.
Tariff peaks and tariff escalation. As a result of the exchange of
concessions in the Uruguay Round, the average tariffs (bound and applied) on industrial goods in developed countries have generally gone down (Appendix Table 1). Nonetheless, there are variations across products. Developing countries still face tariff peaks and tariff escalation in developed countries for most of their manufactured exports. Tariff peaks are usually found in labor-intensive manufactures like textiles, clothing, leather and travel goods and footwear19 (Table 20). The same categories of products are also affected by tariff escalation where the tariff rate increases with the level of processing (Table 21). Tariff escalation affects resource allocation. For developing countries, they will find moving to higher stages of processing difficult as their final products face high tariffs in developed countries.
For clothing and textiles, in addition to tariff peaks and escalation, there is also the slow pace of elimination of quota or quantitative restrictions under the Agreement on Textiles and Clothing (ATC), which replaced the Multifibre Agreement under the 19Tariff peaks are also found in agricultural and food products in the EU and Japan.
Source: PC-TAS
Figure 7. Garments imports of US and Canada from the Philippines and Mexico,1991-1999
USA
0
1
2
3
4
5
6
7
8
9
1991 1993 1995 1997 1999
Value in billion US$
0
2
4
6
8
10
12
14
16
% share
CANADA
0
20
40
60
80
100
120
1991 1993 1995 1997 1999
Value in million US$
0
1
1
2
2
3
3
4
4% share
PHILIPPINES,value MEXICO,value
Philippines, share Mexico, share

31
GATT. The Agreement calls for the gradual elimination of restrictions in three stages starting 1995 up to 2004 and the full integration of these products into the rules and disciplines of the WTO in 2005. Elimination of quota has been modest; and most developing countries are concerned that quotas have not been removed on products that are of commercial interest to them (WTO 2001b). This leaves the bulk of trade affected by quota to be liberalized only at the end of the phase out period. There are concerns that the removal of the remaining quotas might be delayed given the results of studies on the impact of the removal of quotas on importing countries (UNCTAD 2002). If fact, there is a fear of what might replace ATC in 2005, causing some uncertainty for exporters of developing countries.
Table 20. Import-weighted MFN average tariffs of selected developed economies,
by product group (%)
Importing economy
Man
ufac
ture
s
(SIT
C 5
-8 le
ss 6
8)
Tex
tiles
(S
ITC
65)
Clo
thin
g
(SIT
C 8
4)
Lea
ther
and
tr
avel
goo
ds
(SIT
C
611,
612,
831)
Foot
wea
r (S
ITC
85)
Com
pute
rs
and
offi
ce
equi
pmen
t (S
ITC
75)
Tel
ecom
, au
dio
and
vide
o eq
uipm
ent
(SIT
C 7
6)
Australia 4.7 10.3 21.9 5.1 12.6 0.1 4.5 Canada 3.2 10.0 18.3 5.1 15.1 0.0 0.8 European Union 3.5 8.2 11.7 4.1 11.2 0.1 3.7 Japan 2.2 5.9 11.7 10.3 17.4 0.0 0.0 New Zealand 3.7 3.6 14.2 3.4 10.4 0.1 0.7 United States 3.0 8.1 12.0 8.7 12.8 0.0 0.9 Source: UNCTAD (2002), Table 4.3
For the case of the Philippines, Table 20 and Table 21 show that indeed the Philippines suffers from tariff peaks and tariff escalation in its major exports markets of clothing and leather goods and handbags (US, Canada, Japan, EU and Australia).
Trade defense instruments and product regulations as barriers to trade.
Developing countries have been experiencing an increase in the application of trade defense instruments and product regulations against their exports since 1995. Anti-dumping is the most commonly used trade defense instrument, where duties are charged to imports that seemed to be dumped or exported below cost. Almost 50 percent of anti-dumping actions initiated by developed countries between 1995 and 1999 are directed to developing countries (Table 22). It should be noted, however, that developing countries have also been increasing their use of anti-dumping in recent years, not only against developed countries but also against each other. Table 23 shows that anti-dumping measures initiated by developing countries for developed countries and developing countries are almost equal in proportion.
Likewise, product regulations such as sanitary and phytosanitary (SPS) measures and product standards, such as packaging and labeling requirements, have also been increasingly used to meet public policy objectives related to health, safety and environment. The diverse standards and technical regulations among developed countries, along with the corresponding testing procedures for compliance, limit market access and raise production and testing costs for developing countries. Such
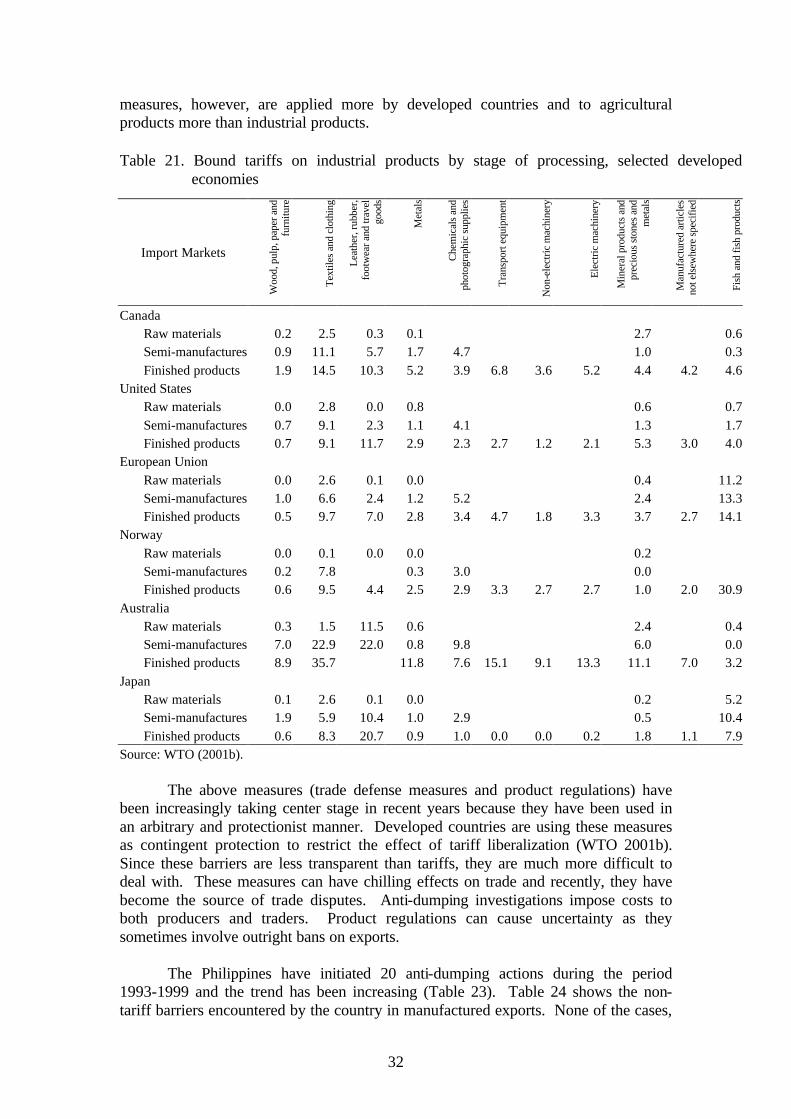
32
measures, however, are applied more by developed countries and to agricultural products more than industrial products. Table 21. Bound tariffs on industrial products by stage of processing, selected developed
economies
Import Markets W
ood,
pul
p, p
aper
and
fu
rnitu
re
Tex
tiles
and
clo
thin
g
Lea
ther
, rub
ber,
foot
wea
r and
trav
el
good
s
Met
als
Che
mic
als
and
phot
ogra
phic
sup
plie
s
Tra
nspo
rt e
quip
men
t
Non
-ele
ctri
c m
achi
nery
Ele
ctri
c m
achi
nery
Min
eral
pro
duct
s an
d pr
ecio
us s
tone
s an
d m
etal
s
Man
ufac
ture
d ar
ticle
s no
t els
ewhe
re s
peci
fied
Fish
and
fish
pro
duct
s
Canada Raw materials 0.2 2.5 0.3 0.1 2.7 0.6 Semi-manufactures 0.9 11.1 5.7 1.7 4.7 1.0 0.3 Finished products 1.9 14.5 10.3 5.2 3.9 6.8 3.6 5.2 4.4 4.2 4.6 United States Raw materials 0.0 2.8 0.0 0.8 0.6 0.7 Semi-manufactures 0.7 9.1 2.3 1.1 4.1 1.3 1.7 Finished products 0.7 9.1 11.7 2.9 2.3 2.7 1.2 2.1 5.3 3.0 4.0 European Union Raw materials 0.0 2.6 0.1 0.0 0.4 11.2 Semi-manufactures 1.0 6.6 2.4 1.2 5.2 2.4 13.3 Finished products 0.5 9.7 7.0 2.8 3.4 4.7 1.8 3.3 3.7 2.7 14.1 Norway Raw materials 0.0 0.1 0.0 0.0 0.2 Semi-manufactures 0.2 7.8 0.3 3.0 0.0 Finished products 0.6 9.5 4.4 2.5 2.9 3.3 2.7 2.7 1.0 2.0 30.9 Australia Raw materials 0.3 1.5 11.5 0.6 2.4 0.4 Semi-manufactures 7.0 22.9 22.0 0.8 9.8 6.0 0.0 Finished products 8.9 35.7 11.8 7.6 15.1 9.1 13.3 11.1 7.0 3.2 Japan Raw materials 0.1 2.6 0.1 0.0 0.2 5.2 Semi-manufactures 1.9 5.9 10.4 1.0 2.9 0.5 10.4
Finished products 0.6 8.3 20.7 0.9 1.0 0.0 0.0 0.2 1.8 1.1 7.9 Source: WTO (2001b). The above measures (trade defense measures and product regulations) have been increasingly taking center stage in recent years because they have been used in an arbitrary and protectionist manner. Developed countries are using these measures as contingent protection to restrict the effect of tariff liberalization (WTO 2001b). Since these barriers are less transparent than tariffs, they are much more difficult to deal with. These measures can have chilling effects on trade and recently, they have become the source of trade disputes. Anti-dumping investigations impose costs to both producers and traders. Product regulations can cause uncertainty as they sometimes involve outright bans on exports.
The Philippines have initiated 20 anti-dumping actions during the period
1993-1999 and the trend has been increasing (Table 23). Table 24 shows the non-tariff barriers encountered by the country in manufactured exports. None of the cases,

33
however, was filed with the WTO. Some of the cases have been resolved, and it was by settlement with the countries involved.
Table 22. Initiation of anti-dumping investigations by level of development of reporting and affected economies, 1995-1999
Affected economies Initiating economies Developed
countries Developing
countries Transition economies Total
A. Number of Investigations Developed countries 126 244 129 499 Developing countries 252 258 201 711 Transition economies 4 0 4 8
All members 382 502 334 1,218 B. Distribution (%) Developed countries 25 49 26 100 Developing countries 35 36 28 100 Transition economies 50 0 50 100
All members 31 41 27 100 Source: WTO (2001b). Table 23. Initiation of anti-dumping investigations, Philippines, 1993-1999
1993 1994 1995 1996 1997 1998 1999 Total 1 7 1 2 3 6 20
Source: WTO (2001b) Table 24. Non-tariff barriers to Philippine exports of manufactures.
Country Product Type of NTB Status United States Textiles, clothing Rules of origin Resolved in 1999 Bras, knit tops Classification Unresolved Australia Food sauces SPS Resolved in June 2000 Korea Floppy disk drives Labelling Resolved in 1996 Pharmaceuticals Entry barrier Resolved in 1999 European Union Milk SPS Unresolved Canned tuna SPS Unresolved Food products SPS, environmental Unresolved Note: SPS means sanitary and phytosanitary measures Source: BITR-DTI (2001), Table 5.
Non-trade issues in the WTO. The WTO has increased its efforts to link
trade to a variety of other international concerns. In the last Uruguay Round, areas like intellectual property rights and environment have been included in the negotiating agenda as affecting trade. WTO has further broadened these areas to include competition policy, investment, government procurement and trade facilitation in the

34
current round. Under the Doha agenda, these areas are considered for possible “future negotiations” in the sense that negotiations will only be launched if a consensus is reached on the modalities of negotiations during the ministerial meeting scheduled for 2003 (UNCTAD 2002)20. But nonetheless, developing countries are already cautious on proposals to bring these areas into the negotiating table, for fear that they could be used as trade barriers against them, similar to their experience in linking trade with environment and labor. As with environment and labor, the possible trade restraints from these new issues could potentially hinder the growth prospects of developing countries. Likewise, non-trade issues will involve heavy structural adjustment costs for developing countries and are also highly politicized.
A fallacy of composition? As presented in the early part of this section of the
paper, the extensive unilateral trade liberalization around the globe among the vast majority of developing countries resulted to the rapid growth of exports of labor-intensive low-skill manufactures. This is particularly true of the middle-income developing countries like the ASEAN-Four21 (the second-tier NIEs) and Mexico. Recently, however, there is a growing concern that expansion of exports of labor intensive exports will result to a sharp drop in prices. This problem is known as the fallacy of composition, which means that,
“…on its own, a small developing country can substantially expand its exports without flooding the market and seriously reducing the price of the products concerned, but this may not be true for developing countries as a whole, or even for large individual countries such as China and India. A rapid expansion in exports of labor intensive products involves a potential risk that the terms of trade will decline to such an extent that the benefits of any increased volume of exports may be more than offset by losses due to lower export values, giving rise to immiserizing growth” (UNCTAD 2002:114) 22.
The concern is based on the argument that the rapid growth of labor-intensive
exports was not accompanied by a higher income growth in the markets for these products (the developed countries), and that new barriers to trade have emerged, as discussed above. In other words, the market is shrinking. As more and more developing countries pursue outward oriented development strategy, capitalizing on their large labor supply and low wage rates, export growth may not be sustained sufficient enough to replicate the growth experience of the NIEs. Evidence shows that some developing countries that have pursued export-oriented strategy have yet to see the fruits for their endeavors (Whalley 1999a).
20 The agenda agreed in Doha for the new WTO round include three major areas, namely: (i) matters for immediate negotiations (negotiations on agriculture, services, industrial goods, environment, trade defense measures, dispute settlement and RTAs); (ii) matters for future negotiations, depending on whether a consensus will be reached regarding modalities of negotiations to be decided in 2003 (investment, competition policy, government procurement and trade facilitation); and (iii) matters for further examination in relevant WTO bodies (special & differential treatment, relationship between trade and finance, transfer of technology, implementation issues, and problems encountered by small and vulnerable economies) (UNCTAD 2002). 21 ASEAN-Four includes Indonesia, Malaysia, Philippines and Thailand. 22This differs from the original concept of the fallacy of composition (Prebisch-Stinger hypothesis) where focus is on the characteristics of the products traded (primary commodities vs manufactures). The shift is now with the characteristics of the trading parties (developing countries vs developed countries), focusing on their differences in technological capacity, and absence or presence of labor surplus (UNCTAD 2002).
35
There are signs already that developing countries exporting labor-intensive manufactures (like clothing, electronic products, footwear and leather goods) are experiencing deterioration in their terms of trade (UNCTAD 2002). Such was not the case for the NIEs during the same stage of their industrialization when they were also producing labor-intensive products. There is also evidence that there might be a risk of excessive global competition in markets for labor-intensive manufactures as more and more developing countries pursue export-oriented strategy.
This emerging phenomenon will have implications on the development
strategy of developing countries. A deteriorating terms of trade will affect their capacity to import essential goods for their development. The danger of the fallacy of composition happening will be greatly reduced depending on how fast the more advanced developing countries (like the ASEAN-Four and Mexico) can upgrade and shift their production structure to high-value added products in order to give room to new developing country exporters of labor-intensive products. Also, as shown earlier in Table 20 and Table 21, except for semiconductors, the labor-intensive exports are faced with tariff peaks and tariff escalation in developed countries. Hence, an increase in market access in developed countries for these products can also reduce risk of fallacy of composition.
South-south trade. One important feature of the trading world during the last
two decades has been the growing trade of developing countries with each other, or the so-called South-south trade. In other words, developing countries have become important markets for each other’s products. Their exports to each other in the 1990s grew much faster at an average rate of 10 percent than their exports to developed countries, which grew at an average rate of 6.5 percent. As a proportion of their total exports, their exports to each other increased from 28 percent in 1990 to about 36 percent in 2000 (WTO 2001:51). This indicates that south-south trade could be an important source of trading opportunities for developing countries in the years ahead.
Again, the increasing South-south trade is attributed to the international
production networks of TNCs. Much of the intra-developing country exports is dominated by manufactures, a large part of which are in semiconductors, and office and telecommunications equipment.
For the Philippines, much of this south-south trade occurred with the ASEAN,
NIEs and more recently, China (Figure 8). This is also supported by the rapid increase in intra-industry trade between the country and these countries, as shown earlier in Table 16.
The China challenge. China’s accession to the WTO is expected to create a
significant change in the global trade and investment environments. Its huge market presents opportunities for exporters to enter or expand commercial interests. At the same time, however, given its success in the exports of labor-intensive manufactures, China is a threat to many developing countries, including the Philippines. Its accession to the WTO means less restrictions to its exports. Its major markets (US, Japan and EU) happen to be the markets of other developing countries as well. Furthermore, given its low wage rate, China is also highly competitive in labor-intensive assembly operations of high technology products and hence, a great

36
attraction to FDI in simple processes of otherwise high-technology activities of international production networks.
The possible impact of China’s entry to the WTO will not be something new
to the country. As discussed earlier in Table 16, even before the accession of China to the WTO, China’s intra-industry trade with the Philippines has already been increasing. Competition is expected to intensify and the strategy for the country to be able to compete with China is product specialization and differentiation (Palanca 2001).
5. The Road Ahead: Challenges and Opportunities for the Philippines What are the implications of the emerging global trade environment to the Philippines? What are the stakes for the country? The fundamental policy issue for the government is not one of more or less trade liberalization, but how best to extract from the country’s participation in the global trading system the elements that will promote economic growth and development. The country’s experience during the past two decades has shown that getting the most out of international trade is no longer just a matter of shift away from exports of primary commodities to exports of manufactures. The key is in upgrading the existing pattern of production and trade in such a way that more of the productive activities generating trade are done at home.
There are risks with continuing the existing pattern of production and trade, i.e. reliance on the low-skill, labor-intensive production segment of the production process of TNCs. One, it involves the type of FDI that is highly mobile as cost advantages can be easily lost due to wage increases or to the emergence of more attractive locations. In other words, there will always be competing locations for these types of products, as the labor cost in the country becomes relatively more expensive (as is already evident among the country’s emerging competitors like China, Vietnam, India and Mexico). Indeed, the wage rates in the country are becoming less and less attractive given the growing competition among developing countries to attract this type of FDI. In fact, the intense competition could lead to a race to the bottom in wage cuts and other incentives to attract FDI. Two, a greater share of the country’s exports is highly vulnerable to the cyclical demand downturns for these types of products, like the recent decline in the global demand for semiconductor products. Three, there is the risk of being locked in into the current
Figure 8. Distribution of Philippine exports, by destination (1985-99)
Source: NAPES database
0
10
20
30
40
50
60
70
80
90
1985 1987 1989 1991 1993 1995 1997 1999
% shareDeveloped countries Developing economiesASEAN 5 NIEsChina
37
structure if local technological upgrading is not pursued (UNCTAD 2002). Being involved in the labor-intensive production chain does not automatically result to a spillover of the technology that is required to be able to move up in the production chain. This could hinder the development of the domestic supply capability and hence, limits the long-term competitiveness of the industry.
Given the above, two areas need to be addressed, namely (i) the need to diversify exports; and (ii) how to make the country’s participation in international production networks create greater impact on the economy.
On the first, diversification of exports reduces the dependence of the country’s
exports on the decision of the TNCs. It thus increases the autonomy of the country in formulating policies and strategies that emphasize national capabilities and goals.
On the second, the key to making the country’s participation in international
production networks create greater impact on the economy is technological upgrading. The country’s exports need to graduate from low-skill labor-intensive manufactures to high-skill high value added manufactures. This means replacing imported parts and components with domestically produced ones thus raising the value-added content of output and exports. In other words, support industries should be developed to supply the required inputs. However, technology upgrading requires a well-devised FDI policy. This requires an FDI where the country could extract technologies from the TNCs that would complement, rather than substitute, efforts to develop and strengthen domestic capacity.
However, both diversification of exports and technological upgrading require good infrastructure. It may well be that the kind of FDI the country is attracting is a response to the kind of infrastructure the country have. The lack of good infrastructure (particularly transport, ports, power, etc.) limits FDI to types of industries that do not have strong linkages with the rest of the economy, as the lack of infrastructure raises the cost of production, making industries unable to compete in the export market.
Discussed below are the opportunities as well as the strategies under three major areas confronting the country in the years ahead. The WTO Doha Round
The Fourth Ministerial Meeting of the WTO in Doha in November 2001
launched the conduct of the new WTO round23. The negotiations are expected to conclude no later than 1 January 2005. As outlined in the Doha agenda, the scopes for negotiations are services, agriculture and the remaining industrial products.
For industrial products, is there scope for further reductions in tariffs? As
shown earlier in Appendix Table 1, the scope of bindings for the country’s major trading partners are already high (US and the EU have 100% binding; Japan,
23 Although the term “negotiating round” is not used, the procedural arrangements are similar to those employed in the Uruguay Round.

38
Australia, Japan and South Korea are almost 100%), including the share of bound duty-free tariff lines. Likewise, the average bound and applied rates are already low.
However, the existing tariff peaks and tariff escalation in the country’s major
markets for textiles, clothing, footwear, and leather and travel goods (Tables 20 and 21) provide considerable scope for negotiations for reciprocal exchange. For clothing and textiles, the elimination of the ATC by 2005 also provides opportunity for negotiations. It should be emphasized that tariff reductions are not part of the ATC and that existing tariffs for textiles and clothing are considerably higher than other industrial products. Success in the negotiation of this unfinished business on tariffs present opportunities for expanding market access for the country.
On the other hand, the country should also be prepared to give concessions to
its trading partners, particularly the developed countries. They may seek to raise the country’s scope of bindings (currently at 67.5%) and lower the level of binding so as to lower the gap between the bound (27.5%) and applied rates (6.7%), which is still large. There is really no cost for the country if it were to raise its scope of bindings. Also, tariffs for some of the country’s industrial products are still relatively high.
Furthermore, the termination of the ATC in 2005 would mean that the
country’s garments industry will be up for increased competition in the world market. Garment exporters will no longer be assured of the markets they originally enjoyed because of quota allocation. By 2005, quota allocation will be abolished and the global market will be up for the taking by the best suppliers who can provide quality and reasonably priced clothing.
In terms of negotiating strategy, the inclusion of services and agriculture in the
current round would permit some cross-sectoral negotiation. This implies that the negotiating strategy on one sector or product should take into account the possible implications it will have for concessions in other sectors or products. The country can also make use of the special and differential treatment provision, especially on sensitive products. In contrast to the Uruguay Round, the Doha meeting has brought back the S&D treatment as a feature of the negotiations. In fact, S&D treatment permeates the Doha text. The unequal distribution of the benefits of the Uruguay Round between the developed and developing countries has brought the issue of development back into the international trade debate. The country should therefore coalesce with other developing countries, especially with the ASEAN, on issues that are of common interest so as to increase its leverage in the negotiations.
On trade rules, the country could use the Doha round to review the principles
and disciplines on the use of trade defense measures and product regulations so as to avoid further abuse of their use.
Non-trade issues, like competition policy, investment, government
procurement and trade facilitation, could be more complex for the country, however. The country should make use of the AFTA and APEC processes to arrive on its negotiating position on these matters. As will be discussed below, APEC has long standing program on these same issues.
39
South-South trade
The increasing trend of South-south trade is expected to continue given the increasing role of international production networks in international trade. For the country to be able to strengthen its position and expand its exports of manufactures to other developing countries, it needs to negotiate, under the current WTO round, the reduction of the high tariffs, tariff peaks and tariff escalation still existing among developing countries (Appendix Table 6 and Appendix Table 7). The country should, of course, be prepared to the same. It is said that the risk of fallacy of composition will be reduced if developing countries will lower their tariff barriers that affect exports of other developing countries (UNCTAD 2002).
The country should exploit the opportunities available in China. With China’s great attraction to FDI, the Philippines can be a good source of imported inputs (electrical machinery) for the labor-intensive segment of the production chain of TNCs in China. This could be achieved only with lower tariffs in China.
Furthermore, while the country exports the same labor-intensive manufactures
as other developing countries, the key is product differentiation and specialization, focusing on improving product quality and standards.
Regionalism With the current WTO round, not much liberalization is expected to occur in APEC. No member economy would be willing to make voluntary reductions in its barriers to trade when concessions can be made in the much larger and binding WTO. It is expected that the APEC process during the period of the WTO negotiations (2002-2005) will be used to building consensus on the Doha agenda that will advance the interests of APEC’s membership. APEC has long-standing work programs on the Doha agenda on competition policy, investment, trade facilitation and government procurement. In particular, APEC has already reached a degree of consensus in these areas through its adoption of the APEC Principles to Enhance Competition and Regulatory Reform, the APEC Non-Binding Investment Principles (NBIP), the APEC Trade Facilitation Principles, and the Non-binding Principles on Government Procurement. Hence, APEC can push WTO to make use of its achievements and progress in these areas. The Philippines can therefore make use of the APEC process to build its negotiating position in these areas.
Another challenge now facing the Philippines is how to respond to the rising regionalism beyond its current participation in the ASEAN-AFTA. The proliferation of RTAs creates pressure for nonmembers and the Philippines is not exempted. The issue of a US-Philippines FTA has been raised recently. Likewise, the ASEAN as a group have taken steps toward RTAs, as shown earlier in Table 19. The most recent of these moves is the agreement last year between the ASEAN and China to establish a free trade area by 2010, followed by the proposal of Japan early this year to look into the possibility of an ASEAN-Japan Comprehensive Economic Partnership. There is also the proposal for an ASEAN Plus Three FTA (South Korea, China and Japan) or an East Asian Free Trade Area. Any move of the ASEAN to enter into a preferential trading agreement with one or more countries or with other RTAs will have implications on the country’s trade and investment policy.

40
How should the country proceed? Negotiating for RTAs could involve a lot of resources (financial, manpower and time). Figure 9 illustrates a very simple process, looking at three important areas that should be considered before embarking into any trading arrangements: objectives/goals, approach and modalities. First, the country should have clear objectives or goals in its participation in trading arrangements. That is, what does it want to achieve? The goals could be economic, political, social, etc. After establishing the goals/objectives, it should then identify the approach that could best serve those objectives/goals. It could be bilateral, regional through the ASEAN or simply strengthening existing cooperation arrangements (like ASEAN, APEC or ASEM). If the approach is bilateral or regional, the modalities will define how to reach those objectives/goals, i.e. either through a free trade area, closer economic partnership or relation, a functional cooperation arrangement or other modalities. It may well be that the objective could be achieved through a functional cooperation arrangement, like the existing financial cooperation of the ASEAN+3. Figure 9. How to respond to RTAs? Objectives/goals Approaches Modalities Considering however, that the country is too small to have leverage to negotiate on its own, it would be in its best interest if it were to respond regionally through the ASEAN. A problem may arise, however, if the ASEAN members would rather want to move individually. Singapore, for example, has been very aggressive in seeking for RTAs. However, whether the approach is bilateral or regional, the country’s participation in trading arrangements requires three things. First, it must be consistent with the WTO rules. What this means is that the trading arrangement should be consistent with Article XXIV of GATT and Article V of GATS. Second, it must be consistent with APEC and AFTA for it not to undermine the credibility of the country’s commitments to these regional cooperation. Third, it should call for commitments that are beyond current commitments in AFTA and APEC for it to contribute to global liberalization. This means that since the country is aiming for a free trade area by 2010 under AFTA and by 2020 under APEC, its participation in trading arrangements cannot be less than a free trade area with a timeframe no longer than APEC’s and AFTA’s.
economic/ political/ social, etc.
bilateral
regional
strengthening existing
cooperation arrangements
Free Trade Area
Close Economic Partnership
Functional Cooperation

41
6. Summary and Conclusions The government has implemented substantial trade and investment policy reforms during the past two decades following a three-track approach involving unilateral, regional and multilateral modalities towards freer trade and investment. The policy reforms are a step in the right direction. The country’s experience points to the importance of domestic policies that foster efficiency and competitiveness before one can participate in regional and multilateral integration and face global competition. The unilateral efforts at liberalization eliminated the inefficiency arising from the past protectionist regime. The result was the improvement in the overall competitiveness of domestic industries, enabling the country to participate in regional trading arrangements such as AFTA and APEC, and in multilateral arrangement, the WTO.
However, while the reforms resulted in positive impacts in resource allocation, competitiveness, productivity and exports, these were not accompanied by a comparable growth of manufacturing output, leading some sectors to question the reforms. The experience of the country during the past two decades brought important policy lessons. The experience shows that getting the most out of international trade is not just a matter of shift away from exports of primary commodities to exports of manufactures. This paper argues that the effect of international trade on the country’s economic growth depends largely on how much of that trade is linked to the domestic economic activity. The rapid expansion of what appears to be high-technology exports should not be taken at face value, as they were produced under the low-skill labor-intensive import-dependent segment of the production chain of the international production networks of transnational companies.
This is not to deny, however, that the country benefited from this type of
exports, or the so-called first generation exports. The strategy was in fact necessary during the country’s early stage of industrialization, enabling it to use its surplus labor. However, markets alone cannot be relied upon to create that dynamic relationship between trade and economic growth. There is a need to employ strategic policies to establish a strong link between trade and the domestic economy.
The country therefore needs to graduate to the next level of the international
production chain and produce the so-called second generation exports, i.e. high value added technology-intensive products. This shift requires a well-devised foreign direct investment policy and technology upgrading. The latter is crucial if the country were to take advantage of the opportunities available in the international trading environment and meet the challenges head on. The government needs to act fast because given the technological race, opportunities for the country to upgrade to the technological ladder have become much more difficult.
The policy lessons pose a great challenge to policymakers, especially given the much more complex global trading environment. The global trading system is becoming more and more multi-tiered than multilateral given the proliferation of bilateral and regional trading arrangements. The new environment offers new challenges as well as opportunities. The challenge for the government is how best to aggressively pursue such opportunities and address the challenges.

42
REFERENCES Austria, Myrna S., 1992. Aggregate Productivity in the Philippine Economy.
Unpublished PhD Dissertation. Australian National University. ________________, 2000. Competitiveness of the Philippine IT Industry: What Lies
Ahead. Philippine Journal of Development 27 (2): 105-148. ________________, 2001. APEC’s Commitments on Investment. in Richard
Feinberg and Ye Zhao. (eds), Chapter 3, Assessing APEC’s Progress: Trade,Ecotech and Institutions. Institute of South East Asian Studies, Singapore.
________________, 2002a. Productivity Growth in the Philippines After the
Industrial Reforms in Josef Yap. (editor), Chapter 6, The Philippines Beyond 2000: An Economic Assessment.. Philippine Institute for Development Studies, Makati City.
________________, 2002b. East Asian Regional Cooperation: Approaches and
Processes. Paper presented at the International Conference on East Asian Cooperation: Progress and Future Agenda. 22-23 August 2002, Beijing, China.
________________, and John Lawrence V. Avila, 2001. Looking Beyond AFTA:
Prospects and Challenges for Inter-regional Trade. Philippine Journal of Development.28 (2): 143-166.
Baldwin, Richard E., 1997. The Causes of Regionalism. The World Economy. 20 (7):
865-888. Bhagwati, Jagdish, 1992. Regionalism versus Multilateralism. The World Economy.15
(5): 535-555. Bureau of International Trade Relations (BITR-DTI) 2001. The Philippines in the
World Trade Organization. Paper presented at the Philippines and the WTO Forum, 30-31 August 2001, Pasay City.
Cororaton, Caesar B. and T. Caparas, 1999. Total Factor Productivity of the
Philippine Manufacturing Industries. Journal of Philippine Development.22 (2): 303-390.
Das, Dilip K., 2001. Regionalism in a Globalizing World: An Asia-Pacific
Perspective. CSGR Working Paper No. 80/01. Centre for the Study of Globalisation and Regionalisation (CSGR), University of Warwick, United Kingdom.
De Dios, Loreli, 1998. “Impediments to Trade in the Philippines,” in Impediments to
Trade in APEC: The Case of China, Indonesia and Philippines. APEC Study Center Institute of Developing Economies, Tokyo, Japan.
43
Ethier, Wilfred J., 1998. The New Regionalism. The Economic Journal, Royal Economic Society, United Kingdom. pp. 1149-61.
Grether, Jean-Marie and Marcelo Olarreaga, 1998. Preferential and Non-preferential
Trade Flows in World Trade. Staff Working Paper ERAD-98-10. World Trade Organization, Geneva.
Intal, Ponciano, 1997. Sustaining the Philippine Economic Resurgence. Paper
presented at a symposium in honor of Dr. Gerardo Sicat and Dr. Jose Encarnacion, Jr. Philippine Institute for Development Studies, September 23-25, 1997, Makati City.
Krueger, Anne O., 1999. Are Preferential Trading Arrangements Trade-Liberalizing
or Protectionist? Journal of Economic Perspectives. Volume 13 (4): 105-124. Laird, Sam, 1999. Regional Trading Agreements: Dangerous Liaisons? The World
Economy 22(9):1179-1200. Low, Linda, 2000. Political Economy of Regional Trading Arrangements in the
Context of Multilateral Trading System in Asia, Department of Business Policy, National University of Singapore. Available at http://www.fba.nus.edu.sg/fba/mscphd/0038.pdf
Medalla, Erlinda, 2002. “Trade and Industrial Policy Beyond 2000: An Assessment
of the Philippine Economy” in Josef Yap, (ed.), Chapter 3, The Philippines Beyond 2000: An Economic Assessment. Philippine Institute for Development Studies, Makati City.
______________, et. al., 1995. Catching Up with Asia’s Tigers. Vol. I. Philippine
Institute for Development Studies, Makati. ___________________, 1996. Catching Up with Asia’s Tigers. Vol. II. Philippine
Institute for Development Studies, Makati. Onguglo, B. and L. Cernat, 2000. Development Issues Arising from Large Economic
Spaces and Options for Developing Countries. Paper presented at the 2000 APEC Economic Outlook Symposium, July 24-25, 2000, Manila.
Palanca, Ellen, 2001. China’s Economic Growth and the ASEAN. Philippine APEC
Study Center Network and the Philippine Institute for Development Studies, Makati.
Patalinghug, Epictetus, 1983. Market Concentration in Philippine Food, Home
Appliance and Textile Industries. Philippine Review of Economic and Business.20(2):215-233.
Pineda, Virginia S., 1997. Effects of the Uniform Five Percent Tariff on
Manufacturing. PTTAF-PSC, Tariff Commission and Philippine Institute for Development Studies, Project No. 95-04. Makati City.

44
Sanchez, A. 1983. Philippine Capital Stock Measurement and Total Factor Productivity Analysis, Unpublished PhD Dissertation, University of the Philippines.
Soesastro, Hadi, 2002. APEC’s Overall Goals and Objectives, Evolution and Current
Status. Paper presented at the 2002 APEC Study Center Consortium Meeting, Merida, Mexico, 22-24 May 2002.
Tan, Elizabeth, 1997. Effects of the Uniform Five Percent Tariff Using the Chunglee
Model. PTTFAP-PSC, Tariff Commission, and Philippine Institute for Development Studies, Project No. 95-04. Makati City.
United Nations Conference on Trade and Development (UNCTAD), 2002. Trade and
Development Report, 2002. UNCTAD/TDR/(2002).Geneva. Whalley, John, 1999a. Developing Countries in the Global Economy: A Forward
Looking View. CSGR Working Paper No. 36/98. Centre for the Study of Globalisation and Regionalisation (CSGR), University of Warwick, United Kingdom. July 1999.
_____________, 1999b. Special and Differential Treatment in the Millenium Round.
CSGR Working Paper No. 30/99. Centre for the Study of Globalisation and Regionalisation (CSGR), University of Warwick, United Kingdom. May 1999.
World Bank, 1997. Philippines Managing Global Integration. Background papers.
Report No. 17024-PH. World Trade Organization (WTO), 1999. Trade Policy Review: The Philippines.
Washington, D.C.: World Trade Organization. _____________________________, 2000. Mapping of Regional Trade Agreements.
Committee on Regional Trade Agreements. WTO Document WT/REG/W/41. Geneva.
_____________________________, 2001a. Overview of the Developments in the International Trading Environment. Annual Report by the Director-General, WTO Document WT/TPR/OV/7. Geneva.
_____________________________, 2001b. Market Access: Unfinished Business. Special Studies 6, Geneva.
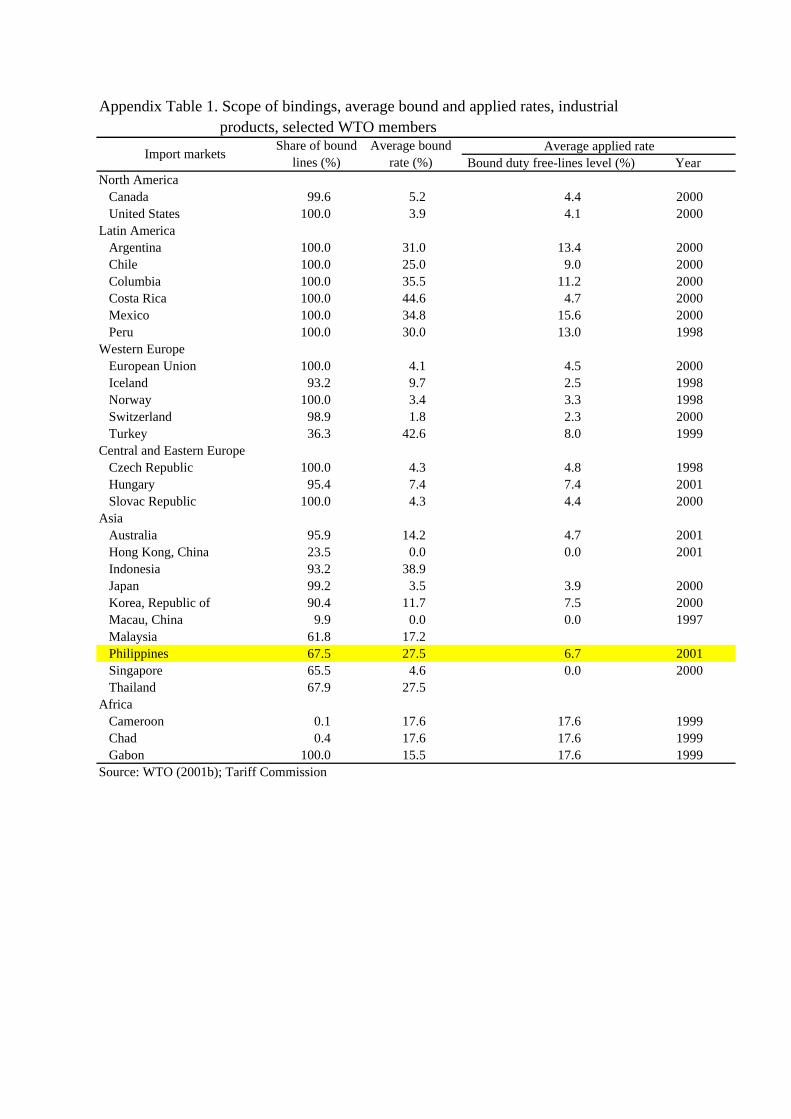
Appendix Table 1. Scope of bindings, average bound and applied rates, industrialproducts, selected WTO members
Year North America
Canada 99.6 5.2 4.4 2000United States 100.0 3.9 4.1 2000
Latin AmericaArgentina 100.0 31.0 13.4 2000Chile 100.0 25.0 9.0 2000Columbia 100.0 35.5 11.2 2000Costa Rica 100.0 44.6 4.7 2000Mexico 100.0 34.8 15.6 2000Peru 100.0 30.0 13.0 1998
Western Europe European Union 100.0 4.1 4.5 2000Iceland 93.2 9.7 2.5 1998Norway 100.0 3.4 3.3 1998Switzerland 98.9 1.8 2.3 2000Turkey 36.3 42.6 8.0 1999
Central and Eastern Europe Czech Republic 100.0 4.3 4.8 1998Hungary 95.4 7.4 7.4 2001Slovac Republic 100.0 4.3 4.4 2000
AsiaAustralia 95.9 14.2 4.7 2001Hong Kong, China 23.5 0.0 0.0 2001Indonesia 93.2 38.9Japan 99.2 3.5 3.9 2000Korea, Republic of 90.4 11.7 7.5 2000Macau, China 9.9 0.0 0.0 1997Malaysia 61.8 17.2Philippines 67.5 27.5 6.7 2001Singapore 65.5 4.6 0.0 2000Thailand 67.9 27.5
AfricaCameroon 0.1 17.6 17.6 1999Chad 0.4 17.6 17.6 1999Gabon 100.0 15.5 17.6 1999
Source: WTO (2001b); Tariff Commission
Average applied rateImport markets
Share of bound lines (%)
Average bound rate (%) Bound duty free-lines level (%)

Appendix Table 2. Revealed comparative advantage of manufactured exports, Philippines, 1977-1999
SITC Code/ Commodity 1977 1978 1979 1980 1981 1982 1983 1984 1985 1986 1987 1988 1989 1990 1991 1992 1993 1994 1995 1996 1997 1998 1999011 MEAT FRSH CHILLD FROZN 0.012 0.013 0.015 0.015 0.025 0.023 0.010 0.015 0.005 0.010 0.007 0.007 0.005 0.013 0.014 0.001 0.001 0.000 0.001 0.000 0.000 0.001 0.000012 MEAT DRIED SALTD SMOKD 0.016 0.008 0.024 0.007 0.007 0.004 0.011 0.000 0.000 0.004 0.001 0.006 0.005 0.003 0.000 0.000 0.000 0.001 0.000 0.001 0.000 0.000 0.000013 MEAT TINNED NES OR PREPD 0.074 0.098 0.090 0.092 0.030 0.026 0.009 0.001 0.011 0.006 0.001 0.001 0.001 0.001 0.003 0.005 0.004 0.008 0.032 0.008 0.036 0.017 0.000022 MILK CREAM 0.101 0.175 0.107 0.144 0.119 0.130 0.184 0.027 0.020 0.012 0.021 0.007 0.018 0.004 0.004 0.009 0.007 0.002 0.001 0.005 0.030 0.008 0.000023 BUTTER 0.000 0.000 0.000 0.000 0.000 0.000 0.000 0.000 0.000 0.000 0.000 0.000 0.000 0.000 0.000 0.000 0.000 0.000 0.001 0.001 0.003 0.001 0.000024 CHEESE CURD 0.002 0.010 0.015 0.004 0.009 0.008 0.006 0.006 0.007 0.007 0.006 0.005 0.004 0.003 0.010 0.002 0.002 0.006 0.013 0.008 0.006 0.004 0.000031 FISH FRESH SIMPLY PRESVD 2.154 2.512 2.818 3.402 2.583 2.164 2.256 2.014 3.106 3.616 4.119 4.901 4.566 4.363 4.477 3.433 3.498 3.234 2.487 1.924 1.587 1.453 1.361032 FISH ETC TINNED PREPARED 0.193 1.027 1.087 3.571 6.242 6.589 7.071 6.012 6.176 5.247 5.514 7.360 8.085 7.022 6.806 5.593 6.033 6.072 5.448 3.758 3.195 2.692 3.529046 WHEAT ETC MEAL OR FLOUR 0.000 0.000 0.000 0.000 0.000 0.000 0.000 0.000 0.000 0.000 0.000 0.000 0.000 0.000 0.000 0.000 0.000 0.000 0.001 0.000 0.000 0.000 0.000047 MEAL FLOUR NONWHEAT 0.000 0.005 0.000 0.000 0.000 0.000 0.014 0.001 0.005 0.000 0.000 0.005 0.003 0.003 0.012 0.016 0.020 0.016 0.032 0.015 0.014 0.021 0.000048 CEREAL ETC PREPS 0.247 0.285 0.276 0.324 0.375 0.533 0.533 0.506 0.544 0.533 0.551 0.421 0.433 0.389 0.338 0.292 0.449 0.457 0.383 0.420 0.445 0.288 0.294053 FRUIT PRSRVD PREPD 9.905 8.679 9.171 9.566 9.064 10.465 8.751 8.396 11.081 10.877 9.048 7.282 7.607 7.140 7.301 6.430 6.774 5.654 5.850 3.788 3.458 2.564 3.333055 VEG ETC PRSVD PREPD 0.081 0.443 0.085 0.155 0.420 0.368 0.143 0.169 0.156 0.143 0.114 0.091 0.076 0.090 0.104 0.576 0.715 0.518 0.300 0.097 0.080 0.051 0.167061 SUGAR HONEY 20.726 8.648 7.968 13.553 16.301 19.326 15.177 14.883 14.050 7.089 4.333 3.415 4.377 5.043 5.334 3.759 4.089 2.099 1.532 2.256 1.484 1.287 1.100062 SUGAR PREPS NONCHOC 1.535 1.238 0.596 0.647 1.584 1.500 1.876 1.520 1.574 1.807 2.233 2.159 1.968 1.660 1.703 1.604 1.090 0.865 0.699 1.058 0.864 0.647 0.429071 COFFEE 1.253 1.184 1.228 1.175 1.497 1.821 1.643 2.228 2.314 3.101 1.232 1.589 1.484 0.418 0.275 0.152 0.110 0.248 0.207 0.075 0.055 0.031 0.042072 COCOA 0.575 0.346 0.563 1.298 3.461 5.446 2.545 0.694 0.869 0.963 0.986 1.134 1.547 2.063 1.820 1.218 1.088 1.195 0.968 0.875 0.733 0.541 0.300073 CHOC AND PRODS 0.089 0.136 0.021 0.096 0.242 0.105 0.031 0.142 0.081 0.037 0.055 0.041 0.044 0.024 0.022 0.031 0.019 0.032 0.039 0.137 0.118 0.095 0.000111 NONALC BEVRGS NES 0.004 0.009 0.001 0.002 0.002 0.010 0.010 0.022 0.000 0.103 0.514 0.164 0.240 0.232 0.707 0.334 0.255 0.299 0.161 0.117 0.132 0.122 0.100112 ALC BEVRGS 0.122 0.108 0.073 0.055 0.142 0.144 0.112 0.111 0.099 0.111 0.113 0.123 0.145 0.160 0.222 0.136 0.109 0.107 0.124 0.100 0.079 0.052 0.214411 ANIMAL OILS FATS 0.138 0.133 0.220 0.734 0.604 0.223 0.517 0.271 0.854 1.419 0.335 0.161 0.151 0.222 0.478 0.488 0.218 0.092 0.020 0.007 0.001 0.002 0.000421 FIXED VEG OILS SOFT 0.000 0.000 0.000 0.000 0.000 0.000 0.274 0.000 0.000 0.000 0.000 0.000 0.000 0.000 0.000 0.000 0.001 0.000 0.007 0.000 0.000 0.000 0.053422 FIXED VEG OIL NONSOFT 58.423 77.856 65.741 49.648 51.795 46.234 52.490 39.710 31.499 48.404 53.355 40.437 36.734 40.596 28.392 37.262 23.805 22.032 23.881 17.577 15.695 13.355 7.313431 PROCESD ANML VEG OIL ETC 0.855 0.907 1.221 0.611 0.398 0.424 0.511 5.568 5.501 2.722 3.667 3.435 2.727 2.522 1.898 1.722 1.349 1.387 2.840 1.239 1.317 0.640 0.833512 ORGANIC CHEMICALS 0.285 0.334 0.308 0.498 0.538 0.597 0.486 0.591 0.561 0.621 0.543 0.521 0.464 0.384 0.271 0.223 0.177 0.148 0.128 0.104 0.093 0.073 0.078513 INORG ELEMNTS OXIDES ETC 0.032 0.025 0.039 0.012 0.013 0.025 0.011 0.070 0.537 0.597 0.978 0.684 0.968 0.904 0.950 0.425 0.325 0.238 0.090 0.079 0.276 0.207 0.306514 OTHR INORGANIC CHEMLS 2.621 2.202 3.800 0.139 0.315 0.343 0.182 0.082 0.059 0.103 0.092 0.081 0.062 0.042 0.062 0.038 0.072 0.193 0.174 0.302 0.079 0.075 0.050515 RADACTVE ETC MATRL 0.000 0.000 0.000 0.000 0.000 0.000 0.000 0.000 0.000 0.000 0.000 0.000 0.000 0.000 0.000 0.000 0.000 0.000 0.001 0.000 0.008 0.000 0.000521 COAL PETROLEUM ETC CHEMS 0.000 0.000 0.000 0.000 0.003 1.574 0.715 0.527 1.433 1.401 0.678 2.502 0.000 0.000 0.000 0.000 0.000 0.000 0.232 0.000 0.000 0.000 0.250531 SYNT DYE NAT INDGO LAKES 0.005 0.029 0.043 0.046 0.039 0.038 0.195 0.023 0.033 0.005 0.000 0.012 0.004 0.009 0.014 0.071 0.037 0.072 0.020 0.092 0.066 0.016 0.000532 DYES NES TANNING PRODS 0.187 0.335 0.198 0.253 0.204 0.201 0.168 0.072 0.090 0.077 0.076 0.094 0.097 0.120 0.158 0.171 0.121 0.122 0.062 0.093 0.089 0.061 0.000533 PIGMENTS PAINTS ETC 0.099 0.036 0.035 0.017 0.017 0.025 0.047 0.013 0.007 0.012 0.027 0.038 0.048 0.038 0.039 0.061 0.094 0.092 0.087 0.090 0.081 0.043 0.024541 MEDICL ETC PRODS 0.126 0.121 0.131 0.139 0.141 0.166 0.149 0.127 0.156 0.114 0.086 0.063 0.072 0.083 0.087 0.081 0.094 0.086 0.053 0.121 0.079 0.048 0.021551 ESSENTL OIL PERFUME ETC 0.374 0.016 0.007 0.041 0.136 0.221 0.289 0.270 0.320 0.479 0.305 0.277 0.296 0.134 0.082 0.065 0.113 0.095 0.116 0.115 0.079 0.058 0.000553 PERFUME COSMETICS ETC 0.041 0.034 0.010 0.037 0.047 0.046 0.040 0.055 0.059 0.029 0.049 0.150 0.120 0.180 0.230 0.187 0.136 0.219 0.091 0.160 0.114 0.115 0.073554 SOAPS CLEANING ETC PREPS 0.200 0.296 1.080 0.224 0.138 0.086 0.091 0.259 0.462 0.458 0.478 0.465 0.252 0.503 0.832 0.898 0.644 0.672 0.234 0.621 0.472 0.326 0.083561 FERTLZRS MANUFACT 0.000 0.000 0.000 0.015 0.002 0.000 0.001 0.039 1.374 5.039 3.448 1.937 2.264 2.202 3.227 2.365 2.410 2.319 0.423 1.528 1.348 1.073 0.148571 EXPLSVS PYROTECH PROD 0.351 0.570 0.391 0.687 0.650 1.295 1.025 1.100 0.858 1.054 0.878 0.752 0.954 1.195 1.381 1.046 1.176 1.390 0.478 0.432 1.152 0.663 0.667581 PLASTIC MATRLS ETC 0.154 0.198 0.145 0.139 0.264 0.168 0.145 0.131 0.225 0.223 0.241 0.212 0.174 0.197 0.157 0.188 0.161 0.145 0.143 0.086 0.118 0.082 0.066599 CHEMCLS NES 0.129 0.147 0.249 0.276 0.302 0.283 0.250 0.290 0.373 0.318 0.348 0.315 0.326 0.300 0.298 0.305 0.279 0.254 0.262 0.194 0.200 0.153 0.164611 LEATHR 0.000 0.000 0.019 0.029 0.009 0.032 0.002 0.013 0.013 0.013 0.027 0.017 0.014 0.036 0.237 0.022 0.007 0.000 0.204 0.117 0.085 0.074 0.083612 LEATHR ETC MANUFACT 0.164 0.293 0.175 0.145 0.215 0.194 0.102 0.038 0.305 0.621 0.362 0.328 0.576 0.642 0.734 0.334 0.201 0.099 0.442 0.415 0.133 0.083 0.083613 FUR SKINS TAN DRSD . . . 0.000 . . . . . 0.000 0.000 0.000 0.001 0.003 0.007 0.062 0.021 0.000 0.031 0.000 0.000 0.013 0.000621 MATRLS OF RUBBER 0.015 0.041 0.024 0.021 0.027 0.042 0.133 0.028 0.030 0.017 0.017 0.040 0.108 0.218 0.132 0.097 0.119 0.077 0.026 0.096 0.066 0.063 0.077629 RUBBER ARTICLES NES 0.052 0.028 0.030 0.013 0.019 0.027 0.056 0.030 0.044 0.102 0.141 0.138 0.177 0.207 0.292 0.173 0.171 0.170 0.203 0.179 0.172 0.252 0.313631VENEERS PLYWOOD ETC 6.491 9.330 10.288 9.010 9.284 6.831 7.233 5.352 5.430 4.991 4.581 4.257 2.409 2.940 1.882 1.233 0.565 0.390 0.206 0.262 0.260 0.164 0.033632 WOOD MANUFACT NES 4.373 3.853 3.738 2.905 3.595 4.077 5.245 4.707 5.153 4.810 5.425 5.119 4.801 5.887 7.740 4.329 3.320 3.419 2.005 2.725 1.857 1.403 1.258633 CORK MANUFACT 0.000 0.006 0.001 0.001 0.002 0.001 0.003 0.000 0.000 0.000 0.000 0.001 0.006 0.005 0.001 0.000 0.001 0.000 0.021 0.039 0.003 0.003 0.000641 PAPER PAPERBRD 0.001 0.007 0.013 0.002 0.001 0.012 0.021 0.014 0.008 0.022 0.012 0.013 0.036 0.015 0.049 0.023 0.024 0.025 0.055 0.052 0.065 0.121 0.097642 ARTCLS OF PAPER ETC 0.039 0.036 0.034 0.033 0.075 0.230 0.099 0.011 0.025 0.026 0.024 0.122 0.249 0.408 0.443 0.472 0.579 0.503 0.537 0.441 0.294 0.232 0.364651 TEXTL YARN AND THREAD 0.189 0.279 0.253 0.446 0.426 0.477 0.285 0.240 0.331 0.197 0.199 0.146 0.195 0.175 0.305 0.375 0.384 0.494 0.320 0.495 0.384 0.236 0.245652 COTTON FABRICS WOVEN 0.019 0.006 0.124 0.111 0.018 0.011 0.007 0.002 0.005 0.214 0.539 0.219 0.209 0.186 0.178 0.106 0.043 0.021 0.081 0.109 0.096 0.049 0.057653 WOVEN TEXTL NONCOT 0.198 0.390 0.306 0.351 0.193 0.128 0.031 0.023 0.018 0.019 0.014 0.017 0.037 0.045 0.150 0.181 0.215 0.415 0.195 0.511 0.486 0.400 0.352654 LACE RIBBONS TULLE ETC 0.391 0.488 0.409 0.267 0.471 0.651 0.593 0.339 0.327 0.617 1.064 0.814 0.587 0.476 2.610 1.335 1.199 1.078 0.497 1.543 1.048 0.705 0.333655 SPEC TEXTL ETC PROD 1.710 1.533 1.629 1.689 1.903 1.592 1.325 1.132 1.073 0.721 0.699 0.738 0.872 0.848 0.551 0.522 0.405 0.355 0.390 0.305 0.307 0.242 0.243656 TEXTL ETC PRODS NES 0.071 0.116 0.201 0.342 0.618 0.682 0.698 0.579 0.768 1.033 1.270 1.581 1.757 1.873 1.804 1.331 1.000 0.949 1.491 1.278 1.009 0.692 0.800657 FLOOR COVR TAPESTRY ETC 0.959 0.619 0.417 0.330 0.225 0.261 0.379 0.273 0.371 0.361 0.407 0.256 0.434 0.440 0.419 0.336 0.315 0.328 0.234 0.358 0.205 0.220 0.125661 CEMENT ETC BLDG PROD 3.036 2.717 1.058 2.771 1.586 1.743 0.659 0.451 1.211 0.412 0.353 0.247 0.334 0.343 0.380 0.306 0.263 0.221 0.341 0.219 0.134 0.157 0.550662 CLAY REFRAC BLDG PRD 0.779 0.511 0.437 0.640 0.557 0.282 0.605 0.410 0.189 0.075 0.113 0.051 0.072 0.076 0.144 0.148 0.081 0.051 0.032 0.028 0.015 0.018 0.000663 OTH NONMET MINERAL MFS 0.039 0.064 0.026 0.070 0.073 0.099 0.049 0.057 0.057 0.051 0.081 0.126 0.129 0.172 0.152 0.119 0.107 0.101 0.294 0.088 0.078 0.067 0.200664 GLASS 0.610 0.525 0.371 0.333 0.382 0.329 0.339 0.236 0.197 0.278 0.270 0.477 0.404 0.432 0.826 0.692 0.573 0.563 0.451 0.175 0.197 0.498 0.273665 GLASSWARE 0.316 0.223 0.230 0.097 0.158 0.020 0.092 0.197 0.252 0.253 0.241 0.188 0.262 0.317 0.199 0.136 0.224 0.188 0.298 0.199 0.608 0.188 0.444666 POTTERY 0.698 1.359 1.151 1.076 1.444 0.978 0.731 0.749 0.624 0.715 0.785 1.283 2.069 2.521 2.889 3.307 3.680 3.351 3.417 2.752 2.488 2.022 1.600667 PEARL PREC SEMI-P STONE 0.012 0.009 0.014 0.007 0.014 0.051 0.043 0.042 0.054 0.049 0.050 0.039 0.041 0.062 0.125 0.048 0.035 0.049 0.152 0.068 0.082 0.078 0.076671 PIG IRON ETC 0.205 0.586 0.503 0.941 1.579 2.004 2.501 2.849 3.264 2.888 2.265 2.354 2.632 1.756 0.731 0.311 0.531 0.415 0.710 0.247 0.068 0.090 0.000672 IRON STL PRIMARY FORMS 0.000 0.000 0.000 0.000 0.000 0.000 0.000 0.000 0.000 0.000 0.000 0.000 0.030 0.143 0.000 0.000 0.001 0.039 0.000 0.000 0.001 0.041 0.000

673 IRON STEEL SHAPES 0.000 0.000 0.003 0.010 0.012 0.008 0.004 0.000 0.002 0.003 0.006 0.003 0.002 0.001 0.000 0.013 0.024 0.046 0.014 0.060 0.093 0.012 0.000674 IRN STL UNIV PLATE SHEET 0.093 0.337 0.422 0.494 0.025 0.001 0.001 0.000 0.001 0.000 0.001 0.158 0.120 0.234 0.176 0.093 0.084 0.085 0.051 0.079 0.094 0.047 0.012675 IRON STEEL HOOP STRIP 0.000 0.014 0.101 0.003 0.000 0.000 0.000 0.003 0.000 0.000 0.000 0.000 0.031 0.474 . . . . . . . . .676 RAILWY RAILS ETC IRN STL 0.000 0.000 0.000 0.000 0.000 0.000 0.000 0.000 0.000 0.000 0.000 0.000 0.000 0.000 0.000 0.000 0.000 0.000 0.039 0.000 0.025 0.000 0.000677 IRN STL WIRE EXCL W ROD 0.003 0.000 0.000 0.000 0.000 0.002 0.002 0.000 0.001 0.000 0.000 0.001 0.000 0.000 0.001 0.002 0.001 0.000 0.017 0.011 0.006 0.011 0.000678 IRON STL TUBES PIPES ETC 0.003 0.007 0.046 0.037 0.020 0.004 0.045 0.004 0.014 0.013 0.033 0.051 0.029 0.318 0.444 0.143 0.511 0.385 0.144 0.504 0.089 0.056 0.256679 IRN STL CASTINGS UNWORKD 0.158 0.337 0.456 0.560 0.839 0.623 0.391 0.440 0.400 0.274 0.333 0.174 0.158 0.079 0.386 0.304 0.550 0.434 0.093 0.271 0.313 0.241 0.125691 STRUCT PARTS NES 0.165 0.208 0.232 0.384 0.192 0.202 0.141 0.119 0.058 0.057 0.468 0.388 0.077 0.162 0.205 0.125 1.503 0.210 0.144 0.902 0.475 0.134 0.654692 METAL TANKS BOXES ETC 0.118 0.175 0.145 0.069 0.165 0.242 0.080 0.176 0.209 0.209 0.362 0.297 0.384 0.283 0.203 0.042 0.070 0.036 0.046 0.292 0.239 0.176 0.231693 WIRE PRODS NONELEC 0.341 0.649 0.415 0.306 0.501 1.028 0.076 0.087 0.034 0.022 0.022 0.014 0.088 0.047 0.047 0.026 0.029 0.025 0.008 0.027 0.072 0.094 0.000694 STEEL COPP NAILS ETC 0.010 0.002 0.000 0.003 0.001 0.004 0.001 0.005 0.004 0.005 0.011 0.005 0.011 0.151 0.376 0.055 0.028 0.100 0.232 0.267 0.205 0.122 0.238695 TOOLS 0.036 0.062 0.086 0.086 0.111 0.138 0.172 0.235 0.250 0.228 0.092 0.053 0.060 0.060 0.060 0.035 0.029 0.044 0.140 0.155 0.132 0.128 0.194696 CUTLERY 0.009 0.014 0.024 0.050 0.051 0.054 0.041 0.044 0.009 0.023 0.105 0.197 0.271 0.311 0.397 0.380 0.420 0.283 0.255 0.186 0.248 0.164 0.125697 BASE MTL HHOLD EQPT 0.029 0.045 0.028 0.027 0.026 0.017 0.019 0.018 0.038 0.026 0.036 0.032 0.041 0.093 0.429 0.683 0.738 0.689 0.956 0.843 0.736 0.607 0.529698 METAL MANUFACT NES 0.053 0.057 0.099 0.137 0.182 0.121 0.119 0.045 0.053 0.081 0.083 0.054 0.060 0.072 0.205 0.110 0.137 0.233 0.330 0.219 0.235 0.233 0.247711 POWER MACH NONELEC 0.007 0.007 0.003 0.002 0.005 0.005 0.003 0.001 0.004 0.001 0.002 0.002 0.001 0.004 0.070 0.016 0.011 0.017 0.155 0.124 0.087 0.073 0.040712 AGRIC MACH 0.001 0.000 0.014 0.047 0.005 0.001 0.004 0.003 0.016 0.006 0.003 0.007 0.000 0.005 0.009 0.002 0.000 0.001 0.001 0.020 0.013 0.022 0.000714 OFFICE MACH 0.001 0.010 0.031 0.013 0.004 0.033 0.011 0.009 0.004 0.036 0.055 0.079 0.195 0.236 0.995 0.518 0.462 0.414 2.126 2.755 3.215 2.899 4.433715 METAL WORK MACH 0.001 0.000 0.003 0.000 0.000 0.009 0.003 0.001 0.001 0.005 0.009 0.007 0.015 0.017 0.023 0.012 0.009 0.010 0.042 0.052 0.039 0.604 0.021717 TEXTL LEATHER MACH 0.117 0.077 0.067 0.073 0.043 0.062 0.038 0.021 0.008 0.010 0.005 0.005 0.006 0.015 0.040 0.032 0.027 0.033 0.061 0.123 0.085 0.043 0.029718 MACH FOR SPCL INDUST 0.063 0.043 0.048 0.045 0.042 0.173 0.050 0.048 0.042 0.042 0.049 0.072 0.055 0.057 0.059 0.033 0.038 0.044 0.092 0.154 0.108 0.094 0.048719 MACH NES NONELEC 0.049 0.060 0.017 0.014 0.012 0.017 0.021 0.019 0.018 0.014 0.012 0.021 0.027 0.033 0.083 0.042 0.050 0.054 0.080 0.155 0.122 0.146 0.103722 ELEC PWR MACH SWITCH 0.010 0.017 0.003 0.014 0.040 0.152 0.233 0.324 0.163 0.157 0.238 0.159 0.200 0.258 0.414 0.318 0.339 0.442 0.730 0.649 0.949 1.633 1.361723 ELEC DISTRIB MACH 0.009 0.028 0.095 0.140 0.118 0.049 0.081 0.001 0.001 0.012 0.008 2.217 3.628 4.769 4.812 5.333 5.022 6.330 5.402 4.240 3.846 2.614 3.079724 TELECOM EQPT 0.125 0.135 0.199 0.207 0.183 0.174 0.281 0.117 0.097 0.089 0.155 0.404 1.113 1.141 1.581 1.513 1.510 1.663 2.014 1.838 1.591 1.147 0.912725 DOMEST ELEC EQPT 0.002 0.000 0.005 0.004 0.002 0.002 0.009 0.102 0.305 0.251 0.262 0.270 0.213 0.287 0.296 0.425 0.329 0.402 0.257 0.328 0.256 0.158 0.121726 ELEC MEDCL XRAY EQPT 0.002 0.000 0.000 0.000 0.000 0.000 0.000 0.000 0.000 0.000 0.000 0.000 0.000 0.000 0.006 0.000 0.000 0.000 0.009 0.003 0.011 0.004 0.000729 ELEC MACH NES 0.299 0.279 0.168 0.442 0.684 0.817 1.311 2.165 1.835 2.002 2.173 1.863 1.777 1.470 4.361 1.672 1.707 1.724 4.195 5.496 6.200 7.810 5.761731 RAILWAY VEH 0.060 0.139 0.031 0.000 0.000 0.000 0.000 0.000 0.000 0.000 0.000 0.237 1.122 1.451 0.480 0.067 0.005 0.001 0.006 0.054 0.004 0.030 0.000732 ROAD MOTOR VEH 0.048 0.071 0.102 0.084 0.089 0.056 0.062 0.062 0.053 0.066 0.103 0.021 0.027 0.030 0.036 0.065 0.102 0.142 0.089 0.165 0.169 0.130 0.063733 ROAD VEH NONMTR 0.040 0.048 0.064 0.033 0.023 0.023 0.028 0.001 0.001 0.001 0.007 0.005 0.030 0.226 0.338 0.039 0.105 0.229 0.292 0.636 0.609 0.298 0.290734 AIRCRAFT 0.022 0.001 0.000 0.003 0.019 0.000 0.000 0.006 0.003 0.009 0.009 0.002 0.014 0.010 0.047 0.001 0.000 0.003 0.016 0.065 0.123 0.051 0.025735 SHIPS BOATS 0.022 0.049 0.026 0.044 0.020 0.017 0.010 0.007 0.018 0.016 0.037 0.004 0.004 0.007 0.012 0.001 0.002 0.014 0.385 0.034 0.518 0.075 0.053812 PLUMB HEAT LGHT EQPT 0.229 0.467 0.357 0.029 0.039 0.056 0.045 0.039 0.039 0.065 0.058 0.120 0.141 0.136 0.441 0.400 0.420 0.425 0.843 0.335 0.272 0.230 0.625821 FURNITURE 1.254 1.278 1.958 0.055 0.056 0.058 0.046 0.041 0.044 0.091 0.090 0.124 0.142 0.195 2.158 1.927 1.877 1.885 1.861 1.513 1.314 1.047 1.182831 TRAVEL GOODS HBAGS 1.359 1.582 1.038 0.101 0.127 0.144 0.097 0.089 0.107 0.197 0.202 0.189 0.203 0.236 3.215 2.520 2.252 2.625 3.794 4.012 4.138 3.964 3.905841 CLOTH NOT FUR 1.857 2.295 2.357 0.273 0.308 0.333 0.362 0.347 0.390 0.649 0.789 0.878 0.859 0.987 6.304 2.485 2.223 2.085 3.964 3.770 2.845 2.319 2.024842 FUR ETC CLOTHES PROD 0.000 . . 0.077 0.083 0.069 0.063 0.045 0.070 0.064 0.068 0.071 0.058 0.052 0.000 0.003 0.004 0.054 0.049 0.036 0.004 0.007 0.000851 FOOT WEAR 0.544 1.462 1.642 0.077 0.090 0.119 0.083 0.069 0.086 0.119 0.127 0.151 0.172 0.192 1.852 1.489 1.559 1.730 1.764 1.200 1.122 0.740 0.515861 INSTR APPARAT 0.013 0.202 0.161 0.018 0.027 0.031 0.026 0.019 0.022 0.029 0.028 0.044 0.043 0.050 0.206 0.094 0.116 0.176 1.018 0.630 0.494 0.416 0.879862 PHOTO CINEMA SUPPLIES 0.000 0.016 0.001 0.013 0.012 0.011 0.010 0.009 0.012 0.051 0.011 0.017 0.012 0.014 0.002 0.001 0.005 0.011 0.007 0.003 0.024 0.008 0.000863 DEVEL CINEMA FILM 0.102 0.078 0.106 0.097 0.136 0.218 0.157 0.066 0.145 0.085 0.085 0.078 0.115 0.086 4.957 5.985 5.180 7.669 5.068 6.545 2.684 2.576 2.323864 WATCHES CLOCKS 0.168 0.529 0.667 0.008 0.010 0.015 0.026 0.032 0.041 0.110 0.149 0.165 0.114 0.128 1.662 0.009 0.017 0.014 3.964 2.219 1.350 1.383 2.074891 SOUND RECORDERS 0.082 0.064 0.040 0.011 0.010 0.007 0.008 0.011 0.013 0.009 0.006 0.006 0.010 0.011 0.315 0.275 0.225 0.191 0.575 0.234 0.195 0.218 0.410892 PRINTED MATTER 0.036 0.033 0.025 0.044 0.055 0.061 0.073 0.078 0.054 0.088 0.058 0.061 0.075 0.068 0.045 0.043 0.055 0.071 0.088 0.056 0.068 0.074 0.083893 PLASTIC NES 0.194 0.305 0.422 0.049 0.055 0.060 0.050 0.037 0.037 0.050 0.052 0.049 0.057 0.063 0.462 0.394 0.387 0.390 0.619 0.548 0.463 0.367 0.355894 TOYS SPORTING GOODS ETC 0.291 0.788 0.793 0.020 0.021 0.020 0.026 0.025 0.037 0.037 0.036 0.038 0.041 0.045 2.139 1.830 1.812 1.972 1.973 1.902 1.421 1.038 0.921895 OFFICE SUPPLIES NES 0.017 0.033 0.015 0.034 0.050 0.045 0.037 0.026 0.060 0.088 0.084 0.087 0.081 0.084 0.018 0.046 0.075 0.176 0.133 0.768 0.086 0.029 0.071896 WORKS ART ETC 0.036 0.028 0.014 0.053 0.108 0.108 0.077 0.155 0.905 0.138 0.134 0.131 0.078 0.080 0.006 0.006 0.016 0.022 0.047 0.051 0.112 0.013 0.167897 GOLD SILVER JEWELRY 0.519 0.777 0.938 0.029 0.022 0.025 0.020 0.027 0.028 0.063 0.058 0.100 0.104 0.126 1.029 0.977 1.075 0.835 0.435 0.303 0.188 0.174 0.237899 OTHER MANUFACT GOODS 5.225 5.284 5.691 5.853 6.023 6.106 6.224 5.762 6.642 7.047 7.526 6.923 7.133 6.715 6.471 5.490 4.850 4.299 3.195 2.536 2.035 1.507 1.079931 SPECL TRANSACTS 9.846 13.627 12.636 9.512 13.839 18.207 16.131 18.277 24.581 20.556 16.174 15.604 13.715 18.437 0.008 16.804 15.471 18.919 0.271 0.000 0.010 0.008 0.639941 ZOO ANIMALS PETS 0.448 0.574 0.672 1.809 1.125 1.012 1.744 1.985 2.530 2.681 3.239 1.839 1.291 0.965 2.864 2.235 1.968 2.726 2.345 0.959 0.970 0.801 1.000951 WAR FIREARMS AMMUN 0.053 0.018 0.010 0.011 0.021 0.006 0.003 0.007 0.005 0.006 0.024 0.004 0.011 0.075 0.043 0.042 0.035 0.024 0.063 0.037 0.034 0.012 0.100961 COIN NONGOLD NONCUR 0.020 0.000 0.000 0.031 0.000 0.000 0.060 2.206 3.457 0.000 0.000 0.000 0.000 0.060 0.000 . . 0.030 0.000 0.015 12.865 17.752 0.000
MANUFACTURING 0.424 0.541 0.590 0.652 0.776 0.838 0.824 0.882 0.877 0.797 0.858 0.835 0.891 0.938 0.937 0.966 1.000 1.025 0.993 1.088 1.116 1.129 1.133
Source: NAPES database
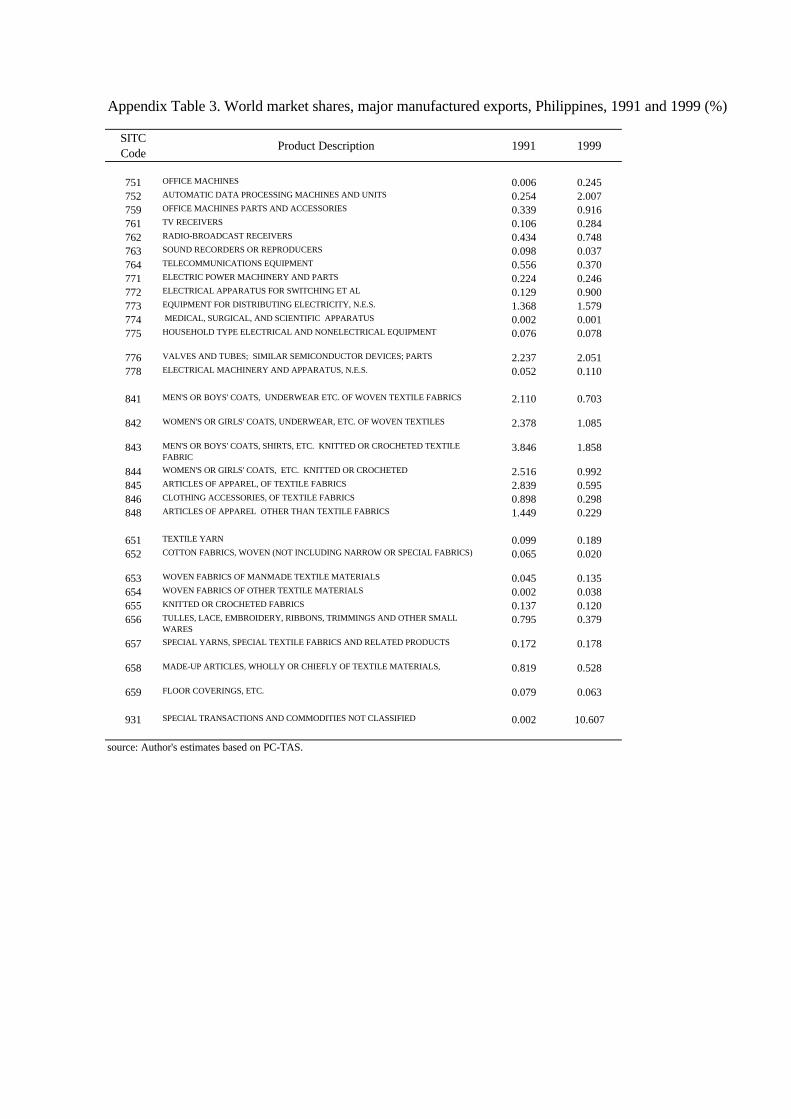
Appendix Table 3. World market shares, major manufactured exports, Philippines, 1991 and 1999 (%)
SITC Code
Product Description 1991 1999
751 OFFICE MACHINES 0.006 0.245752 AUTOMATIC DATA PROCESSING MACHINES AND UNITS 0.254 2.007759 OFFICE MACHINES PARTS AND ACCESSORIES 0.339 0.916761 TV RECEIVERS 0.106 0.284762 RADIO-BROADCAST RECEIVERS 0.434 0.748763 SOUND RECORDERS OR REPRODUCERS 0.098 0.037764 TELECOMMUNICATIONS EQUIPMENT 0.556 0.370771 ELECTRIC POWER MACHINERY AND PARTS 0.224 0.246772 ELECTRICAL APPARATUS FOR SWITCHING ET AL 0.129 0.900773 EQUIPMENT FOR DISTRIBUTING ELECTRICITY, N.E.S. 1.368 1.579774 MEDICAL, SURGICAL, AND SCIENTIFIC APPARATUS 0.002 0.001775 HOUSEHOLD TYPE ELECTRICAL AND NONELECTRICAL EQUIPMENT 0.076 0.078
776 VALVES AND TUBES; SIMILAR SEMICONDUCTOR DEVICES; PARTS 2.237 2.051778 ELECTRICAL MACHINERY AND APPARATUS, N.E.S. 0.052 0.110
841 MEN'S OR BOYS' COATS, UNDERWEAR ETC. OF WOVEN TEXTILE FABRICS 2.110 0.703
842 WOMEN'S OR GIRLS' COATS, UNDERWEAR, ETC. OF WOVEN TEXTILES 2.378 1.085
843 MEN'S OR BOYS' COATS, SHIRTS, ETC. KNITTED OR CROCHETED TEXTILE FABRIC
3.846 1.858
844 WOMEN'S OR GIRLS' COATS, ETC. KNITTED OR CROCHETED 2.516 0.992845 ARTICLES OF APPAREL, OF TEXTILE FABRICS 2.839 0.595846 CLOTHING ACCESSORIES, OF TEXTILE FABRICS 0.898 0.298848 ARTICLES OF APPAREL OTHER THAN TEXTILE FABRICS 1.449 0.229
651 TEXTILE YARN 0.099 0.189652 COTTON FABRICS, WOVEN (NOT INCLUDING NARROW OR SPECIAL FABRICS) 0.065 0.020
653 WOVEN FABRICS OF MANMADE TEXTILE MATERIALS 0.045 0.135654 WOVEN FABRICS OF OTHER TEXTILE MATERIALS 0.002 0.038655 KNITTED OR CROCHETED FABRICS 0.137 0.120656 TULLES, LACE, EMBROIDERY, RIBBONS, TRIMMINGS AND OTHER SMALL
WARES0.795 0.379
657 SPECIAL YARNS, SPECIAL TEXTILE FABRICS AND RELATED PRODUCTS 0.172 0.178
658 MADE-UP ARTICLES, WHOLLY OR CHIEFLY OF TEXTILE MATERIALS, 0.819 0.528
659 FLOOR COVERINGS, ETC. 0.079 0.063
931 SPECIAL TRANSACTIONS AND COMMODITIES NOT CLASSIFIED 0.002 10.607
source: Author's estimates based on PC-TAS.
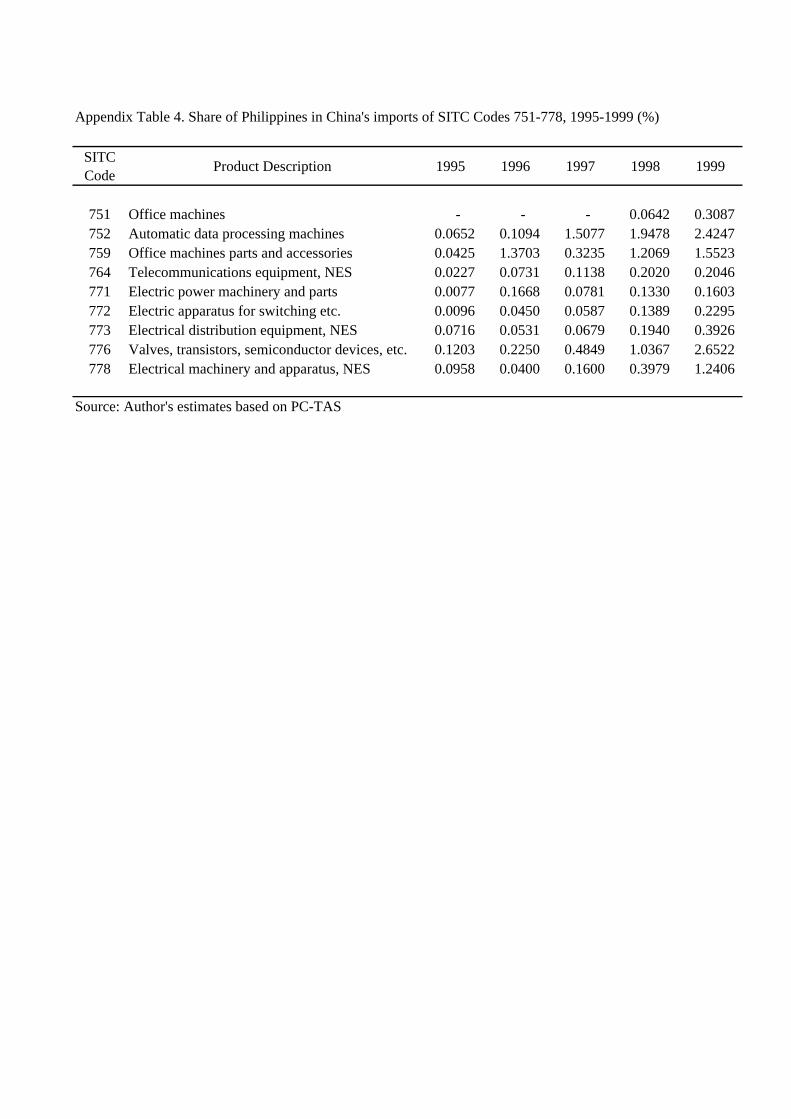
Appendix Table 4. Share of Philippines in China's imports of SITC Codes 751-778, 1995-1999 (%)
SITC Code
Product Description 1995 1996 1997 1998 1999
751 Office machines - - - 0.0642 0.3087 752 Automatic data processing machines 0.0652 0.1094 1.5077 1.9478 2.4247 759 Office machines parts and accessories 0.0425 1.3703 0.3235 1.2069 1.5523 764 Telecommunications equipment, NES 0.0227 0.0731 0.1138 0.2020 0.2046 771 Electric power machinery and parts 0.0077 0.1668 0.0781 0.1330 0.1603 772 Electric apparatus for switching etc. 0.0096 0.0450 0.0587 0.1389 0.2295 773 Electrical distribution equipment, NES 0.0716 0.0531 0.0679 0.1940 0.3926 776 Valves, transistors, semiconductor devices, etc. 0.1203 0.2250 0.4849 1.0367 2.6522 778 Electrical machinery and apparatus, NES 0.0958 0.0400 0.1600 0.3979 1.2406
Source: Author's estimates based on PC-TAS

Appendix Table 5. Intra-industry trade index by commodity, by partner countries, Philippines, 1990, 1995, and 1999 (%)
1990 1995 1999 1990 1995 1999 1990 1995 1999 1990 1995 1999
711 Power machinery non-electric 0.48 0.01 0.11 0.00 0.00 0.02 0.00 0.04 0.10 0.01 0.09 0.77712 Agricultural machinery 0.00 0.00 0.01 0.00 0.00 0.00 0.00 0.04 0.10 0.00 . 0.00714 Office machines 0.14 0.94 0.22 0.82 0.23 0.02 0.00 0.23 0.70 0.91 0.94 0.51715 Metalworking machinery 0.07 0.00 0.01 0.00 0.03 . 0.00 0.53 0.11 0.00 0.18 0.07717 Textile, leather machinery 0.22 0.98 0.39 0.00 0.00 0.86 0.03 0.23 0.20 0.03 0.08 0.09718 Machines for special industries 0.07 0.01 0.30 0.48 0.03 0.04 0.03 0.44 0.45 0.72 0.32 0.68719 Machines NES non-electric 0.02 0.11 0.41 0.49 0.28 0.41 0.05 0.23 0.16 0.28 0.15 0.74722 Elec power machine, switchgear 0.02 0.50 0.92 0.07 0.96 0.06 0.00 0.03 0.58 0.76 0.29 0.30723 Elec distributing machine 0.97 0.08 0.03 0.00 0.50 0.02 0.00 0.32 0.91 0.43 0.46 0.29724 Telecommunications equipment 0.60 0.57 0.84 0.77 0.80 0.36 0.00 0.09 0.40 0.42 0.60 0.88725 Domestic electric equipment 0.59 0.00 0.07 . 0.15 0.38 0.00 0.01 0.00 0.96 0.11 0.09726 Electro medical, x-ray equipment 0.00 0.07 0.04 . 0.57 . 0.00 0.00 0.14 0.00 0.78 0.08729 Electrical machinery NES 0.33 0.46 0.19 0.36 0.11 0.11 0.14 0.78 0.95 0.59 0.68 0.50731 Railway vehicles 0.00 0.07 0.00 0.00 0.00 0.00 0.00 0.00 0.00 0.00 0.00 0.00732 Road motor vehicles 0.41 0.73 0.31 0.00 0.33 0.55 0.00 0.06 0.01 0.68 0.68 0.02733 Road vehicles non-motor 0.06 0.32 0.14 0.00 0.00 0.00 0.00 0.00 0.00 0.00 0.07 0.02734 Aircraft 0.19 0.03 0.55 0.00 0.00 0.01 . . 0.05 0.00 0.28 0.98735 Ships and boats . 0.04 0.03 . 0.00 0.00 . 0.00 0.00 0.00 0.00 0.00812 Plumbing, heating, lighting equipment 0.22 0.23 0.63 0.00 0.61 0.13 0.00 0.28 0.02 0.87 0.57 0.04821 Furniture 0.00 0.11 0.12 0.01 0.13 0.09 0.00 0.20 0.04 0.46 0.49 0.26831 Travel goods, handbags 0.01 0.00 0.02 0.00 0.00 0.00 0.00 0.00 0.00 0.57 0.10 0.17841 Clothing not of fur 0.01 0.08 0.07 0.00 0.00 0.00 0.31 0.10 0.21 0.61 0.38 0.78842 Fur etc clothes, products . . 0.00 . 0.00 0.00 . 0.00 0.00 0.00 . .851 Footwear 0.01 0.01 0.01 0.00 0.00 0.00 0.00 0.00 0.00 0.14 0.32 0.06861 Instruments, apparatus 0.96 0.65 0.54 0.86 0.32 0.17 0.00 0.26 0.51 0.68 0.96 0.80862 Photo, cinema supplies 0.00 0.00 0.00 . . . 0.00 0.00 0.00 0.60 0.01 0.12863 Developed cinema film 0.00 0.00 0.07 . 0.00 . 0.00 0.04 0.00864 Watches and clocks 0.00 0.25 0.08 . 0.03 0.00 0.00 0.02 0.00 0.00 0.86 0.41891 Sound recorders, producers 0.33 0.11 0.28 0.10 0.46 0.07 0.00 0.03 0.68 0.07 0.12 0.97892 Printed matter 0.04 0.08 0.26 0.10 0.11 0.87 0.10 0.55 0.21 0.01 0.05 0.08893 Articles of plastic, NES 0.27 0.84 0.88 0.31 0.93 0.68 0.88 0.20 0.19 0.26 0.19 0.17894 Toys, sporting goods, etc. 0.17 0.19 0.44 0.02 0.08 0.11 0.57 0.10 0.06 0.57 0.12 0.12895 Office supplies NES 0.25 0.51 0.22 0.21 0.00 0.00 . 0.02 0.02 0.27 0.12 0.27896 Works of arts, etc 0.00 0.00 0.41 . 1.00 0.00 . 0.00 0.00 . 0.69 0.13897 Gold, silverware, jewelry 0.01 0.05 0.19 0.06 0.02 0.00 0.00 0.74 0.00 0.52 0.08 0.03899 Other manufactured goods 0.12 0.08 0.23 0.01 0.01 0.04 0.01 0.13 0.01 0.20 0.21 0.11931 Special transactions 0.57 0.03 0.00 0.39 0.68 0.10 0.07 0.03 0.00 0.55 0.55 0.77
CHINA HONG KONGSITC Code
Description AUSTRALIA CANADA
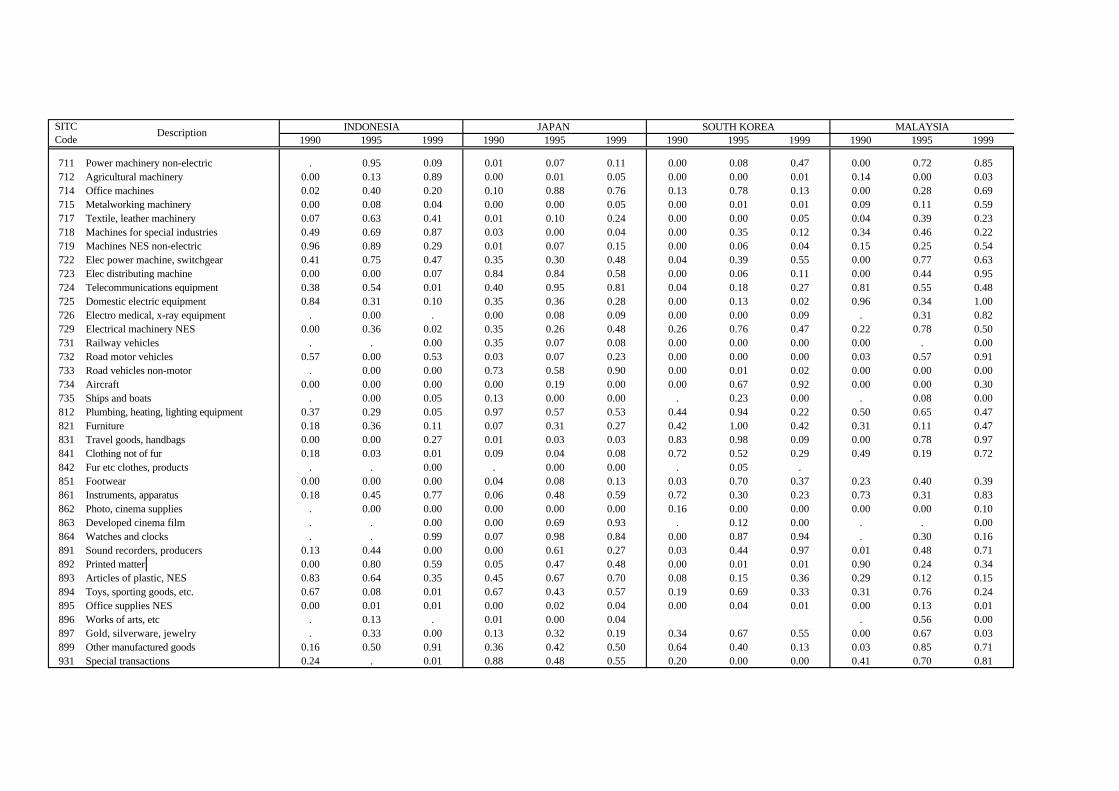
1990 1995 1999 1990 1995 1999 1990 1995 1999 1990 1995 1999
711 Power machinery non-electric . 0.95 0.09 0.01 0.07 0.11 0.00 0.08 0.47 0.00 0.72 0.85712 Agricultural machinery 0.00 0.13 0.89 0.00 0.01 0.05 0.00 0.00 0.01 0.14 0.00 0.03714 Office machines 0.02 0.40 0.20 0.10 0.88 0.76 0.13 0.78 0.13 0.00 0.28 0.69715 Metalworking machinery 0.00 0.08 0.04 0.00 0.00 0.05 0.00 0.01 0.01 0.09 0.11 0.59717 Textile, leather machinery 0.07 0.63 0.41 0.01 0.10 0.24 0.00 0.00 0.05 0.04 0.39 0.23718 Machines for special industries 0.49 0.69 0.87 0.03 0.00 0.04 0.00 0.35 0.12 0.34 0.46 0.22719 Machines NES non-electric 0.96 0.89 0.29 0.01 0.07 0.15 0.00 0.06 0.04 0.15 0.25 0.54722 Elec power machine, switchgear 0.41 0.75 0.47 0.35 0.30 0.48 0.04 0.39 0.55 0.00 0.77 0.63723 Elec distributing machine 0.00 0.00 0.07 0.84 0.84 0.58 0.00 0.06 0.11 0.00 0.44 0.95724 Telecommunications equipment 0.38 0.54 0.01 0.40 0.95 0.81 0.04 0.18 0.27 0.81 0.55 0.48725 Domestic electric equipment 0.84 0.31 0.10 0.35 0.36 0.28 0.00 0.13 0.02 0.96 0.34 1.00726 Electro medical, x-ray equipment . 0.00 . 0.00 0.08 0.09 0.00 0.00 0.09 . 0.31 0.82729 Electrical machinery NES 0.00 0.36 0.02 0.35 0.26 0.48 0.26 0.76 0.47 0.22 0.78 0.50731 Railway vehicles . . 0.00 0.35 0.07 0.08 0.00 0.00 0.00 0.00 . 0.00732 Road motor vehicles 0.57 0.00 0.53 0.03 0.07 0.23 0.00 0.00 0.00 0.03 0.57 0.91733 Road vehicles non-motor . 0.00 0.00 0.73 0.58 0.90 0.00 0.01 0.02 0.00 0.00 0.00734 0.00 0.00 0.00 0.00 0.19 0.00 0.00 0.67 0.92 0.00 0.00 0.30735 Ships and boats . 0.00 0.05 0.13 0.00 0.00 . 0.23 0.00 . 0.08 0.00812 Plumbing, heating, lighting equipment 0.37 0.29 0.05 0.97 0.57 0.53 0.44 0.94 0.22 0.50 0.65 0.47821 0.18 0.36 0.11 0.07 0.31 0.27 0.42 1.00 0.42 0.31 0.11 0.47831 Travel goods, handbags 0.00 0.00 0.27 0.01 0.03 0.03 0.83 0.98 0.09 0.00 0.78 0.97841 Clothing not of fur 0.18 0.03 0.01 0.09 0.04 0.08 0.72 0.52 0.29 0.49 0.19 0.72842 Fur etc clothes, products . . 0.00 . 0.00 0.00 . 0.05 .851 0.00 0.00 0.00 0.04 0.08 0.13 0.03 0.70 0.37 0.23 0.40 0.39861 Instruments, apparatus 0.18 0.45 0.77 0.06 0.48 0.59 0.72 0.30 0.23 0.73 0.31 0.83862 Photo, cinema supplies . 0.00 0.00 0.00 0.00 0.00 0.16 0.00 0.00 0.00 0.00 0.10863 Developed cinema film . . 0.00 0.00 0.69 0.93 . 0.12 0.00 . . 0.00864 Watches and clocks . . 0.99 0.07 0.98 0.84 0.00 0.87 0.94 . 0.30 0.16891 Sound recorders, producers 0.13 0.44 0.00 0.00 0.61 0.27 0.03 0.44 0.97 0.01 0.48 0.71892 Printed matter 0.00 0.80 0.59 0.05 0.47 0.48 0.00 0.01 0.01 0.90 0.24 0.34893 Articles of plastic, NES 0.83 0.64 0.35 0.45 0.67 0.70 0.08 0.15 0.36 0.29 0.12 0.15894 Toys, sporting goods, etc. 0.67 0.08 0.01 0.67 0.43 0.57 0.19 0.69 0.33 0.31 0.76 0.24895 Office supplies NES 0.00 0.01 0.01 0.00 0.02 0.04 0.00 0.04 0.01 0.00 0.13 0.01896 Works of arts, etc . 0.13 . 0.01 0.00 0.04 . 0.56 0.00897 Gold, silverware, jewelry . 0.33 0.00 0.13 0.32 0.19 0.34 0.67 0.55 0.00 0.67 0.03899 Other manufactured goods 0.16 0.50 0.91 0.36 0.42 0.50 0.64 0.40 0.13 0.03 0.85 0.71931 Special transactions 0.24 . 0.01 0.88 0.48 0.55 0.20 0.00 0.00 0.41 0.70 0.81
INDONESIA JAPAN SITC Code
Description MALAYSIASOUTH KOREA
Aircraft
Furniture
Footwear

1990 1995 1999 1990 1995 1999 1990 1995 1999
711 Power machinery non-electric 0.00 0.00 0.00 0.00 0.23 0.04712 Agricultural machinery . 0.00 0.00 0.00 0.00 0.06714 Office machines 0.00 0.00 0.01 0.00 0.13 0.05 0.42 0.95 0.70715 Metalworking machinery . . 0.00 0.00 0.00 0.00 0.10 0.03 0.19717 Textile, leather machinery . 0.00 0.00 0.00 0.00 . 0.00 0.02 0.03718 Machines for special industries 0.00 0.32 0.09 0.24 0.05 0.00 0.15 0.37 0.12719 Machines NES non-electric 0.00 0.62 0.61 0.00 0.10 0.18 0.02 0.05 0.26722 Elec power machine, switchgear 0.00 0.02 0.01 0.00 0.06 0.94 0.12 0.71 0.68723 Elec distributing machine 0.08 0.01 0.00 0.00 0.00 0.44 0.00 0.41 0.65724 Telecommunications equipment 0.00 0.01 0.00 0.92 0.42 0.74 0.50 0.52 0.52725 Domestic electric equipment . 0.97 0.77 0.00 0.00 0.00 0.67 0.61 0.80726 Electro medical, x-ray equipment . 0.00 . . . . 0.00 0.00 0.10729 Electrical machinery NES 0.00 0.01 0.01 0.39 0.10 0.06 0.94 0.66 0.62731 Railway vehicles 0.03 0.00 0.00732 Road motor vehicles 0.00 0.00 0.00 0.75 0.22 0.89 0.07 0.03 0.07733 Road vehicles non-motor . . 0.00 . 0.00 0.00 0.00 0.00 0.08734 0.00 0.00 0.00 0.00 0.20 0.54735 Ships and boats . 0.29 0.00 0.00 0.68 0.15812 Plumbing, heating, lighting equipment . 0.00 0.18 . 0.41 0.00 0.00 0.12 0.24821 0.00 0.00 0.03 0.00 0.04 0.01 0.85 0.84 0.98831 Travel goods, handbags . 0.00 0.00 0.00 0.03 0.00 0.33 0.60 0.60841 Clothing not of fur 0.00 0.00 0.00 0.00 0.00 0.00 0.53 0.29 0.54842 Fur etc clothes, products . 0.00 .851 0.00 0.00 0.00 0.00 0.00 0.00 0.01 0.57 0.76861 Instruments, apparatus 0.00 0.09 0.02 0.20 0.71 0.11 0.47 0.41 0.67862 Photo, cinema supplies 0.00 0.00 0.00 . 0.00 0.00 0.00 0.00 0.00863 Developed cinema film . 0.00 0.00 . 0.00 . . 0.00 0.50864 Watches and clocks . 0.00 0.00 . 0.13 0.18 0.00 0.84 0.11891 Sound recorders, producers 0.03 0.00 0.00 0.00 0.60 0.22 0.05 0.86 0.86892 Printed matter . 0.00 0.01 0.50 0.55 0.88 0.13 0.10 0.09893 Articles of plastic, NES 0.36 0.12 0.98 0.07 0.41 0.65 0.21 0.25 0.19894 Toys, sporting goods, etc. 0.00 0.00 0.00 0.00 0.00 0.06 0.48 0.59 0.65895 Office supplies NES . 0.00 0.00 . 0.57 0.00 0.09 0.09 0.00896 Works of arts, etc . 0.40 0.00 . 0.00 0.09 0.00 0.15 0.90897 Gold, silverware, jewelry 0.00 0.00 0.15 0.00 0.00 0.00 0.14 0.02 0.75899 Other manufactured goods 0.00 0.16 0.00 0.01 0.00 0.08 0.62 0.81 0.72931 Special transactions 0.26 0.20 0.00 0.49 . 0.00 0.73 0.10 0.11
NEW ZEALAND SINGAPORESITC Code
Description MEXICO
Aircraft
Furniture
Footwear
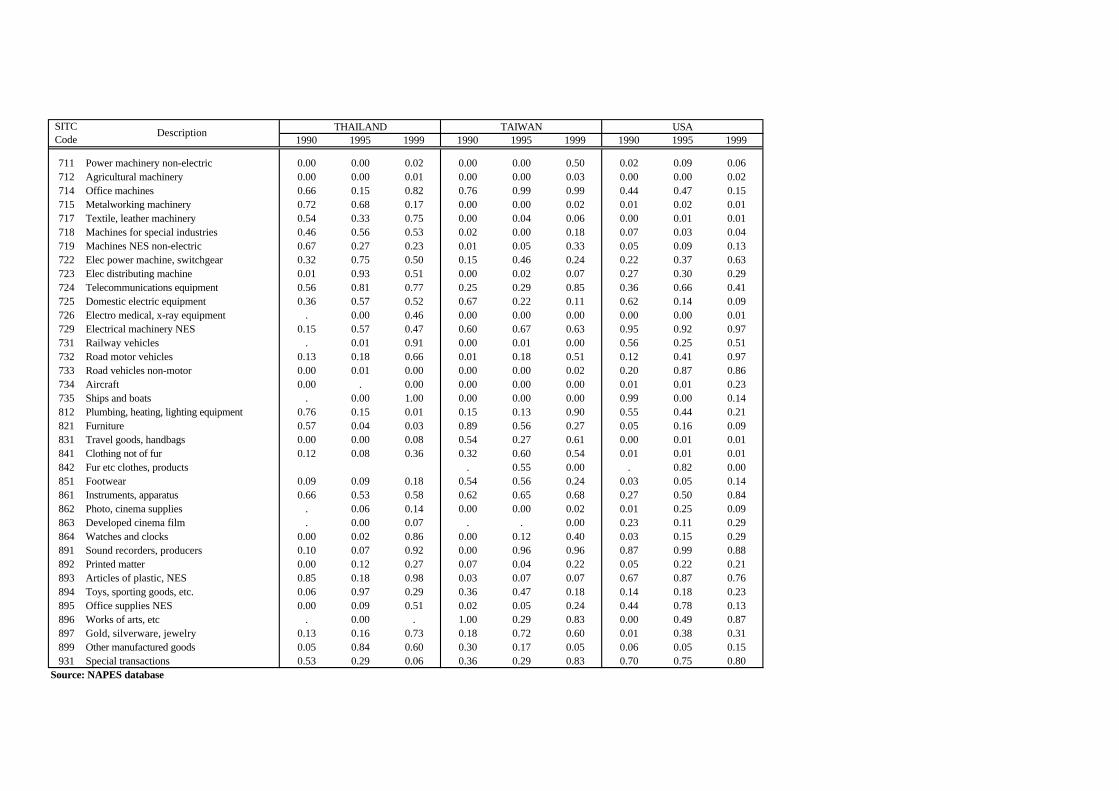
1990 1995 1999 1990 1995 1999 1990 1995 1999
711 Power machinery non-electric 0.00 0.00 0.02 0.00 0.00 0.50 0.02 0.09 0.06712 Agricultural machinery 0.00 0.00 0.01 0.00 0.00 0.03 0.00 0.00 0.02714 0.66 0.15 0.82 0.76 0.99 0.99 0.44 0.47 0.15715 Metalworking machinery 0.72 0.68 0.17 0.00 0.00 0.02 0.01 0.02 0.01717 Textile, leather machinery 0.54 0.33 0.75 0.00 0.04 0.06 0.00 0.01 0.01718 Machines for special industries 0.46 0.56 0.53 0.02 0.00 0.18 0.07 0.03 0.04719 Machines NES non-electric 0.67 0.27 0.23 0.01 0.05 0.33 0.05 0.09 0.13722 Elec power machine, switchgear 0.32 0.75 0.50 0.15 0.46 0.24 0.22 0.37 0.63723 Elec distributing machine 0.01 0.93 0.51 0.00 0.02 0.07 0.27 0.30 0.29724 Telecommunications equipment 0.56 0.81 0.77 0.25 0.29 0.85 0.36 0.66 0.41725 Domestic electric equipment 0.36 0.57 0.52 0.67 0.22 0.11 0.62 0.14 0.09726 Electro medical, x-ray equipment . 0.00 0.46 0.00 0.00 0.00 0.00 0.00 0.01729 Electrical machinery NES 0.15 0.57 0.47 0.60 0.67 0.63 0.95 0.92 0.97731 Railway vehicles . 0.01 0.91 0.00 0.01 0.00 0.56 0.25 0.51732 Road motor vehicles 0.13 0.18 0.66 0.01 0.18 0.51 0.12 0.41 0.97733 Road vehicles non-motor 0.00 0.01 0.00 0.00 0.00 0.02 0.20 0.87 0.86734 0.00 . 0.00 0.00 0.00 0.00 0.01 0.01 0.23735 . 0.00 1.00 0.00 0.00 0.00 0.99 0.00 0.14812 Plumbing, heating, lighting equipment 0.76 0.15 0.01 0.15 0.13 0.90 0.55 0.44 0.21821 0.57 0.04 0.03 0.89 0.56 0.27 0.05 0.16 0.09831 Travel goods, handbags 0.00 0.00 0.08 0.54 0.27 0.61 0.00 0.01 0.01841 Clothing not of fur 0.12 0.08 0.36 0.32 0.60 0.54 0.01 0.01 0.01842 Fur etc clothes, products . 0.55 0.00 . 0.82 0.00851 0.09 0.09 0.18 0.54 0.56 0.24 0.03 0.05 0.14861 Instruments, apparatus 0.66 0.53 0.58 0.62 0.65 0.68 0.27 0.50 0.84862 Photo, cinema supplies . 0.06 0.14 0.00 0.00 0.02 0.01 0.25 0.09863 Developed cinema film . 0.00 0.07 . . 0.00 0.23 0.11 0.29864 Watches and clocks 0.00 0.02 0.86 0.00 0.12 0.40 0.03 0.15 0.29891 Sound recorders, producers 0.10 0.07 0.92 0.00 0.96 0.96 0.87 0.99 0.88892 0.00 0.12 0.27 0.07 0.04 0.22 0.05 0.22 0.21893 Articles of plastic, NES 0.85 0.18 0.98 0.03 0.07 0.07 0.67 0.87 0.76894 Toys, sporting goods, etc. 0.06 0.97 0.29 0.36 0.47 0.18 0.14 0.18 0.23895 Office supplies NES 0.00 0.09 0.51 0.02 0.05 0.24 0.44 0.78 0.13896 Works of arts, etc . 0.00 . 1.00 0.29 0.83 0.00 0.49 0.87897 Gold, silverware, jewelry 0.13 0.16 0.73 0.18 0.72 0.60 0.01 0.38 0.31899 Other manufactured goods 0.05 0.84 0.60 0.30 0.17 0.05 0.06 0.05 0.15931 Special transactions 0.53 0.29 0.06 0.36 0.29 0.83 0.70 0.75 0.80
Source: NAPES database
USATHAILAND TAIWANDescriptionSITC Code
Office machines
Ships and boatsAircraft
Printed matter
Furniture
Footwear
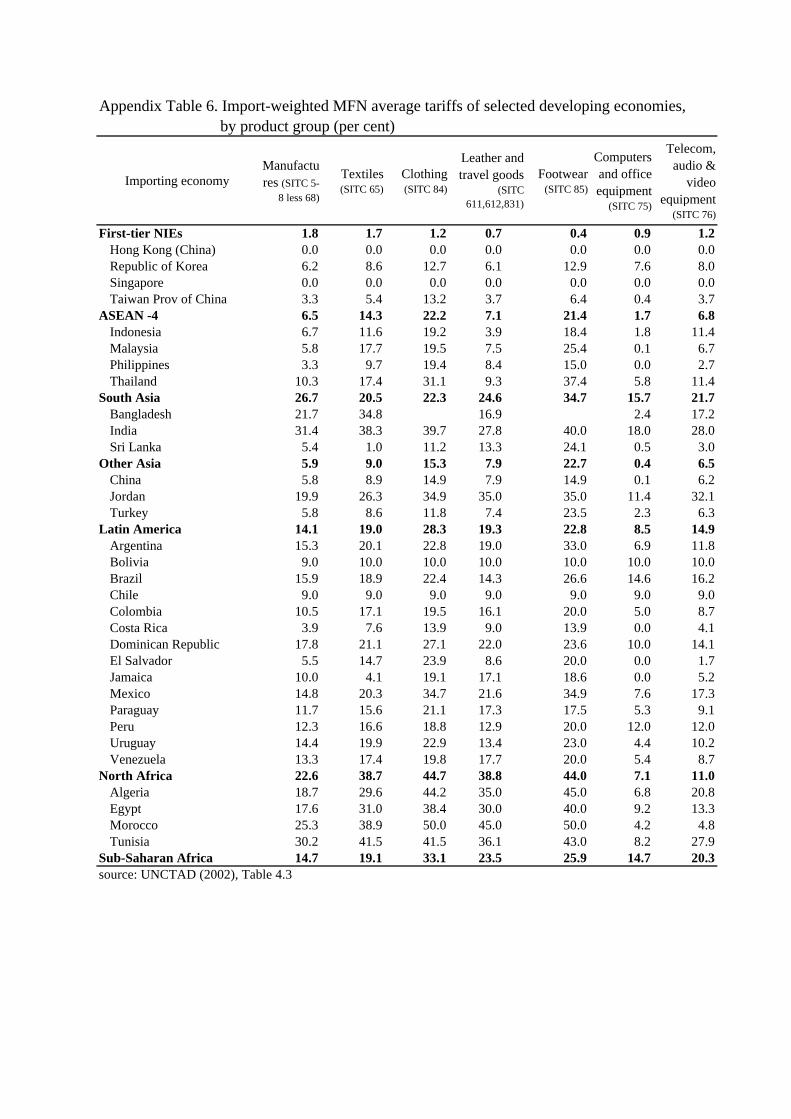
Appendix Table 6. Import-weighted MFN average tariffs of selected developing economies, by product group (per cent)
Importing economyManufactures (SITC 5-
8 less 68)
Textiles (SITC 65)
Clothing (SITC 84)
Footwear (SITC 85)
Computers and office equipment
(SITC 75)
Telecom, audio &
video equipment
(SITC 76)
First-tier NIEs 1.8 1.7 1.2 0.7 0.4 0.9 1.2Hong Kong (China) 0.0 0.0 0.0 0.0 0.0 0.0 0.0Republic of Korea 6.2 8.6 12.7 6.1 12.9 7.6 8.0Singapore 0.0 0.0 0.0 0.0 0.0 0.0 0.0Taiwan Prov of China 3.3 5.4 13.2 3.7 6.4 0.4 3.7
ASEAN -4 6.5 14.3 22.2 7.1 21.4 1.7 6.8Indonesia 6.7 11.6 19.2 3.9 18.4 1.8 11.4Malaysia 5.8 17.7 19.5 7.5 25.4 0.1 6.7Philippines 3.3 9.7 19.4 8.4 15.0 0.0 2.7Thailand 10.3 17.4 31.1 9.3 37.4 5.8 11.4
South Asia 26.7 20.5 22.3 24.6 34.7 15.7 21.7Bangladesh 21.7 34.8 16.9 2.4 17.2India 31.4 38.3 39.7 27.8 40.0 18.0 28.0Sri Lanka 5.4 1.0 11.2 13.3 24.1 0.5 3.0
Other Asia 5.9 9.0 15.3 7.9 22.7 0.4 6.5China 5.8 8.9 14.9 7.9 14.9 0.1 6.2Jordan 19.9 26.3 34.9 35.0 35.0 11.4 32.1Turkey 5.8 8.6 11.8 7.4 23.5 2.3 6.3
Latin America 14.1 19.0 28.3 19.3 22.8 8.5 14.9Argentina 15.3 20.1 22.8 19.0 33.0 6.9 11.8Bolivia 9.0 10.0 10.0 10.0 10.0 10.0 10.0Brazil 15.9 18.9 22.4 14.3 26.6 14.6 16.2Chile 9.0 9.0 9.0 9.0 9.0 9.0 9.0Colombia 10.5 17.1 19.5 16.1 20.0 5.0 8.7Costa Rica 3.9 7.6 13.9 9.0 13.9 0.0 4.1Dominican Republic 17.8 21.1 27.1 22.0 23.6 10.0 14.1El Salvador 5.5 14.7 23.9 8.6 20.0 0.0 1.7Jamaica 10.0 4.1 19.1 17.1 18.6 0.0 5.2Mexico 14.8 20.3 34.7 21.6 34.9 7.6 17.3Paraguay 11.7 15.6 21.1 17.3 17.5 5.3 9.1Peru 12.3 16.6 18.8 12.9 20.0 12.0 12.0Uruguay 14.4 19.9 22.9 13.4 23.0 4.4 10.2Venezuela 13.3 17.4 19.8 17.7 20.0 5.4 8.7
North Africa 22.6 38.7 44.7 38.8 44.0 7.1 11.0Algeria 18.7 29.6 44.2 35.0 45.0 6.8 20.8Egypt 17.6 31.0 38.4 30.0 40.0 9.2 13.3Morocco 25.3 38.9 50.0 45.0 50.0 4.2 4.8Tunisia 30.2 41.5 41.5 36.1 43.0 8.2 27.9
Sub-Saharan Africa 14.7 19.1 33.1 23.5 25.9 14.7 20.3source: UNCTAD (2002), Table 4.3
Leather and travel goods
(SITC 611,612,831)
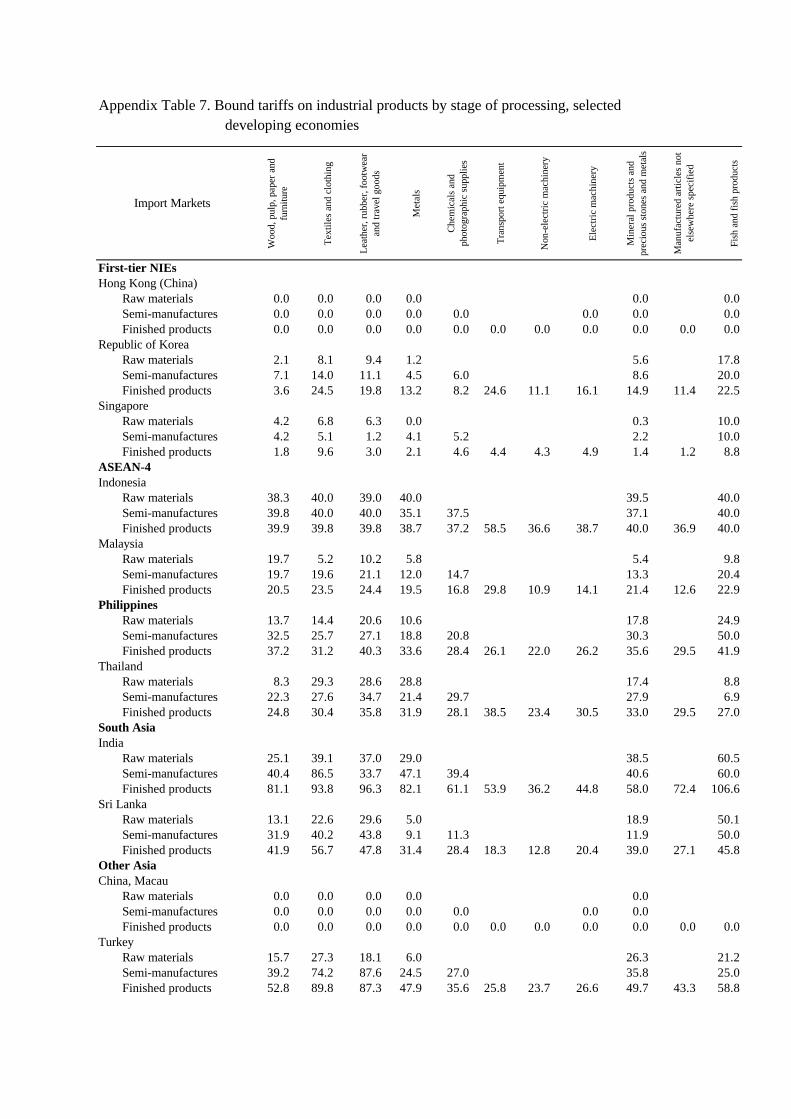
Woo
d, p
ulp,
pap
er a
nd
furn
iture
Tex
tiles
and
clo
thin
g
Lea
ther
, rub
ber,
foo
twea
r an
d tr
avel
goo
ds
Met
als
Che
mic
als
and
phot
ogra
phic
sup
plie
s
Tra
nspo
rt e
quip
men
t
Non
-ele
ctri
c m
achi
nery
Ele
ctri
c m
achi
nery
Min
eral
pro
duct
s an
d pr
ecio
us s
tone
s an
d m
etal
s
Man
ufac
ture
d ar
ticle
s no
t el
sew
here
spe
cifi
ed
Fish
and
fis
h pr
oduc
ts
First-tier NIEsHong Kong (China)
Raw materials 0.0 0.0 0.0 0.0 0.0 0.0Semi-manufactures 0.0 0.0 0.0 0.0 0.0 0.0 0.0 0.0Finished products 0.0 0.0 0.0 0.0 0.0 0.0 0.0 0.0 0.0 0.0 0.0
Republic of KoreaRaw materials 2.1 8.1 9.4 1.2 5.6 17.8Semi-manufactures 7.1 14.0 11.1 4.5 6.0 8.6 20.0Finished products 3.6 24.5 19.8 13.2 8.2 24.6 11.1 16.1 14.9 11.4 22.5
SingaporeRaw materials 4.2 6.8 6.3 0.0 0.3 10.0Semi-manufactures 4.2 5.1 1.2 4.1 5.2 2.2 10.0Finished products 1.8 9.6 3.0 2.1 4.6 4.4 4.3 4.9 1.4 1.2 8.8
ASEAN-4Indonesia
Raw materials 38.3 40.0 39.0 40.0 39.5 40.0Semi-manufactures 39.8 40.0 40.0 35.1 37.5 37.1 40.0Finished products 39.9 39.8 39.8 38.7 37.2 58.5 36.6 38.7 40.0 36.9 40.0
MalaysiaRaw materials 19.7 5.2 10.2 5.8 5.4 9.8Semi-manufactures 19.7 19.6 21.1 12.0 14.7 13.3 20.4Finished products 20.5 23.5 24.4 19.5 16.8 29.8 10.9 14.1 21.4 12.6 22.9
PhilippinesRaw materials 13.7 14.4 20.6 10.6 17.8 24.9Semi-manufactures 32.5 25.7 27.1 18.8 20.8 30.3 50.0Finished products 37.2 31.2 40.3 33.6 28.4 26.1 22.0 26.2 35.6 29.5 41.9
ThailandRaw materials 8.3 29.3 28.6 28.8 17.4 8.8Semi-manufactures 22.3 27.6 34.7 21.4 29.7 27.9 6.9Finished products 24.8 30.4 35.8 31.9 28.1 38.5 23.4 30.5 33.0 29.5 27.0
South AsiaIndia
Raw materials 25.1 39.1 37.0 29.0 38.5 60.5Semi-manufactures 40.4 86.5 33.7 47.1 39.4 40.6 60.0Finished products 81.1 93.8 96.3 82.1 61.1 53.9 36.2 44.8 58.0 72.4 106.6
Sri LankaRaw materials 13.1 22.6 29.6 5.0 18.9 50.1Semi-manufactures 31.9 40.2 43.8 9.1 11.3 11.9 50.0Finished products 41.9 56.7 47.8 31.4 28.4 18.3 12.8 20.4 39.0 27.1 45.8
Other AsiaChina, Macau
Raw materials 0.0 0.0 0.0 0.0 0.0Semi-manufactures 0.0 0.0 0.0 0.0 0.0 0.0 0.0Finished products 0.0 0.0 0.0 0.0 0.0 0.0 0.0 0.0 0.0 0.0 0.0
TurkeyRaw materials 15.7 27.3 18.1 6.0 26.3 21.2Semi-manufactures 39.2 74.2 87.6 24.5 27.0 35.8 25.0Finished products 52.8 89.8 87.3 47.9 35.6 25.8 23.7 26.6 49.7 43.3 58.8
Appendix Table 7. Bound tariffs on industrial products by stage of processing, selected
Import Markets
developing economies

Woo
d, p
ulp,
pap
er a
nd
furn
iture
Tex
tiles
and
clo
thin
g
Lea
ther
, rub
ber,
foo
twea
r an
d tr
avel
goo
ds
Met
als
Che
mic
als
and
phot
ogra
phic
sup
plie
s
Tra
nspo
rt e
quip
men
t
Non
-ele
ctri
c m
achi
nery
Ele
ctri
c m
achi
nery
Min
eral
pro
duct
s an
d pr
ecio
us s
tone
s an
d m
etal
s
Man
ufac
ture
d ar
ticle
s no
t el
sew
here
spe
cifi
ed
Fish
and
fis
h pr
oduc
ts
Latin AmericaBrazil
Raw materials 20.2 35.0 34.3 35.0 34.3 35.0Semi-manufactures 25.8 34.8 34.4 33.3 21.6 29.4 25.6Finished products 31.1 34.9 35.0 33.4 26.2 33.6 32.6 31.9 34.8 33.5 34.5
ChileRaw materials 25.0 25.0 25.0 25.0 24.8 25.0Semi-manufactures 25.0 25.0 25.0 25.0 25.0 25.0 25.0Finished products 25.0 25.0 25.0 25.0 25.0 24.9 25.0 25.0 25.0 25.0 25.0
ColombiaRaw materials 35.0 35.3 34.6 35.0 35.1 35.0Semi-manufactures 35.0 35.0 35.0 35.0 35.0 35.0 35.0Finished products 35.0 38.8 35.5 35.0 35.0 35.8 35.0 35.0 35.1 35.0 63.8
El SalvadorRaw materials 36.4 40.0 40.0 26.3 39.1 42.4Semi-manufactures 30.0 37.1 38.5 32.8 38.0 32.6 48.3Finished products 39.7 40.0 42.4 39.9 36.7 35.8 32.6 34.6 39.2 38.2 55.2
JamaicaRaw materials 50.0 50.0 50.0 50.0 50.0 50.0Semi-manufactures 50.0 50.0 50.0 50.0 50.0 50.0 50.0Finished products 50.0 50.0 50.0 50.0 50.0 50.0 50.0 50.0 50.0 50.0 52.4
MexicoRaw materials 30.1 34.2 34.8 34.1 33.7 35.0Semi-manufactures 34.1 35.1 34.7 34.4 35.1 33.6 33.0Finished products 34.6 35.0 34.9 35.0 35.4 35.8 35.0 34.1 35.0 34.6 36.0
VenezuelaRaw materials 31.8 34.7 34.9 35.0 33.8 33.4Semi-manufactures 32.8 35.0 33.9 32.8 34.0 33.8 34.8Finished products 34.6 34.9 34.6 34.4 34.3 33.6 33.2 33.9 34.6 33.4 33.5
North AfricaTunisia
Raw materials 18.2 55.5 25.2 17.0 20.4 39.4Semi-manufactures 36.2 55.2 35.4 22.6 24.9 26.9 43.0Finished products 36.9 57.3 39.1 32.0 30.7 25.5 25.2 29.1 35.3 32.5 47.0
Sub-Saharan Africa South Africa
Raw materials 1.2 12.5 12.7 0.0 4.3 22.7Semi-manufactures 6.7 23.9 16.3 10.8 13.0 6.7 25.0Finished products 15.5 36.6 27.0 20.0 16.7 23.3 12.0 17.4 16.8 14.8 21.4
Source: WTO (2001b)
Import Markets