the phplot documentation teamphplot.sourceforge.net/phplot.pdf · the phplot documentation team l j...
TRANSCRIPT

PHPlot Reference Manual
The PHPlot Documentation Team
L J BayukPrimary author and editor of the manual, and current maintainer of PHPlot
Miguel de BenitoDeveloper and maintainer of PHPlot
Afan OttenheimerOriginal developer of PHPlot

PHPlot Reference ManualThe PHPlot Documentation Teamby L J Bayuk, Miguel de Benito, and Afan Ottenheimer
Release 2015-11-05 for PHPlot-6.2.0Copyright © 2005-2015 The PHPlot Documentation Team
Permission to use, copy, modify and distribute this manual for any purpose and without fee is hereby granted in perpetuity, provided that the abovecopyright notice and this paragraph appear in all copies.
PHPlot Reference Manual
iii
Table of ContentsPreface ......................................................................................................................................... viiiI. PHPlot Programming ...................................................................................................................... 1
1. PHPlot Installation ................................................................................................................. 21.1. Prerequisites ............................................................................................................... 21.2. Installing ................................................................................................................... 31.3. Next Step .................................................................................................................. 3
2. Getting Started with PHPlot .................................................................................................... 52.1. Introduction ............................................................................................................... 52.2. Creating the Object ..................................................................................................... 62.3. A Simple Graph ......................................................................................................... 62.4. Different Size Images and Titles .................................................................................... 72.5. Multiple Lines Per Graph ............................................................................................. 92.6. Customization ........................................................................................................... 112.7. What's Next? ............................................................................................................ 11
3. PHPlot Concepts .................................................................................................................. 123.1. Definitions ............................................................................................................... 123.2. Programming Overview .............................................................................................. 133.3. PHPlot Data Types .................................................................................................... 153.4. PHPlot Plot Types ..................................................................................................... 193.5. Colors ..................................................................................................................... 323.6. Labels ..................................................................................................................... 373.7. Other Plot Elements ................................................................................................... 443.8. Text Fonts ................................................................................................................ 463.9. Error Handling .......................................................................................................... 50
4. PHPlot Advanced Topics ...................................................................................................... 524.1. Custom PHPlot Class ................................................................................................. 524.2. PHPlot Object Serialization ......................................................................................... 524.3. Truecolor Images ...................................................................................................... 534.4. Callbacks ................................................................................................................. 594.5. Custom Data Color Selection ...................................................................................... 654.6. Plot Range and Tick Increment Calculations .................................................................. 684.7. Tuning Parameters ..................................................................................................... 784.8. Multiple Plots Per Image ............................................................................................ 814.9. Streaming Plots ......................................................................................................... 864.10. Image Maps for Plot Data ......................................................................................... 90
5. PHPlot Examples ............................................................................................................... 1015.1. Example - Line Plot ................................................................................................. 1025.2. Example - Line Plot: Functions .................................................................................. 1045.3. Example - Area Plot ................................................................................................. 1065.4. Example - Bar Chart ................................................................................................ 1085.5. Example - Unshaded Bar Chart .................................................................................. 1105.6. Example - Bar Chart, Label Options ........................................................................... 1125.7. Example - Line/Point Plot, Point Shapes ...................................................................... 1145.8. Example - Pie Chart, text-data-single .......................................................................... 1165.9. Example - Pie Chart, text-data ................................................................................... 1185.10. Example - Pie Chart, flat with options ....................................................................... 1205.11. Example - Points Plot with Error Bars ....................................................................... 1225.12. Example - Points Plot / Scatterplot ............................................................................ 1245.13. Example - Squared Plot .......................................................................................... 1265.14. Example - Stacked Bars, Shaded ............................................................................... 1285.15. Example - Stacked Bars, Unshaded ........................................................................... 130

PHPlot Reference Manual
iv
5.16. Example - Thin Bar Line Plot .................................................................................. 1325.17. Example - Thin Bar Line Plot, Wider Lines ................................................................ 1345.18. Example - Two Plots on One Image .......................................................................... 1365.19. Example - Bar Chart with Data Value Labels .............................................................. 1385.20. Example - Stacked Bars with Y Data Value Labels ...................................................... 1405.21. Example - Stacked Area Plot ................................................................................... 1425.22. Example - Annotating a Plot Using a Callback ............................................................ 1445.23. Example - Complete Web Form with Plot .................................................................. 1475.24. Example - Using Truecolor To Make a Histogram ....................................................... 1545.25. Example - Creative Use of the Data Color Callback ..................................................... 1585.26. Example - Custom Bar Colors Using the Data Color Callback ........................................ 1605.27. Example - Horizontal Bar Chart ............................................................................... 1625.28. Example - Horizontal Stacked Bar Chart .................................................................... 1645.29. Example - Horizontal Thin Bar Line Plot ................................................................... 1665.30. Example - Basic OHLC (Open, High, Low, Close) Financial Plot ................................... 1675.31. Example - Candlesticks OHLC (Open, High, Low, Close) Financial Plot .......................... 1705.32. Example - Filled Candlesticks OHLC (Open, High, Low, Close) Financial Plot .................. 1725.33. Example - Linepoints Plot with Data Value Labels ....................................................... 1745.34. Example - Overlaying Plots ..................................................................................... 1765.35. Example - Legend with Shape Markers ...................................................................... 1795.36. Example - Legend Positioning .................................................................................. 1835.37. Example - Setting a Y Tick Anchor .......................................................................... 1875.38. Example - Hourly Data Using X Tick Anchor ............................................................. 1905.39. Example - Embedding Image with EncodeImage ......................................................... 1935.40. Example - Bubbles Plot .......................................................................................... 1955.41. Example - Pie Chart Label Types ............................................................................. 1975.42. Example - DrawMessage ......................................................................................... 2035.43. Example - Custom Data Value Label Formatting ......................................................... 2055.44. Example - Image Map from Bar Chart ....................................................................... 2085.45. Example - Image Map from Pie Chart ....................................................................... 2115.46. Example - Image Map and Non-embedded Plot Image .................................................. 2165.47. Example - Pie Chart Start Angle and Direction ............................................................ 2195.48. Example - Horizontal Linepoints Plot with Data Value Labels and Lines .......................... 2215.49. Example - Horizontal Error Plot ............................................................................... 2235.50. Example - Box Plot with Data Reduction ................................................................... 2255.51. Example - Box Plot with Outliers and Styles ............................................................... 2275.52. Example - Squared Area Plot ................................................................................... 2295.53. Example - Stacked Squared Area Plot ........................................................................ 231
6. PHPlot Functions By Category ............................................................................................. 2336.1. Core ...................................................................................................................... 2336.2. Input/Output Control ................................................................................................ 2336.3. Colors and Line Styles ............................................................................................. 2346.4. Additional Style Controls .......................................................................................... 2356.5. Error Bar Controls ................................................................................................... 2356.6. Text Fonts .............................................................................................................. 2356.7. Titles ..................................................................................................................... 2366.8. Legend ................................................................................................................... 2366.9. Axis Controls .......................................................................................................... 2366.10. Grid Controls ........................................................................................................ 2376.11. Labels .................................................................................................................. 2376.12. Ticks .................................................................................................................... 2386.13. Scaling and Translation ........................................................................................... 2386.14. Callbacks .............................................................................................................. 239
II. PHPlot Function Reference ......................................................................................................... 240
PHPlot Reference Manual
v
DrawGraph ........................................................................................................................... 243DrawMessage ........................................................................................................................ 244EncodeImage ........................................................................................................................ 246EndStream ............................................................................................................................ 248GetCallback .......................................................................................................................... 249GetDeviceXY ........................................................................................................................ 250GetLegendSize ...................................................................................................................... 251PHPlot ................................................................................................................................. 252PHPlot_truecolor ................................................................................................................... 254PrintImage ............................................................................................................................ 256PrintImageFrame ................................................................................................................... 257RemoveCallback .................................................................................................................... 258SetBackgroundColor ............................................................................................................... 259SetBgImage .......................................................................................................................... 260SetBrowserCache ................................................................................................................... 261SetCallback ........................................................................................................................... 262SetDataBorderColors .............................................................................................................. 263SetDataColors ....................................................................................................................... 265SetDataLabelColor ................................................................................................................. 267SetDataType ......................................................................................................................... 268SetDataValueLabelColor ......................................................................................................... 270SetDataValues ....................................................................................................................... 271SetDefaultDashedStyle ............................................................................................................ 272SetDefaultTTFont .................................................................................................................. 273SetDrawBrokenLines .............................................................................................................. 275SetDrawDashedGrid ............................................................................................................... 276SetDrawDataBorders .............................................................................................................. 277SetDrawPieBorders ................................................................................................................ 278SetDrawPlotAreaBackground ................................................................................................... 279SetDrawXAxis ...................................................................................................................... 280SetDrawXDataLabelLines ........................................................................................................ 281SetDrawXGrid ....................................................................................................................... 282SetDrawYAxis ...................................................................................................................... 283SetDrawYDataLabelLines ........................................................................................................ 284SetDrawYGrid ....................................................................................................................... 285SetErrorBarColors .................................................................................................................. 286SetErrorBarLineWidth ............................................................................................................ 287SetErrorBarShape ................................................................................................................... 288SetErrorBarSize ..................................................................................................................... 289SetFailureImage ..................................................................................................................... 290SetFileFormat ........................................................................................................................ 291SetFont ................................................................................................................................ 292SetFontGD ............................................................................................................................ 295SetFontTTF ........................................................................................................................... 296SetGridColor ......................................................................................................................... 297SetImageBorderColor ............................................................................................................. 298SetImageBorderType .............................................................................................................. 299SetImageBorderWidth ............................................................................................................. 300SetIsInline ............................................................................................................................ 301SetLabelScalePosition ............................................................................................................. 302SetLegend ............................................................................................................................. 303SetLegendBgColor ................................................................................................................. 304SetLegendColorboxBorders ..................................................................................................... 305SetLegendPixels .................................................................................................................... 306

PHPlot Reference Manual
vi
SetLegendPosition .................................................................................................................. 307SetLegendReverse .................................................................................................................. 309SetLegendStyle ...................................................................................................................... 310SetLegendTextColor ............................................................................................................... 312SetLegendUseShapes .............................................................................................................. 313SetLegendWorld .................................................................................................................... 315SetLightGridColor .................................................................................................................. 316SetLineSpacing ...................................................................................................................... 317SetLineStyles ........................................................................................................................ 318SetLineWidths ....................................................................................................................... 319SetMarginsPixels ................................................................................................................... 320SetNumberFormat .................................................................................................................. 321SetNumXTicks ...................................................................................................................... 323SetNumYTicks ...................................................................................................................... 324SetOutputFile ........................................................................................................................ 325SetPieAutoSize ...................................................................................................................... 326SetPieBorderColor ................................................................................................................. 327SetPieDirection ...................................................................................................................... 328SetPieLabelColor ................................................................................................................... 329SetPieLabelType .................................................................................................................... 330SetPieStartAngle .................................................................................................................... 334SetPlotAreaBgImage ............................................................................................................... 335SetPlotAreaPixels ................................................................................................................... 336SetPlotAreaWorld .................................................................................................................. 338SetPlotBgColor ...................................................................................................................... 340SetPlotBorderType ................................................................................................................. 341SetPlotType .......................................................................................................................... 343SetPointShapes ...................................................................................................................... 344SetPointSizes ........................................................................................................................ 346SetPrecisionX ........................................................................................................................ 347SetPrecisionY ........................................................................................................................ 348SetPrintImage ........................................................................................................................ 349SetRGBArray ........................................................................................................................ 350SetShading ............................................................................................................................ 352SetSkipBottomTick ................................................................................................................ 353SetSkipLeftTick ..................................................................................................................... 354SetSkipRightTick ................................................................................................................... 355SetSkipTopTick ..................................................................................................................... 356SetTextColor ......................................................................................................................... 357SetTickColor ......................................................................................................................... 358SetTickLabelColor ................................................................................................................. 359SetTitle ................................................................................................................................ 360SetTitleColor ......................................................................................................................... 361SetTransparentColor ............................................................................................................... 362SetTTFPath ........................................................................................................................... 363SetUseTTF ........................................................................................................................... 364SetXAxisPosition ................................................................................................................... 365SetXDataLabelAngle .............................................................................................................. 366SetXDataLabelPos ................................................................................................................. 367SetXDataLabelType ............................................................................................................... 369SetXLabelAngle .................................................................................................................... 372SetXLabelType ...................................................................................................................... 373SetXScaleType ...................................................................................................................... 377SetXTickAnchor .................................................................................................................... 378
PHPlot Reference Manual
vii
SetXTickCrossing .................................................................................................................. 380SetXTickIncrement ................................................................................................................. 381SetXTickLabelPos .................................................................................................................. 382SetXTickLength ..................................................................................................................... 383SetXTickPos ......................................................................................................................... 384SetXTimeFormat ................................................................................................................... 385SetXTitle .............................................................................................................................. 386SetXTitleColor ...................................................................................................................... 387SetYAxisPosition ................................................................................................................... 388SetYDataLabelAngle .............................................................................................................. 389SetYDataLabelPos ................................................................................................................. 390SetYDataLabelType ............................................................................................................... 392SetYLabelAngle .................................................................................................................... 395SetYLabelType ...................................................................................................................... 396SetYScaleType ...................................................................................................................... 399SetYTickAnchor .................................................................................................................... 400SetYTickCrossing .................................................................................................................. 402SetYTickIncrement ................................................................................................................. 403SetYTickLabelPos .................................................................................................................. 404SetYTickLength ..................................................................................................................... 405SetYTickPos ......................................................................................................................... 406SetYTimeFormat ................................................................................................................... 407SetYTitle .............................................................................................................................. 408SetYTitleColor ...................................................................................................................... 409StartStream ........................................................................................................................... 410TuneXAutoRange .................................................................................................................. 411TuneYAutoRange .................................................................................................................. 413TuneXAutoTicks ................................................................................................................... 415TuneYAutoTicks ................................................................................................................... 417
III. Developer's Guide to PHPlot ...................................................................................................... 4197. PHPlot Plot Layout ............................................................................................................ 4208. PHPlot Legend Layout ........................................................................................................ 4229. PHPlot Class Internal Functions ............................................................................................ 42310. PHPlot Class Member Variables ......................................................................................... 440
10.1. List of Member Variables ........................................................................................ 44010.2. Member Variable Notes .......................................................................................... 45210.3. PHPlot Class Constants ........................................................................................... 456
A. Change Log .............................................................................................................................. 457

viii
PrefacePHPlot is a PHP class for on-the-fly graphs generation. It was started by Afan Ottenheimer in 2000 as an Open Sourceproject, and is developed on SourceForge [http://sourceforge.net]. It is distributed1 under the terms of the GNU LesserGeneral Public License [http://www.opensource.org/licenses/lgpl-2.1.php] version 2.1.
Here are some of the features in PHPlot:
• Creates many graph types, including line plots, point plots, bar charts, and pie charts, also data/error graphs.
• Draws 3-D shading of pie charts and bar graphs.
• Customizable line color, width, solid or dashed patterns.
• Flexible labels, tick marks, axes, titles, legend, grid lines.
• TrueType fonts are supported, but not required.
• Use linear or logarithmic axes.
• Image output uses the GD Library, with supported formats including PNG, GIF, and JPEG.
PHPlot's home page is at http://phplot.sourceforge.net [http://phplot.sourceforge.net/], and project development takesplace at http://sourceforge.net/projects/phplot/ [http://sourceforge.net/projects/phplot/].
1 Versions prior to PHPlot-5.0.7 were distributed under the GPL and PHP licenses.

Part I. PHPlot ProgrammingThis first part of the PHPlot Reference Manual includes instructions on installing and using PHPlot.There is a chapter to help get you started, and a chapter of examples.
PHPlot Installation
2
Chapter 1. PHPlot Installation
This chapter explains how to install PHPlot.
1.1. PrerequisitesBefore you can use PHPlot, you need a recent version of PHP with the GD extension. PHPlot-5.8.0 and later requireat least PHP-5.3. (See the README and NEWS files included with the PHPlot distribution for requirements of otherversions.) In general, you should always use the latest available stable version of PHP.
If you want to display PHPlot charts on a web site, you need a PHP-enabled web server. You can also use PHPlot withthe PHP CLI (command line interface) without a web server.
You need the GD extension to PHP, either built in to PHP or loaded as a module. The GD extension to PHP is includedwith PHP source releases, and is also included in the binary Windows releases (as a loadable module). The PHP GDextension uses the GD library (libgd). A version of the GD library is included with PHP releases, and use of thisversion is recommended, but you can also use the PHP GD extension with a separate GD library (for example, oneincluded with your operating system).
If you aren't sure what extensions you have in PHP, create this PHP script called phpinfo.php somewhere in yourweb server's document tree:
<?php phpinfo();
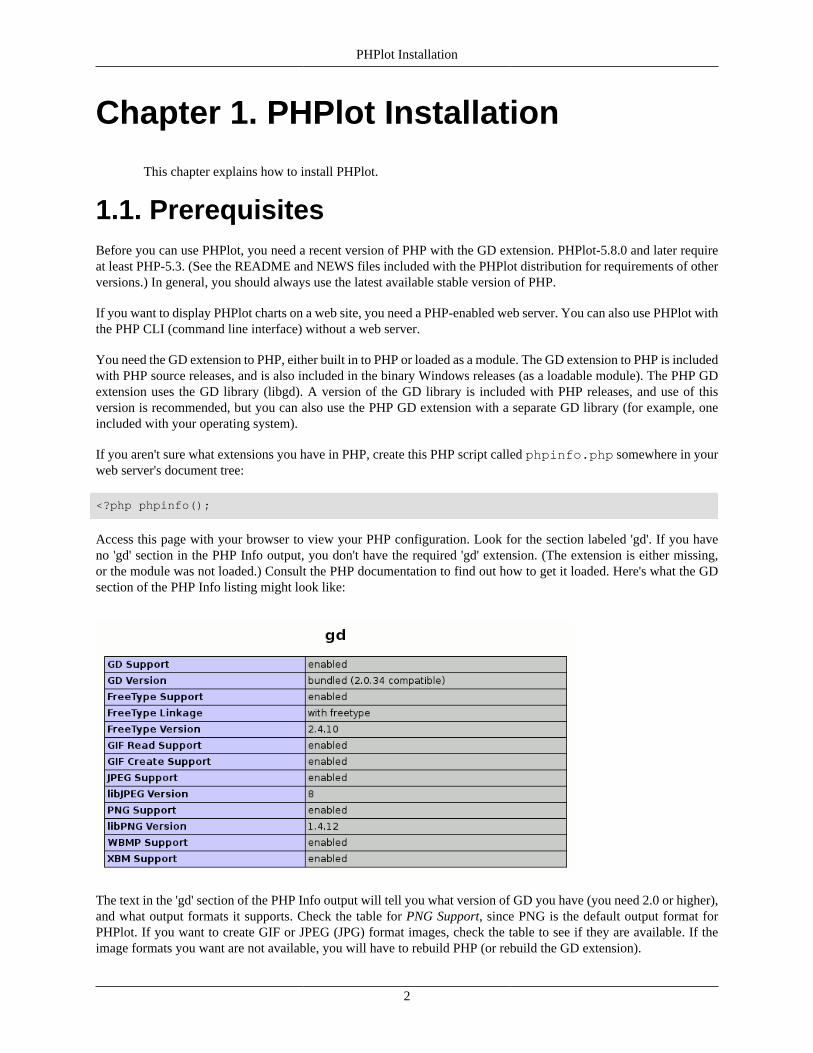
Access this page with your browser to view your PHP configuration. Look for the section labeled 'gd'. If you haveno 'gd' section in the PHP Info output, you don't have the required 'gd' extension. (The extension is either missing,or the module was not loaded.) Consult the PHP documentation to find out how to get it loaded. Here's what the GDsection of the PHP Info listing might look like:
The text in the 'gd' section of the PHP Info output will tell you what version of GD you have (you need 2.0 or higher),and what output formats it supports. Check the table for PNG Support, since PNG is the default output format forPHPlot. If you want to create GIF or JPEG (JPG) format images, check the table to see if they are available. If theimage formats you want are not available, you will have to rebuild PHP (or rebuild the GD extension).
PHPlot Installation
3
Another thing to look for in the 'gd' section of the PHP Info output is FreeType Support. If you have it enabled, you canuse TrueType fonts in PHPlot. If your GD does not have FreeType support enabled, you can still make decent-lookingplots with PHPlot, using the built-in GD fonts. Note that even if you have FreeType Support enabled, you need someactual TrueType font files in order to use TrueType fonts with PHPlot. PHPlot does not include any TrueType font files.
While you have the PHP Info report up, look in the Configuration section for PHP Core, at the top of the report, andmake a note of the include_path setting. If you have a local include directory in this path, you can use it forinstalling PHPlot, as described below.
Note
Don't leave the phpinfo.php file in your web server document tree, as there may be security implicationsin the information it tells people about your web server.
Once you have a web server with PHP and the GD extension, you are ready to install PHPlot.
1.2. InstallingUnpack the PHPlot distribution into a convenient directory. PHPlot releases are available both as ZIP files, and asgzip-compressed TAR files. Use whichever format is more convenient for you. In the example below, the TAR formatis unpacked.
$ tar -xvzf phplot-6.*.tar.gz$ cd phplot-6.*
(Use the appropriate file and directory (folder) name.) Check the distribution for README and/or INSTALL fileswhich may contain newer instructions.
Installation of PHPlot simply involves copying the script files somewhere your PHP application scripts will be able tofind them. The scripts are: phplot.php, the main script file, and rgb.inc.php, an optional script file containinga large color map. Make sure the protections on these files allow the web server to read them. For example:
$ chmod 644 *.php
Then, simply copy the files into a directory where PHP scripts will be able to include them. The ideal place is a directoryoutside your web server document area, and on your PHP include path (that you noted above in the PHP Info report).You can add to the include path in the PHP configuration file; consult the PHP manual for details. For example, if /usr/local/share/php is on your PHP include path, you can install PHPlot with:
$ cp phplot.php rgb.inc.php /usr/local/share/php
Note
On Windows systems, you can simply download the release ZIP file, expand it using Windows Explorer, andcopy the needed script file(s) out of the contained phplot-* folder into place.
1.3. Next StepYou can test PHPlot with any of the examples in Chapter 5, PHPlot Examples, or by entering this minimal script intoa file called (for example) plottest.php.
<?php

PHPlot Installation
4
require 'phplot.php';$data = array(array('', 10), array('', 1));$plot = new PHPlot();$plot->SetDataValues($data);$plot->SetTitle('First Test Plot');$plot->DrawGraph();
Access this script through your browser, and you should see a very simple plot. Note: Since PHPlot returns image data,not text, you will generally not see error messages in the output. If a script using PHPlot has a syntax error, or callsan undefined function, you will get a blank page returned, and you will probably have to check the web server errorlog for the reason. You might find that debugging your PHPlot applications is easier using the PHP CLI (commandline interface), as described at the start of Chapter 5, PHPlot Examples.
If you are installing PHPlot for use by some web application (rather than to develop your own applications), proceedwith that application's setup instructions. If you want to develop your own applications using PHPlot, you can start bylooking at some of the examples in Chapter 5, PHPlot Examples, or go right to the introductory material in Chapter 2,Getting Started with PHPlot. Experienced programmers may want to skip right to Chapter 3, PHPlot Concepts to learnabout PHPlot concepts and features in depth.

Getting Started with PHPlot
5
Chapter 2. Getting Started with PHPlot
This chapter will help you get started with PHPlot.
The material in this chapter was originally from the PHPlot Quick Start and Examples document,by Afan Ottenheimer and Miguel de Benito, distributed with PHPlot. It has undergone much editingand any mistakes are not their fault.
2.1. IntroductionMany web sites need to create real-time or dynamic charts and graphs from live data sets. Many users have found PHPa great way for this dynamic creation of images using the GD library. The advantage of using the server to create animage (that is, using a server-side scripting language rather than a client-side language such as Java) is that one doesnot have to worry about browser compatibility or client operating system compatibility issues.
PHPlot is a specialized graphics library which provides a means for your PHP-enabled web server to create andmanipulate graphs as objects and display the completed graph as an image. PHPlot uses the GD library to createelementary shapes such as lines, rectangles, and text, but hides the details of GD from the application programmer.
Data sets are passed to PHPlot using PHP arrays, in a convenient format for database-driven sites.
First, lets discuss how PHPlot works in general with some terminology. (More complete definitions can be foundin Section 3.1, “Definitions”.) A PHPlot image can consist of several graphs (but usually has only one), each graphconsisting of several elements (like lines, axes, and labels).
To use PHPlot, you create a PHP object from the PHPlot class, for example:
$plot = new PHPlot;
Then you set the properties of the object, by using a series of function calls (actually methods of the class). These definethe characteristics of the image, the graph or graphs, and their elements. This includes setting the array containingthe data to be plotted, defining titles if you want them, and many optional elements and style settings. You can thinkof this as "drawing" elements into the image, but in fact PHPlot just notes your intentions and doesn't do much untilyou are finished.
When you are done describing a graph, you instruct PHPlot to "draw" the graph into the image. When you are donewith all graphs in an image, you need to instruct PHPlot to "print" (output) the image. Since most images containonly one graph, PHPlot simplifies this process by default. Unless instructed otherwise, PHPlot will "print" the image(output it to the browser) as soon as you tell it to "draw" (render) the first graph.
Usually, PHPlot will "print" the image directly to the user's browser. The result will be a complete HTTP responsewith headers, so your PHP script must not produce any other output (except for optional headers). The user will besee the image either as a result of accessing your script directly with a URL, like http://www.example.com/graphs/myplot.php, or you can embed the image in a web page using an image tag, like this:
<IMG SRC="http://www.example.com/graphs/myplot.php">
Instead of sending the image to the browser, your application can instead choose to write the PHPlot image to a fileon the server. This could be useful if you want to implement server-side caching of image files. (PHPlot itself doesnot currently provide caching.)

Getting Started with PHPlot
6
Before continuing, we need to mention coordinates. PHPlot uses two coordinate spaces: one for the image, and onefor the data you are plotting. World Coordinates are the X,Y coordinates of your data, relative to the axis origin, inthe units of the data sets. Your data array uses world coordinates, as do tick mark labels on the X and Y axis. DeviceCoordinates measure pixels in the image according the the GD convention, with the origin in the upper left corner ofthe image. These are also called Pixel Coordinates. PHPlot tries to place elements on your graph appropriately, but ifyou need to override its choices you will use device coordinates to position the elements.
The rest of this chapter explains how to write a PHP script which creates a plot using PHPlot. Information on PHP canbe found at www.php.net [http://www.php.net/]. Information about the GD library which PHP uses to create imagescan be found at libgd.org [http://libgd.org/]. More information about PHPlot can be found at phplot.sourceforge.net[http://phplot.sourceforge.net/].
2.2. Creating the ObjectYou create a PHPlot object by first including the code to be used, and then defining the variable:
<?phprequire_once 'phplot.php'; // here we include the PHPlot code $plot = new PHPlot; // here we define the variable
//Rest of code goes below
The above code assigns the PHPlot object to the variable $plot.
2.3. A Simple GraphWe will start with a simple line graph.
<?php//Include the coderequire_once 'phplot.php';
//Define the object$plot = new PHPlot();
//Define some data$example_data = array( array('a',3), array('b',5), array('c',7), array('d',8), array('e',2), array('f',6), array('g',7));$plot->SetDataValues($example_data);
//Turn off X axis ticks and labels because they get in the way:$plot->SetXTickLabelPos('none');$plot->SetXTickPos('none');
//Draw it$plot->DrawGraph();
Getting Started with PHPlot
7
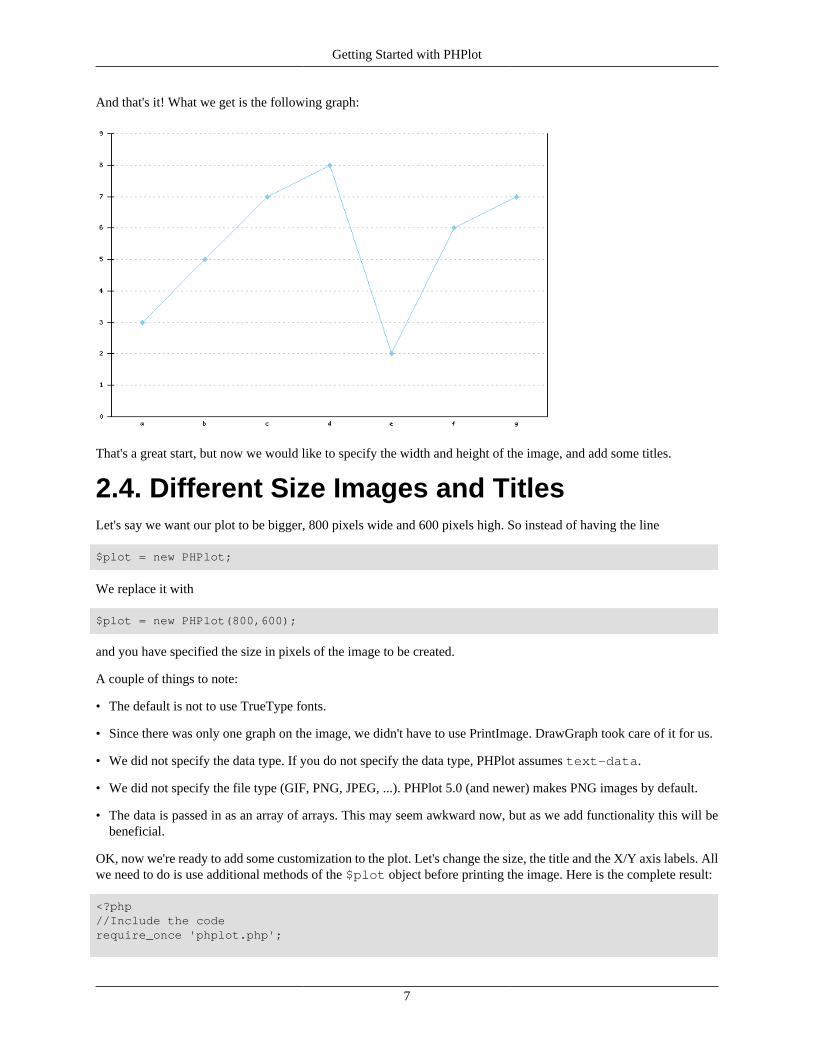
And that's it! What we get is the following graph:
That's a great start, but now we would like to specify the width and height of the image, and add some titles.
2.4. Different Size Images and TitlesLet's say we want our plot to be bigger, 800 pixels wide and 600 pixels high. So instead of having the line
$plot = new PHPlot;
We replace it with
$plot = new PHPlot(800,600);
and you have specified the size in pixels of the image to be created.
A couple of things to note:
• The default is not to use TrueType fonts.
• Since there was only one graph on the image, we didn't have to use PrintImage. DrawGraph took care of it for us.
• We did not specify the data type. If you do not specify the data type, PHPlot assumes text-data.
• We did not specify the file type (GIF, PNG, JPEG, ...). PHPlot 5.0 (and newer) makes PNG images by default.
• The data is passed in as an array of arrays. This may seem awkward now, but as we add functionality this will bebeneficial.
OK, now we're ready to add some customization to the plot. Let's change the size, the title and the X/Y axis labels. Allwe need to do is use additional methods of the $plot object before printing the image. Here is the complete result:
<?php//Include the coderequire_once 'phplot.php';
Getting Started with PHPlot
8
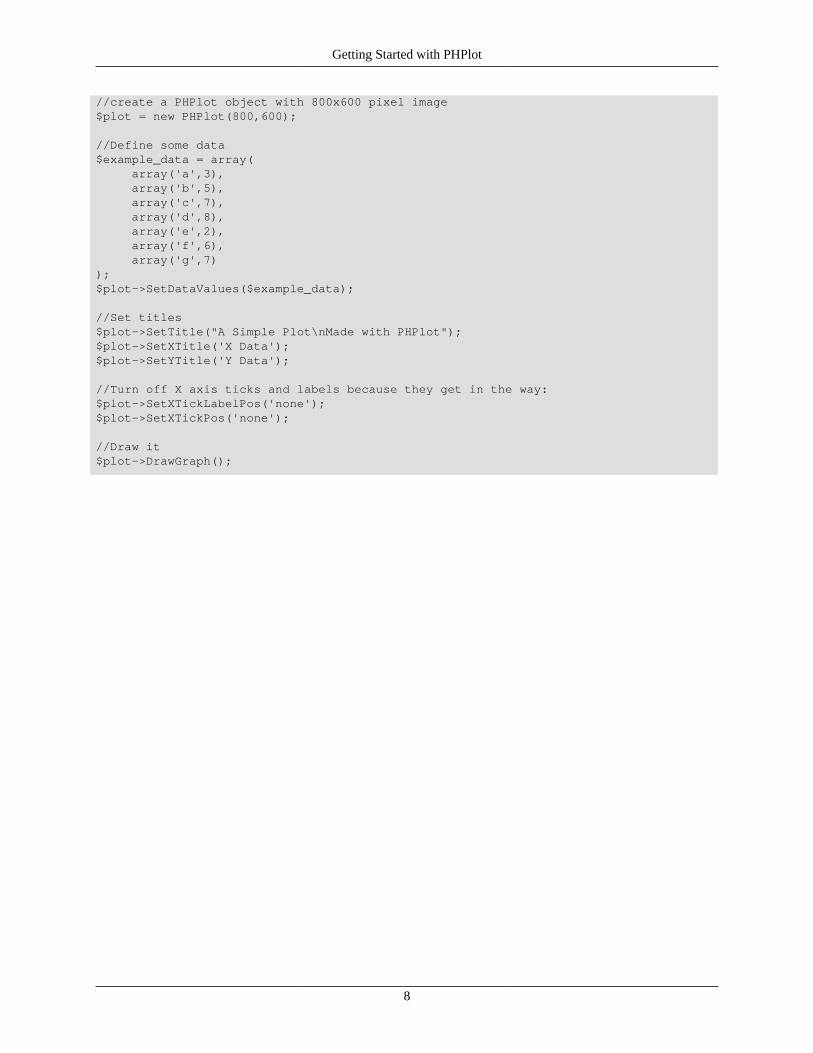
//create a PHPlot object with 800x600 pixel image$plot = new PHPlot(800,600);
//Define some data$example_data = array( array('a',3), array('b',5), array('c',7), array('d',8), array('e',2), array('f',6), array('g',7));$plot->SetDataValues($example_data);
//Set titles$plot->SetTitle("A Simple Plot\nMade with PHPlot");$plot->SetXTitle('X Data');$plot->SetYTitle('Y Data');
//Turn off X axis ticks and labels because they get in the way:$plot->SetXTickLabelPos('none');$plot->SetXTickPos('none');
//Draw it$plot->DrawGraph();

Getting Started with PHPlot
9
And that's it! What we get is the following graph:
Note that the newline character "\n" separates multiple lines in titles, and you must use double quotes around the titlestring for PHP to recognize the newline.
2.5. Multiple Lines Per GraphLet's say we want to plot not just one dataset, but several Y values for each X position. With PHPlot, it is easy to specifythe multiple data lines by just passing in all the Y values for a given X value at once. So instead of array('label',y), we specify array('label', y1, y2, y3, ...). This is very convenient when working with rows ofdata from databases.
Now our data will have three Y values for each position on the X axis.
<?php//Include the coderequire_once 'phplot.php';
//Define the object$plot = new PHPlot(800,600);
//Set titles$plot->SetTitle("A 3-Line Plot\nMade with PHPlot");$plot->SetXTitle('X Data');

Getting Started with PHPlot
10
$plot->SetYTitle('Y Data');
//Define some data$example_data = array( array('a',3,4,2), array('b',5,'',1), // here we have a missing data point, that's ok array('c',7,2,6), array('d',8,1,4), array('e',2,4,6), array('f',6,4,5), array('g',7,2,3));$plot->SetDataValues($example_data);
//Turn off X axis ticks and labels because they get in the way:$plot->SetXTickLabelPos('none');$plot->SetXTickPos('none');
//Draw it$plot->DrawGraph();
Which gives us:
Notice that each set of Y data gets a different color. Also the missing data point (label 'b' on the green line) is skipped.This behavior can be adjusted with SetDrawBrokenLines.
Getting Started with PHPlot
11
This gives you the basics of how to create a graph in PHPlot. A nice start, but now we'd like to add some customization,namely different fonts, margins and types of graphs.
2.6. CustomizationPHPlot can draw these types of plots:
• Bars (with optional shadows) and Stacked Bars, both vertical and horizontal
• Lines
• Points (a lot of point shapes are available)
• Linepoints (as you might expect, both points and lines)
• Area and Stacked Area
• Pie (2D or 3D look)
• Thinbarline (sometimes also called impulse), both vertical and horizontal
• Lines, Points, and Linepoints with Error bars
• Squared (steps)
• Bubbles
• Open/High/Low/Close (shows price changes for a stock, for example)
• Boxes (5-number statistical summary)
You specify which type of plot you want with the SetPlotType function.
There are many ways we can change the look and feel of the graph. Almost every parameter of the graph, includingticks, grids, and data labels, can be adjusted using PHPlot functions. A categorized list of these functions can be foundin Chapter 6, PHPlot Functions By Category. Each of the functions is described in detail in PHPlot Function Reference.
2.7. What's Next?If you want to see more pictures and sample code, take a look at the examples in Chapter 5, PHPlot Examples.
Otherwise, you can continue with Chapter 3, PHPlot Concepts where PHPlot concepts are described in more detail.
PHPlot Concepts
12
Chapter 3. PHPlot Concepts
This chapter explains the operation and use of PHPlot. For advanced topics, see Chapter 4, PHPlotAdvanced Topics.
3.1. Definitions
This section contains definitions of terms used throughout the PHPlot Reference Manual.
Alpha valueA component in a color system which represents the amount of transparency, or opacity. At one extreme, an alphavalue indicates an opaque object which covers or hides whatever was drawn before it. At the other extreme, itindicates a completely transparent object which has no affect on whatever was drawn before it.
Data SetA set of data points which represent some function, trend, samples, etc.
Device CoordinatesThe coordinate space used by GD to create images. The origin is at the upper left corner, X increases to the right,Y increases down, and the units are pixels. Also known as Pixel Coordinates or GD Coordinates.
ElementA component of a graph, such as a label, tick mark, axis, or plot.
GDA programming library used to create and manipulate images. GD can be found at the GD Graphics Library homepage [http://libgd.org/], but is also included with PHP releases. You can think of GD as a software implementationof a video card. GD is also available via a PHP extension, and that is what PHPlot uses to create images.
GraphA complete, labeled, graphical representation of some data sets. In PHPlot, a graph contains a single plot andother elements such as axes, tick marks, and labels.
Horizontal PlotA plot in which the Y (vertical) axis represents the independent variable, and the X (horizontal) axis representsthe dependent variable values. In a horizontal bar chart, for example, the bars extend to the right from the Y axis.A horizontal plot might represent X = F(Y), for example. (Note: This usage is specific to PHPlot. An alternateapproach, not used by PHPlot, is to swap the X and Y axis orientation to make horizontal plots.)
ImageA graphical image, represented as data. For example, a PNG file is an image in PNG format which is stored in a file.PHPlot creates images using the GD library. A PHPlot image contains one or more graphs (but usually only one).
Palette ImageA color image file, or image in memory, in which each pixel value is an index into a color map which containsthe actual color. Typically, the pixel value is 8 bits, limiting this type of image to 256 distinct colors. See alsoTruecolor Image.
PlotThe graphical representation of one or more data sets. In PHPlot, each graph contains a single plot, but a plot cancontain representation of multiple data sets (for example, you can have 3 line charts on a plot).

PHPlot Concepts
13
Less formally, the term 'plot' is often used for the overall output of PHPlot: an image with a complete graphicalrepresentation of data, with labels, legend, title, etc.
Relative CoordinatesA coordinate space in which the X and Y coordinates represent a fraction of the size of an object. The point (0,0)is defined as the upper left corner of the object, and (1,1) is the lower right corner. (Relative coordinate valuesare not restricted to the range 0 to 1, however.) So a point specification in relative coordinates to an object isindependent of the size of the object. This coordinate system is used by SetLegendPosition.
Truecolor ImageA color image file, or image in memory, in which each pixel value has a complete representation of the color ofthat pixel. The pixels may use 24 bits, with 8 bits each for red, blue, and green color components, or 32 bits withan additional alpha component. See also Palette Image.
Vertical PlotA plot in which the X axis represents the independent variable, and the Y axis represents the dependent variablevalues. This is the usual orientation for plots, and might represent Y = F(X). Compare with horizontal plot.
World CoordinatesThe coordinate space of the plotted data. This is the real world coordinate space, in the units of whatever the plotteddata measures. The origin of the world coordinate space is the 0,0 point on the X and Y axes. The X coordinateincreases to the right, and the Y coordinate increases upwards. Note that the Y direction of world coordinates isopposite that of device coordinates. (World coordinates are only defined for plots in an orthogonal X/Y coordinatespace, so there are no world coordinates for pie charts.)
3.2. Programming Overview
This section contains an overview of how to use PHPlot.
3.2.1. How It WorksTo create a plot with PHPlot, your PHP script will generally do the following:
1. Include the phplot.php source using require_once.
2. Create an object which is an instance of the PHPlot class.
3. Use PHPlot functions (methods of the class object) to select the plot type, present the data array, and optionallychange settings which control the appearance of the plot.
4. Output the plot, typically to the user's browser but possibly to a file instead.
The order of operations you use between creating a PHPlot object and output of the plot does not matter. The PHPlotclass sets internal class variables as you configure the plot, but doesn't do anything with the values until you are ready.For example, setting a font for the plot title, then setting the title text, is the same as setting the title text first, then thefont. In both cases, the title will be drawn using the font you selected.
Note
It is important to remember that if you are writing a PHP script that uses PHPlot to create an image for aweb page, that PHP script must output only the image data. If you want your plot image to appear on a webpage with text and other images, you need at least two scripts. Your main script returns an HTML page which

PHPlot Concepts
14
includes an IMG (Image) tag for the plot. The IMG tag has a SRC attribute which references the second script,and it is this second script which creates the PHPlot image. An example of this can be found in Section 5.23,“Example - Complete Web Form with Plot”. You will most likely need a way to communicate parametersfrom your main script to your image script. Two good ways to do this are using URL parameters, and withPHP session variables.
An alternative to using two scripts - one generating HTML, and one using PHPlot to create the plot image - isavailable starting with PHPlot-5.5.0. You can write a single script which generates HTML and also embedsthe PHPlot-generated plot image. See Section 5.39, “Example - Embedding Image with EncodeImage”.
3.2.2. Annotated ExampleHere is a simple, annotated example of a script which produces an image. More examples can be found in Chapter 5,PHPlot Examples.
require_once 'phplot.php';
This brings in the PHPlot source into your script. For this to work, PHP needs to be able to find the PHPlot source file.A good way to arrange this is to install PHPlot into a directory outside your web server's document root and on thePHP Include Path. Other ways are to include a full path to phplot.php when including it, or to copy phplot.phpinto the same directory as your script.
$plot = new PHPlot();
Here we create a new PHPlot object and call it plot. Everything else we do with the plot will be through the $plotobject.
$plot->SetPlotType('lines');$plot->SetDataType('text-data');
Here we select the plot type 'lines', for a line plot (see Section 3.4, “PHPlot Plot Types”), and indicate our data will berepresented in the 'text-data' format (see Section 3.3, “PHPlot Data Types”).
$plot->SetDataValues($data);
The data array $data is where we store the values to be plotted. We haven't shown where the data came from, but ina typical application it might be from a database query. How the data array is constructed is described in Section 3.3,“PHPlot Data Types”.
$plot->SetXDataLabelPos('none');$plot->SetLineWidths(3);$plot->SetDrawXGrid(True);
These three functions illustrate how to change the appearance of the plot.
$plot->DrawGraph();
This final function call outputs the plot. More accurately, this function creates the plot using all the data and settingswhich were established by previous functions, and then outputs the plot. This is a crucial point when using PHPlot:Until you call DrawGraph, PHPlot is simply recording all the settings resulting from the functions you call, and savinga copy of your data array. Nothing really happens until you complete the plot with DrawGraph.

PHPlot Concepts
15
3.3. PHPlot Data Types
This section describes how data need to be organized for use with PHPlot.
3.3.1. Available Data TypesThe data values to be plotted are presented to PHPlot with SetDataValues. In all cases, the data values are stored in aPHP array. This data array contains elements, themselves also arrays, which are called records. Each record containslabels and/or data values. The 'data type' of the data array determines how PHPlot will interpret the records in the dataarray. To set the data type, use SetDataType.
Not all plot types work with all data types. In some cases, the data type doesn't make sense for that plot type, or perhapsit just isn't implemented. See Section 3.4, “PHPlot Plot Types” for a list of available plot types and which data typesare available for each. Section 3.4.18, “Plot Types and Data Types” contains a summary table of supported plot type /data type combinations.
The following data types are available in PHPlot:
text-dataThis is the simplest data type, used for vertical plots where the X values are implied, rather than specified, andthere are one or more Y values for each X. When using this data type, each record (row) in the data array containsa label (which can be empty), followed by one or more Y values: array('label', y1, y2, ...). PHPlotassigns X=0.5 to the first data record, X=1.5 to the second data record, and so on.
data-dataThis data type is similar to text-data except that the values of the independent variable X are supplied in thedata array rather than being implied. This is used for vertical plots. When using this data type, each record (row) inthe data array contains a label (which can be empty), an X value, then one or more Y values: array('label',x, y1, y2, ...).
data-data-errorThis data type is used to make error plots - a plot showing values and error ranges at each point. This is for verticalplots. When using this data type, each record (row) in the data array contains a label (which can be empty), an Xvalue, then sets of 3 values for each Y point: the Y value, error in the positive direction, and error in the negativedirection: array('label', x, y1, e1+, e1-, y2, e2+, e2-, ...).
Note that both errors (e+ and e-) are given as positive numbers. They represent the absolute value of the error inthe positive and negative directions respectively. These must be greater than or equal to zero.
text-data-singleThis data type is only used for pie charts, where the size of each pie segment is represented by a single row andvalue. (There are other data types that work with pie charts too.) When using this data type, each record (row) inthe data array contains a label (which can be empty), and a single value: array('label', value).
text-data-yxThis data type is used for horizontal plots where the Y values are implied, rather than specified, and there are oneor more X values for each Y. (For horizontal plots, Y is the independent variable.) When using this data type,each record (row) in the data array contains a label (which can be empty), followed by one or more X values:array('label', x1, x2, ...). PHPlot assigns Y=0.5 to the first data record, Y=1.5 to the second datarecord, and so on. This is the horizontal plot variation of text-data.
data-data-yxThis data type is used for horizontal plots where the Y values are supplied in the data array rather than beingimplied. (For horizontal plots, Y is the independent variable.) When using this data type, each record (row) in the

PHPlot Concepts
16
data array contains a label (which can be empty), a Y value, then one or more X values: array('label', y,x1, x2, ...). This is the horizontal plot variation of data-data.
data-data-yx-errorThis data type is used to make horizontal error plots - a plot showing values and error ranges at each point. Whenusing this data type, each record (row) in the data array contains a label (which can be empty), a Y value, thensets of 3 values for each X point: the X value, error in the positive direction, and error in the negative direction:array('label', y, x1, e1+, e1-, x2, e2+, e2-, ...).
Note that both errors (e+ and e-) are given as positive numbers. They represent the absolute value of the error inthe positive and negative directions respectively. These must be greater than or equal to zero.
Note that you can also use the alias data-data-error-yx for horizontal error plots.
data-data-xyzThis data type is used for plots which have a 3D component. When using this data type, each record (row) inthe data array contains a label (which can be empty), an X value, then one or more pairs of Y and Z values:array('label', x, y1, z1, y2, z2, ...). A single data set in an array using this data type contains(x, y, z) triplets. Multiple data sets can also be represented, with each row in the array containing an X value andthe corresponding Y and Z values.
3.3.2. Building Data ArraysIn most of the examples in this manual, the data array is built from constant values in PHP code. For example:
$data = array( array('', 0, 0, 0, 0), array('', 1, 1, 1, -10), array('', 2, 8, 4, -20), array('', 3, 27, 9, -30), array('', 4, 64, 16, -40), array('', 5, 125, 25, -50),);
This data array contains 6 records, each with an empty label, an X value (assuming the data type is 'data-data'), andthen 3 Y values representing 3 data sets to plot.
In a real application, of course, the data values will most likely come from a calculation, perhaps using values from adatabase. This section provides a few sample code fragments which construct data arrays. We use the PHP ability toappend a new value to the end of an array using $array[] = ....
This code fragment creates a data array of type 'text-data' with three data sets for Y=X+1, Y=X*X/2, and Y=X*X*X/3.
$data = array();for ($x = 0; $x <= 5; $x++) $data[] = array('', $x+1, $x*$x/2, $x*$x*$x/3);
This code fragment creates a data array of type 'data-data' with about 100 points from the equation X * Y = 10.
$data = array();for ($x = 1.0; $x <= 10.0; $x += 0.1) $data[] = array('', $x, 10.0/$x);
The next code fragments use database queries to build data arrays for PHPlot. In many cases, you can create a querysuch that the returned columns correspond to the format of a PHPlot data array record. The first query result columnshould be the data label, the second (for data type 'data-data' only) should be the X value, and subsequent column resultsshould be one or more Y values (depending on the number of datasets you are plotting). (Pie charts work differently -

PHPlot Concepts
17
see Section 3.4.10, “Plot Type: pie (Pie Plot)”.) You aren't limited to simple table lookups - you can use the full powerof the SQL language to combine tables and perform calculations on the data. Be sure to use ORDER BY in your SQLquery to order the results, or you will not get predictable plots.
Database access methods differ. This code is for PostgreSQL; for MySQL there are similar functions likemysql_fetch_row().
$r = pg_query($db, 'SELECT ...');if (!$r) exit();$data = array();$n_rows = pg_num_rows($r);for ($i = 0; $i < $n_rows; $i++) $data[] = pg_fetch_row($r, $i);...$plot->SetDataValues($data);
This works because pg_fetch_row assigns the result columns from the query to sequentially numbered elementsin the array.
Using data arrays from database query results also works if the result columns are in an array which is indexed bythe field name, because PHPlot converts the data array to use numeric indexes. So with PostgreSQL you can usepg_fetch_assoc(). You can also use pg_fetch_array(), but only if you specify the type as PGSQL_ASSOCor PGSQL_NUM. The default type PGSQL_BOTH will not work, because the result array will contain the data valuesduplicated under both number and field-name indexes, and PHPlot will see both copies of the data.
Going even further, with a properly designed query you can use pg_fetch_all() to fetch the entire query resultand assign it to a data array with one statement.
$r = pg_query($db, 'SELECT ...');if (!$r) exit();$data = pg_fetch_all($r);...$plot->SetDataValues($data);
This uses field-name indexes in the array representing each row, but as noted above PHPlot will convert the data arrayto use numeric indexes.
3.3.3. Duplicate and Out-of-order PointsWith data types 'data-data' and 'data-data-error', the independent variable X is explicitly given for each data point.With data types 'data-data-yx' and 'data-data-yx-error', the independent variable Y is explicitly given for each datapoint. With data type 'data-data-xyz', the independent variables X and Y are explicitly given for each data point. Witheach of these data types, it is possible to create a data array with duplicate values for the independent variable(s), orpoints which are out of order. For example, with data type 'data-data', this array has 2 points at X=4, and the 4th row(X=2) is out of order:
// Data type data-data with out-of-order points$data = array( // X Y array('', 1, 10), array('', 3, 30), array('', 4, 40), array('', 2, 20), array('', 4, 50), );
PHPlot will plot the data points as specified in the array, in row order. Depending on the plot type, this may or maynot make sense.

PHPlot Concepts
18
With a points plot (which puts a marker at each data point), the data array can legitimately contain duplicate or out-of-order independent variable values (usually X) as shown above. A bubbles plot using the 'data-data-xyz' data typecan also contain duplicate or out-of-order points by specifying X and Y values in any order. (However, two bubbleswith the same X and Y will overlap, and one might be covered and invisible.)
With plot types ohlc, candlesticks, candlesticks2, and thinbarline, out-of-order points are OK but duplicate independentvariable values usually will not produce useful results.
On the other hand, with a lines plot (which draws lines between the points in the order defined by the data array rows),it probably makes no sense to have out-of-order or duplicate independent variable values in the data array. The sameis true for plot types area, linepoints, stackedarea, squared, squaredarea, and stackedsquaredarea.
3.3.4. Missing Data in Data ArraysMost plot types support the concept of missing points. A missing point is represented in your data array with an emptystring instead of a Y value. (Actually, any non-numeric value works.) For example:
$data = array( array('1996', 45.5), array('1997', 53.8), array('1998', ''), # No data available for 1998 array('1999', 34.1));
(For horizontal plots, the missing value is X not Y.)
With the lines, linepoints, and squared plot types, there are two ways to handle missing points. By default, PHPlot willact as if the missing point does not exist, connecting the points before it and after it. You can use SetDrawBrokenLinesto leave a gap at the missing point instead.
The candlesticks, candlesticks2, and ohlc plot types support missing points. Specify all four Y values at the missingpoint as empty strings. (This does not work with PHPlot-5.4.0 and earlier.)
The area, stackedarea, stackedbars, squaredarea, and stackedsquaredarea plot types do not support missing points.Non-numeric values are taken as zero for these plot types.
All other plot types support missing points and simply ignore the point. That is, no bar, point shape, thinbar line, etc.will be plotted at that position.
With error plots, missing points are represented by an empty string for the dependent variable value. This is the Yvalue for vertical error plots (data type data-data-error), and the X value for horizontal error plots (data type data-data-yx-error). There still must be two error value entries in the array for each missing point, although the actual valuesof these will be ignored.
With data type data-data-xyz, missing points are represented by an empty string for the Y value. There still must be aZ value entry in the array for each missing Y, although the Z value is ignored.
3.3.5. Data Array IndexesThere are some rules you need to follow when building data arrays, in order for PHPlot to correctly process your data.The following rules apply to the array indexes, or keys, in your data array.
• Your data array must be indexed using sequential integers starting with zero. This is automatically true if you buildan array with the empty-brackets syntax ($mydata[] = ...), or if you use the array(...) construct withoutspecifying keys. Note that this refers only to the data array itself, not the elements of the data array - the records.
• The data records, which are elements of the data array, are also arrays. These record arrays are processed by PHPlotusing the array_values() function. This means the array keys are ignored, and the elements of the record are

PHPlot Concepts
19
processed in the same order as they were assigned. As with the data array itself, you can use the empty-bracketssyntax, or the array() language construct, to build records in the data array. You can also use words (such as databasequery result fields) as indexes, as long as the assignments are made in the correct order.
3.3.6. Data Array ValidationPHPlot checks the validity of the data array in 3 stages. SetDataValues only checks that it really was given an array,that the array contains zero-based sequential integer keys, and that the values are also arrays.
More extensive checking takes place when the graph is drawn with DrawGraph. At that time, PHPlot checks that thedata array is not empty, and that the rows contain a correct number of entries depending on the data type. A third stageof checking takes place for specific plot types. For example, OHLC plots require 4 values, and area plots require thesame number of values for each row. (These requirements are documented in Section 3.4, “PHPlot Plot Types”.) Ifany of these checks fails, PHPlot produces an error image instead of a plot.
An empty plot will be produced if the data array is valid but contains no numeric Y values (X values for horizontalplots). The result has titles, X and Y axis with labels and tick marks (except for pie plots), and other applicable plotfeatures, but no actual plotted data. There is no error or warning from PHPlot when an empty plot is produced.
3.4. PHPlot Plot Types
This section describes the PHPlot plot types and their individual data type requirements.
Plot types determine the overall look of the graphical representation of the data values. To select the plot type, useSetPlotType. The following plot types are available:
Plot Type Description
areaFilled areas between lines. Also known as cumulative line plot or componentline plot.
bars Filled bars with optional 3-D look. Multiple datasets are offset.
boxes Box plot, showing a 5-number statistical summary of a data set.
bubblesA scatter-point plot using bubbles (filled circles), with the bubble sizeproportional to a Z value.

PHPlot Concepts
20
Plot Type Description
candlesticksAn Open/High/Low/Close (OHLC) financial plot using filled and unfilledcandlesticks.
candlesticks2 An Open/High/Low/Close (OHLC) financial plot using filled candlesticks.
linepoints Lines between points, with a marker at each point, and optional error bars.
lines Straight lines between data points, with optional error bars.
ohlc A basic Open/High/Low/Close (OHLC) financial plot using lines and ticks.
pie Pie chart with or without 3-D affects.
points Draws a marker at each data point, with optional error bars.
squared Stepped lines, also called squared lines.

PHPlot Concepts
21
Plot Type Description
squaredarea Filled area between stepped lines.
stackedarea Filled areas between lines, with multiple data sets accumulated.
stackedbarsFilled bars with optional 3-D look. Multiple data sets are accumulated andthe sum is graphed.
stackedsquaredarea Filled areas between stepped lines, with multiple data sets accumulated.
thinbarlineVertical lines from the X axis to the value, or horizontal lines from the Yaxis to the value. Also known as impulse.
3.4.1. Plot Type: area (Area Plot)This plot type draws filled areas between lines. This is often called a cumulative line plot or component line plot.Each data set (set of corresponding Y values from each record in the data array) is plotted in order, with the areabetween each line and the next line filled solid. The area between the last line and the X axis1 is also filled. The datamust be arranged so the values are (generally) decreasing within each row, because later drawn filled areas will coverpreviously drawn areas.
This plot type works with data types text-data and data-data. For 'text-data', the data X values are assumed to be at0.5+N for N=0,1,2...
A minimum of 2 rows (X values and corresponding Y value(s)) is required for this plot type. If there are fewer than2 rows, an empty plot will be produced.
This plot type uses the absolute value of each supplied Y, because negative values do not make sense here. Missingvalues are taken as zero. All records in the data array must have the same number of Y values.
1 The area and squaredarea plot types are actually intended to fill the area between each data set (set of Y values) and the X axis. The way itis described above is how it is actually implemented, however. When using opaque colors, there is no visible difference between the two methods.But when colors are partially transparent, filling the area between data sets (rather than data set to axis) avoids some unwanted color artifacts asthe overlapping colors are blended.

PHPlot Concepts
22
The areas are filled with colors as set with SetDataColors. If data borders are enabled with SetDrawDataBorders, thena border is drawn around each area fill, using the colors set with SetDataBorderColors. (Data borders for area plotswere added in PHPlot-6.2.0.) By default, no data borders are drawn.
An example of this plot type can be seen in Section 5.3, “Example - Area Plot”.
The area plot type is similar to the stackedarea plot type. When plotting a single data set (1 Y value per X), the twoplot types are identical.
3.4.2. Plot Type: bars (Bar Plot)This plot type draws a bar chart, with filled rectangles. Both vertical and horizontal bar charts are available. The barsare centered on the X values (for vertical charts), or on the Y values (for horizontal charts). The rectangles can havea 3-D look (without borders, by default), or be flat (with borders, by default). Multiple data-set plots work, with eachone producing a set of bars offset from the previous set.
For vertical bars, use data type text-data. The data X values are assumed to be at 0.5+N for N=0,1,2... For horizontalbars, use data type text-data-yx. The data Y values are assumed to be at 0.5+N for N=0,1,2... No other data type workswith bar graphs.
If shading is on with SetShading (default is on with value 5 pixels), then the bars have a 3-D look. If shading is off(SetShading(0)), the bars are flat rectangles. The filled bar colors are set with SetDataColors. Data borders aredrawn by default when shading is off. Use SetDrawDataBorders to enable or disable the borders. If the borders areon, the border colors can be set with SetDataBorderColors.
An empty string (or any non-numeric value) for the dependent variable (Y for vertical plots, X for horizontal plots)indicates a missing point. No bar will be drawn at missing point positions.
See also Section 4.7.1, “Tuning Bar Charts”.
Examples of this plot type can be seen in Section 5.4, “Example - Bar Chart”, Section 5.5, “Example - UnshadedBar Chart”, Section 5.6, “Example - Bar Chart, Label Options”, Section 5.19, “Example - Bar Chart with Data ValueLabels”, and Section 5.27, “Example - Horizontal Bar Chart”.
The bars plot type is similar to the stackedbars plot type. When plotting a single data set, the two plot types areidentical.
Horizontal bar plots were added in PHPlot-5.1.2.
3.4.3. Plot Type: boxes (Box Plot)A box plot uses groups of 5 or more numbers to plot a statistical summary of a data set. (This is sometimes called abox and whisker plot.) The first 5 Y values in each row are referred to as Ymin, YQ1, Ymid, YQ3, and Ymax. Byconvention, these represent:
Value Description
Ymin Minimum value. Sometimes used as 5th or 9th percentile instead.
YQ1 Lower quartile - 25th percentile, meaning 25% of the data points are below thisvalue, and 75% are above.
Ymid Median - 50th percentile, meaning half the data points are below this value, andhalf are above.
YQ3 Upper quartile - 75th percentile, meaning 75% of the data points are below thisvalue, and 25% are above.

PHPlot Concepts
23
Value Description
Ymax Maximum value. Sometimes used as 95th or 91st percentile instead.
Any additional numbers (beyond 5) in each row represent outliers. These are generally points outside the range ofYmin and Ymax, and are used when Ymin and Ymax are for some low and high (respectively) percentile values, suchas 5th and 95th.
At each X value, a box plot has the following features:
• box: A rectangular box is drawn from YQ1 to YQ3.
• belt: A horizontal line is drawn through the box at the median position Ymid.
• lower whisker: A vertical line is drawn from the bottom center of the box at the YQ1 position down to the Yminposition, and an upside-down 'T' is drawn at Ymin.
• upper whisker: A vertical line is drawn from the top center of the box at the YQ3 position up to the Ymax position,and a 'T' is drawn at Ymax.
• outliers: If there are any additional values in the row, a marker point (similar to that drawn in a points plot) is drawnat each given Y value.
Note that PHPlot does not force any particular interpretation on the numbers in each row. It draws a box, belt, twowhiskers, and zero or more outliers at each X as described above. PHPlot does however require that the numbers bein order: Ymin <= YQ1 <= Ymid <= YQ3 <= Ymax Any outlier values should be greater than Ymax, or less thanYmin, but PHPlot does not enforce that.
This plot type works with data types text-data and data-data. For 'text-data', the data X values are assumed to be at0.5+N for N=0,1,2...
This plot type requires 5 or more Y values for each X. Multiple data sets are not supported. A missing point is indicatedby using an empty string (or any non-numeric value) for either YQ1 or YQ3 (or both). Nothing at all will be drawn atthat position. If the median value Ymin is an empty string or non-numeric, the belt (median line) is not drawn, but therest of the box plot features are. If either Ymin or Ymax are empty strings or non-numeric, the corresponding whiskerand 'T' end will not be drawn. Finally, any empty strings or non-numeric values in the outlier positions of the data arrayrow are ignored. Regardless of missing values, every row in the data array must still have at least 5 entries for Y values.
This plot type uses 4 colors from the data colors array, indexes 0 through 3. You can use SetDataColors to change thecolors used in the plot. Color 0 is used for the box, color 1 is used for the belt (median line), color 2 is used for theoutliers, and color 3 is used for the whiskers (including the 'T' at the top and bottom).
SetLineWidths can be used to set line widths. Index 0 will be used to draw the box, index 1 is used to draw the belt(median line), and index 2 is used to draw the whiskers and 'T' ends.
The whiskers in a box plot are drawn using the first line style, which defaults to a solid line. Box plots sometimes usedashed lines for the whiskers. Use SetLineStyles('dashed') to have the whiskers drawn as dashed lines. All otherfeatures of a box plot (box, belt, and 'T' ends) use solid lines.
See also Section 4.7.2, “Tuning Box Plots”.
Examples of this plot type can be seen in Section 5.50, “Example - Box Plot with Data Reduction” and Section 5.51,“Example - Box Plot with Outliers and Styles”.
Box plots were added in PHPlot-6.1.0.

PHPlot Concepts
24
3.4.4. Plot Type: bubbles (Bubble Plot)This plot type produces a scatter-plot using filled circles, with the diameter of each circle representing a Z value forthe point. The range of Z values in the plot is linearly mapped into a range of bubble sizes, with the lowest plotted Zvalue producing a bubble with the minimum size, and the largest Z value producing the largest bubble. The smallestand largest bubble sizes are automatically calculated based on the plot area size, but see also Section 4.7.3, “TuningBubble Plots”. Note: There is no way to display the actual numeric Z values on the plot.
Multiple data sets work, with more than one (Y,Z) pair for each X. The bubbles will be drawn using the correspondingcolors in the data colors array, as set with SetDataColors. With multiple data sets (or even a single data set), you mayfind the plot easier to read when using semi-transparent data colors as described in Section 4.3.3, “Using VariableTransparency (Alpha) in PHPlot”.
This plot type only works with data type data-data-xyz. Each (X,Y,Z) triplet from the data array produces a bubbleon the plot.
An empty string (or any non-numeric value) for Y indicates a missing point and will not be plotted. A correspondingZ entry must be provided in the data array, but the value is ignored.
See also Section 4.7.3, “Tuning Bubble Plots”.
An example of this plot type can be seen in Section 5.40, “Example - Bubbles Plot”.
Bubble plots were added in PHPlot-5.5.0.
3.4.5. Plot Type: candlesticks (OHLC Candlesticks Plot)This plot type represents the changing price of a financial instrument (such as a stock or other security) over time. Ateach time point, 4 values are plotted: the opening price, the highest price, the lowest price, and the closing price. Thecandlesticks plot type is one of three Open/High/Low/Close (OHLC) plot types available. It shows the opening andclosing prices as the top and bottom of a narrow rectangle (the candlestick), with an upper wick showing the highestprice, and a lower wick showing the lowest price. The candlestick body is drawn solid filled if the closing price islower than the opening price, and as an outline (unfilled) if the closing price is higher than the opening price. (For avariation on this, see candlesticks2.)
This plot type works with data types text-data and data-data. For 'text-data', the data X values are assumed to be at0.5+N for N=0,1,2...
This plot type requires exactly 4 Y values for each X. These represent the Open, High, Low, and Close prices in thatorder. Multiple data sets are not supported. A missing point is indicated by using four empty strings (or any non-numeric value) for the 4 Y values. (Missing points were not allowed for this plot type in PHPlot-5.4.0 and earlier.)
This plot type uses 4 colors from the data colors array, index 0 through 3. If the security closed lower than it openedfor that time period, then color 0 is used for the candlestick body, and color 2 is used for the upper and lower wicks. Ifthe security closed higher or the same as it opened for that time period, then color 1 is used for the candlestick body,and color 3 is used for the upper and lower wicks.
SetLineWidths can be used to set line widths. Index 0 will be used to draw the candlestick bodies, however thisonly applies to outlined candlestick bodies (drawn when the security closes up). The line width is not used for filledcandlestick bodies (drawn when the security closes down). Line width index 1 will be used to draw the wicks.
See also Section 4.7.4, “Tuning OHLC Charts”.
An example of this plot type can be seen in Section 5.31, “Example - Candlesticks OHLC (Open, High, Low, Close)Financial Plot”.

PHPlot Concepts
25
This plot type was added in PHPlot-5.3.0.
3.4.6. Plot Type: candlesticks2 (OHLC FilledCandlesticks Plot)This plot type represents the changing price of a financial instrument (such as a stock or other security) over time. Thecandlesticks2 plot type is the same as the candlesticks plot type, except the candlestick bodies are always drawn filled,regardless of whether the security closes up or down.
Color usage is the same as with candlesticks plots, with the first 4 data colors used (index 0 through 3). If the securityclosed down, color 0 is used for the body, and color 2 is used for the wicks. If the security closed up or the same, color1 is used for the body, and color 3 is used for the wicks. Be sure to set data colors 0 and 2 with SetDataColors for thisplot type. Unlike candlesticks, candlesticks2 plots use only color to show the difference between a security closing upor closing down. The default colors in these slots (sky blue and orange) are probably not appropriate.
Line width usage is similar to candlesticks plots, except that the candlestick bodies are always filled so line widthindex 0 (body outline line width) is never used. Line width index 1 is used for the wicks.
This plot type works with data types text-data and data-data. For 'text-data', the data X values are assumed to be at0.5+N for N=0,1,2...
This plot type requires exactly 4 Y values for each X. These represent the Open, High, Low, and Close prices in thatorder. Multiple data sets are not supported. A missing point is indicated by using four empty strings (or any non-numeric value) for the 4 Y values. (Missing points were not allowed for this plot type in PHPlot-5.4.0 and earlier.)
See also Section 4.7.4, “Tuning OHLC Charts”.
An example of this plot type can be seen in Section 5.32, “Example - Filled Candlesticks OHLC (Open, High, Low,Close) Financial Plot”.
This plot type was added in PHPlot-5.3.0.
3.4.7. Plot Type: linepoints (Lines and Points Plot)This plot type draws a line graph with a marker at each point, thus combining the 'lines' and 'points' plot types.
This plot type works with data types text-data and data-data. For 'text-data', the data X values are assumed to be at0.5+N for N=0,1,2... It also works with data-data-error for error plots. These produce the usual vertical plots.
This plot type also works with data types text-data-yx and data-data-yx to produce horizontal plots, and with data typedata-data-yx-error to produce horizontal error plots. For 'text-data-yx', the data Y values are assumed to be at 0.5+Nfor N=0,1,2... (Horizontal 'linepoints' plots were added in PHPlot-6.0.0. Horizontal 'linepoints' error plots were addedin PHPlot-6.1.0.)
An empty string (or any non-numeric value) for the dependent variable (Y for vertical plots, X for horizontal plots)indicates a missing point. PHPlot can either skip the line segments around missing points, or connect the adjacentpoints. See SetDrawBrokenLines for details.
Line and marker colors for each line are set with SetDataColors. Marker styles for each line are set with SetPointShapes.Marker sizes for each line are set with SetPointSizes. Line widths for each line are set with SetLineWidths. Line styles(solid or dashed) for each line are set with SetLineStyles.
You can also suppress the line, or the markers, for individual data sets in a graph. This allows you combine points-only, lines-only, and line/points plots. Refer to SetLineStyles and SetPointShapes for details.

PHPlot Concepts
26
For error plots only: Error bar colors for each line are set with SetErrorBarColors. Error bar shape (tee or line) is set withSetErrorBarShape. If tee-shaped error bars are used, the width of the upper and lower 'tee' is set with SetErrorBarSize.Error bar line width is set with SetErrorBarLineWidth.
Example of this plot type can be seen in Section 5.7, “Example - Line/Point Plot, Point Shapes” and Section 5.48,“Example - Horizontal Linepoints Plot with Data Value Labels and Lines”.
3.4.8. Plot Type: lines (Lines Plot)This plot type simply draws a line from each point to the next.
This plot type works with data types text-data and data-data. For 'text-data', the data X values are assumed to be at0.5+N for N=0,1,2... It also works with data-data-error for error plots. These produce the usual vertical plots.
This plot type also works with data types text-data-yx and data-data-yx to produce horizontal plots, and with datatype data-data-yx-error to produce horizontal error plots. For 'text-data-yx', the data Y values are assumed to be at0.5+N for N=0,1,2... (Horizontal 'lines' plots were added in PHPlot-6.0.0. Horizontal 'lines' error plots were addedin PHPlot-6.1.0.)
An empty string (or any non-numeric value) for the dependent variable (Y for vertical plots, X for horizontal plots)indicates a missing point. PHPlot can either skip the line segments around missing points, or connect the adjacentpoints. See SetDrawBrokenLines for details.
Line colors for each line are set with SetDataColors. Line widths for each line are set with SetLineWidths. Line styles(solid or dashed) for each line are set with SetLineStyles.
For error plots only: Error bar colors for each line are set with SetErrorBarColors. Error bar shape (tee or line) is set withSetErrorBarShape. If tee-shaped error bars are used, the width of the upper and lower 'tee' is set with SetErrorBarSize.Error bar line width is set with SetErrorBarLineWidth.
Examples of this plot type can be seen in Section 5.1, “Example - Line Plot” and Section 5.2, “Example - Line Plot:Functions”.
3.4.9. Plot Type: ohlc (Basic OHLC Plot)This plot type represents the changing price of a financial instrument (such as a stock or other security) over time. Ateach time point, 4 values are plotted: the opening price, the highest price, the lowest price, and the closing price. Theohlc plot type is one of three Open/High/Low/Close (OHLC) plot types available. It shows a vertical line connectingthe low and high prices, with small horizontal tick marks showing the opening and closing prices. The opening pricetick mark is on the left of the vertical line, and the closing price tick mark is on the right.
This plot type works with data types text-data and data-data. For 'text-data', the data X values are assumed to be at0.5+N for N=0,1,2...
This plot type requires exactly 4 Y values for each X. These represent the Open, High, Low, and Close prices in thatorder. Multiple data sets are not supported. A missing point is indicated by using four empty strings (or any non-numeric value) for the 4 Y values. (Missing points were not allowed for this plot type in PHPlot-5.4.0 and earlier.)
This plot type uses 4 colors from the data colors array. If the security closed lower than it opened for that time period,then color 0 is used for the vertical line, and color 2 is used for the open and close tick marks. If the security closedhigher or the same as it opened for that time period, then color 1 is used for the vertical line, and color 3 is used forthe open and close tick marks.
SetLineWidths can be used to set line widths. Index 0 will be used to draw the vertical lines, and index 1 will be usedto draw the tick marks.
PHPlot Concepts
27
See also Section 4.7.4, “Tuning OHLC Charts”.
An example of this plot type can be seen in Section 5.30, “Example - Basic OHLC (Open, High, Low, Close) FinancialPlot”.
This plot type was added in PHPlot-5.3.0.
3.4.10. Plot Type: pie (Pie Plot)This plot type draws pie charts. The pie chart can have a 3-D look or be drawn flat. By default, the first pie segmentstarts at 0 degrees (East, or 3:00 on an analog clock face) and segments go around the pie in a counter-clockwisedirection. (The start point and direction can be changed with SetPieStartAngle and SetPieDirection.) Each segmentcan be labeled. By default, the labels show the percentage of each segment.
This plot type works with data types text-data, data-data, and text-data-single. Data arrays for pie charts are handleddifferently from with other plot types, so the data types are described in more detail below.
If shading is on with SetShading (default is on with value 5 pixels), then the pie chart has a 3-D look. If shading is off(SetShading(0)), the pie chart is drawn flat (circular rather than oval). The position of the segment labels is setwith SetLabelScalePosition. The content and formatting of the segment labels is controlled with SetPieLabelType.
Missing values (an empty string or any non-numeric value) are taken as zero. Any segment with arc angle less than1 degree will not be drawn. (This is due to the PHP GD implementation of imagefilledarc, which uses integerdegrees.)
See also Section 4.7.5, “Tuning Pie Charts”.
Examples of this plot type can be seen in Section 5.8, “Example - Pie Chart, text-data-single” (text-data-single),Section 5.9, “Example - Pie Chart, text-data” (text-data), and Section 5.10, “Example - Pie Chart, flat with options”(unshaded).
3.4.10.1. Pie Chart with data type: 'text-data-single'
The data array for pie charts with 'text-data-single' data type is structured as follows. Each record in the data arrayrepresents a pie segment. The record is an array of 2 elements: label and value. By default, the labels from the dataarray are ignored, but these can be used to label the pie segments with SetPieLabelType. The values in the data arrayset the size of each pie segment. PHPlot totals up the values and computes the relative size of each segment.
For example:
$data = array(array('', 1), array('',4), array('',5));
This makes a pie chart with 3 segments, with sizes 10%, 40%, and 50%.
The data array labels can also be used to build a plot legend. For example, this will produce a pie chart with 3 segments,and a legend with 3 entries using the labels from the data array:
$data = array(array('Gold', 100), array('Silver',35), array('Copper',12));$plot = new PHPlot();$plot->SetPlotType('pie');$plot->SetDataType('text-data-single');$plot->SetDataValues($data);foreach ($data as $row) $plot->SetLegend($row[0]); // Copy labels to legend$plot->DrawGraph();
A slightly more complex example of this can be seen in Section 5.8, “Example - Pie Chart, text-data-single”. This onlyworks for the 'text-data-single' data type, where each row or record in the data array is used to build one pie segment.
PHPlot Concepts
28
3.4.10.2. Pie Chart with data type: 'text-data'
The data array for pie charts with 'text-data' data type is structured as follows. Each record in the data array is an arrayof a label followed by N data values. The label is ignored. The pie chart will be produced with N segments. The relativeweight of the first segment is the sum of the first data values in each record. The relative weight of each subsequentsegment is the sum of the corresponding data values in each record.
For example:
$data = array(array('', 10, 10, 20, 10), array('', 15, 10, 15, 10));
This results in 4 segments with sizes 25%, 20%, 35%, and 20%.
3.4.10.3. Pie Chart with data type: 'data-data'
The data array for pie charts with 'data-data' data type is structured the same as 'text-data', except that the first twovalues in each record are ignored (the positions usually used for label and X value). Each element in the data arrayrepresents a record. Each record is an array of a label, X value, then N data values. The label and X value are ignored.The pie chart will be produced with N segments. The relative weight of the first segment is the sum of the first datavalues in each record. The relative weight of each subsequent segment is the sum of the corresponding data valuesin each record.
For example:
$data = array(array('', 1, 10, 10, 20, 10), array('', 2, 15, 10, 15, 10));
This results in 4 segments with sizes 25%, 20%, 35%, and 20%. The empty strings and '1' and '2' are ignored.
3.4.11. Plot Type: points (Styled Dot Plot)This plot type draws a point marker at each X,Y value.
This plot type works with data types text-data and data-data. For 'text-data', the data X values are assumed to be at0.5+N for N=0,1,2... It also works with data-data-error for error plots. These produce the usual vertical plots.
This plot type also works with data types text-data-yx and data-data-yx to produce horizontal plots, and with datatype data-data-yx-error to produce horizontal error plots. For 'text-data-yx', the data Y values are assumed to be at0.5+N for N=0,1,2... (Horizontal 'points' plots were added in PHPlot-6.0.0. Horizontal 'points' error plots were addedin PHPlot-6.1.0.)
Marker colors for each line are set with SetDataColors. Marker styles for each line are set with SetPointShapes. Markersizes for each line are set with SetPointSizes.
For error plots only: Error bar colors for each line are set with SetErrorBarColors. Error bar shape (tee or line) is set withSetErrorBarShape. If tee-shaped error bars are used, the width of the upper and lower 'tee' is set with SetErrorBarSize.Error bar line width is set with SetErrorBarLineWidth.
An empty string (or any non-numeric value) for the dependent variable (Y for vertical plots, X for horizontal plots)indicates a missing point. No point marker will be drawn at missing point positions.
Examples of this plot type can be seen in Section 5.12, “Example - Points Plot / Scatterplot”, Section 5.11, “Example- Points Plot with Error Bars”, and Section 5.49, “Example - Horizontal Error Plot”.

PHPlot Concepts
29
3.4.12. Plot Type: squared (Squared Plot)This plot type makes stepped lines. For each point, you get a horizontal line from the previous point to the currentX, then a vertical line to the current Y.
This plot type works with data types text-data and data-data. For 'text-data', the data X values are assumed to be at0.5+N for N=0,1,2...
An empty string (or any non-numeric value) for a Y value indicates a missing point. PHPlot can either skip the linesegments around missing points, or connect the adjacent points. See SetDrawBrokenLines for details.
Line colors per line are set with SetDataColors. Line widths per line are set with SetLineWidths. Line style (solid ordashed) per line are set with SetLineStyles.
An example of this plot type can be seen in Section 5.13, “Example - Squared Plot”.
3.4.13. Plot Type: squaredarea (Squared Area Plot)This plot type draws filled areas between squared (or stepped) lines. Each data set (set of corresponding Y values fromeach record in the data array) is plotted in order, with the area between the data set and the next data set filled solid.The edges of the filled area are stepped lines, as with the squared plot type, rather than straight line segments, as inthe area plot type. The area between the last line and the X axis1 is also filled. The data must be arranged so the valuesare (generally) decreasing within each row, because later drawn filled areas will cover previously drawn areas.
Because squared lines are drawn by stepping X first, then Y, the last Y value is usually not visible because there isno width for a filled area. One work-around is to append a copy of the last row of the data array. This is shown inthe example linked below.
This plot type works with data types text-data and data-data. For 'text-data', the data X values are assumed to be at0.5+N for N=0,1,2...
A minimum of 2 rows (X values and corresponding Y value(s)) is required for this plot type. If there are fewer than2 rows, an empty plot will be produced.
This plot type uses the absolute value of each supplied Y, because negative values do not make sense here. Missingvalues are taken as zero. All records in the data array must have the same number of Y values.
The areas are filled with colors as set with SetDataColors. If data borders are enabled with SetDrawDataBorders, thena border is drawn around each area fill, using the colors set with SetDataBorderColors. By default, no data bordersare drawn.
An example of this plot type can be seen in Section 5.52, “Example - Squared Area Plot”.
The squaredarea plot type is similar to the stackedsquaredarea plot type. When plotting a single data set (1 Yvalue per X), the two plot types are identical.
This plot type was added in PHPlot-6.2.0.
3.4.14. Plot Type: stackedarea (Stacked Area Plot)This plot type draws filled areas between lines, similar to area except the values are accumulated as in stackedbarsplots. The area between the X axis and the first data set (the line resulting from the first Y value from each record) isfilled first. Then the area above that line, up to the sum of the first and second Y values in each record, is filled next.This repeats until filling the area up to the top-most line, which is the sum of all the Y values from each record.

PHPlot Concepts
30
This plot type works with data types text-data and data-data. For 'text-data', the data X values are assumed to be at0.5+N for N=0,1,2...
A minimum of 2 rows (X values and corresponding Y value(s)) is required for this plot type. If there are fewer than2 rows, an empty plot will be produced.
This plot type uses the absolute value of each supplied Y, because negative values do not make sense here. Missingvalues are taken as zero. All records in the data array must have the same number of Y values.
The areas are filled with colors as set with SetDataColors. Note that color selection with stackedarea plots tendsto go in the reverse order compared to area plots. For stacked plots, the first area fill using the first color fills the areaextending up from the X axis to the first data set. So the first color is always at the bottom of the plot. For unstackedplots, the last area fill using the last color fills the area extending up from the X axis to the last data set. Unless this dataset contains the lowest Y values (and is drawn at the bottom of the plot), it will cover all the other data set area fills.So typically the unstacked plot has to have the last color at the bottom of the plot. Compare Section 5.3, “Example -Area Plot” and Section 5.21, “Example - Stacked Area Plot”.
If data borders are enabled with SetDrawDataBorders, then a border is drawn around each area fill, using the colorsset with SetDataBorderColors. (Data borders for stackedarea plots were added in PHPlot-6.2.0.) By default, nodata borders are drawn.
An example of this plot type can be seen in Section 5.21, “Example - Stacked Area Plot”.
This plot type was added in PHPlot-5.1.1.
A stackedarea plot is identical to an area plot when plotting a single data set (1 Y value per X),
3.4.15. Plot Type: stackedbars (Stacked Bar Plot)This plot type draws a bar chart with stacked bars. Both vertical and horizontal stacked bar charts are available. Thebars are centered on the X values (for vertical charts), or on the Y values (for horizontal charts). Each data set valuecontributes one segment of a stack. That is, the first data set is drawn from the axis in the first color, then the seconddata set is drawn stacked on the first using the second color, etc.
Data values greater than zero result in an upward (or rightward) bar. Data values less than zero result in a downward(or leftward) bar. Mixing negative and positive values within a row does work, but the results are not generally useful.The first non-zero value in any given row determines the direction of that bar stack. PHPlot keeps a running total foreach row, but does not draw any segment unless it increases the bar stack height (or length, for horizontal plots). Italso does not draw any segment on the wrong side of the axis (which is normally at 0).
Segments of length zero in a bar stack are usually ignored, but they might be visible if the axis is moved in the directionopposite to the bar stack direction. (For example, axis is at Y=2, stack contains segment values 0 and -4; the 0 segmentis drawn down from the axis at Y=2 to Y=0, followed by the second segment down to -4).
For vertical bars, use data type text-data. The data X values are assumed to be at 0.5+N for N=0,1,2... For horizontalbars, use data type text-data-yx. The data Y values are assumed to be at 0.5+N for N=0,1,2... No other data type workswith stacked bar plots.
If shading is on with SetShading (default is on with value 5 pixels), then the bars have a 3-D look. If shading is off(SetShading(0)), the bars are flat rectangles. The filled colors for each stacked segment are set with SetDataColors.Data borders are drawn by default when shading is off. Use SetDrawDataBorders to enable or disable the borders. Ifthe borders are on, the border colors can be set with SetDataBorderColors.
Missing values (an empty string or any non-numeric value) are taken as zero, except that they do not result in a visiblesegment in the case of a moved axis described above.
See also Section 4.7.1, “Tuning Bar Charts”.

PHPlot Concepts
31
Examples of this plot type can be seen in Section 5.14, “Example - Stacked Bars, Shaded”, Section 5.15, “Example- Stacked Bars, Unshaded”, Section 5.20, “Example - Stacked Bars with Y Data Value Labels”, and Section 5.28,“Example - Horizontal Stacked Bar Chart”.
The stackedbars plot type is similar to the bars plot type. When plotting a single data set, the two plot types areidentical.
Horizontal stackedbars plots were added in PHPlot-5.1.3. Support for negative values in stackedbars plots was addedin PHPlot-5.2.0. Before PHPlot-5.4.0, zero values were completely ignored in stackedbars plots. From PHPlot-5.4.0through PHPlot-5.6.0, a zero value at the end of a data row (or an all zero row) would result in a color 'cap' on the topof the bar stack, but this was changed in PHPlot-5.7.0.
3.4.16. Plot Type: stackedsquaredarea (Stacked SquaredArea Plot)This plot type draws filled areas between squared (or stepped) lines, similar to squaredarea except the values areaccumulated as in stackedbars plots. The area between the X axis and the first data set (the squared line resulting fromthe first Y value from each record) is filled first. Then the area above that up to the sum of the first and second Y valuesin each record is filled next. This repeats until filling the area up to the top-most squared line, which is the sum of allthe Y values from each record. The edges of the filled areas are squared lines, as with the squared plot type.
Because squared lines are drawn by stepping X first, then Y, the last Y value is usually not visible because there isno width for a filled area. One work-around is to append a copy of the last row of the data array. This is shown inthe example linked below.
This plot type works with data types text-data and data-data. For 'text-data', the data X values are assumed to be at0.5+N for N=0,1,2...
A minimum of 2 rows (X values and corresponding Y value(s)) is required for this plot type. If there are fewer than2 rows, an empty plot will be produced.
This plot type uses the absolute value of each supplied Y, because negative values do not make sense here. Missingvalues are taken as zero. All records in the data array must have the same number of Y values.
The areas are filled with colors as set with SetDataColors. If data borders are enabled with SetDrawDataBorders, thena border is drawn around each area fill, using the colors set with SetDataBorderColors. By default, no data bordersare drawn.
Note that color selection with stackedsquaredarea plots tends to go in the reverse order compared tosquaredarea plots. For stacked plots, the first area fill using the first color fills the area extending up from the Xaxis to the first data set. So the first color is always at the bottom of the plot. For unstacked plots, the last area fill usingthe last color fills the area extending up from the X axis to the last data set. Unless this data set contains the lowest Yvalues (and is drawn at the bottom of the plot), it will cover all the other data set area fills. So typically the unstackedplot has to have the last color at the bottom of the plot. Compare Section 5.52, “Example - Squared Area Plot” andSection 5.53, “Example - Stacked Squared Area Plot”.
An example of this plot type can be seen in Section 5.53, “Example - Stacked Squared Area Plot”.
A stackedsquaredarea plot is identical to a squaredarea plot when plotting a single data set (1 Y value per X).
This plot type was added in PHPlot-6.2.0.
3.4.17. Plot Type: thinbarline (Thin Bar Line Plot)This plot type draws lines from the axis to the data value. Other implementations call this type of plot impulses. Bothvertical and horizontal thinbarline plots are available. Plotting multiple data sets does not work, because the lines are

PHPlot Concepts
32
drawn on top of each other and only one can typically be seen. This plot type can be more readable than a bar chartwhen there are a large number of data points.
For vertical plots, use data type text-data or data-data. For 'text-data', the data X values are assumed to be at 0.5+Nfor N=0,1,2... For horizontal plots, use data type text-data-yx or data-data-yx. For 'text-data-yx', the data Y values areassumed to be at 0.5+N for N=0,1,2...
The width of the plot lines can be controlled with SetLineWidths.
An empty string (or any non-numeric value) for the dependent variable (Y for vertical plots, X for horizontal plots)indicates a missing point. No line will be drawn at missing point positions.
Examples of this plot type can be seen in Section 5.16, “Example - Thin Bar Line Plot”, Section 5.17, “Example - ThinBar Line Plot, Wider Lines”, and Section 5.29, “Example - Horizontal Thin Bar Line Plot”.
3.4.18. Plot Types and Data TypesThe following table indicates which plot types support which data types. Refer to Section 3.3, “PHPlot Data Types”for more information on data types.
Data Type:
Plot Type:
text-data data-data data-data-error
text-data-single
text-data-yx
data-data-yx
data-data-
yx-error
data-data-xyz
area Yes Yes
bars Yes Yes
boxes Yes Yes
bubbles Yes
candlesticks Yes Yes
candlesticks2 Yes Yes
linepoints Yes Yes Yes Yes Yes Yes
lines Yes Yes Yes Yes Yes Yes
pie Yes Yes Yes
ohlc Yes Yes
points Yes Yes Yes Yes Yes Yes
squared Yes Yes
squaredarea Yes Yes
stackedarea Yes Yes
stackedbars Yes Yes
stackedsquaredarea Yes Yes
thinbarline Yes Yes Yes Yes
3.5. Colors
This section contains information about using colors in PHPlot. Functions described in Section 6.3,“Colors and Line Styles” in the Reference chapter control the use of colors in PHPlot.

PHPlot Concepts
33
This section describes Palette images. Starting with PHPlot-5.1.1, a second color model is availablein PHPlot: Truecolor images. Refer to Section 4.3, “Truecolor Images” for more information.
3.5.1. Color Parameter FormsIndividual colors as arguments to PHPlot functions can take one of the following forms:
1. A color name, as defined by SetRGBArray or from a built-in color map if SetRGBArray was not called. Note thatcolor names are case sensitive.
2. Numeric color component values, in the form #rrggbb. Here rr is red, gg is green, and bb is blue, and eachcomponent value is represented as a 2-digit hexadecimal number between 00 and ff. For example, #0000ff isfull-saturation blue.
3. A PHP array of red, green, and blue color component values, each value being in the range 0 to 255 inclusive, forexample array(0,0,255) for blue.
Additional color forms can be found in Section 4.3.4, “Color Parameter Form Extensions”. Those forms are moreuseful with truecolor images.
Note
You cannot use the (red, green, blue) array form as a color value in those functions (like SetDataColors)which accept either a single color or an array of colors. The functions are unable to distinguish between anarray of colors and a single color represented as an array. However, you can work around this restriction byusing an array containing the array with the colors, for example: array(array(102, 0, 192)).
3.5.2. Built-in Color MapsThere are 36 colors defined in the 'small' internal color map. This is the set of color names which are available bydefault, unless SetRGBArray is used to load in a different color map. The colors and their names are shown in thefigure below.
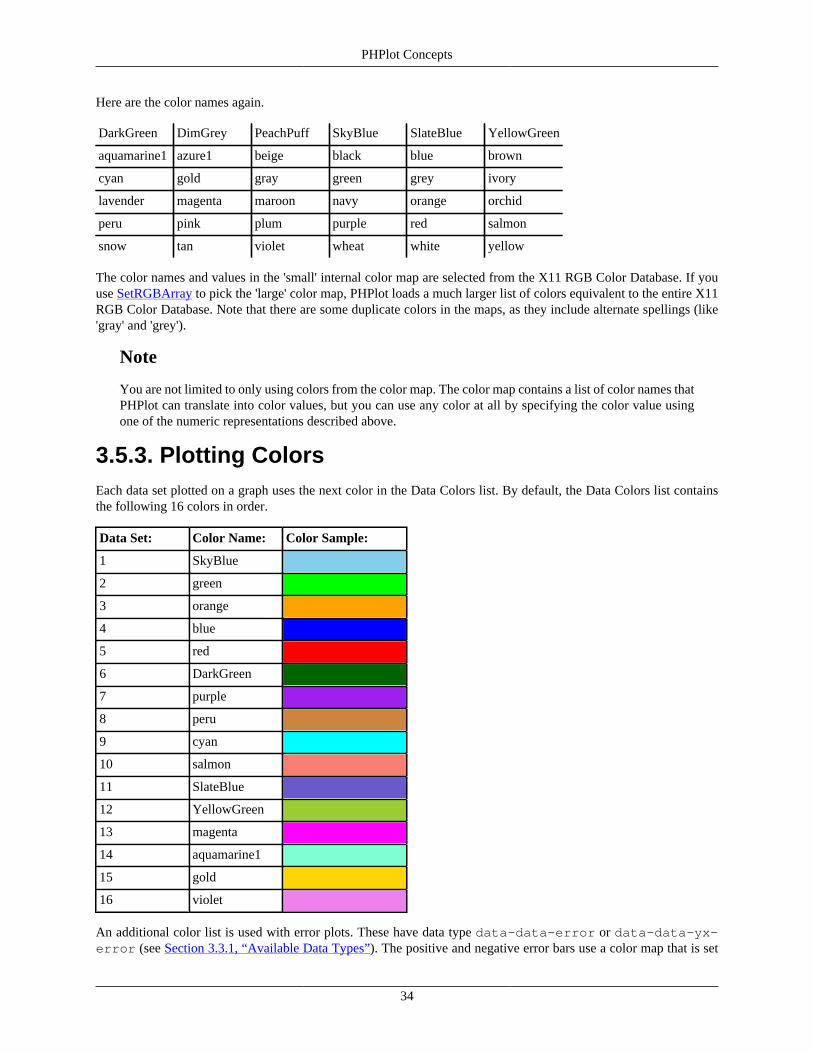
PHPlot Concepts
34
Here are the color names again.
DarkGreen DimGrey PeachPuff SkyBlue SlateBlue YellowGreen
aquamarine1 azure1 beige black blue brown
cyan gold gray green grey ivory
lavender magenta maroon navy orange orchid
peru pink plum purple red salmon
snow tan violet wheat white yellow
The color names and values in the 'small' internal color map are selected from the X11 RGB Color Database. If youuse SetRGBArray to pick the 'large' color map, PHPlot loads a much larger list of colors equivalent to the entire X11RGB Color Database. Note that there are some duplicate colors in the maps, as they include alternate spellings (like'gray' and 'grey').
Note
You are not limited to only using colors from the color map. The color map contains a list of color names thatPHPlot can translate into color values, but you can use any color at all by specifying the color value usingone of the numeric representations described above.
3.5.3. Plotting ColorsEach data set plotted on a graph uses the next color in the Data Colors list. By default, the Data Colors list containsthe following 16 colors in order.
Data Set: Color Name: Color Sample:
1 SkyBlue
2 green
3 orange
4 blue
5 red
6 DarkGreen
7 purple
8 peru
9 cyan
10 salmon
11 SlateBlue
12 YellowGreen
13 magenta
14 aquamarine1
15 gold
16 violet
An additional color list is used with error plots. These have data type data-data-error or data-data-yx-error (see Section 3.3.1, “Available Data Types”). The positive and negative error bars use a color map that is set

PHPlot Concepts
35
using SetErrorBarColors. By default, this color list contains the same colors as the data color list, so each data set andits error bars will be in the same color. If you change the data colors list with SetDataColors, you probably want tochange the error bar color list too, so you get the same colors for data sets and their error bars.
Some plot types support data borders, which are outlines around filled areas. This includes the bars andsquaredarea plot types, for example. Use SetDrawDataBorders to enable or disable drawing of data borders. Thecolors used for data borders can be set with SetDataBorderColors. By default, a black data border is used for all datasets, if borders are enabled.
Note: PHPlot through version 5.0.7 used 8 colors in the default Data Colors list: SkyBlue, green, orange, blue, orange,red, violet, and azure1. If plotting more than four data sets with PHPlot-5.0.7 or earlier, you should use SetDataColorsto define your own data colors list. Otherwise you will get two data sets plotted in the same color, orange.
Instead of using sequential data colors for plotted data sets, you can control exactly which data color is used for eachdata value using the data color callback. For more information, see Section 4.5, “Custom Data Color Selection”.
Some plot types which only support a single data set still use multiple data colors, but in a way that is specific tothat plot type. This is described for each applicable plot type in Section 3.4, “PHPlot Plot Types”. For example, the 3OHLC financial plot types use the first 4 data colors for different parts of the marker at each data point, as well as toindicate the overall direction (up or down). You can use the same methods - SetDataColors or a data color callback- to change colors for these plot types.
3.5.4. Transparency
You can designate one color in the color map to be transparent. This is most often used to make a plot with atransparent background. Use SetTransparentColor to designate the color, and SetBackgroundColor to use that colorfor the background. Use a color which is not otherwise used in the plot.
For transparency to work, the output format (see SetFileFormat) must support transparency, and the the user's vieweror browser also must support transparency. If transparency is not supported, the user will see the actual color whichwas designated as transparent (so don't use red, for example). Most viewers support transparency in GIF format, andnewer viewers should support transparency in PNG format. JPEG format does not support transparency.
3.5.5. Plot Element Colors
The following table shows the function(s) used to set the color of each element on a plot, and the default color ifno functions are used to change it. Where multiple function names are shown, they are listed from highest to lowestpriority. (That is, if the first function is not used, the color is set with the second function, etc.)
Plot element: Function(s) used to set color: Default color:
Data borders SetDataBorderColors black
Data elements (points, lines, areafill, etc.)
SetDataColors See Section 3.5.3, “PlottingColors”
Data value labels SetDataValueLabelColor,SetDataLabelColor, SetTextColor
black
Error bars SetErrorBarColors Same as data colors. SeeSection 3.5.3, “Plotting Colors”
Image background SetBackgroundColor white
Image border SetImageBorderColor #c2c2c2 gray

PHPlot Concepts
36
Plot element: Function(s) used to set color: Default color:
Legend background SetLegendBgColor, SetBackgroundColor white
Legend color box fill or shapemarker
SetDataColors N/A
Legend color box borders SetTextColor or SetDataBorderColors (seenotes)
black
Legend border SetGridColor black
Legend text SetLegendTextColor, SetTextColor black
Main title SetTitleColor black
Pie chart data labels SetPieLabelColor, SetGridColor black
Pie segment borders SetPieBorderColor, SetGridColor black
Pie segment fill SetDataColors N/A
Plot area background SetPlotBgColor white, but disabled by default
Plot border SetGridColor black
X axis line SetGridColor black
X axis data labels SetDataLabelColor, SetTextColor black
X data label lines SetLightGridColor gray
X grid lines SetLightGridColor gray
X tick labels SetTickLabelColor, SetTextColor black
X tick marks SetTickColor black
X title SetXTitleColor, SetTitleColor black
Y axis lines SetGridColor black
Y axis data labels SetDataLabelColor, SetTextColor black
Y data label lines SetLightGridColor gray
Y grid lines SetLightGridColor gray
Y tick labels SetTickLabelColor, SetTextColor black
Y tick marks SetTickColor black
Y title SetYTitleColor, SetTitleColor black
The following notes apply to the table of plot element colors above:
• Data borders refers to the borders, or outlines, around bars in a bars or stackedbars plot. Data borders arealso available with the area, squaredarea, stackedarea, and stackedsquaredarea plot types.
• SetPieBorderColor was added in PHPlot-6.0.0. In prior releases, pie segment borders (which were available onlyon unshaded pie charts) used the color set with SetGridColor. The new function is backwards compatible, as theborders default to the grid color if SetPieBorderColor is not used.
• SetDataLabelColor, SetDataValueLabelColor, SetPieLabelColor, and SetTickLabelColor were added inPHPlot-5.7.0. Through PHPlot-5.6.0:
• Tick labels and axis data labels all used the color set with SetTextColor.
• Data value labels (incorrectly) used the title color set with SetTitleColor.

PHPlot Concepts
37
• Pie chart labels used the grid color set with SetGridColor.Except for data value labels, the defaults are backwards compatible. That is, if you use SetGridColor() and donot use the new SetPieLabelColor(), your pie chart labels will display in the same color with all releases.
• The legend background uses the overall image background color set with SetBackgroundColor by default. Startingwith PHPlot-6.0.0, you can set the legend background color separately with SetLegendBgColor.
• The legend color box borders use the color set with SetTextColor by default. Starting with PHPlot-6.0.0, you canuse the colors set with SetDataBorderColors instead. See SetLegendColorboxBorders.
• Legend text uses the general text color set with SetTextColor by default. Starting with PHPlot-6.0.0, you can setthe legend text color separately with SetLegendTextColor.
3.6. Labels
This section contains information about creating labels which identify data values on the plot. For alist of functions used to control labels, see Section 6.11, “Labels”.
Several types of labels are available in PHPlot:
• Tick labels identify the values at the tick positions. There are X tick labels and Y tick labels.
• Axis data labels display the label values from your data array. X axis data labels are available for vertical plots, andY axis data labels are available for horizontal plots.
• Data value labels display the actual value of a data point. These are available only for some plot types. Y data valuelabels are available for vertical plots, and X data value labels are available for horizontal plots.
• Pie chart data labels identify the pie segments. By default, they show the percentage of each pie segment.
Note
The term data label is often used to refer to both axis data labels and data value labels. The same PHPlotfunctions are used to configure axis data labels and data value labels.
Here is a sample plot with the Y tick labels and X axis data labels called out.

PHPlot Concepts
38
Here is a sample plot with the pie chart labels called out.
Here is a sample vertical bar plot with the Y tick labels, Y data value labels, and X axis data labels called out.
Here is a sample horizontal bar plot with the Y (axis) data labels, X data value labels, and X tick labels called out.

PHPlot Concepts
39
3.6.1. Tick LabelsTick labels identify the X or Y values at tick positions (even if the tick marks themselves are not drawn). SeeSection 3.7.4, “Tick Marks” for information about the tick positions.
Note that even with data type 'data-data', where explicit independent variable values for the data are supplied, the tickpositions and labels along that axis are still calculated automatically (unless modified by the available functions). Forexample, for vertical plots, your supplied X values in the data array are not used for the X tick labels.
You can enable, disable, or position the tick labels with SetXTickLabelPos and SetYTickLabelPos.
3.6.2. Axis Data LabelsAxis data labels are available for the independent variable axis. This is X for vertical plots, and Y for horizontal plots.These data labels are supplied in your data array for each data point. For example, with data type text-data :
$data = array( array('Peaches',100), array('Apples', 140), array('Pears', 90));
The three points have data labels 'Peaches', 'Apples', and 'Pears'. For vertical plots, these data labels will be drawn atthe bottom of the plot (by default) below the corresponding X values. For horizontal plots, these data labels will bedrawn to the left of the plot (by default), to the left of the corresponding Y values. You can disable or reposition thedata labels with SetXDataLabelPos and SetYDataLabelPos.
Note
The axis data labels are not necessarily drawn along axis lines. They are usually drawn along the bottom (forX) or left side (for Y) of the plot. Although these are also the usual positions for the X axis and Y axis, theactual axis lines may be drawn elsewhere. See SetXAxisPosition or SetYAxisPosition for more informationon axis positions.
You will generally not want both tick labels and axis data labels on, because they will overlap and be unreadable.If you are not using data labels, you should either make them all empty strings in your data array, or else useSetXDataLabelPos('none') (for vertical plots) or SetYDataLabelPos('none') (for horizontal plots) to turn them off. Youcan also call SetXTickLabelPos (for vertical plots) or SetYTickLabelPos (for horizontal plots) to explicitly positionthe tick labels. PHPlot will then disable the data labels.
If you don't tell PHPlot what to do with data and tick labels, the behavior depends on the PHPlot version. PHPlot 5.1.0and later will examine your data array to see if there are any non-empty data labels, and if so it will draw only datalabels, and omit tick labels. If all of the labels in your data array are empty, tick labels will be drawn. (PHPlot through5.0.7 will draw both tick and data labels in these cases.)
3.6.3. Data Value LabelsData value labels are available only for some plot types. These are displayed inside the plot, and show the value ateach data point, bar, or bar segment.
For vertical bar charts, Y data value labels indicate the Y value for each bar, and are drawn above the bar for positivevalues, or below the bar for negative values. For vertical stackedbar charts, Y data value labels indicate the total Y valuefor each stack, and optionally indicate the value of each segment. Use SetYDataLabelPos to enable Y data value labels.
For horizontal bar charts, X data value labels indicate the X value for each bar, and are drawn to the left or right ofthe end of the bar. For horizontal stackedbar charts, X data value labels indicate the total X value for each stack, andoptionally indicate the value of each segment. Use SetXDataLabelPos to enable X data value labels.

PHPlot Concepts
40
Y data value labels are also available for vertical plots of types lines, linepoints, points, and squared (starting inPHPlot-5.3.0). X data value labels are available for horizontal plots of types lines, linepoints, and points (starting inPHPlot-6.0.0). The data value labels indicate the value of each point and are displayed (by default) above each point.Use SetYDataLabelPos to enable Y data value labels for these vertical plots, and SetXDataLabelPos to enable X datavalue labels for these horizontal plots. PHPlot does not attempt to prevent interference between the labels and otherplot elements. To change the position of the labels, see Section 4.7.7, “Tuning Labels”.
Data value labels are not available with other plot types.
Note
The same function is used to position X axis data labels and X data value labels, and the same function isused to position Y axis data labels and Y data value labels. There is no ambiguity, because one type of labelis available for each axis for vertical plots, and the other type for horizontal plots.
Example 5.19, “Bar Chart with Data Value Labels” shows a vertical bar chart with Y data value labels. Example 5.20,“Stacked Bars with Y Data Value Labels” shows a vertical stacked bar chart with Y data value labels. Example 5.33,“Linepoints Plot with Data Value Labels” shows a linepoints plot with Y data value labels.
Example 5.27, “Horizontal Bar Chart” shows a horizontal bar chart with X data value labels. Example 5.28, “HorizontalStacked Bar Chart” shows a horizontal stacked bar chart with X data value labels. Example 5.48, “HorizontalLinepoints Plot with Data Value Labels and Lines” shows a horizontal linepoints plot with X data value labels.
3.6.4. Pie Chart LabelsPie chart labels identify segments on a pie chart. By default, these show the percentage of each segment, relative to thewhole pie. Starting with PHPlot-5.6.0, pie chart labels can display other information, and can be flexibly formatted.
Use SetPieLabelType to select the source for pie labels as well as how to format them. Example 5.41, “Pie Chart LabelTypes” shows a pie chart with different labeling options.
3.6.5. Formatting LabelsTick labels, data labels, and pie chart labels are subject to format controls. There are several choices in formatting. Bydefault, the label value itself is simply displayed. Use SetXLabelType and SetYLabelType to select one of the otherformat types for tick labels. Use SetXDataLabelType and SetYDataLabelType to select one of the other format typesfor data labels (both axis data labels and data value labels). (Note that SetXLabelType also sets the default format forX data labels, for use if SetXDataLabelType is not called. Also SetYLabelType sets the default for Y data labels, foruse if SetYDataLabelType is not called.) Use SetPieLabelType to select a format type for pie chart labels.
The following sections contain details of the available formatting types. More examples can be found in the referencepage for SetXLabelType.
3.6.5.1. Formatting Labels: 'data' type
Label format type 'data' expects the tick label, data label, or pie label values to be numbers, and formats the valuesas floating point numbers with a separator between every group of thousands and a fixed number of decimal places.You can set the number of digits of precision, with the default being 1 digit. You can also set a prefix and/or suffixstring (such as a currency symbol or percent sign). PHPlot will try to set the thousands grouping separator and decimalseparator according to your locale, but this can be overridden if necessary.
For example:
$plot->SetYLabelType('data', 2, '$');
This might format the value 1234.567 as "$1,234.57" (depending on locale).
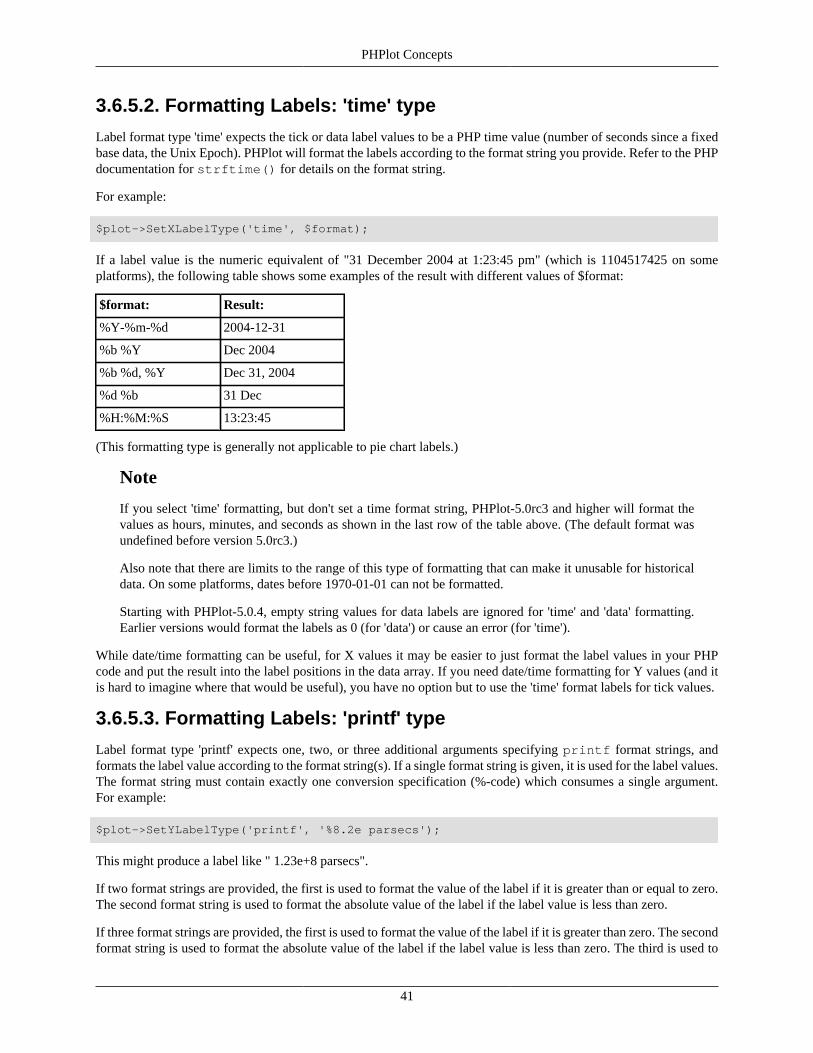
PHPlot Concepts
41
3.6.5.2. Formatting Labels: 'time' type
Label format type 'time' expects the tick or data label values to be a PHP time value (number of seconds since a fixedbase data, the Unix Epoch). PHPlot will format the labels according to the format string you provide. Refer to the PHPdocumentation for strftime() for details on the format string.
For example:
$plot->SetXLabelType('time', $format);
If a label value is the numeric equivalent of "31 December 2004 at 1:23:45 pm" (which is 1104517425 on someplatforms), the following table shows some examples of the result with different values of $format:
$format: Result:
%Y-%m-%d 2004-12-31
%b %Y Dec 2004
%b %d, %Y Dec 31, 2004
%d %b 31 Dec
%H:%M:%S 13:23:45
(This formatting type is generally not applicable to pie chart labels.)
Note
If you select 'time' formatting, but don't set a time format string, PHPlot-5.0rc3 and higher will format thevalues as hours, minutes, and seconds as shown in the last row of the table above. (The default format wasundefined before version 5.0rc3.)
Also note that there are limits to the range of this type of formatting that can make it unusable for historicaldata. On some platforms, dates before 1970-01-01 can not be formatted.
Starting with PHPlot-5.0.4, empty string values for data labels are ignored for 'time' and 'data' formatting.Earlier versions would format the labels as 0 (for 'data') or cause an error (for 'time').
While date/time formatting can be useful, for X values it may be easier to just format the label values in your PHPcode and put the result into the label positions in the data array. If you need date/time formatting for Y values (and itis hard to imagine where that would be useful), you have no option but to use the 'time' format labels for tick values.
3.6.5.3. Formatting Labels: 'printf' type
Label format type 'printf' expects one, two, or three additional arguments specifying printf format strings, andformats the label value according to the format string(s). If a single format string is given, it is used for the label values.The format string must contain exactly one conversion specification (%-code) which consumes a single argument.For example:
$plot->SetYLabelType('printf', '%8.2e parsecs');
This might produce a label like " 1.23e+8 parsecs".
If two format strings are provided, the first is used to format the value of the label if it is greater than or equal to zero.The second format string is used to format the absolute value of the label if the label value is less than zero.
If three format strings are provided, the first is used to format the value of the label if it is greater than zero. The secondformat string is used to format the absolute value of the label if the label value is less than zero. The third is used to
PHPlot Concepts
42
format the value of the label if it is zero. In some applications, it may be appropriate to use an empty string as the thirdformat string, which will suppress the display of labels with a value of zero.
Note
Support for using two or three 'printf' format strings was added in PHPlot-6.2.0. When using 2 or 3 'printf'format strings, the labels being formatted must be numeric values.
3.6.5.4. Formatting Labels: 'custom' type
A user-defined function can be provided to format labels. Specify formatting type 'custom', and provide the name ofyour function as a string. (This is actually a PHP callback type argument, which can also be an array containing anobject and a method name. See the PHP documentation on callbacks for more details.) You can provide an additionalargument which will be passed to your function when formatting labels (a pass-through argument).
In this example, the user-provided function is called my_formatter, and you want an additional argument $datapassed to the function.
$plot->SetYLabelType('custom', 'my_formatter', $data);
Your formatting function will accept 1 or 2 arguments (or more - see below).
function my_formatter($label, $arg){ ... return $some_result;}
The function will be called with $label set to the value of the label to be formatted, and is expected to return theformatted label text. $arg is a pass-through argument that has whatever value you used with SetXLabelType (etc.).In the above example, this is $data. You need to declare this second argument in your function only if you are usinga pass-through argument.
You can also use PHP anonymous functions for custom label formatting. This avoids having to define a functionelsewhere in your code, and keeps the custom label formatting code near where it is being used. This is recommendedonly when the custom label formatting code is relatively short2. Anonymous functions can also take advantage of thePHP use clause to inherit variables from the parent scope.
Here is an example of a custom label formatting function that uses an anonymous function to offset the Y axis labelby an amount in a local variable.
$offset = 10; // A local variable...$plot->SetYLabelType('custom', function ($y) use ($offset) { return ($y - $offset); } );
Note
PHPlot may call your label formatting function multiple times for the same label, and your function mustreturn the same value each time. Also, do not rely on the labels being formatted in any particular order.
A custom label formatting function will not be called at all if the label value is an empty string (''). Thisgenerally only applies to axis data labels (the label strings in your data array), since others are numbers. Thismeans you cannot use custom label formatting to replace an empty string with something else. The custom
2You can't do unit testing on an anonymous function.

PHPlot Concepts
43
label formatting function will be called if the label string is anything other than an empty string, such as astring with single space.
Custom label formatting is extremely flexible. You can convert values into another format (for example, degrees,minutes, seconds), or look up values in an external array (see Section 5.40, “Example - Bubbles Plot”), for example.However, using this method, you can only selectively format or display labels based on their value. For even morecontrol, use the additional arguments provided to the formatting function which are described in the next section.
3.6.5.5. Formatting Labels: Extended 'custom' type
When you use 'custom' formatting type, PHPlot actually provides 0, 1, or 2 additional arguments to your callback.These identify the row, or row and column, of the data point being labeled. You can use these extra arguments in yourcallback for selective formatting or filtering based on the position of the point being plotted in your data array.
PHPlot provides the following additional arguments to a custom label formatting callback (after the label value andpass-through arguments):
Label: Arguments Provided:
Tick Labels (None)
Axis Data Labels $row
Data Value Labels (other thanstackedbars total labels)
$row, $column
stackedbars data value labels for bartotals
$row
You need not declare these arguments unless you are using them, but if you do declare them, it is safer to make themoptional with default NULL. (If you are only using the custom callback function for one specific type of label, youcan omit the defaults.) For example:
function my_formatter($label, $arg, $row=NULL, $column=NULL){ ... return $some_result;}
The row argument value is an index starting with zero that numbers the rows in your data array. This correspondsto the ordinal position of the independent variable (X for vertical plots, Y for horizontal plots). This is also the outerindex of your data array.
The column argument value is an index starting with zero that numbers the data sets in each row. This corresponds tothe ordinal position of the dependent variable (Y for vertical plots, X for horizontal plots). Note that this is not simplythe inner index of your data array, because the data array rows also have labels, and (depending on the data type) maycontain other values. For example, given the data type data-data and this data array:
$data = array( array('Jan', 1, 10, 11, 12), array('Feb', 2, 20, 21, 22), array('Mar', 3, 30, 31, 32),);
When formatting a data value label for X=2, Y=22 (the 3rd data set in the row labeled 'Feb'), PHPlot will call a customlabel formatting function like this:
my_formatter(22, $passthrough, 1, 2);

PHPlot Concepts
44
That is, row=1 and column=2.
As described in Section 3.6.5.4, “Formatting Labels: 'custom' type”, your callback function returns the value of theformatted label. You can return an empty string to display no label. This can be used to display data value labels foronly one data set, for example - just return an empty string if $column is not equal to the index of the data set youwant to label.
See Section 5.43, “Example - Custom Data Value Label Formatting” for an example.
Note
These additional row and column arguments are only available starting with PHPlot-5.8.0.
3.7. Other Plot Elements
This section contains information about other elements which can be part of a plot.
3.7.1. TitlesPHPlot can draw three types of titles:
• The main plot title, which is centered at the top of the image. This is typically used to identify the plot as a whole.
• The X title, which is drawn horizontally and can appear below the plot, above the plot, or in both places. This istypically used to identify the values along the X axis.
• The Y title, which is drawn vertically and can appear to the left of the plot, to the right of the plot, or on both sides.This is typically used to identify the values along the Y axis.
For a list of functions used to control titles, see Section 6.7, “Titles”.
Here is a sample plot with the titles called out.
3.7.2. LegendPHPlot can draw a legend on the plot. This is normally used with multiple data sets, to identify the data sets by color.A legend can also be used with pie charts to identify the segments. For a list of functions used to control the legend,see Section 6.8, “Legend”.

PHPlot Concepts
45
• Use SetLegend to enable the legend and define the text lines to be displayed.
• You can let PHPlot position the legend, or position it yourself with SetLegendPixels, SetLegendWorld, orSetLegendPosition.
• You can change the legend text color with SetTextColor or SetLegendTextColor, and the background color withSetLegendBgColor. You can control the color box border colors with SetLegendColorboxBorders. The colors ofthe color boxes or shape markers automatically match the colors of the plotted data sets, and you cannot controlthose colors separately from the data colors. See also Section 3.5.5, “Plot Element Colors”.
• Other aspects of the legend appearance can also be changed. Use SetLegendStyle to control the text and color boxalignment, SetLegendUseShapes to select color boxes or shape markers, and SetLegendReverse if you want theentries in the legend ordered from bottom to top.
Here is a sample plot with the legend called out.
3.7.3. Grid LinesPHPlot can draw horizontal (Y) and/or vertical (X) grid lines on a plot. You can independently enable the horizontal(Y) and vertical (X) lines in the grid, and use dashed or solid lines. For a list of functions used to control the grid,see Section 6.10, “Grid Controls”.
Here is a sample plot with the X Grid and Y Grid called out.

PHPlot Concepts
46
3.7.4. Tick MarksTick marks are drawn by default along the bottom edge of the plot (X tick marks) and the left side of the plot (Y tickmarks). These usually, but not always, correspond to the X and Y axis lines. You can set the tick interval or controlthe number of ticks, suppress the first or last tick on an axis, and control the tick mark size. You can also anchor thetick marks at a specific X or Y value. For a list of functions used to control tick marks, see Section 6.12, “Ticks”.
Left to its own, PHPlot will determine tick positions for X and Y axes. (See Section 4.6.7, “Automatic Tick IncrementCalculation” if you want to read all the details on how PHPlot does this.) Starting with PHPlot-6.0.0, an attempt ismade to pick a good tick increment. (Older releases are much less likely to come up with a good result.) Even so, youmight not be happy with the results. You can improve the situation with some combination of: setting the desired tickinterval, setting a tick anchor point, or using SetPlotAreaWorld to set the X or Y data range limits (since the automaticcalculation of tick marks is based on the data range).
For example:
$plot->SetPlotAreaWorld(-10, NULL, 10, NULL);$plot->SetXTickIncrement(1);
This results in the X tick labels going from -10 to 10, with a tick mark every 1 data unit.
3.8. Text Fonts
This section contains information about using text fonts in PHPlot. See Section 6.6, “Text Fonts”for PHPlot functions used with text fonts.
3.8.1. OverviewPHPlot supports both built-in GD fonts and TrueType fonts (if available on your system). TrueType fonts generallyproduce higher quality text, but using them requires more internal computations. The built-in GD fonts are faster torender, but are limited to one typeface and 5 available sizes. TrueType fonts can be drawn at any size and angle, andmany typefaces are available. On most systems, TrueType fonts are anti-aliased for improved appearance, but undersome conditions the GD fonts may be easier to read. TrueType fonts support much wider character sets, includingspecial symbols, while the GD fonts are more limited.
The following figure shows the built-in GD fonts plus a sample TrueType font. (Depending on how you are viewingthis manual, the sizes of the fonts in this figure might differ from how they would look in a PHPlot image. For moreon font sizes, see the notes with SetFont.)
3.8.2. Text Element NamesEach type of text available in PHPlot has an element name. When selecting text fonts with SetFont and related functions,you use the element name to indicate what type of text you are configuring. The following table lists the PHPlot textelement names.

PHPlot Concepts
47
Element Name Used for
generic Pie chart labels, error image text, message image text
legend Text in the legend (SetLegend)
title Main plot title (SetTitle)
x_label X tick labels and X data labels
y_label Y tick labels and Y data labels
x_title X axis title (SetXTitle)
y_title Y axis title (SetYTitle)
Notes: generic is also used for text drawn from a callback when no font is specified. See Section 4.4.5, “UsingCallbacks to Annotate Plots” and DrawText. Although generic is used for error image text, changing the font orsize has no effect because the error handler resets the font to the default before displaying the error. Message imagetext refers to DrawMessage.
3.8.3. TrueType Font SelectionPHPlot text can use built-in GD fonts or TrueType fonts. When using GD fonts, you specify a font name as a numberbetween 1 and 5. This selects from 5 built-in GD fonts. When using TrueType fonts, you need to specify a font filename.The rest of this section discusses only TrueType fonts.
Note
The material on specifying font files for PHPlot applies to releases starting with PHPlot-5.1.3. ThroughPHPlot-5.1.2, you generally need to specify the full pathname of a font file, or the full path of a font directory.
On Windows systems, you need to use the font filename, not the font name. You can get the font filename usingControl Panel - Fonts. For example, Windows applications may display "Arial Black", or "Arial Black (TrueType)"as a font name, but the actual font filename is "ariblk.ttf". Since GD knows to look for fonts in the Windows fontdirectory, you will not need to specify a full pathname to font files, unless the font is installed in some other directory.
On Windows, you can use the "Character Map" system tool to examine a font. This can also be used to find the Unicodecharacter code of a special character. These will be displayed in hexadecimal, for example U+20AC for the Euro. SeeSection 3.8.5, “Using Extended Characters” for more information on using special characters.
Here are some font selection examples for Windows:
# For titles, use Arial Bold Italic at 14 points:$plot->SetFontTTF('title', 'ARIALBI.TTF', 14)# For X Title, use Verdana at 12 points:$plot->SetFontTTF('x_title', 'VERDANA.TTF', 12)
On some Linux and similar systems, GD is able to find fonts specified without paths, but on other systems you willhave to specify a font directory with either SetTTFPath or as part of the font name in SetFontTTF. If you specify afull pathname to a font, you must also supply the extension (.ttf); you may omit the extension when relying on GD tofind the font. Remember that font filenames are case sensitive on most of these systems.
The font search path for GD (bundled with PHP) includes the following directories on Linux and similar systems:
• /usr/X11R6/lib/X11/fonts/TrueType
• /usr/X11R6/lib/X11/fonts/truetype
• /usr/X11R6/lib/X11/fonts/TTF

PHPlot Concepts
48
• /usr/share/fonts/TrueType
• /usr/share/fonts/truetype
• /usr/openwin/lib/X11/fonts/TrueType
If your system has TrueType fonts in one of those directories, you can select them with a filename only. If not, youmust use a full directory path in either the font name or with SetTTFPath.
Note
The environment variable GDFONTPATH can be defined to contain a list of directories (separated by a colon':') to search for fonts. If defined, this replaces the above list.
Your Linux system may include a tool for examining fonts. One such tool is gucharmap. This can also be used to findthe Unicode character code of a special character. These may be displayed in hexadecimal, for example U+20AC forthe Euro. See the next section for more information on using special characters.
Here are some font selection examples for Linux:
# On systems with fonts in an expected place, like Slackware Linux,# just use the font filename:# For titles, use Liberation Sans Bold Italic at 14 points:$plot->SetFontTTF('title', 'LiberationSans-BoldItalic.ttf', 14)# For X Title, use DejaVuSans Bold at 12 points:$plot->SetFontTTF('x_title', 'DejaVuSans-Bold.ttf', 12)
# Ubuntu and Debian use subdirectories under a searched path.# You can use a partial path here.$plot->SetFontTTF('x_title', 'liberation/LiberationSans-Regular.ttf', 12)# Note: Older Ubuntu/Debian used the path ttf-liberation/...
# Fedora uses subdirectories which are not under a searched path.# You must use full paths here.$plot->SetTTFPath('/usr/share/fonts/liberation/');$plot->SetFontTTF('x_title', 'LiberationSans-Regular.ttf', 12)
Note
Your Linux system probably has a package called fontconfig which is used to provide more consistentaccess to fonts. But even if your system uses a version of the gd library which is built with fontconfig(and the one bundled with PHP does not), PHP does not use fontconfig. Therefore PHPlot needs to beable to locate font files using other means.
3.8.4. Default TrueType Font
Note
This section applies starting with PHPlot-5.1.3.
If you try to use TrueType text without specifying a font name, PHPlot will use the default font. You can set the defaultfont with SetDefaultTTFont. If you do not set a default font, PHPlot tries to locate a sans-serif font to use. Here arethe font names that PHPlot tries in order. First it tries the filename alone, letting GD use its search path, and then ittries with the default font path, as set with SetTTFPath.
• LiberationSans-Regular.ttf - Likely to work on Linux and other systems with a correct GD font searchpath.

PHPlot Concepts
49
• Verdana.ttf, Arial.ttf, Helvetica.ttf - One of these is going to work on Windows, maybe othersystems too.
• liberation/LiberationSans-Regular.ttf, ttf-liberation/LiberationSans-Regular.ttf - This is for Debian, Ubuntu, and similar (the first is for newer releases, such as Ubuntu 12.04 andlater, and the second is for older releases).
• benjamingothic.ttf - The original PHPlot default, for compatibility.
The last item on the list is used regardless of whether it can be found or not. This means if you enable TrueType fontswithout setting a default, and get a fatal error from PHPlot that it can't find the font benjamingothic.ttf, this meansPHPlot was unable to find any of the standard fonts in its list. On that system, then, you must provide either a fontdirectory, or use full font pathnames.
3.8.5. Using Extended CharactersYou can include non-ASCII characters in your PHPlot labels and titles. This includes characters from languages otherthan English, accented characters, and special symbols.
PHPlot itself does not do any special processing of text strings, so you should refer to the PHP GD and Image Functionsreference for more information, in particular imagettftext().
Note
This mostly only works with TrueType fonts. The built-in GD fonts do have some extended characters, butthey are encoded in ISO 8859-2 which is probably not what you might expect, and the GD font routines donot support special character entities.
To use extended characters in your PHPlot text strings, you need a TrueType font that contains the characters youwant. Ideally, you want a Unicode font. You might have to examine the font using an operating system-specific toolto see if your characters are present and to find their numeric values.
There are three basic ways to include extended characters in your text strings. The examples below use the Eurocharacter, which is decimal Unicode value 8364.
• Use HTML-type character entities with decimal numeric encoding. For example, the Unicode Euro symbol is:€
• Include the UTF-8 encoding of the Unicode value in your string as a series of hex escapes. For example, the Eurosymbol is: "\xe2\x82\xac".
• Include the UTF-8 encoding of the Unicode value directly in your character string. We can't show you an example ofwhat this looks like, or tell you how to enter these characters, because it depends on your own hardware, operatingsystem, text editor, and locale.
The first two of these options are shown in the example below, both of which set the Y axis title to "Items per €100".
$plot->SetYTitle("Items per €100"); # Numeric character entity$plot->SetYTitle("Items per \xe2\x82\xac100"); # UTF-8 encoding
You can also use PHP functions to encode your characters for including in PHPlot text strings. See the PHPdocumentation for the functions html_entity_decode() and iconv(). Here are some examples (sent in bySourceForge user 'kalvaro'):
# Encode the Euro symbol into UTF-8:$chars = html_entity_decode('€', ENT_NOQUOTES, 'UTF-8');
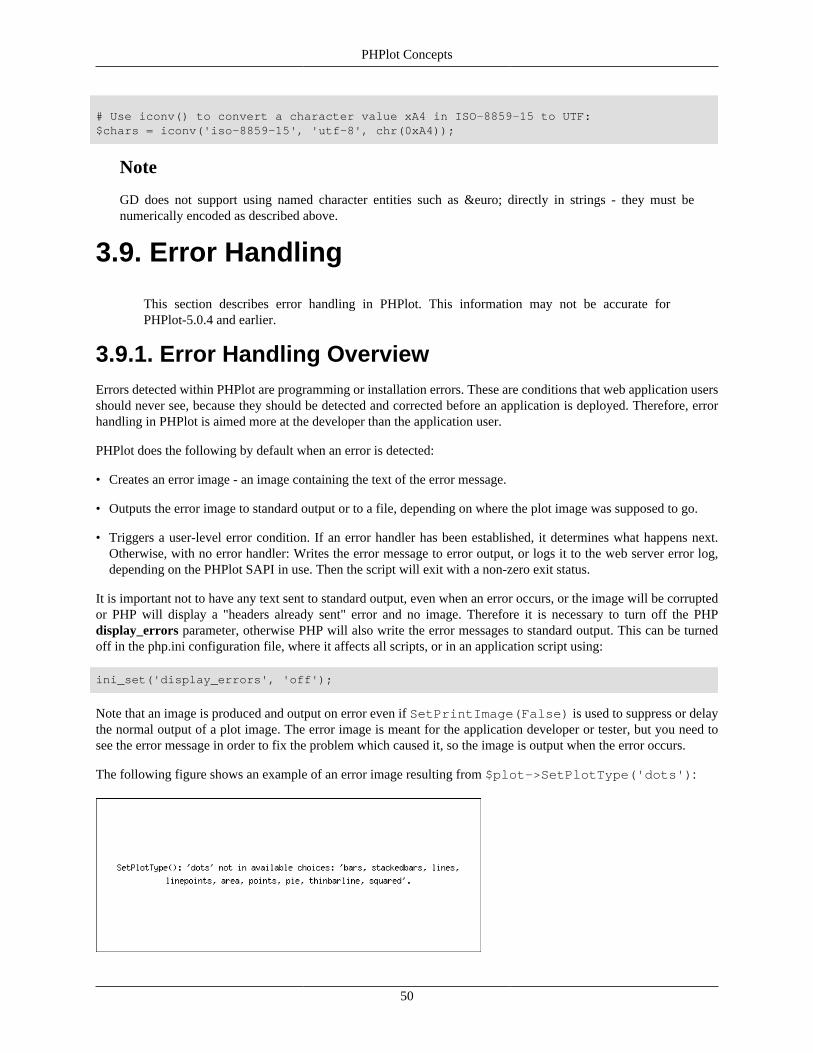
PHPlot Concepts
50
# Use iconv() to convert a character value xA4 in ISO-8859-15 to UTF:$chars = iconv('iso-8859-15', 'utf-8', chr(0xA4));
Note
GD does not support using named character entities such as € directly in strings - they must benumerically encoded as described above.
3.9. Error Handling
This section describes error handling in PHPlot. This information may not be accurate forPHPlot-5.0.4 and earlier.
3.9.1. Error Handling OverviewErrors detected within PHPlot are programming or installation errors. These are conditions that web application usersshould never see, because they should be detected and corrected before an application is deployed. Therefore, errorhandling in PHPlot is aimed more at the developer than the application user.
PHPlot does the following by default when an error is detected:
• Creates an error image - an image containing the text of the error message.
• Outputs the error image to standard output or to a file, depending on where the plot image was supposed to go.
• Triggers a user-level error condition. If an error handler has been established, it determines what happens next.Otherwise, with no error handler: Writes the error message to error output, or logs it to the web server error log,depending on the PHPlot SAPI in use. Then the script will exit with a non-zero exit status.
It is important not to have any text sent to standard output, even when an error occurs, or the image will be corruptedor PHP will display a "headers already sent" error and no image. Therefore it is necessary to turn off the PHPdisplay_errors parameter, otherwise PHP will also write the error messages to standard output. This can be turnedoff in the php.ini configuration file, where it affects all scripts, or in an application script using:
ini_set('display_errors', 'off');
Note that an image is produced and output on error even if SetPrintImage(False) is used to suppress or delaythe normal output of a plot image. The error image is meant for the application developer or tester, but you need tosee the error message in order to fix the problem which caused it, so the image is output when the error occurs.
The following figure shows an example of an error image resulting from $plot->SetPlotType('dots'):

PHPlot Concepts
51
You can disable the error image entirely using SetFailureImage (added in PHPlot-5.5.0). One case where this isrecommended is when your script will use EncodeImage to get the plot image, rather than sending it to a file or backto the browser. Since your script is not intended to ever produce an image, it should not produce an error image either.
If a failure occurs when error images are disabled with SetFailureImage, PHPlot will still trigger a user-level errorcondition, which will normally record the error message in the server log, and terminate the script. However, there willbe no feedback to the user that the error occurred. If using SetFailureImage(False) to disable error images,you should place this call right after creating the PHPlot object, because an error which occurs before the call willproduce an error image.
3.9.2. Types of ErrorsThe following types of errors can occur within PHPlot:
1. Parameter value errors: Use of an incorrect argument to a PHPlot function, such as: SetPlotType('dots') ['dots' isnot a valid plot type].
2. Semantic errors: Invalid combination of parameters or data values, such as trying to use data type 'data-data' withplot type 'bars' [bar charts only work with 'text-data' data type].
3. Pathname errors: Missing font file or invalid font path; missing or invalid image file used as background. It mightseem extreme to have a missing font file be a fatal error, but PHPlot has no way to substitute an appropriate font,and a missing font would indicate an application configuration or installation error.
4. Inability to create a GD image resource. Probably the only way this can happen is if there is insufficient memory,which can occur if PHP's configured per-script memory limit is reached. (See note below)
All of these result in an E_USER_ERROR level error, except for memory exhaustion when creating an image, which isE_ERROR (fatal unrecoverable). If no GD image resource was created, no error image will be output. Furthermore, ifthe reason was memory exhaustion, there is no way to catch the error and PHP will cause the script to immediately exit.
3.9.3. Error HandlersIt is possible to set up an error handler with PHP's set_error_handler to catch most errors from PHPlot. Thehandler can be established for all errors (the default), or just E_USER_ERROR error types (the only type PHPlotwill trigger). See the PHP documentation for more details. Your handler function can perform cleanup before it exits,however it should not return. Some of the PHPlot functions will correctly handle a return from an error handler, andreturn FALSE to their callers, but not all. At the very least, a PHPlot object instance should be unset and not re-usedafter error.
Note that if you do choose to have an error handler that returns, a return value of FALSE from the handler functionwill result in the standard PHP error handling, meaning the script will exit with an error message. If you want yourscript to continue after the handled error, your error handler must return TRUE. (A return with no value, or return ofNULL, seems to work the same as TRUE, but this is not documented.)
Note that an error image will be created and output, as described above, even if you have established an error handler.
3.9.4. Application-level ErrorsIf you would like your application to handle some errors in a similar manner to PHPlot, you can use DrawMessage tocreate and output an image contain a message from your application. See also Section 5.42, “Example - DrawMessage”.(DrawMessage was added in PHPlot-5.7.0.)

PHPlot Advanced Topics
52
Chapter 4. PHPlot Advanced Topics
This chapter documents advanced PHPlot programming topics, going beyond the material inChapter 3, PHPlot Concepts.
4.1. Custom PHPlot Class
This section describes how to create a custom PHPlot class.
If you have a number of applications that use PHPlot, and you want to standardize some of the PHPlot default settings,you can define your own class which extends the PHPlot class and changes the default settings. Here is a short exampleof a custom PHPlot class, which changes the following defaults:
• Use a TrueType font for all text
• Change the default image size to 800 x 600
• Change the default title colors to red
To extend the PHPlot class, declare your class as shown below. Make sure your class constructor calls the PHPlotclass constructor before changing any settings.
<?php# Define a custom PHPlot class
// Load the PHPlot class firstrequire_once 'phplot.php';
// Define a class which extends PHPlot:class my_phplot extends PHPlot { function __construct($width=800, $height=600, $out=NULL, $in=NULL) { parent::__construct($width, $height, $out, $in); $this->SetDefaultTTFont('LiberationSans-Bold'); // System dependent $this->SetTitleColor('red'); }}
To use this custom PHPlot class, use require_once to include the file containing the class definition, then createan instance of the custom class.
$plot = new my_phplot();
You can then use the $plot object exactly the same as you might use any other PHPlot object.
4.2. PHPlot Object Serialization
This section contains information about serializing and unserializing a PHPlot object.

PHPlot Advanced Topics
53
Serializing a PHP variable, array, or object with the PHP function serialize() generates a string representationof the value which can be stored or transmitted. Unserialization with the PHP function unserialize() re-createsthe variable, array, or object from the string representation.
Starting with PHPlot-5.8.0, PHPlot objects can be serialized and unserialized, subject to these limitations:
• A PHPlot object can only be serialized until DrawGraph is used. However, you can serialize the object, then callDrawGraph, if you want both the serialization and the actual plot.
• Serialization and unserialization will not work when an input file is specified in the PHPlot or PHPlot_truecolorconstructors. Consider using SetBgImage instead.
• You must serialize and unserialize with the exact same version of PHPlot.
Here is an example of serializing a PHPlot object:
require_once 'phplot.php';$plot = new PHPlot(800, 600);... // Configure the PHPlot object: Set plot type, data values, etc.// Do not use DrawGraph (yet)$str = serialize($plot);
The corresponding unserialization looks like this:
require_once 'phplot.php';$newplot = unserialize($str);// You can do additional plot setup here if desired.$newplot->DrawGraph(); // Draw it
4.3. Truecolor Images
This section contains information about using Truecolor images in PHPlot. This materialsupplements the text in the Section 3.5, “Colors”.
Truecolor image support was added to PHPlot-5.1.1. With Truecolor image support, you can:
• Create images with a larger number of colors
• Control color transparency with alpha blending
• Perform advanced image processing operations
An example of using Truecolor with PHPlot can be found in Section 5.24, “Example - Using Truecolor To Make aHistogram”.
4.3.1. Using Truecolor Images in PHPlot
To make a Truecolor image in PHPlot, create an object of the derived class PHPlot_truecolor instead of theclass PHPlot. For example, replace this:
$plot = new PHPlot(800, 600);

PHPlot Advanced Topics
54
with this:
$plot = new PHPlot_truecolor(800, 600);
That is all you need to do in order to create truecolor images. All PHPlot methods are compatible with PHPlot_truecolorobjects. An image file produced from a PHPlot_truecolor object with no other programming changes will be the sameas an image file produced from a PHPlot object except as described under Section 4.3.5, “Image Formats and FileFormats, Palette and Truecolor”.
One of the advantages of truecolor images is the ability to use variable transparency. This is described in the nexttwo sections.
4.3.2. Understanding Variable Transparency (Alpha)
Colors in a truecolor image have four components: red, green, blue, and alpha. The alpha component corresponds tothe transparency of a color. An alpha value of zero means the color is opaque, and an alpha value of 127 means thecolor is transparent, or clear.1 In between values, from 1 to 126, correspond to various amounts of transparency.
Transparency is only meaningful when drawing objects on top of objects, or objects on top of the image background.An object drawn with an opaque color (alpha=0) will replace whatever was in the image before the object was drawnat that position. An object drawn with an transparent color (alpha=127) is invisible and does not affect the appearanceof the image. An object drawn with a color that has an alpha value between 1 and 126 will be combined with whateverwas in the image before the object was drawn using alpha blending.
The PHP Manual explains alpha blending like this: "In blending mode, the alpha channel component of the colorsupplied to all drawing functions determines how much of the underlying color should be allowed to shine through.As a result, gd automatically blends the existing color at that point with the drawing color, and stores the result in theimage. The resulting pixel is opaque."2
Note
Note that the PHP Manual says the resulting pixel is opaque. This means that objects drawn with alpha above0 are partially or completely transparent only relative to other objects in that same image. This does notresult in an image with transparent portions which would show through to a browser or desktop background,for example. (Read the PHP Manual page for imagesavealpha for more about this behavior and howto change it.) Use SetTransparentColor to make portions of an image transparent to web page or desktopbackgrounds.
1 PHPlot follows the GD Library convention here. Other systems use alpha=0 to mean transparent, and a maximum alpha value to mean opaque.2From the PHP Reference Manual, imagealphablending

PHPlot Advanced Topics
55
The following figure shows the effect of alpha blending when drawing lines. The left side shows the normal overlayingof lines, and the right side shows alpha-blended overlaying of lines with alpha = 60 (that is, 60/127 transparency). Theeffect of alpha blending can be seen where the data lines cross. Note: These plots use wide lines (3 pixels) and theportions of the images are magnified 2x to show detail.
4.3.3. Using Variable Transparency (Alpha) in PHPlotTo use partially transparent colors (that is, colors with an alpha channel) with a PHPlot_truecolor object, you canspecify an alpha value as part of a color specification, and you can specify a default alpha value for all data colors.
Use of alpha values with a color specification is described below, in Section 4.3.4, “Color Parameter Form Extensions”.Here are some examples of using colors with an alpha specification.
This sets the color used for labels to red=192, green=192, blue=33, and alpha=50 (that is, 50/127 transparency).
$plot->SetTextColor(array(192, 192, 33, 50));
This sets the color used for tick marks to the color 'blue' from the color map, with alpha value 64 (64/127 transparency).
$plot->SetTickColor('blue:64');
This sets colors for the first three data sets to red, green, and blue with different alpha values. The three colors arerepresented using different formats for illustration purposes.
$plot->SetDataColors(array( array(255, 0, 0, 60), // Red with alpha=60 '#00ff0050', // Green with alpha=80 (0x50) 'blue:70')); // Blue with alpha=70
Instead of specifying the alpha value for each data set color, you can provide a default alpha value for all data colorsusing the third argument to This uses the colors specified in $my_color_array with a default alpha of 50. The defaultis applied to any color definition which does not already have an alpha value. SetDataColors.
$plot->SetDataColors($my_color_array, NULL, 50);

PHPlot Advanced Topics
56
This can also be used to apply an alpha value to the default data colors. This retains the default data colors, but appliesalpha = 50 (50/127 transparency) to all the colors. This is a quick way to get partially transparent data colors withoutre-specifying all the colors.
$plot->SetDataColors(NULL, NULL, 50);
4.3.4. Color Parameter Form ExtensionsIn addition to the forms specified in Section 3.5.1, “Color Parameter Forms”, colors specifications can include analpha value. Although this works with palette images as well as truecolor images, specifying alpha values with paletteimages provides limited value.
1. A color name, as defined by SetRGBArray or from a built-in color map if SetRGBArray was not called, followedby a colon and an alpha value as a decimal number, for example: 'red:60'. The alpha value is between 0 (opaque) and127 (transparent). Note that colors in the color map can be defined with or without an alpha value. An alpha valueappended to the color name overrides any specified in the color map. For example, if the color 'red2' is defined inthe color map as array(255,0,0,80) - that is, red with 80/127 transparency - then 'red2' has alpha of 80, and 'red2:40'has alpha of 40.
2. Numeric color component values, in the form #rrggbbaa. Here rr is red, gg is green, and bb is blue, and eachcomponent value is represented as a 2-digit hexadecimal number between 00 and ff. Also aa is alpha, representedas a 2 digit hexadecimal number between 00 and 7f. For example, #00ff0010 is green with 16/127 transparency.
3. A PHP array of red, green, blue, and alpha color component values. Each value of red, green, and blue arein the range 0 to 255 inclusive, and the alpha component is in the range 0 to 127 inclusive. For example,array(0,255,0,16) is the same green with 16/127 transparency.
4.3.5. Image Formats and File Formats, Palette andTruecolorPHPlot can produce JPEG, PNG, and GIF image files (and possibly others). You select the PHPlot output image fileformat with SetFileFormat.
PHPlot works with GD images before producing an image file. There are two types of GD images: truecolor andpalette. Truecolor images represent pixels as 32 bit values, combining 8 bits each of red, green, and blue componentswith a 7 bit alpha (transparency) value. Palette images use a color table with at most 256 entries, and represent pixelsas 8 bit indexes into the color table. The palette image color table entries have 32 bit values, with the same componentsas truecolor image pixel values. So palette images in GD can have at most 256 unique colors, but there is no limitationon the number of unique colors in truecolor images.
As long as you don't specify a background image when creating your plot object, truecolor images are created withthe PHPlot_truecolor class, and palette images are created with the PHPlot class. If you specify a backgroundimage, the GD image created by PHPlot matches the type - truecolor or palette - of your background image file. Moreon background image files can be found in Section 4.3.7, “Background Images” below.
What happens when you output the GD image to an image file depends on the image file format you select.
JPEG image files are always truecolor. Whether you have a GD palette image or truecolor image, you will get atruecolor image file. Note: You are discouraged from using JPEG images with PHPlot, because they are not optimalfor this type of graphical information due to use of lossy compression.
GIF image files are always palette type, limited to 256 colors. If you have a GD palette image, you will get a paletteGIF image file with the colors you used in your plot. If you have a a GD truecolor image, GD will convert your image
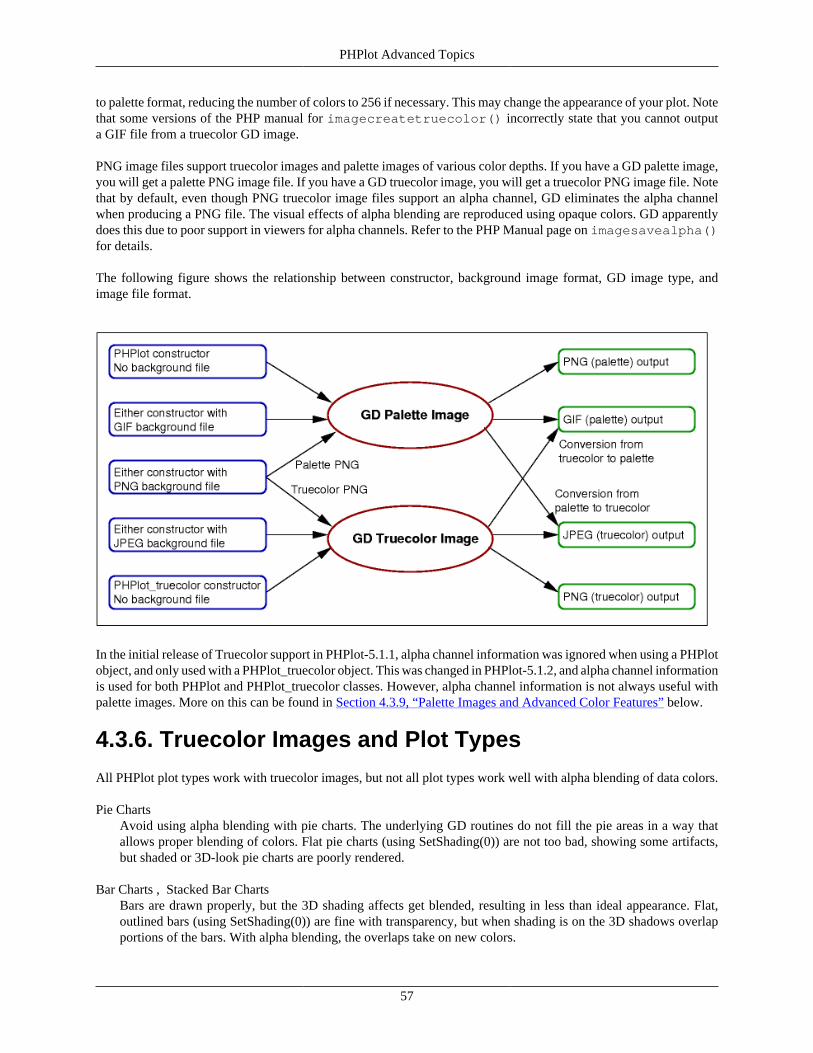
PHPlot Advanced Topics
57
to palette format, reducing the number of colors to 256 if necessary. This may change the appearance of your plot. Notethat some versions of the PHP manual for imagecreatetruecolor() incorrectly state that you cannot outputa GIF file from a truecolor GD image.
PNG image files support truecolor images and palette images of various color depths. If you have a GD palette image,you will get a palette PNG image file. If you have a GD truecolor image, you will get a truecolor PNG image file. Notethat by default, even though PNG truecolor image files support an alpha channel, GD eliminates the alpha channelwhen producing a PNG file. The visual effects of alpha blending are reproduced using opaque colors. GD apparentlydoes this due to poor support in viewers for alpha channels. Refer to the PHP Manual page on imagesavealpha()for details.
The following figure shows the relationship between constructor, background image format, GD image type, andimage file format.
In the initial release of Truecolor support in PHPlot-5.1.1, alpha channel information was ignored when using a PHPlotobject, and only used with a PHPlot_truecolor object. This was changed in PHPlot-5.1.2, and alpha channel informationis used for both PHPlot and PHPlot_truecolor classes. However, alpha channel information is not always useful withpalette images. More on this can be found in Section 4.3.9, “Palette Images and Advanced Color Features” below.
4.3.6. Truecolor Images and Plot Types
All PHPlot plot types work with truecolor images, but not all plot types work well with alpha blending of data colors.
Pie ChartsAvoid using alpha blending with pie charts. The underlying GD routines do not fill the pie areas in a way thatallows proper blending of colors. Flat pie charts (using SetShading(0)) are not too bad, showing some artifacts,but shaded or 3D-look pie charts are poorly rendered.
Bar Charts , Stacked Bar ChartsBars are drawn properly, but the 3D shading affects get blended, resulting in less than ideal appearance. Flat,outlined bars (using SetShading(0)) are fine with transparency, but when shading is on the 3D shadows overlapportions of the bars. With alpha blending, the overlaps take on new colors.
PHPlot Advanced Topics
58
4.3.7. Background Images
When creating a PHPlot or PHPlot_truecolor object, you can provide an existing image filename to the constructoras the fourth argument, $input_file.
$plot = new PHPlot(800, 600, NULL, 'myimage.png');
This image file becomes the background for your plot. (The function SetInputFile also does this, but is deprecated foruse except through the constructor.)
If you provide an input file to the constructor, the image associated with your PHPlot or PHPlot_truecolor object takeson the type of the input file: palette or truecolor. It does not matter which constructor you use when specifying an inputfile as background. (This was changed after the initial release of truecolor support. In PHPlot-5.1.1, you must use thePHPlot_truecolor constructor in order to use some truecolor features even when you use a truecolor background imagefile. Starting with PHPlot-5.1.2 you can use either constructor.)
Note
The above applies only when an input file is specified to the PHPlot or PHPlot_truecolor constructor.It does not apply to an image background set with SetBgImage nor to a plot area background set withSetPlotAreaBgImage.
4.3.8. Additional Operations on Truecolor Images UsingCallbacks
Advanced operations on truecolor PHPlot images are possible using PHPlot callbacks. See Section 4.4, “Callbacks”for more information about using callbacks. Here are some of the operations you can perform, and the correspondingGD functions. Refer to the GD section of the PHP Manual for more information on these functions.
Note
Some of these functions are only available when PHP was built with the bundled version of the GD library.
4.3.8.1. imageantialias()
You can turn on anti-aliasing of truecolor images. This must be done before anything is drawn, so the pre-drawingcallback draw_setup is used. Here is a partial example:
function pre_plot($img){ imageantialias($img, True);}...$plot = new PHPlot_truecolor(1024, 768);$plot->SetCallback('draw_setup', 'pre_plot');
Note: There are limitations with anti-aliased images. You cannot use wide lines (SetLineWidths). Patterned lines donot work, so if you are displaying X or Y grid lines you must use SetDrawDashedGrid(False) to make these solid.Also note that TrueType Font (TTF) text is always anti-aliased, even on palette images, regardless of the use ofimageantialias().

PHPlot Advanced Topics
59
4.3.8.2. imagealphablending() and imagelayereffect()
These functions control the combining of partially transparent colors. They can be used via a draw_setup callback,in the same way as imageantialias in the example above. Note that alpha blending is on by default with alltruecolor images.
4.3.8.3. imagegammacorrect()
You can have the GD library perform gamma adjustment on a truecolor image. This must be done after all drawing,so the post-drawing callback draw_all is used. Here is a partial example:
function post_plot($img){ imagegammacorrect($img, 1.0, 0.5); // Input gamma=1, output gamma=.5}
...$plot = new PHPlot_truecolor(1024, 768);$plot->SetCallback('draw_all', 'post_plot');
4.3.9. Palette Images and Advanced Color FeaturesYou will have a GD palette image if you use the PHPlot constructor without a background image file, or if you useeither the PHPlot or PHPlot_truecolor constructors with a background image file that is a palette image (GIFor some types of PNG). You can use alpha color specifications with palette GD images, but this is not recommended.The results are not well documented, but the following behavior has been observed:
• There is no alpha blending. Drawing operations simply replace existing pixels values with the new pixel values.(These are actually index values into the color table.)
• Alpha values are ignored when the image is output to a JPEG or GIF file. All colors are output as opaque.
• Alpha values are preserved in PNG image files. These will be palette, not truecolor, PNG images, with the colortable containing the alpha values. You can therefore have palette PNG files with partial transparency, however notall viewers properly support this.
Nothing described in Section 4.3.8, “Additional Operations on Truecolor Images Using Callbacks” works with paletteimages, including gamma adjust and anti-aliasing (except that TrueType Font text is always anti-aliased.)
4.4. Callbacks
This section documents the callback feature in PHPlot.
Callbacks allow a programmer using PHPlot to insert their own functions into the graph drawing process. Callbacksare currently also used for development and testing of PHPlot.
Warning
All PHPlot class variables, and all methods/functions which are not documented in the "Reference" section ofthe PHPlot Reference Manual, are considered to be for internal use and are subject to be changed or removedat any time. If you call internal functions, or access internal class variables, you greatly increase the risk ofbreaking your application with future PHPlot releases.

PHPlot Advanced Topics
60
4.4.1. Callbacks Application InterfaceRefer to these entries in the Function Reference:
• SetCallback - Register a callback function
• GetCallback - Return a currently registered callback function
• RemoveCallback - Unregister a callback function
Either a function name or an object and method can be registered as a callback with SetCallback. For more informationabout using callbacks with objects and methods, see the PHP manual under Types, Pseudo Types, Callback [http://www.php.net/manual/en/language.pseudo-types.php#language.types.callback] and the documentation for the PHPcall_user_func [http://www.php.net/manual/en/function.call-user-func.php ] function. Also refer to Section 4.4.4,“Object Methods as Callbacks” later in this manual. Whether calling a function or an object method as a callback,the same calling sequence is used.
function_name($img, $passthrough_arg, [other_args...])
$imgThe GD image resource for the plot image.
$passthrough_argThe third argument supplied to SetCallback ($arg) when the callback is established. This allows the programmerto pass information to the callback without using global variables. This can be any PHP type including array. Topass a reference, you should put it into an array and pass the array.
other_args...Zero or more additional arguments supplied by PHPlot to callbacks of this type. Refer to Section 4.4.3, “AvailableCallbacks” to see what callback reasons supply extra arguments.
For example, given this callback setup:
$plot->SetCallback('draw_graph', 'my_drawing_callback', $myvar);
Then PHPlot will call:
my_drawing_callback($img, $myvar_value, $plot_area);
Where $myvar_value is the value of $myvar at the time SetCallback was called. (The plot_area parameter is onlysupplied for the draw_graph callback in PHPlot-5.1.0 and later.)
Some callbacks are expected to return a value. This is documented in Section 4.4.3, “Available Callbacks”. In allother cases, the return value from a callback function is ignored. (Callbacks which return a value were implementedin PHPlot-5.1.3.)
Note
Instead of using the name of a function in SetCallback, you can use a PHP anonymous function. See theexample in Section 4.5.2, “Custom Data Color Selection”.
4.4.2. Callback Function AccessBy default, the callback function has access only to the GD image resource as the $img argument, the pass-throughargument provided when the callback function was registered, and additional arguments (if any) provided by PHPlotfor the callback. It does not have access to the PHPlot class object instance, nor any of its contents.

PHPlot Advanced Topics
61
If you need access to the internals of the PHPlot class instance from your callback, you have three options.
1. You can declare your PHPlot class instance variable as global.
2. You can pass the instance variable as the $arg when registering the callback. With PHP5 and above, this will passa reference to the object, which allows reading and changing variables.
3. You can use a class method which extends PHPlot. This is described in Section 4.4.4, “Object Methods asCallbacks”.
As stated in the warning at the top of this section, any access to the class internals is risky and subject to break withany new update to PHPlot.
4.4.3. Available CallbacksThis section defines the currently available callback names. A callback name is also called a reason.
Note
At most one callback can be active for any given callback name, for each PHPlot object. Setting a secondcallback on the same name will result in the new callback replacing the old one.
Most of the callbacks currently available are drawing callbacks, activated during the graph drawing process startedby DrawGraph. By convention, a drawing callback occurs right after the event which it names. For example, thedraw_titles callback will be called after drawing the plot titles.
Debug callbacks are for use when developing and debugging PHPlot itself. Needless to say, their use for other purposesis discouraged.
The following table lists the available callback reasons.
Callback Name: Calling Point: Extra Parameters: Notes:
data_color Every time a coloris needed for a dataelement.
$row, $col, $extra The callback is expected to return an integercolor index into the data colors array. Thisis for custom color selection. For moreinformation, see Section 4.5, “Custom DataColor Selection”.
data_points Every time a datapoint is plotted,for supported plottypes.
$shape, $row,$col, ...
This callback is primarily used to createimage maps. For more information, seeSection 4.10, “Image Maps for Plot Data”.This was added in PHPlot-5.7.0.
draw_setup After all setup,before drawinganything.
(None) Anything drawn here will be covered by thebackground.
draw_image_background After drawing theimage backgroundsand border.
(None)
draw_plotarea_background After drawingthe plot areabackground.
plot_area plot_area parameter was added inPHPlot-5.1.0
draw_titles After drawing theplot title, X and Ytitles.
(None) Called even if no titles were set.

PHPlot Advanced Topics
62
Callback Name: Calling Point: Extra Parameters: Notes:
draw_axes After drawing the Xand Y axis and gridlines.
(None) Not called for pie charts.
draw_graph After drawing thebody of the graph.
plot_area plot_area parameter was added inPHPlot-5.1.0
draw_border After drawing theplot area border.
(None) Not called for pie charts before PHPlot-5.6.0
draw_legend After drawing thelegend, if legend isenabled.
(None) Not called if no legend was set.
draw_all After all drawing iscomplete.
plot_area Added in PHPlot-5.1.0
debug_textbox Just before drawingany text.
$px, $py,$bbox_width,$bbox_height
Provides access to the orthogonal boundingbox position and size for the text string.
debug_scale Called at endof many scalecalculationfunctions.
Function name, thenan array of variablename => value
For displaying intermediate values inmargin and scale calculations.
Notes:
Several of the drawing callbacks include plot_area as an extra parameter. This is an array of 4 values thatdefine the plot area within the image, in GD pixel coordinates, as left_x, top_y, right_x, and bottom_y. Formore information, see Chapter 7, PHPlot Plot Layout.
See Section 4.4.5, “Using Callbacks to Annotate Plots” for information on using the drawing callbacks toannotate your plot.
4.4.4. Object Methods as Callbacks
The callback function argument to SetCallback can be an array of two elements: a class variable and a method. Thiscan be used with any class, but here we are interested in using an extension of the PHPlot class. Consider the followingsetup:
class my_PHPlot extends PHPlot{ function __construct($width=600, $height=400, $outfile=NULL, $infile=NULL) { parent::__construct($width, $height, $outfile, $infile); }
function callback($img, $arg) { fwrite(STDERR, "callback in object\n"); fwrite(STDERR, "Plot area: ({$this->plot_area[0]}, {$this->plot_area[1]}) :"); fwrite(STDERR, " ({$this->plot_area[2]}, {$this->plot_area[2]})\n"); }}

PHPlot Advanced Topics
63
We define a class which extends PHPlot, and a method 'callback' which displays the plot area using the internal PHPlotclass variable plot_area.
Note
PHPlot version 6.1.0 and earlier used the class name as the constructor method name, as required in PHP4.This was deprecated in PHP7. Earlier versions of this reference manual used $this->PHPlot(...) tocall the parent constructor. This will not work with PHPlot after version 6.1.0 when the constructor namewas changed for PHP7.
Using __construct() in the extended class as shown above - for both the extended class constructor andwhen calling the base class constructor - will work in PHP5 and PHP7, and with PHPlot versions before andafter the constructor name change.
We will then create an instance of the extended class, and set a callback.
$plot = new my_PHPlot(400,300);$plot->SetCallback('draw_titles', array($plot, 'callback'));
When the draw_titles callback is triggered, it will call the 'callback' method inside our extended class. Because this isan extension of the PHPlot class, it has access to all the member variables via $this.
4.4.5. Using Callbacks to Annotate PlotsThis section contains information about using PHPlot callbacks to annotate a plot with text and graphics. This is anadvanced topic, and requires some knowledge of both PHPlot and the PHP GD extension.
Warning
The information in this section uses features which are recent additions to PHPlot, and in some cases usesPHPlot internal variables and functions. As a result, these methods are less likely to work with older releases,and more at risk to change or break in future releases.
This section will first provide general information and advice about annotating plots using callbacks. After, portionsof the script from Section 5.22, “Example - Annotating a Plot Using a Callback” will be explained in more detail.
The emphasis here is on using callbacks, but annotation is also possible without callbacks. You can useSetPrintImage(False) to disable automatic output of your image. Then, when DrawGraph returns, you can annotateyour plot using GD functions on the img member variable of your PHPlot object. Use of callbacks is preferred,however, because it makes your script somewhat less dependent on PHPlot internals (such as the img variable).
4.4.5.1. Setting the callback
Use SetCallback to establish a drawing callback. You can find a list of callbacks in Section 4.4.3, “AvailableCallbacks”. The various callbacks with names starting 'draw_' are called at different points in the drawing process.Drawn objects will cover items drawn at an earlier stage. For example, if you draw a line from a 'draw_titles' callback(which is called after the plot titles are drawn, but before the graph is drawn), the line would be 'behind' and possiblycovered by the plotted data.
Note that PHPlot does very little except save parameter values until you call DrawGraph. For that reason, you shoulduse GD functions for annotation only from a drawing callback (that is, a callback with a name starting with 'draw_').The drawing callbacks are called after PHPlot calculations and image resource setup, at which point everything isready for drawing. In addition, you should not use PHPlot functions which control plot appearance from your drawingcallback. These would either have no affect, because it is too late, or produce unexpected results.

PHPlot Advanced Topics
64
4.4.5.2. Coordinates
When drawing with GD, you will use the Device Coordinate system. The coordinates in this system are pixels, withthe origin in the upper left corner of your image. Y advances down and X advances to the right.
If you want to make annotations relative to specific values in your plot data, you need to translate those values fromWorld Coordinates to device coordinates. Use the PHPlot function GetDeviceXY to perform this translation. You willneed access to your PHPlot object from inside your callback function in order to use this (or any other PHPlot methodfunction). You can make it global, or designate it as the passthrough argument to SetCallback.
Note
This does not apply to pie charts, which have do not use world coordinates.
If your annotations will fall outside the plot area (for example, in an area you reserved for annotation usingSetPlotAreaPixels or SetMarginsPixels, then you need not be concerned with coordinate translation. Of course, youcan also add annotations at fixed pixel coordinates inside the plot area, however these may overlay (if done from adraw_graph or later callback) or underlay (if done before the draw_graph callback) the plotted data.
4.4.5.3. Colors
Every GD drawing function you use will require a color value argument. You are recommended to allocate yourown colors in your callback using the GD function imagecolorresolve(). This function will always returna color index, by either re-using an existing color in the image's color map, or by allocating a new color. Usingimagecolorresolve() rather than trying to access the PHPlot internal variables for color indexes will protect your scriptfrom breaking if the way PHPlot manages its internal colors ever changes.
4.4.5.4. Text
Text can be added to your plot using GD functions which include imagestring, for build-in simple fonts, andimagettftext for TrueType font text. To use these functions, you need device coordinates, as described above.
You can also add text to your plot using the PHPlot function DrawText. This is documented only for internal useby PHPlot, so there is a risk of future incompatibility. But this function provides support for controlling the textjustification, and works better with multi-line text.
4.4.5.5. Example
This example creates a bar chart and adds annotation. The goal is to draw an ellipse and add text to the highest andlowest bars in a bar chart. Refer to Section 5.22, “Example - Annotating a Plot Using a Callback” for the completescript and output from this example.
The script starts with the usual PHPlot object creation and setup.
$plot = new PHPlot(800, 600);$plot->SetTitle('Monthly Widget Sales');...
(For the complete script, see the example referenced above.)
Before calling DrawGraph, establish the drawing callback. This uses the draw_all callback, which gets called whenall drawing is complete in DrawGraph. (Note: If using PHPlot-5.0.7 or earlier, use 'draw_graph' instead, as 'draw_all'was not yet available.) The name of our callback function is annotate_plot, and we are passing the PHPlot object($plot) as a pass-through parameter. You can use a global or class callback instead - see Section 4.4.1, “CallbacksApplication Interface” for more on these options.
PHPlot Advanced Topics
65
$plot->SetCallback('draw_all', 'annotate_plot', $plot);
Here is the declaration of our callback function. The $img parameter is provided by PHPlot itself, and is the GDresource for our image. The $plot parameter is the pass-through argument we provided above when establishing thecallback. Some callbacks make other parameters available. In fact, 'draw_all' provides the plot area coordinates as anadditional parameter, but we don't need that here so we do not have to include that in the function declaration.
function annotate_plot($img, $plot){
As stated above, you should allocate your own colors, rather than trying to get into PHPlot's internals for color values.Here we allocate two colors and assign the color indexes to local variables:
$red = imagecolorresolve($img, 255, 0, 0);$green = imagecolorresolve($img, 0, 216, 0);
Next, we want to draw graphics centered on two points in our data. The points were calculated as best_index (X),best_sales (Y), worst_index (X), and worst_sales (Y). In order to draw at these locations, we need to translate thevalues from World Coordinates to Device Coordinates. This is done using the PHPlot function GetDeviceXY.
list($best_x, $best_y) = $plot->GetDeviceXY($best_index, $best_sales);list($worst_x, $worst_y) = $plot->GetDeviceXY($worst_index, $worst_sales);
Now we are ready to draw some ellipses, centered on our two data points. The values 50 and 20 are the width andheight, in pixels.
imageellipse($img, $best_x, $best_y, 50, 20, $green);imageellipse($img, $worst_x, $worst_y, 50, 20, $red);
As stated above, we have two options for text, and the example uses each method. We can draw text using the GDfunctions, but we have to do a little more work to position the text. Here the text is approximately centered horizontallyand above the data point. (Note ImageString by default uses the upper left corner of the text string for positioning.)
$font = '3';$fh = imagefontheight($font);$fw = imagefontwidth($font);imagestring($img, $font, $best_x-$fw*4, $best_y-$fh-10, 'Good Job!', $green);
Or, we can use the PHPlot internal function DrawText. With a PHPlot version 5.1.0 and later, we omit the fontspecification and it will default to the generic font, which can be set with SetFont('generic', ...)
$plot->DrawText('', 0, $worst_x, $worst_y-10, $red, 'Bad News!', 'center', 'bottom');
4.5. Custom Data Color Selection
This section describes customizing the selection of data colors using a PHPlot callback. The datacolor callback was added in PHPlot-5.1.3.
4.5.1. Standard Behavior of Data Color SelectionBefore explaining how to customize data color selection, here is a review of how data color selection works by default.

PHPlot Advanced Topics
66
Think of your data array as having rows and columns. The rows represent values of the independent variable (usuallyX), and the columns contain one or more values of the dependent variable (usually Y) for that value of the independentvariable. For this discussion, ignore any additional entries in the data array, such as labels and X values. The set ofvalues from a column in your data array is also referred to as a data set.
The standard behavior of PHPlot is to select a data color from the data colors array using the column index for thedata point. The selected color will be used to draw a point marker, line segment, bar, etc. This was explained inSection 3.5.3, “Plotting Colors”.
For example, if you have a data array with 12 rows and 3 columns for a bar chart, you are drawing 12 groups of 3 bars.Within each bar group, the first bar will be drawn with the first color in the data colors array (the color with index 0),the second bar will use the second color from the data colors array, and the third bar will use the third color. You can seethis in Example 5.4, “Bar Chart”, where the first three colors in the data colors array are SkyBlue, green, and orange.
There are two other color arrays: the error bar colors and data border colors. Error bar colors are used in error plots toindicate the positive and negative error range, and data border colors are used to draw borders around areas representingthe data for some plot types (such as bars). The same index (but not necessarily the same color) is used to select thecolor for any of the three elements which are used in a plot. For example, the first data set in a points plot with error barswill use data color index 0 for the point markers, and error bar color index 0 for the error bars. The second bar in eachgroup in an unshaded bar chart will use the second data color to fill the bar and the second data border color to outline it.
You can set the colors in the three color arrays with SetDataColors, SetErrorBarColors, and SetDataBorderColors.PHPlot will pad all these arrays to the number of columns in your data array, by duplicating the earlier values. (Forexample, if you have 5 data sets and define 3 colors red, green, and blue, PHPlot will pad this to be a 5 color arrayred, green, blue, red, green.) It will not truncate the arrays. This means you can define more data colors than thereare data columns. These additional colors will not be used with the standard color selection method, but can be usedwith custom data color selection.
4.5.2. Custom Data Color SelectionIf you need more control over data colors, you can use the PHPlot callback called data_color. (See Section 4.4,“Callbacks” for general information about callbacks.) Some of the things you can do with custom data color selectionare:
• A bar chart with each bar having a different color.
• A linepoints plot with different colors for the line segments and the point markers.
• A bar chart where the bar color depends on the value of that data point.
Note
Custom data color selection is not available for plot types area, pie, squaredarea, stackedarea, orstackedsquaredarea. These plot types already provide full control over the data color selection, withno need for the callback function, because each color in the color array is only used once.
To customize the use of data colors, you will define a function that accepts as arguments the data array row and columnindex numbers (0-based integers), and returns the color array index. Register this function with PHPlot as a callback,and your function will be called whenever PHPlot needs to select a data color.
Note that your callback will return an array index, not a color value. For example, if it returns 0, the first color in thedata colors array will be used, and the first color in the error bar colors array (if error bars are being drawn), and thefirst color in the data border colors array (if data borders are being drawn). You will most likely need to set up the datacolors array (and possibly the error bar colors array and data border colors array too) in order to get the results you want.
A function to act as a data color callback might look like this:

PHPlot Advanced Topics
67
function pickcolor($img, $passthrough, $row, $col, $extra = 0){ $color_index = ...;
return $color_index;}
The first two arguments are common to all callbacks: the PHPlot image resource, and your passthrough argument(if any - see below). (You generally will not need to access the image resource from the data colors callback, but itis provided to all callbacks.) The second and third arguments specify which data value is being plotted. The $rowcorresponds to the independent variable (usually X), and $col corresponds to the data set - plot line, bar within a bargroup, etc. Both $row and $col are zero based integers indexes.
Your callback is expected to return a color array index for this data point. This will be an integer greater than or equalto zero, where zero indicates the first color in the colors array should be used. Your returned index should be withinthe bounds of the color array being referenced, however PHPlot will use the value you return modulo the size of thearray. For example, the default PHPlot data colors array has 16 colors. If your callback returns the value 20, the 5thcolor in the array will be used (because 20 % 16 = 4, and index 4 is the 5th value in the array).
The $extra argument to your callback is for extra information you may need to determine the color to use. Currently,this is only used for 'linepoints' plots and 'linepoints' error plots. These plots are drawn in two stages: points and lines.In case you want different colors for the points and lines, use the $extra argument. It will have the value 1 whenPHPlot is requesting the color of the point marker (shape), and the value will be 0 when requesting the color of theline segment. Note that the error bars of a linepoints error plot are drawn with the color index returned for the points(but using the error bars colors, not the data colors).
You do not need to specify the $extra argument in your callback function declaration if you do not need it. But if you dospecify it, you must make it an optional argument with the value zero, because PHPlot does not always supply the value.
The above function would be established as a data color callback for a PHPlot object $plot like this:
$plot->SetCallback('data_color', 'pickcolor', $passthru_arg);
The first argument is the callback name, or 'reason': data_color. The second argument is the name of your callbackfunction. An object and method can be used here instead - see Section 4.4.4, “Object Methods as Callbacks”. The thirdargument is an optional pass-through value that will be sent to your callback function each time it is called.
You can also use a PHP anonymous function as a data color callback (or as any callback). This is recommended onlywhen the color selection code is relatively short. Here is an example of using an anonymous function as a data colorcallback. This uses color 1 (green) or 4 (red) based on the value of a bar chart value (text-data data type). Notethe use clause is used by the anonymous function to access the data array $data.
$plot->SetCallback('data_color', function($img, $passthru, $row, $col) use($data) { if ($data[$row][$col + 1] >= 50) return 1; return 4; });
4.5.3. Custom Data Color Selection and LegendIf your plot includes a legend, the legend uses the colors in the order defined in the data colors array, without regard toany custom data color selection callback. When using a legend with a custom data color selection callback, you needto define your data colors array (with SetDataColors, if used) and set your legend lines (with SetLegend) knowing that

PHPlot Advanced Topics
68
each legend line will reference the corresponding color in the data array in order. The Custom Bar Colors examplereferenced below demonstrates this.
4.5.4. Custom Data Color Selection ExamplesFor examples of using a data color callback, see Section 5.25, “Example - Creative Use of the Data Color Callback”and Section 5.26, “Example - Custom Bar Colors Using the Data Color Callback”.
4.6. Plot Range and Tick IncrementCalculations
This section describes how PHPlot calculates the range of World Coordinate space, and the tickincrement for each axis, when those values have not been set manually.
In order to plot a data set, PHPlot needs to map the data points from world coordinate space to device coordinatespace. The world coordinates of the data points are generally in real-world units, such as kilometers, seconds, degreescentigrade, etc. Device coordinates are pixels in an image file, display screen, or paper hardcopy. PHPlot knows thepixel coordinates of the limits of the plot area in device space. In order to translate data points from world coordinatesinto pixel coordinates, it needs to know the limits of world coordinate space. These can be provided manually, orcomputed by PHPlot.
The limits of world coordinate space are the end-points of the X and Y axis lines. The two end-points of an axis arealso referred to as the plot range along that axis. Each of those plot ranges is divided into uniformly sized tick intervals,which may or may not be marked by visible tick marks. The space between tick marks is called the tick increment.PHPlot will calculate a suitable tick increment if necessary.
The rest of this section describes how PHPlot calculates the limits of the plot ranges, and the tick increments.
Note
This section does not apply to pie charts, which do not have X or Y axis lines.
4.6.1. Manual (Fixed) Plot Range and Tick IncrementIf you use SetPlotAreaWorld to set both Xmin and Xmax to non-NULL values, this will fix both ends of the X axis.Similarly, setting both Ymin and Ymax to non-NULL values will fix both ends of the Y axis. If you set both endsof an axis, PHPlot will use exactly that for the plot range on that axis. This is recommended if your data has a rangewhich is known, predictable, and/or 'natural'. For example, if your Y axis represents percentage values from 0 to 100,you might use this to fix the Y axis ends:
$plot->SetPlotAreaWorld(NULL, 0, NULL, 100);
You can use SetXTickIncrement to set a fixed X tick increment, and SetYTickIncrement to set a fixed Y tick increment.If you set a fixed tick increment along an axis, PHPlot will use exactly that value (even if it results in too many, ortoo few tick marks).
Another way to manually specify tick increments is with SetNumXTicks or SetNumYTicks. These set the desirednumber of tick intervals. PHPlot will then calculate the tick increment by dividing the plot range into exactly that manyintervals. For example, if the Y axis range is 0 to 17, and you use $plot->SetNumYTicks(6) to get 6 intervals,then the tick mark spacing will be about 2.833333. This is probably not a desirable value for the tick increment. UsingSetNumXTicks or SetNumYTicks to set the number of tick intervals is usually not a good idea, unless you alsoset the plot range with SetPlotAreaWorld.
PHPlot Advanced Topics
69
If you set both ends of the X or Y plot range, PHPlot will position tick marks starting from the lower end of that range,by default. For example, if you set the Y axis range from 1 to 20, with a tick increment of 5, the tick marks will be at 1,6, 11, and 16. You can set a tick anchor to change this. See Section 4.6.9, “Tick Positions” below for more information.
4.6.2. Partial Fixed Plot RangeIf you use SetPlotAreaWorld to set either Xmin or Xmax (but not both) to a non-NULL value, or you set either Yminor Ymax (but not both) to a non-NULL value, then you are fixing one end of the plot range. PHPlot will use your fixedvalue for that end of the range, and calculate the other end as described below.
This may make sense if your data has a fixed lower (or upper) bound. For example, if you are plotting outdoor summertemperatures in degrees Fahrenheit, you might use something like this:
$plot->SetPlotAreaWorld(NULL, 60);
which sets Ymin to 60.
Since PHPlot positions tick marks starting from the lower limit of the X and Y plot ranges, setting Xmin or Yminestablishes the basis for tick marks along that axis. For example, if you set the lower end of the X axis range to 12,with a tick increment of 10, the tick marks along X will be at 12, 22, 32, etc. You can set a tick anchor to change this.See Section 4.6.9, “Tick Positions” below for more information.
4.6.3. Automatic Range CalculationEach end of the plot range (for both X and Y) which is not specified using SetPlotAreaWorld will be calculated byPHPlot. The algorithm used by PHPlot to calculate the ends of a plot range is not perfect, but is meant to createreasonable plots in a majority of cases.
Note
This description applies starting with PHPlot-6.0.0. In older versions, PHPlot used a more simplistic approachto calculating the plot range.
Here is an overview of the method, using the Y axis as an example. DataMin and DataMax are the smallest andlargest Y values in the data array (or the values derived from the data array, for some plot types). PlotMin andPlotMax are the calculated limits of the plot range. Remember that PHPlot only calculates PlotMax and PlotMin ifthey have not already been set using SetPlotAreaWorld.
1. Initialization: Start by setting the plot range to the data range: PlotMin = DataMin, and PlotMax = DataMax. Theplot range will now include all the data, but just barely.
2. Zero Magnet: If the plot range does not currently include zero (PlotMin <= 0 and 0 <= PlotMax), PHPlot tries toextend the range so it will begin or end at zero. This is done by either by moving PlotMin down to zero (for positivedata), or by moving PlotMax up to zero (for negative data). There is a limit as to how far PHPlot is willing to extendthe plot range to include zero (see below).
3. End Adjust / Increase range: PHPlot may then adjust the ends of the plot range by a factor (adjust_amount)multiplied by the plot range. This provides some extra room above or below the data for data value labels, andprevents the top (or bottom) of the plotted data from hitting the edge of the plot area, which would detract from theappearance. Adjustment only occurs for PlotMin if it is negative, and for PlotMax if it is positive. This correspondsto the direction of the plot data 'away' from zero. For example, if 0 < PlotMin < PlotMax (all the data is positive),then PlotMax will be increased. If PlotMin < PlotMax < 0 (all the data is negative), then PlotMin will be decreased.If the range spans 0 with PlotMin < 0 < PlotMax, then both PlotMin will be decreased and PlotMax will be increased.
4. End Adjust / Finalize: PHPlot may then adjust the ends of the plot range further, based on the adjustment mode(adjust_mode), but only if the end of the range is not already zero.

PHPlot Advanced Topics
70
• If the adjustment mode is T (Tick, the default mode), then PlotMax is adjusted up to the next higher tick markposition, and PlotMin is adjusted down to the next lower tick mark position. Note that this happens even iftick marks are not displayed. If a tick anchor is set, this is taken into account when adjusting the range (seeSection 4.6.9, “Tick Positions” below).
• If the adjustment mode is R (Range), there is no further adjustment.
• If the adjustment mode is I (Integer), then PlotMax is adjusted up to the next higher integer, and PlotMin isadjusted down to the next lower integer.
Note that adjustment modes R and I are intended for special applications where the default T (Tick) mode producesundesirable results.
4.6.4. Automatic Range ParametersThe range calculation uses parameters which can be set using TuneXAutoRange and TuneYAutoRange. Theparameters are described in the next sections.
4.6.4.1. Range parameter: zero_magnet
The zero_magnet parameter sets the strength of the zero magnet, which controls how far PHPlot is willing to extendthe plot range to include zero, if the range does not already include zero. This is a floating point number greater thanor equal to 0, and less than or equal to 1.0. A value of 0 means the magnet is disabled. PHPlot will not extend the plotrange to include zero. A value of 1.0 means the magnet strength is infinite, and PHPlot will always extend the plotrange to include zero. For increasing values between 0.0 and 1.0, the zero magnet becomes stronger, and PHPlot willgo further in extending the plot range to include zero.
Between 0 and 1.0, the zero magnet factor is applied as follows. Let ZF = zero_magnet / (1 - zero_magnet). This mapsthe zero magnet domain of 0:1 into the range 0:infinity. PHPlot will extend the plot range to include 0 if that increasesthe range by a factor of ZF or less.
For example, the default zero magnet factor of 6/7 results in ZF=6, so PHPlot will 'pull' the bottom of the plot rangedown to zero if doing so will stretch the range by 600% or less. (If the data is all negative, it will apply the zero magnetto 'pushing' the top of the range to zero in the same manner.) If the data range is 500 to 600, PHPlot will adjust itto become 0 to 600, because adjusting the lower range by 500 is less than the maximum 6*100. If the data range is900 to 1000, PHPlot will not adjust it to start at 0, because the zero magnet is only 'strong enough' to pull the rangedown by 6*100, not 900.
The purpose of having a variable zero magnet is to balance two conflicting goals:
• Including zero in the data range improves the utility of plots, as it facilitates comparing relative changes anddifferences.
• Increasing the data range of a plot makes it harder to see relatively small changes in the data.
4.6.4.2. Range parameter: adjust_mode
The adjust_mode parameter selects from one of three methods PHPlot has to determine how to extend the end ofthe plot range. The value is a single character, selecting one of three available modes.
Mode Description
T Tick : extend the range, then to the next tickmark.
R Range : extend the range.

PHPlot Advanced Topics
71
Mode Description
I Integer : extend the range, then to the nextinteger value.
The default mode is T, extend to tick mark. Mode I, extend to integer, is similar to the only available adjustmentmode available before PHPlot-6.0.0.
Range end adjustment works as follows. First, PlotMin is extended by the adjust_amount multiplied by the currentplot range (PlotMax - PlotMin), but only if PlotMin is negative. Similarly, PlotMax is extended by the same factor,but only if it is positive. This corresponds to where extra spaces is needed for data value labels, for example: abovepositive values, and below negative values.
For adjustment mode R, that completes the range adjustment. For example, in this mode, with the adjustment amount0.025 and data range -10 to 10, the resulting plot range will be -10.5 to 10.5 (having been increased at each end by2.5% times the range of 20).
For adjustment mode I, after extending the range, PHPlot adjusts PlotMin to the next lowest integer, and PlotMaxto the next highest integer. Using the same example, with the data range -10 to 10 and adjustment amount 0.025, therange is now -11 to 11 using this mode.
Adjustment mode T, the default mode, extends the range end to coincide with a tick mark (or where a tick mark wouldbe, if tick marks were displayed). In this mode, the adjust_amount can be thought of as controlling the minimumamount of space between the top of the data and the next tick mark. If the adjust_amount is 0, and the maximum datavalue DataMax falls exactly on a tick mark, PHPlot will end the range at that tick mark. But if adjust_amount is greaterthan zero, PHPlot will extend the range by least one additional tick mark.
As an example of T adjustment mode, consider a Y tick increment of 10, and adjustment amount 0.03 (3%). With theY data range of 0 to 95, PHPlot will set PlotMax to 100 - extending the range to the very next tick mark. But with a Ydata range of 0 to 98, the space between DataMax and the tick mark at 100 is not enough (less than 3% of the range),so the range is extended to the next tick mark after that, at 110.
4.6.4.3. Range parameter: adjust_amount
The adjust_amount parameter determines how much the end of the plot range is adjusted (extended) to leave roomfor labels within the plot area, or to keep the plotted data from pushing against the edge of the plot. This is a non-negative floating point value.
See the previous section on how the adjust_mode and adjust_amount parameters are used.
The default adjustment amount is either 0 (0%) or 0.03 (3%), depending on the plot type, and on whether the adjustmentis for the independent or dependent variable. For most plot types, the default is 0 for the independent variable axis (X forvertical plots, Y for horizontal plots), and 3% for the dependent variable axis. Some plot types, such as bubbles, benefitfrom adjustment on both axes, so the default value for adjust_amount is 3% for both X and Y. Other plot types, suchas candlesticks, do not need any adjustment on either axis (because there are no data value labels, and the upper wickmay touch the edge of the plot without harm). For these plot types, the default adjust_amount is 0% for both X and Y.
4.6.5. Examples of Automatic Range Calculation
Here are 3 examples showing the automatic range calculation. Each figure contains 4 plots showing the cumulativeeffect of the numbered steps which are detailed above: (1) initial range, (2) zero magnet, (3) end adjust / increaserange, and (4) end adjust / finalize ('Tick' adjust mode).
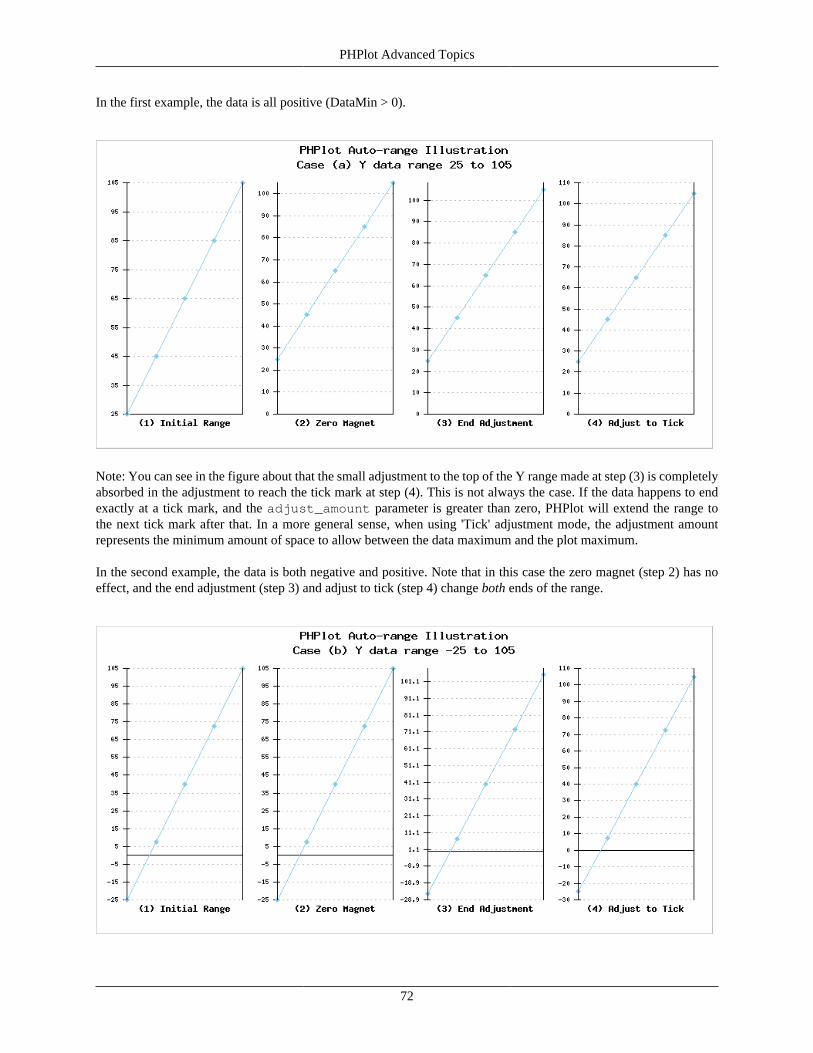
PHPlot Advanced Topics
72
In the first example, the data is all positive (DataMin > 0).
Note: You can see in the figure about that the small adjustment to the top of the Y range made at step (3) is completelyabsorbed in the adjustment to reach the tick mark at step (4). This is not always the case. If the data happens to endexactly at a tick mark, and the adjust_amount parameter is greater than zero, PHPlot will extend the range tothe next tick mark after that. In a more general sense, when using 'Tick' adjustment mode, the adjustment amountrepresents the minimum amount of space to allow between the data maximum and the plot maximum.
In the second example, the data is both negative and positive. Note that in this case the zero magnet (step 2) has noeffect, and the end adjustment (step 3) and adjust to tick (step 4) change both ends of the range.

PHPlot Advanced Topics
73
The third example has all negative data (DataMax < 0). Zero magnet applies to the top of the range, and end adjustmentapplies to the bottom of the range in this case.
4.6.6. Implied Independent Variable CaseThere are two implied independent variable cases:
1. When using the text-data data type, you are drawing a vertical plot without specifying the values of the independentvariable X. Your data array will contain only labels and Y values; the X values are implied.
2. When using the text-data-yx data type, you are drawing a horizontal plot without specifying the values of theindependent variable Y. Your data array will contain only labels and X values; the Y values are implied.
If you don't use SetPlotAreaWorld to set an explicit plot range for the independent variable axis in these cases, PHPlotsets the plot range for that axis to start at 0 and end at N, where N is the number of rows in the data array. The automaticrange calculation is disabled for that axis, and there is no adjustment.
4.6.7. Automatic Tick Increment CalculationFor both the X axis and Y axis, PHPlot calculates a tick increment if it was not set as described above. (Even if yourplot has no visible tick marks along an axis, PHPlot will calculate a tick increment for that axis, since it might be usedin adjusting the plot range.)
Note
This description applies starting with PHPlot-6.0.0. In older versions, PHPlot simply divided the plot rangeby 10 to calculate the tick increment.
PHPlot uses one of three methods to calculate a tick increment for a given plot range (along the X or Y axis). Themethods are called 'decimal', 'binary', and 'date', and correspond to the tick_mode parameter described below. Bydefault, PHPlot uses the 'decimal' method, unless the axis labels have been set up to use date/time labels, in which caseit uses the 'date' mode. You can also directly control which method is used.
PHPlot Advanced Topics
74
Using the decimal method, PHPlot picks the largest tick increment which is 1, 2, or 5 times a power of 10, and whichdivides the plot range into no fewer than the acceptable minimum number of tick intervals (see the min_ticksparameter below). The power of 10 can be negative, zero, or positive. Valid automatically-calculated tick incrementsfor non-negative powers of 10 include 1, 2, 5, 10, 20, 50, 100, 200, 500, etc. Valid automatically-calculated tickincrements for negative powers of 10 include 0.5, 0.2, 0.1, 0.05, 0.02, 0.01, etc.
For example, given the range 0 to 135, and the default min_ticks of 8, PHPlot will calculate a tick increment of 10,giving 14 intervals. A tick increment of 20 is not valid because it would result in only 7 intervals, fewer than theminimum of 8. A tick increment of 5 would result in 28 intervals; while there is no explicit maximum, PHPlot choosesthe largest valid increment that produces 8 or more intervals.
When using the date method, PHPlot selects from a pre-defined list of valid tick increments. The list covers a rangefrom 1 second up to 7 days: 1, 2, 5, 10, 15, and 30 seconds; 1, 2, 5, 10, 15, and 30 minutes, then 1, 2, 4, 8, 12,24, 48, 96, and 168 hours. PHPlot will pick the largest increment in the list which will result in no fewer than theacceptable minimum number of tick intervals (min_ticks). If the plot area range exceeds 7 days, PHPlot switchesto the 'decimal' method instead, with units of 24 hours. With the 'date' method, PHPlot never chooses an incrementless than 1 second.
For example, given a date/time range which spans 1020 seconds (17 minutes), and the default min_ticks of 8, PHPlotwill calculate a tick increment of 120 seconds (2 minutes), which results in 9 intervals. This is the largest incrementin the list above which results in 8 or more intervals.
When using the binary method, PHPlot picks the largest tick increment which is a power of 2, and which dividesthe plot range into no fewer than the acceptable minimum number of tick intervals (see the min_ticks parameterbelow). The power of 2 can be negative, zero, or positive. Valid automatically-calculated tick increments for non-negative powers of 2 include 1, 2, 4, 8, 16, 32, etc. Valid automatically-calculated tick increments for negative powersof 2 include 1/2, 1/4, 1/8, 1/16, 1/32, etc. (Note that PHPlot will label these ticks as decimal values 0.5, 0.25, 0.125etc., not fractions.)
4.6.8. Automatic Tick Increment ParametersThe tick increment calculation uses parameters which can be set using TuneXAutoTicks and TuneYAutoTicks. Theparameters are described in the next sections.
4.6.8.1. Tick Increment parameter: min_ticks
The min_ticks parameter sets the minimum number of tick intervals along the axis. The default is 8. The maximumnumber of tick intervals will be about 2.5 times the minimum. (The value 2.5 comes from the largest ratio betweenadjacent acceptable tick increment values. This is true for the 'decimal' method choices of 1, 2, 5, 10, 20, etc., the'binary' method, and also for the pre-defined list of values used with the 'date' method.) Therefore, by default, a plotrange will have between 8 and 20 tick intervals inclusive (before possible additional tick intervals resulting fromadjustment to the range, as described above).
4.6.8.2. Tick Increment parameter: tick_mode
The tick_mode parameter selects one of the three available methods to calculate the tick increment:
Mode Description
decimal Use a power of 10 times 1, 2, or 5
binary Use a power of 2
date Use a date/time increment value
PHPlot Advanced Topics
75
These methods are described in more detail above.
By default, PHPlot will automatically decide which method to use. It will use the 'date' method if the correspondingaxis tick labels use date/time formatting (as set with SetXLabelType('time') or SetYLabelType('time')).Otherwise is will use the 'decimal' method.
Use this parameter to override the automatic tick increment method selection. For example, if you are using date/timevalues along the X axis, but have a custom label formatting function (rather than selecting time format type), youwill probably want to tell PHPlot to pick a date/time tick increment for the X axis:
// Pick a date/time tick increment on X:$plot->TuneXAutoTicks(NULL, 'date');
Another example is if you are using time value label types along X, but you want tick increments to follow the 1, 2,5 times power of 10 rule, rather than choosing a date/time value. You can use:
// Format X labels as time values:$plot->SetXLabelType('time', '%H:%M:%S');// Override default and use the decimal method to pick a tick increment:$plot->TuneXAutoTicks(NULL, 'decimal');
In this third example, your Y axis values represent something like memory sizes which are normally measured inpowers of two. You can have PHPlot pick a power of two as a tick increment with:
// Use a power of 2 for the Y axis tick increment:$plot->TuneYAutoTicks(NULL, 'binary');
If the plot range is small enough, PHPlot may select a tick increment which is less than one - a negative power of two.This results in a tick increment of 1/2, 1/4, 1/8, 1/16, or smaller. If you want to use the binary tick method, but do notwant fractional tick increments, set tick_inc_integer (see next section):
// Valid tick increments are powers of 2 >= 1$plot->TuneXAutoTicks(NULL, 'binary', TRUE);
4.6.8.3. Tick Increment parameter: tick_inc_integer
The tick_inc_integer parameter is a boolean flag which can be set to prevent fractional tick increments. Ifthe flag is TRUE, PHPlot will not pick a tick increment less than 1. This may result in fewer than min_ticks tickintervals. If the flag is FALSE, PHPlot may pick any tick increment. The default is FALSE.
The 'decimal' and 'binary' tick increment selection methods (see above) can select tick increments less than 1, usingnegative powers of 10 or 2 respectively. This will happen if the plot range is small enough (and/or min_ticks is highenough). Specifically, a fractional tick increment will result from having a plot range which is less than the minimumnumber of ticks. Set tick_inc_integer to TRUE if you do not want fractional tick increments. This parameterdoes not apply to the 'date' tick increment selection method, which does not support tick increments less than 1 second.In 'date' mode, tick_inc_integer is assumed TRUE.
Note
PHPlot never picks a tick increment which is greater than one and not a whole number. Selected tickincrements are either integers >= 1, or fractions between 0 and 1.
For example, if your Y data range is 0 to 1.8, and you set the tick_inc_integer parameter for Y to TRUE, thenPHPlot will use a tick increment of 1, and you will get only 2 tick intervals. This is less than the default minimum of
PHPlot Advanced Topics
76
8 tick intervals. With tick_inc_integer FALSE, PHPlot would use a tick increment of 0.2 in 'decimal' mode,or 0.125 in 'binary' mode.
4.6.9. Tick PositionsThis section describes how PHPlot positions the tick marks along the X and Y axis (if tick marks are enabled), andthe tick label values which result. Several factors are involved:
• The plot range minimum (PlotMin), which is the world coordinates of the left end of the X axis, or the worldcoordinates of the bottom of the Y axis.
• Whether or not a tick anchor was set. You use a tick anchor to tell PHPlot that you want tick marks based on aparticular world coordinate value.
• The plot range adjustment mode adjust_mode (see above), if PHPlot calculated the plot range minimum PlotMinautomatically.
PHPlot generally places tick marks along each axis starting from the minimum value of the plot range (PlotMin), whichis the left-most position on the X axis, and the bottom-most position on the Y axis. Therefore, the value of PlotMinaffects all the tick values. For example, if the tick increment is 10, and PlotMin is 12, ticks will be at 12, 22, 32, 42.
A tick anchor can be set with SetXTickAnchor or SetYTickAnchor to change tick mark positions. In the above example,with PlotMin 12, if you set a tick anchor at 10, you will get tick positions 20, 30, 40, etc. Setting the tick anchorshifts all the ticks, so one of them falls at the anchor (or would, if the axis was extended). Thus, a tick anchor canbe used to 'round off' the tick values to desired numbers, when the plot range minimum (PlotMin) is not a multipleof the tick increment.
If you set the plot range minimum (PlotMin) to a fixed value with SetPlotAreaWorld, consider that this value will beused as the basis for tick marks along that axis, unless you also set a tick anchor.
If PHPlot calculates the plot range minimum using the default adjustment mode T (adjust to tick, see above), thenPHPlot will adjust the range to start at a tick mark. That is, PHPlot acts as if a tick anchor was set at 0. Your tick markswill be at whole multiples of the tick increment, unless you set a tick anchor to move them somewhere else.
In the other adjustments modes - I (integer) or R (range) - PHPlot makes no attempt to correlate the plot range minimumwith the tick increment. Your tick marks will probably not be located at multiples of the tick increment. In mode R(range), your tick marks will likely not even be whole numbers. As in all other cases, you can set a tick anchor toposition the tick marks at the values you prefer.
Here are some examples of PHPlot-calculated plot ranges and tick positions, when no tick anchor has been set.
Y datamin
Y datamax
AdjustmentMode
ResultingPlot Range
Resulting Tick Positions Notes
7 123 T (tick) 0 to 130 0, 10, 20, ... 130 The bottom of the Y range is extended tozero, and the tick marks are at multiplesof 10. The top of the Y range is extendedto the next tick mark.
7 123 R (range) 0 to 126.69 0, 10, 20, ... 120 With 'R' adjustment mode, the top ofthe Y range is extended by 3% of therange. The bottom of the Y range wasmoved to zero (due to the zero magnet),so the tick marks are based at 0 andpositioned at whole multiples of 10. Theresulting tick marks are the same as 'T'

PHPlot Advanced Topics
77
Y datamin
Y datamax
AdjustmentMode
ResultingPlot Range
Resulting Tick Positions Notes
mode, except the Y axis does not end ata tick mark.
7 123 I (integer) 0 to 127 0, 10, 20, ... 120 Here 'I' adjustment mode is almostthe the same as the previous case, exceptthe top of the range is adjusted tothe next integer. Since there is no tickmark there, the difference would not bevisible.
-17 33 T (tick) -20 to 35 -20, -15, -10, -5,0, 5, 10, ... 35
Both ends of plot range are adjustedto a tick position, with an implied tickanchor at 0. The resulting tick marks areat whole multiples of the tick step 5.
-17 33 R (range) -18.5 to 34.5 -18.5, -13.5, -8.5,1.5, 6.5, ... 31.5
In this mode, the range is simplyextended by 3% (by default) at eachend, where 3% of (33+17) = 1.5.The resulting tick mark positions areprobably not ideal.
-17 33 I (integer) -19 to 35 -19, -14, -9, -4, 1, 6, ... 31 In this mode, the range is extended by3%, and then the ends are extendedto the next integer. The tick markpositions are whole numbers now, butnot anchored at 0.
To summarize, setting a tick anchor to force the tick positions to align one tick at a particular value, usually 0, canbe useful in the situations including:
• You are letting PHPlot calculate the range, but with adjustment mode R (range) or I (integer).
• You are manually setting the minimum of the plot range with SetPlotAreaWorld to a value other than zero or awhole multiple of the tick increment.
• You are using date/time values along the axis, and you need the ticks to start at a specific date/time value (suchas the start of an experiment).
• You are using a version before PHPlot-6.0.0, which only supports an adjustment mode similar to I (integer).
4.6.10. Plot Range Regressive CasesGiven incomplete or contradictory data, PHPlot will always produce a positive plot range (PlotMin < PlotMax),although the range may be somewhat arbitrary. Here are some of the regressive cases, and how PHPlot produces anautomatic range for them. DataMin and DataMax mean the limits of the data from the data array; PlotMin andPlotMax are the limits of the plot range. In all cases, any values specified in SetPlotAreaWorld will not be alteredby PHPlot, even if it results in a plot with no visible data points.
Empty range with non-zero values (DataMin == DataMax != 0):For positive data, PHPlot uses the range 0 to K, where K is the larger of DataMin and 10. For example, if all theY values are 5, PHPlot uses 0 to 10 for the Y range; if all the Y values are 150, PHPlot uses 0 to 150. For negativedata, PHPlot uses a similar method, setting PlotMax=0.
Empty range with all zero values (DataMin == DataMax == 0):PHPlot uses the arbitrary range 0 to 10.

PHPlot Advanced Topics
78
Partially specified range with maximum set and all data above that:If you set PlotMax to a value, but all your data is above that (DataMin > PlotMax), you will get an empty plot.PHPlot will use a range of 0 to PlotMax if your PlotMax is positive, else a range of PlotMax-10 to PlotMax. Allyour data points will be outside the plot area.
Partially specified range with minimum set and all data below that:If you set PlotMin to a value, but all your data is below that (DataMax < PlotMin), you will get an empty plot.PHPlot will use a range of PlotMin to 0 if your PlotMin is negative, else a range of PlotMin to PlotMin+10. Allyour data points will be outside the plot area.
Negative range or zero range:If you try to use SetPlotAreaWorld to set a negative range (PlotMin > PlotMax) or zero range (PlotMin ==PlotMax), PHPlot will report an error and not produce a plot.
Note that the above range choices happen as part of the "initialization" step of automatic range calculation (seeSection 4.6.3, “Automatic Range Calculation” above). That is, the selected range is then subject to the same adjustmentsas in other cases.
4.7. Tuning Parameters
This section documents some PHPlot class member variables that can be used to adjust theappearance of plots. You should rarely find it necessary to change these, and PHPlot does not provide"Set" functions for them.
The class member variables listed in Section 10.1, “List of Member Variables” are generally reserved for use onlyby the class implementation itself. But there are some adjustments you can make to the appearance of a plot only bychanging member variables. This section documents some PHPlot class member variables that alter a plot appearance,but which do not have any defined class functions for you to use to set the values.
For example, if you want PHPlot to draw the X/Y grid above (after) the plot, rather than behind it, you would dothe following:
$plot = new PHPlot(800, 600);...$plot->grid_at_foreground = TRUE; // Draw grid after plot
4.7.1. Tuning Bar ChartsThese variables affect plot types bars and stackedbars. They are used to control the width of the bars. (For horizontalplots, the "width" of the bars is actually the height.)
bar_extra_spaceControls the amount of extra space within each group of bars. Default is 0.5, meaning 1/2 of the width of one baris left as a gap, within the space allocated to the group (see group_frac_width). Increasing this makes eachgroup of bars shrink together. Decreasing this makes the group of bars expand within the allocated space.
group_frac_widthControls the amount of available space used by each bar group. Default is 0.7, meaning the group of bars fills 70%of the available space (but that includes the empty space due to bar_extra_space). Increasing this makesthe group of bars wider.
bar_width_adjustControls the width of each bar. Default is 1.0. Decreasing this makes individual bars narrower, leaving gapsbetween the bars in a group. This must be greater than 0. If it is greater than 1, the bars will overlap.
PHPlot Advanced Topics
79
If bar_extra_space=0, group_frac_width=1, and bar_width_adjust=1 then all the bars touch (within each group, andadjacent groups).
4.7.2. Tuning Box PlotsThese variables affect plot type boxes. (Box Plots were added in PHPlot-6.1.0.)
boxes_max_widthThis is one half the maximum width of the boxes. The default is 8 pixels.
boxes_min_widthThis is one half the minimum width of the boxes. The default is 2 pixels.
boxes_frac_widthThis is the fractional amount of the available space (plot width area divided by number of points) to use for halfthe width of the boxes. The default is 0.3. This needs to be less than 0.5 or there will be overlap between adjacentboxes.
boxes_t_widthThis is the ratio of the width of the 'T' ends of the whiskers to the width of the boxes. The default is 0.6, meaningthe 'T' ends are 60% of the width of the boxes.
PHPlot calculates the width of the boxes in a box plot in the same way as it does for OHLC and candlestick plots (seeSection 4.7.4, “Tuning OHLC Charts”). Half of the width of each box is:
half_width = max(boxes_min_width, min(boxes_max_width, boxes_frac_width * avail_area))Where avail_area = plot_area_width / number_data_points
4.7.3. Tuning Bubble PlotsThese two variables set the range of bubble size in bubbles plots.
bubbles_min_sizeMinimum bubble diameter in pixels.
bubbles_max_sizeMaximum bubble diameter in pixels.
The point with the smallest Z value will be drawn as a bubble with a diameter of bubbles_min_size, and the point withthe largest Z value will be drawn as a bubble with a diameter of bubbles_max_size. That is, PHPlot linearly maps therange of Z values in the plot to the range of bubble sizes.
By default, the minimum bubble size is 6 pixels, and the maximum bubble size is 1/12 times the smaller of the plotarea width and plot area height. For example, if the plot area is 800x600, the default maximum bubble size will be50 pixels (600 / 12).
4.7.4. Tuning OHLC ChartsThese variables affect plot types ohlc, candlesticks, and candlesticks2, For candlesticks plots, they adjust thecalculation of the width of the candlestick body. For basic OHLC plots, they adjust the calculation of the length of thetick marks which represent opening and closing prices. (All of these were added in PHPlot-5.3.0.)
ohlc_max_widthThis is one half the maximum width of the candlestick body, or the maximum length of an OHLC tick mark.The default is 8 pixels.

PHPlot Advanced Topics
80
ohlc_min_widthThis is one half the minimum width of the candlestick body, or the minimum length of an OHLC tick mark. Thedefault is 2 pixels.
ohlc_frac_widthThis is the fractional amount of the available space (plot width area divided by number of points) to use for halfthe width of the candlestick bodies or OHLC tick marks. The default is 0.3. This needs to be less than 0.5 or therewill be overlap between adjacent candlesticks.
PHPlot calculates a value to use for one half the width of the candlestick bodies, or for the OHLC open/close tickmark lengths, as follows:
half_width = max(ohlc_min_width, min(ohlc_max_width, ohlc_frac_width * avail_area))Where avail_area = plot_area_width / number_data_points
4.7.5. Tuning Pie ChartsThese variables adjusts the appearance of pie charts.
pie_diam_factorDiameter factor for shaded pie charts. This is the ratio of the height to the width of the pie. The default value is0.5, meaning the pie chart will be drawn as an ellipse with height equal to half of its width. This variable is ignoredfor unshaded plots (see SetShading), which are always circular (diameter factor of 1.0).
pie_min_size_factorThe minimum size of the pie in a pie chart, relative to the plot area size. When pie chart autosizing is on (seeSetPieAutoSize), and pie labels are located outside the pie chart (as they are by default), PHPlot will shrink thepie so the labels will fit inside the plot area. To prevent an overly long label from making the pie too small, PHPlotuses pie_min_size_factor to limit how small the pie will become. The default value is 0.5, meaning thepie chart will be no smaller than half the width or height of the plot area, even if that makes the labels fall partlyoff the image.
Setting this smaller allows the pie to be a smaller portion of the plot area, if long labels require the space. Settingthis larger prevents the pie from becoming smaller in that case. Setting this to 1.0 is approximately equivalentto using SetPieAutoSize(False). (The difference is that the later still leaves a small gap between the pieand the plot area boundary.)
4.7.6. Tuning the LegendThis variable adjusts the appearance of the legend.
legend_colorbox_widthThis is an adjustment factor for the width of the color boxes in the legend. With the default value 1.0, the colorboxes are as wide as one character in the font used in the legend (width of "E" for TrueType fonts). A valueof 2.0 makes the color boxes twice as wide, and 0.5 makes them half the character width. (This was added inPHPlot-5.3.0.)
If point shapes are used in the legend instead of color boxes (see SetLegendUseShapes - for points plots andsimilar), then legend_colorbox_width still adjusts the horizontal space allocated for the point shape. Thepoint shape itself is not scaled, but is always drawn at the same size as in the plot itself. If the plot area has a colorbackground, the width adjustment will stretch the box in that color which is drawn behind the point shape.
If line markers are used in the legend of instead of color boxes (see SetLegendUseShapes - with line plots andsimilar), then legend_colorbox_width scales the horizontal space allocated for the line marker, but there is

PHPlot Advanced Topics
81
an additional factor of 4 applied by PHPlot. This leaves enough room to draw a line segment that can be identifiedvisually by color and width.
4.7.7. Tuning LabelsThese variables affect the appearance of labels.
data_value_label_angleThis sets the angle, in degrees, for the position of data value labels near the data points they label. Together withdata_value_label_distance, it determines the position of the reference point for the label. (This doesnot apply to data value labels for bars or stackedbars plots, as the label position is fixed for these plot types.)The default is 90 degrees, which places the label above the data point. PHPlot automatically selects which textalignment to use, based on the angle. For example, with the default 90 degree angle, the label will be horizontallycentered, vertically bottom aligned. If the angle is 0 degrees, the alignment is horizontally left, vertically centered.
data_value_label_distanceThis sets the distance, in pixels, for the position of data value labels near the data points they label. Together withdata_value_label_angle, it determines the position of the reference point for the label. (This does notapply to data value labels for bars or stackedbars plots, as the label position is fixed for these plot types.) Thedefault is 5 pixels.
4.7.8. Miscellaneous TuningThese variables affect other aspects of the appearance of a plot.
grid_at_foregroundControls the order in which certain plot elements are drawn. The default is FALSE, meaning the X axis, Y axis,and grid lines are drawn before the main part of the plot. If TRUE, the X axis, Y axis, and grid lines are drawnafter the main part of the plot, which results in the grid lines overlaying the plotted data.
locale_overrideSet this to TRUE (or any non-empty value) to prevent PHPlot from loading information about the locale fromthe operating system. You must do this if you want to override the locale using setlocale() from yourPHP code, perhaps because your platform does not allow setting the locale from environment variables. SeeSetNumberFormat for more information.
safe_marginThis is the amount of space that PHPlot leaves between elements that should not touch. The default is 5 pixels.Changing this is not recommended. The effect is similar to changing the cellpadding on an HTML table.
4.8. Multiple Plots Per Image
This section contains information about producing more than one plot on an image.
Using PHPlot, you can produce more than one plot on a single image. These can be tiled plots - separate plots manuallypositioned within the image, or overlay plots. Tiled plots are used when you want to display more than one plot on asingle image, for example side-by-side. Overlay plots are used when you want to show more than one type or range ofdata representation on a single plot. For example, an overlay plot could be used to show two data sets with differentY scales, or to overlay a bar chart with a line plot. You can also combine tiled and overlay plots in a single image.
An example of two tiled plots on an image can be found in Section 5.18, “Example - Two Plots on One Image”. Anexample of an overlay plot can be found in Section 5.34, “Example - Overlaying Plots”

PHPlot Advanced Topics
82
4.8.1. Overview of Multiple PlotsWhen producing multiple plots on an image, a single PHPlot object is used. The overall steps to be followed are:
1. Create a PHPlot or PHPlot_truecolor object (referred to here as $plot).
2. Use $plot->SetPrintImage(False) to disable automatic output of the image after a plot is created.
3. Prepare the first plot, including setting the data array, plot type, and any other applicable settings.
4. Use $plot->DrawGraph() when complete. This creates the plot, but does not produce any output.
5. Repeat the previous two steps to prepare each additional plot, completing it with $plot->DrawGraph().
6. When all the plots are complete, use $plot->PrintImage() to output the completed image.
The sections which follow contain additional information you will need to produce multiple plots on a single image.
4.8.2. Plot Settings with Multiple PlotsIn general, PHPlot applies settings made for one plot as defaults for the next plot, when using the same PHPlot classinstance. There are some special cases, however, which are discussed in the sections below.
4.8.2.1. Global Settings
Certain plot elements apply to the image as a whole, not to individual plots. PHPlot will draw these at most once perimage. (That is, the element will be drawn only the first time DrawGraph() is called after the element has beenset up.)
• Main title (SetTitle)
• Image background color (SetBackgroundColor) or image background file (SetBgImage)
• Image border (SetImageBorderColor and SetImageBorderType)
For example, the first plot on an image that has a main title will result in the main title being drawn. If any subsequentplot (using the same PHPlot instance) also sets a main title, that will be ignored.
4.8.2.2. Data Scaling
Whether you use SetPlotAreaWorld to set the plot area data range, or you let PHPlot calculate the plot area data range,that range applies to all subsequent plots unless overridden. Even if you set a new data array, the calculated or pre-setdata range from the previous plot applies. Without being told otherwise, PHPlot will not re-examine the data array torecalculate the data range. This allows you to re-use an automatically calculated data range, if you want.
Note
Nothing related to world coordinates and data scaling applies to pie charts, which have do not use worldcoordinates.
If instead you want PHPlot to automatically calculate the data range for additional plots, callSetPlotAreaWorld() (with no arguments), or SetPlotAreaWorld(NULL, NULL, NULL, NULL). Eitherof these forms causes PHPlot to forget about a specified or calculated data range, and it will compute a new range.
Of course, you can also use SetPlotAreaWorld with parameter values, to manually set all or part of the data rangefor each plot. Any parameters you do not set (or specify as NULL) will be calculated based on the data array for the

PHPlot Advanced Topics
83
current plot. That is, PHPlot will forget about the previous data range once you call SetPlotAreaWorld, regardless ofhow many non-NULL parameters you use.
When overlaying plots, you will often want all the plots to use the same data scale, so the values can be read off of theaxis. Another option is to have two separate Y scales, with one represented on the left side and one on the right side.(See Section 5.34, “Example - Overlaying Plots” for an example of overlaying plots with two different Y scales.) Insome cases it may make sense to overlay plots with different scales and no separate axis, for example when using datavalue labels, or when the important information is the trend or shape shown by the graph rather than the actual values.
4.8.2.3. Plot Area
You can specify a plot area (window) with SetPlotAreaPixels or SetMarginsPixels, or you can let PHPlot calculate aplot area. Whether you set the plot area yourself, or you let PHPlot calculate it, those settings apply to all subsequentplots unless overridden.
This means that if you are doing side-by-side (tiled) plots on an image, you must use SetPlotAreaPixels orSetMarginsPixels with each plot, to set the area of the image to be used for that plot. Remember that the plot area doesnot include the axis labels, tick marks, or titles, so you must leave enough room between and around plots for these.
If you are doing overlay plots, you can let PHPlot calculate the plot area for the first plot, or you can specify the areawith SetPlotAreaPixels or SetMarginsPixels. You need not use these for subsequent plots; PHPlot will continue to usethe same window, overlaying the additional plots.
However, if you allow PHPlot to calculate the plot area, it will only use information in the first plot to determine themargins. This will not work well if subsequent plots require more margin space. For example, if the first plot has a Yaxis title and tick labels only on the left side, and the second overlay plot has a Y axis title and tick labels on the rightside, automatic plot area calculation will only leave enough margin space on the left side. As a result, the right side Yaxis title and tick labels may fall off the image edge. To avoid this, use either SetPlotAreaPixels or SetMarginsPixelsto specify large enough margins.
4.8.2.4. Tick Increment
Tick increments are recalculated for each plot, based on the data range, unless set with SetXTickIncrement orSetYTickIncrement. 'Data range' here refers to that set with SetPlotAreaWorld, or automatically calculated. This differsfrom the way PHPlot handles the data range, which is not recalculated by default after the first plot.
For overlay plots, if you want to use the same tick increments, you should either set the desired tick increment (doingthis for the first plot is sufficient), or make sure the data ranges match.
4.8.2.5. Grid Lines
PHPlot defaults to drawing the dependent variable grid (usually Y), and the grid lines will be drawn at tick positions.As stated above, the tick positions by default will be recalculated for each plot, using the calculated or explicitly setdata range.
For overlay plots, you generally do not want to have more than one set of grid lines in each of X and Y, or the resultswill be confusing. Even if your plot overlays have the same tick increments, avoid having the grid lines drawn morethan once. Otherwise, the grid lines for the second plot will overlay the plotted data from the first plot. You can turnoff the grid lines with SetDrawXGrid(False) and SetDrawYGrid(False).
4.8.2.6. Legend Positioning
Legend position with multiple plots works differently depending on whether the position is defaulted or set, and ifset what method was used.

PHPlot Advanced Topics
84
• If the legend position is defaulted, a legend will be drawn at the upper right corner of each plot. The same legendwill be drawn in each position, unless the contents are changed with SetLegend.
• If the legend position is specified using device coordinates with SetLegendPixels, or by using SetLegendPosition(PHPlot-5.4.0 or later) with mode 'image' or 'title', then the legend position is relative to the image. The legend willbe drawn at the specified position on the image, once per plot, at the same location. This repeated over-drawing isusually harmless, but if you want to have it drawn only once, either use SetLegend only before the last plot, or useeither SetLegend(NULL) or SetLegend(array()) to cancel the legend after the first plot.
• If the legend position is specified using world coordinates with SetLegendWorld, or by using SetLegendPosition(PHPlot-5.4.0 or later) with mode 'world' or 'plot', then the legend position is relative to the plot or the datawithin the plot. The legend will be drawn at the calculated position on each plot. If using SetLegendWorld, orSetLegendPosition with mode 'world', this assumes the specified world coordinates are within the plot area for eachplot. As with the default positioning case, the same legend will be drawn for each plot, unless the contents arechanged with SetLegend().
4.8.2.7. Plot Area Background
If you set a plot area background color with SetPlotBgColor and SetDrawPlotAreaBackground, or if you set a plotarea background image with SetPlotAreaBgImage, this will be applied to each plot until disabled. This works well forside-by-side (tiled) plots, as each will get the same background by default.
If you are overlaying multiple plots on an image, setting a plot area background color or image for one plot will resultin that background hiding previous plots. Therefore, you need to set up the background for the first plot, then turn it offit for the second plot. If you previously set a plot area background image, you can disable it for subsequent plots withSetPlotAreaBgImage(NULL). If you previously set and enabled a plot area background color, you can disableit for subsequent plots with SetDrawPlotAreaBackground(FALSE).
4.8.2.8. Axis Positioning
You can position the X and Y axis manually with SetXAxisPosition and SetYAxisPosition, or you can let PHPlotcalculate the axis positions for you. Whether you set the positions yourself, or let PHPlot calculate them for you, thosepositions apply to subsequent plots unless overridden. Even if you set a new data array, PHPlot will not recalculatethe axis positions unless told to.
If you want PHPlot to automatically re-calculate the X axis position for a subsequent plot, useSetXAxisPosition() (with no arguments), or SetXAxisPosition(''). To restore automatic Y axisposition calculation, use SetYAxisPosition() or SetYAxisPosition('').
4.8.3. Summary - Tiled Multiple PlotsHere are some guidelines for tiling multiple plots:
• Unless all plots will use the same X and Y data ranges, use SetPlotAreaWorld with each plot. Call the function withno arguments to have PHPlot automatically calculate the data range for the plot, or supply arguments to explicitlyset a data range.
• Use SetPlotAreaPixels to set the area within the image for each plot. Remember to leave room for axis labels andtitles.
• If you want a legend for each plot, use SetLegendPixels, SetLegendWorld, or SetLegendPosition to position it. Orlet the position default to the upper right corner of each plot. If instead you want a single legend, for example outsideall the plot areas, either set it up for the last plot, or set it up for any plot and cancel it for the next plot. Position thesingle legend with SetLegendPixels, or with SetLegendPosition using any mode except 'world'.

PHPlot Advanced Topics
85
• You can only have one main title for the entire image.
4.8.4. Summary - Overlay Multiple PlotsHere are some guidelines for overlaying multiple plots:
• All plots will use the same data scaling by default, whether automatically calculated by PHPlot or set withSetPlotAreaWorld. Use SetPlotAreaWorld if you want different data scaling for subsequent plots.
• You can let PHPlot calculate the plot window by default, but it will not account for additional margin space neededby plots after the first. Instead, you can use SetPlotAreaPixels or SetMarginsPixels to set a specific plot area touse for all plots.
• Set the tick increments you want for each plot, especially if the data ranges differ. You can have two sets of tickmarks and labels if you position them on the opposite sides of the plot area.
• Draw grid lines, if you want them, only for the first plot, and turn them off for the second plot.
• If you want a single legend, either set it up for the last plot, or set it up for any plot and cancel it for the next plot.If you want multiple legends, one per overlay, position them manually with SetLegendWorld, SetLegendPixels, orSetLegendPosition.
• If you want a plot area background, you must set it for the first plot and cancel it for the second plot, or it willhide the plots.
4.8.5. Multiple Plots - HistoryA number of fixes were made in PHPlot-5.3.1 that affect multiple plots per image. If you are creating multiple plotimages using PHPlot-5.3.0 or earlier, you should upgrade to the latest release. If you are unable to upgrade, you mayneed to work around the following issues:
• Color allocation: In PHPlot-5.2.0 and PHPlot-5.3.0, the data color array (whether defaulted or set withSetDataColors) was truncated to the number of colors required for a plot. This means that the additional colors werenot available for subsequent plots, so the data colors would repeat. For example, if plot #1 used 3 colors for 3 datasets, and plot #2 had 5 data sets, only 3 colors were available and the first two colors would be reused for the 4thand 5th data sets. To work around this, you can reload the data colors before each subsequent plot. To reload thedefault data colors, use $plot->SetDataColors(False). Another work-around is to define a custom datacolor callback, which turns off the color slot optimization.
• Legend positioning using SetLegendWorld was not correctly applied to subsequent plots in an image throughPHPlot-5.3.0. If you have multiple side-by-side plots and you want the legend in the same world coordinate positionin each plot, you still need to use SetLegendWorld(..., ...) when creating each plot.
• Through PHPlot-5.3.0, there was no way to reset the X axis position or Y axis position to the default of automaticpositioning. That is, SetXAxisPosition(), SetXAxisPosition(''), SetYAxisPosition(), andSetYAxisPosition('') did not work. There is no work-around to get automatic positioning of the axis lines.
• Through PHPlot-5.3.0, several functions had more restricted usage when resetting to defaults.
• Use SetLegendPixels(NULL, NULL) rather than SetLegendPixels().
• Use SetNumXTicks('') and SetNumYTicks('') rather than SetNumXTicks() andSetNumYTicks().
• Use SetLegend(array()) rather than SetLegend(NULL).

PHPlot Advanced Topics
86
4.9. Streaming Plots
This section contains information about producing streaming plots. The end of this section containsa complete example.
A script can use PHPlot to produce a series of plots that are streamed to a browser or other viewing application. Theresult is a movie, or video, consisting of a plot with changing data. This might be used to display real-time data, toreplay historical data, or for graphical display of any data where adding a time dimension improves the presentation.This feature was added in PHPlot-5.8.0.
This feature is intended for use when you want to update a plot one or more times per second. If instead you wanteach plot to be displayed for one or more seconds, consider using a refreshing page instead, for example using usinga "Refresh" meta-tag.
Warning
Producing streaming plots will place a significant load on your server. See Section 4.9.2, “Streaming Plots -Performance Considerations” below for more information.
PHPlot produces streaming plots using Motion JPEG [http://en.wikipedia.org/wiki/Motion_Jpeg] (M-JPEG),specifically Streaming M-JPEG over HTTP. This method (which is not a standard) sends a series of JPEG images,with appropriate MIME headers, in a stream to the browser or viewer. PHPlot produces each plot as usual, and sendsit out as part of the stream. Your script is responsible for changing the data (or other plot elements) between frames,and for the overall frame timing.
Browsers and viewers which have been found to be capable of displaying a Motion-JPEG Stream over HTTP includerecent versions of:
• Mozilla Firefox
• Mozilla Seamonkey
• VLC Media Player
Note: Microsoft Internet Explorer is not able to display these streams without an add-on. Google Chrome and AppleSafari are reported to be capable of displaying these streams, but they have not been tested with PHPlot.
Although only JPEG images are used in this section, the same method works in theory for other image types such asPNG, and PHPlot does not force the use of JPEG with streaming plots. Mozilla Firefox and Seamonkey have beenfound to be able to display "Motion-PNG" streams - a sequence of PNG images using the same MIME structure asMotion-JPEG. (VLC Media Player cannot display them.) Since plot images using JPEG compression are of poorerquality than PNG images, you might want to consider using another format such as PNG, however compatibility withviewers is a bigger issue than with JPEG.
4.9.1. Streaming Plots - Creating Moving PlotsThere are generally 3 parts to a script that produces streaming plots:
1. Creating a PHPlot object, and configuring your plot. This is the same as for single image plots.
2. You will need an incremental way to produce data for the plot. Typically, it will produce one new row of a PHPlotdata array for each plot frame.
3. Your script will have a loop that produces frames and includes frame timing. (If your data is produced at fixedintervals, your loop may not need any additional timing.) You may choose to produce a fixed number of frames (or

PHPlot Advanced Topics
87
equivalently, run for a fixed length of time), or run forever. The user can always end the stream by stopping theirbrowser or viewer, and the script will terminate on the server.
You will use these PHPlot functions to produce streaming plots, in addition to the functions used for static plots.
• Use SetPrintImage(False) to disable automatic printing from DrawGraph.
• Use SetFileFormat('jpg') to select JPEG format. This is the only format that is 'legal' with Motion-JPEG Streaming,although other formats work with some browsers.
• Call StartStream outside your main loop to begin the plot stream.
• Within your main loop, use SetDataValues to reload the data array after addition the new row(s). This is necessarybecause PHPlot creates a copy (rather than a reference) of your data.
• Use DrawGraph to produce the plot (but not output it).
• Still within your main loop, use PrintImageFrame to output the plot as a single frame within the plot stream.
• If your plot stream ends at some point (rather than running until stopped by the user), call EndStream to cleanlyend the plot stream.
Your PHP script should be referenced from an HTML page using an <img> tag, just like when creating a single plot.The MIME type returned by PHPlot (multipart/x-mixed-replace rather than image/jpeg for example)tells the browser or viewer to expect a stream rather than a single image.
Be aware that PHP is usually configured to time out scripts that run too long, and will terminate your streaming plotscript. To prevent this, use the PHP function set_time_limit($seconds). If you know the total number offrames and frame rate, you can set the timeout to a bit more than the total expected runtime. Alternatively, you cancall set_time_limit within your main loop, so it is called when each frame is produced. Because this functionresets the PHP timer, your script will not time out and can produce frames forever.
For frame timing, you can use the PHP functions microtime() and time_sleep_until(). Callmicrotime(TRUE) once, to get a precise timestamp as a floating point number. Then, within your main loop, usetime_sleep_until($timestamp) to put your script to sleep until the time to start of the next frame.
Note
Be sure your PHP script does not leak memory during the loop that produces frames, especially if the scriptis designed to runs until stopped (rather than producing a fixed number of frames). Appending to an arrayinside the loop is an example of something to avoid.
4.9.2. Streaming Plots - Performance ConsiderationsThis section discusses performance considerations for streaming plots, starting with some definitions.
Frame RateThe number of plots (frames) produced per second.
Frame TimeThe total time per frame, equal to the reciprocal of the frame rate.
Plot Time, Output Time, Idle TimeThese are the 3 parts of the Frame Time. The Plot Time is the time it takes to prepare your data for each frameand draw the plot graphics. The Output Time is the time to send the completed plot to the browser or viewer. Idletime is when your script is sleeping, waiting for the next frame's time interval.

PHPlot Advanced Topics
88
Frame Slippage, Missed FramesIf your script and processor cannot keep up with the plot stream requirements, the idle time will drop to zero.Frame slippage is when the frame time exceeds the desired goal, so the frame rate drops (but no frames are lost).A different approach is to enforce the frame time and drop frames to catch up, resulting in missed frames.
To produce a good plot stream, your script and server must be able to consistently produce and output frames at thedesired rate. The frame rate you want will depend on your data and application, while the rate you can achieve dependson the complexity of your script and your available processing power. Although typical video runs at between 24 and60 frames per second, those rates are likely too fast to be useful with plot data. A more realistic starting point forstreaming plots is 10 frames per second. This will provide the appearance of continuous motion of the graph(s), butwithout too much blurring of the data.
Here are some real performance numbers, using a relatively simple plot, and hardware that is old but was consideredhigh performance when introduced several year ago (circa 2007). With a PHPlot script producing 10 frames per second,the Apache server process was found to be using about 24% of one processor core's available CPU time. (Keep inmind that this is not a short-term load, but means 24% for the duration of the plot stream.) On the same hardware, 15frames per second used 35% CPU time, and 30 frames per second used 70% CPU time (of one core).
You can measure the performance of your script with a small change, if you are using a main loop like the one shownin the full example in the next section (repeated briefly here).
$timestamp = microtime(TRUE);$frame_time = 1 / $frame_rate;$slip = 0; // Number of slipped frames$frame = 0; // Current frame numberwhile(1) { $frame++; ... $plot->DrawGraph(); $plot->PrintImageFrame(); if (!@time_sleep_until($timestamp += $frame_time)) $slip++;}
The PHP function time_sleep_until() returns FALSE if the desired time already passed. (We use @ to suppressthe message which would be logged in that case.) The variable $slip counts the number of slipped frames. The ratioof $slip to $frame should be as low as possible, ideally zero. If ($slip/$frame) gets too high, you may need touse a lower frame rate, because either your frame rate is too high, your plot is too complex, or your server is too slowto keep up. However, optimizing your plot may help.
To optimize performance of your streaming plot, you should avoid these more expensive features:
• Plots that use area fills are slower. This especially includes pie charts with shading (because PHPlot redraws thefilled pie segments for each level of shading). Area plots and similar types have a lot of area fill. Bar charts havesome area fill, with shaded bar charts having more shading (but not nearly as much as shaded pie charts). The fastestplot types are line plots.
• TrueType fonts are slower than GD fonts. Consider using text in the HTML page containing the image reference,rather than in the image itself.
• Some operations on truecolor images are slow (for example, gamma adjustment or anti-aliasing) and should beavoided.
• Avoid using a background image, especially one which needs to be scaled.
• Avoid external factors that can affect performance. An obvious example is database access, since a database servercan take a variable amount of time to respond to a query.
PHPlot Advanced Topics
89
Note that PHPlot redraws the complete plot image for each frame, regardless of which functions are used inside oroutside your loop. For example, if you use SetTitle to set title text outside the frame loop, the same title will be drawninto each frame. If it is inside the loop, you can change the text for each frame. Either way, the time to draw the titlecounts for each frame. The same is true for legend, labels, etc. Although you should keep invariant PHPlot "Set...()"function calls outside your frame loop, this does not significantly affect the performance.
4.9.3. Streaming Plots - ExampleThis is a complete example that produces a streaming plot sequence showing sin() and cos(). The frame rate and runtime are set with variables at the top.
<?php# Example of Streaming Plots with PHPlot# This simply plots sin(x) and cos(x), updating at the rate given below.# Replace the function next_row() to plot something else.# This must run using a web server, not CLI.
require_once 'phplot.php';
# Configuration:# This is the fixed number of points along the X axis:$n_rows = 40;# Data range for Y:$max_y = 1;$min_y = -1;# Frames per second:$frame_rate = 10;# Total runtime in seconds. Use 0 to run 'forever':$run_for = 0;
# Derived:$run_forever = $run_for == 0;$frame_time = 1 / $frame_rate;$n_frames = $frame_rate * $run_for;
# Return the next data row (per PHPlot text-data data type):function next_row($x){ global $frame_rate; # Map 8 seconds of frames into 360 degrees (360/8 = 45 degrees/second) $theta = deg2rad(45 * $x / $frame_rate); return array('', sin($theta), cos($theta));}
# Create an initial data array with no values. New values will be# shifted in to the end. This is text-data format; the X values# are implicit and ignored (not plotted).for ($i = 0; $i < $n_rows; $i++) $data[$i] = array('', '', '');
# Create and configure the PHPlot object:$plot = new PHPlot(640, 480);$plot->SetDataType('text-data');$plot->SetPlotType('lines');$plot->SetFileFormat('jpg');$plot->SetXTickLabelPos('none');$plot->SetXTickPos('none');$plot->SetXDataLabelPos('none');# Don't draw the initial, empty values:

PHPlot Advanced Topics
90
$plot->SetDrawBrokenLines(True);# Force the Y range, or it will use the first frame to calculate:$plot->SetPlotAreaWorld(NULL, $min_y, NULL, $max_y);$plot->SetPrintImage(False);
# Main loop:$plot->StartStream();$timestamp = microtime(TRUE);for ($frame = 0; $run_forever || $frame < $n_frames; $frame++) { # Set PHP timeout so it won't terminate the script early. set_time_limit(60); # Discard the oldest data row, and shift in the new row: array_shift($data); $data[] = next_row($frame); # Set a plot title that includes the frame number: $plot->SetTitle(sprintf("Moving Plot Test (Frame %4d)", $frame)); # Reload the data array: $plot->SetDataValues($data); # Draw and output the plot: $plot->DrawGraph(); $plot->PrintImageFrame(); # Sleep until it is time to start the next frame: time_sleep_until($timestamp += $frame_time);}# End the stream:$plot->EndStream();
4.10. Image Maps for Plot Data
This section describes the use of the data_points callback to generate an HTML image map(or other similar construct) from plot data. An image map created using this callback will containlinks from the data points or shapes on the plot. This feature was first added in PHPlot-5.7.0 as anexperimental feature, and was first documented in this Reference Manual with PHPlot-6.0.0.
Note
Use of callbacks is documented in Section 4.4, “Callbacks”.
The data_points callback makes the device coordinates of plotted data available to a script using PHPlot. If ascript registers a function as a handler for the data_points callback name, the function will be called repeatedlywhen the plot is being generated. Each call will contain parameters describing the graphics for the corresponding datapoint. These parameters can be used to create an HTML image map.
This feature is most likely only useful when generating embedded image data with PHPlot. (See EncodeImage fordetails on embedded image data.) This is because HTML requires the image map be included in the HTML page whichcontains the reference to the plot image. The browser will first request the HTML page, then make a second requestfor the image. Normally, the image is generated by a script using PHPlot, but the image map has to be available beforethis script runs. Using embedded image data allows a single PHP script to produce both the image map and the imagedata, and return the result as a single page.
Nevertheless, it is also possible to create an image map with a non-embedded image. See Section 4.10.4, “Image Mapswith Non-embedded Image Data” for details.
The data_points callback works with the following plot types:
• bars and stackedbars (both horizontal and vertical)
PHPlot Advanced Topics
91
• boxes
• bubbles
• ohlc, candlesticks, and candlesticks2
• pie
• points and linepoints (both standard and error bar plots)
No other plot type is supported. This includes lines, squared, and thinbarline, which do nothave well-defined areas which could map to data points, and area, squaredarea, stackedarea, andstackedsquaredarea for which this feature has not been implemented.
The rest of this section contains details on the callback, usage with each plot type, and additional information.
4.10.1. Image Maps - UsageTo register a callback function to handle data_points, use:
$plot->SetCallback('data_points', 'my_handler', $my_arg);
Where my_handler is the name of your function, $my_arg is an optional additional argument to pass to yourfunction.
The data_points callback function (my_handler() above) will be called with 5 fixed-purpose argumentsfollowed by variable arguments. The number and purpose of the variable arguments depends on the plot type. If yourhandler only needs to work with one specific plot type, you can declare these arguments in your function definition.
If your handler must handle multiple plot types, define your function without arguments and use func_get_arg()or func_get_args() to access the arguments. You can use the value of the 3rd argument, $shape, to determinethe number and usage of the variable arguments, since there is one specific function argument set for each value of$shape. See Section 4.10.2, “Image Maps - data_points Callback Parameter Summary” for more information.
Here are the fixed arguments to the data_points callback function, with this general declaration:
function my_handler($img, $passthru, $shape, $row, $column, ...)
$imgThe image resource (standard for all callbacks). Not generally used with a data_points callback, which cannotsafely draw on the image (since PHPlot is in the middle of drawing the plot on the same image).
$passthruPass-through argument, supplied in the SetCallback() call (standard for all callbacks, referred to above as$my_arg). You can use this however you want, or ignore it.
$shapeA word describing the shape of the area being described. This does not necessarily correspond to an HTML imagemap <area> shape. Each plot type passes a specific shape value, and the shape value defines the usage of thevariable arguments.
$rowThe number of the data row being plotted. This typically corresponds to the ordinal of the X axis values (Y forhorizontal plots), starting with 0 for the first point, 1 for the second point, etc.

PHPlot Advanced Topics
92
$columnThe column, or data set index, starting with 0 for the first data set. This indicates which Y value for a given X,for example, or which bar within a bar group, or segment within a stacked bar. (For horizontal plots, this wouldindicate which X for a given Y.) Always 0 for pie charts and OHLC plots, which only have a single data set.
For the variable arguments, refer to the sections below which describe each plot type.
4.10.1.1. Image Maps from Bars and Stackedbars Plots
With plot types bars and stackedbars, an image map can be produced which indicates the area of each bar or stackedbar segment. This works with both vertical and horizontal plots.
For bar and stackedbar plots, the data_points callback has this form:
function my_handler($img, $passthru, $shape, $row, $column, $x1, $y1, $x2, $y2)
The first 2 arguments are standard for all PHPlot callbacks and are not described here. The next 3 arguments arecommon to all data_points callbacks, and there are 4 additional arguments:
$shapeAlways rect, indicating a rectangle shape.
$rowThis is the bar group index. The left-most bar group (for vertical bar charts) is row 0.
$columnThis is the bar index within a group. For vertical plot type 'bars', index 0 is the left-most in the group. For verticalplot type 'stackedbars', index 0 is the bar segment closest to the X axis.
$x1, $y1Device coordinates of the upper left corner of a bar or segment.
$x2, $y2Device coordinates of the lower right corner of a bar or segment.
Generating an image map for bar and stackedbar plots is straight-forward. The provided $shape and coordinates arecompatible with HTML <area> markup. You must provide the URL, alternate text, and optionally a title (tooltip text).
This example appends the image map line to a string. sprintf() is used to convert the coordinates to integers for cleanerHTML.
$coords = sprintf("%d,%d,%d,%d", $x1, $y1, $x2, $y2);$image_map .= " <area shape=\"rect\" coords=\"$coords\"" .. " title=\"$title_text\" alt=\"$alt_text\" href=\"$url\">\n";
The $url, $title_text, and $alt_text would typically depend on the passed $row and $column.
Refer to Section 5.44, “Example - Image Map from Bar Chart” for a complete example of an image map for a bar chart.
4.10.1.2. Image Maps from Box Plots
With plot type boxes, an image map can be produced which indicates the area of each data point. This area is thebounding box which includes the box and both whiskers. The bounding box does not include any outliers.
For box plots, the data_points callback has this form:
PHPlot Advanced Topics
93
function my_handler($img, $passthru, $shape, $row, $column, $x1, $y1, $x2, $y2)
The first 2 arguments are standard for all PHPlot callbacks and are not described here. The next 3 arguments arecommon to all data_points callbacks, and there are 4 additional arguments:
$shapeAlways rect, indicating a rectangle shape.
$rowThe index of the data row, starting with 0 for the first X value.
$columnThis is unused, and always 0.
$x1, $y1Device coordinates of the upper left corner.
$x2, $y2Device coordinates of the lower right corner.
The upper left and lower right coordinates above refer to the bounding box as described above.
Generating an image map for box plots is straight-forward. The provided $shape and coordinates are compatiblewith HTML <area> markup. You must provide the URL, alternate text, and optionally a title (tooltip text).
This example appends the image map line to a string. sprintf() is used to convert the coordinates to integers for cleanerHTML.
$coords = sprintf("%d,%d,%d,%d", $x1, $y1, $x2, $y2);$image_map .= " <area shape=\"rect\" coords=\"$coords\"" .. " title=\"$title_text\" alt=\"$alt_text\" href=\"$url\">\n";
The $url, $title_text, and $alt_text would typically depend on the passed $row.
Section 5.44, “Example - Image Map from Bar Chart” contains a complete example of an image map for a bar chart,and the parameters and usage for box plots are the same except that the $col (column) parameter is always 0, sincethere is only one data set.
4.10.1.3. Image Maps from Bubbles Plots
With plot type bubbles, an image map can be produced which indicates the area of each bubble.
For bubbles plots, the data_points callback has this form:
function my_handler($img, $passthru, $shape, $row, $column, $x, $y, $diam)
The first 2 arguments are standard for all PHPlot callbacks and are not described here. The next 3 arguments arecommon to all data_points callbacks, and there are 3 additional arguments:
$shapeAlways circle, indicating a disk shape.
$rowThe row is the index for the independent variable X. The first X value has index 0.

PHPlot Advanced Topics
94
$columnThe column is the index for the dependent variable Y. For the first (or only) dataset for each X, the column indexis 0.
$x, $yDevice coordinates of the center of the bubble.
$diamDiameter of the bubble, in pixels.
Generating an image map for bubble plots is straight-forward. PHPlot provides parameters that are compatible withHTML image map markup, except that PHPlot provides a diameter, and HTML requires the radius.
Here is an example of generating one area in an image map from a bubbles plot. You must provide the URL, alternatetext, and optionally a title (tooltip text). This appends the image map line to a string. sprintf() is used to convert thecoordinates to integers for cleaner HTML.
$coords = sprintf("%d,%d,%d", $x, $y, $diam / 2);$image_map .= " <area shape=\"circle\" coords=\"$coords\"" . " title=\"$title_text\" alt=\"$alt_text\" href=\"$url\">\n";
The $url, $title_text, and $alt_text would typically depend on the passed $row and $column.
Other than the above code, a script to generate an image map for a bubbles plot would be similar to Section 5.44,“Example - Image Map from Bar Chart”, which produces a bar chart.
4.10.1.4. Image Maps from Financial OHLC Plots
With plot types ohlc, candlesticks, and candlesticks2 (collectively called OHLC - open, high, low, close plots), animage map can be produced which indicates the area of each data point. For candlesticks and candlesticks2 plots, thisarea is the bounding box containing the candlestick and its wicks. For ohlc plots, this area is the bounding box formedby the vertical line and horizontal ticks.
For OHLC plots, the data_points callback has this form:
function my_handler($img, $passthru, $shape, $row, $column, $x1, $y1, $x2, $y2)
The first 2 arguments are standard for all PHPlot callbacks and are not described here. The next 3 arguments arecommon to all data_points callbacks, and there are 4 additional arguments:
$shapeAlways rect, indicating a rectangle shape.
$rowThe index of the data row, starting with 0 for the first X value.
$columnThis is unused, and always 0.
$x1, $y1Device coordinates of the upper left corner.
$x2, $y2Device coordinates of the lower right corner.

PHPlot Advanced Topics
95
The upper left and lower right coordinates above refer to the bounding box as described above.
Generating an image map for OHLC plots is straight-forward. The provided $shape and coordinates are compatiblewith HTML <area> markup. You must provide the URL, alternate text, and optionally a title (tooltip text).
This example appends the image map line to a string. sprintf() is used to convert the coordinates to integers for cleanerHTML.
$coords = sprintf("%d,%d,%d,%d", $x1, $y1, $x2, $y2);$image_map .= " <area shape=\"rect\" coords=\"$coords\"" .. " title=\"$title_text\" alt=\"$alt_text\" href=\"$url\">\n";
The $url, $title_text, and $alt_text would typically depend on the passed $row.
Section 5.44, “Example - Image Map from Bar Chart” contains a complete example of an image map for a bar chart,and the parameters and usage for OHLC plots are the same except that the $col (column) parameter is always 0, sincethere is only one data set.
4.10.1.5. Image Maps from Pie Plots
With plot type pie, an image map can be produced which indicates the area of each pie segment. However, PHPlotonly supplies the values which identify the outline of the pie segment, and HTML maps do not support areas of thisshape. Therefore, the callback handler function needs to generate one or more polygons which approximate the piesegment area.
Note
PHPlot does not attempt to draw pie segments that are too small (due to the implementation of the PHP/GDdrawing function). If a segment's calculated start angle and end angle are equal (after converting to integers),the segment will not be drawn, and the data_points callback will not be called for that segment.
For pie charts, the data_points callback has this form:
function my_handler($img, $passthru, $shape, $row, $column, $x, $y, $pie_width, $pie_height, $start_angle, $end_angle)
The first 2 arguments are standard for all PHPlot callbacks and are not described here. The next 3 arguments arecommon to all data_points callbacks, and there are 6 additional arguments:
$shapeAlways pie, indicating a pie segment of an ellipse.
$rowThe pie segment index, starting at 0 for the first segment. (By default, segments are drawn counter-clockwisefrom 0 degrees, but this can be changed.)
$columnThis is unused, and always 0.
$x, $yDevice coordinates of the center of the pie.
$pie_widthHorizontal diameter of the pie, in pixels.

PHPlot Advanced Topics
96
$pie_heightVertical diameter of the pie, in pixels.
$start_angleStarting angle for the segment, in clockwise degrees (see note).
$end_angleEnding angle for the segment, in clockwise degrees.
Note
clockwise degrees means (360 - A), where A is an angle measured in the conventional sense: counter-clockwise from the X axis. For example, a pie segment that starts at the top of the pie ('North') and ends atthe bottom point ('South') would have start_angle=270 and end_angle=90. The start_angle is always greaterthan the end angle.
Generating an image map for pie charts is more involved than with other plot types. Each pie segment is defined by theellipse center point, the two diameter values, and the start and end angles. Due to the PHP/GD implementation, PHPlotuses clockwise angles (360-A), so the start_angle is greater than the end_angle, and the segment is drawn clockwisefrom the end_angle to the start_angle.
HTML image maps do not support ellipse section shapes directly. Therefore, the callback function has to approximatethe area using one or more polygons.
The method shown in the example linked below approximates the pie segment area using a polygon with one pointat the pie center, one point at each end of the arc, and zero or more points along the arc , such that the maximumseparation of points along the circumference is no more than 20 degrees. This has been found to produce a good fitfor image maps. More details on the method can be found in the example.
Once you have your points (converted to integers, in an array $points with X and Y values alternating), you cangenerate a line in the image map as follows. This example appends the image map line to a string.
$coords = implode(',', $points);$image_map .= " <area shape=\"poly\" coords=\"$coords\"" . " title=\"$title_text\" alt=\"$alt_text\" href=\"$url\">\n";
The $url, $title_text, and $alt_text would typically depend on the passed $row.
Refer to Section 5.45, “Example - Image Map from Pie Chart” for a complete example of an image map for a pie chart.
4.10.1.6. Image Maps from Points and Linepoints Plots
With plot types points and linepoints, an image map can be produced which indicates the area around each point. Thelines in a linepoints plot are not part of the image map areas. This also works with error plots that use these plot types,however the error bars are not part of the image map areas.
For points and linepoints plots, the data_points callback has this form:
function my_handler($img, $passthru, $shape, $row, $column, $x, $y)
The first 2 arguments are standard for all PHPlot callbacks and are not described here. The next 3 arguments arecommon to all data_points callbacks, and there are 2 additional arguments:
$shapeAlways dot, indicating a single point.

PHPlot Advanced Topics
97
$rowThe row is the index for the independent variable X. The first X value has index 0.
$columnThe column is the index for the dependent variable Y. For the first (or only) dataset for each X, the column indexis 0.
$x, $yDevice coordinates of the center of the point marker.
Generating an image map for points and linepoints plots is straight-forward. PHPlot provides only the centercoordinates for each point marker. It does not indicate the shape or size of the marker, nor the coordinates of any linesegments or error bars. To generate an image map, you should use a fixed radius size and define the image map areasas circles with that radius centered around each data point. You need to choose a radius. A larger radius provides alarger clickable area, but the area of adjacent points may overlap.
Here is an example of generating one area in an image map from a points or linepoints plot. You must provide the URL,alternate text, and optionally a title (tooltip text). This appends the image map line to a string. sprintf() is used to convertthe coordinates to integers for cleaner HTML. This example uses a 20 pixel radius for the areas around each data point.
define('MAP_RADIUS', 20); // Capture area circle radii$coords = sprintf("%d,%d,%d", $x, $y, MAP_RADIUS);$image_map .= " <area shape=\"circle\" coords=\"$coords\"" . " title=\"$title_text\" alt=\"$alt_text\" href=\"$url\">\n";
The $url, $title_text, and $alt_text would typically depend on the passed $row and $column.
Other than the above code, a script to generate an image map for a points or linepoints plot would be similar toSection 5.44, “Example - Image Map from Bar Chart”, which produces a bar chart.
4.10.2. Image Maps - data_points Callback ParameterSummaryThe following table contains a summary of the data_points callback parameters for each supported plot type.
Plot Type(s) Callback Parameters / Notes
$img, $passthru, $shape='rect', $row, $column, $x1, $y1, $x2, $y2bars, stackedbars
Image map area does not include shading.
$img, $passthru, $shape='rect', $row, 0, $x1, $y1, $x2, $y2boxes
Rectangle shape includes box and whiskers. It does not include any outliers.
$img, $passthru, $shape='circle', $row, $column, $x, $y, $diambubbles
x,y is center. Use diam/2 for radius in image map circle area.
$img, $passthru, $shape='rect', $row, 0, $x1, $y1, $x2, $y2candlesticks,candlesticks, ohlc Rectangle shape includes body, wicks, ticks of each candlestick or OHLC marker.
$img, $passthru, $shape='pie', $row, 0, $x, $y, $width, $height, $start_angle, $end_anglepie
Callback needs to fit a polygon to the ellipse segment.
$img, $passthru, $shape='dot', $row, $column, $x, $ypoints, linepoints
x,y is center. Supply a radius for image map circle areas. Image map area will cover the pointsonly, not lines.

PHPlot Advanced Topics
98
4.10.3. Image Maps - Implementation Notes andLimitationsSince most PHPlot scripts will not produce image maps, the burden of converting data points into a format for HTMLimage maps was left to the implementation in the callback function. This is why PHPlot passes the diameter values italready calculated (instead of radius values), and why pie chart segments must be interpolated by the callback function.
You can generate image maps for error plots (data types data-data-error and data-data-yx-error) with points andlinepoints plot types, but the image map areas will not include the error bars. For these plot types, the only thecoordinates of the data points are provided.
PHPlot does not provide the data values from the data array that go with the points. If you need these values, forexample in tooltips, your callback function needs to get them from the data array, using the $row and $column indexvalues. This may be complex for pie charts (for example, if you want tooltip text to show the percentage value of thepie segment). Section 5.45, “Example - Image Map from Pie Chart” shows access to data values for a pie chart inthe simple case of data type text-data-single. Section 5.46, “Example - Image Map and Non-embedded PlotImage” shows access to data values for a bar chart.
For OHLC plots (candlesticks, candlesticks2, and ohlc plot types), and for box plots, PHPlot does not provide thecallback with the coordinates of individual features (such as the candlestick body rather than the high point wick).PHPlot only provides the bounding box rectangle for the overall data point graphic.
The image map must be located in the same HTML file as the image reference. Although the HTML definition ofthe usemap attribute of the <img> tag seems to indicate that a URL to an external file containing the map may beused, this does not in fact work.
4.10.4. Image Maps with Non-embedded Image DataIt is also possible to generate an image map when the PHPlot script produces an image in the normal way (notembedded) and returns it to the browser as image data. But the script will need to run twice: once to generate the PHPlotimage, and once to generate the containing HTML page with the image map. (You can use two separate scripts instead,but this is not recommended, since both operations must create identical plots so the image map areas correspond tothe plot areas.)
In the following example, the script normally generates an HTML page. The page contains an image map, generatedwith PHPlot, and also a <img> image tag which points back to the same script to have it generate the plot image.When requesting the image, the script adds a parameter 'mode=plot' to the URL. This tells the second execution of thescript to generate the image data instead of the HTML page.
The obvious drawback to this method is that you are processing a complete plot twice each time a plot is needed. Thefirst time, only the image map is needed, and the plot itself is discarded. This is inefficient, especially if the plottingscript needs to query a database or perform extensive calculations.
Another concern is if the script queries a database, the data could change between the two uses of the script, resultingin an image map and plot which do not correlate.
The rest of this section contains selected, annotated code from Section 5.46, “Example - Image Map and Non-embeddedPlot Image”.
Start by checking for the mode parameter:
# Produce an image if the URL has mode=plot, and an HTML page otherwise:$do_html = empty($_GET['mode']) || $_GET['mode'] != 'plot';

PHPlot Advanced Topics
99
The callback handler is the same as the other imagemap examples, in that it appends to the global string $image_mapone line from the image map.
# Callback for 'data_points' : Generate 1 line in the image map.function store_map($im, $data, $shape, $row, $col, $x1, $y1, $x2, $y2){ ... }
The generate_html() function creates the containing HTML page. Only parts of the code are shown.
function generate_html(){ global $image_map;
Create a self-referencing URL with mode=plot parameter for the <img> tag:
# If the URL already has parameters, use & separator, else ?. $sep = empty($_SERVER['QUERY_STRING']) ? '?' : '&'; $url = htmlspecialchars($_SERVER['REQUEST_URI'] . $sep . 'mode=plot');
Now generate the HTML page. Include the image map using the global string $image_map, which our callbackfunction has built line-by-line as PHPlot produced the plot. Also include the reference to the plot image. This willresult in the browser making a second request to the script, this time with the mode=plot parameter.
echo <<<END<!DOCTYPE HTML PUBLIC "-//W3C//DTD HTML 4.01 Transitional//EN" "http://www.w3.org/TR/html4/loose.dtd"><html>...<map name="map1">$image_map</map>...<img src="$url" alt="Plot image" usemap="#map1">...</html>
END;}
This ends the generate_html() function.
In the main body of the script, create a PHPlot object and configure the plot as usual. Set the data_points callback.(You need only do this in the case of generating HTML, not the image case.) There are two other places where theoperation differs for the HTML or image generation, based on the $do_html flag: disabling automatic output withSetPrintImage, and calling the generate_html() function at the end.
$plot = new PHPlot(800, 600);if ($do_html) { // Do not output the image in this mode: $plot->SetPrintImage(False); // Set the callback for image map generation: $plot->SetCallback('data_points', 'store_map');}... // Set up the plot, data values, plot type, etc.// Output the image (in plot mode), or build the image map (in html mode):$plot->DrawGraph();
PHPlot Advanced Topics
100
if ($do_html) generate_html();
That's all. If $do_html is true, no image will be produced (due to SetPrintImage(False)), andgenerate_html() will be called. If $do_html is false, DrawGraph() will output the plot image, and the mapdata will be not be produced or output.

PHPlot Examples
101
Chapter 5. PHPlot ExamplesThis chapter contains examples of plots produced with PHPlot.
Each of the following PHPlot examples shows an image, followed by the PHP script which produced that image. Eachscript is self-contained (needing only PHPlot), so you can copy it from this manual and run it with PHP to produce theimage. Note that some of the scripts may require the latest version of PHPlot.
Note
The PHP CLI (command line interface), used to generate the examples here, never outputs HTTP headers. Soit isn't necessary to use SetIsInline to suppress headers when using the CLI. This is a useful method you canuse to debug and test your own PHPlot scripts without having to modify them for stand-alone use. Also, byusing the CLI instead of a web server and browser, you can more readily see any error messages. Run yourPHPlot scripts with the PHP CLI like this (using the ImageMagick [http://www.imagemagick.org/] displayprogram to view the results):
$ php myscript.php > output.png$ display output.png
ImageMagick is available for several operating systems. There are many other image viewers for Linux andLinux-like systems, including qiv and geeqie.
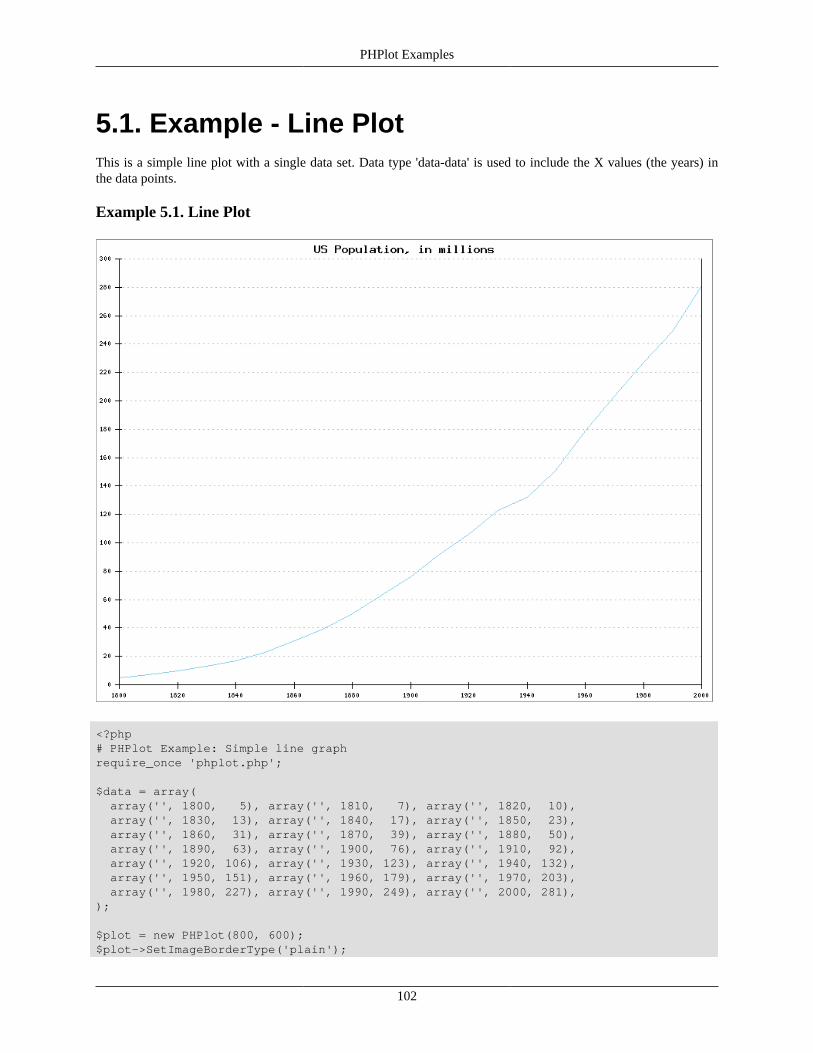
PHPlot Examples
102
5.1. Example - Line PlotThis is a simple line plot with a single data set. Data type 'data-data' is used to include the X values (the years) inthe data points.
Example 5.1. Line Plot
<?php# PHPlot Example: Simple line graphrequire_once 'phplot.php';
$data = array( array('', 1800, 5), array('', 1810, 7), array('', 1820, 10), array('', 1830, 13), array('', 1840, 17), array('', 1850, 23), array('', 1860, 31), array('', 1870, 39), array('', 1880, 50), array('', 1890, 63), array('', 1900, 76), array('', 1910, 92), array('', 1920, 106), array('', 1930, 123), array('', 1940, 132), array('', 1950, 151), array('', 1960, 179), array('', 1970, 203), array('', 1980, 227), array('', 1990, 249), array('', 2000, 281),);
$plot = new PHPlot(800, 600);$plot->SetImageBorderType('plain');

PHPlot Examples
103
$plot->SetPlotType('lines');$plot->SetDataType('data-data');$plot->SetDataValues($data);
# Main plot title:$plot->SetTitle('US Population, in millions');
# Make sure Y axis starts at 0:$plot->SetPlotAreaWorld(NULL, 0, NULL, NULL);
$plot->DrawGraph();
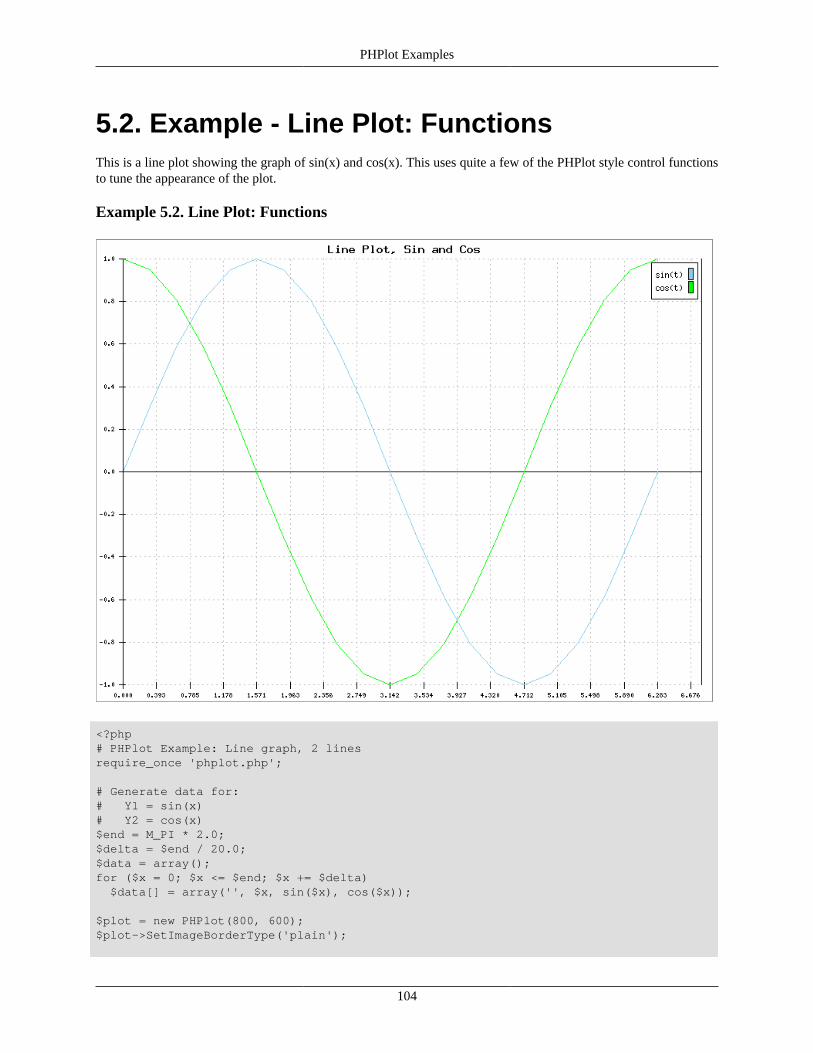
PHPlot Examples
104
5.2. Example - Line Plot: FunctionsThis is a line plot showing the graph of sin(x) and cos(x). This uses quite a few of the PHPlot style control functionsto tune the appearance of the plot.
Example 5.2. Line Plot: Functions
<?php# PHPlot Example: Line graph, 2 linesrequire_once 'phplot.php';
# Generate data for:# Y1 = sin(x)# Y2 = cos(x)$end = M_PI * 2.0;$delta = $end / 20.0;$data = array();for ($x = 0; $x <= $end; $x += $delta) $data[] = array('', $x, sin($x), cos($x));
$plot = new PHPlot(800, 600);$plot->SetImageBorderType('plain');

PHPlot Examples
105
$plot->SetPlotType('lines');$plot->SetDataType('data-data');$plot->SetDataValues($data);
# Main plot title:$plot->SetTitle('Line Plot, Sin and Cos');
# Make a legend for the 2 functions:$plot->SetLegend(array('sin(t)', 'cos(t)'));
# Select a plot area and force ticks to nice values:$plot->SetPlotAreaWorld(0, -1, 6.8, 1);
# Even though the data labels are empty, with numeric formatting they# will be output as zeros unless we turn them off:$plot->SetXDataLabelPos('none');
$plot->SetXTickIncrement(M_PI / 8.0);$plot->SetXLabelType('data');$plot->SetPrecisionX(3);
$plot->SetYTickIncrement(0.2);$plot->SetYLabelType('data');$plot->SetPrecisionY(1);
# Draw both grids:$plot->SetDrawXGrid(True);$plot->SetDrawYGrid(True);
$plot->DrawGraph();

PHPlot Examples
106
5.3. Example - Area PlotIn the area plot, PHPlot fills the area from each data set down to the next data set, or to the X axis for the last data set.For this example, the data was prepared such that the data sets are cumulative percentages. (See also Example 5.21,“Stacked Area Plot” which produces a similar plot using a different data representation.)
Example 5.3. Area Plot
<?php# PHPlot Example: Area chart, 6 areas.require_once 'phplot.php';
$data = array( array('1960', 100, 70, 60, 54, 16, 2), array('1970', 100, 80, 63, 54, 22, 20), array('1980', 100, 80, 66, 54, 27, 25), array('1990', 100, 95, 69, 54, 28, 10), array('2000', 100, 72, 72, 54, 38, 5),);
$plot = new PHPlot(800, 600);$plot->SetImageBorderType('plain');
PHPlot Examples
107
$plot->SetPlotType('area');$plot->SetDataType('text-data');$plot->SetDataValues($data);
# Main plot title:$plot->SetTitle('Candy Sales by Flavor');
# Set Y data limits, tick increment, and titles:$plot->SetPlotAreaWorld(NULL, 0, NULL, 100);$plot->SetYTickIncrement(10);$plot->SetYTitle('% of Total');$plot->SetXTitle('Year');
# Colors are significant to this data:$plot->SetDataColors(array('red', 'green', 'blue', 'yellow', 'cyan', 'magenta'));$plot->SetLegend(array('Cherry', 'Lime', 'Lemon', 'Banana', 'Apple', 'Berry'));
# Turn off X tick labels and ticks because they don't apply here:$plot->SetXTickLabelPos('none');$plot->SetXTickPos('none');
$plot->DrawGraph();

PHPlot Examples
108
5.4. Example - Bar ChartThis is a bar chart with three data sets plotted. The data type is 'text-data', so the X values are implicit. But the X valuesare not relevant because the data labels (month names) are used instead, and the X tick marks and labels are turnedoff. This plot uses the default shading of bars.
Example 5.4. Bar Chart
<?php# PHPlot Example: Bar chart, 3 data sets, shadedrequire_once 'phplot.php';
$data = array( array('Jan', 40, 2, 4), array('Feb', 30, 3, 4), array('Mar', 20, 4, 4), array('Apr', 10, 5, 4), array('May', 3, 6, 4), array('Jun', 7, 7, 4), array('Jul', 10, 8, 4), array('Aug', 15, 9, 4), array('Sep', 20, 5, 4), array('Oct', 18, 4, 4), array('Nov', 16, 7, 4), array('Dec', 14, 3, 4),);
$plot = new PHPlot(800, 600);$plot->SetImageBorderType('plain');
$plot->SetPlotType('bars');
PHPlot Examples
109
$plot->SetDataType('text-data');$plot->SetDataValues($data);
# Main plot title:$plot->SetTitle('Shaded Bar Chart with 3 Data Sets');
# Make a legend for the 3 data sets plotted:$plot->SetLegend(array('Engineering', 'Manufacturing', 'Administration'));
# Turn off X tick labels and ticks because they don't apply here:$plot->SetXTickLabelPos('none');$plot->SetXTickPos('none');
$plot->DrawGraph();

PHPlot Examples
110
5.5. Example - Unshaded Bar ChartThis is the same example as Example 5.4, “Bar Chart” except shading has been turned off. Instead we get flat rectangleswith borders for the bars.
Example 5.5. Bar Chart - Unshaded
<?php# PHPlot Example: Bar chart, 3 data sets, unshadedrequire_once 'phplot.php';
$data = array( array('Jan', 40, 2, 4), array('Feb', 30, 3, 4), array('Mar', 20, 4, 4), array('Apr', 10, 5, 4), array('May', 3, 6, 4), array('Jun', 7, 7, 4), array('Jul', 10, 8, 4), array('Aug', 15, 9, 4), array('Sep', 20, 5, 4), array('Oct', 18, 4, 4), array('Nov', 16, 7, 4), array('Dec', 14, 3, 4),);
$plot = new PHPlot(800, 600);$plot->SetImageBorderType('plain');
$plot->SetPlotType('bars');$plot->SetDataType('text-data');

PHPlot Examples
111
$plot->SetDataValues($data);
# Main plot title:$plot->SetTitle('Unshaded Bar Chart with 3 Data Sets');
# No 3-D shading of the bars:$plot->SetShading(0);
# Make a legend for the 3 data sets plotted:$plot->SetLegend(array('Engineering', 'Manufacturing', 'Administration'));
# Turn off X tick labels and ticks because they don't apply here:$plot->SetXTickLabelPos('none');$plot->SetXTickPos('none');
$plot->DrawGraph();

PHPlot Examples
112
5.6. Example - Bar Chart, Label OptionsThis is a bar chart showing data per year. Because the Y values are so large, we enable numeric formatting of Y ticklabels, with precision 0. This results in a comma separator between thousands. This example also shows how to forcethe Y tick marks to start at zero and use a nice whole number for the tick interval.
Example 5.6. Bar Chart - Label Options
<?php# PHPlot Example: Bar chart, annual datarequire_once 'phplot.php';
$data = array( array('1985', 340), array('1986', 682), array('1987', 1231), array('1988', 2069), array('1989', 3509), array('1990', 5283), array('1991', 7557), array('1992', 11033), array('1993', 16009), array('1994', 24134), array('1995', 33768), array('1996', 44043), array('1997', 55312), array('1998', 69209), array('1999', 86047), array('2000', 109478), array('2001', 128375), array('2002', 140767),);
$plot = new PHPlot(800, 600);$plot->SetImageBorderType('plain');
PHPlot Examples
113
$plot->SetPlotType('bars');$plot->SetDataType('text-data');$plot->SetDataValues($data);
# Let's use a new color for these bars:$plot->SetDataColors('magenta');
# Force bottom to Y=0 and set reasonable tick interval:$plot->SetPlotAreaWorld(NULL, 0, NULL, NULL);$plot->SetYTickIncrement(10000);# Format the Y tick labels as numerics to get thousands separators:$plot->SetYLabelType('data');$plot->SetPrecisionY(0);
# Main plot title:$plot->SetTitle('US Cell Phone Subscribership');# Y Axis title:$plot->SetYTitle('Thousands of Subscribers');
# Turn off X tick labels and ticks because they don't apply here:$plot->SetXTickLabelPos('none');$plot->SetXTickPos('none');
$plot->DrawGraph();
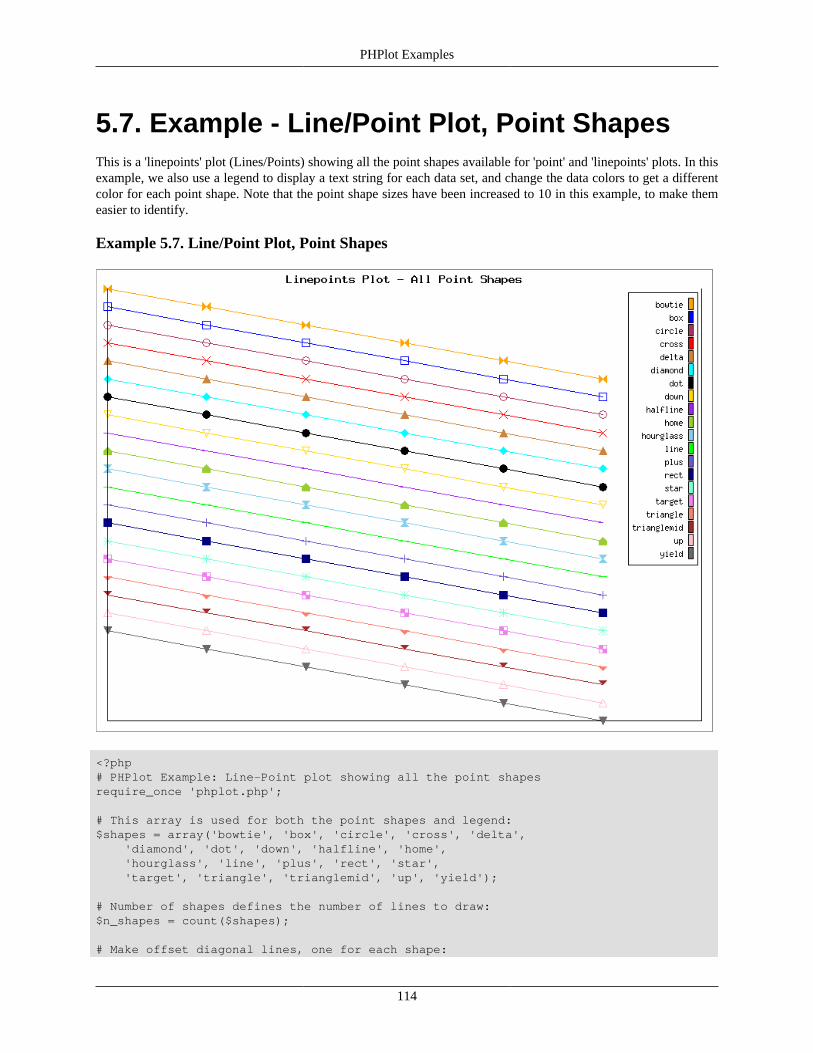
PHPlot Examples
114
5.7. Example - Line/Point Plot, Point ShapesThis is a 'linepoints' plot (Lines/Points) showing all the point shapes available for 'point' and 'linepoints' plots. In thisexample, we also use a legend to display a text string for each data set, and change the data colors to get a differentcolor for each point shape. Note that the point shape sizes have been increased to 10 in this example, to make themeasier to identify.
Example 5.7. Line/Point Plot, Point Shapes
<?php# PHPlot Example: Line-Point plot showing all the point shapesrequire_once 'phplot.php';
# This array is used for both the point shapes and legend:$shapes = array('bowtie', 'box', 'circle', 'cross', 'delta', 'diamond', 'dot', 'down', 'halfline', 'home', 'hourglass', 'line', 'plus', 'rect', 'star', 'target', 'triangle', 'trianglemid', 'up', 'yield');
# Number of shapes defines the number of lines to draw:$n_shapes = count($shapes);
# Make offset diagonal lines, one for each shape:
PHPlot Examples
115
$ppl = 6; # Number of points per line.$data = array();for ($i = 0; $i < $ppl; $i++) { $subdata = array('', $i); $offset = $n_shapes + $ppl - $i - 2; for ($j = 0; $j < $n_shapes; $j++) $subdata[] = $offset - $j; $data[] = $subdata;}
$plot = new PHPlot(800, 600);$plot->SetImageBorderType('plain');
$plot->SetPlotType('linepoints');$plot->SetDataType('data-data');$plot->SetDataValues($data);
# Main plot title:$plot->SetTitle('Linepoints Plot - All Point Shapes');
# Increase X range to make room for the legend.$plot->SetPlotAreaWorld(0, 0, $ppl, $n_shapes + $ppl - 2);# Turn off tick labels and ticks - not used for this plot.$plot->SetXTickLabelPos('none');$plot->SetXTickPos('none');$plot->SetYTickLabelPos('none');$plot->SetYTickPos('none');
# Need some different colors;$plot->SetDataColors(array('orange', 'blue', 'maroon', 'red', 'peru', 'cyan', 'black', 'gold', 'purple', 'YellowGreen', 'SkyBlue', 'green', 'SlateBlue', 'navy', 'aquamarine1', 'violet', 'salmon', 'brown', 'pink', 'DimGrey'));
# Show all shapes:$plot->SetPointShapes($shapes);
# Make the points bigger so we can see them:$plot->SetPointSizes(10);
# Make the lines all be solid:$plot->SetLineStyles('solid');
# Also show that as the legend:$plot->SetLegend($shapes);
# Draw no grids:$plot->SetDrawXGrid(False);$plot->SetDrawYGrid(False);
$plot->DrawGraph();

PHPlot Examples
116
5.8. Example - Pie Chart, text-data-singleThis is a pie chart with the data array type 'text-data-single'. This data type is only used with pie charts. Each recordin the data array simply contains a label (which is not used by PHPlot) and a segment size. In this example, we usethe label to identify the data for our own reference, and then build a legend from those data labels along with the datavalues. This is useful because by default PHPlot labels the segments with only the percentage values. (Starting withPHPlot-5.6.0, there are new options for labels. See Section 5.41, “Example - Pie Chart Label Types”.)
Example 5.8. Pie Chart, text-data-single
<?php# PHPlot Example: Pie/text-data-singlerequire_once 'phplot.php';
# The data labels aren't used directly by PHPlot. They are here for our# reference, and we copy them to the legend below.$data = array( array('Australia', 7849), array('Dem Rep Congo', 299), array('Canada', 5447), array('Columbia', 944), array('Ghana', 541), array('China', 3215),
PHPlot Examples
117
array('Philippines', 791), array('South Africa', 19454), array('Mexico', 311), array('United States', 9458), array('USSR', 9710),);
$plot = new PHPlot(800,600);$plot->SetImageBorderType('plain');
$plot->SetPlotType('pie');$plot->SetDataType('text-data-single');$plot->SetDataValues($data);
# Set enough different colors;$plot->SetDataColors(array('red', 'green', 'blue', 'yellow', 'cyan', 'magenta', 'brown', 'lavender', 'pink', 'gray', 'orange'));
# Main plot title:$plot->SetTitle("World Gold Production, 1990\n(1000s of Troy Ounces)");
# Build a legend from our data array.# Each call to SetLegend makes one line as "label: value".foreach ($data as $row) $plot->SetLegend(implode(': ', $row));# Place the legend in the upper left corner:$plot->SetLegendPixels(5, 5);
$plot->DrawGraph();

PHPlot Examples
118
5.9. Example - Pie Chart, text-dataThis is a simple pie chart showing the data type 'text-data'. When you use this data type with pie charts, the first entryin each record (a label) is ignored; the sum of all the second entries equals the relative size of the first segment, thesum of the third entries is the second segment, etc. So this pie has 4 segments, of relative size 250, 200, 350, and 200.
Data type 'data-data' is similar, except the first two entries in each record (label and X value for other plot types) isignored.
Example 5.9. Pie Chart, text-data
<?php# PHPlot Example: Pie/text-datarequire_once 'phplot.php';
$data = array( array('', 100, 100, 200, 100), array('', 150, 100, 150, 100),);
$plot = new PHPlot(800,600);$plot->SetImageBorderType('plain');$plot->SetDataType('text-data');
PHPlot Examples
119
$plot->SetDataValues($data);$plot->SetPlotType('pie');$plot->DrawGraph();

PHPlot Examples
120
5.10. Example - Pie Chart, flat with optionsFor this pie chart, we turned off shading with SetShading to get a flat pie instead of a 3-D look. We also overrodethe default colors with our own array using SetDataColors, and used the same color names to make a legend withSetLegend. Finally, we moved the labels in towards the center with SetLabelScalePosition.
Example 5.10. Pie Chart, flat with options
<?php# PHPlot Example: Flat Pie with optionsrequire_once 'phplot.php';
$data = array( array('', 10), array('', 20), array('', 30), array('', 35), array('', 5),);
$plot = new PHPlot(800,600);$plot->SetImageBorderType('plain');$plot->SetDataType('text-data-single');

PHPlot Examples
121
$plot->SetDataValues($data);$plot->SetPlotType('pie');
$colors = array('red', 'green', 'blue', 'yellow', 'cyan');$plot->SetDataColors($colors);$plot->SetLegend($colors);$plot->SetShading(0);$plot->SetLabelScalePosition(0.2);
$plot->DrawGraph();

PHPlot Examples
122
5.11. Example - Points Plot with Error BarsThis is a point plot with error bars (as indicated by data type 'data-data-error'). Each point is specified as X value, Yvalue, Y error in the positive direction, and Y error in the negative direction.
Example 5.11. Points Plot with Error Bars
<?php# PHPlot Example: Point chart with error barsrequire_once 'phplot.php';
$data = array( array('', 1, 23.5, 5, 5), array('', 2, 20.1, 3, 3), array('', 3, 19.1, 2, 2), array('', 4, 16.8, 3, 3), array('', 5, 18.4, 4, 6), array('', 6, 20.5, 3, 2), array('', 7, 23.2, 4, 4), array('', 8, 23.1, 5, 2), array('', 9, 24.5, 2, 2), array('', 10, 28.1, 2, 2),);
$plot = new PHPlot(800, 600);$plot->SetImageBorderType('plain');
$plot->SetPlotType('points');
PHPlot Examples
123
$plot->SetDataType('data-data-error');$plot->SetDataValues($data);
# Main plot title:$plot->SetTitle('Points Plot With Error Bars');
# Set data range and tick increments to get nice even numbers:$plot->SetPlotAreaWorld(0, 0, 11, 40);$plot->SetXTickIncrement(1);$plot->SetYTickIncrement(5);
# Draw both grids:$plot->SetDrawXGrid(True);$plot->SetDrawYGrid(True); # Is default
# Set some options for error bars:$plot->SetErrorBarShape('tee'); # Is default$plot->SetErrorBarSize(10);$plot->SetErrorBarLineWidth(2);
# Use a darker color for the plot:$plot->SetDataColors('brown');$plot->SetErrorBarColors('brown');
# Make the points bigger so we can see them:$plot->SetPointSizes(10);
$plot->DrawGraph();

PHPlot Examples
124
5.12. Example - Points Plot / ScatterplotThis is a rather contrived example of using a 'points' plot to make a scatterplot. The data array is a set of X/Y points.With 'points' plots, the data can be in any order and duplicate X values are allowed. The points here are generatedfrom R = 0.5 * Theta.
For this example, the X and Y axes and tick marks were moved to 0,0, labels turned off, and plot borders enabledfor all four sides.
Example 5.12. Points Plot / Scatterplot
<?php# PHPlot Example: Point plot - scatter plotrequire_once 'phplot.php';
$data = array();$a = 0.5;$d_theta = M_PI/48.0;for ($theta = M_PI * 7; $theta >= 0; $theta -= $d_theta) $data[] = array('', $a * $theta * cos($theta), $a * $theta * sin($theta));
$plot = new PHPlot(800, 600);$plot->SetImageBorderType('plain');
PHPlot Examples
125
$plot->SetPlotType('points');$plot->SetDataType('data-data');$plot->SetDataValues($data);
# Main plot title:$plot->SetTitle('Scatterplot (points plot)');
# Need to set area and ticks to get reasonable choices.$plot->SetPlotAreaWorld(-12, -12, 12, 12);$plot->SetXTickIncrement(2);$plot->SetYTickIncrement(2);
# Move axes and ticks to 0,0, but turn off tick labels:$plot->SetXAxisPosition(0); # Is default$plot->SetYAxisPosition(0);$plot->SetXTickPos('xaxis');$plot->SetXTickLabelPos('none');$plot->SetYTickPos('yaxis');$plot->SetYTickLabelPos('none');
# Turn on 4 sided borders, now that axes are inside:$plot->SetPlotBorderType('full');
# Draw both grids:$plot->SetDrawXGrid(True);$plot->SetDrawYGrid(True); # Is default
$plot->DrawGraph();

PHPlot Examples
126
5.13. Example - Squared PlotThis is a squared line plot, which is similar to a line plot but the points are connected with steps.
Example 5.13. Squared Plot
<?php# PHPlot Example: squared plotrequire_once 'phplot.php';
# To get repeatable results with 'random' data:mt_srand(1);
# Make some noisy data:$data = array();for ($i = 0; $i < 100; $i++) $data[] = array('', $i / 4.0 + 2.0 + mt_rand(-20, 20) / 10.0);
$plot = new PHPlot(800, 600);$plot->SetImageBorderType('plain');
$plot->SetPlotType('squared');$plot->SetDataType('text-data');

PHPlot Examples
127
$plot->SetDataValues($data);
$plot->SetTitle('Noisy Data (squared plot)');
# Make the lines a bit wider:$plot->SetLineWidths(2);
# Turn on the X grid (Y grid is on by default):$plot->SetDrawXGrid(True);
# Use exactly this data range:$plot->SetPlotAreaWorld(0, 0, 100, 40);
$plot->DrawGraph();

PHPlot Examples
128
5.14. Example - Stacked Bars, ShadedThis is a stacked bar chart, with the default 3-D shaded look. (Compare with Example 5.15, “Stacked Bars, Unshaded”which has no shading.) The only valid data types for stacked bars are 'text-data' (for vertical plots), and 'text-data-yx' (for horizontal plots).
Example 5.14. Stacked Bars, Shaded
<?php# PHPlot Example: Stacked Bars, shadedrequire_once 'phplot.php';
$data = array( array('Jan', 40, 5, 10, 3), array('Feb', 90, 8, 15, 4), array('Mar', 50, 6, 10, 4), array('Apr', 40, 3, 20, 4), array('May', 75, 2, 10, 5), array('Jun', 45, 6, 15, 5), array('Jul', 40, 5, 20, 6), array('Aug', 35, 6, 12, 6), array('Sep', 50, 5, 10, 7), array('Oct', 45, 6, 15, 8), array('Nov', 35, 6, 20, 9), array('Dec', 40, 7, 12, 9),);
$plot = new PHPlot(800, 600);$plot->SetImageBorderType('plain');

PHPlot Examples
129
$plot->SetPlotType('stackedbars');$plot->SetDataType('text-data');$plot->SetDataValues($data);
$plot->SetTitle('Candy Sales by Month and Product');$plot->SetYTitle('Millions of Units');$plot->SetLegend(array('Chocolates', 'Mints', 'Hard Candy', 'Sugar-Free'));
$plot->SetXTickLabelPos('none');$plot->SetXTickPos('none');
$plot->DrawGraph();

PHPlot Examples
130
5.15. Example - Stacked Bars, UnshadedThis is the same as Example 5.14, “Stacked Bars, Shaded” except we have turned off shading and now get flat stackedbars with borders. Also in this example we changed the legend using SetLegendReverse so the lines of text and colorboxes are in the same order as the stacked bar segments, bottom-to-top.
Example 5.15. Stacked Bars, Unshaded
<?php# PHPlot Example: Stacked Bars, unshadedrequire_once 'phplot.php';
$data = array( array('Jan', 40, 5, 10, 3), array('Feb', 90, 8, 15, 4), array('Mar', 50, 6, 10, 4), array('Apr', 40, 3, 20, 4), array('May', 75, 2, 10, 5), array('Jun', 45, 6, 15, 5), array('Jul', 40, 5, 20, 6), array('Aug', 35, 6, 12, 6), array('Sep', 50, 5, 10, 7), array('Oct', 45, 6, 15, 8), array('Nov', 35, 6, 20, 9), array('Dec', 40, 7, 12, 9),);
$plot = new PHPlot(800, 600);$plot->SetImageBorderType('plain');

PHPlot Examples
131
$plot->SetPlotType('stackedbars');$plot->SetDataType('text-data');$plot->SetDataValues($data);
$plot->SetTitle('Candy Sales by Month and Product');$plot->SetYTitle('Millions of Units');
# No shading:$plot->SetShading(0);
$plot->SetLegend(array('Chocolates', 'Mints', 'Hard Candy', 'Sugar-Free'));# Make legend lines go bottom to top, like the bar segments (PHPlot > 5.4.0)$plot->SetLegendReverse(True);
$plot->SetXTickLabelPos('none');$plot->SetXTickPos('none');
$plot->DrawGraph();

PHPlot Examples
132
5.16. Example - Thin Bar Line PlotThis is a Thin Bar Line Plot (thinbarline).
Example 5.16. Thin Bar Line
<?php# PHPlot Example: thinbarline plotrequire_once 'phplot.php';
# To get repeatable results with 'random' data:mt_srand(1);
# Make some noisy data:$data = array();for ($i = 0; $i < 100; $i++) $data[] = array('', $i / 4.0 + 2.0 + mt_rand(-20, 20) / 10.0);
$plot = new PHPlot(800, 600);$plot->SetImageBorderType('plain');
$plot->SetPlotType('thinbarline');$plot->SetDataType('text-data');
PHPlot Examples
133
$plot->SetDataValues($data);
# Main plot title:$plot->SetTitle('Noisy Data (thinbarline)');
$plot->DrawGraph();

PHPlot Examples
134
5.17. Example - Thin Bar Line Plot, Wider LinesThis is the same as the previous plot type (Example 5.16, “Thin Bar Line”) except the lines are wider. This now looksmore like a bar chart.
Example 5.17. Thin Bar Line Plot, Wider Lines
<?php# PHPlot Example: thinbarline plot, widerrequire_once 'phplot.php';
# To get repeatable results with 'random' data:mt_srand(1);
# Make some noisy data:$data = array();for ($i = 0; $i < 100; $i++) $data[] = array('', $i / 4.0 + 2.0 + mt_rand(-20, 20) / 10.0);
$plot = new PHPlot(800, 600);$plot->SetImageBorderType('plain');
$plot->SetPlotType('thinbarline');

PHPlot Examples
135
$plot->SetDataType('text-data');$plot->SetDataValues($data);
# Main plot title:$plot->SetTitle('Noisy Data (thinbarline, wider)');
# Make the lines wider:$plot->SetLineWidths(3);
$plot->DrawGraph();

PHPlot Examples
136
5.18. Example - Two Plots on One ImageThis example shows multiple plots tiled on a single image. To place multiple plots on an image, first disable automaticoutput with SetPrintImage(False). Then define each plot area using SetPlotAreaPixels and create the plot. Finish eachplot with DrawGraph. At the end, PrintImage outputs the image containing all of the plots.
See Section 4.8, “Multiple Plots Per Image” for more information.
Example 5.18. Two Plots on One Image
<?php# PHPlot Example: Two plots on one imagerequire_once 'phplot.php';
$data1 = array( # Data array for top plot: Imports array('1981', 5996), array('1982', 5113), array('1983', 5051), array('1984', 5437), array('1985', 5067), array('1986', 6224), array('1987', 6678), array('1988', 7402), array('1989', 8061), array('1990', 8018), array('1991', 7627), array('1992', 7888), array('1993', 8620), array('1994', 8996), array('1995', 8835), array('1996', 9478), array('1997', 10162), array('1998', 10708), array('1999', 10852), array('2000', 11459),);

PHPlot Examples
137
$data2 = array( # Data array for bottom plot: Exports array('1981', 595), array('1982', 815), array('1983', 739), array('1984', 722), array('1985', 781), array('1986', 785), array('1987', 764), array('1988', 815), array('1989', 859), array('1990', 857), array('1991', 1001), array('1992', 950), array('1993', 1003), array('1994', 942), array('1995', 949), array('1996', 981), array('1997', 1003), array('1998', 945), array('1999', 940), array('2000', 1040),);
$plot = new PHPlot(800,600);$plot->SetImageBorderType('plain');
# Disable auto-output:$plot->SetPrintImage(0);
# There is only one title: it is outside both plot areas.$plot->SetTitle('US Petroleum Import/Export');
# Set up area for first plot:$plot->SetPlotAreaPixels(80, 40, 740, 350);
# Do the first plot:$plot->SetDataType('text-data');$plot->SetDataValues($data1);$plot->SetPlotAreaWorld(NULL, 0, NULL, 13000);$plot->SetDataColors(array('blue'));$plot->SetXTickLabelPos('none');$plot->SetXTickPos('none');$plot->SetYTickIncrement(1000);$plot->SetYTitle("IMPORTS\n1000 barrels/day");
$plot->SetPlotType('bars');$plot->DrawGraph();
# Set up area for second plot:$plot->SetPlotAreaPixels(80, 400, 740, 550);
# Do the second plot:$plot->SetDataType('text-data');$plot->SetDataValues($data2);$plot->SetPlotAreaWorld(NULL, 0, NULL, 1300);$plot->SetDataColors(array('green'));$plot->SetXTickLabelPos('none');$plot->SetXTickPos('none');$plot->SetYTickIncrement(200);$plot->SetYTitle("EXPORTS\n1000 barrels/day");
$plot->SetPlotType('bars');$plot->DrawGraph();
# Output the image now:$plot->PrintImage();
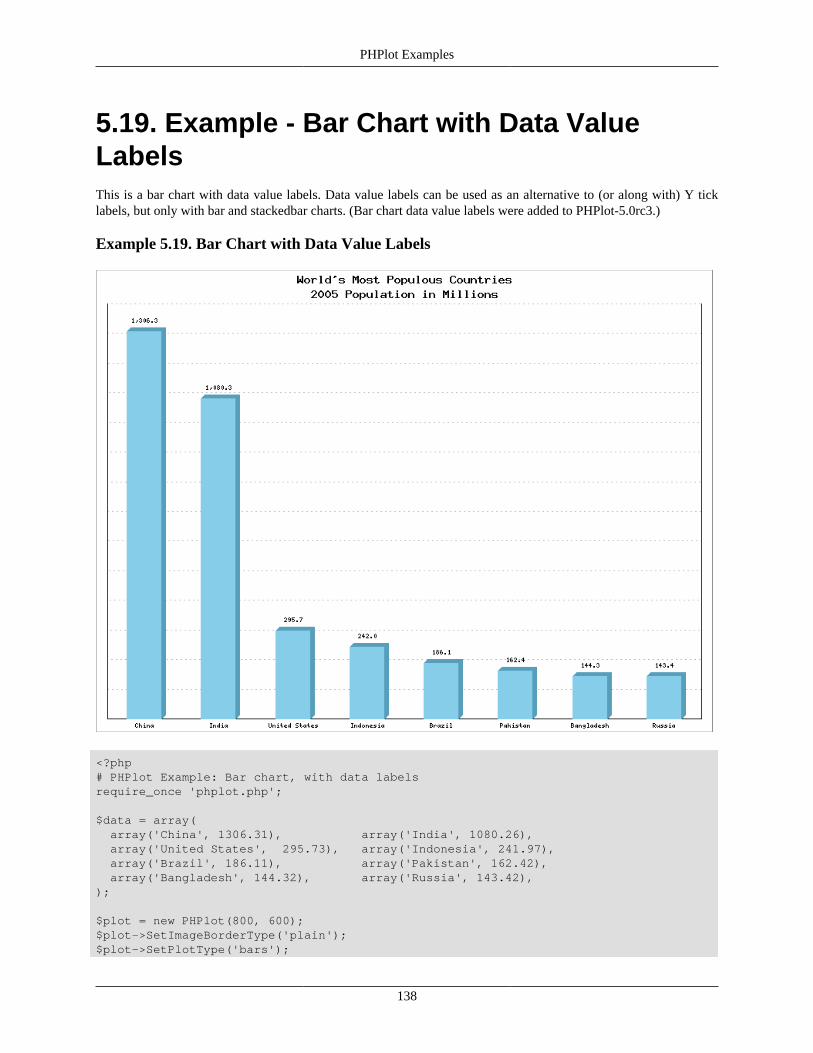
PHPlot Examples
138
5.19. Example - Bar Chart with Data ValueLabelsThis is a bar chart with data value labels. Data value labels can be used as an alternative to (or along with) Y ticklabels, but only with bar and stackedbar charts. (Bar chart data value labels were added to PHPlot-5.0rc3.)
Example 5.19. Bar Chart with Data Value Labels
<?php# PHPlot Example: Bar chart, with data labelsrequire_once 'phplot.php';
$data = array( array('China', 1306.31), array('India', 1080.26), array('United States', 295.73), array('Indonesia', 241.97), array('Brazil', 186.11), array('Pakistan', 162.42), array('Bangladesh', 144.32), array('Russia', 143.42),);
$plot = new PHPlot(800, 600);$plot->SetImageBorderType('plain');$plot->SetPlotType('bars');
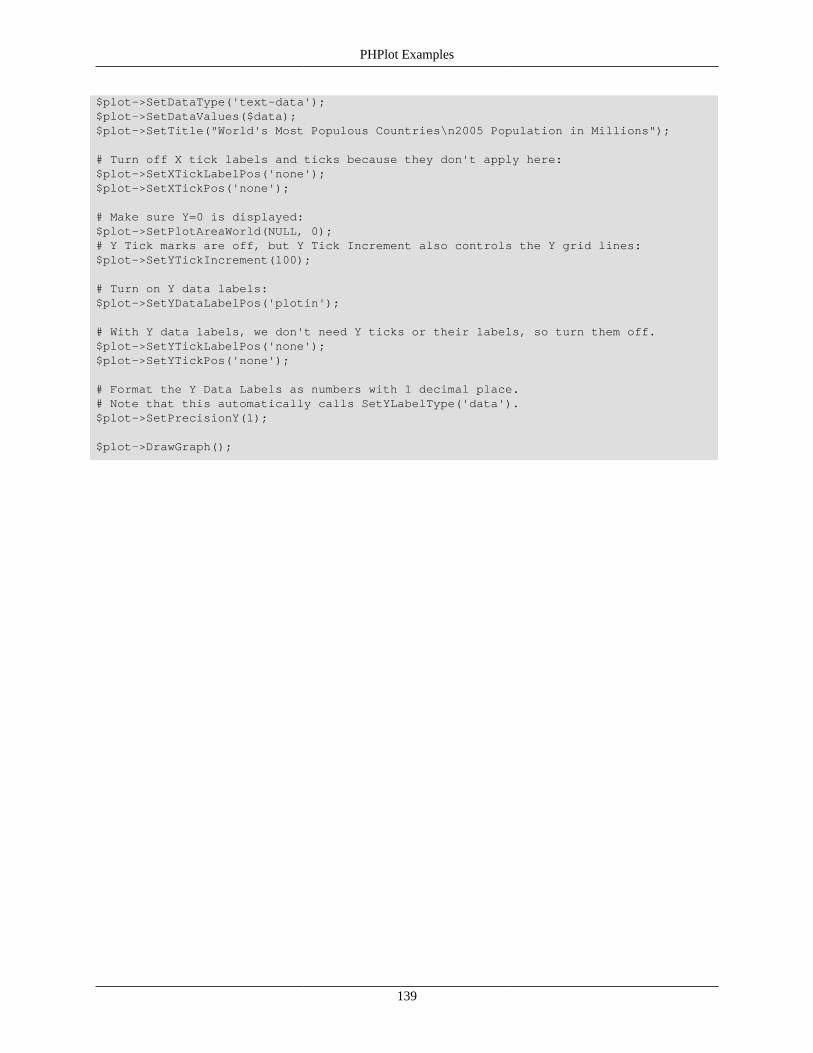
PHPlot Examples
139
$plot->SetDataType('text-data');$plot->SetDataValues($data);$plot->SetTitle("World's Most Populous Countries\n2005 Population in Millions");
# Turn off X tick labels and ticks because they don't apply here:$plot->SetXTickLabelPos('none');$plot->SetXTickPos('none');
# Make sure Y=0 is displayed:$plot->SetPlotAreaWorld(NULL, 0);# Y Tick marks are off, but Y Tick Increment also controls the Y grid lines:$plot->SetYTickIncrement(100);
# Turn on Y data labels:$plot->SetYDataLabelPos('plotin');
# With Y data labels, we don't need Y ticks or their labels, so turn them off.$plot->SetYTickLabelPos('none');$plot->SetYTickPos('none');
# Format the Y Data Labels as numbers with 1 decimal place.# Note that this automatically calls SetYLabelType('data').$plot->SetPrecisionY(1);
$plot->DrawGraph();
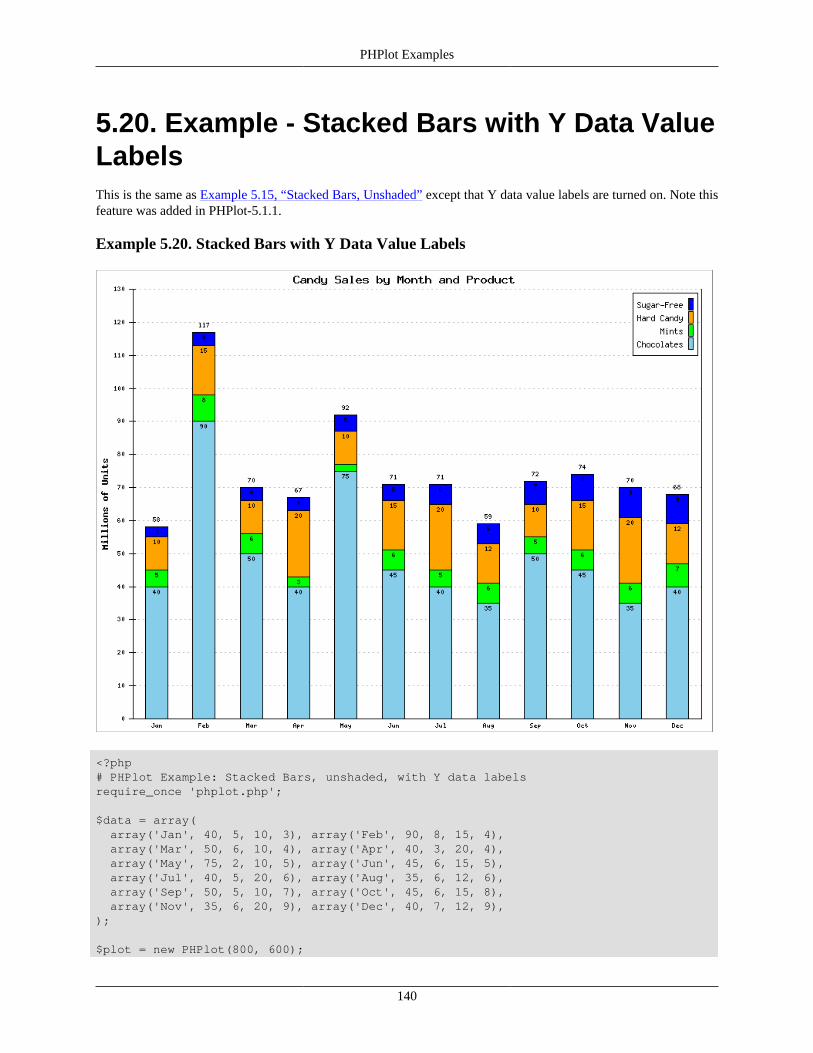
PHPlot Examples
140
5.20. Example - Stacked Bars with Y Data ValueLabelsThis is the same as Example 5.15, “Stacked Bars, Unshaded” except that Y data value labels are turned on. Note thisfeature was added in PHPlot-5.1.1.
Example 5.20. Stacked Bars with Y Data Value Labels
<?php# PHPlot Example: Stacked Bars, unshaded, with Y data labelsrequire_once 'phplot.php';
$data = array( array('Jan', 40, 5, 10, 3), array('Feb', 90, 8, 15, 4), array('Mar', 50, 6, 10, 4), array('Apr', 40, 3, 20, 4), array('May', 75, 2, 10, 5), array('Jun', 45, 6, 15, 5), array('Jul', 40, 5, 20, 6), array('Aug', 35, 6, 12, 6), array('Sep', 50, 5, 10, 7), array('Oct', 45, 6, 15, 8), array('Nov', 35, 6, 20, 9), array('Dec', 40, 7, 12, 9),);
$plot = new PHPlot(800, 600);
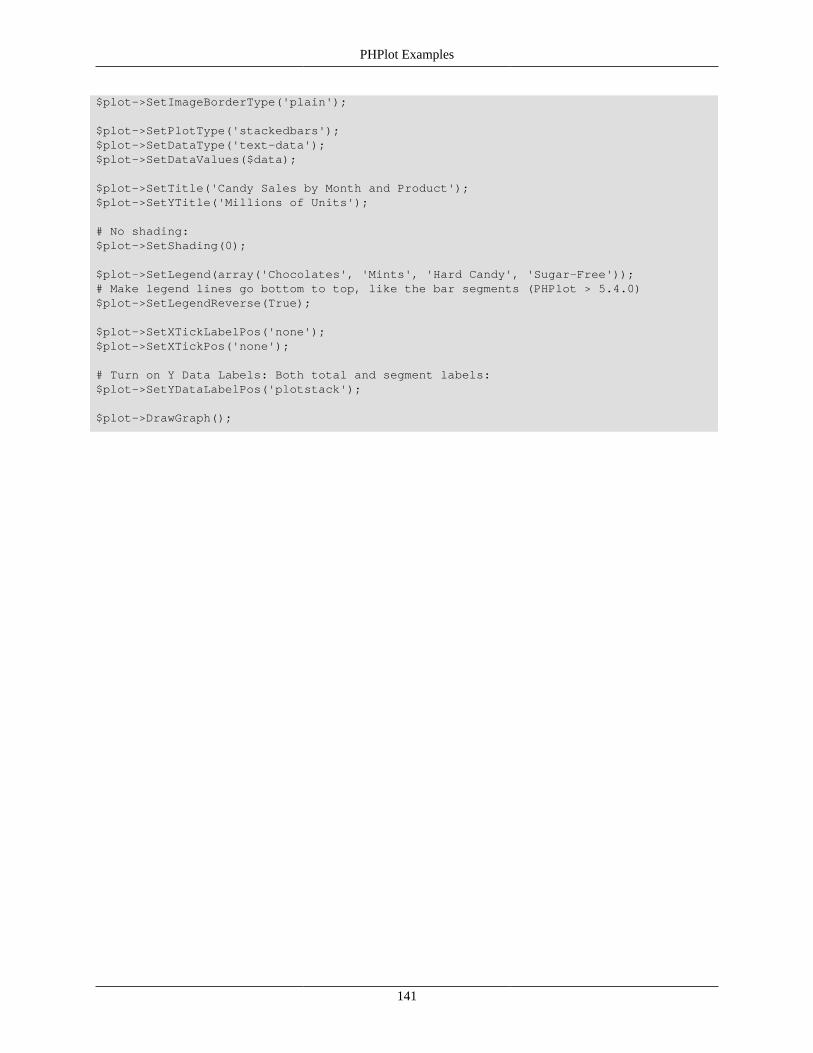
PHPlot Examples
141
$plot->SetImageBorderType('plain');
$plot->SetPlotType('stackedbars');$plot->SetDataType('text-data');$plot->SetDataValues($data);
$plot->SetTitle('Candy Sales by Month and Product');$plot->SetYTitle('Millions of Units');
# No shading:$plot->SetShading(0);
$plot->SetLegend(array('Chocolates', 'Mints', 'Hard Candy', 'Sugar-Free'));# Make legend lines go bottom to top, like the bar segments (PHPlot > 5.4.0)$plot->SetLegendReverse(True);
$plot->SetXTickLabelPos('none');$plot->SetXTickPos('none');
# Turn on Y Data Labels: Both total and segment labels:$plot->SetYDataLabelPos('plotstack');
$plot->DrawGraph();
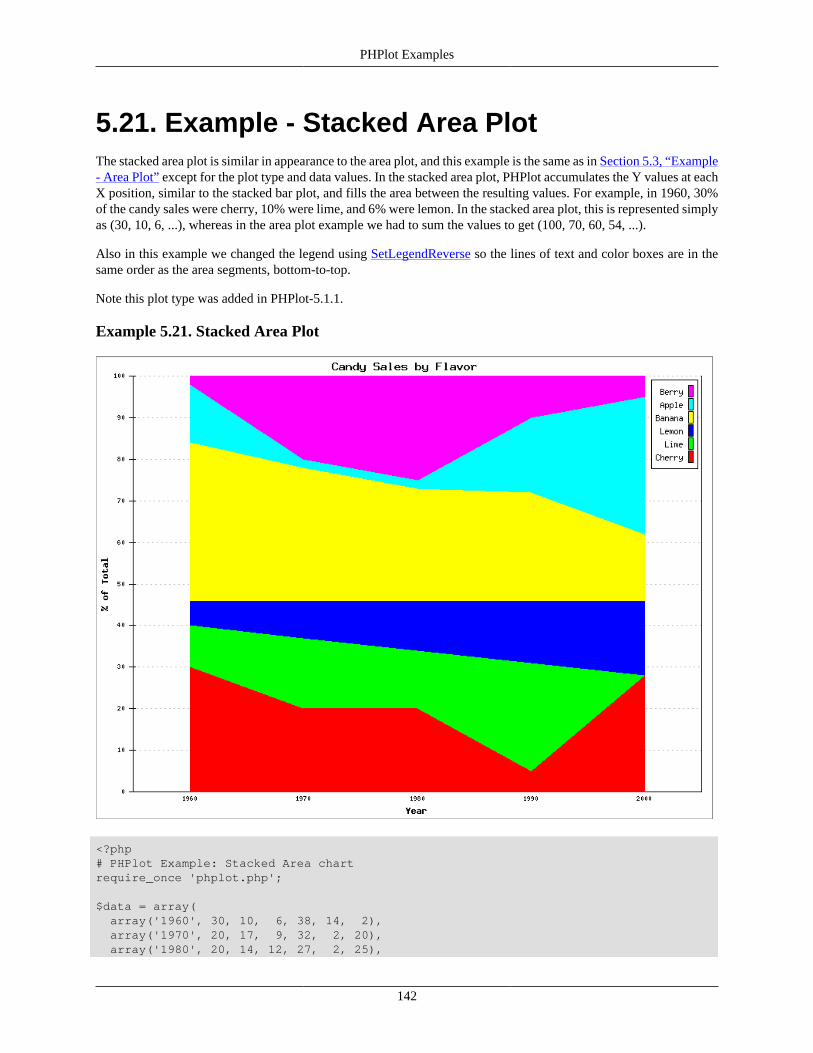
PHPlot Examples
142
5.21. Example - Stacked Area PlotThe stacked area plot is similar in appearance to the area plot, and this example is the same as in Section 5.3, “Example- Area Plot” except for the plot type and data values. In the stacked area plot, PHPlot accumulates the Y values at eachX position, similar to the stacked bar plot, and fills the area between the resulting values. For example, in 1960, 30%of the candy sales were cherry, 10% were lime, and 6% were lemon. In the stacked area plot, this is represented simplyas (30, 10, 6, ...), whereas in the area plot example we had to sum the values to get (100, 70, 60, 54, ...).
Also in this example we changed the legend using SetLegendReverse so the lines of text and color boxes are in thesame order as the area segments, bottom-to-top.
Note this plot type was added in PHPlot-5.1.1.
Example 5.21. Stacked Area Plot
<?php# PHPlot Example: Stacked Area chartrequire_once 'phplot.php';
$data = array( array('1960', 30, 10, 6, 38, 14, 2), array('1970', 20, 17, 9, 32, 2, 20), array('1980', 20, 14, 12, 27, 2, 25),

PHPlot Examples
143
array('1990', 5, 26, 15, 26, 18, 10), array('2000', 28, 0, 18, 16, 33, 5),);
$plot = new PHPlot(800, 600);$plot->SetImageBorderType('plain');
$plot->SetPlotType('stackedarea');$plot->SetDataType('text-data');$plot->SetDataValues($data);
# Main plot title:$plot->SetTitle('Candy Sales by Flavor');
# Set Y data limits, tick increment, and titles:$plot->SetPlotAreaWorld(NULL, 0, NULL, 100);$plot->SetYTickIncrement(10);$plot->SetYTitle('% of Total');$plot->SetXTitle('Year');
# Colors are significant to this data:$plot->SetDataColors(array('red', 'green', 'blue', 'yellow', 'cyan', 'magenta'));$plot->SetLegend(array('Cherry', 'Lime', 'Lemon', 'Banana', 'Apple', 'Berry'));# Make legend lines go bottom to top, like the area segments (PHPlot > 5.4.0)$plot->SetLegendReverse(True);
# Turn off X tick labels and ticks because they don't apply here:$plot->SetXTickLabelPos('none');$plot->SetXTickPos('none');
$plot->DrawGraph();

PHPlot Examples
144
5.22. Example - Annotating a Plot Using aCallbackThis is an advanced example that uses a drawing callback to add annotations to a plot. More information on this topiccan be found in Section 4.4.5, “Using Callbacks to Annotate Plots”, where this example is described in detail.
Example 5.22. Annotated Plot
<?php# PHPlot Example: Annotating a plot using callbacks# Note: This example is coded for PHPlot > 5.0.7require_once 'phplot.php';
# Get the Sales data. In real life, this would most likely come from# a database or external file. For this example, we will use 'random'# data, but with a fixed seed for repeatable results.function get_data(){ mt_srand(1); $data = array(); # Build an array with 12 arrays of (month_name, value): for ($month = 1; $month <= 12; $month++)
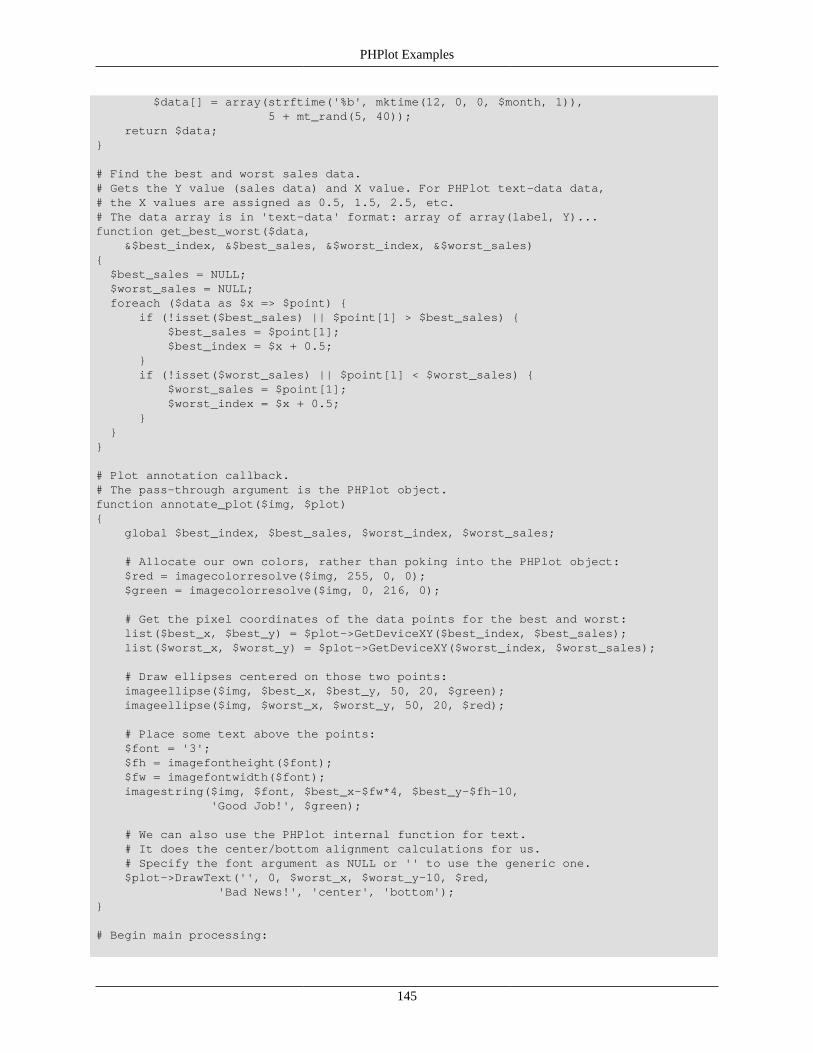
PHPlot Examples
145
$data[] = array(strftime('%b', mktime(12, 0, 0, $month, 1)), 5 + mt_rand(5, 40)); return $data;}
# Find the best and worst sales data.# Gets the Y value (sales data) and X value. For PHPlot text-data data,# the X values are assigned as 0.5, 1.5, 2.5, etc.# The data array is in 'text-data' format: array of array(label, Y)...function get_best_worst($data, &$best_index, &$best_sales, &$worst_index, &$worst_sales){ $best_sales = NULL; $worst_sales = NULL; foreach ($data as $x => $point) { if (!isset($best_sales) || $point[1] > $best_sales) { $best_sales = $point[1]; $best_index = $x + 0.5; } if (!isset($worst_sales) || $point[1] < $worst_sales) { $worst_sales = $point[1]; $worst_index = $x + 0.5; } }}
# Plot annotation callback.# The pass-through argument is the PHPlot object.function annotate_plot($img, $plot){ global $best_index, $best_sales, $worst_index, $worst_sales;
# Allocate our own colors, rather than poking into the PHPlot object: $red = imagecolorresolve($img, 255, 0, 0); $green = imagecolorresolve($img, 0, 216, 0);
# Get the pixel coordinates of the data points for the best and worst: list($best_x, $best_y) = $plot->GetDeviceXY($best_index, $best_sales); list($worst_x, $worst_y) = $plot->GetDeviceXY($worst_index, $worst_sales);
# Draw ellipses centered on those two points: imageellipse($img, $best_x, $best_y, 50, 20, $green); imageellipse($img, $worst_x, $worst_y, 50, 20, $red);
# Place some text above the points: $font = '3'; $fh = imagefontheight($font); $fw = imagefontwidth($font); imagestring($img, $font, $best_x-$fw*4, $best_y-$fh-10, 'Good Job!', $green);
# We can also use the PHPlot internal function for text. # It does the center/bottom alignment calculations for us. # Specify the font argument as NULL or '' to use the generic one. $plot->DrawText('', 0, $worst_x, $worst_y-10, $red, 'Bad News!', 'center', 'bottom');}
# Begin main processing:

PHPlot Examples
146
# Fill the data array:$data = get_data();
# Find the best and worst months:get_best_worst($data, $best_index, $best_sales, $worst_index, $worst_sales);
# Create the PHPlot object, set title, plot type, data array type, and data:$plot = new PHPlot(800, 600);$plot->SetTitle('Monthly Widget Sales');$plot->SetPlotType('bars');$plot->SetDataType('text-data');$plot->SetDataValues($data);# Borders are needed for the manual:$plot->SetImageBorderType('plain');
# Select X data labels (not tick labels):$plot->SetXTickPos('none');$plot->SetXTickLabelPos('none');$plot->SetXDataLabelPos('plotdown');
# Format Y labels as "$nM" with no decimals, steps of 5:$plot->SetYLabelType('data', 0, '$', 'M');$plot->SetYTickIncrement(5.0);
# Force the bottom of the plot to be at Y=0, and omit# the bottom "$0M" tick label because it looks odd:$plot->SetPlotAreaWorld(NULL, 0);$plot->SetSkipBottomTick(True);
# Establish the drawing callback to do the annotation:$plot->SetCallback('draw_all', 'annotate_plot', $plot);
# Draw the graph:$plot->DrawGraph();

PHPlot Examples
147
5.23. Example - Complete Web Form with PlotThis section shows a complete mini-application which uses PHPlot to display a graph based on user input througha web form. The purpose of this example is to illustrate form handling and parameter passing from a form-handlingscript to an image-generating script.
Here a screen-shot of the application, as seen from a web browser. (The bottom section with the graph will only beshown after the form is submitted.)
Example 5.23. Screen Shot of Web Form with Plot
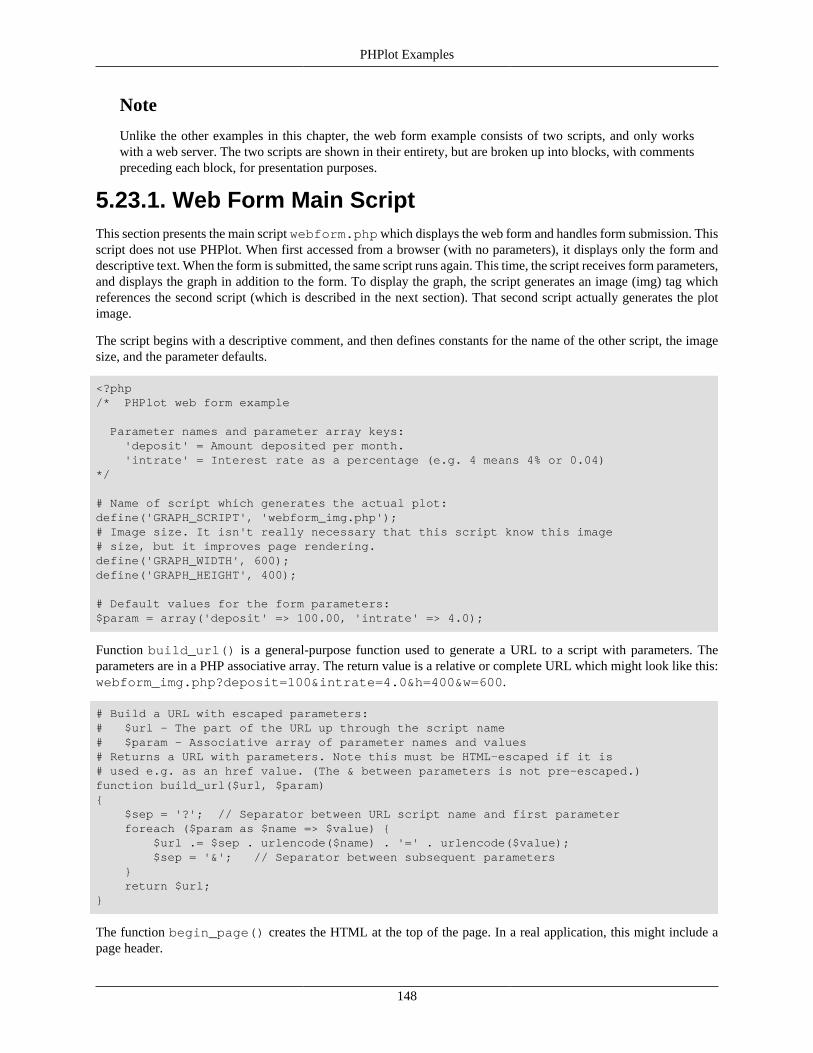
PHPlot Examples
148
Note
Unlike the other examples in this chapter, the web form example consists of two scripts, and only workswith a web server. The two scripts are shown in their entirety, but are broken up into blocks, with commentspreceding each block, for presentation purposes.
5.23.1. Web Form Main ScriptThis section presents the main script webform.php which displays the web form and handles form submission. Thisscript does not use PHPlot. When first accessed from a browser (with no parameters), it displays only the form anddescriptive text. When the form is submitted, the same script runs again. This time, the script receives form parameters,and displays the graph in addition to the form. To display the graph, the script generates an image (img) tag whichreferences the second script (which is described in the next section). That second script actually generates the plotimage.
The script begins with a descriptive comment, and then defines constants for the name of the other script, the imagesize, and the parameter defaults.
<?php/* PHPlot web form example
Parameter names and parameter array keys: 'deposit' = Amount deposited per month. 'intrate' = Interest rate as a percentage (e.g. 4 means 4% or 0.04)*/
# Name of script which generates the actual plot:define('GRAPH_SCRIPT', 'webform_img.php');# Image size. It isn't really necessary that this script know this image# size, but it improves page rendering.define('GRAPH_WIDTH', 600);define('GRAPH_HEIGHT', 400);
# Default values for the form parameters:$param = array('deposit' => 100.00, 'intrate' => 4.0);
Function build_url() is a general-purpose function used to generate a URL to a script with parameters. Theparameters are in a PHP associative array. The return value is a relative or complete URL which might look like this:webform_img.php?deposit=100&intrate=4.0&h=400&w=600.
# Build a URL with escaped parameters:# $url - The part of the URL up through the script name# $param - Associative array of parameter names and values# Returns a URL with parameters. Note this must be HTML-escaped if it is# used e.g. as an href value. (The & between parameters is not pre-escaped.)function build_url($url, $param){ $sep = '?'; // Separator between URL script name and first parameter foreach ($param as $name => $value) { $url .= $sep . urlencode($name) . '=' . urlencode($value); $sep = '&'; // Separator between subsequent parameters } return $url;}
The function begin_page() creates the HTML at the top of the page. In a real application, this might include apage header.

PHPlot Examples
149
# Output the start of the HTML page:function begin_page($title){ echo <<<END<!DOCTYPE HTML PUBLIC "-//W3C//DTD HTML 4.01 Transitional//EN" "http://www.w3.org/TR/html4/loose.dtd"><html><head><title>$title</title></head><body><h1>$title</h1>
END;}
The function end_page() creates the HTML at the end of the page. In a real application, this might include a pagefooter.
# Output the bottom of the HTML page:function end_page(){ echo <<<END</body></html>
END;}
The function show_descriptive_text() produces HTML text which describes the form. This will go abovethe form on the web page.
# Output text which describes the form.function show_descriptive_text(){ echo <<<END<p>This page calculates the balance over time in an interest-earning savingsaccount when fixed monthly deposits are made and there are no withdrawals.</p><p>Fill in the values below and click on the button to display agraph of the account balance over time.</p>
END;}
The function show_form() outputs the HTML form. This includes entry boxes for the two parameters and a submitbutton. The form action URL is this script itself, so we use the SCRIPT_NAME value to self-reference the script.
# Output the web form.# The form resubmits to this same script for processing.# The $param array contains default values for the form.# The values have already been validated as containing numbers and# do not need escaping for HTML.function show_form($param){

PHPlot Examples
150
$action = htmlspecialchars($_SERVER['SCRIPT_NAME']);
echo <<<END<form name="f1" id="f1" method="get" action="$action"><table cellpadding="5" summary="Entry form for balance calculation"><tr> <td align="right"><label for="deposit">Monthly Deposit Amount:</label></td> <td><input type="text" size="10" name="deposit" id="deposit" value="{$param['deposit']}"></tr><tr> <td align="right"><label for="intrate">Interest Rate:</label></td> <td><input type="text" size="10" name="intrate" id="intrate" value="{$param['intrate']}">%</tr><tr> <td colspan="2" align="center"><input type="submit" value="Display Graph"></td></tr></table></form>
END;}
The function check_form_params() performs the important task of validating the parameters received from aform submission. Each parameter is checked for presence and syntax, then converted to the appropriate PHP type.This function is also used to determine if a plot should be displayed. A plot is displayed only if valid form parameterswere received.
# Check for parameters supplied to this web page.# If there are valid parameters, store them in the array argument and# return True.# If there are no parameters, or the parameters are not valid, return False.function check_form_params(&$param){ $valid = True;
if (!isset($_GET['deposit']) || !is_numeric($_GET['deposit']) || ($deposit = floatval($_GET['deposit'])) < 0) $valid = False;
if (!isset($_GET['intrate']) || !is_numeric($_GET['intrate']) || ($intrate = floatval($_GET['intrate'])) < 0 || $intrate > 100) $valid = False;
if ($valid) $param = compact('deposit', 'intrate'); return $valid;}
The function show_graph() produces the HTML which will will invoke the second script to produce the graph.This is an image (img) tag which references the second script, including the parameters the script needs to generatethe plot. This is one of several ways to pass parameters from the form handling script and the image generating script.The other way is using session variables. Using URL parameters is simpler, especially when there are only a fewparameters. Note the HTML also specifies the width and height of the plot image. This is not necessary, however ithelps the browser lay out the page without waiting for the image script to complete.
# Display a graph.# The param array contains the validated values: deposit and intrate.

PHPlot Examples
151
# This function creates the portion of the page that contains the# graph, but the actual graph is generated by the $GRAPH_SCRIPT script.function show_graph($param){ # Include the width and height as parameters: $param['w'] = GRAPH_WIDTH; $param['h'] = GRAPH_HEIGHT; # URL to the graphing script, with parameters, escaped for HTML: $img_url = htmlspecialchars(build_url(GRAPH_SCRIPT, $param));
echo <<<END<hr><p>Graph showing the account balance over time, with monthly deposits of{$param['deposit']} and earning annual interest of {$param['intrate']}%:
<p><img src="$img_url" width="{$param['w']}" height="{$param['h']}" alt="Account balance graph.">
END;}
Finally, with all the functions defined, the main code is just a few lines.
# This is the main processing code.begin_page("PHPlot: Example of a Web Form and Plot");$params_supplied = check_form_params($param);show_descriptive_text();show_form($param);if ($params_supplied) show_graph($param);end_page();
5.23.2. Web Form Image ScriptThis section presents the second script webform_img.php, which generates the plot using PHPlot. The URL tothis script, along with its parameters, is embedded in the web page produced by the main script in Section 5.23.1,“Web Form Main Script”. When the user's browser asks the web server for the image, this second script runs andgenerates the plot.
The script begins with a descriptive comment and then includes the PHPlot source.
<?php/* PHPlot web form example - image generation
This draws the plot image for webform.php It expects the following parameters: 'deposit' = Amount deposited per month. Must be >= 0. 'intrate' = Interest rate as a percentage (e.g. 4 means 4% or 0.04) 'w', 'h' = image width and height. (Must be between 100 and 5000)*/require_once 'phplot.php';
Function check_form_params() validates the parameters supplied to the script. Two parameters are required(intrate and deposit), and two are optional (h and w). Even though the main script validated the parameters it passesto this script, it is still necessary for the script to do its own validation. That is because any accessible script can becalled from any other web page, or directly from a browser, with arbitrary parameters. (Error handling details canbe found below.)
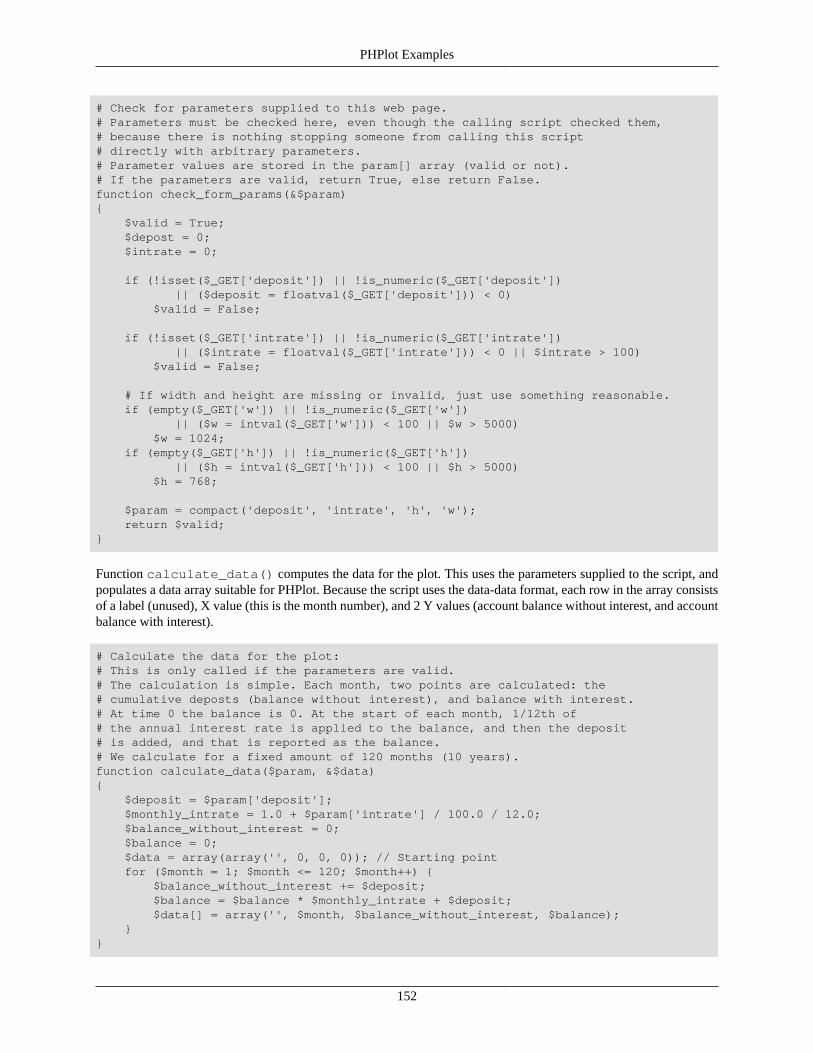
PHPlot Examples
152
# Check for parameters supplied to this web page.# Parameters must be checked here, even though the calling script checked them,# because there is nothing stopping someone from calling this script# directly with arbitrary parameters.# Parameter values are stored in the param[] array (valid or not).# If the parameters are valid, return True, else return False.function check_form_params(&$param){ $valid = True; $depost = 0; $intrate = 0;
if (!isset($_GET['deposit']) || !is_numeric($_GET['deposit']) || ($deposit = floatval($_GET['deposit'])) < 0) $valid = False;
if (!isset($_GET['intrate']) || !is_numeric($_GET['intrate']) || ($intrate = floatval($_GET['intrate'])) < 0 || $intrate > 100) $valid = False;
# If width and height are missing or invalid, just use something reasonable. if (empty($_GET['w']) || !is_numeric($_GET['w']) || ($w = intval($_GET['w'])) < 100 || $w > 5000) $w = 1024; if (empty($_GET['h']) || !is_numeric($_GET['h']) || ($h = intval($_GET['h'])) < 100 || $h > 5000) $h = 768;
$param = compact('deposit', 'intrate', 'h', 'w'); return $valid;}
Function calculate_data() computes the data for the plot. This uses the parameters supplied to the script, andpopulates a data array suitable for PHPlot. Because the script uses the data-data format, each row in the array consistsof a label (unused), X value (this is the month number), and 2 Y values (account balance without interest, and accountbalance with interest).
# Calculate the data for the plot:# This is only called if the parameters are valid.# The calculation is simple. Each month, two points are calculated: the# cumulative deposts (balance without interest), and balance with interest.# At time 0 the balance is 0. At the start of each month, 1/12th of# the annual interest rate is applied to the balance, and then the deposit# is added, and that is reported as the balance.# We calculate for a fixed amount of 120 months (10 years).function calculate_data($param, &$data){ $deposit = $param['deposit']; $monthly_intrate = 1.0 + $param['intrate'] / 100.0 / 12.0; $balance_without_interest = 0; $balance = 0; $data = array(array('', 0, 0, 0)); // Starting point for ($month = 1; $month <= 120; $month++) { $balance_without_interest += $deposit; $balance = $balance * $monthly_intrate + $deposit; $data[] = array('', $month, $balance_without_interest, $balance); }}

PHPlot Examples
153
Function draw_graph() uses PHPlot to actually produce the graph. This function is similar to the other codeexamples in this chapter. A PHPlot object is created, set up, and then told to draw the plot. If the script parameters arenot valid, however, an attempt is made to draw the plot without a data array. This results in an error, which PHPlothandles by creating an image file with an error message. This method of error handling is used because the scriptcannot return a textual error message since it is referenced from a web page via an image (img) tag. An alternative tothis error handling is to have the script return an HTTP error code such as error 500 (server error).
# Draw the graph:function draw_graph($valid_params, $param, $data){ extract($param);
$plot = new PHPlot($w, $h); $plot->SetTitle('Savings with Interest'); $plot->SetDataType('data-data'); # Don't set data values if parameters were not valid. This will result # in PHPlot making an image with an error message. if ($valid_params) { $plot->SetDataValues($data); } $plot->SetLegend(array('Deposits only', 'Deposits with Interest')); $plot->SetLegendPixels(100, 50); // Move legend to upper left $plot->SetXTitle('Month'); $plot->SetXTickIncrement(12); $plot->SetYTitle('Balance'); $plot->SetYLabelType('data', 2); $plot->SetDrawXGrid(True); $plot->SetPlotType('lines'); $plot->DrawGraph();}
Lastly, the main code for the image drawing script simply uses the above functions.
# This is our main processing code.$valid_params = check_form_params($param);if ($valid_params) calculate_data($param, $data);draw_graph($valid_params, $param, $data);

PHPlot Examples
154
5.24. Example - Using Truecolor To Make aHistogramThis example creates a Truecolor plot containing a histogram of a photograph, then overlays the histogram on a scaled-down copy of the photograph. The histogram is partly transparent so you can still see the photograph below. Refer toSection 4.3, “Truecolor Images” for more information on using truecolor PHPlot images.
Here are some notes on the code example:
• The main functions are get_histogram and plot_histogram. Parameters controlling the histogram and itsplacement on the image are in an array passed to plot_histogram. For the purpose of this demo, the array$param is used, and there is no provision to change the parameters or the photograph filename.
• This isn't a 'true' histogram, because the Y values are automatically scaled by PHPlot so they fill the available height.This could be called a 'relative histogram', with the heights indicating the relative count of pixels in the image withthat value.
• The histogram is created by converting each pixel's R, G, B color values to a grayscale value between 0 and 255,and counting the number of times each value appears in the image.
• The photograph image is scaled by PHPlot to fit into the background of the plot image using SetBgImage. Thehistogram is then drawn into an area restricted using SetPlotAreaPixels, leaving most of the background imageunobscured. All labels and tick marks are turned off. The plot data colors are set to be partly transparent using thedefault alpha argument to SetDataColors.
NoteThis is a demonstration only. Processing individual pixels in nested loops this way using PHP code is notrecommended, because it is very slow. A small image file (800x600) might be processed in a few seconds,but a larger file such as a 12 megapixel photograph could take 30 seconds, for example.

PHPlot Examples
155
Example 5.24. Truecolor Plot of Histogram
<?php# PHPlot Example - Histogram of a Photograph# Display a photo image with its value histogram overlaid# Note: This requires PHPlot-5.1.1 or higher for Truecolor support.# Unlike the other examples, and contrary to the usual PHPlot recommendation,# this script creates JPEG not PNG, because most of the image is the original# photograph and PNG results in an overlarge file.require_once 'phplot.php';
# Tunable parameters:$param = array( 'plot_image_width' => 640, # Width of final image 'plot_image_height' => 480, # Height of final image 'histogram_color' => 'magenta', # Color to use for histogram lines 'histogram_alpha' => 50, # Histogram transparency (0=opaque, 127=clear) 'draw_border' => True, # If true, put a border around the histogram 'border_color' => 'red', # Border color, if draw_border is true 'hx' => 0.6, # Upper left X relative position of histogram 'hy' => 0.0, # Upper left Y relative position of histogram 'h_width' => 0.4, # Relative width of histogram 'h_height' => 0.35, # Relative height of histogram);
/* Make a histogram from an image file, which can be palette or truecolor. Returns an array $histogram[i] where i is from 0 to 255. Each histogram[i] is the number of pixels in the image with grayscale value i. (Grayscale is computed using the NTSC formula, but with integers.)*/function get_histogram($image_file)
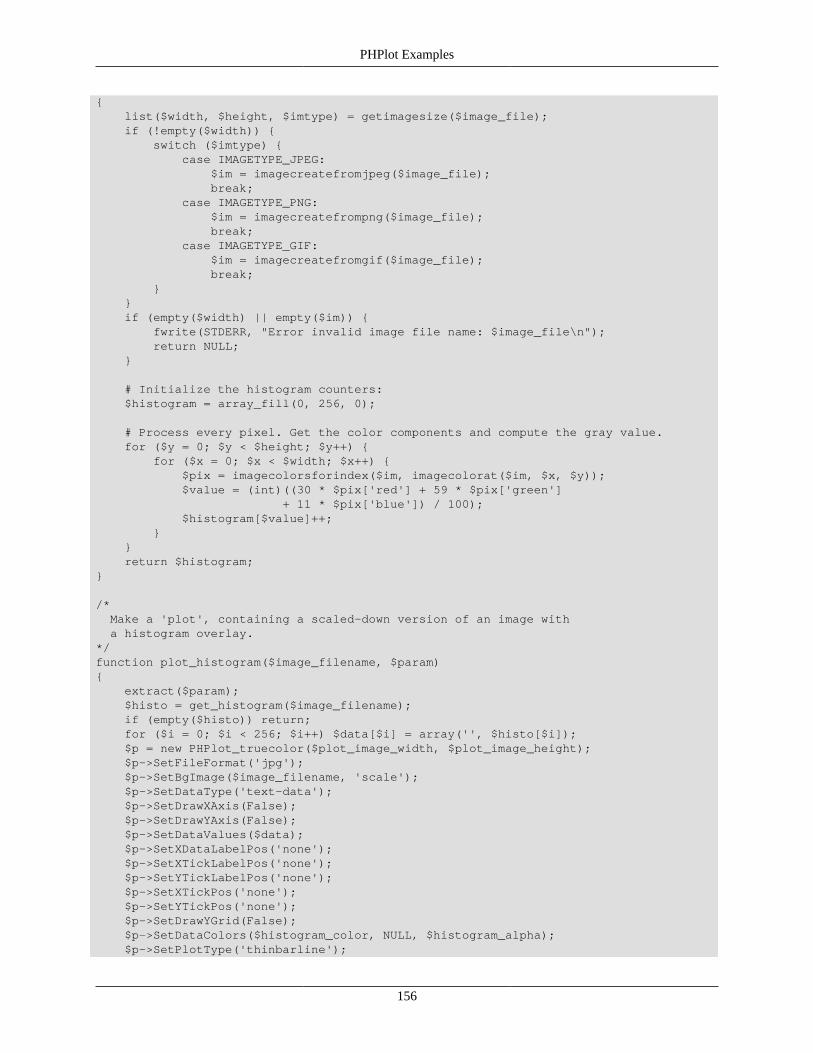
PHPlot Examples
156
{ list($width, $height, $imtype) = getimagesize($image_file); if (!empty($width)) { switch ($imtype) { case IMAGETYPE_JPEG: $im = imagecreatefromjpeg($image_file); break; case IMAGETYPE_PNG: $im = imagecreatefrompng($image_file); break; case IMAGETYPE_GIF: $im = imagecreatefromgif($image_file); break; } } if (empty($width) || empty($im)) { fwrite(STDERR, "Error invalid image file name: $image_file\n"); return NULL; }
# Initialize the histogram counters: $histogram = array_fill(0, 256, 0);
# Process every pixel. Get the color components and compute the gray value. for ($y = 0; $y < $height; $y++) { for ($x = 0; $x < $width; $x++) { $pix = imagecolorsforindex($im, imagecolorat($im, $x, $y)); $value = (int)((30 * $pix['red'] + 59 * $pix['green'] + 11 * $pix['blue']) / 100); $histogram[$value]++; } } return $histogram;}
/* Make a 'plot', containing a scaled-down version of an image with a histogram overlay.*/function plot_histogram($image_filename, $param){ extract($param); $histo = get_histogram($image_filename); if (empty($histo)) return; for ($i = 0; $i < 256; $i++) $data[$i] = array('', $histo[$i]); $p = new PHPlot_truecolor($plot_image_width, $plot_image_height); $p->SetFileFormat('jpg'); $p->SetBgImage($image_filename, 'scale'); $p->SetDataType('text-data'); $p->SetDrawXAxis(False); $p->SetDrawYAxis(False); $p->SetDataValues($data); $p->SetXDataLabelPos('none'); $p->SetXTickLabelPos('none'); $p->SetYTickLabelPos('none'); $p->SetXTickPos('none'); $p->SetYTickPos('none'); $p->SetDrawYGrid(False); $p->SetDataColors($histogram_color, NULL, $histogram_alpha); $p->SetPlotType('thinbarline');

PHPlot Examples
157
if ($draw_border) { $p->SetGridColor($border_color); $p->SetPlotBorderType('full'); } else { $p->SetPlotBorderType('none'); } # Compute the position of the histogram plot within the image. $hx0 = (int)($hx * $plot_image_width); $hy0 = (int)($hy * $plot_image_height); $hx1 = (int)($h_width * $plot_image_width) + $hx0; $hy1 = (int)($h_height * $plot_image_height) + $hy0; $p->SetPlotAreaPixels($hx0, $hy0, $hx1, $hy1); $p->DrawGraph();}
/* Demo main. */plot_histogram('examples/geese.jpg', $param);

PHPlot Examples
158
5.25. Example - Creative Use of the Data ColorCallbackThis example uses the data_color callback to vary the colors used in a thinbarline plot. The callback functiongetcolor simply returns the row number, which corresponds to each point's position along the X axis. PHPlot willtherefore use a different color for each plotted point (modulo the number of defined colors). A large data color arrayis also defined, with colors set to shades of blue from dark to light and back to dark.
A truecolor plot image is used to allow for more colors than would be allowed in a palette image.
Using the data color callback is described in Section 4.5, “Custom Data Color Selection”. More information oncallbacks can be found in Section 4.4, “Callbacks”. More information on truecolor images can be found in Section 4.3,“Truecolor Images”.
Example 5.25. Creative Use of the Data Color Callback
<?php# PHPlot Example: Creative use of data colorsrequire_once 'phplot.php';
# Callback for picking a data color.
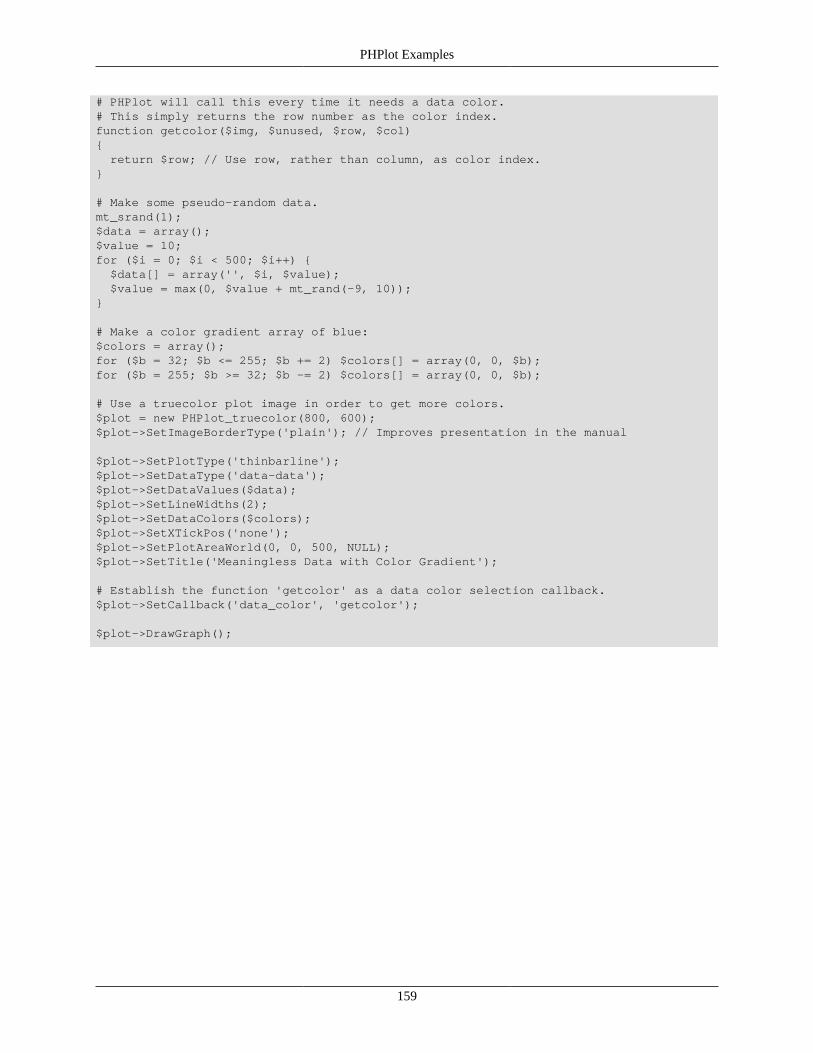
PHPlot Examples
159
# PHPlot will call this every time it needs a data color.# This simply returns the row number as the color index.function getcolor($img, $unused, $row, $col){ return $row; // Use row, rather than column, as color index.}
# Make some pseudo-random data.mt_srand(1);$data = array();$value = 10;for ($i = 0; $i < 500; $i++) { $data[] = array('', $i, $value); $value = max(0, $value + mt_rand(-9, 10));}
# Make a color gradient array of blue:$colors = array();for ($b = 32; $b <= 255; $b += 2) $colors[] = array(0, 0, $b);for ($b = 255; $b >= 32; $b -= 2) $colors[] = array(0, 0, $b);
# Use a truecolor plot image in order to get more colors.$plot = new PHPlot_truecolor(800, 600);$plot->SetImageBorderType('plain'); // Improves presentation in the manual
$plot->SetPlotType('thinbarline');$plot->SetDataType('data-data');$plot->SetDataValues($data);$plot->SetLineWidths(2);$plot->SetDataColors($colors);$plot->SetXTickPos('none');$plot->SetPlotAreaWorld(0, 0, 500, NULL);$plot->SetTitle('Meaningless Data with Color Gradient');
# Establish the function 'getcolor' as a data color selection callback.$plot->SetCallback('data_color', 'getcolor');
$plot->DrawGraph();

PHPlot Examples
160
5.26. Example - Custom Bar Colors Using theData Color CallbackThis example uses the data_color callback to customize the colors in a bar chart. The goal is to have the bar colorsdepend on the value of the bar (rather than the position of the bar in the bar group). Bars above 80% will be drawn ingreen, bars below 60% will be red, and bars in between those two values will be yellow.
The function pickcolor is the data_color callback. It accesses the data array using its pass-through argument,indexing into it with the current row and column. (Note col+1 is used to skip over the row label.) It then checks thedata value, and returns an index into the data colors array: 0, 1, or 2, depending on the value.
Using the data color callback is described in Section 4.5, “Custom Data Color Selection”. More information oncallbacks can be found in Section 4.4, “Callbacks”.
Example 5.26. Custom Bar Colors Using the Data Color Callback
<?php# PHPlot Example: Bar chart with bar color depending on valuerequire_once 'phplot.php';
# Callback for picking a data color.
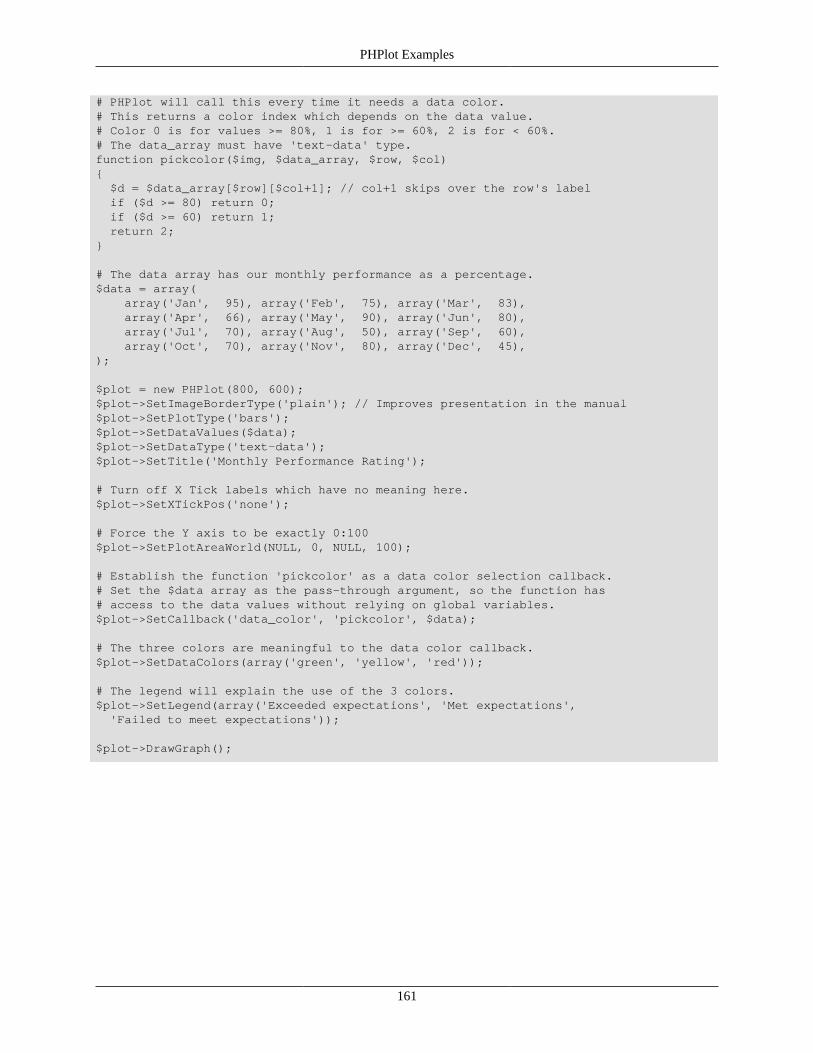
PHPlot Examples
161
# PHPlot will call this every time it needs a data color.# This returns a color index which depends on the data value.# Color 0 is for values >= 80%, 1 is for >= 60%, 2 is for < 60%.# The data_array must have 'text-data' type.function pickcolor($img, $data_array, $row, $col){ $d = $data_array[$row][$col+1]; // col+1 skips over the row's label if ($d >= 80) return 0; if ($d >= 60) return 1; return 2;}
# The data array has our monthly performance as a percentage.$data = array( array('Jan', 95), array('Feb', 75), array('Mar', 83), array('Apr', 66), array('May', 90), array('Jun', 80), array('Jul', 70), array('Aug', 50), array('Sep', 60), array('Oct', 70), array('Nov', 80), array('Dec', 45),);
$plot = new PHPlot(800, 600);$plot->SetImageBorderType('plain'); // Improves presentation in the manual$plot->SetPlotType('bars');$plot->SetDataValues($data);$plot->SetDataType('text-data');$plot->SetTitle('Monthly Performance Rating');
# Turn off X Tick labels which have no meaning here.$plot->SetXTickPos('none');
# Force the Y axis to be exactly 0:100$plot->SetPlotAreaWorld(NULL, 0, NULL, 100);
# Establish the function 'pickcolor' as a data color selection callback.# Set the $data array as the pass-through argument, so the function has# access to the data values without relying on global variables.$plot->SetCallback('data_color', 'pickcolor', $data);
# The three colors are meaningful to the data color callback.$plot->SetDataColors(array('green', 'yellow', 'red'));
# The legend will explain the use of the 3 colors.$plot->SetLegend(array('Exceeded expectations', 'Met expectations', 'Failed to meet expectations'));
$plot->DrawGraph();

PHPlot Examples
162
5.27. Example - Horizontal Bar ChartThis example shows a horizontal bar chart. As always, the X axis is horizontal, and the Y axis is vertical. But the dataarray contains the X value for each implicit Y. The data type 'text-data-yx' indicates this is a horizontal plot.
This example also has a tiled background image under the plot area.
Example 5.27. Horizontal Bar Chart
<?php# PHPlot Example - Horizontal Barsrequire_once 'phplot.php';

PHPlot Examples
163
$data = array( array('San Francisco CA', 20.11), array('Reno NV', 7.5), array('Phoenix AZ', 8.3), array('New York NY', 49.7), array('New Orleans LA', 64.2), array('Miami FL', 52.3), array('Los Angeles CA', 13.2), array('Honolulu HI', 18.3), array('Helena MT', 11.3), array('Duluth MN', 31.0), array('Dodge City KS', 22.4), array('Denver CO', 15.8), array('Burlington VT', 36.1), array('Boston MA', 42.5), array('Barrow AL', 4.2),);
$plot = new PHPlot(800, 800);$plot->SetImageBorderType('plain'); // Improves presentation in the manual$plot->SetTitle("Average Annual Precipitation (inches)\n" . "Selected U.S. Cities");$plot->SetBackgroundColor('gray');# Set a tiled background image:$plot->SetPlotAreaBgImage('images/drop.png', 'centeredtile');# Force the X axis range to start at 0:$plot->SetPlotAreaWorld(0);# No ticks along Y axis, just bar labels:$plot->SetYTickPos('none');# No ticks along X axis:$plot->SetXTickPos('none');# No X axis labels. The data values labels are sufficient.$plot->SetXTickLabelPos('none');# Turn on the data value labels:$plot->SetXDataLabelPos('plotin');# No grid lines are needed:$plot->SetDrawXGrid(FALSE);# Set the bar fill color:$plot->SetDataColors('salmon');# Use less 3D shading on the bars:$plot->SetShading(2);$plot->SetDataValues($data);$plot->SetDataType('text-data-yx');$plot->SetPlotType('bars');$plot->DrawGraph();

PHPlot Examples
164
5.28. Example - Horizontal Stacked Bar ChartThis example shows a horizontal stacked bar chart. As always, the X axis is horizontal, and the Y axis is vertical. Butthe data array contains the X value for each implicit Y. The data type 'text-data-yx' indicates this is a horizontal plot.
Example 5.28. Horizontal Stacked Bar Chart
<?php# PHPlot Example - Horizontal Stacked Barsrequire_once 'phplot.php';
$column_names = array( 'Beef', 'Fish', 'Pork', 'Chicken', 'Butter', 'Cheese', 'Ice Cream');// | | | | | | |$data = array( array('1910', 48.5, 11.2, 38.2, 11.0, 18.4, 3.9, 1.9), array('1930', 33.7, 10.2, 41.1, 11.1, 17.6, 4.7, 9.7), array('1950', 44.6, 11.9, 43.0, 14.3, 10.9, 7.7, 17.4), array('1970', 79.6, 11.7, 48.1, 27.4, 5.4, 11.4, 17.8), array('1990', 63.9, 14.9, 46.4, 42.4, 4.0, 24.6, 15.8),);$plot = new PHPlot(800, 500);$plot->SetImageBorderType('plain'); // Improves presentation in the manual$plot->SetTitle("U.S. Annual Per-Capita Consumption\n" . "of Selected Meat and Dairy Products");$plot->SetLegend($column_names);

PHPlot Examples
165
# Move the legend to the lower right of the plot area:$plot->SetLegendPixels(700, 300);$plot->SetDataValues($data);$plot->SetDataType('text-data-yx');$plot->SetPlotType('stackedbars');$plot->SetXTitle('Pounds Consumed Per Capita');# Show data value labels:$plot->SetXDataLabelPos('plotstack');# Rotate data value labels to 90 degrees:$plot->SetXDataLabelAngle(90);# Format the data value labels with 1 decimal place:$plot->SetXDataLabelType('data', 1);# Specify a whole number for the X tick interval:$plot->SetXTickIncrement(20);# Disable the Y tick marks:$plot->SetYTickPos('none');$plot->DrawGraph();
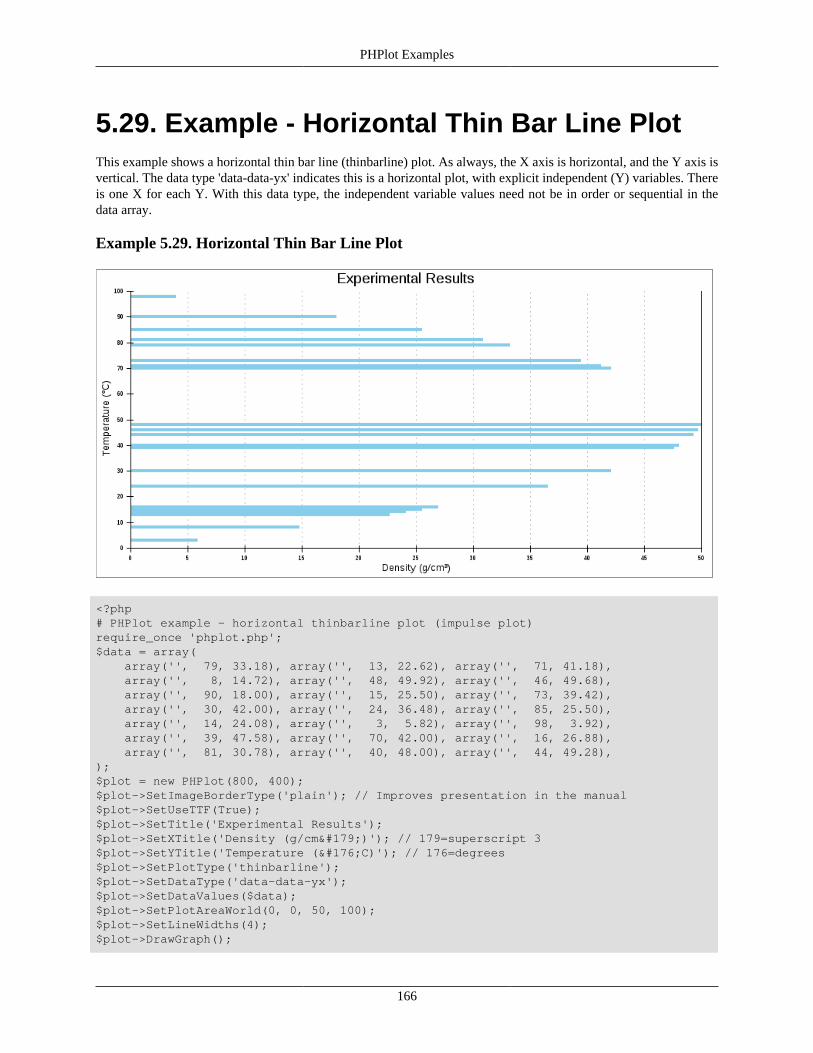
PHPlot Examples
166
5.29. Example - Horizontal Thin Bar Line PlotThis example shows a horizontal thin bar line (thinbarline) plot. As always, the X axis is horizontal, and the Y axis isvertical. The data type 'data-data-yx' indicates this is a horizontal plot, with explicit independent (Y) variables. Thereis one X for each Y. With this data type, the independent variable values need not be in order or sequential in thedata array.
Example 5.29. Horizontal Thin Bar Line Plot
<?php# PHPlot example - horizontal thinbarline plot (impulse plot)require_once 'phplot.php';$data = array( array('', 79, 33.18), array('', 13, 22.62), array('', 71, 41.18), array('', 8, 14.72), array('', 48, 49.92), array('', 46, 49.68), array('', 90, 18.00), array('', 15, 25.50), array('', 73, 39.42), array('', 30, 42.00), array('', 24, 36.48), array('', 85, 25.50), array('', 14, 24.08), array('', 3, 5.82), array('', 98, 3.92), array('', 39, 47.58), array('', 70, 42.00), array('', 16, 26.88), array('', 81, 30.78), array('', 40, 48.00), array('', 44, 49.28),);$plot = new PHPlot(800, 400);$plot->SetImageBorderType('plain'); // Improves presentation in the manual$plot->SetUseTTF(True);$plot->SetTitle('Experimental Results');$plot->SetXTitle('Density (g/cm³)'); // 179=superscript 3$plot->SetYTitle('Temperature (°C)'); // 176=degrees$plot->SetPlotType('thinbarline');$plot->SetDataType('data-data-yx');$plot->SetDataValues($data);$plot->SetPlotAreaWorld(0, 0, 50, 100);$plot->SetLineWidths(4);$plot->DrawGraph();

PHPlot Examples
167
5.30. Example - Basic OHLC (Open, High, Low,Close) Financial PlotThis example shows an ohlc plot, which is a basic form of the Open, High, Low, Close (OHLC) financial plot. EachX is a point in time or interval, and there are 4 corresponding Y values for the four prices (open, high, low, andclose). Compare this with the next two examples, Example 5.31, “Candlesticks OHLC Plot” and Example 5.32, “FilledCandlesticks OHLC Plot”, which show the same data but with a different presentation.
In this example, the data array is read from an external file in Comma Separated Value (CSV) format. (Financial data inthis format is available for download from sites such as Yahoo! Finance.) A portion of the data file can be found below.
This example uses the dates from the data file as row labels in the data array, with text-data data format. For this towork, the rows have to be sorted by increasing date, so the read_prices_text_data() first reads the data intoa temporary array, sorts by the date, then copies the data into a PHPlot data array. Compare this with the other twoOHLC examples, where the same data is used differently.
This example uses TuneYAutoRange to disable the zero magnet, which would otherwise stretch the Y axis range toinclude 0. For many plots, including 0 on the axis is desirable, but for this financial plot we want to be able to seesmall changes in the values, and are less interested in the relative amounts. (The zero magnet feature was added atPHPlot-6.0.0, and the script tests for the method availability before using it.)
Example 5.30. Basic OHLC Plot

PHPlot Examples
168
<?php# PHPlot Example: OHLC (Financial) plot, basic lines, using# external data file, text-data format.define('DATAFILE', 'examples/ohlcdata.csv'); // External data filerequire_once 'phplot.php';
/* Read historical price data from a CSV data downloaded from Yahoo! Finance. The first line is a header which must contain: Date,Open,High,Low,Close[...] Each additional line has a date (YYYY-MM-DD), then 4 price values. The rows have to be sorted by date, because the original is reversed. This version of the function uses the date as a label, and returns a text-data (implied X) PHPlot data array.*/function read_prices_text_data($filename){ $f = fopen($filename, 'r'); if (!$f) { fwrite(STDERR, "Failed to open data file: $filename\n"); return FALSE; } // Read and check the file header. $row = fgetcsv($f); if ($row === FALSE || $row[0] != 'Date' || $row[1] != 'Open' || $row[2] != 'High' || $row[3] != 'Low' || $row[4] != 'Close') { fwrite(STDERR, "Incorrect header in: $filename\n"); return FALSE; } // Read the rest of the file into array keyed by date for sorting. while ($r = fgetcsv($f)) { $d[$r[0]] = array($r[1], $r[2], $r[3], $r[4]); } fclose($f); ksort($d); // Convert to a PHPlot data array with label and 4 values per row. foreach ($d as $date => $r) { $data[] = array($date, $r[0], $r[1], $r[2], $r[3]); } return $data;}
$plot = new PHPlot(800, 600);$plot->SetImageBorderType('plain'); // Improves presentation in the manual$plot->SetTitle("OHLC (Open/High/Low/Close) Financial Plot\nMSFT Q1 2009");$plot->SetDataType('text-data');$plot->SetDataValues(read_prices_text_data(DATAFILE));$plot->SetPlotType('ohlc');$plot->SetDataColors('black');$plot->SetXLabelAngle(90);$plot->SetXTickPos('none');if (method_exists($plot, 'TuneYAutoRange')) $plot->TuneYAutoRange(0); // Suppress Y zero magnet (PHPlot >= 6.0.0)$plot->DrawGraph();
Here is the top portion of the data file used for the three OHLC examples. This file is called ohlcdata.csv.
Date,Open,High,Low,Close,Volume,Adj Close2009-03-31,17.83,18.79,17.78,18.37,92095500,17.812009-03-30,17.74,17.76,17.27,17.48,49633000,16.95

PHPlot Examples
169
2009-03-27,18.54,18.62,18.05,18.13,47670400,17.582009-03-26,18.17,18.88,18.12,18.83,63775100,18.262009-03-25,17.98,18.31,17.52,17.88,73927100,17.34...

PHPlot Examples
170
5.31. Example - Candlesticks OHLC (Open,High, Low, Close) Financial PlotThis example shows a candlesticks plot, which is a form of the Open, High, Low, Close (OHLC) financial plot. EachX is a point in time or interval, and there are 4 corresponding Y values for the four prices (open, high, low, and close).Compare this with Example 5.30, “Basic OHLC Plot” and Example 5.32, “Filled Candlesticks OHLC Plot”, whichshow the same data but with a different presentation.
The data values for this example are read from an external file. Refer to Section 5.30, “Example - Basic OHLC (Open,High, Low, Close) Financial Plot” for more information. Unlike that example, this candlesticks example uses the datesfrom the data file as the X values in the data array, with the PHPlot data type data-data. The dates read from the fileare converted into timestamp values with strtotime() inside read_prices_data_data(). Since each rowin a data-data array specifies its X value, the rows do not need to be sorted (as they were in the previous example).
PHPlot will format the X values as dates because SetXLabelType is used to select date/time formatting. Unlike thetext-data example, this also lets us use SetXTickIncrement to control the label density along the X axis.
Example 5.31. Candlesticks OHLC Plot
<?php# PHPlot Example: OHLC (Financial) plot, Candlesticks plot, using

PHPlot Examples
171
# external data file, data-data format with date-formatted labels.define('DATAFILE', 'examples/ohlcdata.csv'); // External data filerequire_once 'phplot.php';
/* Read historical price data from a CSV data downloaded from Yahoo! Finance. The first line is a header which must contain: Date,Open,High,Low,Close[...] Each additional line has a date (YYYY-MM-DD), then 4 price values. Convert to PHPlot data-data data array with empty labels and time_t X values and return the data array.*/function read_prices_data_data($filename){ $f = fopen($filename, 'r'); if (!$f) { fwrite(STDERR, "Failed to open data file: $filename\n"); return FALSE; } // Read and check the file header. $row = fgetcsv($f); if ($row === FALSE || $row[0] != 'Date' || $row[1] != 'Open' || $row[2] != 'High' || $row[3] != 'Low' || $row[4] != 'Close') { fwrite(STDERR, "Incorrect header in: $filename\n"); return FALSE; } // Read the rest of the file and convert. while ($d = fgetcsv($f)) { $data[] = array('', strtotime($d[0]), $d[1], $d[2], $d[3], $d[4]); } fclose($f); return $data;}
$plot = new PHPlot(800, 600);$plot->SetImageBorderType('plain'); // Improves presentation in the manual$plot->SetTitle("Candlesticks Financial Plot (data-data)\nMSFT Q1 2009");$plot->SetDataType('data-data');$plot->SetDataValues(read_prices_data_data(DATAFILE));$plot->SetPlotType('candlesticks');$plot->SetDataColors(array('SlateBlue', 'black', 'SlateBlue', 'black'));$plot->SetXLabelAngle(90);$plot->SetXLabelType('time', '%Y-%m-%d');$plot->SetXTickIncrement(7*24*60*60); // 1 week intervalif (method_exists($plot, 'TuneYAutoRange')) $plot->TuneYAutoRange(0); // Suppress Y zero magnet (PHPlot >= 6.0.0)$plot->DrawGraph();
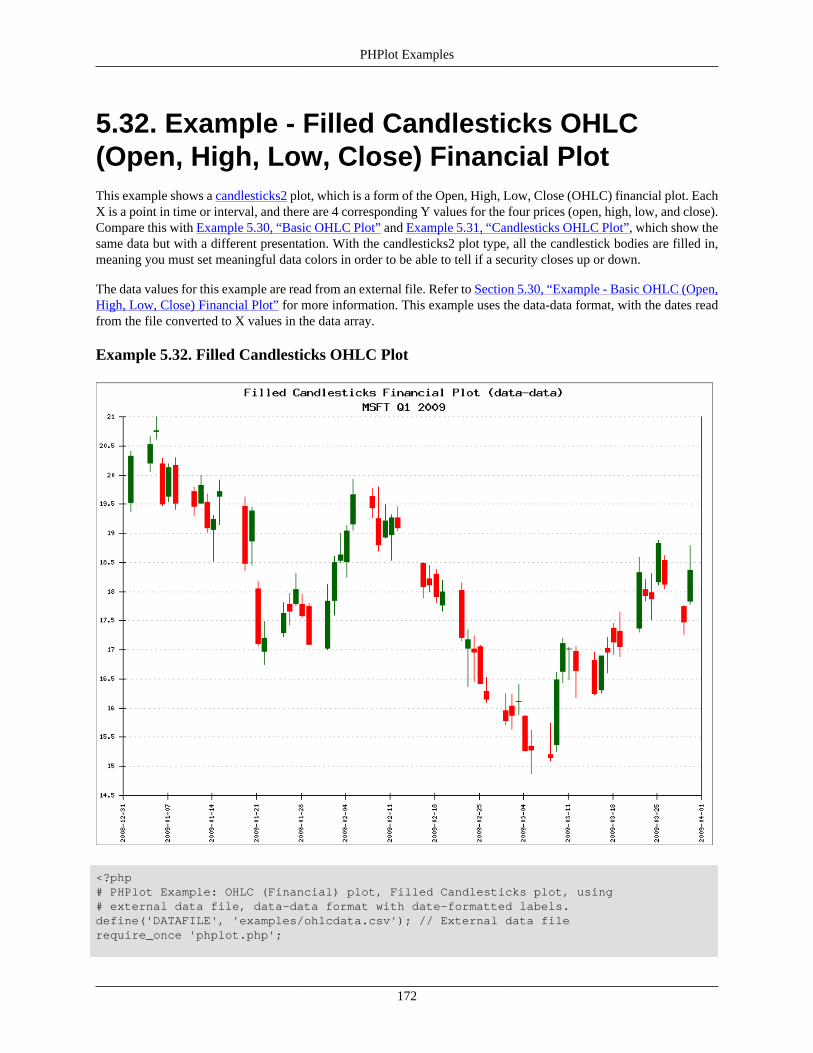
PHPlot Examples
172
5.32. Example - Filled Candlesticks OHLC(Open, High, Low, Close) Financial PlotThis example shows a candlesticks2 plot, which is a form of the Open, High, Low, Close (OHLC) financial plot. EachX is a point in time or interval, and there are 4 corresponding Y values for the four prices (open, high, low, and close).Compare this with Example 5.30, “Basic OHLC Plot” and Example 5.31, “Candlesticks OHLC Plot”, which show thesame data but with a different presentation. With the candlesticks2 plot type, all the candlestick bodies are filled in,meaning you must set meaningful data colors in order to be able to tell if a security closes up or down.
The data values for this example are read from an external file. Refer to Section 5.30, “Example - Basic OHLC (Open,High, Low, Close) Financial Plot” for more information. This example uses the data-data format, with the dates readfrom the file converted to X values in the data array.
Example 5.32. Filled Candlesticks OHLC Plot
<?php# PHPlot Example: OHLC (Financial) plot, Filled Candlesticks plot, using# external data file, data-data format with date-formatted labels.define('DATAFILE', 'examples/ohlcdata.csv'); // External data filerequire_once 'phplot.php';

PHPlot Examples
173
/* Read historical price data from a CSV data downloaded from Yahoo! Finance. The first line is a header which must contain: Date,Open,High,Low,Close[...] Each additional line has a date (YYYY-MM-DD), then 4 price values. Convert to PHPlot data-data data array with empty labels and time_t X values and return the data array.*/function read_prices_data_data($filename){ $f = fopen($filename, 'r'); if (!$f) { fwrite(STDERR, "Failed to open data file: $filename\n"); return FALSE; } // Read and check the file header. $row = fgetcsv($f); if ($row === FALSE || $row[0] != 'Date' || $row[1] != 'Open' || $row[2] != 'High' || $row[3] != 'Low' || $row[4] != 'Close') { fwrite(STDERR, "Incorrect header in: $filename\n"); return FALSE; } // Read the rest of the file and convert. while ($d = fgetcsv($f)) { $data[] = array('', strtotime($d[0]), $d[1], $d[2], $d[3], $d[4]); } fclose($f); return $data;}
$plot = new PHPlot(800, 600);$plot->SetImageBorderType('plain'); // Improves presentation in the manual$plot->SetTitle("Filled Candlesticks Financial Plot (data-data)\nMSFT Q1 2009");$plot->SetDataType('data-data');$plot->SetDataValues(read_prices_data_data(DATAFILE));$plot->SetPlotType('candlesticks2');$plot->SetDataColors(array('red', 'DarkGreen', 'red', 'DarkGreen'));$plot->SetXLabelAngle(90);$plot->SetXLabelType('time', '%Y-%m-%d');$plot->SetXTickIncrement(7*24*60*60); // 1 week intervalif (method_exists($plot, 'TuneYAutoRange')) $plot->TuneYAutoRange(0); // Suppress Y zero magnet (PHPlot >= 6.0.0)$plot->DrawGraph();
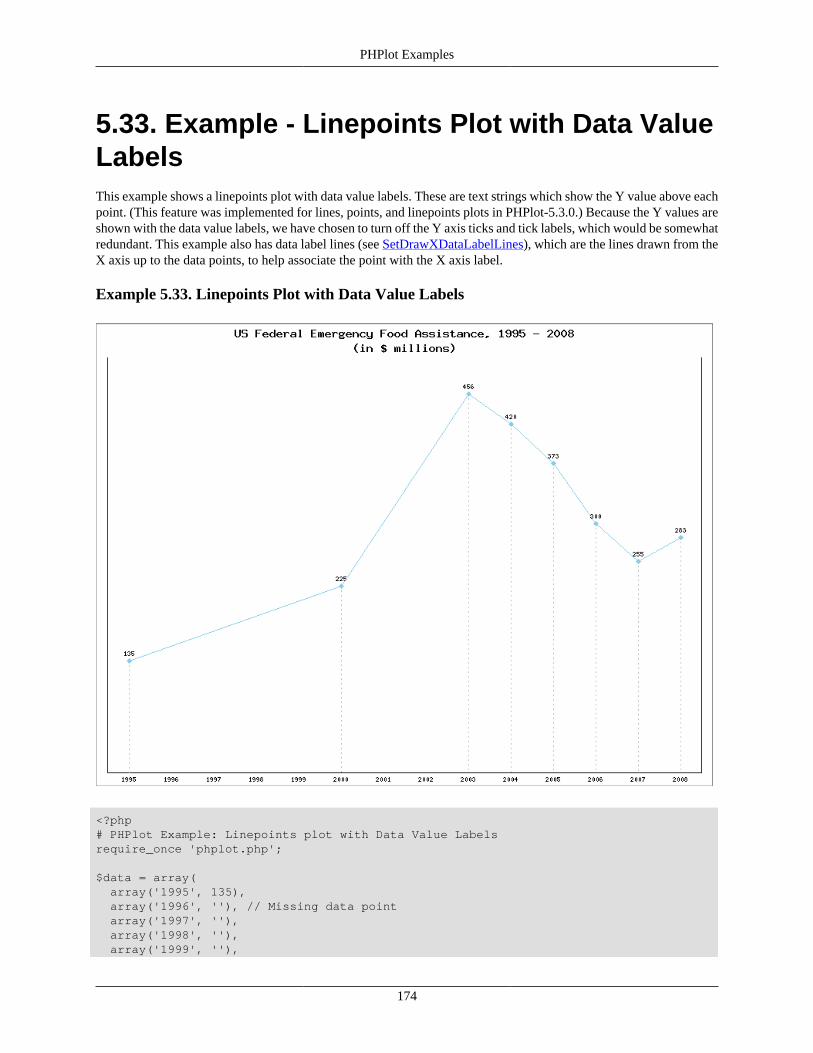
PHPlot Examples
174
5.33. Example - Linepoints Plot with Data ValueLabelsThis example shows a linepoints plot with data value labels. These are text strings which show the Y value above eachpoint. (This feature was implemented for lines, points, and linepoints plots in PHPlot-5.3.0.) Because the Y values areshown with the data value labels, we have chosen to turn off the Y axis ticks and tick labels, which would be somewhatredundant. This example also has data label lines (see SetDrawXDataLabelLines), which are the lines drawn from theX axis up to the data points, to help associate the point with the X axis label.
Example 5.33. Linepoints Plot with Data Value Labels
<?php# PHPlot Example: Linepoints plot with Data Value Labelsrequire_once 'phplot.php';
$data = array( array('1995', 135), array('1996', ''), // Missing data point array('1997', ''), array('1998', ''), array('1999', ''),
PHPlot Examples
175
array('2000', 225), array('2001', ''), array('2002', ''), array('2003', 456), array('2004', 420), array('2005', 373), array('2006', 300), array('2007', 255), array('2008', 283),);
$plot = new PHPlot(800, 600);$plot->SetImageBorderType('plain'); // Improves presentation in the manual$plot->SetPlotType('linepoints');$plot->SetDataType('text-data');$plot->SetDataValues($data);$plot->SetTitle("US Federal Emergency Food Assistance, 1995 - 2008\n" . "(in $ millions)");
# Turn on Y data labels:$plot->SetYDataLabelPos('plotin');
# Turn on X data label lines (drawn from X axis up to data point):$plot->SetDrawXDataLabelLines(True);
# With Y data labels, we don't need Y ticks, Y tick labels, or grid lines.$plot->SetYTickLabelPos('none');$plot->SetYTickPos('none');$plot->SetDrawYGrid(False);# X tick marks are meaningless with this data:$plot->SetXTickPos('none');$plot->SetXTickLabelPos('none');
$plot->DrawGraph();

PHPlot Examples
176
5.34. Example - Overlaying PlotsThis example shows overlay plots, where multiple plots are drawn at the same position on the same image. In this case,one plot contains a stacked bar plot, and the second is a linepoints plot. The two plots also have different Y axis scales.
See Section 4.8, “Multiple Plots Per Image” for more information.
Example 5.34. Overlaying Plots
<?php# PHPlot Example: Plot Overlay (lines and stackedbars)require_once 'phplot.php';
$title = '2009 Outbreak, Positive Tests';
# Note: Graph is based on the real thing, but the data is invented.# Data for plot #1: stackedbars:$y_title1 = 'Number of positive tests';$data1 = array( array('1/09', 200, 200, 300), array('2/09', 300, 100, 700), array('3/09', 400, 200, 800), array('4/09', 500, 300, 1200),

PHPlot Examples
177
array('5/09', 400, 400, 2500), array('6/09', 500, 600, 3600), array('7/09', 400, 1200, 3300), array('8/09', 300, 1500, 2500), array('9/09', 200, 1900, 800), array('10/09', 100, 2000, 200), array('11/09', 100, 2500, 100), array('12/09', 100, 2700, 200),);$legend1 = array('Strain A', 'Strain B', 'Strain C');
# Data for plot #2: linepoints:$y_title2 = 'Percent Positive';$data2 = array( array('1/09', 5), array('2/09', 10), array('3/09', 15), array('4/09', 30), array('5/09', 40), array('6/09', 45), array('7/09', 47), array('8/09', 35), array('9/09', 25), array('10/09', 20), array('11/09', 25), array('12/09', 30),);$legend2 = array('% positive');
$plot = new PHPlot(800, 600);$plot->SetImageBorderType('plain'); // For presentation in the manual$plot->SetPrintImage(False); // Defer output until the end$plot->SetTitle($title);$plot->SetPlotBgColor('gray');$plot->SetLightGridColor('black'); // So grid stands out from background
# Plot 1$plot->SetDrawPlotAreaBackground(True);$plot->SetPlotType('stackedbars');$plot->SetDataType('text-data');$plot->SetDataValues($data1);$plot->SetYTitle($y_title1);# Set and position legend #1:$plot->SetLegend($legend1);$plot->SetLegendPixels(5, 30);# Set margins to leave room for plot 2 Y title on the right.$plot->SetMarginsPixels(120, 120);# Specify Y range of these data sets:$plot->SetPlotAreaWorld(NULL, 0, NULL, 5000);$plot->SetYTickIncrement(500);$plot->SetXTickLabelPos('none');$plot->SetXTickPos('none');# Format Y tick labels as integers, with thousands separator:$plot->SetYLabelType('data', 0);$plot->DrawGraph();
# Plot 2$plot->SetDrawPlotAreaBackground(False); // Cancel background$plot->SetDrawYGrid(False); // Cancel grid, already drawn$plot->SetPlotType('linepoints');
PHPlot Examples
178
$plot->SetDataValues($data2);# Set Y title for plot #2 and position it on the right side:$plot->SetYTitle($y_title2, 'plotright');# Set and position legend #2:$plot->SetLegend($legend2);$plot->SetLegendPixels(690, 30);# Specify Y range of this data set:$plot->SetPlotAreaWorld(NULL, 0, NULL, 50);$plot->SetYTickIncrement(10);$plot->SetYTickPos('plotright');$plot->SetYTickLabelPos('plotright');$plot->SetDataColors('black');# Format Y tick labels as integers with trailing percent sign:$plot->SetYLabelType('data', 0, '', '%');$plot->DrawGraph();
# Now output the graph with both plots:$plot->PrintImage();

PHPlot Examples
179
5.35. Example - Legend with Shape MarkersThis example shows the standard legend appearance, followed by the same plot with point shape markers in thelegend instead of color boxes, and again using a line plot with line markers. Using point shapes in the legend wasadded in PHPlot-5.4.0. These are useful if you need to be able to interpret the legend without color, for example withmonochrome printing, or for accessibility reasons. Using line markers in the legend was added in PHPlot-6.0.0. Whenused with varying line widths, this can reduce the dependency on color to identify the plotted lines. See Section 3.7.2,“Legend” for more on the plot legend.
Example 5.35. Legend with Color Boxes or Shape Markers
First, here is the standard legend with color boxes.
<?php# PHPlot Example: Linepoints plot with legend using color boxes or shape markersrequire_once 'phplot.php';
# The variable $use_shapes can be set to TRUE in another# script which calls this script, to use shape markers# rather than color boxes in the legend.if (empty($use_shapes)) $use_shapes = FALSE;

PHPlot Examples
180
# The variable $plot_type can be set in another script as well.if (empty($plot_type)) $plot_type = 'linepoints';
# Use data labels to display only the points we want,# but specify the same values for X to get the correct# spacing.$data = array( array('1990', 1990, 41308, 21015, 62634), array('1995', 1995, 44310, 13883, 61529), array('2000', 2000, 46772, 9000, 59421), array('2004', 2004, 46887, 7738, 57754), array('2006', 2006, 45441, 6888, 53179), array('2008', 2008, 42757, 5840, 49115),);$legend_text = array('Morning Papers', 'Evening Papers', 'Sunday Papers');
$plot = new PHPlot(800, 600);$plot->SetImageBorderType('plain'); // Improves presentation in the manual$plot->SetTitle("US Daily Newspaper Circulation\n" . $plot_type . ' plot with SetLegendUseShapes(' . ($use_shapes ? 'True' : 'False') . ')');$plot->SetPlotType($plot_type);$plot->SetDataType('data-data');$plot->SetDataValues($data);$plot->SetPlotAreaWorld(1988, 0, 2010, 80000);$plot->SetYTickIncrement(10000);$plot->SetLegend($legend_text);$plot->SetXTickPos('none');$plot->SetDrawXDataLabelLines(True);$plot->SetLegendUseShapes($use_shapes); // Use color boxes or shapes$plot->SetPointSizes(12); // Make points bigger for visibility$plot->SetLineStyles('solid'); // Make all lines solid$plot->SetLineWidths(2); // Make all lines thicker
$plot->DrawGraph();
Changing the call to SetLegendUseShapes results in a legend using point shapes instead of color boxes. (This requiresPHPlot-5.4.0 or later.)

PHPlot Examples
181
<?php# PHPlot Example: Linepoints plot with legend using shape markers# This sets a variable and calls the script directly above.$use_shapes = TRUE;require_once 'legendshape.php';
With a line plot, the shape markers are line segments rather than point markers. (This requires PHPlot-6.0.0 or later.)

PHPlot Examples
182
<?php# PHPlot Example: Line plot with legend using line markers# This sets variables and calls the script directly above.$use_shapes = TRUE;$plot_type = 'lines';require_once 'legendshape.php';
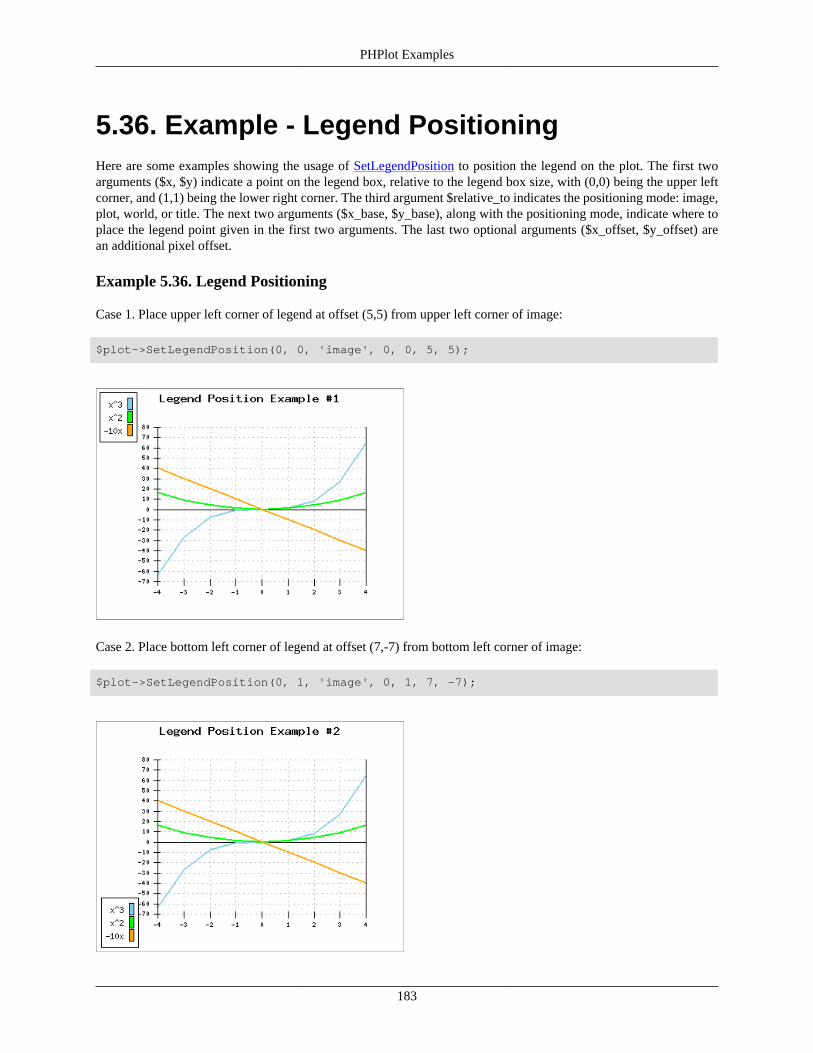
PHPlot Examples
183
5.36. Example - Legend PositioningHere are some examples showing the usage of SetLegendPosition to position the legend on the plot. The first twoarguments ($x, $y) indicate a point on the legend box, relative to the legend box size, with (0,0) being the upper leftcorner, and (1,1) being the lower right corner. The third argument $relative_to indicates the positioning mode: image,plot, world, or title. The next two arguments ($x_base, $y_base), along with the positioning mode, indicate where toplace the legend point given in the first two arguments. The last two optional arguments ($x_offset, $y_offset) arean additional pixel offset.
Example 5.36. Legend Positioning
Case 1. Place upper left corner of legend at offset (5,5) from upper left corner of image:
$plot->SetLegendPosition(0, 0, 'image', 0, 0, 5, 5);
Case 2. Place bottom left corner of legend at offset (7,-7) from bottom left corner of image:
$plot->SetLegendPosition(0, 1, 'image', 0, 1, 7, -7);

PHPlot Examples
184
Case 3. Place top right corner of legend at top center of plot area:
$plot->SetLegendPosition(1, 0, 'plot', 0.5, 0);
Case 4. Center the legend in the upper half of the plot area:
$plot->SetLegendPosition(0.5, 0.5, 'plot', 0.5, 0.25);

PHPlot Examples
185
Case 5. Place center of legend at world coordinates (2,60):
$plot->SetLegendPosition(0.5, 0.5, 'world', 2, 60);
Case 6. Place top right corner of legend at offset (-5,5) from world coordinates (4,0):
$plot->SetLegendPosition(1, 0, 'world', 4, 0, -5, 5);

PHPlot Examples
186
Case 7. Center the top of the legend below the bottom of the title:
$plot->SetLegendPosition(0.5, 0, 'title', 0.5, 1);

PHPlot Examples
187
5.37. Example - Setting a Y Tick AnchorThis example shows the use of SetYTickAnchor to tell PHPlot that we want a tick mark and label at a specific value.
Example 5.37. Setting a Y Tick Anchor
First, here is the example without a Y tick anchor. Note that there is no Y tick mark or label at the X axis Y=0.
Note
The script uses SetPlotAreaWorld to set the Y axis range to -3.5 to 13.5. This is used here to illustrate the needfor setting a Y tick anchor, and the effect of setting the Y tick anchor at 0. Without SetPlotAreaWorld(),PHPlot-6.0.0 and later (but not older versions) will automatically calculate the Y range such that a tick markwill be at Y=0 even without SetYTickAnchor(0).
<?php# PHPlot Example: Using a Y tick anchor to force a tick at 0.# This requires PHPlot >= 5.4.0require_once 'phplot.php';
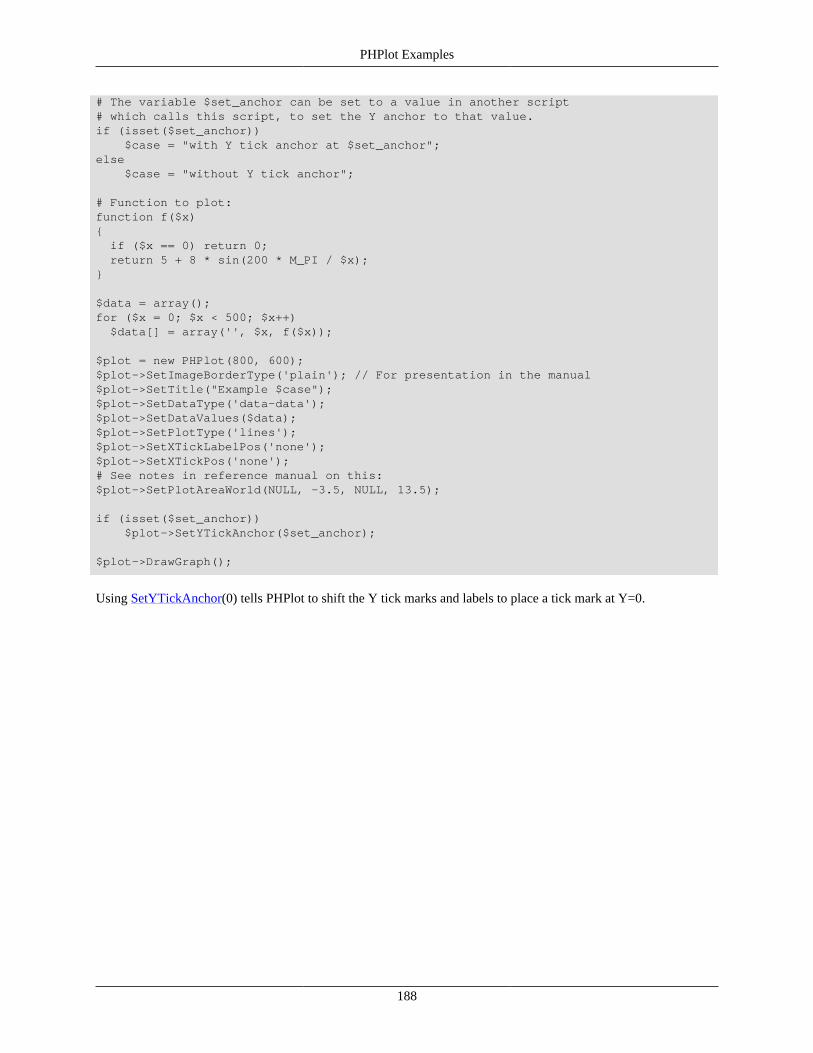
PHPlot Examples
188
# The variable $set_anchor can be set to a value in another script# which calls this script, to set the Y anchor to that value.if (isset($set_anchor)) $case = "with Y tick anchor at $set_anchor";else $case = "without Y tick anchor";
# Function to plot:function f($x){ if ($x == 0) return 0; return 5 + 8 * sin(200 * M_PI / $x);}
$data = array();for ($x = 0; $x < 500; $x++) $data[] = array('', $x, f($x));
$plot = new PHPlot(800, 600);$plot->SetImageBorderType('plain'); // For presentation in the manual$plot->SetTitle("Example $case");$plot->SetDataType('data-data');$plot->SetDataValues($data);$plot->SetPlotType('lines');$plot->SetXTickLabelPos('none');$plot->SetXTickPos('none');# See notes in reference manual on this:$plot->SetPlotAreaWorld(NULL, -3.5, NULL, 13.5);
if (isset($set_anchor)) $plot->SetYTickAnchor($set_anchor);
$plot->DrawGraph();
Using SetYTickAnchor(0) tells PHPlot to shift the Y tick marks and labels to place a tick mark at Y=0.

PHPlot Examples
189
<?php# PHPlot Example: Using a Y tick anchor to force a tick at 0.# This sets a variable and calls the script directly above.$set_anchor = 0;require_once 'ytickanchor.php';

PHPlot Examples
190
5.38. Example - Hourly Data Using X TickAnchorThis example uses an X tick anchor (see SetXTickAnchor) to offset the X tick marks and grid lines. Hourly datais being plotted, for one week, and the goal is to have the tick marks and grid lines separate the days of the week,regardless of the time during the day of the initial data point.
In this example, both X axis data labels and X tick labels are turned on. The data labels display weekday names, andthe tick labels display the dates. Having both labels on is usually something to avoid, because the labels will overlay.In this case, however, only 1 in 24 points has a data label (those points representing noon). Tick marks are also every24 hours, but anchored at midnight. So the tick and data labels are separated. To avoid any overlap, the tick labels aredrawn vertically (90 degrees) while the data labels are horizontal.
(Note that SetXLabelAngle sets the angle for both tick and data labels, while SetXDataLabelAngle sets the angle fordata labels only. PHPlot does this to maintain compatibility. As a result, since the example here wants to turn the ticklabels only (from the default 0 degrees), we also need to turn the data labels back to 0. The order of the calls doesnot matter, however. The same is true for label formatting with SetXLabelType and SetXDataLabelType. To get non-default tick label formatting and default data label formatting requires two calls as shown in the example.)
Example 5.38. Hourly Data Using X Tick Anchor
<?php
PHPlot Examples
191
# PHPlot Example: Using an X tick anchor to control grid lines# This example is based on a question on the PHPlot forum on 5/8/2011.# It requires PHPlot >= 5.4.0require_once 'phplot.php';
# The first data point was recorded at this date/time: (always top of an hour)# Example: 5/1/2011 at 10:00am$year = 2011;$month = 5;$day = 1;$hour = 10;
# Number of hourly data points, e.g. 168 for 1 week's worth:$n_points = 168;# ==================================================================
# Timestamp for the first data point:$time0 = mktime($hour, 0, 0, $month, $day, $year); // H M S m d y
mt_srand(1); // For repeatable, identical results
# Build the PHPlot data array from the base data, and base timestamp.$data = array();$ts = $time0;$tick_anchor = NULL;$d = 5; // Data valuefor ($i = 0; $i < $n_points; $i++) {
# Decode this point's timestamp as hour 0-23: $hour = date('G', $ts);
# Label noon data points with the weekday name, all others unlabelled. $label = ($hour == 12) ? strftime('%A', $ts) : '';
# Remember the first midnight datapoint seen for use as X tick anchor: if (!isset($tick_anchor) && $hour == 0) $tick_anchor = $ts;
# Make a random data point, and add a row to the data array: $d += mt_rand(-200, 250) / 100; $data[] = array($label, $ts, $d);
# Step to next hour: $ts += 3600;}
$plot = new PHPlot(800, 600);$plot->SetImageBorderType('plain'); // For presentation in the manual$plot->SetTitle('Hourly Data Example Plot');$plot->SetDataType('data-data');$plot->SetDataValues($data);$plot->SetPlotType('lines');
# Make the X tick marks (and therefore X grid lines) 24 hours apart:$plot->SetXTickIncrement(60 * 60 * 24);$plot->SetDrawXGrid(True);
# Anchor the X tick marks at midnight. This makes the X grid lines act as# separators between days of the week, regardless of the starting hour.# (Except this messes up around daylight saving time changes.)

PHPlot Examples
192
$plot->SetXTickAnchor($tick_anchor);
# We want both X axis data labels and X tick labels displayed. They will# be positioned in a way that prevents them from overwriting.$plot->SetXDataLabelPos('plotdown');$plot->SetXTickLabelPos('plotdown');
# Increase the left and right margins to leave room for weekday labels.$plot->SetMarginsPixels(50, 50);
# Tick labels will be formatted as date/times, showing the date:$plot->SetXLabelType('time', '%Y-%m-%d');# ... but then we must reset the data label formatting to no formatting.$plot->SetXDataLabelType('');
# Show tick labels (with dates) at 90 degrees, to fit between the data labels.$plot->SetXLabelAngle(90);# ... but then we must reset the data labels to 0 degrees.$plot->SetXDataLabelAngle(0);
# Force the Y range to 0:100.$plot->SetPlotAreaWorld(NULL, 0, NULL, 100);
# Now draw the graph:$plot->DrawGraph();

PHPlot Examples
193
5.39. Example - Embedding Image withEncodeImageThis example shows how EncodeImage can be used to embed a PHPlot image inside an HTML file using the 'data:'URL scheme. Note: This feature was added in PHPlot-5.5.0.
This is the same plot as Section 5.2, “Example - Line Plot: Functions”, except instead of producing the image onstandard output, this script embeds the image in an HTML page, which is produced on standard output. The screenshotbelow shows how the web page looks in Firefox.
Example 5.39. Embedding Image with EncodeImage (Browser screenshot)
<?php# PHPlot Example: Using 'data:' URL scheme to embed an image# Unlike other examples, this outputs a complete HTML page with embedded image.

PHPlot Examples
194
require_once 'phplot.php';
# Generate data for: Y1 = sin(x), Y2 = cos(x)$end = M_PI * 2.0;$delta = $end / 20.0;$data = array();for ($x = 0; $x <= $end; $x += $delta) $data[] = array('', $x, sin($x), cos($x));
$plot = new PHPlot(800, 600);$plot->SetFailureImage(False); // No error images$plot->SetPrintImage(False); // No automatic output$plot->SetImageBorderType('plain');$plot->SetPlotType('lines');$plot->SetDataType('data-data');$plot->SetDataValues($data);$plot->SetTitle('Line Plot, Sin and Cos - Embedded Image');$plot->SetLegend(array('sin(t)', 'cos(t)'));$plot->SetPlotAreaWorld(0, -1, 6.8, 1);$plot->SetXDataLabelPos('none');$plot->SetXTickIncrement(M_PI / 8.0);$plot->SetXLabelType('data');$plot->SetPrecisionX(3);$plot->SetYTickIncrement(0.2);$plot->SetYLabelType('data');$plot->SetPrecisionY(1);$plot->SetDrawXGrid(True);$plot->SetDrawYGrid(True);$plot->DrawGraph();
?><!DOCTYPE HTML PUBLIC "-//W3C//DTD HTML 4.01 Transitional//EN" "http://www.w3.org/TR/html4/loose.dtd"><html><head><title>PHPlot Example - Inline Image</title></head><body><h1>PHPlot Example - Inline Image</h1><p>This is a plot of sin() and cos().</p><img src="<?php echo $plot->EncodeImage();?>" alt="Plot Image"></body></html>

PHPlot Examples
195
5.40. Example - Bubbles PlotThis example shows a bubbles plot. A data array for a bubbles plot uses the data-data-xyz data type, in which threecoordinate values specify each point: X and Y are the position on the plot, and Z maps to the bubble diameter.
In this example, X is the flavor, Y is the age group, and Z represents the percentage of participants who liked that flavor.Note that there are two missing points in the Y=1 row. No bubbles are drawn at X=3,Y=1 or X=5,Y=1. Presumably,no-one under 12 would try the pear or kiwi flavors, so there are no valid data points there. This is different from avalue Z=0, which would be plotted with a bubble of the smallest size.
This plot type was added in PHPlot-5.5.0.
This example also shows the use of custom Y labels. A function get_label() is defined to map the Y tick value intoa string from an array of strings. This method allows the display of arbitrary labels along the Y axis. See SetYLabelTypefor details.
Example 5.40. Bubbles Plot
<?php# PHPlot Example - Bubble Plotrequire_once 'phplot.php';

PHPlot Examples
196
# Array of custom labels for the Y axis. See the get_label callback.$y_labels = array("", "Age\n12 and under", "Age 13-17", "Age 18-29", "Age 30-39", "Age 40-54", "Age\n55 and older");
# Return the string for a Y label:function get_label($value, $labels){ if (isset($labels[(int)$value])) return $labels[(int)$value]; return $value;}
# <=12 13-17 17-28 30-39 40-54 >=55$data = array( array('Cherry', 1, 1, 2, 2, 4, 3, 3, 4, 3, 5, 5, 6, 6), array('Apple', 2, 1, 9, 2, 7, 3, 4, 4, 7, 5, 3, 6, 7), array('Pear', 3, '', 2, 2, 2, 3, 3, 4, 4, 5, 3, 6, 2), array('Grape', 4, 1, 8, 2, 5, 3, 5, 4, 6, 5, 3, 6, 4), array('Kiwi', 5, '', 0, 2, 3, 3, 4, 4, 4, 5, 5, 6, 2), array('Banana', 6, 1, 5, 2, 4, 3, 6, 4, 3, 5, 3, 6, 4),);
$plot = new PHPlot(600, 600);$plot->SetTitle("Flavor Preference By Age Group");$plot->SetDataType('data-data-xyz');$plot->SetDataValues($data);$plot->SetPlotType('bubbles');$plot->SetDataColors('yellow'); // Use same color for all data sets$plot->SetDrawPlotAreaBackground(True);$plot->SetPlotBgColor('plum');$plot->SetLightGridColor('red'); // Change grid color to make it visible$plot->SetImageBorderType('plain');$plot->SetPlotBorderType('full');$plot->SetXTickIncrement(1); // For grid line spacing$plot->SetYTickIncrement(1);$plot->SetPlotAreaWorld(0, 0, 6.5, 6.5);# Establish the handler for the Y label text:$plot->SetYLabelType('custom', 'get_label', $y_labels);$plot->SetXTickPos('both'); // Tick marks on both sides$plot->SetYTickPos('both'); // Tick marks on top and bottom too$plot->SetXDataLabelPos('both'); // X axis data labels top and bottom$plot->SetYTickLabelPos('both'); // Y axis labels left and right$plot->SetDrawXGrid(True);$plot->DrawGraph();

PHPlot Examples
197
5.41. Example - Pie Chart Label TypesBy default, PHPlot labels pie chart segments with their percentage. That is, a pie segment that spans 90 degrees willbe labeled "25.0%". Using SetPieLabelType, you can choose the source of the labels (percentage, data array labels,segment index, or value) and how the result should be formatted.
Notes: Pie label type options were added in PHPlot-5.6.0.
All of the examples in this section include the following script which contains the data array and plot title. The scriptis called pielabeltypedata.php.
<?php# PHPlot Example: Pie Chart Label Types - Data array# This is used by several examples. The data is 'altered' for appearance.$title = 'Energy Production By Source, 2005';$data = array( array('Biomass', 3120.43), array('Coal', 23185.20), array('Geotherm.', 343.74), array('Hydro', 2703.92), array('NGPL', 2334.04), array('Nat. Gas', 18574.55), array('Nuclear', 8160.49), array('Oil', 10963.63),);
Example 5.41. Pie Chart Label Types
This first script shows the default behavior - percentage labels.

PHPlot Examples
198
<?php# PHPlot Example: Pie Chart Label Types - baseline, default label type# This requires PHPlot >= 5.6.0require_once 'phplot.php';require_once 'pielabeltypedata.php'; // Defines $data and $title
$plot = new PHPlot(800, 600);$plot->SetImageBorderType('plain'); // Improves presentation in the manual$plot->SetPlotType('pie');$plot->SetDataType('text-data-single');$plot->SetDataValues($data);$plot->SetTitle($title);$plot->DrawGraph();
The example below uses the label strings from the data array to label the pie segments. Note that this only works whenthe data array data type is text-data-single.

PHPlot Examples
199
<?php# PHPlot Example: Pie Chart Label Types - Labels from data array# This requires PHPlot >= 5.6.0require_once 'phplot.php';require_once 'pielabeltypedata.php'; // Defines $data and $title
$plot = new PHPlot(800, 600);$plot->SetImageBorderType('plain'); // Improves presentation in the manual$plot->SetPlotType('pie');$plot->SetDataType('text-data-single');$plot->SetDataValues($data);$plot->SetTitle($title);# Set label type: Use labels from data array$plot->SetPieLabelType('label');$plot->DrawGraph();
The next example uses the numeric value of each segment to label the segment. In addition, 'data' formatting is usedwith 2 digits of precision.

PHPlot Examples
200
<?php# PHPlot Example: Pie Chart Label Types - Formatted values as labels# This requires PHPlot >= 5.6.0require_once 'phplot.php';require_once 'pielabeltypedata.php'; // Defines $data and $title
$plot = new PHPlot(800, 600);$plot->SetImageBorderType('plain'); // Improves presentation in the manual$plot->SetPlotType('pie');$plot->SetDataType('text-data-single');$plot->SetDataValues($data);$plot->SetTitle($title);# Set label type: segment values, formatted with 2 decimal places$plot->SetPieLabelType('value', 'data', 2);$plot->DrawGraph();
In this example, we want to use strings from an external array to label the pie segments. To do that, set the labelsource to 'index' to get a segment number starting with zero, and define a custom formatting callback function to getthe value for each label.

PHPlot Examples
201
<?php# PHPlot Example: Pie Chart Label Types - Index and custom callback# This requires PHPlot >= 5.6.0require_once 'phplot.php';require_once 'pielabeltypedata.php'; // Defines $data and $title
$mylabels = array('A', 'B', 'C', 'D', 'E', 'F', 'G', 'H', 'I', 'J');function mycallback($index){ global $mylabels; return $mylabels[$index];}
$plot = new PHPlot(800, 600);$plot->SetImageBorderType('plain'); // Improves presentation in the manual$plot->SetPlotType('pie');$plot->SetDataType('text-data-single');$plot->SetDataValues($data);$plot->SetTitle($title);# Set label type: Pass segment index (0-N) to custom formating function$plot->SetPieLabelType('index', 'custom', 'mycallback');$plot->DrawGraph();
The last example of pie chart labels shows how to use multiple label sources to make complex labels. In this case,we want the pie segment labels to show the label string from the data array and the percentage. When multiple label

PHPlot Examples
202
sources are selected, PHPlot separates the fields with a space, then passes them to your custom formatting callbackfunction as a single string. In order to separate them, use the explode(). Since the data array labels might containspaces, be sure to put this field last, and limit how many fields explode will return.
<?php# PHPlot Example: Pie Chart Label Types - Multi-part labels# This requires PHPlot >= 5.6.0require_once 'phplot.php';require_once 'pielabeltypedata.php'; // Defines $data and $title
function mycallback($str){ list($percent, $label) = explode(' ', $str, 2); return sprintf('%s (%.1f%%)', $label, $percent);}
$plot = new PHPlot(800, 600);$plot->SetImageBorderType('plain'); // Improves presentation in the manual$plot->SetPlotType('pie');$plot->SetDataType('text-data-single');$plot->SetDataValues($data);$plot->SetTitle($title);# Set label type: combine 2 fields and pass to custom formatting function$plot->SetPieLabelType(array('percent', 'label'), 'custom', 'mycallback');$plot->DrawGraph();
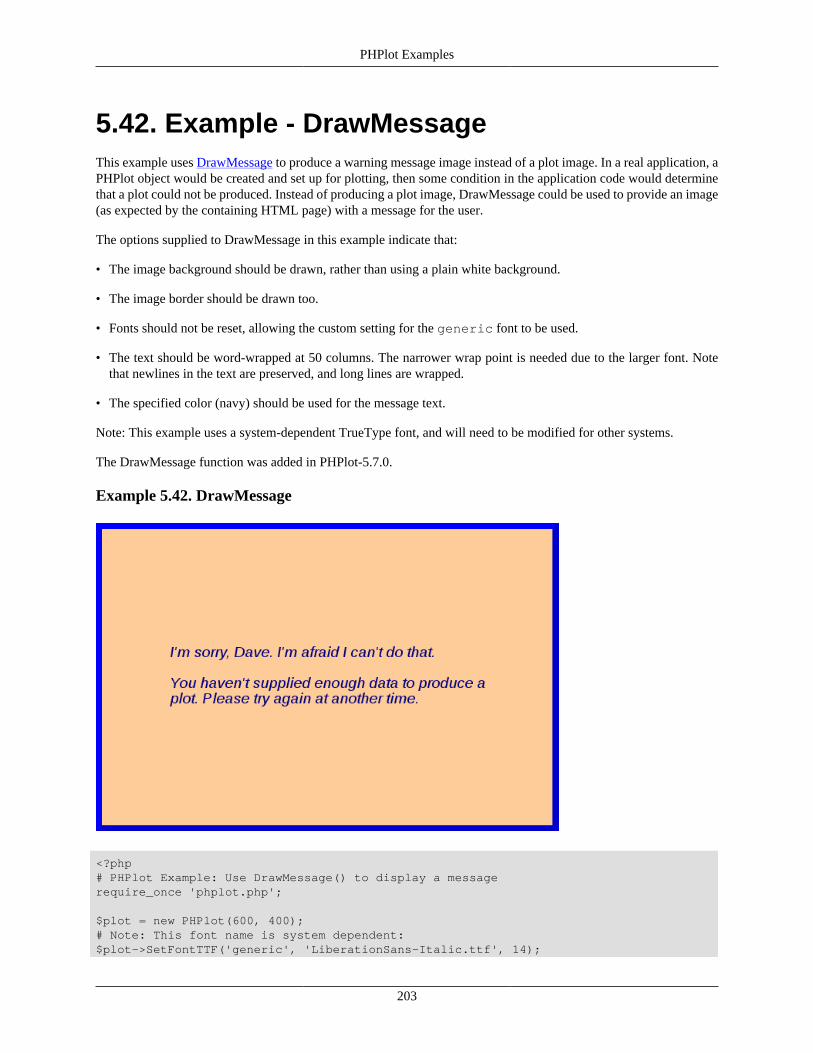
PHPlot Examples
203
5.42. Example - DrawMessageThis example uses DrawMessage to produce a warning message image instead of a plot image. In a real application, aPHPlot object would be created and set up for plotting, then some condition in the application code would determinethat a plot could not be produced. Instead of producing a plot image, DrawMessage could be used to provide an image(as expected by the containing HTML page) with a message for the user.
The options supplied to DrawMessage in this example indicate that:
• The image background should be drawn, rather than using a plain white background.
• The image border should be drawn too.
• Fonts should not be reset, allowing the custom setting for the generic font to be used.
• The text should be word-wrapped at 50 columns. The narrower wrap point is needed due to the larger font. Notethat newlines in the text are preserved, and long lines are wrapped.
• The specified color (navy) should be used for the message text.
Note: This example uses a system-dependent TrueType font, and will need to be modified for other systems.
The DrawMessage function was added in PHPlot-5.7.0.
Example 5.42. DrawMessage
<?php# PHPlot Example: Use DrawMessage() to display a messagerequire_once 'phplot.php';
$plot = new PHPlot(600, 400);# Note: This font name is system dependent:$plot->SetFontTTF('generic', 'LiberationSans-Italic.ttf', 14);

PHPlot Examples
204
$plot->SetBackgroundColor('#ffcc99');$plot->SetImageBorderWidth(8);$plot->SetImageBorderColor('blue');$plot->SetImageBorderType('raised');## Here you would start to produce the plot, then detect something wrong ...#$message = "I'm sorry, Dave. I'm afraid I can't do that.\n" . "\n" . "You haven't supplied enough data to produce a plot. " . "Please try again at another time.";$plot->DrawMessage($message, array( 'draw_background' => TRUE, 'draw_border' => TRUE, 'reset_font' => FALSE, 'wrap_width' => 50, 'text_color' => 'navy'));
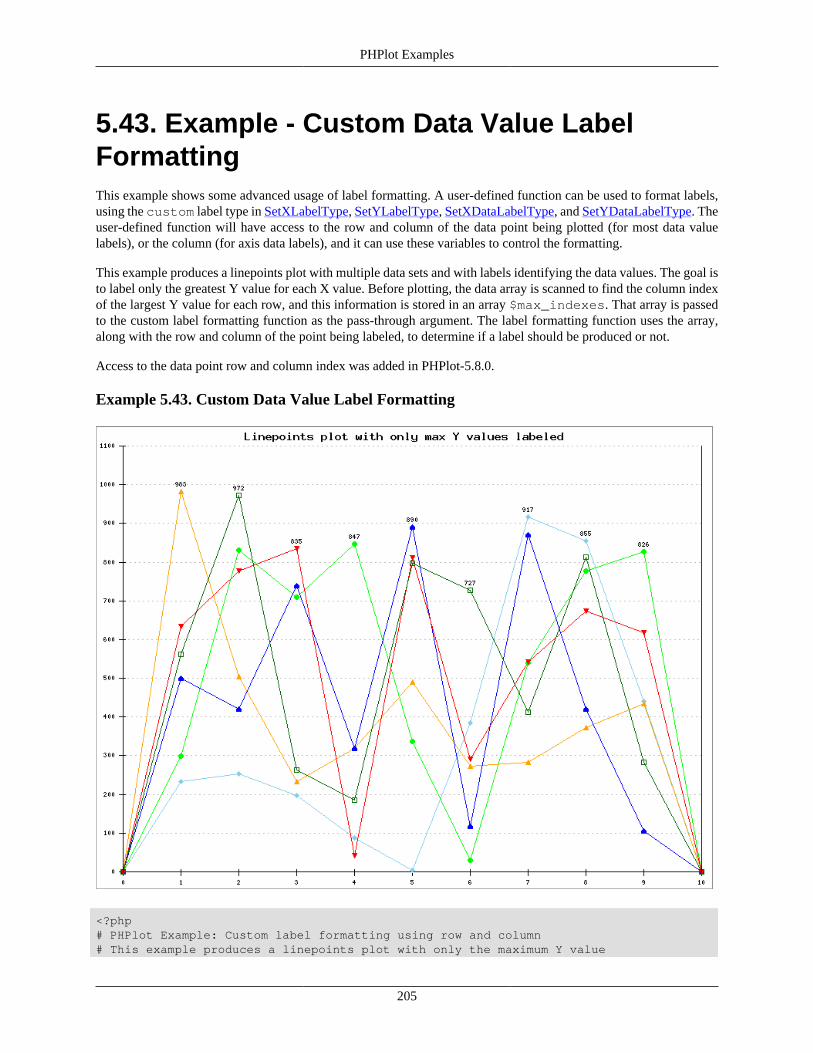
PHPlot Examples
205
5.43. Example - Custom Data Value LabelFormattingThis example shows some advanced usage of label formatting. A user-defined function can be used to format labels,using the custom label type in SetXLabelType, SetYLabelType, SetXDataLabelType, and SetYDataLabelType. Theuser-defined function will have access to the row and column of the data point being plotted (for most data valuelabels), or the column (for axis data labels), and it can use these variables to control the formatting.
This example produces a linepoints plot with multiple data sets and with labels identifying the data values. The goal isto label only the greatest Y value for each X value. Before plotting, the data array is scanned to find the column indexof the largest Y value for each row, and this information is stored in an array $max_indexes. That array is passedto the custom label formatting function as the pass-through argument. The label formatting function uses the array,along with the row and column of the point being labeled, to determine if a label should be produced or not.
Access to the data point row and column index was added in PHPlot-5.8.0.
Example 5.43. Custom Data Value Label Formatting
<?php# PHPlot Example: Custom label formatting using row and column# This example produces a linepoints plot with only the maximum Y value

PHPlot Examples
206
# for each X value labeled. This is an example of a custom label# formatting with access to the data array position.# This requires PHPlot > 5.7.0require_once 'phplot.php';
# Build a data array. The values are psuedo-random integers, but the first# and last rows have all Y=0. Return the completed data array.function make_data_array($n_rows, $n_y_per_row){ mt_srand(10); // For repeatable results $data[0] = array('', 0) + array_fill(2, $n_y_per_row, 0); for ($i = 1; $i < $n_rows - 1; $i++) { $row = array('', $i); for ($j = 0; $j < $n_y_per_row; $j++) $row[] = mt_rand(0, 999); $data[] = $row; } if ($n_rows > 1) $data[] = array('', $n_rows - 1) + array_fill(2, $n_y_per_row, 0); return $data;}
# Find the index of the largest Y for each X in the data array.# Build an array $max_indexes such that $max_indexes[$row]=$column means# the $column-th Y value is the largest in row $row (where $row and $column# are zero-based). However, if max Y<=0 in the row, mark this with $column=-1# to prevent labeling. Returns the array $max_indexes.function find_max_indexes($data){ $max_indexes = array(); foreach ($data as $row) { $max_index = 0; $max_y = $row[2]; // Skip label and X value // Process remaining values in the row: for ($j = 3; $j < count($row); $j++) { if ($row[$j] > $max_y) { $max_y = $row[$j]; $max_index = $j - 2; // Offset by 2 for label and X value } } if ($max_y <= 0) $max_index = -1; // Will suppress the label $max_indexes[] = $max_index; } return $max_indexes;}
# Custom label formatting function: Return an empty string, unless this is# the largest value in the row.function fmt_label($value, $maxes, $row, $column){ if ($maxes[$row] == $column) return $value; return "";}
# Get the data array with 11 rows, 6 values per row:$data = make_data_array(11, 6);# Process the data array to find the largest Y per row:$max_indexes = find_max_indexes($data);
# Now plot the data:$plot = new PHPlot(800, 600);

PHPlot Examples
207
$plot->SetImageBorderType('plain'); // For presentation in the manual$plot->SetPlotType('linepoints');$plot->SetDataType('data-data');$plot->SetDataValues($data);$plot->SetTitle('Linepoints plot with only max Y values labeled');$plot->SetYDataLabelPos('plotin');$plot->SetYDataLabelType('custom', 'fmt_label', $max_indexes);$plot->SetLineStyles('solid');$plot->SetYTickIncrement(100);$plot->DrawGraph();

PHPlot Examples
208
5.44. Example - Image Map from Bar ChartThis example produces an HTML page with an embedded image containing a bar chart, and an image map. The imagemap makes the bars in the bar chart into hotlinks. In this example, tool-tip float-over text identifies the bars and groups,and clicking on a bar displays the same text in an alert popup. These looks could be used instead to link to anotherweb page, display data in a popup window, etc.
See Section 4.10, “Image Maps for Plot Data” for more information on image maps. This capability was added inPHPlot-5.7.0. See EncodeImage for more on embedding plot images within an HTML page.
Example 5.44. Image Map from Bar Chart (Browser screenshot)
<?php# PHPlot example: Bar chart, embedded image with image maprequire_once 'phplot.php';
# This global string accumulates the image map AREA tags.$image_map = "";
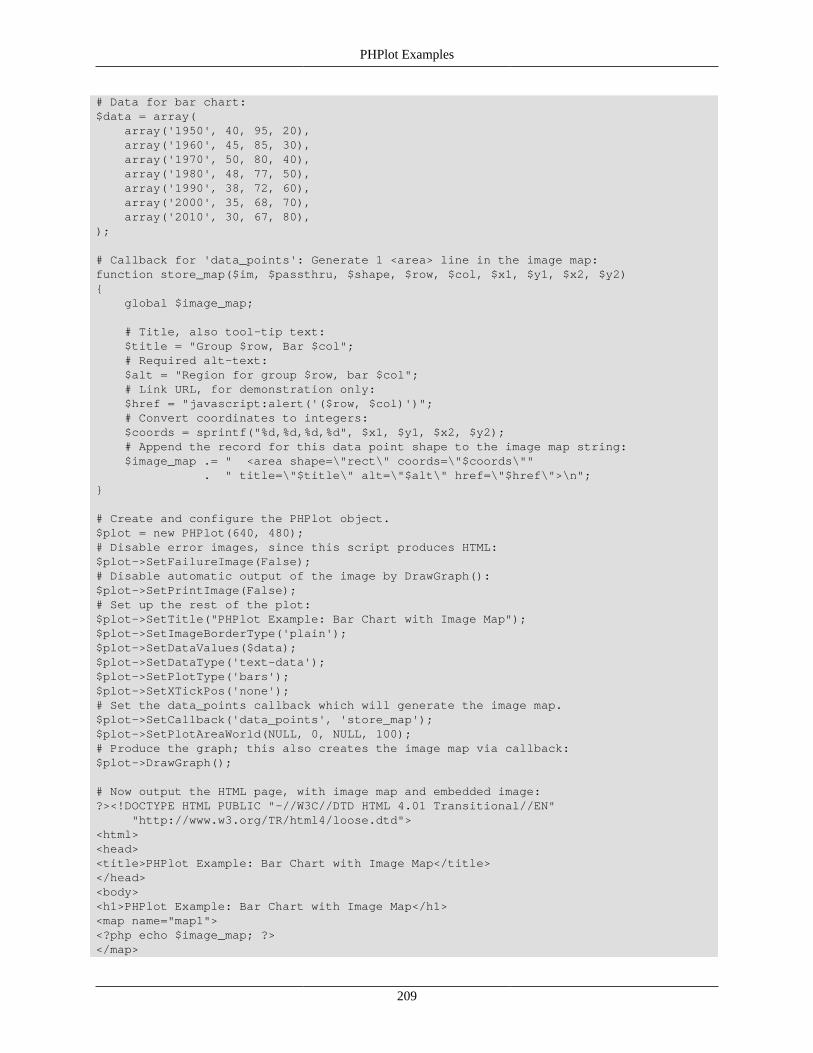
PHPlot Examples
209
# Data for bar chart:$data = array( array('1950', 40, 95, 20), array('1960', 45, 85, 30), array('1970', 50, 80, 40), array('1980', 48, 77, 50), array('1990', 38, 72, 60), array('2000', 35, 68, 70), array('2010', 30, 67, 80),);
# Callback for 'data_points': Generate 1 <area> line in the image map:function store_map($im, $passthru, $shape, $row, $col, $x1, $y1, $x2, $y2){ global $image_map;
# Title, also tool-tip text: $title = "Group $row, Bar $col"; # Required alt-text: $alt = "Region for group $row, bar $col"; # Link URL, for demonstration only: $href = "javascript:alert('($row, $col)')"; # Convert coordinates to integers: $coords = sprintf("%d,%d,%d,%d", $x1, $y1, $x2, $y2); # Append the record for this data point shape to the image map string: $image_map .= " <area shape=\"rect\" coords=\"$coords\"" . " title=\"$title\" alt=\"$alt\" href=\"$href\">\n";}
# Create and configure the PHPlot object.$plot = new PHPlot(640, 480);# Disable error images, since this script produces HTML:$plot->SetFailureImage(False);# Disable automatic output of the image by DrawGraph():$plot->SetPrintImage(False);# Set up the rest of the plot:$plot->SetTitle("PHPlot Example: Bar Chart with Image Map");$plot->SetImageBorderType('plain');$plot->SetDataValues($data);$plot->SetDataType('text-data');$plot->SetPlotType('bars');$plot->SetXTickPos('none');# Set the data_points callback which will generate the image map.$plot->SetCallback('data_points', 'store_map');$plot->SetPlotAreaWorld(NULL, 0, NULL, 100);# Produce the graph; this also creates the image map via callback:$plot->DrawGraph();
# Now output the HTML page, with image map and embedded image:?><!DOCTYPE HTML PUBLIC "-//W3C//DTD HTML 4.01 Transitional//EN" "http://www.w3.org/TR/html4/loose.dtd"><html><head><title>PHPlot Example: Bar Chart with Image Map</title></head><body><h1>PHPlot Example: Bar Chart with Image Map</h1><map name="map1"><?php echo $image_map; ?></map>

PHPlot Examples
210
<p>This is a plot with image map and tooltip text.</p><img src="<?php echo $plot->EncodeImage();?>" alt="Plot Image" usemap="#map1"></body></html>

PHPlot Examples
211
5.45. Example - Image Map from Pie ChartThis example produces an HTML page with an embedded image containing a pie chart, and an image map. The imagemap makes the pie sectors in the chart into hotlinks. In this example, tool-tip text identifies the segment number andits numeric value, and clicking on a pie segment displays the same text in an alert popup. These looks could be usedinstead to link to another web page, display data in a popup window, etc.
This example also shows getting access to the data values. The callback handler accesses the data array to get thecurrent segment value and uses that in the tool-tip text and alert box. This is dependent on the data type of the array,and the code shown here only works with data type text-data-single.
Unlike the previous example with a bar chart, in this example the callback function needs to do some more significantcalculations in order to produce the image map areas. This is because HTML image maps do not directly support anyarea shape which corresponds to a pie chart segment. Therefore the callback function approximates each pie chartsegment with a polygon. This is explained in the code shown below.
See Section 4.10, “Image Maps for Plot Data” for more information on image maps. This capability was added inPHPlot-5.7.0. See EncodeImage for more on embedding plot images within an HTML page.

PHPlot Examples
212
Example 5.45. Image Map from Pie Chart (Browser screenshot)
<?php# PHPlot example: Pie chart, embedded image with image maprequire_once 'phplot.php';
# This global string accumulates the image map AREA tags.$image_map = "";
# Data for pie chart:$data = array( array('', 20), array('', 30), array('', 10), array('', 40), array('', 10),);
/*

PHPlot Examples
213
Callback handler for generating an image map for a pie chart.
NOTE: The code in this function is excluded from the license terms for PHPlot, the PHPlot Reference Manual, and the PHPlot Test Suite. You may freely copy, use, modify, and redistribute the code in this function. Attribution is not necessary. Or, to put it another way, I am placing this function in the public domain.
Arguments: $im, $passthru : standard arguments for all callbacks. $shape : always 'pie' $segment : 0 for the first pie segment, 1 for the next, etc. $xc, $yc : Center of the pie, in device coordinates $wd, $ht : Pie diameters - width (horizontal), height (vertical) $start_angle, $end_angle : Segment arc angles, in degrees, offset from 360. That is, the values are (360-A) for angle A. This is the way PHPlot processes the angles for the GD function imagefilledarc(). Note that sin(360-A) = -sin(A); and cos(360-A) = cos(A). Since the Y axis (sin) is reversed in device, or image, coordinates with Y=0 at the top, this works out correctly.
Method used: Approximate a pie segment using a polygon. Note the pie is not necessarilycircular, but is an ellipse. + The 1st point is the pie center. + The 2nd point is on the circumference*, at the start angle. + The last point is on the circumference*, at the end angle. + In between the 2nd and last point are N>=0 additional points on thecircumference*, spaced no more than 20 degrees apart. (20 is chosen bytrial and error for a reasonable fit.) So small segments will be approximatedby a single triangle. Larger segments will have more vertices.
*Note: These points are actually slightly outside the circumference.This is done by increasing the two radius values by a small amount (2 pixels).This produces a better fit, for the case where we want to make sure all theinterior is covered, even if some of the exterior is also included. (Usingthe actual radii would result in the area omitting a small part of the pieinterior. For an image map, this would result in dead spaces.)
The segment subdivisions are made to have about equal angles. This resultsin a closer fit. For example, with a maximum sub-segment arc of 20 degrees,and a segment of 24 degrees, we make two 12 degree sub-segments rather than a20 degree and a 4 degree.
Note: Web image map coordinates have 0,0 in upper left, so Y is reversed.
The pass-through argument gets the data array. This is used to include thepie segment value in the URL and/or tooltip. This will only work with datatype text-data-single, where array values map 1:1 to segment values.*/function store_map($im, $data, $shape, $segment, $unused, $xc, $yc, $wd, $ht, $start_angle, $end_angle){ global $image_map;
# Choose the largest step_angle <= 20 degrees that divides the segment # into equal parts. (20 degrees is chosen as a threshold.) # Note start_angle > end_angle due to reversal (360-A) of arguments. $arc_angle = $start_angle - $end_angle; $n_steps = (int)ceil($arc_angle / 20);
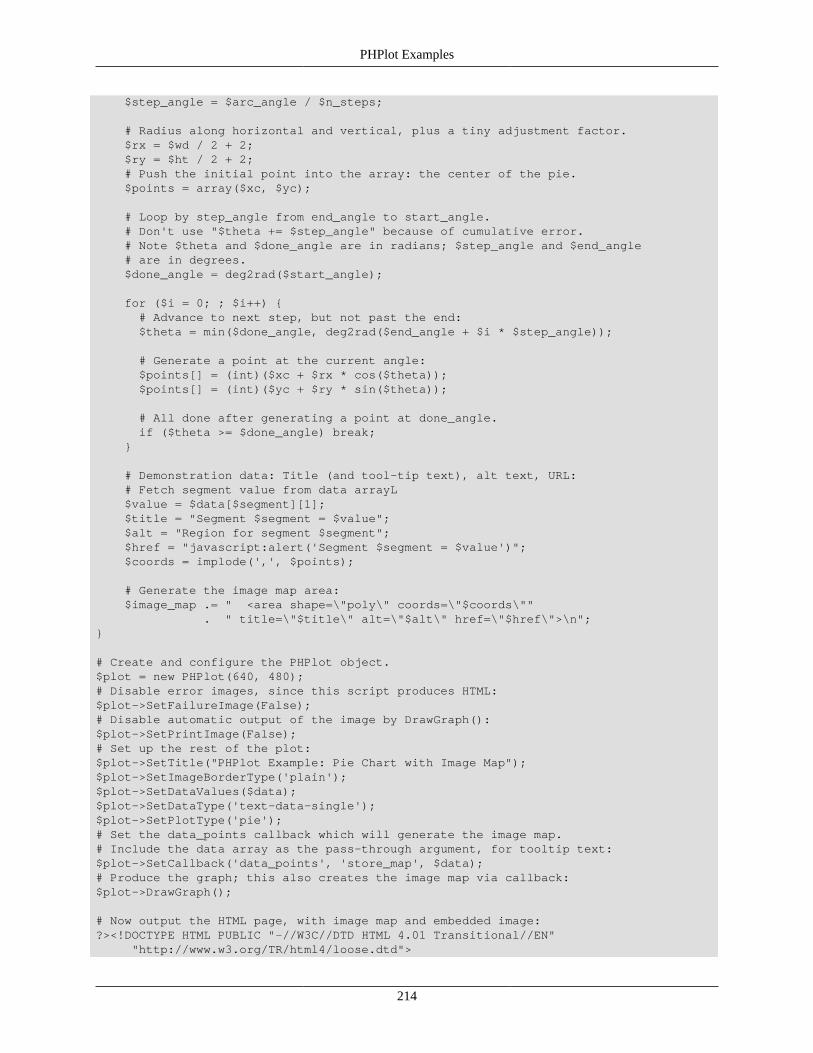
PHPlot Examples
214
$step_angle = $arc_angle / $n_steps;
# Radius along horizontal and vertical, plus a tiny adjustment factor. $rx = $wd / 2 + 2; $ry = $ht / 2 + 2; # Push the initial point into the array: the center of the pie. $points = array($xc, $yc);
# Loop by step_angle from end_angle to start_angle. # Don't use "$theta += $step_angle" because of cumulative error. # Note $theta and $done_angle are in radians; $step_angle and $end_angle # are in degrees. $done_angle = deg2rad($start_angle);
for ($i = 0; ; $i++) { # Advance to next step, but not past the end: $theta = min($done_angle, deg2rad($end_angle + $i * $step_angle));
# Generate a point at the current angle: $points[] = (int)($xc + $rx * cos($theta)); $points[] = (int)($yc + $ry * sin($theta));
# All done after generating a point at done_angle. if ($theta >= $done_angle) break; }
# Demonstration data: Title (and tool-tip text), alt text, URL: # Fetch segment value from data arrayL $value = $data[$segment][1]; $title = "Segment $segment = $value"; $alt = "Region for segment $segment"; $href = "javascript:alert('Segment $segment = $value')"; $coords = implode(',', $points);
# Generate the image map area: $image_map .= " <area shape=\"poly\" coords=\"$coords\"" . " title=\"$title\" alt=\"$alt\" href=\"$href\">\n";}
# Create and configure the PHPlot object.$plot = new PHPlot(640, 480);# Disable error images, since this script produces HTML:$plot->SetFailureImage(False);# Disable automatic output of the image by DrawGraph():$plot->SetPrintImage(False);# Set up the rest of the plot:$plot->SetTitle("PHPlot Example: Pie Chart with Image Map");$plot->SetImageBorderType('plain');$plot->SetDataValues($data);$plot->SetDataType('text-data-single');$plot->SetPlotType('pie');# Set the data_points callback which will generate the image map.# Include the data array as the pass-through argument, for tooltip text:$plot->SetCallback('data_points', 'store_map', $data);# Produce the graph; this also creates the image map via callback:$plot->DrawGraph();
# Now output the HTML page, with image map and embedded image:?><!DOCTYPE HTML PUBLIC "-//W3C//DTD HTML 4.01 Transitional//EN" "http://www.w3.org/TR/html4/loose.dtd">
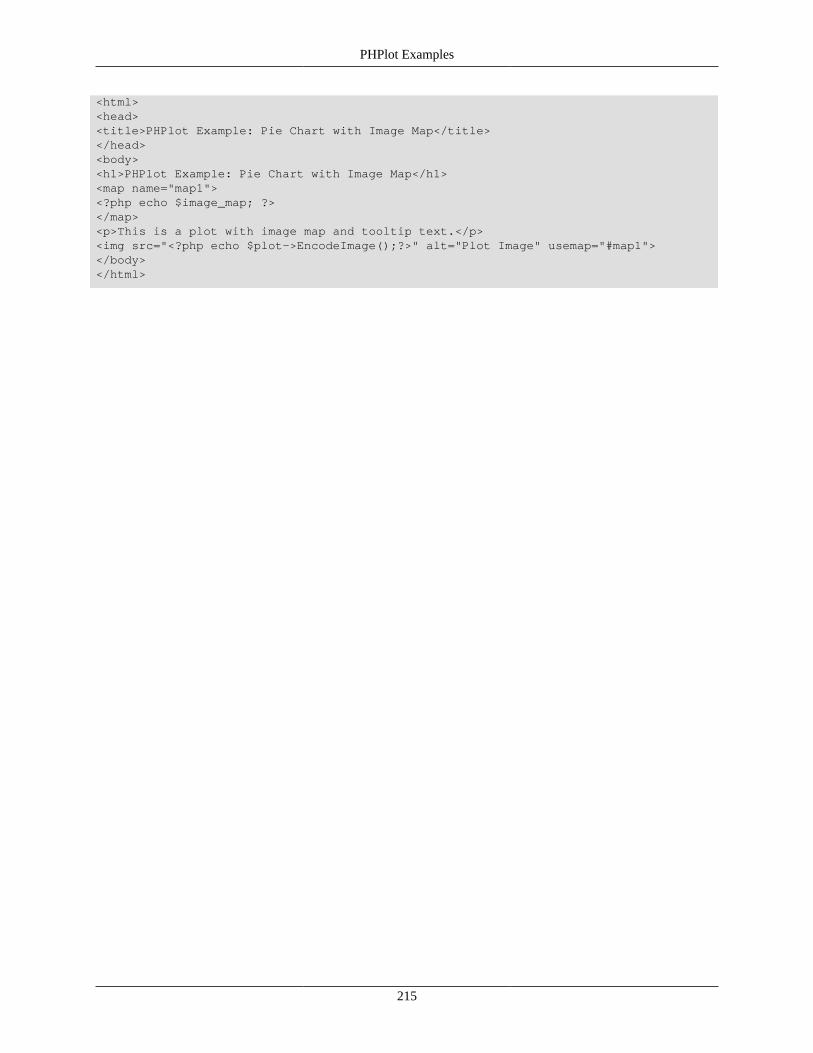
PHPlot Examples
215
<html><head><title>PHPlot Example: Pie Chart with Image Map</title></head><body><h1>PHPlot Example: Pie Chart with Image Map</h1><map name="map1"><?php echo $image_map; ?></map><p>This is a plot with image map and tooltip text.</p><img src="<?php echo $plot->EncodeImage();?>" alt="Plot Image" usemap="#map1"></body></html>

PHPlot Examples
216
5.46. Example - Image Map and Non-embeddedPlot ImageThis the complete example described in Section 4.10.4, “Image Maps with Non-embedded Image Data”. It shows thatimage maps can also be produced when using PHPlot without using embedded ("data-URL") images. The down-sideis that the script must run and process the plot data twice - once to create the HTML page with the image map, andonce to create the plot image.
Example 5.46. Image Map and Non-embedded Plot Image (Browser screenshot)
<?php# $Id: imagemapnonembed.php 1560 2013-03-27 20:22:36Z lbayuk $# PHPlot example: Image Map and Non-embedded Plot Image
PHPlot Examples
217
# This scripts creates a PHPlot plot image and an image map, without using# embedded (data-url) images. The down-side is that this script has to # run twice, and generate the plot twice: once for the HTML wrapper page# with image map, and once to create the actual image.# This takes a 'mode' CGI parameter (HTTP GET) and generates a plot# if mode=plot, and an HTML page and image map otherwise.# Note: The image map links just produce popup (Javascript alert) messages,# for demonstration purposes.require_once 'phplot.php';
# This global string accumulates the image map AREA tags.$image_map = "";
# Data for bar chart:$data = array( array('1980', 13, 21, 8, 24, 10, 19), array('1990', 14, 19, 6, 26, 11, 13), array('2000', 11, 13, 8, 15, 9, 11), array('2010', 13, 16, 9, 21, 12, 13),);$legend = array('US', 'AL', 'CT', 'MS', 'PA', 'SD');
# Produce an image if the URL has mode=plot, and an HTML page otherwise:$do_html = empty($_GET['mode']) || $_GET['mode'] != 'plot';
# Callback for 'data_points' : Generate 1 line in the image map.function store_map($im, $data, $shape, $row, $col, $x1, $y1, $x2, $y2){ global $image_map; if ($shape != 'rect') die("Error expecting rect shapes from plot\n"); # Get the data point value. (Offset column by 1 to skip label) $value = $data[$row][$col+1]; # See top note: URL for demonstration purposes. $message = "Data value: $value"; $url = "javascript:alert('$message')"; # Convert coords to integers: $coords = sprintf("%d,%d,%d,%d", $x1, $y1, $x2, $y2); # Area alt text (required attribute): $alt = "Region for Group $row bar $col"; # Area title text, which is displayed as the tool-tip: $title = "Group $row bar $col";
# Append one line to the image map: $image_map .= " <area shape=\"rect\" coords=\"$coords\"" . " title=\"$title\" alt=\"$alt\" href=\"$url\">\n";}
# Produce an HTML page which includes the image map and the reference# to the plot image. The plot image is generated by this same script,# with a mode=plot URL parameter.function generate_html(){ global $image_map;
# Self-referencing URL for <img>, with additional mode=plot parameter. # If the URL already has parameters, use & separator, else ?. $sep = empty($_SERVER['QUERY_STRING']) ? '?' : '&'; $url = htmlspecialchars($_SERVER['REQUEST_URI'] . $sep . 'mode=plot');
echo <<<END

PHPlot Examples
218
<!DOCTYPE HTML PUBLIC "-//W3C//DTD HTML 4.01 Transitional//EN" "http://www.w3.org/TR/html4/loose.dtd"><html><head><title>PHPlot Example - Image Map and Non-embedded Plot Image</title></head><body><h1>PHPlot Example: Bar Chart with image map, non-embedded</h1><p>This example uses a single PHP script to generate both a container HTML pagewith image map, and the plot image itself. The image map is used toproduce tool-tip text for the plot image. The script is called twice.</p><map name="map1">$image_map</map><p>If you are viewing this image 'live', via a web server, you can float yourcursor over a bar to see the tooltip text, and click to get an alert popupcontaining the data value. (This will not work if you are viewing theexample in the reference manual.)</p><img src="$url" alt="Plot image" usemap="#map1"></body></html>
END;}
$plot = new PHPlot(640, 480);if ($do_html) { # When producing HTML, don't output the plot image: $plot->SetPrintImage(False); # Just to make it clear, this script usage returns HTML: header("Content-type: text/html"); # The image map callback is only needed when doing the HTML page. # Pass the data array so the callback can fetch values from it. $plot->SetCallback('data_points', 'store_map', $data);}$plot->SetTitle("PHPlot Example: Image Map and Non-embedded Plot");$plot->SetImageBorderType('plain');$plot->SetDataValues($data);$plot->SetDataType('text-data');$plot->SetPlotType('bars');$plot->SetXTickPos('none');$plot->SetPlotAreaWorld(NULL, 0, NULL, 30);$plot->SetLegend($legend);$plot->DrawGraph();if ($do_html) generate_html();

PHPlot Examples
219
5.47. Example - Pie Chart Start Angle andDirectionThis example shows the use of SetPieStartAngle and SetPieDirection to set the starting angle for the first segment ina pie chart, and the direction of the segments (clockwise or counter-clockwise). Note that the ability to change thestarting angle and segment direction was added to PHPlot-6.0.0.
In each of the 8 plots, the pie segments are numbered from 0, with segment 0 being the first entry in the data array.The upper-left plot represents the default, and the only available option before PHPlot-6.0.0, with counter-clockwisepie segments starting at 0 degrees.
Example 5.47. Pie Chart Start Angle and Direction
<?php# PHPlot Example: Pie chart with varying start angle and direction# Note: This requires PHPlot-6.0.0 or higher.require_once 'phplot.php';
$pie_slices = 6;$base_angle = 0;

PHPlot Examples
220
# This callback is used to label each plot with a title.# The x_title font is set below and used here.function draw_plot_title($img, $args){ list($plot, $x, $y, $title) = $args; $text_color = imagecolorresolve($img, 0, 0, 0); $plot->DrawText('x_title', 0, $x, $y, $text_color, $title, 'center', 'top');}
# Produce one plot tilefunction draw_plot($plot, $start_angle, $direction, $xbase, $ybase){ $plot->SetPieStartAngle($start_angle); $plot->SetPieDirection($direction); $plot->SetPlotAreaPixels($xbase, $ybase, $xbase + 200, $ybase + 200); $title = "Start @{$start_angle}d $direction"; $plot->SetCallback('draw_all', 'draw_plot_title', array($plot, $xbase + 100, $ybase + 200, $title)); $plot->DrawGraph();}
# Make a data array with equal-size slices:$data = array_fill(0, $pie_slices, array('', 1));
$plot = new PHPlot(800, 600);$plot->SetDataValues($data);$plot->SetDataType('text-data-single');$plot->SetPlotType('pie');$plot->SetShading(0);$plot->SetImageBorderType('plain');$plot->SetPrintImage(False);$plot->SetTitle("Pie Chart - Vary Start Angle and Direction\n" . "(CW = Clockwise, CCW = Counter-clockwise)");
# Configure pie labels: Show sector index, inside the pie, in a large font.$plot->SetPieLabelType('index');$plot->SetLabelScalePosition(0.25);# Use the default TrueType font at 36 points.$plot->SetFontTTF('generic', '', 36);
# This font is used by the callback to label each plot:# Use the default TrueType font at 16 points.$plot->SetFontTTF('x_title', '', 16); // Use the default TTF font at 16 pts
# Draw the plot tiles:draw_plot($plot, $base_angle + 0, 'CCW', 0, 50);draw_plot($plot, $base_angle + 90, 'CCW', 200, 50);draw_plot($plot, $base_angle + 180, 'CCW', 400, 50);draw_plot($plot, $base_angle + 270, 'CCW', 600, 50);
draw_plot($plot, $base_angle + 0, 'CW', 0, 300);draw_plot($plot, $base_angle + 90, 'CW', 200, 300);draw_plot($plot, $base_angle + 180, 'CW', 400, 300);draw_plot($plot, $base_angle + 270, 'CW', 600, 300);
# Done:$plot->PrintImage();
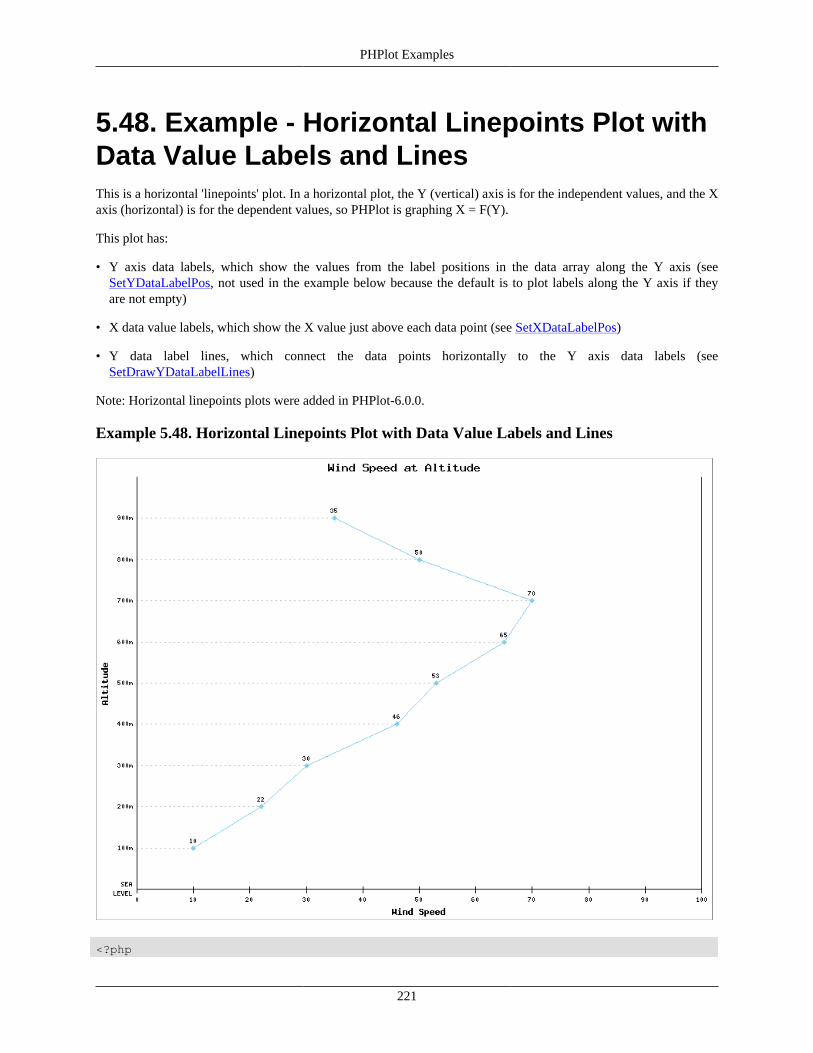
PHPlot Examples
221
5.48. Example - Horizontal Linepoints Plot withData Value Labels and LinesThis is a horizontal 'linepoints' plot. In a horizontal plot, the Y (vertical) axis is for the independent values, and the Xaxis (horizontal) is for the dependent values, so PHPlot is graphing X = F(Y).
This plot has:
• Y axis data labels, which show the values from the label positions in the data array along the Y axis (seeSetYDataLabelPos, not used in the example below because the default is to plot labels along the Y axis if theyare not empty)
• X data value labels, which show the X value just above each data point (see SetXDataLabelPos)
• Y data label lines, which connect the data points horizontally to the Y axis data labels (seeSetDrawYDataLabelLines)
Note: Horizontal linepoints plots were added in PHPlot-6.0.0.
Example 5.48. Horizontal Linepoints Plot with Data Value Labels and Lines
<?php

PHPlot Examples
222
# PHPlot Example - Horizontal linepoints plot with Y Data Label Linesrequire_once 'phplot.php';
$data = array( array("SEA\nLEVEL", 0, ''), array('100m', 1, 10), array('200m', 2, 22), array('300m', 3, 30), array('400m', 4, 46), array('500m', 5, 53), array('600m', 6, 65), array('700m', 7, 70), array('800m', 8, 50), array('900m', 9, 35), );
$plot = new PHPlot(800, 600);$plot->SetImageBorderType('plain'); // Improves presentation in the manual$plot->SetTitle('Wind Speed at Altitude');$plot->SetDataType('data-data-yx');$plot->SetDataValues($data);$plot->SetPlotType('linepoints');$plot->SetPlotAreaWorld(0, 0, 100, 10);$plot->SetDrawYDataLabelLines(True);$plot->SetXTitle('Wind Speed');$plot->SetYTitle('Altitude');$plot->SetYTickLabelPos('none');$plot->SetYTickPos('none');$plot->SetXDataLabelPos('plotin');$plot->SetDrawXGrid(False);$plot->SetDrawYGrid(False);$plot->DrawGraph();

PHPlot Examples
223
5.49. Example - Horizontal Error PlotThis is a horizontal error plot, showing a series of measurements as a 'points' plot, with error bars. In a horizontal plot,the Y (vertical) axis is for the independent values, and the X axis (horizontal) is for the dependent values.
Note: Horizontal error plots were added in PHPlot-6.1.0.
Example 5.49. Horizontal Error Plot
<?php# PHPlot Example - Horizontal Error Plotrequire_once 'phplot.php';
# The experimental results as a series of temperature measurements:$results = array(98, 102, 100, 103, 101, 105, 110, 108, 109);# The accuracy of our measuring equipment is +/- 5%$error_factor = 0.05;
# Convert the experimental results to a PHPlot data array for error plots.function reduce_data($results, $error_factor){ # Use the average of measurements to approximate the error amount: $err = $error_factor * array_sum($results) / count($results);

PHPlot Examples
224
# Build the 'data-data-yx-error' data array: $data = array(); $i = 1; foreach ($results as $value) { $data[] = array("Sample $i", $i++, $value, $err, $err); } return $data;}
$plot = new PHPlot(800, 600);$plot->SetTitle('Experiment Results');$plot->SetXTitle('Melting Temperature (degrees C)');$plot->SetDataValues(reduce_data($results, $error_factor));$plot->SetDataType('data-data-yx-error');$plot->SetPlotType('points');$plot->SetYTickPos('none');$plot->SetImageBorderType('plain'); // Improves presentation in the manual$plot->SetPlotAreaWorld(80);$plot->DrawGraph();

PHPlot Examples
225
5.50. Example - Box Plot with Data ReductionThis is a box plot (plot type boxes), without outliers. This example also shows how a PHP function might be used tocreate a PHPlot data array from experimental results. The input data is a series of lists of test results, and the output isa PHPlot data array for a box plot, with rows in the form (label, Ymin, YQ1, Ymid, YQ3, Ymax).
Note: Box plots were added in PHPlot-6.1.0.
Example 5.50. Box Plot with Data Reduction
<?php# PHPlot Example - Box Plot (without outliers)require_once 'phplot.php';
# The experimental results:$results = array( 'Material A1' => array(11.1, 8.4, 11.9, 13, 10.2, 9.2), 'Material A2' => array(10.6, 9.8, 9.1, 12, 8.5, 7.1, 8.2, 7.8, 11.8), 'Material B1' => array(9.9, 11.2, 10.9, 12.9, 8.5), 'Material C1' =>

PHPlot Examples
226
array(10.1, 11.8, 11.6, 8.5, 9.6, 12, 12, 8.9, 12.7, 10.3, 11.1), 'Material C2' => array(10.9, 11.9, 7.3, 11.7, 12.6, 9.2, 10, 7, 7.1), 'Material C3' => array(11.9, 9.1, 10.5, 10.7, 10, 7.3, 10.1, 11.7, 10.4, 9), 'Material D1' => array(12, 8, 9.8, 11.4, 10.5, 12.5, 7.1, 8.6, 7.6, 7.4, 8.2, 7.1), 'Material E1' => array(10.6, 8.2, 8.2, 7.9, 12, 7, 9.3),);
# Return the k-th percentile value of a sorted array, where 0 <= $k <= 1# If there is no single value, return the average of the two adjacent ones.# Caution: Don't copy this code. It may not be valid, but suits the example.function kpercentile($row, $k){ $n = count($row); $p = $k * ($n - 1); if ($p == (int)($p)) return $row[$p]; return ($row[(int)$p] + $row[(int)($p+1)]) / 2;}
# Convert the experimental results to a PHPlot data array.function reduce_data($results){ $data = array(); foreach ($results as $label => $row) { $n_samples = count($row); sort($row); $data[] = array("$label\n($n_samples Samples)", $row[0], // Minimum kpercentile($row, 0.25), // Q1 = 25% kpercentile($row, 0.50), // Median kpercentile($row, 0.75), // Q3 = 75% $row[$n_samples-1]); // Maximum } return $data;}
$plot = new PHPlot(800, 600);$plot->SetTitle('Box Plot (without outliers)');$plot->SetDataType('text-data');$plot->SetDataValues(reduce_data($results));$plot->SetPlotType('boxes');# These 2 lines make tick marks line up with text-data data points:$plot->SetXTickIncrement(1);$plot->SetXTickAnchor(0.5);$plot->SetImageBorderType('plain'); // Improves presentation in the manual$plot->DrawGraph();
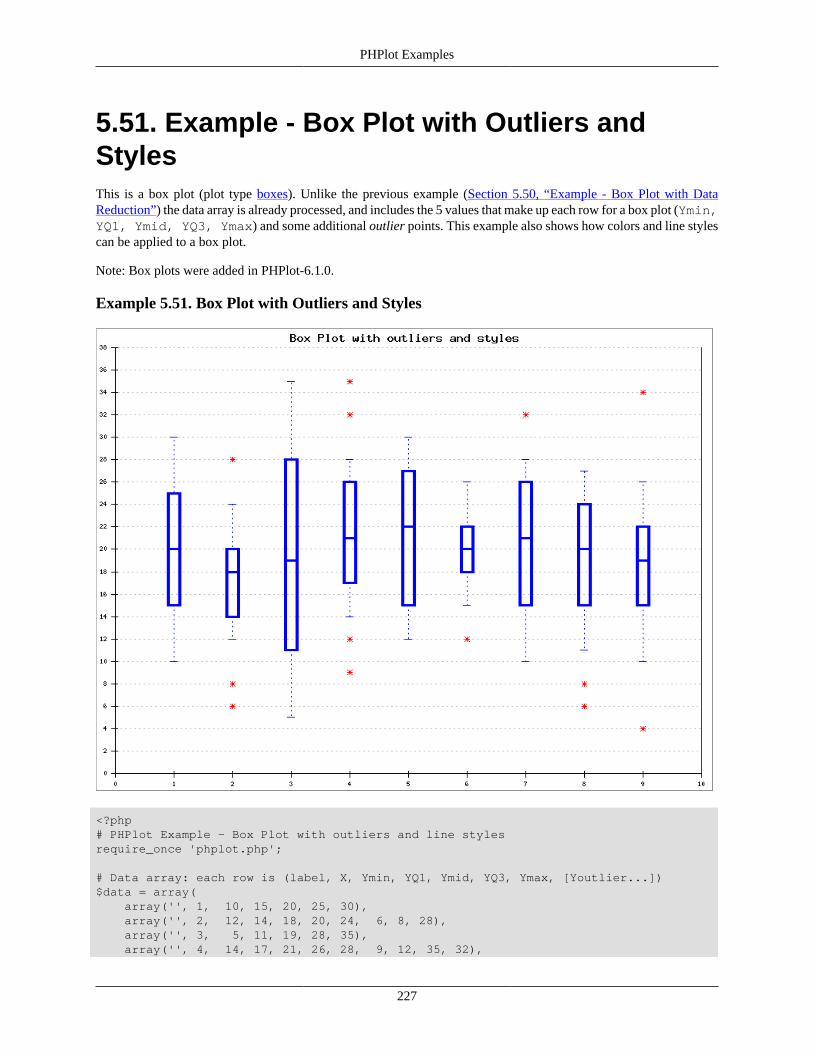
PHPlot Examples
227
5.51. Example - Box Plot with Outliers andStylesThis is a box plot (plot type boxes). Unlike the previous example (Section 5.50, “Example - Box Plot with DataReduction”) the data array is already processed, and includes the 5 values that make up each row for a box plot (Ymin,YQ1, Ymid, YQ3, Ymax) and some additional outlier points. This example also shows how colors and line stylescan be applied to a box plot.
Note: Box plots were added in PHPlot-6.1.0.
Example 5.51. Box Plot with Outliers and Styles
<?php# PHPlot Example - Box Plot with outliers and line stylesrequire_once 'phplot.php';
# Data array: each row is (label, X, Ymin, YQ1, Ymid, YQ3, Ymax, [Youtlier...])$data = array( array('', 1, 10, 15, 20, 25, 30), array('', 2, 12, 14, 18, 20, 24, 6, 8, 28), array('', 3, 5, 11, 19, 28, 35), array('', 4, 14, 17, 21, 26, 28, 9, 12, 35, 32),

PHPlot Examples
228
array('', 5, 12, 15, 22, 27, 30), array('', 6, 15, 18, 20, 22, 26, 12), array('', 7, 10, 15, 21, 26, 28, 32), array('', 8, 11, 15, 20, 24, 27, 6, 8), array('', 9, 10, 15, 19, 22, 26, 4, 34),);
$plot = new PHPlot(800, 600);$plot->SetTitle('Box Plot with outliers and styles');$plot->SetDataType('data-data');$plot->SetDataValues($data);$plot->SetPlotType('boxes');$plot->SetImageBorderType('plain'); // Improves presentation in the manual
# Use dashed lines for the upper and lower whiskers:$plot->SetLineStyles('dashed');# Make the box and belt use a thicker line:$plot->SetLineWidths(array(3, 3, 1));# Make the outliers red, and everything else blue:$plot->SetDataColors(array('blue', 'blue', 'red', 'blue'));# Draw the outliers using a "star":$plot->SetPointShapes('star');
$plot->DrawGraph();

PHPlot Examples
229
5.52. Example - Squared Area PlotThis is a squared area plot (plot type squaredarea). It is similar to the area) plot, but the data lines are stepped as inthe squared) plot.
Compare this image to the next example, Section 5.53, “Example - Stacked Squared Area Plot”, which uses the samedata but plots a stacked (or cumulative) plot. This unstacked plot shows the actual values for each country (which canbe read on the Y axis scale) but only if they are visible. For instance, in 2007 the amount for Venezuela (dark blue)is a little more than the amount for Nigeria (red). But in 2002-2003, the amounts for Canada (light blue) are less thanthe next two countries, which results in the Canada values being covered by the others and not visible.
In the script below, a copy of the last data row is appended to the data array. This is usually necessary with thesquaredarea plot if you want the last data set to be visible. For an explanation, see description of the squaredarea plottype.
Note: Squared Area plots were added in PHPlot-6.2.0.
Example 5.52. Squared Area Plot
<?php# PHPlot Example: Squared Area plotrequire_once 'phplot.php';

PHPlot Examples
230
$title = "US Oil Imports by Country, Top 5\n" . "Non-cumulative (unstacked) Data";
$countries = array( 'Canada', 'Saudi Arabia', 'Mexico', 'Venezuela', 'Nigeria',# -------- -------------- -------- ----------- ---------);$data = array( array('2002', 1445, 1519, 1500, 1201, 589), array('2003', 1549, 1726, 1569, 1183, 832), array('2004', 1616, 1495, 1598, 1297, 1078), array('2005', 1633, 1445, 1556, 1241, 1077), array('2006', 1802, 1423, 1577, 1142, 1037), array('2007', 1888, 1447, 1409, 1148, 1084), array('2008', 1956, 1503, 1187, 1039, 922),);
# Append a duplicate of the last row, without label, to make it visible.$n_rows = count($data);$data[$n_rows] = $data[$n_rows-1];$data[$n_rows][0] = '';
$plot = new PHPlot(800, 600);$plot->SetTitle($title);$plot->SetYTitle('1000\'s of barrels per day');$plot->SetDataType('text-data');$plot->SetDataValues($data);$plot->SetPlotType('squaredarea');$plot->SetXTickPos('none');$plot->SetLineStyles('solid');$plot->SetYTickIncrement(250);$plot->SetLegend($countries);# Make room for the legend to the left of the plot:$plot->SetMarginsPixels(200);# Move the legend to the left:$plot->SetLegendPixels(10, 10);# To improve presentation in the manual:$plot->SetImageBorderType('plain');$plot->DrawGraph();

PHPlot Examples
231
5.53. Example - Stacked Squared Area PlotThis is a stacked squared area plot (plot type stackedsquaredarea). It is similar to the stackedarea) plot, but the datalines are stepped as in the squared) plot.
Compare this image to the previous example, Section 5.52, “Example - Squared Area Plot”, which uses the samedata but plots an unstacked (or non-cumulative) plot. In this stacked plot, all the data sets are visible because they areaccumulated from first (Canada, light blue) to last (Nigeria, red). Unlike in the unstacked plot, you cannot read theper-country values from the Y axis scale. But also unlike the unstacked plot, you can visually compare the relativeamounts from each country, and also read the overall total at the top of the plot.
In the script below, a copy of the last data row is appended to the data array. This is usually necessary withthe stackedsquaredarea plot if you want the last data set to be visible. For an explanation, see description of thestackedsquaredarea plot type.
Note: Stacked Squared Area plots were added in PHPlot-6.2.0.
Example 5.53. Stacked Squared Area Plot
<?php# PHPlot Example: Stacked Squared Area plotrequire_once 'phplot.php';
PHPlot Examples
232
$title = "US Oil Imports by Country, Top 5\n" . "Cumulative (stacked) Data";
$countries = array( 'Canada', 'Saudi Arabia', 'Mexico', 'Venezuela', 'Nigeria',# -------- -------------- -------- ----------- ---------);$data = array( array('2002', 1445, 1519, 1500, 1201, 589), array('2003', 1549, 1726, 1569, 1183, 832), array('2004', 1616, 1495, 1598, 1297, 1078), array('2005', 1633, 1445, 1556, 1241, 1077), array('2006', 1802, 1423, 1577, 1142, 1037), array('2007', 1888, 1447, 1409, 1148, 1084), array('2008', 1956, 1503, 1187, 1039, 922),);
# Append a duplicate of the last row, without label, to make it visible.$n_rows = count($data);$data[$n_rows] = $data[$n_rows-1];$data[$n_rows][0] = '';
$plot = new PHPlot(800, 600);$plot->SetTitle($title);$plot->SetYTitle('1000\'s of barrels per day');$plot->SetDataType('text-data');$plot->SetDataValues($data);$plot->SetPlotType('stackedsquaredarea');$plot->SetXTickPos('none');$plot->SetLineStyles('solid');$plot->SetYTickIncrement(250);$plot->SetLegend($countries);# Make room for the legend to the left of the plot:$plot->SetMarginsPixels(200);# Move the legend to the left:$plot->SetLegendPixels(10, 10);# Flip the legend order for stacked plots:$plot->SetLegendReverse(True);# To improve presentation in the manual:$plot->SetImageBorderType('plain');$plot->DrawGraph();

PHPlot Functions By Category
233
Chapter 6. PHPlot Functions ByCategory
This chapter presents a grouping of the PHPlot functions by category. Descriptions of the functionscan be found in PHPlot Function Reference.
6.1. CoreThe functions in this section form the core of PHPlot. You cannot produce plots without using some of these. If youwant to produce plots with little or no customization, you need use no other functions. These functions are used tocreate a PHPlot object, select the type of plot you want, provide the data to be plotted, and output the plot. For moreinformation, see Section 3.2, “Programming Overview”.
• PHPlot
• PHPlot_truecolor
• DrawGraph
• EncodeImage
• EndStream
• PrintImage
• PrintImageFrame
• SetDataType
• SetDataValues
• SetPlotType
• StartStream
6.2. Input/Output ControlThe functions in this section control the overall input and output of the plot. Use the functions in this section to selectthe graphics file format, direct the output, control browser caching, and control error handling.
• DrawMessage
• SetBrowserCache
• SetFailureImage
• SetFileFormat
• SetIsInline
• SetOutputFile

PHPlot Functions By Category
234
• SetPrintImage
6.3. Colors and Line StylesThe functions in this section are used to control the colors and line styles of PHPlot elements. More information aboutusing colors in PHPlot can be found in Section 3.5, “Colors” and Section 4.3, “Truecolor Images”.
• SetBackgroundColor
• SetDataBorderColors
• SetDataColors
• SetDataLabelColor
• SetDataValueLabelColor
• SetDefaultDashedStyle
• SetErrorBarColors
• SetGridColor
• SetImageBorderColor
• SetImageBorderWidth
• SetLegendBgColor
• SetLegendTextColor
• SetLightGridColor
• SetLineStyles
• SetLineWidths
• SetPieBorderColor
• SetPieLabelColor
• SetPlotBgColor
• SetRGBArray
• SetTextColor
• SetTickColor
• SetTickLabelColor
• SetTitleColor
• SetTransparentColor
• SetXTitleColor
• SetYTitleColor
PHPlot Functions By Category
235
6.4. Additional Style ControlsThe functions in this section control additional style attributes of the plot, including background images, borders, pointstyle and size for point plots, and shading for 3D affects.
• SetBgImage
• SetDrawBrokenLines
• SetDrawDataBorders
• SetDrawPieBorders
• SetDrawPlotAreaBackground
• SetImageBorderType
• SetPieDirection
• SetPieStartAngle
• SetPlotAreaBgImage
• SetPlotBorderType
• SetPointShapes
• SetPointSizes
• SetShading
6.5. Error Bar ControlsThe functions in this section control the appearance of error bars, used in plots with data types data-data-errorand data-data-yx-error.
See also SetErrorBarColors, which sets the color used for error bars.
• SetErrorBarLineWidth
• SetErrorBarShape
• SetErrorBarSize
6.6. Text FontsThe functions in this section control the text fonts used by PHPlot. For more information, see Section 3.8, “Text Fonts”.
• SetDefaultTTFont
• SetFont
• SetFontGD
• SetFontTTF
PHPlot Functions By Category
236
• SetLineSpacing
• SetTTFPath
• SetUseTTF
6.7. TitlesThe functions in this section set the title strings: the overall plot title, and optional titles for the X and Y axes. Formore information, see Section 3.7.1, “Titles”. See also SetTitleColor, SetXTitleColor, and SetYTitleColor to set thetitle colors, and SetFont to set the title fonts.
• SetTitle
• SetXTitle
• SetYTitle
6.8. LegendThe functions in this section control the legend. For more information, see Section 3.7.2, “Legend”. See alsoSetLegendTextColor to set the legend text color, SetLegendBgColor to set the legend background color, SetGridColorto set the legend border color, and SetFont to set the legend text font.
• GetLegendSize
• SetLegend
• SetLegendColorboxBorders
• SetLegendPixels
• SetLegendPosition
• SetLegendReverse
• SetLegendStyle
• SetLegendUseShapes
• SetLegendWorld
6.9. Axis ControlsThe functions in this section control aspects of the X and Y axes. You can control the axis position and optionally uselogarithmic scaling. You can also prevent drawing the axis lines.
• SetDrawXAxis
• SetDrawYAxis
• SetXAxisPosition
• SetXScaleType

PHPlot Functions By Category
237
• SetYAxisPosition
• SetYScaleType
6.10. Grid ControlsThe functions in this section control the optional grid lines. For more information, see Section 3.7.3, “Grid Lines”.See also SetLightGridColor to set the grid color.
• SetDrawDashedGrid
• SetDrawXGrid
• SetDrawYGrid
6.11. LabelsThe functions in this section control the formatting and display of labels. This includes data labels (axis data labelswhich come from your data array, and data value labels), tick labels (automatically generated by PHPlot), and the datalabels used on pie charts to identify the pie segments. For more information, see Section 3.6, “Labels”.
• SetDrawXDataLabelLines
• SetDrawYDataLabelLines
• SetLabelScalePosition
• SetNumberFormat
• SetPieLabelType
• SetPrecisionX
• SetPrecisionY
• SetXDataLabelAngle
• SetXDataLabelPos
• SetXDataLabelType
• SetXLabelAngle
• SetXLabelType
• SetXTickLabelPos
• SetXTimeFormat
• SetYDataLabelAngle
• SetYDataLabelPos
• SetYDataLabelType
• SetYLabelAngle
PHPlot Functions By Category
238
• SetYLabelType
• SetYTickLabelPos
• SetYTimeFormat
6.12. TicksThe functions in this section control the X axis and Y axis tick marks. For more information, see Section 3.7.4, “TickMarks”.
• SetNumXTicks
• SetNumYTicks
• SetSkipBottomTick
• SetSkipLeftTick
• SetSkipRightTick
• SetSkipTopTick
• SetXTickAnchor
• SetXTickCrossing
• SetXTickIncrement
• SetXTickLength
• SetXTickPos
• SetYTickAnchor
• SetYTickCrossing
• SetYTickIncrement
• SetYTickLength
• SetYTickPos
• TuneXAutoTicks
• TuneYAutoTicks
6.13. Scaling and TranslationThe functions in this section control the overall data scaling and positioning of the plot on the image, or translatecoordinates.
• GetDeviceXY
• SetMarginsPixels
• SetPieAutoSize

PHPlot Functions By Category
239
• SetPlotAreaPixels
• SetPlotAreaWorld
• TuneXAutoRange
• TuneYAutoRange
6.14. CallbacksThe functions in this section are used to implement callbacks. This is an advanced feature described in more detailin Section 4.4, “Callbacks”.
• GetCallback
• RemoveCallback
• SetCallback

PHPlot Function Reference
240
PHPlot Function Reference
This part of the PHPlot Reference Manual contains the reference information for the PHPlotfunctions. Note that all the functions (except the class constructor) are implemented as methods ofthe class PHPlot, and are therefore called through an object which is an instance of the class. In thistext, $plot is used to represent an instance of the PHPlot class.
Table of ContentsDrawGraph ................................................................................................................................... 243DrawMessage ................................................................................................................................ 244EncodeImage ................................................................................................................................ 246EndStream .................................................................................................................................... 248GetCallback .................................................................................................................................. 249GetDeviceXY ................................................................................................................................ 250GetLegendSize .............................................................................................................................. 251PHPlot ......................................................................................................................................... 252PHPlot_truecolor ........................................................................................................................... 254PrintImage .................................................................................................................................... 256PrintImageFrame ........................................................................................................................... 257RemoveCallback ............................................................................................................................ 258SetBackgroundColor ....................................................................................................................... 259SetBgImage .................................................................................................................................. 260SetBrowserCache ........................................................................................................................... 261SetCallback ................................................................................................................................... 262SetDataBorderColors ...................................................................................................................... 263SetDataColors ............................................................................................................................... 265SetDataLabelColor ......................................................................................................................... 267SetDataType ................................................................................................................................. 268SetDataValueLabelColor ................................................................................................................. 270SetDataValues ............................................................................................................................... 271SetDefaultDashedStyle .................................................................................................................... 272SetDefaultTTFont .......................................................................................................................... 273SetDrawBrokenLines ...................................................................................................................... 275SetDrawDashedGrid ....................................................................................................................... 276SetDrawDataBorders ...................................................................................................................... 277SetDrawPieBorders ........................................................................................................................ 278SetDrawPlotAreaBackground ........................................................................................................... 279SetDrawXAxis .............................................................................................................................. 280SetDrawXDataLabelLines ............................................................................................................... 281SetDrawXGrid ............................................................................................................................... 282SetDrawYAxis .............................................................................................................................. 283SetDrawYDataLabelLines ............................................................................................................... 284SetDrawYGrid ............................................................................................................................... 285SetErrorBarColors .......................................................................................................................... 286SetErrorBarLineWidth .................................................................................................................... 287SetErrorBarShape ........................................................................................................................... 288SetErrorBarSize ............................................................................................................................. 289SetFailureImage ............................................................................................................................. 290SetFileFormat ................................................................................................................................ 291
PHPlot Function Reference
241
SetFont ........................................................................................................................................ 292SetFontGD .................................................................................................................................... 295SetFontTTF .................................................................................................................................. 296SetGridColor ................................................................................................................................. 297SetImageBorderColor ..................................................................................................................... 298SetImageBorderType ...................................................................................................................... 299SetImageBorderWidth ..................................................................................................................... 300SetIsInline .................................................................................................................................... 301SetLabelScalePosition ..................................................................................................................... 302SetLegend ..................................................................................................................................... 303SetLegendBgColor ......................................................................................................................... 304SetLegendColorboxBorders ............................................................................................................. 305SetLegendPixels ............................................................................................................................ 306SetLegendPosition .......................................................................................................................... 307SetLegendReverse .......................................................................................................................... 309SetLegendStyle .............................................................................................................................. 310SetLegendTextColor ....................................................................................................................... 312SetLegendUseShapes ...................................................................................................................... 313SetLegendWorld ............................................................................................................................ 315SetLightGridColor .......................................................................................................................... 316SetLineSpacing .............................................................................................................................. 317SetLineStyles ................................................................................................................................ 318SetLineWidths ............................................................................................................................... 319SetMarginsPixels ........................................................................................................................... 320SetNumberFormat .......................................................................................................................... 321SetNumXTicks .............................................................................................................................. 323SetNumYTicks .............................................................................................................................. 324SetOutputFile ................................................................................................................................ 325SetPieAutoSize .............................................................................................................................. 326SetPieBorderColor ......................................................................................................................... 327SetPieDirection .............................................................................................................................. 328SetPieLabelColor ........................................................................................................................... 329SetPieLabelType ............................................................................................................................ 330SetPieStartAngle ............................................................................................................................ 334SetPlotAreaBgImage ....................................................................................................................... 335SetPlotAreaPixels ........................................................................................................................... 336SetPlotAreaWorld .......................................................................................................................... 338SetPlotBgColor .............................................................................................................................. 340SetPlotBorderType ......................................................................................................................... 341SetPlotType .................................................................................................................................. 343SetPointShapes .............................................................................................................................. 344SetPointSizes ................................................................................................................................ 346SetPrecisionX ................................................................................................................................ 347SetPrecisionY ................................................................................................................................ 348SetPrintImage ................................................................................................................................ 349SetRGBArray ................................................................................................................................ 350SetShading .................................................................................................................................... 352SetSkipBottomTick ........................................................................................................................ 353SetSkipLeftTick ............................................................................................................................. 354SetSkipRightTick ........................................................................................................................... 355SetSkipTopTick ............................................................................................................................. 356SetTextColor ................................................................................................................................. 357SetTickColor ................................................................................................................................. 358SetTickLabelColor ......................................................................................................................... 359

PHPlot Function Reference
242
SetTitle ........................................................................................................................................ 360SetTitleColor ................................................................................................................................. 361SetTransparentColor ....................................................................................................................... 362SetTTFPath ................................................................................................................................... 363SetUseTTF ................................................................................................................................... 364SetXAxisPosition ........................................................................................................................... 365SetXDataLabelAngle ...................................................................................................................... 366SetXDataLabelPos ......................................................................................................................... 367SetXDataLabelType ....................................................................................................................... 369SetXLabelAngle ............................................................................................................................ 372SetXLabelType .............................................................................................................................. 373SetXScaleType .............................................................................................................................. 377SetXTickAnchor ............................................................................................................................ 378SetXTickCrossing .......................................................................................................................... 380SetXTickIncrement ......................................................................................................................... 381SetXTickLabelPos .......................................................................................................................... 382SetXTickLength ............................................................................................................................. 383SetXTickPos ................................................................................................................................. 384SetXTimeFormat ........................................................................................................................... 385SetXTitle ...................................................................................................................................... 386SetXTitleColor .............................................................................................................................. 387SetYAxisPosition ........................................................................................................................... 388SetYDataLabelAngle ...................................................................................................................... 389SetYDataLabelPos ......................................................................................................................... 390SetYDataLabelType ....................................................................................................................... 392SetYLabelAngle ............................................................................................................................ 395SetYLabelType .............................................................................................................................. 396SetYScaleType .............................................................................................................................. 399SetYTickAnchor ............................................................................................................................ 400SetYTickCrossing .......................................................................................................................... 402SetYTickIncrement ......................................................................................................................... 403SetYTickLabelPos .......................................................................................................................... 404SetYTickLength ............................................................................................................................. 405SetYTickPos ................................................................................................................................. 406SetYTimeFormat ........................................................................................................................... 407SetYTitle ...................................................................................................................................... 408SetYTitleColor .............................................................................................................................. 409StartStream ................................................................................................................................... 410TuneXAutoRange .......................................................................................................................... 411TuneYAutoRange .......................................................................................................................... 413TuneXAutoTicks ........................................................................................................................... 415TuneYAutoTicks ........................................................................................................................... 417
DrawGraph
243
DrawGraphDrawGraph — Draw the current graph onto the image
Synopsis
$plot->DrawGraph()
DescriptionDrawGraph actually draws the current graph onto the image. That is, until DrawGraph is used, nothing happensexcept the recording of settings and data. DrawGraph also outputs the image with PrintImage, unless SetPrintImagewas used.
ParametersNone
NotesAfter using DrawGraph and automatic or subsequent output of the image, the PHPlot object should not be reused.

DrawMessage
244
DrawMessageDrawMessage — Draw a text message on the image, discarding the plot
Synopsis
$plot->DrawMessage($text, [$options])
DescriptionDrawMessage draws a text message on the image, effectively replacing the plot with a message. It can be usedinstead of DrawGraph to handle an application-level error condition, for example.
Parameters$text
The text message to display. This can include newlines, which will result in line breaks.
$optionsOptional associative array of settings to control the appearance of the message image. If missing or empty, thedefaults result in small black text on a white background, with word wrapping. If provided, the options array maycontain the following keys and values:
Option name (array key) Default value Description
draw_background False If true, draw the image background
draw_border False If true, draw the image border
force_print True If true, ignore SetPrintImage(False) andalways output
reset_font True If true, reset fonts to standard sizes and type
text_color '' If not empty, color to use for the text
text_wrap True If true, word-wrap the text
wrap_width 75 Width in characters for word-wrapping thetext
NotesThe default option values are chosen to be appropriate for error messages, and are designed to be 'fail-safe'. (Forexample, resetting fonts to use the built-in GD fonts ensures that there will be no error with TrueType font files whiledisplaying an error message.)
If the draw_background option is False or defaulted, the image will have a white background. Ifdraw_background is True, then the image will have a background as specified by prior calls toSetBackgroundColor or SetBgImage. If neither of those has been called before DrawMessage, then the backgroundwill be white regardless of the draw_background option value. Note that if an input file was given to the PHPlotconstructor to set a background, that will not be used with a message image, regardless of the options.
If the draw_border option is False or defaulted, no border will be drawn. If draw_border is True, thenthe the image will have a border as specified by prior calls to SetImageBorderType, SetImageBorderWidth, and
DrawMessage
245
SetImageBorderColor. Note that if SetImageBorderType was not used to enable a border before DrawMessage,then there will be no border, regardless of the draw_border option value.
The message text will be drawn using the PHPlot generic font settings. But if the reset_font option is Trueor defaulted, all fonts will be reset to defaults first, resulting in the use of GD font #2 (a small monospaced font).If reset_font is False, the generic font settings will be used without reset. Use SetFont, SetFontGD, orSetFontTTF in this case to select the font. For example, to use a TrueType font for your message, call $plot->SetFontTTF('generic', $font_name, $font_size), then set the reset_font option to Falsewhen calling DrawMessage().
If the text_color option is empty or defaulted, the text will be black. To use a different color for the message text,set text_color to any valid PHPlot color specification, such as a color name or "#rrggbb" form (see Section 3.5.1,“Color Parameter Forms”).
If the force_print option is True or defaulted, the message image will be output after creating it - ignoring anysetting made with SetPrintImage. If force_print is False, and SetPrintImage(False) was previouslycalled, the message image will created but not output. This would be appropriate when using PrintImage orEncodeImage to output the image. Note that if SetPrintImage(False) was not called, the image will be outputregardless of the force_print option value.
The text may contain newlines, which will produce separate lines of text in the message image. The text will be word-wrapped (unless the text_wrap option is set to False). Each line of text will be left aligned, and the boundingbox of the text will be centered in the image. PHPlot makes no attempt to make sure the text will fit, but the upperleft corner will always be visible.
After using DrawMessage and automatic or subsequent output of the image, the PHPlot object should not be reused.
See Section 5.42, “Example - DrawMessage” for an example of this function.
HistoryThis function was added in PHPlot-5.7.0.

EncodeImage
246
EncodeImageEncodeImage — Returns the plot image data
Synopsis
$plot->EncodeImage([$encoding])
DescriptionEncodeImage returns the plot image as a string, using one of three encodings. This function can be used when specialprocessing of the plot image data is necessary, rather than the default behavior of sending the image via standard output(usually to a browser), or writing it to a file. In particular, EncodeImage can be used to embed a PHPlot imageinside an HTML file without requiring a separate script.
Parameters$encoding
Optional string indicating the encoding to use for the return value. If supplied, it must be one of the followingvalues:
Encoding Description
raw No encoding - the raw data representing the image is returned.
base64 Encodes the image data using base64 (RFC2045).
dataurl Encodes the image data for a 'data:' URL scheme. This is the default. See notes below.
Return ValueReturns the image data, using the indicated encoding.
NotesThe default value for $encoding is dataurl.
raw encoding returns the image data. If the image file format was set to the default PNG, the return result would bea valid PNG file if it was written to a file.
base64 encoding starts with the same data as raw, and encodes it as ASCII characters using the PHP functionbase64_encode and returns the result. Note that the result is not broken into lines, as required by some applications.Use the PHP function chunk_split if this is needed.
dataurl encoding returns the image data suitable for use as the value of the 'src' attribute in an HTML 'img' tagusing the data URL scheme. This embeds the image into the HTML, and so it does not require an external image file.The data URL scheme is defined by RFC 2397 [http://www.faqs.org/rfcs/rfc2397.html].
Warning
RFC 2397 makes it clear that the scheme is intended for embedding small images, and that there may belength limitations on the encoded data. However, there are other applications (for example LibreOffice) that

EncodeImage
247
use the data URL scheme for large images. While it has been found to work with large images in the majorweb browsers, testing in your own environment is recommended.
When using EncodeImage to get the plot image, rather than letting PHPlot output the image to standard output ora file, you must call SetPrintImage(False) to prevent DrawGraph from sending the image data to standard output.You should also call SetFailureImage(False) to prevent PHPlot from producing an unexpected image on standardoutput in case of a fatal error.
An example of using the dataurl encoding is:
$plot = new PHPlot(800, 600);$plot->SetPrintImage(False); // Do not output the image... // Plot settings, data, etc.$plot->DrawGraph(); // Make the plot but do not output itecho "<img src=\"" . $plot->EncodeImage() . "\">\n";
A more complete example can be found in Section 5.39, “Example - Embedding Image with EncodeImage”.
HistoryThis function was added in PHPlot-5.5.0.

EndStream
248
EndStreamEndStream — End a Motion-JPEG (or other type) plot stream
Synopsis
$plot->EndStream()
DescriptionEndStream is used to end a plot stream, started with StartStream and containing frames produced byPrintImageFrame. This function simply outputs the ending MIME boundary for the stream.
ParametersNone
NotesThe three functions StartStream, PrintImageFrame, and EndStream are used together to produce streaming plots.Scripts producing streaming plots must use a web server. The PHP CLI will not work, because streaming plots requireHTTP headers.
For more on streaming plots, see Section 4.9, “Streaming Plots”.
ExampleSee PrintImageFrame for a partial example, and Section 4.9.3, “Streaming Plots - Example” for the complete example.
HistoryThis function was added in PHPlot-5.8.0. Prior releases are not able to produce streaming plots.

GetCallback
249
GetCallbackGetCallback — Returns the current callback function registered for the given reason
Synopsis
$plot->GetCallback($reason)
DescriptionGetCallback returns the current callback function registered for the given reason. That is, it returns the functionargument value used when a callback function was registered with SetCallback.
Parameters$reason
A PHPlot-defined name for the callback. See Section 4.4.3, “Available Callbacks”.
Return ValueReturns the function name as a string, or a 2-element array for object instance and method calls. Returns False if thereis no callback registered for this reason, or if the given reason is not valid.
NotesSince no valid function name (or array of object instance and method) evaluates to false when directly tested, it is notnecessary to check using the identical-to (===) operator.
Refer to Section 4.4, “Callbacks” for more information on callbacks.
HistoryThis function and the callbacks implementation were added in PHPlot-5.0.4 as an experimental feature. Callbackswere first documented in this manual as of PHPlot-5.0.5 and are no longer considered experimental.

GetDeviceXY
250
GetDeviceXYGetDeviceXY — Translate world coordinates into device coordinates
Synopsis
list($x, $y) = $plot->GetDeviceXY($x_world, $y_world)
DescriptionGetDeviceXY translates values in world coordinates into values in device coordinates. This is useful if you want toannotate a plot with text or graphics positioned relative to specific data values. Given the coordinates of a point in thecoordinate space of your data values, this function returns the pixel coordinates of that point in the image.
Parameters$x_world
The X coordinate to translate from world coordinates.
$y_worldThe Y coordinate to translate from world coordinates.
Return ValueReturns an array of two values ($x, $y) in device coordinates which correspond to the world coordinate parameters.
NotesThis function only works after scaling factors have been established, which happens in DrawGraph. So it can onlybe used in two cases:
• From a drawing callback (see Section 4.4, “Callbacks”) - that is, a callback whose name starts with 'draw'.
• If SetPrintImage(False) is used to disable automatic output of the image file, then GetDeviceXY() can be usedafter DrawGraph returns.
GetDeviceXY() will fail with an error message if it is called before scaling is set up.
If the world coordinates represent a point that is not visible on the plot, the returned device coordinates will be outsidethe plot area, or even outside the image area.
To see how this can be used in callbacks, see Section 4.4.5, “Using Callbacks to Annotate Plots”.
Because there are no valid world coordinates for pie charts, GetDeviceXY() does not work with pie charts.
HistoryStarting with PHPlot-5.6.0, this function will fail with pie charts, because they do not have valid world coordinates.Through PHPlot-5.5.0, this function returned somewhat meaningless values when used with pie charts.
This function was added in PHPlot-5.1.0.
GetLegendSize
251
GetLegendSizeGetLegendSize — Return the amount of space required for the legend box
Synopsis
list($width, $height) = $plot->GetLegendSize()
DescriptionGetLegendSize returns the size (in pixels) required for the legend box. This might be used to adjust the plotmargins based on the legend size, for example. After calling GetLegendSize, you can use SetPlotAreaWorld orSetMarginsPixels to leave room for the legend.
ParametersNone
Return ValueReturns an array of two values ($width, $height). These are the width and height required for the box containing thelegend. Returns FALSE if no legend has been defined.
NotesThis function will return valid numbers after the legend has been set up (including using SetLegend to set all the textlines, and optional calls to set the font, linespacing, and style). The results from this function do not depend on datavalues, plot type, or other plot elements.
HistoryStarting with PHPlot-6.0.0, the function returns FALSE if no legend has been defined yet. (In previous versions, theresult was undefined if there was no legend defined.)
This function was added in PHPlot-5.4.0.

PHPlot
252
PHPlotPHPlot — Construct a new PHPlot Class Object
Synopsis
$plot = new PHPlot([$width], [$height], [$output_file], [$input_file])
DescriptionThis is the class constructor for PHPlot. It creates a new plot object and initializes all internal settings to default values.
Parameters$width
Optional width of the plot image, in pixels. Default is 600.
$heightOptional height of the plot image, in pixels. Default is 400.
$output_fileOptional name of a file where the image output will be written. This is the same as using SetOutputFile. Defaultis no output file, meaning the image is written to standard output (that is, sent back to the browser).
$input_fileOptional name of a file to use as a starting image. This becomes the background for the plot. If an input_file isgiven, any width and height given to the constructor are ignored, and the size of the image in the named input_fileare the plot image size. Default is no input file, meaning a blank image will be created at the given or defaultwidth and height.
Return ValueReturns an object, an instance of the PHPlot class.
NotesThe output_file will be ignored unless SetIsInline(True) is called.
If no input_file is supplied, the PHPlot constructor creates a palette plot image, and the PHPlot_truecolor constructorcreates a truecolor plot image. If an input_file is supplied, the two constructors are equivalent, and the type of the inputfile (truecolor or palette) determines the type of the plot image.
HistoryEarlier versions of this manual said that the created object should always be returned as a reference, like this:
$plot =& new PHPlot(...); // Do not use this
This was because PHPlot included a function to deallocate memory used by the object at script shutdown, but thatwould only work if a reference assignment was used. This quasi-destructor was removed at PHPlot-5.0.4 because it

PHPlot
253
interfered with memory deallocation until the script ended. So the reference assignment should not be used. In addition,reference assignment of a newly created object instance is deprecated starting with PHP5, and removed in PHP7.

PHPlot_truecolor
254
PHPlot_truecolorPHPlot_truecolor — Construct a new PHPlot Truecolor Class Object
Synopsis
$plot = new PHPlot_truecolor([$width], [$height], [$output_file], [$input_file])
DescriptionThis is the constructor for the PHPlot_truecolor class, which is an extended class that inherits from the PHPlot class.Like the PHPlot class, it creates a new plot object and initializes all internal settings to default values, but the resultingimage will be a truecolor image, rather than a palette image. (See the notes below regarding an exception to this rule.)
Parameters$width
Optional width of the plot image, in pixels. Default is 600.
$heightOptional height of the plot image, in pixels. Default is 400.
$output_fileOptional name of a file where the image output will be written. This is the same as using SetOutputFile. Defaultis no output file, meaning the image is written to standard output (that is, sent back to the browser).
$input_fileOptional name of a file to use as a starting image. This becomes the background for the plot. If an input_file isgiven, any width and height given to the constructor are ignored, and the size of the image in the named input_fileare the plot image size. Default is no input file, meaning a blank image will be created at the given or defaultwidth and height.
Return ValueReturns an object, an instance of the PHPlot_truecolor class, which inherits all the functions (methods) of the PHPlotclass.
NotesRefer to PHPlot for the base class constructor. Refer to Section 4.3, “Truecolor Images” for more information ontruecolor images.
The output_file will be ignored unless SetIsInline(True) is called.
If no input_file is supplied, the PHPlot_truecolor constructor creates a truecolor plot image, and the PHPlot constructorcreates a palette plot image. If an input_file is supplied, the two constructors are equivalent, and the type of the inputfile (truecolor or palette) determines the type of the plot image.
The type of the plot image (truecolor or palette) might not be the same as the type of output file or stream whichis generated by PHPlot. For example, a truecolor image is converted to palette if the output format (as set withSetFileFormat) is GIF, which supports only palette images. A palette image is converted to truecolor if the output

PHPlot_truecolor
255
format is JPEG, which supports only truecolor images. More information can be found in Section 4.3.5, “ImageFormats and File Formats, Palette and Truecolor”.
HistoryThe PHPlot_truecolor class and its constructor were added in PHPlot-5.1.1. For that release only, there was a greaterdependency between which constructor was used and which features were available, but this was removed in the nextrelease.
PrintImage
256
PrintImagePrintImage — Output the generated graph image and clean up the internal storage space.
Synopsis
$plot->PrintImage()
DescriptionPrintImage outputs the generated graph image and cleans up the internal storage space used. Output goes to thebrowser by default, or to the output file set by SetOutputFile.
Using PrintImage is not normally needed, since DrawGraph calls PrintImage unless it was told not to usingSetPrintImage.
ParametersNone

PrintImageFrame
257
PrintImageFramePrintImageFrame — Output the generated plot as one frame in a plot stream
Synopsis
$plot->PrintImageFrame()
DescriptionPrintImageFrame is used to output (that is, send to the browser) a single plot in a plot stream. This function issimilar to PrintImage, except that the image is preceded by MIME headers that indicate it is part of a stream. Also,after producing the plot, PrintImageFrame() changes the PHPlot object so that a new plot can be drawn usingthe same object.
ParametersNone
NotesThe three functions StartStream, PrintImageFrame, and EndStream are used together to produce streaming plots.Scripts producing streaming plots must use a web server. The PHP CLI will not work, because streaming plots requireHTTP headers.
PrintImageFrame resets internal flags in the PHPlot object that will result in the next plot starting with a blankbackground, just like the initial plot in the series. It does not change any of the plot settings.
For more on streaming plots, see Section 4.9, “Streaming Plots”.
ExampleThis is a partial example showing how the 3 functions are used to produce streaming plots. See Section 4.9.3,“Streaming Plots - Example” for the complete example.
$plot = new PHPlot(640, 480);...$plot->SetPrintImage(False);$plot->StartStream();$timestamp = microtime(TRUE);for ($frame = 0; $frame < $n_frames; $frame++) { array_shift($data); $data[] = next_row(); $plot->SetDataValues($data); $plot->DrawGraph(); $plot->PrintImageFrame(); time_sleep_until($timestamp += $frame_time);}$plot->EndStream();
HistoryThis function was added in PHPlot-5.8.0. Prior releases are not able to produce streaming plots.

RemoveCallback
258
RemoveCallbackRemoveCallback — Unregisters any callback registered for the given reason
Synopsis
$plot->RemoveCallback($reason)
DescriptionRemoveCallback unregisters any callback registered for the given reason. It undoes the effect of SetCallback.
Parameters$reason
A PHPlot-defined name for the callback. See Section 4.4.3, “Available Callbacks”.
Return ValueReturns True if the given reason is valid (whether or not there was actually a callback registered for it). Returns Falseif reason is not a valid callback reason.
NotesRefer to Section 4.4, “Callbacks” for more information on callbacks.
HistoryThis function and the callbacks implementation were added in PHPlot-5.0.4 as an experimental feature. Callbackswere first documented in this manual as of PHPlot-5.0.5 and are no longer considered experimental.

SetBackgroundColor
259
SetBackgroundColorSetBackgroundColor — Sets the overall background color.
Synopsis
$plot->SetBackgroundColor($color)
DescriptionSetBackgroundColor sets the overall background color. This is the color of the background of the whole image.
Parameters$color
Color value to use. See Section 3.5, “Colors” for more on color values.
NotesThe default background color is white. Background image overrides background color; background color is ignoredif a background image was set with SetBgImage.
The background color shows through in the plot area too, unless the plot area background is changed withSetPlotBgColor or SetPlotAreaBgImage.
The background color is used as the legend background, unless SetLegendBgColor is used to change it.

SetBgImage
260
SetBgImageSetBgImage — Set a graphic file to be used in the graph background
Synopsis
$plot->SetBgImage($input_file, [$mode])
DescriptionSetBgImage sets an image file to be used as the graph background. The image can be scaled or tiled to fit.
Parameters$input_file
Path to the file to be used. The file can be any type allowed by GD, which usually includes JPEG, GIF, and PNG.
$modeOptional display mode for the background image: one of the strings 'centeredtile', 'tile', or 'scale'. The default is'centeredtile'.
NotesIf a background image has been set, background color (set with SetBackgroundColor) is ignored.
Scale mode scales the supplied background image file to fit the image area of the entire graph. Tile and centeredtilemodes repeat the supplied background image file as needed to fit the image area of the graph. The difference is thatcenteredtile offsets the start position within the background image by half its size, which works better for some images.
SetBgImage sets a background for the entire image area, while SetPlotAreaBgImage sets a background for the plotarea (generally, the area between the axes). If both are used, the plot area background overlays that portion of theoverall background.
If $input_file is NULL, no background image will be used.
If you are going to use a JPEG file for the image background, you should be using a truecolor PHPlot image. Truecolorimages do not have a limited-size color map like palette images (which PHPlot uses by default). If you use palette imagewith a JPEG background, the background will likely overflow your image's color map and leave no free color slotsfor PHPlot to use for plot elements. The same is true if using a 24-bit color (non-mapped) PNG file for a backgroundif it has many colors. For more on truecolor PHPlot images, see Section 4.3, “Truecolor Images”.

SetBrowserCache
261
SetBrowserCacheSetBrowserCache — Control browser-side image caching
Synopsis
$plot->SetBrowserCache($browser_cache)
DescriptionSetBrowserCache controls whether to allow the browser to cache the image generated by PHPlot. By default,PHPlot sends out HTTP headers to tell the browser not to cache the generated image, since it is assumed that theimage is generated from dynamic data and a cached copy would not be accurate. You can use this function to allowthe browser to cache the image.
Parameters$browser_cache
True to allow the browser to cache the image; False to not allow the browser to cache the image.

SetCallback
262
SetCallbackSetCallback — Registers a callback function
Synopsis
$plot->SetCallback($reason, $function, [$arg])
DescriptionSetCallback registers a callback function. That is, it arranges for the caller-provided function to be called at aspecific point or points inside PHPlot's internal processing.
Parameters$reason
A PHPlot-defined name for the callback. See Section 4.4.3, “Available Callbacks”.
$functionThe function to be called. This can be either the name of a function as a string, or a two-element array with anobject class instance and method name. See Section 4.4.1, “Callbacks Application Interface” for more information.
$argAn optional opaque argument passed-through to the callback function when PHPlot triggers the callback. If notsupplied, the callback function will get a NULL argument.
Return ValueReturns True if the callback has been registered. Returns False on error. The only error condition is if the given callbackreason is not valid. Note that the function name is not validated until the callback is triggered.
NotesIf a callback is already registered for the given reason, the new callback replaces the old one.
Refer to Section 4.4, “Callbacks” for more information on callbacks.
HistoryThis function and the callbacks implementation were added in PHPlot-5.0.4 as an experimental feature. Callbackswere first documented in this manual as of PHPlot-5.0.5 and are no longer considered experimental.
SetDataBorderColors
263
SetDataBorderColorsSetDataBorderColors — Set the data border colors
Synopsis
$plot->SetDataBorderColors($border)
Description
SetDataBorderColors sets the colors used for data borders on supported plot types. For plot types bars andstackedbars, these are the borders around the individual bars or bar segments in the plot. For plot types area,squaredarea, stackedarea, and stackedsquaredarea, these are outlines of the filled areas.
Parameters
$borderAn array of color values, one for the border of each data set. Or, a single color value (not an array) to use for alldata sets. For other possibilities, see Notes. See Section 3.5, “Colors” for more on color values.
Notes
If an array is used for $border, it must use zero-based sequential integer indexes.
If this function is never called, a default color map is used which sets all data borders to black.
Data borders can be used with plot types bars and stackedbars. With these plot types, by default, unshadedplots (SetShading(0)) have data borders, and shaded plots have a 3D-look and no data borders. If you want unshadedplots with no data borders, use SetDrawDataBorders(FALSE) to disable the borders. You can enable data borders onshaded plots with SetDrawDataBorders(TRUE).
Data borders can also be used with plot types area, squaredarea, stackedarea, andstackedsquaredarea. With these plot types, by default, data borders are not drawn. You can enable data bordersfor these plot types with SetDrawDataBorders(TRUE).
The data border colors can also be used to outline the color boxes in a legend. See SetLegendColorboxBorders forthis option.
If $border is not an array, but a single color value, then that color will be used for all data sets. However, thearray(r,g,b) notation is not allowed in this case (because it looks like an array of 3 separate color values). You can getaround this restriction if you want to specify a single color as an R, G, B array by wrapping the array in another array,for example: array(array(102, 0, 192)).
Two special uses of the $border argument are available. If the argument is an empty string, or boolean False, thecolor map is reset to the defaults. This can be used to restore the default color map. If the argument is NULL or missingfrom the function call, the color map is reset to the defaults, but only if it has not already been set. This is used internalto PHPlot for one-time initialization.
A data colors callback, as described in Section 4.5, “Custom Data Color Selection”, also controls selection of the colorfor data borders (if used). Note this does not apply to plot types that do not use the data colors callback.

SetDataBorderColors
264
HistoryStarting with PHPlot-6.2.0, data borders are available with area and stackedarea plot types, and with the newsquaredarea and stackedsquaredarea plot types.
Before PHPlot-6.0.0, unshaded bar and stackedbar plots always had data borders, and shaded bar and stackedbar plotsnever had data borders.

SetDataColors
265
SetDataColorsSetDataColors — Set the colors for plotting data sets
Synopsis
$plot->SetDataColors($data_colors, [$border], [$default_alpha])
DescriptionSetDataColors sets the colors used for plotting the data.
Parameters$data_colors
An array of color values, one for each data set. Or, a single color value (not an array) to use for all data sets. Forother possibilities, see Notes. See Section 3.5, “Colors” for more on color values.
$borderArgument provided for backward compatibility. Use SetDataBorderColors instead.
$default_alphaA default alpha value to apply to all data colors which do not have an alpha value. This is generally useful only withTruecolor images. A value of zero means opaque, and 127 means fully transparent. See Section 4.3, “TruecolorImages” for more information.
NotesIf an array is used for $data_colors, it must use zero-based sequential integer indexes.
Usually the $data_colors argument is an array of colors, one for each data set to be plotted. For example:
$plot->SetDataColors(array('red', 'green', 'blue'));$plot->SetDataType('data-data');$plot->SetDataValues(array( array('', 1, 4, 10, 5), array('', 2, 6, 20, 3)));
This will plot a red line from (1,4) to (2,6), a green line from (1,10) to (2,20), and a blue line from (1,5) to (2,3).
If $data_colors is not an array, but a single color value, then that color will be used for all data sets. However,the array(r,g,b) notation is not allowed in this case (because it looks like an array of 3 separate color values). You canget around this restriction if you want to specify a single color as an R, G, B array by wrapping the array in anotherarray, for example: array(array(102, 0, 192)).
Two special uses of the $data_colors argument are available. If the argument is an empty string, or boolean False,the color map is reset to the defaults. This can be used to restore the default color map. If the argument is NULL ormissing from the function call, the color map is reset to the defaults, but only if it has not already been set. This isused internal to PHPlot for one-time initialization.
If SetDataColors is never called, a default color map is used which contains 16 colors starting with SkyBlue, green,orange, and blue. For the full list, see Section 3.5.3, “Plotting Colors”. By default, all colors are opaque (alpha=0).
SetDataColors
266
You can keep the default color map but set all colors in it to use a transparency (alpha) value like this:
$plot->SetDataColors(NULL, NULL, 60);
This applies alpha=60 (meaning 60/127 transparency) to all the default data colors.
You can control how the data colors array is used with a data colors callback. See Section 4.5, “Custom Data ColorSelection” for more information.
Some plot types which only support a single data set still use multiple data colors, but in a way that is specific to thatplot type. This is described for each applicable plot type in Section 3.4, “PHPlot Plot Types”.
HistoryThe optional $default_alpha argument was added in PHPlot-5.1.1 when truecolor images were implemented.
Through PHPlot-5.0.7, the default color map contained these 8 colors: SkyBlue, green, orange, blue, orange, red,violet, and azure1. These were used if SetDataColors was never called. Unfortunately, orange is used twice, and azure1is so close to the white background that it is invisible. Also, through PHPlot-5.0.7, if SetDataColors was called withan empty string argument, the color map was set to these 4 colors: blue red green orange. Starting with PHPlot-5.1.0,a new default color map with 16 colors was defined. Given an empty string (or False), SetDataColors now restoresthe default color map.

SetDataLabelColor
267
SetDataLabelColorSetDataLabelColor — Set the color for data labels
Synopsis
$plot->SetDataLabelColor($color)
DescriptionSetDataLabelColor sets the color which is used for data labels. This includes X axis data labels (for verticalplots) or Y axis data labels (for horizontal plots). It also includes Data Value Labels, which show the values of datapoints or bars within the plot area, unless overridden by SetDataValueLabelColor.
Parameters$color
Color value to use. See Section 3.5, “Colors” for more on color values.
NotesIf SetDataLabelColor is not used, data labels are drawn using the general text color set with SetTextColor. Ifneither SetDataLabelColor nor SetTextColor is used, the default color is black.
See also Section 3.6, “Labels” for information about different label types.
PHPlot has a deprecated function called SetLabelColor. Do not use this function. It does not set the color usedfor labels.
HistoryThis function was added in PHPlot-5.7.0. In earlier releases, the data label colors could only be set using SetTextColor,which also changed the color of other elements.
SetDataType
268
SetDataTypeSetDataType — Indicate the format of the data array
Synopsis
$plot->SetDataType($dt)
Description
SetDataType tells PHPlot how to interpret the data array set with SetDataValues. More information on data typescan be found in Section 3.3, “PHPlot Data Types”.
Parameters
$dtThe data array format type, which must be one of the following values:
Data Type Description
text-data Plot with implied X: (Label, Y1, [Y2, ...])
data-data Plot with explicit X: (Label, X, Y1, [Y2, ...])
data-data-error Error plot: (Label, X, Y1, Y1err+, Y1err-, [Y2, ...])
text-data-single Simple pie chart data: (Label, Value)
text-data-yx Horizontal plot with implied Y: (Label, X1, [X2, ...])
data-data-yx Horizontal plot with explicit Y: (Label, Y, X1, [X2, ...])
data-data-yx-error Horizontal error plot: (Label, Y, X1, X1err+, X1err-, [X2, ...])
data-data-xyz Plot with X, Y, Z data: (Label, X, Y1, Z1, [Y2, Z2, ...])
Note: The descriptions above show one row of the data array.
Notes
The default data type is text-data.
An example of a text-data data array is:
$data = array( array('Jan', 100, 150, 200), array('Feb', 110, 140, 210), array('Mar', 120, 145, 200), array('Apr', 110, 160, 220) );
This defines the data for 3 data sets with 4 points on each, and a month name as label for each point. This is also avalid data array for data type text-data-yx.

SetDataType
269
An example of a data-data data array is:
$data = array( array('', 2, 15), array('', 4, 14), array('', 6, 10), array('', 8, 20) );
Here the labels are empty strings, next are the X values, then a single set of Y values (1 data set, 1 plot line). This is alsoa valid data array for data type data-data-yx, with each row containing a Y value, followed by a single X value.
An example of a data-data-error data array is:
$data = array( array('1999', 1, 23.5, 5, 3), array('2000', 2, 20.1, 4, 4), array('2001', 3, 19.1, 3, 4), array('2002', 4, 16.8, 4, 3) );
Here the labels are years, next are the X values 1-4, then a single set of Y values with error ranges between 3 and5 for each point.
An example of a text-data-single data array, used only for pie charts, is:
$data = array( array('', 10), array('', 40), array('', 50) );
Here the labels are empty, and 3 segments with relative weights of 10, 40, and 50 are defined.
Data type alias data-data-error-yx can be used in place of data-data-yx-error. There are other datatype aliases, such as text-linear, which exist for compatibility with very old versions of PHPlot, but they arenot documented.
HistoryData type data-data-yx-error was added in PHPlot-6.1.0 for horizontal error plots. Data type data-data-xyz was added in PHPlot-5.5.0 for the bubbles plot type. Data type data-data-yx for horizontal plots was addedin PHPlot-5.1.3. Data type text-data-yx for horizontal bar charts was added in PHPlot-5.1.2.

SetDataValueLabelColor
270
SetDataValueLabelColorSetDataValueLabelColor — Set the color for data value labels
Synopsis
$plot->SetDataValueLabelColor($color)
DescriptionSetDataValueLabelColor sets the color which is used for data value labels. These are the labels which showthe values of data points or bars, within the plot area. (Do not confuse these with axis data labels, which are displayedalong the X or Y axis lines.)
Parameters$color
Color value to use. See Section 3.5, “Colors” for more on color values.
NotesIf SetDataValueLabelColor is not used, data value labels default to using the color set for all data labels withSetDataLabelColor. If that function is not used, both types of data labels default to using the general text color set withSetTextColor. If none of SetDataValueLabelColor, SetDataLabelColor, or SetTextColor is used,the default color for all data labels is black.
See also Section 3.6, “Labels” for information about different label types.
PHPlot has a deprecated function called SetLabelColor. Do not use this function. It does not set the color usedfor labels.
HistoryThis function was added in PHPlot-5.7.0, and the defaults were changed as described above. Through PHPlot-5.6.0,the data value labels were drawn using the title color, as set with SetTitleColor. Since data value labels are not titles,this was incorrect, and they should have been using the general text color like other data labels. There were two partsto the fix in PHPlot-5.7.0: data value label color now defaults to the general text color rather than the title color, andnew functions SetDataValueLabelColor and SetDataLabelColor were added to allow separate control of labelcolors.

SetDataValues
271
SetDataValuesSetDataValues — Set the data array for plotting
Synopsis
$plot->SetDataValues($dv)
DescriptionSetDataValues sets the data array which contains the data values to be plotted. Use of this function is required.
Parameters$dv
The data array, containing values according to the data type format set by SetDataType.
NotesThe data array $dv must use zero-based sequential integer indexes. Each entry in the data array is also an array,representing one 'record'. The record arrays need not use zero based sequential integer indexes; the entries are processedin the same order in which they were defined, regardless of the index values.
For more on data arrays and data types, see Section 3.3, “PHPlot Data Types”.

SetDefaultDashedStyle
272
SetDefaultDashedStyleSetDefaultDashedStyle — Sets the on/off pattern for dashed lines.
Synopsis
$plot->SetDefaultDashedStyle($style)
DescriptionSetDefaultDashedStyle sets the line style for dashed lines. That is, it customizes the look of dashed lines byspecifying the dash and gap lengths.
Parameters$style
A string specifying the number of alternating colored and transparent dots, in order. For example, '4-3' means 4colored, 3 transparent; '2-3-1-2' means 2 colored, 3 transparent, 1 colored, 2 transparent.
NotesThe default dashed style is '2-4', meaning 2 pixels drawn, followed by a gap of 4 pixels.
All dashed lines on a plot must use the same dashed style. Dashed lines are used for the grid (unless disabled withSetDrawDashedGrid), and for any data sets with line style set to dashed with SetLineStyles.

SetDefaultTTFont
273
SetDefaultTTFontSetDefaultTTFont — Set the default TrueType font
Synopsis
$plot->SetDefaultTTFont([$font])
DescriptionSetDefaultTTFont sets the default TrueType font, resets all text elements to use that font, and makes TrueTypefonts the default font type.
Parameters$font
Name of the TrueType font file to use as default. Specify either a filename in the default TrueType font directory(or one that can be found by GD using its own rules), or the full pathname to a font file. If this parameter is omittedor NULL, the default TrueType font is cleared.
NotesThis function selects TrueType fonts as the default font type as if SetUseTTF(True) was called.
The supplied font name is first checked as given. If that does not work, it is checked prefixed with the default TrueTypefont directory as set with SetTTFPath. If that does not work either, a fatal error results. See Section 3.8.3, “TrueTypeFont Selection” for more information.
This function resets all elements to use the named font and default sizes, so it undoes all prior SetFont, SetFontGD,and SetFontTTF calls.
Change the font used by individual text elements with SetFont, SetFontGD, and SetFontTTF after usingSetDefaultTTFont.
Using SetDefaultTTFont(NULL) or SetDefaultTTFont() will erase the default font, then set TrueTypefonts as the default font type and reset all fonts. This will immediately result in PHPlot using its default algorithmto locate a usable TrueType font. On systems where PHPlot is unable to locate a TrueType font without help,SetDefaultTTFont([NULL]) will fail, although using SetTTFPath first may help.
HistoryStarting in PHPlot-6.0.0, the argument can be omitted and defaults to NULL, which clears the default font. In previousversions, the argument was required.
Starting with PHPlot-5.1.3, TrueType fonts are validated using GD. This allows GD to apply its own rules to try tolocate a font file. On at least some platforms, this allows fonts to be specified by filename only, without having to setthe PHPlot default font directory. (Through PHPlot-5.1.2, the existence of the font file was checked, which did notallow GD to try to find the font using its own rules.)
Through PHPlot-5.0.5, setting a default TrueType font with this function also forced all text on the graph to useTrueType text. Starting with PHPlot-5.0.6, it just sets the default font type. Set SetUseTTF for more information onthis change.
SetDefaultTTFont
274
This behavior of this function was changed significantly at PHPlot-5.0rc3.
SetDrawBrokenLines
275
SetDrawBrokenLinesSetDrawBrokenLines — Sets whether lines should be broken at missing data
Synopsis
$plot->SetDrawBrokenLines($bl)
DescriptionSetDrawBrokenLines determines how to plot lines with missing data points. By default, PHPlot will actas if the point does not exist, connecting the points before and after the missing datum in the usual way. UseSetDrawBrokenLines to leave a gap between the points before and after missing data instead.
This only applies to 'lines', 'linepoints', and 'squared' plot types.
Parameters$bl
True to break the lines at missing data points. False to connect the lines around missing data.
NotesThe default is to ignore missing data and connect lines around missing points.
A missing data point is indicated by an empty string in the corresponding position for the dependent variable valuein the data array. This is the Y value for vertical plots, or X value for horizontal plots. See Section 3.3.4, “MissingData in Data Arrays” for more information.

SetDrawDashedGrid
276
SetDrawDashedGridSetDrawDashedGrid — Use solid or dashed lines for the grid
Synopsis
$plot->SetDrawDashedGrid($ddg)
DescriptionSetDrawDashedGrid determines whether the grid will be drawn with solid or dashed lines. The default is to useddashed lines.
Parameters$ddg
True to use dashed lines, False to use solid lines.

SetDrawDataBorders
277
SetDrawDataBordersSetDrawDataBorders — Enable or disable drawing of data borders
Synopsis
$plot->SetDrawDataBorders($draw)
DescriptionSetDrawDataBorders enables or disables drawing of the data borders on supported plot types. For plot typesbars and stackedbars, these are the borders around the individual bars or bar segments in the plot. For plot types area,squaredarea, stackedarea, and stackedsquaredarea, these are outlines of the filled areas.
Parameters$draw
True to draw the data borders, False to not draw them.
NotesBy default, data borders are drawn for unshaded bars and stackedbars plots, and not drawn if shading is on. (Bydefault, shading is on for these plot types. See SetShading.)
By default, data borders are not drawn for area, squaredarea, stackedarea, or stackedsquaredareaplot types.
Use SetDataBorderColors to set the border colors.
For pie charts, see SetDrawPieBorders.
HistoryStarting with PHPlot-6.2.0, data borders are available with area and stackedarea plot types, and with the newsquaredarea and stackedsquaredarea plot types.
This function was added in PHPlot-6.0.0. In prior versions, borders were always drawn for unshaded bar and stackedbar plots, and never drawn for shaded plots.
SetDrawPieBorders
278
SetDrawPieBordersSetDrawPieBorders — Enable or disable drawing of pie chart segment borders
Synopsis
$plot->SetDrawPieBorders($draw)
DescriptionSetDrawPieBorders enables or disables drawing of the the segment borders on pie charts. These are the linesthat outline each pie segment.
Parameters$draw
True to draw pie chart segment borders, False to not draw them.
NotesBy default, the pie chart segment borders are drawn for unshaded pie charts, and not drawn for shaded pie charts. (Bydefault, pie charts are shaded. See SetShading.)
Use SetPieBorderColor or SetGridColor to set the border color.
HistoryThis function was added in PHPlot-6.0.0. In prior versions, borders were always drawn for unshaded pie charts, andnever drawn for shaded pie charts.
SetDrawPlotAreaBackground
279
SetDrawPlotAreaBackgroundSetDrawPlotAreaBackground — Enables drawing of a plot area background color
Synopsis
$plot->SetDrawPlotAreaBackground($dpab)
DescriptionSetDrawPlotAreaBackground enables or disables drawing of a solid fill color behind the plot area (the areainside the axes, typically). By default, no plot area background color is used, which results in the overall imagebackground color applying to the plot area.
Parameters$dpab
If True, draw the plot area background color. If False, ignore the plot area background color.
NotesThe actual color which will be drawn in the plot area background is set with SetPlotBgColor.
Plot area background color is ignored if a plot area background image was set with SetPlotAreaBgImage.

SetDrawXAxis
280
SetDrawXAxisSetDrawXAxis — Enable or disable drawing of the X axis line
Synopsis
$plot->SetDrawXAxis($draw)
DescriptionSetDrawXAxis enables or disables drawing of the X axis line. Disabling the X axis line should be necessary onlyin special applications.
Parameters$draw
True to draw the X axis line, False to not draw the X axis line.
NotesBy default, the X axis line is drawn.
Disabling the X axis line does not disable associated plot elements, nor change the plot margin calculation. To producea completely 'bare' plot, you must turn off the grid, tick marks, tick labels, and data labels. You also need to turn offthe plot area border, which defaults to left and right sides. Lastly, you might want to reduce the margins, since thedefault minimum margin is 15 pixels on each side of the plot area, even if there are no axis lines, labels, or titles.Here is an example:
// 'Bare' plot partial code example$plot->SetXTickPos('none'); // Turn off X tick marks$plot->SetXTickLabelPos('none'); // Turn off X tick labels$plot->SetXDataLabelPos('none'); // Turn off X data labels$plot->SetYTickPos('none'); // Turn off Y tick marks$plot->SetYTickLabelPos('none'); // Turn off Y tick labels$plot->SetPlotBorderType('none'); // Turn off plot area border$plot->SetDrawXGrid(False); // Turn off X grid lines$plot->SetDrawYGrid(False); // Turn off Y grid lines$plot->SetDrawXAxis(False); // Don't draw X axis line$plot->SetDrawYAxis(False); // Don't draw Y axis line$plot->SetMarginsPixels(2, 2, 2, 2); // Reduce plot margins to 2 pixels
See Section 5.24, “Example - Using Truecolor To Make a Histogram” for an example of a plot where axis lines arenot desired. (The configuration data as shown in the example draws a full plot area border, so the axis lines would becovered anyway. But if the border is turned off, the axis lines would be visible unless they are suppressed as shown.)
HistoryThis function was added in PHPlot-5.3.0.

SetDrawXDataLabelLines
281
SetDrawXDataLabelLinesSetDrawXDataLabelLines — Draw data label lines for vertical plots
Synopsis
$plot->SetDrawXDataLabelLines($dxdl)
DescriptionSetDrawXDataLabelLines enables drawing of data label lines for plot types that support them. Data label linesare vertical lines drawn from the data points to the edge or edges of the plot with the axis data labels. In the usual case,with the X axis data labels at the bottom of the plot, the data label lines would be drawn from the data points to thebottom of the plot area. Depending on the data label locations set with SetXDataLabelPos, the lines would be drawnup, down, or in both directions from the data points to the top or bottom of the plot area.
To use data label lines, you generally want to turn off X ticks, X tick labels, and the X grid lines. Your data array needsto provide data labels, which will be drawn by default at the bottom of the plot area.
Parameters$dxdl
True to draw the data label lines, False to not draw the lines.
NotesX data label lines only work with these plot types: lines, points, linepoints, and bubbles. Data label lines can only bedrawn if X axis data labels are on.
If a graph contains multiple data sets, data label lines drawn down will start at the maximum Y value for each X value.Data label lines drawn up will start at the minimum Y value for each X value.
By default, data label lines are not drawn.
For an example of X data label lines, see Section 5.33, “Example - Linepoints Plot with Data Value Labels”.
This function is for vertical plot types. For the horizontal plot types, see SetDrawYDataLabelLines.

SetDrawXGrid
282
SetDrawXGridSetDrawXGrid — Whether or not to draw the X grid lines
Synopsis
$plot->SetDrawXGrid([$dxg])
DescriptionSetDrawXGrid enables or disables the drawing of the X grid lines. (The X grid lines are the vertical lines whichintersect the X axis and are parallel to the Y axis.) The default is to not draw the X grid for vertical plots, and to drawthe X grid for horizontal plots.
Parameters$dxg
True to draw the X grid lines, False to not draw the X grid lines. If this parameter is omitted or NULL, the defaultbehavior is restored.
NotesGrid lines are drawn at tick mark positions.
SetLightGridColor sets the color of the grid lines.
HistoryThe ability to specify NULL or omit the parameter to restore the default behavior was added in PHPlot-6.0.0.
SetDrawYAxis
283
SetDrawYAxisSetDrawYAxis — Enable or disable drawing of the Y axis line
Synopsis
$plot->SetDrawYAxis($draw)
DescriptionSetDrawYAxis enables or disables drawing of the Y axis line. Disabling the Y axis line should be necessary onlyin special applications.
Parameters$draw
True to draw the Y axis line, False to not draw the Y axis line.
NotesBy default, the Y axis line is drawn.
Disabling the Y axis line does not disable associated plot elements, nor change the plot margin calculation. To producea completely 'bare' plot, you must turn off the grid, tick marks, tick labels, and data labels. You also need to turn offthe plot area border, which defaults to left and right sides. Lastly, you might want to reduce the margins, since thedefault minimum margin is 15 pixels on each side of the plot area, even if there are no axis lines, labels, or titles. SeeSetDrawXAxis for sample code.
HistoryThis function was added in PHPlot-5.3.0.

SetDrawYDataLabelLines
284
SetDrawYDataLabelLinesSetDrawYDataLabelLines — Draw data label lines for horizontal plots
Synopsis
$plot->SetDrawYDataLabelLines($dydl)
DescriptionSetDrawYDataLabelLines enables drawing of data label lines for horizontal plot types that support them. Datalabel lines are horizontal lines drawn from the data points to the edge or edges of the plot with the axis data labels.In the usual case, with the Y axis data labels on the left side of the plot, the data label lines would be drawn from thedata points to the left side of the plot area. Depending on the data label locations set with SetYDataLabelPos, the lineswould be drawn left, right, or in both directions from the data points to the sides of the plot area.
To use data label lines, you generally want to turn off Y ticks, Y tick labels, and the Y grid lines. Your data array needsto provide data labels, which will be drawn by default on the left side of the plot area.
Parameters$dydl
True to draw the data label lines, False to not draw the lines.
NotesY data label lines only work with these plot types: lines, points, and linepoints, and only when using a data type thatindicates a horizontal plot. Data label lines can only be drawn if Y axis data labels are on.
If a graph contains multiple data sets, data label lines drawn from the left edge will end at the maximum X valuefor each Y value. Data label lines drawn from the right edge will end at the minimum Y value for each X value.(Remember that the X and Y axes are in the same position for vertical and horizontal plots, but the roles of X andY are reversed for horizontal plots.)
By default, data label lines are not drawn.
For an example of Y data label lines, see Section 5.48, “Example - Horizontal Linepoints Plot with Data Value Labelsand Lines”.
This function is for horizontal plot types. For the usual vertical plot types, see SetDrawXDataLabelLines.
HistoryThis function was added in PHPlot-6.0.0. In earlier releases, there was no support for data label lines in any horizontalplot type.

SetDrawYGrid
285
SetDrawYGridSetDrawYGrid — Whether or not to draw the Y grid lines
Synopsis
$plot->SetDrawYGrid([$dyg])
DescriptionSetDrawYGrid enables or disables the drawing of the Y grid lines. (The Y grid lines are the horizontal lines whichintersect the Y axis and are parallel to the X axis.) The default is to draw the Y grid for vertical plots, and not drawthe Y grid for horizontal plots.
Parameters$dyg
True to draw the Y grid lines, False to not draw the Y grid lines. If this parameter is omitted or NULL, the defaultbehavior is restored.
NotesGrid lines are drawn at tick mark positions.
SetLightGridColor sets the color of the grid lines.
HistoryThe ability to specify NULL or omit the parameter to restore the default behavior was added in PHPlot-6.0.0.

SetErrorBarColors
286
SetErrorBarColorsSetErrorBarColors — Sets the colors used for data error bars
Synopsis
$plot->SetErrorBarColors($error_bar_colors)
DescriptionSetErrorBarColors sets the colors used for each data set's error bars, in the same way SetDataColors sets thecolors used for the data plot itself.
Parameters$error_bar_colors
An array of color values, one for each data set's error bars. Or, a single color value (not an array) to use for alldata set error bars. For other possibilities, see Notes. See Section 3.5, “Colors” for more on color values.
NotesIf an array is used for $error_bar_colors, it must use zero-based sequential integer indexes.
If $error_bar_colors is not an array, but a single color value, then that color will be used for all data sets' errorbars. However, the array(r,g,b) notation is not allowed in this case (because it looks like an array of 3 separate colorvalues). You can get around this restriction if you want to specify a single color as an R, G, B array by wrapping thearray in another array, for example: array(array(102, 0, 192)).
Two special uses of the $error_bar_colors argument are available. If the argument is an empty string, or booleanFalse, the color map is reset to the defaults. This can be used to restore the default color map. If the argument is NULLor missing from the function call, the color map is reset to the defaults, but only if it has not already been set. Thisis used internal to PHPlot for one-time initialization.
If SetErrorBarColors is never called, the default color map is the same as for SetDataColors. It contains 16 colors,starting with SkyBlue, green, orange, and blue. For the full list, see Section 3.5.3, “Plotting Colors”.
If you change the data colors with SetDataColors, you probably want to change the error bar colors to the same array.
A data colors callback, as described in Section 4.5, “Custom Data Color Selection”, also controls selection of the colorfor error bars.
HistoryThrough PHPlot-5.0.7, the default color map contained these 8 colors: SkyBlue, green, orange, blue, orange, red, violet,and azure1. These were used if SetErrorBarColors was never called. Also, through PHPlot-5.0.7, if SetErrorBarColorswas called with an empty string argument, the color map was set to just contain 'black'. Starting with PHPlot-5.1.0, anew default color map with 16 colors was defined. Given an empty string (or False), SetErrorBarColors now restoresthe default color map.

SetErrorBarLineWidth
287
SetErrorBarLineWidthSetErrorBarLineWidth — Set the line width used for error bars
Synopsis
$plot->SetErrorBarLineWidth($seblw)
DescriptionSetErrorBarLineWidth sets the line width used for error bars. This width is used to draw the vertical linesindicating the error range in the positive and negative direction, and also the tees (if enabled) and the top and bottom.
Parameters$seblw
Desired width in pixels of the lines used to draw error bars.
NotesThe default is to use 1 pixel wide lines.
This is only used with error plots (data types data-data-error and data-data-yx-error).
All lines in a plot use the same error bar width.

SetErrorBarShape
288
SetErrorBarShapeSetErrorBarShape — Select line or tee-style error bars
Synopsis
$plot->SetErrorBarShape($ebs)
DescriptionSetErrorBarShape selects the shape used for error indicators. Two shapes are available: 'tee' puts a shorthorizontal line at the top and bottom of each error bar, and 'line' does not.
Parameters$ebs
Error bar shape: either 'tee' or 'line'.
NotesThe default error bar shape is 'tee'.
This is only used with error plots (data types data-data-error and data-data-yx-error).
All lines in a plot use the same error bar shape.

SetErrorBarSize
289
SetErrorBarSizeSetErrorBarSize — Set the size of the error bar tee.
Synopsis
$plot->SetErrorBarSize($ebs)
DescriptionSetErrorBarSize sets the length of the 'tee' drawn at the top and bottom of error bars, if the error bar shape isset to 'tee' with SetErrorBarShape (or defaulted to 'tee').
Parameters$ebs
Error bar tee length in pixels.
NotesThe default size is 5 pixels.
This is only used with error plots (data types data-data-error and data-data-yx-error), and with error bar shape 'tee'.
All lines in a plot use the same error bar size.

SetFailureImage
290
SetFailureImageSetFailureImage — Enable or disable error image production on failure
Synopsis
$plot->SetFailureImage($error_image)
DescriptionSetFailureImage can be used to disable the error image normally produced by PHPlot if a fatal error occurs.
Parameters$error_image
True to enable the error image, False to disable the error image.
NotesSee Section 3.9, “Error Handling” for an overview of error handling in PHPlot. The error image is enabled by default.
If failure occurs when error images are disabled, PHPlot will still trigger a user-level error condition, which willnormally log the error to the server log and terminate the script. However, there will be no feedback to the user thatthe error occurred.
SetFailureImage(False) should be called right after creating the PHPlot object if using EncodeImage to returnthe image as a string (rather than output the image). This will make sure that no unexpected error image is producedby a script that would not normally produce an image at all.
HistoryThis function was added in PHPlot-5.5.0.

SetFileFormat
291
SetFileFormatSetFileFormat — Select the graphic image format generated by PHPlot
Synopsis
$plot->SetFileFormat($format)
DescriptionSetFileFormat selects a graphic image format from the available image formats. Depending on how PHP and/orGD were built on your system, available formats include JPEG, PNG, GIF, and WBMP.
Parameters$format
What graphic image format to use: 'jpg', 'png', 'gif', or 'wbmp'.
NotesThe default file format is 'png'.
Depending on how GD was built, not all of these formats will be available. You can use phpinfo() to see whatformats are supported by your PHP/GD installation.
JPEG is generally a bad choice for this type of image, as the lossy compression reduces the quality of lines and text.

SetFont
292
SetFontSetFont — Select which font to use for a plot element
Synopsis
$plot->SetFont($elem, $font, [$size], [$line_spacing])
DescriptionSetFont selects the font and size to use for one plot element (for example, the title). This functions works differentlydepending on whether or not you are using TrueType fonts. If using TrueType fonts, call either SetDefaultTTFont orSetUseTTF before calling SetFont.
Parameters$elem
The name of the element to change the font for. Use one of the following strings: 'title', 'legend', 'generic', 'x_label','y_label', 'x_title', or 'y_title'.
$fontSelects the font to use. For TrueType fonts, this is either the full pathname of a TrueType font filename, or thefilename (without path) if the font file is either located in the default TrueType font directory set with SetTTFPathor can be found by GD using its default search rules. An empty string or NULL can be specified to use the defaultTrueType font.
For built-in GD fonts, this is a number between 1 and 5 which selects one of the built-in GD fonts. Font 1 is thesmallest, and font 5 is the largest.
$sizeThe font size in points for TrueType fonts. Ignored for built-in GD fonts. If not specified, a default value of 12is used. See note below.
$line_spacingOptional line spacing adjustment for this text element. This is interpreted differently for GD and TrueType text.See SetLineSpacing for details. If not specified, the value set by SetLineSpacing is used.
NotesSee also Section 3.8, “Text Fonts”.
The generic font is used for pie chart segment labels, message image text (see DrawMessage), error image text, andcan be used from callbacks (see Section 4.4.5, “Using Callbacks to Annotate Plots”). However, changing this font hasno effect on error image text, because the PHPlot error handler resets the font to the default before displaying the error.
When using built-in GD fonts, the default fonts are shown in the following table, where font 1 is the smallest fontand font 5 is the biggest font.
Element Default Built-in Font
generic 2

SetFont
293
Element Default Built-in Font
legend 2
title 5
x_label 1
y_label 1
x_title 3
y_title 3
When using TrueType fonts, the default font sizes are shown in the following table. Use SetDefaultTTFont to set thedefault TrueType font.
Element Default TrueType FontSize (points)
generic 8
legend 8
title 14
x_label 6
y_label 6
x_title 10
y_title 10
Simultaneous use of GD and TrueType font text is allowed in the same plot. To mix font types, use SetFontGD andSetFontTTF to specify the font and font type of an element, instead of using SetFont.
SetFont implicitly uses the default font type. When a PHPlot object instance is created, the default font type is GD.Using SetUseTTF(True), or selecting a default font with SetDefaultTTFont, sets the default font type to TrueType.Using SetUseTTF(False) sets the default font type back to GD. Either of these three operations will also reset allcurrent text elements to the defaults indicated above, negating any prior SetFont, SetFontGD, or SetFontTTF calls.Note that SetTTFPath, which selects the directory where TrueType fonts can be found, does not affect the default fonttype nor does it change any existing font selections.
Although PHP documents the TrueType font sizes as being given in points (where there are about 72 points per inch),it doesn't know the output device resolution, so it just assumes a fixed resolution of 72 pixels per inch. As a result,the TrueType font size argument actually measures the approximate font height in pixels. For example, if you use$size=18, the text will be about 18 pixels high in the user's browser. The actual size seen by the user will depend onthe resolution of the user's display. On a 72 pixels per inch display, the text size will be 18 points, but at 96 pixelsper inch it would only be 13.5 points.
HistoryStarting with PHPlot-5.1.3, TrueType fonts are validated by trying to use the font with a non-drawing operation, ratherthan by seeing if the font file exists. See Section 3.8.3, “TrueType Font Selection” for more information.
Simultaneous use of GD and TrueType font text was added at PHPlot-5.0.6. Through PHPlot-5.0.5, all text in a plotused GD fonts, or all text used TrueType fonts.
The line_spacing parameter was added at PHPlot-5.0.6 to allow finer control over the line spacing for differentelements. Through PHPlot-5.0.5, the same line spacing was used for all text elements.

SetFont
294
The described behavior for finding TrueType font files (first using the name as given, then looking in the SetTTFPathfont directory) was implemented in PHPlot-5.0rc3.
SetFontGD
295
SetFontGDSetFontGD — Select a GD font to use for a plot element
Synopsis
$plot->SetFontGD($elem, $font, [$line_spacing])
DescriptionSetFontGD selects a GD font to use for one plot element (for example, the title). This function supplements SetFont,which selects a GD or TTF font depending on the currently selected font type. SetFontGD always selects a GD font,even if TrueType fonts are in use.
Parameters$elem
The name of the element to change the font for. Use one of the following strings: 'title', 'legend', 'generic', 'x_label','y_label', 'x_title', or 'y_title'.
$fontSelects the GD font to use. This is a number between 1 and 5 which selects one of the built-in GD fonts. Font1 is the smallest, and font 5 is the largest.
$line_spacingOptional line spacing adjustment for this text element. For GD fonts, this is the number of pixels between lines.If not specified, the value set by SetLineSpacing is used.
NotesSee Section 3.8, “Text Fonts”, SetFont for more information about fonts, and SetLineSpacing for more informationabout line spacing.
The generic font is used for pie chart segment labels, message image text (see DrawMessage), error image text, andcan be used from callbacks (see Section 4.4.5, “Using Callbacks to Annotate Plots”). However, changing this font hasno effect on error image text, because the PHPlot error handler resets the font to the default before displaying the error.
Use SetUseTTF (or SetDefaultTTFont, which calls it) to set the default font type. Use SetFont to specify the font touse for an element using the default font type. Use SetFontGD and SetFontTTF to specify the font of an element usingthe specific type of font.
HistoryThis function was added at PHPlot-5.0.6, along with SetFontTTF, to allow mixing GD and TrueType fonts in thesame graph.

SetFontTTF
296
SetFontTTFSetFontTTF — Select a TrueType font to use for a plot element
Synopsis
$plot->SetFontTTF($elem, $font, [$size], [$line_spacing])
DescriptionSetFontTTF selects a TrueType font and size to use for one plot element (for example, the title). This functionsupplements SetFont, which selects a GD or TTF font depending on the currently selected font type. SetFontTTFalways selects a TrueType font, even if TrueType fonts are not the default font type.
Parameters$elem
The name of the element to change the font for. Use one of the following strings: 'title', 'legend', 'generic', 'x_label','y_label', 'x_title', or 'y_title'.
$fontSelects the TrueType font to use. This is either the full pathname of a TrueType font filename, or the filename(without path) if the font file is either located in the default TrueType font directory set with SetTTFPath or can befound by GD using its default search rules. See Section 3.8.3, “TrueType Font Selection” for more information.An empty string or NULL can be specified to use the default TrueType font.
$sizeThe TrueType font size in points. If not specified, a default value of 12 is used.
$line_spacingOptional line spacing adjustment for this text element. For TrueType text, this is an adjustment factor for the built-in font spacing. See SetLineSpacing for details.
NotesSee Section 3.8, “Text Fonts”, SetFont for more information about fonts, and SetLineSpacing for more informationabout line spacing.
The generic font is used for pie chart segment labels, message image text (see DrawMessage), error image text, andcan be used from callbacks (see Section 4.4.5, “Using Callbacks to Annotate Plots”). However, changing this font hasno effect on error image text, because the PHPlot error handler resets the font to the default before displaying the error.
Use SetUseTTF (or SetDefaultTTFont, which calls it) to set the default font type. Use SetFont to specify the font touse for an element using the default font type. Use SetFontGD and SetFontTTF to specify the font of an element usingthe specific type of font.
HistoryStarting with PHPlot-5.1.3, TrueType fonts are validated by trying to use the font with a non-drawing operation, ratherthan by seeing if the font file exists. See Section 3.8.3, “TrueType Font Selection” for more information.
This function was added at PHPlot-5.0.6, along with SetFontGD, to allow mixing GD and TrueType fonts in the samegraph.

SetGridColor
297
SetGridColorSetGridColor — Set the color used for the axes and borders
Synopsis
$plot->SetGridColor($color)
DescriptionSetGridColor sets the color used for the X and Y axes, the plot border, and the legend border. It also sets thedefault color for pie chart data labels and pie chart segment borders.
Parameters$color
Color value to use. See Section 3.5, “Colors” for more on color values.
NotesThe default color is black.
This doesn't actually set the color used by the grid; for that see SetLightGridColor. We have no idea why this is so.
The color used for pie chart segment borders is set with SetPieBorderColor (starting with PHPlot-6.0.0), withSetGridColor providing a default color.
The color used for pie chart data labels is set with SetPieLabelColor (starting with PHPlot-5.7.0), withSetGridColor providing a default color.

SetImageBorderColor
298
SetImageBorderColorSetImageBorderColor — Set image border color, if enabled
Synopsis
$plot->SetImageBorderColor($color)
DescriptionSetImageBorderColor sets the color to use for a border around the entire image.
Parameters$color
Color value to use. See Section 3.5, “Colors” for more on color values.
NotesThe image border is only drawn if SetImageBorderType is called with a type other than 'none'. By default there is noborder. If the border is enabled but no color is set, the default color is gray (194,194,194).
Either the specified color, a darker shade of that color, or both are used to draw the image border. SeeSetImageBorderType for details.
The border width can be set with SetImageBorderWidth.

SetImageBorderType
299
SetImageBorderTypeSetImageBorderType — Draw a border around the image
Synopsis
$plot->SetImageBorderType($sibt)
DescriptionSetImageBorderType controls the drawing of a border around the entire image. By default, no border is drawn.
Parameters$sibt
A string indicating the desired border type: 'raised', 'plain', 'solid', or 'none'. Use 'none' to revert to the default ofno border. Use 'solid' for a border drawn with the specified color. Use 'plain' for a border drawn with a darkershade of the specified color. Use 'raised' for a border that appears to raise the image, by drawing the top and leftsides with the specified color and the bottom and right sides with a darker shade of the specified color.
NotesThe base color for the image border is set with SetImageBorderColor. Either that color, a darker shade of that color,or both are used to draw the border, as described above.
The image border width can be set with SetImageBorderWidth. The default width is 1 pixel for types 'plain' and 'solid',and 2 pixels for 'raised'.
It can be useful to have a border drawn around images when embedded in an HTML page. An alternative to thisfunction is to use the BORDER attribute in the IMG tag when embedding the image.
HistoryThrough PHPlot-5.1.1, the choices were 'none', 'plain' for a 1 pixel wide border using the darker shade, or 'raised' fora 2 pixel wide border using the specified color for the top and left sides and a darker shade for the bottom and right.There was no way to control the border width. Starting with PHPlot-5.1.2, a new choice 'solid' was added to use theexact color specified with SetImageBorderColor rather than using the darker shade like 'plain' uses (which may havebeen a bug). A new function SetImageBorderWidth was added to control the border width.
Use of 'none' to turn the border off was added in PHPlot-5.1.0.

SetImageBorderWidth
300
SetImageBorderWidthSetImageBorderWidth — Set the width for the image border
Synopsis
$plot->SetImageBorderWidth($width)
DescriptionSetImageBorderWidth sets the width of an image border, if enabled by SetImageBorderType.
Parameters$width
The desired border width, in pixels.
NotesUse SetImageBorderType to enable the border. Use SetImageBorderColor to set the border color.
By default, the image border width is 1 pixel for a 'solid' or 'plain' border type, and 2 pixels for a 'raised' border type.
HistoryThis function was added in PHPlot-5.1.2.

SetIsInline
301
SetIsInlineSetIsInline — Set the output image to be inline - without HTTP headers
Synopsis
$plot->SetIsInline($is_inline)
DescriptionSetIsInline determines if HTTP headers are sent along with the output image or not. By default, HTTP headersare sent, identifying the image type for browsers. If PHPlot output is not being directed to a browser, or in other special-purpose applications, you can turn off the HTTP content type header using this function.
Parameters$is_inline
True to suppress HTTP content type headers, False to include the headers.
NotesThe default is to include the headers. However, the PHP CLI (command line interface) never outputs headers, so usingthis function is not necessary if you are using the PHP CLI to create image files by redirecting standard output to a file.
You must call SetIsInline(True) if you are sending PHPlot output to a file with SetOutputFile, or by supplying afilename argument to the PHPlot constructor.

SetLabelScalePosition
302
SetLabelScalePositionSetLabelScalePosition — Position pie-chart labels
Synopsis
$plot->SetLabelScalePosition($blp)
DescriptionSetLabelScalePosition adjusts the position of the pie chart data labels which identify the pie segments.
Parameters$blp
Position factor for the pie chart labels. This is a floating point number. The default value is 0.5, which places thelabels just outside the pie circumference. See notes below.
NotesThis affects pie charts only.
Values greater than or equal to 0.5 place the labels outside the pie. The default value 0.5 places the labels outside andclose to the pie circumference. Larger values move the labels away from the pie. A value of 1.0 would place the labelsabout twice as far from the pie center as the pie radius.
Values less than 0.5 place the labels inside the pie circumference, with smaller values moving the labels in towardsthe center. To place the labels just inside the pie circumference, use 0.49 (for example). Using 0 (or False) resultsin no labels at all.
A more detailed definition of the label scale position parameter is that it is a scale factor applied to the diameter of thepie (at the angle where the label will be drawn), which determines the text basepoint for the label. However, PHPlotadjusts the result when it is close to the pie circumference.
Note that PHPlot sizes the pie chart so the labels fit inside the plot area, if possible. This means the label scale positionwill affect the pie size, if greater than or equal to 0.5.
To control the pie chart label contents, see SetPieLabelType.
HistoryStarting with PHPlot-5.6.0, the label scale position argument was interpreted as above, with values greater than or equalto 0.5 meaning outside the pie, values less than 0.5 meaning inside, and 0 meaning no labels. Through PHPlot-5.5.0,the label scale position was used with less precision, and included an additional 1.2 scale factor to try to move thelabels further out in the hope that they would be clear of the pie.
Accepting 0 or False as a valid argument value to disable the labels was added in PHPlot-5.6.0. Before that, thelabels were always plotted.
The ability to control pie label contents, and the automatic sizing of the pie to leave room for labels, were addedin PHPlot-5.6.0. Through PHPlot-5.5.0, pie chart labels always displayed segment percentages, and the pie size wascalculated without regard to the labels.

SetLegend
303
SetLegendSetLegend — Add text to a legend box
Synopsis
$plot->SetLegend($leg)
DescriptionSetLegend sets the text to be displayed in the legend. A legend is often needed when a plot contains more thanone data set, to identify the purpose of the different data sets being plotted. The legend text consists of multiple lines,with each line identifying one data set on the plot. PHPlot adds an identifying color box or shape marker next to eachline in the legend.
Parameters$leg
An array with each element containing the text for one line of the legend. Or, if not an array, the one line to beappended to the legend. See notes.
NotesBy default, no legend is displayed.
The legend usually needs to contain one line of text for each data set plotted on the graph, in the same order as thedata array. You can supply all the legend lines in a single call to SetLegend as an array, or you can build up the legendone line at a time with multiple calls to SetLegend, supplying one line per call (in the same order as the data sets inthe data array).
By default, legend text lines are displayed in order from top to bottom in the legend. (See SetLegendReverse to reversethe order.) Each line also has a color box or shape maker with the corresponding color from the data colors array.The colors used in the legend color boxes or shape markers are independent of any custom data color callback (seeSection 4.5, “Custom Data Color Selection”).
To cancel a legend (perhaps as part of drawing multiple plots on an image), pass an empty array or NULL as $leg.
To control the legend position on the plot, use SetLegendPixels, SetLegendWorld, or the more generalSetLegendPosition. You can control the text and color box or shape marker alignment within the legend usingSetLegendStyle.
Use SetLegendUseShapes to select color boxes or shape markers in the legend.
HistoryAccepting NULL as a valid argument value was added in PHPlot-5.3.1. Through PHPlot-5.3.0, passing NULL wouldcause an error.

SetLegendBgColor
304
SetLegendBgColorSetLegendBgColor — Set legend background color
Synopsis
$plot->SetLegendBgColor($color)
DescriptionSetLegendBgColor sets the background color used in the legend.
Parameters$color
Color value to use. See Section 3.5, “Colors” for more on color values.
NotesIf SetLegendBgColor is not used, the legend background color will be the same as the image background color.The image background color is set with SetBackgroundColor, and defaults to white.
If you position the legend outside the plot area, this function is useful to make it stand out more, by using a color thatdiffers from image background color. Similarly, if your legend is positioned inside the plot area, but you have notchanged the plot area background, you can use this function to make the legend stand out with a different backgroundcolor.
HistoryThis function was added in PHPlot-6.0.0. In earlier releases, the legend background was always drawn using the imagebackground color.

SetLegendColorboxBorders
305
SetLegendColorboxBordersSetLegendColorboxBorders — Control the borders around color boxes in the legend
Synopsis
$plot->SetLegendColorboxBorders([$cbbmode])
DescriptionSetLegendColorboxBorders controls the appearance of the borders around the color boxes in the legend. Theborders can be off, on using the Text color, or on using the set of Data Border colors.
Parameters$cbbmode
Optional string indicating the color mode for the legend color boxes. If supplied, it must be one of the followingvalues:
Mode Description
none No color box borders aredrawn
textcolor Use the Textcolor for alllegend color boxes
databordercolor Use successive entriesfrom the Data BorderColors array for eachlegend color box
If omitted, textcolor is used.
NotesBy default, the color boxes are drawn using the text color set with SetTextColor, which defaults to black.
If the color box border mode is databordercolor, then the colors set with SetDataBorderColors are used. (Theseare the same colors used as borders for the bars in a bar chart.) The top line (or bottom line, if SetLegendReverse(True)is used) in the legend will have a color box using the first data color (see SetDataColors) and a border using the firstdata border color, etc.
HistoryThis function was added in PHPlot-6.0.0. In earlier releases, the legend color boxes always had a border using thetext color.

SetLegendPixels
306
SetLegendPixelsSetLegendPixels — Position the legend on the image (device coordinates)
Synopsis
$plot->SetLegendPixels([$x, $y])
DescriptionSetLegendPixels lets you position the legend on the image, using device coordinates, rather than letting PHPlotposition it for you.
Parameters$x , $y
Absolute device coordinates of the upper left corner of the legend box. The units are pixels and the origin is in theupper left corner of the image. If the values are omitted or NULL, the default behavior is restored.
NotesThe default behavior is for PHPlot to position the legend in the upper right corner of the plot area.
See SetLegendPosition for more flexible legend positioning options. SetLegendPixels($x, $y) is equivalentto SetLegendPosition(0, 0, 'image', 0, 0, $x, $y). This places the top left corner of the legendat the top left corner of the image, offset by ($x, $y) pixels.
See also SetLegendWorld.
HistoryThrough PHPlot-5.3.0, the arguments were required. To restore the default behavior, it was necessary to useSetLegendPixels(NULL, NULL). Starting with PHPlot-5.3.1, the arguments may be omitted to restore thedefault behavior.

SetLegendPosition
307
SetLegendPositionSetLegendPosition — Position the legend
Synopsis
$plot->SetLegendPosition($x, $y, $relative_to, $x_base, $y_base, [$x_offset], [$y_offset])
DescriptionSetLegendPosition lets you position the legend on the image, using relative coordinates, world coordinates, ordevice (pixel) coordinates.
Parameters$x , $y
Relative coordinates of a point on the legend box to use as a reference. The coordinates are relative to the size ofthe legend box, with the upper left corner as (0.0, 0.0) and the lower right corner as (1.0, 1.0).
$relative_toA string indicating how the next two parameters ($x_base, $y_base) are interpreted. Accepted values are: image,plot, world, or title. See the description of the next parameters for details.
$x_base , $y_baseReference point for positioning the legend. The interpretation depends on the previous parameter $relative_to asfollows.
$relative_to $x_base, $y_base
image Relative coordinates of a point on the image. The point on the legend box indicated by ($x,$y) is placed at this point. These coordinates are relative to the size of the image, with (0.0,0.0) being the upper left corner, and (1.0, 1.0) being the lower right corner.
plot Relative coordinates of a point on the plot area. (The plot area is generally the area enclosedby the X and Y axis lines.) The point on the legend box indicated by ($x, $y) is placed atthis point. These coordinates are relative to the size of the plot area, with (0.0, 0.0) being theupper left corner, and (1.0, 1.0) being the lower right corner.
title Relative coordinates of a point in the main plot title. The point on the legend box indicatedby ($x, $y) is placed at this point. These coordinates are relative to a bounding box whichencloses the main plot title, with (0.0, 0.0) being the upper left corner of the title, and (1.0,1.0) being the lower right corner.
world World coordinates
$x_offset , $y_offsetOptional arguments specifying an additional offset for the legend, in device (pixel) coordinates. After the legendposition has been calculated using the preceding arguments, this offset is added to the position. It can be usedto move the legend a little bit away from the edge of the image or plot, for example. If not specified, no offsetis applied.
NotesFor examples of using SetLegendPosition, see Section 5.36, “Example - Legend Positioning”.

SetLegendPosition
308
By default, PHPlot will position the legend in the upper right corner of the plot area, with a small offset. This isequivalent to:
$plot->SetLegendPosition(1, 0, 'plot', 1, 0, -5, 5);
The default behavior can be restored by using NULL for the $x and $y arguments (or the $x_offset and $y_offsetarguments) in SetLegendPosition. That is, using NULL for any of those arguments undoes any previous call toSetLegendPosition, SetLegendPixels, and SetLegendWorld.
See SetLegendPixels and SetLegendWorld for simpler forms of legend positioning.
SetLegendWorld($x, $y) is equivalent to SetLegendPosition(0, 0, 'world', $x, $y).
SetLegendPixels($x, $y) is equivalent to SetLegendPosition(0, 0, 'image', 0, 0, $x, $y).
The value of each of X and Y used in relative coordinates are usually in the range (0.0 <= x, y <= 1.0), but this is notrequired by PHPlot. For the legend box reference point ($x, $y) or when using 'title' or 'plot' mode ($base_x, $base_y),a value outside this range may be used to refer to a point outside the object. For example, using (-1, -1) for ($x, $y)indicates a point above and to the left of the upper left corner of the legend box at a distance equal to the width andheight of the legend box. Relative coordinates outside this range for 'image' mode ($base_x, $base_y) will be outsidethe image and not visible.
Positioning relative to 'world' will not work with pie charts, because they have no valid world coordinates.
HistoryThis function was added in PHPlot-5.4.0, and SetLegendPixels and SetLegendWorld were changed to be simplewrappers that call SetLegendPosition. No other legend positioning methods were available in earlier releases.

SetLegendReverse
309
SetLegendReverseSetLegendReverse — Control the order of text lines in the legend
Synopsis
$plot->SetLegendReverse($reverse)
DescriptionSetLegendReverse is used to change the order of entries in the legend. A legend is drawn if SetLegend is used.The legend consists of a series of text strings and color boxes or shape markers. The contents of the legend helpsidentify the different data sets in the plot (for example, the separate plot lines). The legend line identifying the firstdata set is normally drawn at the top of the legend, with the rest of the lines in order below it. SetLegendReversecan be used to reverse that order, so the line for the first data set is drawn at the bottom of the legend.
Parameters$reverse
True to reverse the order of legend entries (bottom up), False to keep the default order (top down).
NotesThe main use of this function is to set the legend line order for stackedarea, stackedbars, and stackedsquaredarea plots.In these plot types, the first data set (bar segment or area section) is plotted along the the bottom of the plot, withsubsequent data sets in order above it. By default, a legend for these plot types will correctly identify the data setsby color, but the entries in the legend will be in the opposite order compared to the data sets and colors on the plot.Use $plot->SetLegendReverse(True) with these plot types to keep the legend entries and plotted data setsin the same order.
See Section 5.15, “Example - Stacked Bars, Unshaded” for an example showing the legend ordering reversal, comparedto Section 5.14, “Example - Stacked Bars, Shaded”.
HistoryThis function was added to PHPlot-5.5.0.

SetLegendStyle
310
SetLegendStyleSetLegendStyle — Control the appearance of the legend
Synopsis
$plot->SetLegendStyle($text_align, [$colorbox_align])
DescriptionSetLegendStyle controls the appearance of the legend, which is drawn if SetLegend is used. The legend containsof a series of text strings and either color boxes or shape markers, identifying the plot lines. SetLegendStyle sets thealignment of the text strings and color boxes or shapes markers. First the color boxes or shapes markers are alignedwithin the legend box, left or right, and then the text strings are aligned within the remaining space, left or right.SetLegendStyle can also turn off the color boxes or shape markers.
Parameters$text_align
A string indicating the alignment of the text strings: 'left' or 'right'. If 'left', the text strings are left-aligned betweenthe legend box edge and the color boxes or shape markers. If 'right', the text strings are right-aligned between thelegend box edge and the color boxes or shape markers.
$colorbox_alignOptional string indicating the alignment of the color boxes or shape markers: 'left', 'right', or 'none'. If 'left', they aredrawn along the left side of the legend box. If 'right', they are drawn along the right side of the legend box. If 'none',no color boxes or shape markers are drawn. If this parameter is omitted, the same alignment as $text_align is used.
NotesBy default, the color boxes or shape markers are lined up along the right side of the legend box, and the text stringsare right-aligned just left of the color boxes or shape markers. The following figure shows the four possible alignmentchoices.
Using 'none' for $colorbox_align results in a legend with only text lines. This is not recommended for multi-line ormulti-dataset plots, unless you have provided some other way to indicate which legend text line goes with which plot,or if you are using the legend for some purpose other than identifying the plot lines.

SetLegendStyle
311
HistoryIn PHPlot-6.0, the term 'point shapes' was replaced with 'shape markers', since PHPlot can now produce markers forline plots as well. (There was no change to the behavior of SetLegendStyle - only the description changed.)
The option to use point shapes instead of color boxes in the legend was added in PHPlot-5.4.0. SeeSetLegendUseShapes. In earlier releases, the $colorbox_align parameter to SetLegendStyle only appliedto color boxes.
Through PHPlot-5.3.1, there was an optional third parameter $style, which was intended for possible future use butwas never used. It was removed at PHPlot-5.4.0.
This function was added to PHPlot-5.0.4.

SetLegendTextColor
312
SetLegendTextColorSetLegendTextColor — Set legend text color
Synopsis
$plot->SetLegendTextColor($color)
DescriptionSetLegendTextColor sets the color used for lines of text in the legend.
Parameters$color
Color value to use. See Section 3.5, “Colors” for more on color values.
NotesIf SetLegendTextColor is not used, text in the legend will be drawn using the general text color as set withSetTextColor. The default for the general text color is black.
HistoryThis function was added in PHPlot-6.0.0. In earlier releases, the text in the legend was always drawn using the generaltext color.

SetLegendUseShapes
313
SetLegendUseShapesSetLegendUseShapes — Use color boxes or shape markers in the legend
Synopsis
$plot->SetLegendUseShapes($use_shapes)
DescriptionSetLegendUseShapes sets the legend to use either color boxes or shapes marker to show which legend line goeswith which data set.
Parameters$use_shapes
A boolean value: true to use shape markers, false to use color boxes.
NotesBy default, the legend is drawn with color boxes.
Use of SetLegendUseShapes(True) instructs PHPlot to use an alternate marker in the legend. The markerdepends on the plot type used in the plot.
• For points and linepoints plots, the alternate marker is the point shape used to identify the data set in the plot.
• For lines and squared plots, the alternate marker is a short horizontal line segment matching the corresponding dataset line in the plot.
• For all other plot types, no alternate marker is defined, and SetLegendUseShapes is ignored.
When shape markers are enabled using SetLegendUseShapes(True), PHPlot will first draw a solid box withthe same color as the plot area background (if plot area background color is enabled with SetPlotBgColor andSetDrawPlotAreaBackground). Then it will draw the shape marker, overlaying the background box.
Point shape markers will have the same color and size as the point shape used in the plot for the corresponding dataset. Note that PHPlot will not adjust the legend box size or line spacing based on the point shape sizes set withSetPointSizes. If the point shapes are too big, they will overflow their allocated space and overlap. You can control thelegend text line height to account for large point shapes by adjusting the line spacing parameter (using SetLineSpacing,SetFont, or related font control functions.
Line segment markers will have the same color, line width, and style as the lines used in the corresponding data set. Thearea reserved in the legend for color boxes or shape markers is automatically made 4 times wider when line segmentmarkers are used, in order to improve visibility.
For examples of legends with color boxes and shape markers, see Section 5.35, “Example - Legend with ShapeMarkers”.
HistoryPHPlot-6.0.0 added a third type of shape marker for legends: line segments, and SetLegendUseShapes nowapplies to more plot types. Before PHPlot-6.0.0, only color boxes and point shape markers were available, andSetLegendUseShapes was ignored with plot types other than points and linepoints.

SetLegendUseShapes
314
This function was added to PHPlot-5.4.0. Before that, only color boxes were available in legends.

SetLegendWorld
315
SetLegendWorldSetLegendWorld — Position the legend on the image (world coordinates)
Synopsis
$plot->SetLegendWorld($x, $y)
DescriptionSetLegendWorld lets you position the legend on the image, using world coordinates, rather than letting PHPlotposition it for you. (World coordinates are the coordinate space of your data points.)
Parameters$x , $y
World coordinates of the upper left corner of the legend box. The units and origin are the same as the data youare plotting.
NotesThe default behavior is for PHPlot to position the legend in the upper right corner of the plot area.
See SetLegendPosition for more flexible legend positioning options. SetLegendWorld($x, $y) is equivalentto SetLegendPosition(0, 0, 'world', $x, $y). This places the top left corner of the legend at worldcoordinates $x, $y with no pixel offset.
See also SetLegendPixels.
This function will not work with pie charts, because they have no valid world coordinates.
HistoryThis function did actually work with pie charts through PHPlot-5.5.0, although we are not sure what it did, since piecharts do not have valid world coordinates.
Through PHPlot-5.0rc3, it was required that the data array, axis types, and any other setting which affects the scale ofthe data be set up before this function is used. Starting at PHPlot-5.0.4 this is no longer required, as the coordinatesyou supply are not scaled until the plot is drawn.

SetLightGridColor
316
SetLightGridColorSetLightGridColor — Set the color for grid lines and data label lines
Synopsis
$plot->SetLightGridColor($color)
DescriptionSetLightGridColor sets the color used for the X and Y grid lines. This color is also used for X data label lines,if enabled with SetDrawXDataLabelLines, and for Y data label lines, if enabled with SetDrawYDataLabelLines.
Parameters$color
Color value to use. See Section 3.5, “Colors” for more on color values.
NotesThe default color is gray.
This function, not SetGridColor, sets the color for the grid lines.

SetLineSpacing
317
SetLineSpacingSetLineSpacing — Set spacing between lines of multi-line text elements
Synopsis
$plot->SetLineSpacing($spc)
DescriptionSetLineSpacing sets the default spacing between lines of a multi-line text element. Multiple lines can be specifiedin titles, for example, by placing a newline between lines (for example: "Line 1\nLine 2"). Line spacing also affectsthe legend. You can override the default line spacing for individual text elements (such as the X title) using SetFont,SetFontGD, and SetFontTTF.
Parameters$spc
Desired default line spacing factor. For the built-in GD fonts, this is the number of pixels between lines. ForTrueType fonts, this is an adjustment factor for the font's built-in line spacing (see notes).
NotesThe default line spacing value is 4. For GD fonts, this is the number of pixels between text lines, and is independentof the font size.
TrueType fonts have a built-in line spacing amount, which is the distance between the baseline of one text line andthe top of the next text line. With TrueType text, PHPlot uses the line spacing value (set with SetLineSpacing or oneof the SetFont functions) as an adjustment factor for this built-in line spacing. A value of 4 produces the built-in linespacing, lower values reduce the spacing and larger values increase the spacing. A value of 0 for line spacing wouldresult in the baseline of one line nearly touching the top of the next line.
HistoryThe interpretation of the line spacing as an adjustment factor for TrueType text, rather than a value in pixels, beganwith PHPlot-5.0.6. This is also when the line spacing could be adjusted for each text element.
At PHPlot-5.0.5, line spacing was the number of pixels between lines of text, for both GD or TrueType fonts. BeforePHPlot-5.0.5, line spacing did not affect TrueType font text at all, except in the legend.
Before PHPlot-5.0.5, the line spacing had to be set before setting titles, because the title height was calculated whensetting the title. This restriction was removed in PHPlot-5.0.5, so line spacing and titles can be set in either order.

SetLineStyles
318
SetLineStylesSetLineStyles — Set the line style (solid or dashed) for each data set
Synopsis
$plot->SetLineStyles($ls)
DescriptionSetLineStyles selects the line style for each plotted data set.
Parameters$ls
An array of strings, each either 'solid', for solid lines; 'dashed', for dashed lines, or 'none', to suppress the lines(see notes). Or, a single value of 'solid' or 'dashed' to apply to all data sets.
NotesIf an array is used for $ls, it must use zero-based sequential integer indexes.
The line style for dashed lines can be set with SetDefaultDashedStyle.
By default, the line styles are 'solid', 'solid', and 'dashed'. (As with all style arrays, PHPlot duplicates the array asneeded for the number of data sets to be plotted.) This means the 3rd and 6th data sets will plot as dashed lines unlessyou use SetLineStyles to change it.
A line style can be set to 'none' to suppress the line for that data set. This is only useful with 'linepoints' plot types,and results in a 'points' plot type for that data set: markers only, but no lines. (This is available with PHPlot-5.0rc3and higher.)

SetLineWidths
319
SetLineWidthsSetLineWidths — Set line width (thickness) for each data set
Synopsis
$plot->SetLineWidths($lw)
DescriptionSetLineWidths sets the desired line width to be used when plotting each data set.
Parameters$lw
An array of line widths in pixels, one for each data set to be plotted. Or, a single value to be used for all data sets.
NotesIf an array is used for $lw, it must use zero-based sequential integer indexes.
The plot types that support using different line widths for the data sets being plotted are: lines, linepoints, squared,and thinbarline. In addition, you can use SetLineWidths with some other plot types which support only a singledata set but use multiple line widths in a plot-specific way: boxes, candlesticks, candlesticks2, and ohlc. Line widthsdo not apply to all other plot types.
By default, all data set plot lines are 1 pixel wide.

SetMarginsPixels
320
SetMarginsPixelsSetMarginsPixels — Set margins around the plot area
Synopsis
$plot->SetMarginsPixels([$lm], [$rm], [$tm], [$bm])
DescriptionSetMarginsPixels sets the size of the margins around the plot area. By default, the margin sizes are automaticallycalculated based on the space needed. Use SetMarginsPixels to override these automatic calculations and set specificmargin sizes. The four margins are specified independently and in pixels.
Parameters$lm
Optional argument specifying the left margin, in pixels. If omitted or NULL, the value is automatically calculated.
$rmOptional argument specifying the right margin, in pixels. If omitted or NULL, the value is automatically calculated.
$tmOptional argument specifying the top margin, in pixels. If omitted or NULL, the value is automatically calculated.
$bmOptional argument specifying the bottom margin, in pixels. If omitted or NULL, the value is automaticallycalculated.
NotesThe plot area is equal to the image area minus the margins. By default, the margins are automatically calculated basedon the space needed for items outside the plot area. The plot area is then whatever space remains. Calculation for mostplot types takes into account the main title, axis titles, tick or data labels, and tick marks (but not the legend, if drawn).For pie charts, only the main title size is used when calculating the needed margins. Use SetMarginsPixels to overridethese automatic calculations and control the margins.
The upper left corner of the plot area is at device coordinates (Left_Margin, Top_Margin). The lower right corner ofthe plot area is at device coordinates (Image_Width - Right_Margin, Image_Height - Bottom_Margin).
SetMarginsPixels and SetPlotAreaPixels perform the same function with different semantics. It makes no sense to useboth - only the last one called will have an effect.
Trailing defaulted arguments can be omitted, but non-trailing defaulted arguments must be specified as NULL. Forexample, to set the right margin to 100 pixels, and let PHPlot calculate the other three margins, use:
$plot->SetMarginsPixels(NULL, 100);
HistoryThrough PHPlot-5.0.6, SetMarginsPixels required all 4 arguments be specified and not be NULL. Starting withPHPlot-5.0.7, each margin can either be specified or automatically calculated.

SetNumberFormat
321
SetNumberFormatSetNumberFormat — Set the separators used when formatting number labels
Synopsis
$plot->SetNumberFormat($decimal_point, $thousands_sep)
DescriptionSetNumberFormat sets the separator characters used when formatting number labels. Labels are formatted asnumbers when the 'data' format type is selected with SetXLabelType or SetYLabelType.
Parameters$decimal_point
The character used as a decimal point, to separate the integer part of the label from the fraction part.
$thousands_sepThe character used as a thousands grouping separator (placed between every group of 3 digits left of the decimalpoint).
NotesThese separators are only used for labels when 'data' mode formatting is selected with SetXLabelType orSetYLabelType.
If SetNumberFormat is not used, PHPlot attempts to get the proper separator characters from your system locale.If this works and your locale is set correctly, you will probably not need to use this function. If locale information isnot available, the default for decimal_point is a period, and the default for thousands_sep is a comma.
If your system locale is set to "C" or "POSIX", you might find that there are no thousands separators in yourformatted labels. This is the correct behavior for those locales. If you cannot select a more specific locale, useSetNumberFormat to set the correct separators.
To set the number of decimal places, use SetPrecisionX and SetPrecisionY.
If you are trying to force a specific locale with setlocale(), it will not work, because PHPlot uses setlocale(LC_ALL,'') to import locale information from the system, and this overrides a forced locale from your script. On non-Windowsplatforms, you can force a locale using environment variables, but this does not work on Windows. To address this,PHPlot has (see the History section below) a special member variable locale_override that prevents PHPlotfrom importing locale settings from the system. For example, if the following code is used, numeric formatting willuse the fr_CA locale settings, regardless of the system locale.
setlocale(LC_ALL, 'fr_CA'); # On Windows use: 'French_Canada'$plot = new PHPlot(800, 600);$plot->locale_override = True;
HistoryThe locale_override hook was added in PHPlot-5.1.0. Before that, there was no way to force a specific localeon Windows, and on other platforms a locale could be forced only by using environment variables. The hook wasadded primarily for testing on Windows, but could be needed in other situations too.

SetNumberFormat
322
This function was added to PHPlot-5.0.4. Versions up to and including 5.0rc3 always used a period for decimal point,and comma for thousands separator.

SetNumXTicks
323
SetNumXTicksSetNumXTicks — Set the number of X tick intervals
Synopsis
$plot->SetNumXTicks([$nt])
DescriptionSetNumXTicks sets the number of tick intervals along the X axis. You can use either this function orSetXTickIncrement (but not both) to control the tick mark spacing.
Parameters$nt
Integer number of tick intervals. If the value is omitted or an empty string, the default behavior is restored.
NotesSetNumXTicks sets the number of intervals into which PHPlot divides the X data range. If there are N intervals,there might be as many as N+1 tick marks (accounting for one at each end). Or, there might be N or N-1 tick marks, ifa tick anchor is set with SetXTickAnchor, or if PHPlot is told to omit tick marks from either end with SetSkipLeftTickor SetSkipRightTick.
If you use SetNumXTicks, you will get exactly that many tick intervals, regardless of whether the resulting tickincrement is a whole number. In general, you would only use SetNumXTicks when also using SetPlotAreaWorldto specify both ends of the X plot range. For example:
$plot->SetPlotAreaWorld(0, NULL, 200);$plot->SetNumXTicks(10);
You will have an X range from 0 to 200, with 10 intervals of 20 units.
If neither SetNumXTicks nor SetXTickIncrement is used, the tick interval is automatically calculated by PHPlot.See Section 4.6.7, “Automatic Tick Increment Calculation” for details.
HistoryBefore PHPlot-6.0.0, if neither the number of ticks nor the tick increment was specified, PHPlot calculated the tickincrement as 1/10 of the X data range. Starting with PHPlot-6.0.0, a more complex algorithm is used which tries toproduce 'natural' tick increments.
Starting with PHPlot-6.0.0, if you call both SetNumXTicks and SetXTickIncrement, the tick incrementhas priority and the specified number of ticks is ignored. Before PHPlot-6.0.0, the behavior was order-dependent:whichever function was used last had priority.
Through PHPlot-5.3.0, the argument was required. To restore the default behavior, it was necessary to useSetNumXTicks(''). Starting with PHPlot-5.3.1, the argument may be omitted to restore the default behavior.

SetNumYTicks
324
SetNumYTicksSetNumYTicks — Set the number of Y tick intervals
Synopsis
$plot->SetNumYTicks([$nt])
DescriptionSetNumYTicks sets the number of tick intervals along the Y axis. You can use either this function orSetYTickIncrement (but not both) to control the tick mark spacing.
Parameters$nt
Integer number of tick intervals. If the value is omitted or an empty string, the default behavior is restored.
NotesSetNumYTicks sets the number of intervals into which PHPlot divides the Y data range. If there are N intervals,there might be as many as N+1 tick marks (accounting for one at each end). Or, there might be N or N-1 tick marks, if atick anchor is set with SetYTickAnchor, or if PHPlot is told to omit tick marks from either end with SetSkipBottomTickor SetSkipTopTick.
If you use SetNumYTicks, you will get exactly that many tick intervals, regardless of whether the resulting tickincrement is a whole number. In general, you would only use SetNumYTicks when also using SetPlotAreaWorldto specify both ends of the Y plot range. For example:
$plot->SetPlotAreaWorld(NULL, -10, NULL, 10);$plot->SetNumXTicks(20);
You will have a Y range from -10 to 10, with 20 intervals of 1 unit each.
If neither SetNumYTicks nor SetYTickIncrement is used, the tick interval is automatically calculated by PHPlot.See Section 4.6.7, “Automatic Tick Increment Calculation” for details.
HistoryBefore PHPlot-6.0.0, if neither the number of ticks nor the tick increment was specified, PHPlot calculated the tickincrement as 1/10 of the Y data range. Starting with PHPlot-6.0.0, a more complex algorithm is used which tries toproduce 'natural' tick increments.
Starting with PHPlot-6.0.0, if you call both SetNumYTicks and SetYTickIncrement, the tick incrementhas priority and the specified number of ticks is ignored. Before PHPlot-6.0.0, the behavior was order-dependent:whichever function was used last had priority.
Through PHPlot-5.3.0, the argument was required. To restore the default behavior, it was necessary to useSetNumYTicks(''). Starting with PHPlot-5.3.1, the argument may be omitted to restore the default behavior.

SetOutputFile
325
SetOutputFileSetOutputFile — Redirect PHPlot output to a file
Synopsis
$plot->SetOutputFile($output_file)
DescriptionSetOutputFile arranges for image output to be sent to a file instead of to the browser (or standard output). Bydefault, output is sent to the browser (or standard output, if running from the command line).
Parameters$output_file
Pathname of the file to write the image data into.
NotesThe output file will only be produced if SetIsInline(True) is called.
By default, there is no output file, and the image is written to the browser or standard output.

SetPieAutoSize
326
SetPieAutoSizeSetPieAutoSize — Enable or disable automatic pie chart size calculation
Synopsis
$plot->SetPieAutoSize($enable)
DescriptionSetPieAutoSize controls the automatic pie chart size calculation. When this is enabled, PHPlot calculates the sizeof the pie by taking the label sizes into account.
Parameters$enable
True to enable automatic size calculation, or False to use the maximum area.
NotesBy default, automatic pie chart sizing is enabled.
If automatic pie chart sizing is disabled, PHPlot will make the pie as large as possible to fit within the plot area (seeSetPlotAreaPixels), minus a small 5-pixel margin on each side. The center of the pie is always at the center of theplot area.
If automatic pie chart sizing is enabled, PHPlot will leave additional room within the plot area for the pie chart labels.It will calculate the maximum width and height of the labels, and use these to increase the margins. Note that it doesnot take into account where each label is displayed. For example, if there is a very wide label displayed only at the topof the pie, this will still result in a decrease in overall pie width.
If pie labels are either disabled or positioned inside the pie (using SetLabelScalePosition), then SetPieAutoSize()has no effect. Whether automatic sizing is on or off, the pie chart will use the maximum size in this case, since noadditional space is needed for labels.
With automatic pie chart sizing enabled, PHPlot prevents overly long labels from resulting in a pie chart which is toosmall. It does this by limiting the minimum pie size to one half of the plot width or height, even if this causes labelsto run off the edge. This behavior can be adjusted - see Section 4.7.5, “Tuning Pie Charts” for more.
HistoryThis function was added in PHPlot-5.6.0. In earlier releases, PHPlot never took label sizes into account whencalculating the pie size. Note that the default True is not backward compatible. However, there were additionalchanges made to pie chart sizing and label positioning in PHPlot-5.6.0, such that neither enabling nor disablingautomatic sizing will produce identical results compared to previous releases.

SetPieBorderColor
327
SetPieBorderColorSetPieBorderColor — Set the color for pie chart segment borders
Synopsis
$plot->SetPieBorderColor($color)
DescriptionSetPieBorderColor sets the color which is used for borders drawn around pie chart segments (if enabled).
Parameters$color
Color value to use. See Section 3.5, “Colors” for more on color values.
NotesIf SetPieBorderColor is not used, pie chart segment borders (if enabled) are drawn using the color set withSetGridColor. If neither SetPieBorderColor nor SetGridColor is used, the default color is black.
By default, pie chart segment borders are drawn for unshaded plots, and not for shaded plots. See SetDrawPieBordersfor more information.
HistoryThis function was added in PHPlot-6.0.0. In earlier releases, pie chart segment borders always used the color set withSetGridColor, which also sets the color of other elements.

SetPieDirection
328
SetPieDirectionSetPieDirection — Set the direction for pie chart segments
Synopsis
$plot->SetPieDirection($which)
DescriptionSetPieDirection sets the direction for segments around a pie chart - clockwise or counter-clockwise.
Parameters$which
Indicates the direction for pie segments. Use the string 'clockwise' or 'CW' to get segments in a clockwisedirection. Use the string 'counterclockwise' or 'CCW' to get segments in a counter-clockwise direction.(The argument value is not case sensitive.)
NotesThe default direction is counter-clockwise.
See also SetPieStartAngle which is used to set the starting angle for the first pie segment.
ExampleSee Section 5.47, “Example - Pie Chart Start Angle and Direction”.
HistoryThis function was added in PHPlot-6.0.0. Before that, pie chart segments always started at 0 degrees and advancedin a counter-clockwise direction around the pie.

SetPieLabelColor
329
SetPieLabelColorSetPieLabelColor — Set the color for pie chart data labels
Synopsis
$plot->SetPieLabelColor($color)
DescriptionSetPieLabelColor sets the color which is used for data labels on pie charts.
Parameters$color
Color value to use. See Section 3.5, “Colors” for more on color values.
NotesIf SetPieLabelColor is not used, pie chart data labels are drawn using the text color set with SetGridColor. Ifneither SetPieLabelColor nor SetGridColor is used, the default color is black.
See also Section 3.6, “Labels” for information about different label types.
PHPlot has a deprecated function called SetLabelColor. Do not use this function. It does not set the color usedfor labels.
HistoryThis function was added in PHPlot-5.7.0. In earlier releases, the pie chart data labels used the color set withSetGridColor, which also sets the color of other elements. Although it would have made more sense to useSetDataLabelColor to set the color for pie chart data labels when that function was introduced, it would have not havebeen backward compatible, since the default color comes from a different source.
SetPieLabelType
330
SetPieLabelTypeSetPieLabelType — Set type and format for pie chart labels
Synopsis
$plot->SetPieLabelType($source, [$type], [...])
DescriptionSetPieLabelType sets the type and format of labels which will be displayed on a pie chart. The labels identify thesegments of the pie. They can show the segment percentage, a numeric value, or a text string.
ParametersThere is one required argument, $source, following by an optional argument $type. If $type is present and not empty,additional arguments are required.
$sourceA string or array indicating the source of the label. If a string, it must be one of the following values (see notesfor more details):
Source Description
index Use the ordinal number of the segment (starting at 0)
label Use the label string from the data array
percent Use the segment's percentage of the whole pie
value Use the numeric value of the segment
An empty string (or NULL) restores the default pie chart label source and format type.
An array of strings can be used. Each element in the array must be one of the string values above. PHPlot willjoin the multiple sources for the label, separating each pair with a space. This can be used with custom formattingtypes to have pie chart labels with multiple fields (such as percentage and label, or label and value). See notesbelow for more.
$typeOptional argument indicating how to format the label string. If supplied, it can be one of the following: data,printf, or custom. If the argument is missing or an empty string, this indicates that the default of no formattingshould be used. If the argument is provided and not empty, additional arguments are required or optional as shownbelow.
If the $type argument is data, there are three optional arguments:
$precisionThe formatting precision, or number of decimal places (optional). If omitted, the default is 1.
$prefixA prefix string to be placed before the formatted label values.
$suffixA suffix string to be placed after the formatted label values. When $source is percent, a percent sign '%' shouldbe specified as the suffix.
SetPieLabelType
331
If the $type argument is printf, there is one optional argument:
$formatFormatting string, used with sprintf(). The formatting string must contain exactly one conversionspecification (%-code) which consumes a single argument. If omitted, the default value of '%e' uses scientificnotation with default field sizes.
If the $type argument is custom, there is one required argument and one optional argument:
$callbackA callback function to format the label. This is either the name of a function (as a string), or a two-element arraywith an object instance and method name. (Refer to the PHP documentation for more information on the callbacktype.) The callback will be called with two arguments: the value of the label to be formatted, and the pass-throughargument (see next).
$callback_argA pass-through argument for the callback function. If omitted, NULL is used.
NotesThe default formatting if this function is not called is to show the percentage of each segment, formatted with onedecimal point and a percent sign suffix. This is the same as:
$plot->SetPieLabelType('percent', 'data', 1, '', '%');
The default formatting can be restored by passing an empty string or NULL as the $source argument. (Note: Thedefault precision can be changed; see History below.)
The formatting arguments starting with $type work exactly the same way as when formatting X tick labels (forexample) using SetXLabelType. See there for formatting examples. Date/time formatted labels would also work here,but are not documented for pie chart labels because they are unlikely to be useful.
If $source is index, the label source is an integer starting with 0 for the first pie segment, 1 for the second pie segment,etc. (By default, segments are drawn counter-clockwise from 0 degrees, but this can be changed.) This can be usefulwith custom type formatting, by providing a formatting function to get the label text from an external array (forexample).
If $source is label, the label source is taken from the data array as set with SetDataValues. This can only be usedwith data type text-data-single, because that is the only data type where each data array row (and its label, in the firstarray position) corresponds to a single pie segment.
If $source is percent, the label source is the percentage of the pie represented by the segment being labeled. Thisnormally needs to used with $type = data, printf, or custom formatting, in order to get a fixed number of decimalplaces and a percent sign suffix. Note that the following is probably not useful:
$plot->SetPieLabelType('percent'); // Do not use
The resulting labels would display segment percentages, but as unformatted floating point numbers with no suffix. Forexample, instead of "48.5%", the label might display: "48.4865312". This is usually not the desired result.
If $source is value, the label source is the numeric value of the pie segment. Depending on the data type used, thisis a value or sum of values from the data array.
If $source is an array, the result is a string containing multiple space-separated fields. This is most likely to be usefulwith custom formatting. A custom label formatting function can split up the fields using explode(' ', $str).

SetPieLabelType
332
Note: If one of the fields is a label which might contain spaces, always place that field last when specifying the $sourcearray, and use the 3rd parameter to explode() to limit the number of fields returned. This will ensure that the completelabel is extracted as a single field. See the last example below.
To adjust the position of the pie chart labels, see SetLabelScalePosition. To turn the labels off completely, useSetLabelScalePosition(False).
SetPieLabelType also supports the use of two or three format strings with 'printf' formatting type, as describedin SetXLabelType and Section 3.6.5.3, “Formatting Labels: 'printf' type”. (The additional format strings are used fornegative numbers, or zero.) But this feature is almost never useful with pie charts, where all pie slices have size greaterthan zero.
ExamplesIn addition to the examples in this section, see Section 5.41, “Example - Pie Chart Label Types”.
Assume plot type pie, data type text-data-single, and the follow data array:
$data = array( array('Gold', 20), array('Silver', 13), array('Copper', 7), array('Tin', 18), array('Bronze', 10), array('Iron', 4), array('Platinum', 2), array('Nickel', 5),);
For the default behavior of percentage labels with numeric formatting, do not call SetPieLabelType. Result:25.3%, 16.5%, 8.9% etc.
...
Show segment indexes (ordinal segment number from 0). Result: 0, 1, 2 etc.
$plot->SetPieLabelType('index');
Show label strings from the data array. Result: Gold, Silver, Copper etc.
$plot->SetPieLabelType('label');
Show label strings from the data array, with quote marks added. Result: "Gold", "Silver", "Copper" etc.
$plot->SetPieLabelType('label', 'printf', '"%s"');
Show the numeric value of each segment, unformatted. Result: 20, 13, 7 etc.
$plot->SetPieLabelType('value');
Show the numeric value of each segment, formatted with 3 decimal places. Result: 20.000, 13.000, 7.000 etc.
$plot->SetPieLabelType('value', 'data', 3);

SetPieLabelType
333
Use a custom formatting function to convert the data array labels to upper case. Result: GOLD, SILVER, COPPERetc.
function mylabels($str){ return strtoupper($str);}$plot->SetPieLabelType('label', 'custom', 'mylabels');
Combine multiple label sources: data array label and percentage. Result: Gold (25.3%), Silver (16.5%),Copper (8.9%) etc.
function mylabels($str){ list($percent, $label) = explode(' ', $str, 2); return sprintf("%s (%.1f%%)", $label, $percent);}$plot->SetPieLabelType(array('percent', 'label'), 'custom', 'mylabels');
HistoryThis function was added in PHPlot-5.6.0. In earlier releases, only 'percent' label type was available, and the labelswere always formatted as fixed-point values (format type 'data').
Versions before PHPlot-5.6.0 used a numeric precision set with SetPrecisionY or SetYLabelType for pie chartpercentage labels, with a default of 1 decimal place. (This was not documented.) PHPlot-5.6.0 still does that, but onlyif SetPieLabelType was never called (or reset to all defaults). That is, if SetPieLabelType was not called toset up a label source and formatting type, the Y label precision will be used if set, else 1 digit.

SetPieStartAngle
334
SetPieStartAngleSetPieStartAngle — Set the starting angle for pie chart segments
Synopsis
$plot->SetPieStartAngle($angle)
DescriptionSetPieStartAngle sets the starting angle for the first segment in a pie chart.
Parameters$angle
Starting angle in degrees
NotesThe default starting angle is 0 degrees. This results in the first pie segment starting on the right-pointing horizontalradius ("East"), and extending upwards in a counter-clockwise direction (by default).
See also SetPieDirection which is used to set the direction for pie chart segments - clockwise or counter-clockwise.
ExampleSee Section 5.47, “Example - Pie Chart Start Angle and Direction”.
HistoryThis function was added in PHPlot-6.0.0. Before that, the first segment of a pie chart always started at 0 degrees.

SetPlotAreaBgImage
335
SetPlotAreaBgImageSetPlotAreaBgImage — Set a graphic file to be used in the plot area background
Synopsis
$plot->SetPlotAreaBgImage($input_file, [$mode])
DescriptionSetPlotAreaBgImage sets an image file to be used as the plot area background. The image can be scaled or tiledto fit.
Parameters$input_file
Path to the file to be used. The file can be any type allowed by GD, which usually includes JPEG, GIF, and PNG.
$modeOptional display mode for the background image: one of the strings 'centeredtile', 'tile', or 'scale'. The default is'tile'.
NotesIf a background image has been set, background color (set with SetPlotBgColor) is ignored.
Scale mode scales the supplied background image file to fit the plot area. Tile and centeredtile modes repeat thesupplied background image file as needed to fit the plot area. The difference is that centeredtile offsets the start positionwithin the background image by half its size, which works better for some images.
SetPlotAreaBgImage sets a background for the plot area, while SetBgImage sets a background for the entire imagearea. If both are used, the plot area background overlays that portion of the overall background.
If $input_file is NULL, no background image will be used for the plot area.
If you are going to use a JPEG file for the plot area background, you should be using a truecolor PHPlot image.Truecolor images do not have a limited-size color map like palette images (which PHPlot uses by default). If you usepalette image with a JPEG background, the background will likely overflow your image's color map and leave no freecolor slots for PHPlot to use for plot elements. The same is true if using a 24-bit color (non-mapped) PNG file for abackground if it has many colors. For more on truecolor PHPlot images, see Section 4.3, “Truecolor Images”.

SetPlotAreaPixels
336
SetPlotAreaPixelsSetPlotAreaPixels — Set the limits for the plot area in device coordinates
Synopsis
$plot->SetPlotAreaPixels([$x1], [$y1], [$x2], [$y2])
DescriptionSetPlotAreaPixels sets the area to be used for the plot within the image, in device coordinates. (Devicecoordinates are GD coordinates, with the origin at the top left of the image, X values increase to the right, Y valuesincrease down, and the units in pixels.) The plot area is equal to the image area minus the margins. By default, themargins (and therefore the plot area) are automatically calculated based on the space needed for titles, labels, etc. UseSetPlotAreaPixels to override these automatic calculations and control the plot area. The four coordinate values arespecified independently. SetPlotAreaPixels and SetMarginsPixels perform the same function with different semantics.
Parameters$x1 , $y1
Device coordinates of the top left corner of the area to use for the plot. Each value is optional, and if omitted orNULL the automatically calculated value is used.
$x2 , $y2Device coordinates of the bottom right corner of the area to use for the plot. Each value is optional, and if omittedor NULL the automatically calculated value is used.
NotesThe plot area is equal to the image area minus the margins. By default, the margins (and therefore the plot area) areautomatically calculated based on the space needed for items outside the plot area. The plot area is then whatever spaceremains. Calculation for most plot types takes into account the main title, axis titles, tick or data labels, and tick marks(but not the legend, if drawn). For pie charts, only the main title size is used when calculating the needed margins. UseSetPlotAreaPixels to override these automatic calculations and control the plot area.
SetPlotAreaPixels and SetMarginsPixels perform the same function with different semantics. It makes no sense to useboth - only the last one called will have an effect.
SetPlotAreaPixels is also used when placing multiple plots on an image. See Section 4.8, “Multiple Plots Per Image”for more information.
Trailing defaulted arguments can be omitted, but non-trailing defaulted arguments must be specified as NULL. Forexample, to fix the bottom right corner of the plot area at (600, 400) and let PHPlot calculate the upper left corner use:
$plot->SetPlotAreaPixels(NULL, NULL, 600, 400);
You do not have to specify both X and Y. The following example sets the right edge of the plot area at X=600 andlets the other 3 edges be automatically calculated:
$plot->SetPlotAreaPixels(NULL, NULL, 600);

SetPlotAreaPixels
337
HistoryThrough PHPlot-5.0.6, SetPlotAreaPixels required all 4 arguments be specified and not be NULL. Starting withPHPlot-5.0.7, each X and Y parameter can either be specified or automatically calculated.
SetPlotAreaPixels and SetPlotAreaWorld can be called in either order. Through PHPlot-5.0.4 this was becauseSetPlotAreaPixels would reset the scale factors if SetPlotAreaWorld was already called. Starting with PHPlot-5.0.5,both functions just store the information, and no calculations take place until DrawGraph is used.
SetPlotAreaWorld
338
SetPlotAreaWorldSetPlotAreaWorld — Override automatic data scaling to device coordinates
Synopsis
$plot->SetPlotAreaWorld([$xmin], [$ymin], [$xmax], [$ymax])
DescriptionSetPlotAreaWorld changes the range for World Coordinate space. This is the coordinate space of the data to beplotted, and is translated and scaled to fit into the Device Coordinate space of the image. By default, PHPlot definesthe world coordinate space based on the actual limits of the data to be plotted. By using SetPlotAreaWorld, you canoverride one or more of the calculated limits. Each parameter you specify overrides the corresponding calculated limit.Each defaulted or NULL parameter is ignored and the calculated limit is used.
Parameters$xmin
Optional argument specifying the desired X data range minimum value. If omitted or NULL, the value is calculatedfrom the actual plot data.
$yminOptional argument specifying the desired Y data range minimum value. If omitted or NULL, the value is calculatedfrom the actual plot data.
$xmaxOptional argument specifying the desired X data range maximum value. If omitted or NULL, the value iscalculated from the actual plot data.
$ymaxOptional argument specifying the desired Y data range maximum value. If omitted or NULL, the value iscalculated from the actual plot data.
NotesTrailing defaulted arguments can be omitted, but non-trailing defaulted arguments must be specified as NULL. Forexample, to set the minimum X value to 10, the maximum X value to 100, and default the Y scaling, you can use:
$plot->SetPlotAreaWorld(10, NULL, 100);
This function has no effect with pie charts, because they do not use world coordinates.
See Section 4.6, “Plot Range and Tick Increment Calculations” for more information about how PHPlot calculates thelimits of the World Coordinate space in the absence of values set with SetPlotAreaWorld.
HistoryStarting with PHPlot-6.0.0, SetPlotAreaWorld will stop with an error if a fully specified range is invalid. Thatis, if both $xmin and $xmax are given and not NULL, $xmin must be less than $xmax. If both $ymin and $ymax aregiven and not NULL, $ymin must be less than $ymax. In older versions, this error was not detected.

SetPlotAreaWorld
339
SetPlotAreaPixels and SetPlotAreaWorld can be called in either order. Through PHPlot-5.0.4 this wasbecause SetPlotAreaWorld would reset the scale factors if SetPlotAreaPixels was already called. Starting withPHPlot-5.0.5, both functions just store the information, and no calculations take place until DrawGraph is used.
Through PHPlot-5.0.4, SetPlotAreaWorld needed to access and interpret the data array, so it had to be called afterSetDataValues sets the data array, and after SetDataType (if used). Starting with PHPlot-5.0.5, this restriction nolonger applies and the functions can be called in any order.
SetPlotBgColor
340
SetPlotBgColorSetPlotBgColor — Set plot area background color
Synopsis
$plot->SetPlotBgColor($color)
DescriptionSetPlotBgColor sets the background color of the plot area of the image (the area inside the margins, title, andusually the axes).
Parameters$color
Color value to use. See Section 3.5, “Colors” for more on color values.
NotesBackground color is disabled by default. If you want a background color for the plot area, you must enabled it withSetDrawPlotAreaBackground.
Background image takes priority over background color. If a background image was set with SetPlotAreaBgImage,then no background color will be drawn, even if it was enabled.
The default background color for the plot area is white (if enabled as noted above). If background color for the plotarea is not enabled, the overall background color (or image) will be seen in the plot area.

SetPlotBorderType
341
SetPlotBorderTypeSetPlotBorderType — Control how much of a border is drawn around the plot
Synopsis
$plot->SetPlotBorderType($pbt)
DescriptionSetPlotBorderType controls how much of a border is drawn around the plot.
Parameters$pbt
A string or array indicating where to draw the plot borders. If a string, it must be one of the following values:
Value Description
bottom Border on bottom plot
full Border on all four sides of the plot
left Border on left side of plot
none No plot area border
right Border on right side of plot
sides Border on left and right sides of plot
top Border on top of plot
An array of strings can be used. Each element in the array must be one of the above values. For example, useeither array('left', 'right', 'bottom') or array('sides', 'bottom') to get a plot borderon the sides and bottom but not the top.
NotesBy default, left and right side borders are drawn for all plot types except pie charts. For pie charts, no borders aredrawn by default.
Plot border color is set by SetGridColor (this color also applies to the axes and other elements). The default coloris black.
The X and Y axis lines and the plot border are all drawn in the same color. Usually, the X axis line is drawn at thebottom of the plot area, and the Y axis line is drawn on the left side of the plot area. (See SetXAxisPosition andSetYAxisPosition for more information on the axis positions.) Enabling or disabling a plot border edge that correspondsto an axis line will have no visible effect because the axis line will be drawn there.
The preceding paragraph does not apply to pie charts, which do not have axis lines.
HistoryThrough PHPlot-5.5.0, plot area borders were not available for pie charts, and the default border type was always'sides'. Starting with PHPlot-5.6.0, pie charts can also have plot area borders. The default plot area border type is 'none'for pie charts, and 'sides' for all other plot types.

SetPlotBorderType
342
Through PHPlot-5.1.1, the available choices were 'left', 'sides', 'full', or 'none', and only a single string option wassupported. Starting with PHPlot-5.1.2, the additional choices 'right', 'top', and 'bottom' were added, as well as the abilityto pass an array of choices.

SetPlotType
343
SetPlotTypeSetPlotType — Select the type of plot - how the data will be graphed
Synopsis
$plot->SetPlotType($pt)
DescriptionSetPlotType selects a type of plot from among the plot types supported by PHPlot.
Parameters$pt
A string indicating the type of plot. The following types are available:• area• bars• boxes• bubbles• candlesticks• candlesticks2• linepoints• lines• ohlc• pie• points• squared• squaredarea• stackedarea• stackedbars• stackedsquaredarea• thinbarline
NotesThe default plot type is 'linepoints'.
A complete description of the available plot types can be found in Section 3.4, “PHPlot Plot Types”.
HistoryPlot types 'squaredarea' and 'stackedsquaredarea' were added in PHPlot-6.2.0.
Plot type 'boxes' was added in PHPlot-6.1.0.
Plot type 'bubbles' was added in PHPlot-5.5.0.
Plot types 'candlesticks', 'candlesticks2', and 'ohlc' were added in PHPlot-5.3.0.
Plot type 'stackedarea' was added in PHPlot-5.1.1.

SetPointShapes
344
SetPointShapesSetPointShapes — Select a point shape for each data set
Synopsis
$plot->SetPointShapes($pt)
DescriptionSetPointShapes assigns a point shape to each data set in a plot. 'Point' here refers to the marker drawn at each datapoint in 'points' and 'linepoints' type plots. For example, if each data row contains 4 Y values, the first point shape willbe used for the first Y value, the second point shape for the second Y value, etc. There are 20 point shapes to chose from.
Parameters$pt
An array of point shape names, or a string naming a single point shape. If a string, that shape name is used for alldata sets. If an array, the array values name the point shapes for each subsequent data set in a plot. The followingshapes are available:
Shape Shape Name Description
bowtie Two filled triangles pointing right and left towards the point.
box A square outline centered on the point.
circle A hollow circle centered on the point.
cross An X centered on the point.
delta A filled triangle pointing up, centered on the point.
diamond A filled diamond (square rotated 45 degrees), centered on the point.
dot A filled circle centered on the point.
down An unfilled triangle pointing down, centered on the point.
halfline A short line from the point going left.
home A filled 5-sided shape, centered on the point.
hourglass Two filled triangles pointing up and down towards the point.
line A horizontal line centered on the point.
plus A plus sign centered on the point.
rect A filled square centered on the point.
star Four lines crossing at the point.
target A square outline with two filled squares and two open squares, centered onthe point.

SetPointShapes
345
Shape Shape Name Description
triangle A filled triangle pointing down from the point.
trianglemid A filled triangle pointing down to the point.
up An unfilled triangle pointing up, centered on the point.
yield A filled triangle pointing down, centered on the point.
none No marker (see notes).
Example 5.7, “Line/Point Plot, Point Shapes” also shows all of the point shapes.
NotesIf an array is used for $pt, it must use zero-based sequential integer indexes.
This applies only to 'points' and 'linepoints' plot types.
By default, ten shapes are used in order: diamond, dot, delta, home, yield, box, circle, up, down, and cross.
A point shape can be set to 'none' to suppress the point markers for that data set. This is only useful with 'linepoints'plot types, and results in a 'lines' plot type for that data set: a line only, but no markers.
PHPlot duplicates the entries in the shorter of the two arrays, point sizes (set by SetPointSizes) and point shapes, tomake both arrays the same size. Then it uses the entries in order, restarting at the beginning, for each data set at eachX value. For example, if point sizes is (6, 10), and point shapes is ('diamond', 'dot', 'rect'), then PHPlot first extendspoint sizes to (6, 10, 6) to match the point shapes. If there are 4 data sets to plot, PHPlot draws the point markers ateach X value as: diamond (size 6), dot (size 10), rect (size 6), diamond (size 6).
HistoryThrough PHPlot-5.0.7, these ten shapes were available: halfline, line, plus, cross, rect, circle, dot, diamond, triangle,trianglemid, and none. The default shape for all data sets was 'diamond'. Starting with PHPlot-5.1.0, ten new pointshapes were added, and different shape defaults were assigned for ten data sets. To restore the behavior in PHPlot-5.0.7and earlier, call SetPointShapes('diamond').
Using 'none' as a point shape was added in PHPlot-5.0rc3.

SetPointSizes
346
SetPointSizesSetPointSizes — Sets the point size for each data set
Synopsis
$plot->SetPointSizes($ps)
DescriptionSetPointSizes assigns a point size to each data set in a plot. 'Point' here refers to the marker drawn at each datapoint in 'points' and 'linepoints' type plots. For example, if each data row contains 4 Y values, the first point size willbe used for the first Y value, the second point size for the second Y value, etc.
Parameters$ps
An array of point sizes, or a single value. All values are in pixels. If a single value, that size is used for all datasets. If an array, the array values are the sizes for each subsequent data set in a plot.
NotesIf an array is used for $ps, it must use zero-based sequential integer indexes.
This applies only to 'points' and 'linepoints' plot types.
PHPlot duplicates the entries in the shorter of the two arrays, point sizes and point shapes (set by SetPointShapes), tomake both arrays the same size. Then it uses the entries in order, restarting at the beginning, for each data set at eachX value. For example, if point sizes is (6, 10), and point shapes is ('diamond', 'dot', 'rect'), then PHPlot first extendspoint sizes to (6, 10, 6) to match the point shapes. If there are 4 data sets to plot, PHPlot draws the point markers ateach X value as: diamond (size 6), dot (size 10), rect (size 6), diamond (size 6).
By default, all point sizes are 6 pixels.
HistoryThrough PHPlot-5.0.7, the default size array was (5, 5, 3). However, there were bugs in processing the sizes of thepoint shapes and point sizes arrays. Also, for some point sizes, PHPlot rounded the size up to the next even number.

SetPrecisionX
347
SetPrecisionXSetPrecisionX — Set precision for numeric formated X labels
Synopsis
$plot->SetPrecisionX($prec)
DescriptionSetPrecisionX sets the desired numeric precision for X tick and data labels, and also enables 'data' mode formattingof those labels with SetXLabelType.
Note
This function is retained for compatibility, but use of SetXLabelType is preferred.
Parameters$prec
The desired numeric precision. This is the number of decimal positions to output.
NotesSetting numeric precision with this function automatically enables 'data' mode formatting as ifSetXLabelType('data') was called.
The default is to format numbers with 1 decimal position, but only if 'data' mode formatting is selected.
This function applies to both X tick labels and X data labels. (X data labels are axis data labels for vertical plots, ordata value labels within the plot area for horizontal plots. See Section 3.6, “Labels” for more on labels.) Using 'data'format for X axis data labels only makes sense when your data array contains numeric data in the label position.
See SetPrecisionY for Y tick and data labels.
HistoryStarting with PHPlot-5.0.6, using SetPrecisionX($n) is exactly the same as callingSetXLabelType('data', $n).
SetPrecisionY
348
SetPrecisionYSetPrecisionY — Set precision for numeric formated Y labels
Synopsis
$plot->SetPrecisionY($prec)
DescriptionSetPrecisionY sets the desired numeric precision for Y tick and data labels, and also enables 'data' mode formattingof those labels with SetYLabelType.
Note
This function is retained for compatibility, but use of SetYLabelType is preferred.
Parameters$prec
The desired numeric precision. This is the number of decimal positions to output.
NotesSetting numeric precision with this function automatically enables 'data' mode formatting as ifSetYLabelType('data') was called.
The default is to format numbers with 1 decimal position, but only if 'data' mode formatting is selected.
This function applies to both Y tick labels and Y data labels. (Y data labels are data value labels within the plot areafor vertical plots, or axis data labels for horizontal plots. See Section 3.6, “Labels” for more on labels.) Using 'data'format for Y axis data labels only makes sense when your data array contains numeric data in the label position.
See SetPrecisionX for X tick and data labels.
This function also affects pie chart labels, for backward compatibility. When drawing a pie chart, if SetPieLabelTypewas not called, and SetPrecisionY was called, then the precision set with SetPrecisionY is used whenformatting pie chart labels.
HistoryStarting with PHPlot-5.0.6, using SetPrecisionY($n) is exactly the same as callingSetYLabelType('data', $n).

SetPrintImage
349
SetPrintImageSetPrintImage — Determine whether or not to automatically output the image when the plot is drawn
Synopsis
$plot->SetPrintImage($pi)
DescriptionSetPrintImage determines whether or not to automatically output the image (as if PrintImage was used) when aplot is drawn (with DrawGraph). The default is True.
Parameters$pi
True to have DrawGraph automatically print (output) the image, False to prevent DrawGraph from outputtingthe image.
NotesWhen putting multiple plots on one image, is is necessary to use SetPrintImage(False) to defer output of theimage until after all the plots have been drawn. See Section 4.8, “Multiple Plots Per Image” for more information onputting multiple plots on an image.
Calling SetPrintImage(False) is also needed when using EncodeImage to return the image data (rather thansending it to standard output or to a file).
SetRGBArray
350
SetRGBArraySetRGBArray — Select a color map
Synopsis
$plot->SetRGBArray($color_array)
Description
SetRGBArray selects a color map to use. A color map is an array of color names available for use in the plot.You can select from pre-defined color maps, or define your own. Each color in a color map has a name, and 3 or 4color component values (red, green, blue, and optional alpha). The red, green, and blue components are in the range0 through 255, and the optional alpha component is in the range 0 through 127.
Parameters
$color_arrayAn array or a string. If an array, each element defines a color in the color map. The array element key is the colorname, and the array element value is an array of three or four components. (See example below).
Or, a string selecting a built-in color map. Use 'small' to select a map of 36 colors, or 'large' to select a muchlarger color map.
Notes
If SetRGBArray is not called, the 'small' color map is used.
More information about the color maps can be found in Section 3.5.2, “Built-in Color Maps”. More information aboutusing the alpha component can be found in Section 4.3, “Truecolor Images”.
Color names are case sensitive.
For the large color map to be loaded with SetRGBArray('large'), the file rgb.inc.php must be found on the PHPinclude path or in the same directory as phplot.php. This file is included in the PHPlot distribution.
You are not limited to using only the colors in the color map. The color map defines which color names you can use,and exactly what they mean. You can also specify colors numerically.
PHPlot resolves a color name to its component values (red, green, blue) at the time the element's color is set, usingwhatever color map is present at that time. For PHPlot's default colors, this happens when the PHPlot object is created.This means that changes to the color map affect only future color settings. See the Color Resolution example belowfor more. After using SetRGBArray, you will probably want to define element and data colors with the functionslisted in Section 6.3, “Colors and Line Styles”.

SetRGBArray
351
ExamplesAn example of a user-defined color map is:
array( 'black' => array(0, 0, 0), 'white' => array(255, 255, 255), 'gray' => array(190, 190, 190), 'red' => array(255, 0, 0), 'green' => array(0, 255, 0), 'blue' => array(0, 0, 255) )
The following example is provided for the note above on color resolution. The main title will be black, the X title willbe blue, and the Y title will be green. This is because:
• The main title color is defaulted, so it gets defined as black by the PHPlot constructor. The later redefinition of blackin the color array has no effect on this title.
• The X title color is set to blue, using the default ('small') color map's definition of blue at that time.
• The Y title color is green, because a new color map was loaded before the Y title color was set, and that color mapdefines a color named blue as RGB #00ff00 which is green.
$plot = new PHPlot();...$plot->SetXTitleColor('blue');$plot->SetRGBArray(array('black' => array(255,0,0), 'blue' => array(0, 255, 0)));$plot->SetYTitleColor('blue');...
HistoryStarting with PHPlot-6.0.0, specifying an invalid string for $color_array results in an error message. In olderreleases, a two color black/white color map would be loaded with no error reported.
Versions of this manual written for releases before PHPlot-6.0.0 incorrectly stated that your color map must includethe colors that PHPlot uses as internal defaults (black, white, and gray), and incorrectly implied that you could redefineexisting colors (for example, change black to (r=255,g=0,b=0) to make it red) and have that apply to the default elementcolors. The actual behavior is as described in the note above about color resolution.

SetShading
352
SetShadingSetShading — Set the size of the drop shadow for bar and pie charts.
Synopsis
$plot->SetShading($s)
DescriptionSetShading sets the size in pixels of the drop shadow used to give bar and pie charts a 3-D look. The 3-D lookcan be disabled by setting the shading to zero.
Parameters$s
Desired shading size in pixels. If this is set to 0, pie charts are flat (not rotated away from the screen) with noshadow, and bars in bar charts and stackedbar charts are drawn as rectangles without drop shadows.
NotesThe default is shading enabled with a size of 5 pixels.
If shading is turned off for bar and stackedbar charts, the bars will be drawn with borders. The color of the bordersis set with SetDataBorderColors.

SetSkipBottomTick
353
SetSkipBottomTickSetSkipBottomTick — Suppress the bottom Y axis tick mark and label
Synopsis
$plot->SetSkipBottomTick($skip)
DescriptionSetSkipBottomTick can be used to skip (suppress) the bottom-most Y tick mark and its label. See alsoSetSkipLeftTick, SetSkipRightTick, and SetSkipTopTick.
Parameters$skip
If True, don't draw the bottom Y tick mark and label; if False, draw the bottom Y tick mark and label.
NotesBy default, no tick marks or labels are skipped.

SetSkipLeftTick
354
SetSkipLeftTickSetSkipLeftTick — Suppress the first X axis tick mark and label
Synopsis
$plot->SetSkipLeftTick($skip)
DescriptionSetSkipLeftTick can be used to skip (suppress) the left-most X tick mark and its label. See alsoSetSkipBottomTick, SetSkipRightTick, and SetSkipTopTick.
Parameters$skip
If True, don't draw the first X tick mark and label; if False, draw the first X tick mark and label.
NotesBy default, no tick marks or labels are skipped.

SetSkipRightTick
355
SetSkipRightTickSetSkipRightTick — Suppress the last X axis tick mark and label
Synopsis
$plot->SetSkipRightTick($skip)
DescriptionSetSkipRightTick can be used to skip (suppress) the right-most X tick mark and its label. See alsoSetSkipBottomTick, SetSkipLeftTick, and SetSkipTopTick.
Parameters$skip
If True, don't draw the last X tick mark and label; if False, draw the last X tick mark and label.
NotesBy default, no tick marks or labels are skipped.

SetSkipTopTick
356
SetSkipTopTickSetSkipTopTick — Suppress the top Y axis tick mark and label
Synopsis
$plot->SetSkipTopTick($skip)
DescriptionSetSkipTopTick can be used to skip (suppress) the top-most Y tick mark and its label. See alsoSetSkipBottomTick, SetSkipLeftTick, and SetSkipRightTick.
Parameters$skip
If True, don't draw the top Y tick mark and label; if False, draw the top Y tick mark and label.
NotesBy default, no tick marks or labels are skipped.

SetTextColor
357
SetTextColorSetTextColor — Set general text color
Synopsis
$plot->SetTextColor($color)
DescriptionSetTextColor sets the default color which is used for legend text, tick labels, and data labels.
Parameters$color
Color value to use. See Section 3.5, “Colors” for more on color values.
NotesThe default text color is black.
Starting with PHPlot-5.7.0, there are more specific functions to set the color for labels: SetDataLabelColor,SetDataValueLabelColor, and SetTickLabelColor. All of these elements default to using the color set withSetTextColor.
Starting with PHPlot-6.0.0, the legend text color can be set with SetLegendTextColor. If that function is not used, thenthe legend text uses the color set with SetTextColor.
ExampleLegend text and data labels will be blue, and tick labels will be red. Note that the functions may be used in any order,with the same results.
$plot->SetTextColor('blue');$plot->SetTickLabelColor('red');

SetTickColor
358
SetTickColorSetTickColor — Set the color of the axis tick marks
Synopsis
$plot->SetTickColor($color)
DescriptionSetTickColor sets the color of the axis tick marks.
Parameters$color
Color value to use. See Section 3.5, “Colors” for more on color values.
NotesThe default color for the tick marks is black.

SetTickLabelColor
359
SetTickLabelColorSetTickLabelColor — Set the color for tick labels
Synopsis
$plot->SetTickLabelColor($color)
DescriptionSetTickLabelColor sets the color which is used for tick labels along the X and Y axis lines.
Parameters$color
Color value to use. See Section 3.5, “Colors” for more on color values.
NotesIf SetTickLabelColor is not used, tick labels are drawn using the general text color set with SetTextColor. Ifneither SetTickLabelColor nor SetTextColor is used, the default color is black.
See also Section 3.6, “Labels” for information about different label types.
PHPlot has a deprecated function called SetLabelColor. Do not use this function. It does not set the color usedfor labels.
HistoryThis function was added in PHPlot-5.7.0. In earlier releases, the tick label colors could only be set using SetTextColor,which also changed the color of other elements.
SetTitle
360
SetTitleSetTitle — Set the main title text for the plot
Synopsis
$plot->SetTitle($title)
DescriptionSetTitle sets the main plot title text. This is displayed centered at the top of the plot.
Parameters$title
The title text to be displayed. The string can contain multiple lines, separated by newlines (in PHP: "\n").
SetTitleColor
361
SetTitleColorSetTitleColor — Set the color of the main plot title
Synopsis
$plot->SetTitleColor($color)
DescriptionSetTitleColor sets the color of the main plot title (as set with SetTitle), and the default color for the X and Ytitles (as set with SetXTitle and SetYTitle).
Parameters$color
Color value to use. See Section 3.5, “Colors” for more on color values.
NotesThe default color for the main title is black.
Use just SetTitleColor if you want all three titles to have the same color. If you want different colors for the main,X, and/or Y titles, use SetTitleColor to set the main title color, and use SetXTitleColor and/or SetYTitleColor to setthe color of the other titles.
HistoryThrough PHPlot-5.1.3, this function set the color for all three titles. Starting with PHPlot-5.2.0, it sets the main titlecolor, and the default color for X and Y titles.

SetTransparentColor
362
SetTransparentColorSetTransparentColor — Designate one color to be transparent
Synopsis
$plot->SetTransparentColor([$color])
DescriptionSetTransparentColor designates one color in the image to be transparent. The designated color will not bevisible (assuming the image is viewed with a program which supports transparency) - instead, everything drawn inthat color will be transparent. By default, no color is transparent.
Parameters$color
Color value to designate as transparent. See Section 3.5, “Colors” for more on color values. If this parameter isomitted or NULL, the default behavior of not having a transparent color is restored.
NotesThis will only work if both the selected image file format (see SetFileFormat) and the user's browser or viewer supporttransparency. GIF format supports transparency. PNG format also supports transparency, but viewer support is morelimited.
As an alternative to designating a single color as transparent, you can control the transparency, or alpha value, of anycolor. See Section 4.3, “Truecolor Images” for more information.
An image either has a transparent color or it does not. (This is aside from use of alpha values for colors.) If you designate'yellow' as transparent, for example, everything drawn on the image in yellow becomes transparent, regardless of whenit was drawn - before or after the transparent color selection. This is because the transparent color designation occursin the image's color map - it does not change the pixels in the image.
ExampleTo set the plot image background to be transparent, pick a color (here 'yellow') that won't be used anywhere else onthe image, and use code like this:
$plot->SetBackgroundColor('yellow');$plot->SetTransparentColor('yellow');
HistoryThe ability to specify NULL or omit the parameter to disable having a transparent color was added in PHPlot-6.0.0.

SetTTFPath
363
SetTTFPathSetTTFPath — Set the default TrueType font directory
Synopsis
$plot->SetTTFPath($path)
DescriptionSetTTFPath sets the directory where SetFont and SetFontTTF can find TrueType font files.
Parameters$path
Full path to a directory containing TrueType fonts.
NotesThe default TrueType font directory is '.', meaning fonts will be loaded from the directory containing your main PHPscript. PHPlot also attempts to load fonts without any path, which allows GD to try to locate the font using its owninternal rules. This works on some platforms, but not on others.
SetTTFPath does not enable the use of TrueType fonts. See the note at the end of the reference for SetUseTTF onhow to set up and use TrueType fonts.
The default TrueType font directory is also used to find an internally-set default font. This means that if you useSetTTFPath, but do not specify a font name (with SetDefaultTTFont, SetFont, or SetFontTTF), PHPlot will attemptto select a default font from its internal list, but using the directory you specify with SetTTFPath. This can be usefulon platforms where you are willing to use a default font, but the internal GD rules on how to locate fonts do not work.
See Section 3.8.3, “TrueType Font Selection” for more information.
HistoryUse of the default TrueType font directory to locate the initial, default font was implemented in PHPlot-5.1.3. Also withthis release, fonts are first searched for without a path, which allows GD to try to locate the font using its internal rules.
Starting with PHPlot-5.0rc3, the default TrueType font directory is used both for the default font set withSetDefaultTTFont and for fonts set with SetFont. Refer to those two functions for details.

SetUseTTF
364
SetUseTTFSetUseTTF — Set the default font type
Synopsis
$plot->SetUseTTF($ttf)
DescriptionSetUseTTF sets the default font type to TrueType fonts or built-in GD fonts, and re-initializes all font settings.
Parameters$ttf
True to use TrueType fonts by default, False to use built-in GD fonts by default.
NotesChanging the font type re-initializes all the font settings to the PHPlot defaults.
• SetUseTTF(FALSE) resets all text elements to use the built-in GD fonts in the default sizes, and sets GD fontsas the default.
• SetUseTTF(TRUE) resets all text elements to use TrueType fonts, in the default point sizes, but without changingthe default font name (if one was set). It sets TrueType fonts as the default.
• SetDefaultTTFont(NULL) or SetDefaultTTFont() resets all text elements to use TrueType fonts, inthe default point sizes, and also erases any default font name. See SetDefaultTTFont for details.
By default, built-in GD fonts are used.
When you enable TrueType fonts with SetUseTTF, there must be a valid default font. You can use SetDefaultTTFontto establish a default font, but since this also enables TrueType fonts as the default, you need not use SetUseTTF inthat case. On some platforms, PHPlot can find a valid default font on its own. See Section 3.8.3, “TrueType FontSelection” for more information on the default font.
After enabling TrueType fonts, you can use SetFont or SetFontTTF to select fonts and sizes for individual text elementsin the plot. You can also use SetFontGD to use GD fonts for one or more elements, overriding the default font type.
HistoryThrough PHPlot-5.1.2, there was a fixed default font called benjamingothic.ttf, which used to be includedwith PHPlot, but was removed in 2006. (It was not generally suitable for plotting anyway.) As a result, you hadto use SetDefaultTTFont to set a valid default font before enabling TrueType fonts with SetUseTTF(). But sinceSetDefaultTTFont() itself turned on TrueType fonts, SetUseTTF() was rarely useful. Starting with PHPlot-5.1.3,PHPlot will try a number of sans-serif font names, trying to find a valid font to use as the default. On platforms wherethis works, SetUseTTF(True) can be used without any other font setup in order to use the default TrueType font forall text.
Through PHPlot-5.0.5, this function enabled or disabled the use of TrueType font text, since all text on a graph hadto be either TrueType or all GD. Starting with PHPlot-5.0.6, this function selects the default font type (and still re-initializes all fonts). Both GD and TrueType font text can now be used on a graph.
SetXAxisPosition
365
SetXAxisPositionSetXAxisPosition — Move the X axis
Synopsis
$plot->SetXAxisPosition([$pos])
DescriptionSetXAxisPosition sets the position of the X axis.
Parameters$pos
The Y position in world coordinates for the X axis. (World coordinates are the coordinate space of your datapoints.) If the value is omitted or an empty string, the default behavior is restored.
NotesThe given position is truncated (towards 0) to an integer value.
The default axis position differs for vertical and horizontal plots. For vertical plots, the X axis position defaults to Y=0,provided Y=0 is within the range of the graph. If Y=0 is not within the range of the graph, the X axis position willdefault to the edge with the smallest absolute Y value. This means the X axis will be at the bottom of the graph if allvalues of Y are greater than zero, and at the top of the graph if all values of Y are less than zero. (For log scale plots,however, the default X axis position is Y=1.) For horizontal plots, the X axis position defaults to the bottom of the plot.
HistoryThrough PHPlot-5.3.0, the argument was required, and there was no way to restore the default behavior (because theargument value was always converted to an integer). Starting with PHPlot-5.3.1, the argument may be given as anempty string, or omitted, to restore the default behavior.
Through PHPlot-5.1.3, there was no special handling for horizontal plots. The X axis always defaulted to Y=0 or theY with the smallest absolute value.
Through PHPlot-5.1.0, the default position for the X axis was the bottom of the graph whenever Y=0 was not withinthe range the graph, regardless of whether the data was all positive or all negative.

SetXDataLabelAngle
366
SetXDataLabelAngleSetXDataLabelAngle — Set the text angle for X data labels
Synopsis
$plot->SetXDataLabelAngle($xdla)
DescriptionSetXDataLabelAngle sets the text angle for X data labels. If using TrueType fonts, any angle can be used. Ifusing built-in GD fonts, only 0 degree and 90 degree text can be used.
Parameters$xdla
Desired angle for label text, in degrees.
NotesThis function applies to both X axis data labels and X data value labels. See Section 3.6, “Labels” for more informationon data labels.
By default, X Data Labels are drawn at the same angle as X Tick Labels, as set with SetXLabelAngle.
HistoryThis function was added to PHPlot in 5.1.0. Through PHPlot-5.0.7, SetXLabelAngle set the angle for both text anddata labels.
Through PHPlot-5.0.7, there was a deprecated function by the same name that simply called SetXLabelAngle.

SetXDataLabelPos
367
SetXDataLabelPosSetXDataLabelPos — Position and control X data labels
Synopsis
$plot->SetXDataLabelPos($xdlp)
DescriptionSetXDataLabelPos determines if and where X data labels are drawn. For vertical plots, these are X axis datalabels, which display the label strings from your data array. The labels can be drawn at the bottom of the plot (belowthe X axis), above the plot, in both positions, or neither. For horizontal plots, these are X data value labels, displayingthe value of the data point within the plot area.
Parameters$xdlp
A string indicating the desired position for the X data labels:
Position Description
plotdown Data labels below the plot. This is for vertical plots.
plotup Data labels above the plot. This is for vertical plots.
both Data labels both below and above the plot. This is for vertical plots.
plotin Data value labels within the plot area. For bar charts, this displays thevalue to the right (or left) of each bar. For stacked bar charts, this displayonly the bar total labels and not the bar segment labels. For other plottypes, see notes below.
plotstack Data value labels to the right (or left) of each bar, and just left of the endof each bar segment. This is valid for horizontal stacked bar plots only.It turns on both bar total labels (as with 'plotin') and bar segment labels.
none No data labels or data value labels
NotesWith vertical plots, this function controls the X axis data labels. For an example, see Section 5.3, “Example - Area Plot”,where the labels are enabled by default and displayed below the X axis. With horizontal plots, this function controls theX data value labels. For examples, see Example 5.27, “Horizontal Bar Chart” and Example 5.28, “Horizontal StackedBar Chart”.
The default position for X data labels (for vertical plots) is below the plot. However, PHPlot only enables the datalabels if SetXDataLabelPos was used to position them, or if SetXTickLabelPos was not used to enable the tick labelsand the data labels are not all empty.
The default position for X data value labels (for horizontal plots) is 'none', meaning no labels. For plot types 'bars' and'stackedbars', X data value labels are drawn (if enabled) at fixed positions within or left/right of the bars. For plot types'lines', 'points', and 'linepoints', X data labels are drawn (if enabled) above the data points by default. The positioncan be changed (see Section 4.7.7, “Tuning Labels”), but PHPlot does not attempt to prevent interference between thelabels and other plot elements. X data value labels are not available with other plot types.

SetXDataLabelPos
368
For tick labels, see SetXTickLabelPos.
The bar segment labels, if enabled ('plotstack'), are drawn inside the bars and may not be very visible if dark colorsare used for the bar fill. Bar segment labels will be omitted for segments which are too short.
X data value labels will be drawn to the left of the bars for negative values. This only applies to horizontal bar charts.Stacked bar charts are not allowed to have negative values.
If X data label lines are enabled with SetDrawXDataLabelLines, then SetXDataLabelPos() also determines thedirection of the lines which are drawn from the data points.
The X data label text angle is set with SetXDataLabelAngle. The X data label text format can be controlled withSetXDataLabelType or SetXLabelType.
X data value labels do work with horizontal error plots (plot types 'lines', 'points', and 'linepoints' and data type data-data-yx-error). The labels will identify the base X values of the points. You can change the default label positions(offset and angle) as explained in Section 4.7.7, “Tuning Labels”).
HistoryHorizontal error plots, with data labels, were first available in PHPlot-6.1.0.
Horizontal lines, points, and linepoints plots and data value labels for them were first available in PHPlot-6.0.0.
Horizontal bar plot data value labels were added in PHPlot-5.1.3. Through PHPlot-5.1.2, the 'plotin' and 'plotstack'values were not available.
Through PHPlot-5.0.7, the default position for X data labels was below the plot ('plotdown'). This would result inoverlaid data and tick labels by default. In addition, positioning the X tick labels with SetXTickLabelPos with a positionother than 'none' resulted in disabling the X data labels, and vice-versa. If both tick and data labels were positioned,the later setting overrode the earlier, which was turned off. Starting with PHPlot-5.1.0, PHPlot handles tick and datalabel positions as described in the notes above.

SetXDataLabelType
369
SetXDataLabelTypeSetXDataLabelType — Set formatting type for X data labels
Synopsis
$plot->SetXDataLabelType($type, [...])
DescriptionSetXDataLabelType sets the formatting type for X data labels. By default, data labels are formatted the same astick labels. If SetXLabelType is not used, then there is no special formatting for either label type, so the labels areoutput as-is. Available format types are 'data', 'time', 'printf', and 'custom'.
'data' formatting formats the labels as floating point numbers, with digits grouped into thousands (3 digit groups), andwith user-defined precision. Grouping separator characters can be set with SetNumberFormat. The precision (numberof digits after the decimal point) can be set as an additional argument to SetXDataLabelType. A prefix and suffixstring can also be specified.
'time' formatting formats the labels as date/time values, with the format string specified as an additional argument toSetXDataLabelType.
'printf' formatting formats the labels using the standard sprintf function. One, two, or three format strings arespecified as additional arguments to SetXDataLabelType.
'custom' formatting formats the labels using a caller-provided function, with an optional pass-through argument. Thisprovides the maximum flexibility in formatting labels.
ParametersThere is one required argument, $type. Other arguments depend on the value of the $type argument.
$typeA string indicating the desired formatting mode: 'data', 'time', 'printf', or 'custom'. Or, an empty string meaningrevert to no formatting.
For type 'data', there are three optional arguments:
$precisionThe formatting precision, or number of decimal places (optional). If omitted, the default is 1.
$prefixA prefix string to be placed before the formatted label values. This could be used for a currency symbol, forexample. The default is an empty string.
$suffixA suffix string to be placed after the formatted label values. This could be used for a currency symbol, for example.The default is an empty string.
For type 'time', there is one optional argument:
$formatFormatting string, used with strftime(). For example, '%Y-%m-%d' results in formatting a time_t valueas a year, month, and day numbers. If omitted, the default is '%H:%M:%S' (hours, minutes, and seconds).

SetXDataLabelType
370
For type 'printf', there can be one, two, or three optional arguments:
$format1, [$format2, [$format3 ]]Format string(s), used with sprintf(). The format string(s) must contain at most one conversion specification(%-code) which consumes a single argument. If no format strings are specified, the default value of '%e' usesscientific notation with default field sizes.
If a single format string is given ($format1), it is used for all label values.
If two format strings are given ($format1, $format2), then the first string $format1 is used to formatthe value of the label if it is greater than or equal to zero. The second string $format2 is used to format theabsolute value of the label if it is less than zero.
If three format strings are given ($format1, $format2, $format3), then the first string $format1 isused to format the value of the label if it is greater than zero. The second string $format2 is used to formatthe absolute value of the label if it is less than zero. The third string $format3 is used when the value of thelabel is zero.
For type 'custom', there is one required argument and one optional argument:
$callbackA callback function to format the label. This is either the name of a function (as a string), or a two-element arraywith an object instance and method name. (Refer to the PHP documentation for more information on the callbacktype.) The callback will be called with two, three, or four arguments: the value of the label to be formatted, thepass-through argument (see next), and the row and column of the data point (if applicable to the label type). SeeSection 3.6.5.5, “Formatting Labels: Extended 'custom' type” for more on the row and column arguments suppliedto the callback.
$callback_argA pass-through argument for the callback function. If omitted, NULL is used.
NotesThis function applies to both X axis data labels and X data value labels. (There is no ambiguity, because vertical plotshave only X axis data labels, and horizontal plots have only X data value labels.)
See Section 3.6, “Labels” for more information on labels, and specifically Section 3.6.5, “Formatting Labels” for moreinformation on formatting labels.
The default formatting mode is to do no special formatting of the labels. Strings will be output as-is, and numbers willbe output using PHP's default formatting. If you need to change label formatting back to the default, or to override aformat type you set for tick labels and have no formatting for data labels, use SetXDataLabelType without arguments,or with an empty string argument.
When using a custom label formatting function, do not assume the labels are formatted in any particular order, oronly once each.
When using 2 or 3 'printf' format strings, the labels being formatted must be numeric values.
When using 2 or 3 'printf' format strings, the second one is used to format the absolute value of the label, so yougenerally must provide some indication in the format string that the value is negative.
ExamplesSee SetXLabelType.
SetXDataLabelType
371
HistoryThe 'printf' label format type was extended to support 2 or 3 format strings in PHPlot-6.2.0. Before that release, onlya single format string could be used.
Custom label formatting functions are passed the row and column arguments (if applicable) starting with PHPlot-5.8.0.
This function was added in PHPlot-5.1.0. Through PHPlot-5.0.7, data labels and tick labels always used the sameformatting, as set with SetXLabelType.

SetXLabelAngle
372
SetXLabelAngleSetXLabelAngle — Set the text angle for X labels
Synopsis
$plot->SetXLabelAngle($xla)
DescriptionSetXLabelAngle sets the text angle for X tick labels. Unless SetXDataLabelAngle is called, the same angle is alsoused for X data labels. If using TrueType fonts, any angle can be used. If using built-in GD fonts, only 0 degree and90 degree text can be used.
Parameters$xla
Desired angle for label text, in degrees.
NotesThe default text angle for X labels is 0 degrees, for horizontal text.
HistoryThrough PHPlot-5.0.7, SetXLabelAngle sets the angle for both tick and data labels. Starting with PHPlot-5.1.0, thesecan be controlled independently using SetXDataLabelAngle. For compatibility, data label angles default to the valueset for tick label angles with SetXLabelAngle.

SetXLabelType
373
SetXLabelTypeSetXLabelType — Set formatting type for X tick labels
Synopsis
$plot->SetXLabelType($type, [...])
DescriptionSetXLabelType sets the formatting type for X tick labels, and the default formatting type for X data labels. (IfSetXDataLabelType is never called, SetXLabelType effectively sets the formatting type for both X tick labels andX data labels.) By default, there is no special formatting, so the labels are output as-is. Available format types are'data', 'time', 'printf', and 'custom'.
'data' formatting formats the labels as floating point numbers, with digits grouped into thousands (3 digit groups), andwith user-defined precision. Grouping separator characters can be set with SetNumberFormat. The precision (numberof digits after the decimal point) can be set with SetPrecisionX, or as an additional argument to SetXLabelType. Aprefix and suffix string can also be specified.
'time' formatting formats the labels as date/time values, using a format specifier set by SetXTimeFormat or using anadditional argument to SetXLabelType.
'printf' formatting formats the labels using the standard sprintf function. One, two, or three format strings arespecified as additional arguments to SetXLabelType.
'custom' formatting formats the labels using a caller-provided function, with an optional pass-through argument. Thisprovides the maximum flexibility in formatting labels.
ParametersThere is one required argument, $type. Other arguments depend on the value of the $type argument.
$typeA string indicating the desired formatting mode: 'data', 'time', 'printf', or 'custom'. Or, an empty string meaningrevert to no formatting.
For type 'data', there are three optional arguments:
$precisionThe formatting precision, or number of decimal places (optional). If omitted, the value set with SetPrecisionX isused, or if that was never called then the default is 1.
$prefixA prefix string to be placed before the formatted label values. This could be used for a currency symbol, forexample. The default is an empty string.
$suffixA suffix string to be placed after the formatted label values. This could be used for a currency symbol, for example.The default is an empty string.
For type 'time', there is one optional argument:
SetXLabelType
374
$formatFormat string, used with strftime(). For example, '%Y-%m-%d' results in formatting a time_t value as ayear, month, and day numbers. If omitted, the value set with SetXTimeFormat is used, or if that was never calledthen the default is '%H:%M:%S' (hours, minutes, and seconds).
For type 'printf', there can be one, two, or three optional arguments:
$format1, [$format2, [$format3 ]]Format string(s), used with sprintf(). The format string(s) must contain at most one conversion specification(%-code) which consumes a single argument. If no format strings are specified, the default value of '%e' usesscientific notation with default field sizes.
If a single format string is given ($format1), it is used for all label values.
If two format strings are given ($format1, $format2), then the first string $format1 is used to formatthe value of the label if it is greater than or equal to zero. The second string $format2 is used to format theabsolute value of the label if it is less than zero.
If three format strings are given ($format1, $format2, $format3), then the first string $format1 isused to format the value of the label if it is greater than zero. The second string $format2 is used to formatthe absolute value of the label if it is less than zero. The third string $format3 is used when the value of thelabel is zero.
For type 'custom', there is one required argument and one optional argument:
$callbackA callback function to format the label. This is either the name of a function (as a string), or a two-element arraywith an object instance and method name. (Refer to the PHP documentation for more information on the callbacktype.) The callback will be called with two, three, or four arguments: the value of the label to be formatted, thepass-through argument (see next), and the row and column of the data point (if applicable to the label type). SeeSection 3.6.5.5, “Formatting Labels: Extended 'custom' type” for more on the row and column arguments suppliedto the callback.
$callback_argA pass-through argument for the callback function. If omitted, NULL is used.
NotesSee Section 3.6, “Labels” for more information on labels, and specifically Section 3.6.5, “Formatting Labels” for moreinformation on formatting labels.
The default formatting mode is to do no special formatting of the labels. Strings will be output as-is, and numbers will beoutput using PHP's default formatting. If you need to change label formatting back to the default, use SetXLabelTypewithout arguments, or with an empty string argument.
A side effect of SetPrecisionX is to call this function SetXLabelType and set the format type to 'data'. Note thatSetXTimeFormat does not have a corresponding side effect on the format type.
When using a custom label formatting function, do not assume the labels are formatted in any particular order, oronly once each.
When using 2 or 3 'printf' format strings, the labels being formatted must be numeric values.
When using 2 or 3 'printf' format strings, the second one is used to format the absolute value of the label, so yougenerally must provide some indication in the format string that the value is negative.

SetXLabelType
375
ExamplesThe following tables show some label formatting examples. These also apply to SetXLabelType,SetXDataLabelType, SetYLabelType, and SetYDataLabelType.
Data (numeric) formatting with two digits of precision. Grouping and decimal separators depend on locale.
Code: Value: Result:
1234.56 1,234.56$plot->SetXLabelType('data', 2);
3.14159 3.14
Data (numeric) formatting with prefix. € is the entity code for the Euro sign in Unicode. (Numeric entity codesare handled by the GD library, but not named character entity codes.) Here we use it as a prefix, common usage forEnglish. The Euro sign may appear differently in your browser. But when used with PHPlot it requires a Unicodefont on the server.
Code: Value: Result:
$plot->SetXLabelType('data', 0, '&#8364;'); 1000000 €1,000,000
Data (numeric) formatting with suffix. Here we use the Euro as a suffix, common usage for French, represented bya 3 byte UTF code. You can use html_entity_decode() with UTF-8 as the character set to translate € into thissequence. SetNumberFormat is used here to override the locale settings for thousands and decimal separators.
Code: Value: Result:
1e6 1.000.000,00€$plot->SetNumberFormat(',', '.');$plot->SetXLabelType('data', 2, '', "\xe2\x82\xac");
4321.123 4.321,123€
Date/time formatting. The given value is mktime(0,0,0,4,15,2008). The format string could be set withSetXTimeFormat instead.
Code: Value: Result:
$plot->SetXLabelType('time', '%m/%Y'); 1208232000 04/2008
Formatting using printf. Note PHP printf may differ from the standard C library. For example, PHP outputs only aone digit exponent here.
Code: Value: Result:
$plot->SetXLabelType('printf', '%8.2e'); 1234 1.23e+3
When two format strings are used with printf formatting, the first is used for non-negative values, and the second fornegative values (with the absolute value formatted).
Code: Value: Result:
15.6 15.60$plot->SetXLabelType('printf', '%.2f', '(%.2f)');
-9.87 (9.87)

SetXLabelType
376
When three format strings are used with printf formatting, the first is used for positive values, the second for negativevalues (with the absolute value formatted), and the third for zero. You can suppress zero with an empty third formatstring.
Code: Value: Result:
9.1 GAIN:$9.10
-26.35 LOSS:($26.35)$plot->SetXLabelType('printf', 'GAIN:$%.2f', 'LOSS:($%.2f)', '[Unchanged]');
0 [Unchanged]
In this example, a custom formatting function is used to format values in decimal degrees as degrees, minutes, andseconds. (This only works for non-negative angles.)
Code: Value: Result:
75.12345 75d 7m 24s
0 0d 0m 0sfunction deg_min_sec($value){ $deg = (int)$value; $value = ($value - $deg) * 60; $min = (int)$value; $sec = (int)(($value - $min) * 60); return "{$deg}d {$min}m {$sec}s";}$plot->SetXLabelType('custom', 'deg_min_sec');
136.5 136d 30m 0s
HistoryThe 'printf' label format type was extended to support 2 or 3 format strings in PHPlot-6.2.0. Before that release, onlya single format string could be used.
Custom label formatting functions are passed the row and column arguments (if applicable) starting with PHPlot-5.8.0.
Through PHPlot-5.0.7, this function set the format type for both X tick labels and X data labels. Starting withPHPlot-5.1.0, a new function SetXDataLabelType was added to allow separate control of tick and data labels.SetXLabelType now sets the format type for X tick labels, and the default format type for X data labels.
New label format types 'printf' and 'custom' were added at PHPlot-5.0.6, as well as all arguments after the first. InPHPlot-5.0.5 and earlier, you must use SetXTimeFormat and SetPrecisionX to set the formatting parameters. Startingwith PHPlot-5.0.6, you have the choice of using those, or providing additional arguments to SetXLabelType. Alsoadded was the ability to add a prefix and suffix to 'data' formatted labels. In PHPlot-5.0.5 and earlier, there was anundocumented class variable data_units_text that was applied as a suffix to 'data' mode labels, for both X andY. This continues to work, but is deprecated.
Starting with PHPlot-5.0.6, you can use an empty string or no argument at all to reset to the default of no formatting.
Starting with PHPlot-5.0.4, empty string data labels are ignored when formatting with 'data' or 'time' formats. You canuse this to suppress some data labels, or control label density, with 'data' and 'time' formatted labels.
Through PHPlot-5.0rc3, empty strings would still be formatted. With 'data' format, an empty string would result in azero value, and with 'time' format an empty string would cause an error. As a result, with older releases, if you don't wantto use data labels when using 'data' or 'time' formats, you must turn off X data label display with SetXDataLabelPos,even if your data array labels are empty strings.
Through PHPlot-5.0rc3, when the formatting mode is 'data' the thousands grouping separator was always a comma,and a period was used as a decimal point. Starting with 5.0.4, PHPlot attempts to get the correct values for your locale.You can set the separator characters yourself instead with SetNumberFormat.

SetXScaleType
377
SetXScaleTypeSetXScaleType — Select linear or logarithmic scale
Synopsis
$plot->SetXScaleType($st)
DescriptionSetXScaleType sets the scale type along the X axis to be either linear (the default) or logarithmic.
Parameters$st
A string specifying the scale type: 'linear' or 'log'.
NotesNo X value may be less than or equal to 0 with logarithmic X scale.
Support for logarithmic scales in PHPlot is limited. One problem is that tick interval is fixed for the entire range ofdata, which is inappropriate for logarithmic scales where the data spans more than one magnitude.
The default X and Y scale types are linear.

SetXTickAnchor
378
SetXTickAnchorSetXTickAnchor — Set an anchor point for X tick marks
Synopsis
$plot->SetXTickAnchor([$xta])
DescriptionSetXTickAnchor sets an anchor point for X tick marks. This ensures that a tick mark will be placed at that value(if it is within the plotted data range). The effect of this function is to slide the set of tick marks along the axis untilone of them falls on the anchor. This also affects the position of the tick labels and X grid lines. It does not changethe plotted data values, nor the range of values along the X axis.
Parameters$xta
The desired X anchor point, in world coordinates. If omitted or NULL, the default of not using an anchor isrestored.
NotesBy default, PHPlot will place the left-most tick mark at the left end of the X axis range. For example, if the X rangeis -5 to 5, and the tick increment is 2, tick marks will be placed at X=-5, -3, -1, 1, 3, and 5. Note that in this case therewould be no tick mark at the Y axis position X=0.
When using the default method of calculating and adjusting the plot range, PHPlot will select a whole multiple of thetick increment as the left end of the X plot range. Another way of looking at this is that PHPlot implicitly anchorsthe X tick marks at 0, when it calculates the range with the default adjustment method. If you set the plot range withSetPlotAreaWorld, or change the range end adjustment method, the tick marks may not be anchored at 0 unless you useSetXTickAnchor(0). More on this can be found in Section 4.6, “Plot Range and Tick Increment Calculations”.
If an X tick anchor is set, and its value is within the plotted range, PHPlot will adjust the left-most tick mark so thatthere is a tick mark at the X tick anchor position. For example, if the X range is -5 to 5, the tick increment is 2, andthe X tick anchor is set to 0, ticks marks will be placed at X=-4, -2, 0, 2, and 4.
The X tick anchor need not be within the plotted range. If the tick anchor is outside the plotted range, the tick markswill still be adjusted so that a tick marked would be placed at the anchor if the data range was extended to include it.For example, if the X range is -5 to 5, the tick increment is 2, and the X tick anchor is set to 10, ticks marks will stillbe placed at X=-4, -2, 0, 2, and 4 as in the previous example.
See Section 5.38, “Example - Hourly Data Using X Tick Anchor” for an example of setting an X tick anchor.
HistoryThis function did not change at PHPlot-6.0.0, however a new method of automatically calculating the plotrange was introduced which always anchors the X tick marks at 0, when using the default settings. Therefore,SetXTickAnchor(0) is usually no longer needed to get a tick mark at X=0. In releases before PHPlot-6.0.0,SetXTickAnchor was usually necessary to get reasonable tick marks, unless the left end of the X plot rangehappened to be 0, or was set to 0 or a multiple of the tick increment.

SetXTickAnchor
379
This function was added in PHPlot-5.4.0.
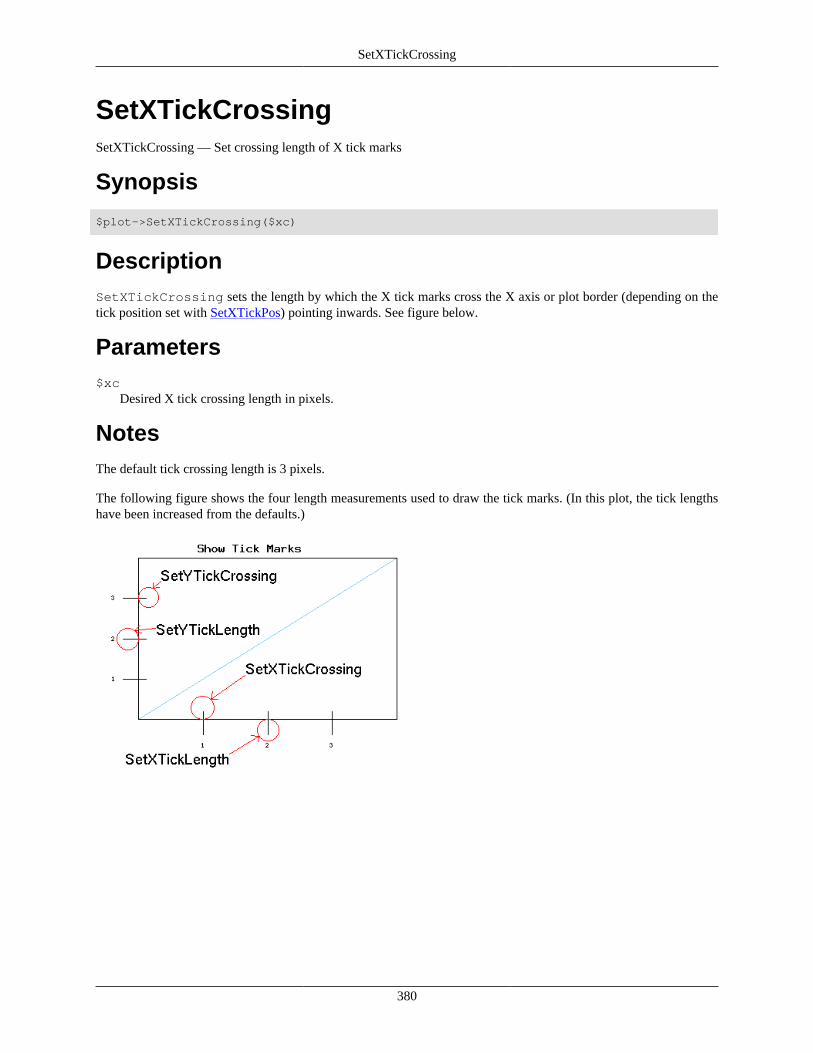
SetXTickCrossing
380
SetXTickCrossingSetXTickCrossing — Set crossing length of X tick marks
Synopsis
$plot->SetXTickCrossing($xc)
DescriptionSetXTickCrossing sets the length by which the X tick marks cross the X axis or plot border (depending on thetick position set with SetXTickPos) pointing inwards. See figure below.
Parameters$xc
Desired X tick crossing length in pixels.
NotesThe default tick crossing length is 3 pixels.
The following figure shows the four length measurements used to draw the tick marks. (In this plot, the tick lengthshave been increased from the defaults.)

SetXTickIncrement
381
SetXTickIncrementSetXTickIncrement — Set the length of the interval between X ticks
Synopsis
$plot->SetXTickIncrement([$ti])
DescriptionSetXTickIncrement sets the length of the interval between X tick marks (the tick increment, or tick step). Youcan use either this function or SetNumXTicks (but not both) to control the tick mark spacing.
Parameters$ti
Desired tick increment, in world coordinates. If the value is omitted or an empty string, the default behavior isrestored.
NotesIf neither SetXTickIncrement nor SetNumXTicks is used, the tick interval is automatically calculated by PHPlot.See Section 4.6.7, “Automatic Tick Increment Calculation” for details.
HistoryBefore PHPlot-6.0.0, if neither the number of ticks nor the tick increment were specified, PHPlot calculated the tickincrement as 1/10 of the X data range. Starting with PHPlot-6.0.0, a more complex algorithm is used which tries toproduce 'natural' tick increments.
Starting with PHPlot-6.0.0, if you call both SetNumXTicks and SetXTickIncrement, the tick incrementhas priority and the specified number of ticks is ignored. Before PHPlot-6.0.0, the behavior was order-dependent:whichever function was used last had priority.

SetXTickLabelPos
382
SetXTickLabelPosSetXTickLabelPos — Position the X tick labels
Synopsis
$plot->SetXTickLabelPos($xtlp)
DescriptionSetXTickLabelPos determines where (and if) the X tick labels are drawn. The labels can be drawn at the bottomof the plot, above the plot, in both positions, at the X axis (even if it is in the middle of the plot), or not drawn at all.
Parameters$xtlp
A string indicating the desired position for the X tick labels:
Position Description
plotdown Tick labels below the plot
plotup Tick labels above the plot
both Tick labels both below and above the plot
xaxis Tick labels at X axis (even if the axis is in the middle of the plot)
none No tick labels
NotesThe default position for the X tick labels is chosen to avoid overlapping tick and data labels. For vertical plots,the X tick labels will default to 'none' if the X data labels have been enabled using SetXDataLabelPos. If neitherSetXTickLabelPos nor SetXDataLabelPos are used, PHPlot will enable just data labels if they are non-empty, andotherwise it will enable just tick labels, and position them below the plot. For horizontal plots, there is no conflict(because data labels are drawn along Y), so the tick label position defaults to 'plotdown'.
This applies only to tick labels. For data labels, see SetXDataLabelPos. You may want the tick marks to be in the sameposition as the tick labels. To position the tick marks, see SetXTickPos.
See SetXAxisPosition for positioning the X axis.
HistoryThrough PHPlot-5.0.7, the default position for X tick labels was below the plot ('plotdown'). This would result inoverlaid data and tick labels by default. In addition, positioning the X data labels with SetXDataLabelPos with aposition other than 'none' resulted in disabling the X tick labels, and vice-versa. If both tick and data labels werepositioned, the later setting overrode the earlier, which was turned off. Starting with PHPlot-5.1.0, PHPlot handlestick and data label positions as described in the notes above.

SetXTickLength
383
SetXTickLengthSetXTickLength — Set outer length of X tick marks
Synopsis
$plot->SetXTickLength($xln)
DescriptionSetXTickLength sets the length of the X tick marks pointing outwards from the plot. For example, for tick markson an X axis at the bottom of the plot, this is the length from the X axis down.
Parameters$xln
Desired X tick length in pixels.
NotesThe default tick length is 5 pixels.
See figure under SetXTickCrossing.

SetXTickPos
384
SetXTickPosSetXTickPos — Position the X tick marks
Synopsis
$plot->SetXTickPos($tp)
DescriptionSetXTickPos determines where (and if) the X tick marks are drawn. The tick marks can be drawn at the bottom ofthe plot, above the plot, in both positions, at the X axis (even if it is in the middle of the plot), or not drawn at all.
Parameters$xtp
A string indicating the desired position for the X tick marks:
Position Description
plotdown Tick marks below the plot
plotup Tick marks above the plot
both Tick marks both below and above the plot
xaxis Tick marks at X axis (even if the axis is in the middle of the plot)
none No tick marks
NotesThe default position for the X tick marks is below the plot.
This applies only to tick marks. You may want the tick labels to be in the same positions as the tick marks. To positionthe tick labels, see SetXTickLabelPos.
See SetXAxisPosition for positioning the X axis.

SetXTimeFormat
385
SetXTimeFormatSetXTimeFormat — Set date/time formatting string for X labels
Synopsis
$plot->SetXTimeFormat($xtf)
DescriptionSetXTimeFormat sets the formatting string for X tick and data labels when 'time' formatting mode for X labelsis in effect. Use SetXLabelType to select the formatting mode for labels. The formatting string is used with the PHPstrftime to format labels as date/time strings.
Note
This function is retained for compatibility, but use of SetXLabelType is preferred.
Parameters$xtf
Formatting string for X labels, used with strftime(). For example, if the label value is 1104534000 (whichis the time_t representation of 6:00 PM on the last day of 2004), '%Y-%m-%d.%H:%M:%S' results in'2004-12-31.18:00:00', and '%d %b %Y' results in '31 Dec 2004'.
NotesThis applies to X tick labels, and also to X data labels unless overridden by SetXDataLabelType.
To use date/time formatting, the label values must be Unix time_t values (number of seconds since Unix epoch).
Unlike SetPrecisionX, SetXTimeFormat does not automatically enable the correct label formatting mode. You mustcall SetXLabelType('time') to use date/time formatting of labels.
The default time format is '%H:%M:%S', showing hours, minutes, and seconds (and ignoring any date information).
HistoryStarting with PHPlot-5.0.6, the time format can be set with SetXLabelType instead.
The default time format was undefined prior to PHPlot-5.0rc3.

SetXTitle
386
SetXTitleSetXTitle — Sets the X axis title, and optionally its position
Synopsis
$plot->SetXTitle($xtitle, [$xpos])
DescriptionSetXTitle sets the text to be displayed as the X axis title. Optionally, it also sets the position of the title and theaxis itself: below the graph (the usual place), above the graph, both, or neither.
Parameters$xtitle
The text string to use for the X axis title. The string can contain multiple lines, separated by newlines (in PHP: "\n").
$xposOptional position for the X axis and title. Use one of the following strings for the position:
Position Description
plotdown X axis below the plot
plotup X axis above the plot
both One X axis above, and one below
none No X axis, no X axis title
The default is 'plotdown'.
NotesBy default, there is no X axis title. If SetXTitle is called with an empty string as the title, the default behavior isrestored. This includes not leaving space on the graph for the title.

SetXTitleColor
387
SetXTitleColorSetXTitleColor — Set the color of the X Title
Synopsis
$plot->SetXTitleColor($color)
DescriptionSetXTitleColor sets the color of the X title (as set with SetXTitle).
Parameters$color
Color value to use. See Section 3.5, “Colors” for more on color values.
NotesUse this function if you want the X title to have a different color than the main title. See Section 3.7.1, “Titles” formore about plot titles.
By default, the X title defaults to use the same color as the main plot title. The main plot title color is set withSetTitleColor, and it defaults to black.
HistoryThis function was added in PHPlot-5.2.0. Through PHPlot-5.1.3, the main, X, and Y titles always used the same color.

SetYAxisPosition
388
SetYAxisPositionSetYAxisPosition — Move the Y axis
Synopsis
$plot->SetYAxisPosition($pos)
DescriptionSetYAxisPosition sets the position of the Y axis.
Parameters$pos
The X position in world coordinates for the Y axis. (World coordinates are the coordinate space of your datapoints.) If the value is omitted or an empty string, the default behavior is restored.
NotesThe given position is truncated (towards 0) to an integer value.
The default axis position differs for vertical and horizontal plots. For vertical plots, the Y axis position defaults to theleft side of the plot. For horizontal plots, the Y axis position defaults to X=0, provided X=0 is within the range ofthe graph. If X=0 is not within the range of the graph, the Y axis position will default to the edge with the smallestabsolute X value. This means the Y axis will be on the left side of the graph if all values of X are greater than zero,and on the right side of the graph if all values of X are less than zero. (For log scale plots, however, the default Yaxis position is X=1.)
HistoryThrough PHPlot-5.3.0, the argument was required, and there was no way to restore the default behavior (because theargument value was always converted to an integer). Starting with PHPlot-5.3.1, the argument may be given as anempty string, or omitted, to restore the default behavior.
Through PHPlot-5.1.3, there was no special handling for horizontal plots. The Y axis always defaulted to the left side ofthe plot. When plotting negative data with horizontal plots, it was usually necessary to use SetYAxisPosition(0)to force the bars to start from X=0.

SetYDataLabelAngle
389
SetYDataLabelAngleSetYDataLabelAngle — Set the text angle for Y data labels
Synopsis
$plot->SetYDataLabelAngle($ydla)
DescriptionSetYDataLabelAngle sets the text angle for Y data labels. If using TrueType fonts, any angle can be used. Ifusing built-in GD fonts, only 0 degree and 90 degree text can be used.
Parameters$ydla
Desired angle for label text, in degrees.
NotesThis function applies to both Y axis data labels and Y data value labels. See Section 3.6, “Labels” for more informationon data labels.
By default, Y data labels are drawn at 0 degrees. (This is different from X data labels, which default to the angle setfor X tick labels.)
HistoryThis function was added in PHPlot-5.1.0. Through PHPlot-5.0.7, Y data labels were always drawn at 0 degrees.

SetYDataLabelPos
390
SetYDataLabelPosSetYDataLabelPos — Position and control Y data labels
Synopsis
$plot->SetYDataLabelPos($ydlp)
DescriptionSetYDataLabelPos determines if and where Y data labels are drawn. For horizontal plots, these are Y axis datalabels, which display the label strings from your data array. The labels can be drawn at the left side of the plot (left ofthe Y axis), on the right side, in both positions, or neither. For vertical plots, these are Y data value labels, displayingthe value of the data point within the plot area.
Parameters$ydlp
A string indicating the desired position for the Y data labels:
Position Description
plotleft Data labels left of the plot. This is for horizontal plots.
plotright Data labels right of the plot. This is for horizontal plots.
both Data labels both left and right of the plot. This is for horizontal plots.
plotin Data value labels within the plot area. For bar charts, this displays thevalue above (or below) each bar. For stacked bar charts, this displaysonly the bar total labels and not the bar segment labels. For other plottypes, see notes below.
plotstack Data value labels above (or below) each bar, and below the top of eachbar segment. This is valid for vertical stacked bar plots only. It turns onboth bar total labels (as with 'plotin') and bar segment labels.
none No data labels or data value labels
NotesWith vertical plots, this function controls the Y data value labels. For examples, see Example 5.19, “Bar Chart with DataValue Labels”, Example 5.20, “Stacked Bars with Y Data Value Labels”, and Example 5.33, “Linepoints Plot with DataValue Labels”. With horizontal plots, this function controls the Y axis data labels. For examples, see Example 5.27,“Horizontal Bar Chart” and Example 5.28, “Horizontal Stacked Bar Chart”, where the labels are enabled by defaultand displayed to the left of the Y axis.
The default position for Y data labels (for horizontal plots) is left of the plot. However, PHPlot only enables the datalabels if SetYDataLabelPos was used to position them, or if SetYTickLabelPos was not used to enable the tick labelsand the data labels are not all empty.
The default position for Y data value labels (for vertical plots) is 'none', meaning no labels. For plot types 'bars' and'stackedbars', Y data value labels are drawn (if enabled) at fixed positions within or above/below the bars. For plottypes 'lines', 'points', 'linepoints', and 'squared', Y data labels are drawn (if enabled) above the data points by default.

SetYDataLabelPos
391
The position can be changed (see Section 4.7.7, “Tuning Labels”), but PHPlot does not attempt to prevent interferencebetween the labels and other plot elements. Y data value labels are not available with other plot types.
For tick labels, see SetYTickLabelPos.
The bar segment labels, if enabled ('plotstack'), are drawn inside the bars and may not be very visible if dark colorsare used for the bar fill. Bar segment labels will be omitted for segments which are too narrow.
Y data value labels will be drawn below the bars for negative values. This only applies to vertical bar charts. Stackedbar charts are not allowed to have negative values.
If Y data label lines are enabled with SetDrawYDataLabelLines, then SetYDataLabelPos() also determines thedirection of the lines which are drawn from the data points.
The Y data label text angle is set with SetYDataLabelAngle. The Y data label text format can be controlled withSetYDataLabelType or SetYLabelType.
Y data value labels do work with error plots (plot types 'lines', 'points', and 'linepoints' and data type data-data-error).The labels will identify the base Y values of the points. However, the default label position above the points will overlapthe error bars. To prevent this, change the position angle as explained in Section 4.7.7, “Tuning Labels”). For example:
// Setup for error plot with data value labels$plot->SetDataType('data-data-error');$plot->SetYDataLabelPos('plotin');$plot->data_value_label_angle = 45; // Position the labels at 45 degrees
HistoryData value labels were first available for error plots in PHPlot-6.0.0.
Through PHPlot-5.2.0, data value labels were only available for bars and stackedbars plot types. Starting withPHPlot-5.3.0, data value labels are also implemented for lines, points, linepoints, and squared plot types.
Horizontal plot types were added in PHPlot-5.1.2 and PHPlot-5.1.3, and the Y Data Labels were extended to includethe Y axis data labels for horizontal plots in addition to the data value labels for vertical plots.
The data value label feature for stacked bar graphs was added in PHPlot-5.1.1.
The data value label feature for bar graphs was added to PHPlot-5.0rc3.

SetYDataLabelType
392
SetYDataLabelTypeSetYDataLabelType — Set formatting type for Y data labels
Synopsis
$plot->SetYDataLabelType($type, [...])
DescriptionSetYDataLabelType sets the formatting type for Y data labels. By default, data labels are formatted the same astick labels. If SetYLabelType is not used, then there is no special formatting for either label type, so the labels areoutput as-is. Available format types are 'data', 'time', 'printf', and 'custom'.
'data' formatting formats the labels as floating point numbers, with digits grouped into thousands (3 digit groups), andwith user-defined precision Grouping separator characters can be set with SetNumberFormat. The precision (numberof digits after the decimal point) can be set as an additional argument to SetYDataLabelType. A prefix and suffixstring can also be specified.
'time' formatting formats the labels as date/time values, with the format string specified as an additional argument toSetYDataLabelType.
'printf' formatting formats the labels using the standard sprintf function. One, two, or three format strings arespecified as additional arguments to SetYDataLabelType.
'custom' formatting formats the labels using a caller-provided function, with an optional pass-through argument. Thisprovides the maximum flexibility in formatting labels.
ParametersThere is one required argument, $type. Other arguments depend on the value of the $type argument.
$typeA string indicating the desired formatting mode: 'data', 'time', 'printf', or 'custom'. Or, an empty string meaningrevert to no formatting.
For type 'data', there are three optional arguments:
$precisionThe formatting precision, or number of decimal places (optional). If omitted, the default is 1.
$prefixA prefix string to be placed before the formatted label values. This could be used for a currency symbol, forexample. The default is an empty string.
$suffixA suffix string to be placed after the formatted label values. This could be used for a currency symbol, for example.The default is an empty string.
For type 'time', there is one optional argument:
$formatFormatting string, used with strftime(). For example, '%Y-%m-%d' results in formatting a time_t valueas a year, month, and day numbers. If omitted, the default is '%H:%M:%S' (hours, minutes, and seconds).

SetYDataLabelType
393
For type 'printf', there can be one, two, or three optional arguments:
$format1, [$format2, [$format3 ]]Format string(s), used with sprintf(). The format string(s) must contain at most one conversion specification(%-code) which consumes a single argument. If no format strings are specified, the default value of '%e' usesscientific notation with default field sizes.
If a single format string is given ($format1), it is used for all label values.
If two format strings are given ($format1, $format2), then the first string $format1 is used to formatthe value of the label if it is greater than or equal to zero. The second string $format2 is used to format theabsolute value of the label if it is less than zero.
If three format strings are given ($format1, $format2, $format3), then the first string $format1 isused to format the value of the label if it is greater than zero. The second string $format2 is used to formatthe absolute value of the label if it is less than zero. The third string $format3 is used when the value of thelabel is zero.
For type 'custom', there is one required argument and one optional argument:
$callbackA callback function to format the label. This is either the name of a function (as a string), or a two-element arraywith an object instance and method name. (Refer to the PHP documentation for more information on the callbacktype.) The callback will be called with two, three, or four arguments: the value of the label to be formatted, thepass-through argument (see next), and the row and column of the data point (if applicable to the label type). SeeSection 3.6.5.5, “Formatting Labels: Extended 'custom' type” for more on the row and column arguments suppliedto the callback.
$callback_argA pass-through argument for the callback function. If omitted, NULL is used.
NotesThis function applies to both Y axis data labels and Y data value labels. (There is no ambiguity, because vertical plotshave only Y data value labels, and horizontal plots have only Y axis data labels.)
See Section 3.6, “Labels” for more information on labels, and specifically Section 3.6.5, “Formatting Labels” for moreinformation on formatting labels.
The default formatting mode is to do no special formatting of the labels. Strings will be output as-is, and numbers willbe output using PHP's default formatting. If you need to change label formatting back to the default, or to override aformat type you set for tick labels and have no formatting for data labels, use SetYDataLabelType without arguments,or with an empty string argument.
When using a custom label formatting function, do not assume the labels are formatted in any particular order, oronly once each.
When using 2 or 3 'printf' format strings, the labels being formatted must be numeric values.
When using 2 or 3 'printf' format strings, the second one is used to format the absolute value of the label, so yougenerally must provide some indication in the format string that the value is negative.
ExamplesSee SetXLabelType.

SetYDataLabelType
394
HistoryThe 'printf' label format type was extended to support 2 or 3 format strings in PHPlot-6.2.0. Before that release, onlya single format string could be used.
Custom label formatting functions are passed the row and column arguments (if applicable) starting with PHPlot-5.8.0.
This function was added in PHPlot-5.1.0. Through PHPlot-5.0.7, data labels and tick labels always used the sameformatting, as set with SetYLabelType.

SetYLabelAngle
395
SetYLabelAngleSetYLabelAngle — Set the text angle for Y tick labels
Synopsis
$plot->SetYLabelAngle($yla)
DescriptionSetYLabelAngle sets the text angle for Y tick labels. If using TrueType fonts, any angle can be used. If usingbuilt-in GD fonts, only 0 degree and 90 degree text can be used.
Parameters$yla
Desired angle for label text, in degrees.
NotesThe default text angle for Y labels is 0 degrees, for horizontal text.
This does not apply to Y data labels. For those, see SetYDataLabelAngle.
SetYLabelType
396
SetYLabelTypeSetYLabelType — Set formatting type for Y tick labels
Synopsis
$plot->SetYLabelType($type, [...])
DescriptionSetYLabelType sets the formatting type for Y tick labels, and the default formatting type for Y data labels. (IfSetYDataLabelType is never called, SetYLabelType effectively sets the formatting type for both Y tick labels andY data labels.) By default, there is no special formatting, so the labels are output as-is. Available format types are'data', 'time', 'printf', and 'custom'.
'data' formatting formats the labels as floating point numbers, with digits grouped into thousands (3 digit groups), andwith user-defined precision Grouping separator characters can be set with SetNumberFormat. The precision (numberof digits after the decimal point) can be set with SetPrecisionY, or as an additional argument to SetYLabelType. Aprefix and suffix string can also be specified.
'time' formatting formats the labels as date/time values, using a format specifier set by SetYTimeFormat or using anadditional argument to SetYLabelType.
'printf' formatting formats the labels using the standard sprintf function. One, two, or three format strings arespecified as additional arguments to SetYLabelType.
'custom' formatting formats the labels using a caller-provided function, with an optional pass-through argument. Thisprovides the maximum flexibility in formatting labels.
ParametersThere is one required argument, $type. Other arguments depend on the value of the $type argument.
$typeA string indicating the desired formatting mode: 'data', 'time', 'printf', or 'custom'. Or, an empty string meaningrevert to no formatting.
For type 'data', there are three optional arguments:
$precisionThe formatting precision, or number of decimal places (optional). If omitted, the value set with SetPrecisionY isused, or if that was never called then the default is 1.
$prefixA prefix string to be placed before the formatted label values. This could be used for a currency symbol, forexample. The default is an empty string.
$suffixA suffix string to be placed after the formatted label values. This could be used for a currency symbol, for example.The default is an empty string.
For type 'time', there is one optional argument:

SetYLabelType
397
$formatFormatting string, used with strftime(). For example, '%Y-%m-%d' results in formatting a time_t valueas a year, month, and day numbers. If omitted, the value set with SetYTimeFormat is used, or if that was nevercalled then the default is '%H:%M:%S' (hours, minutes, and seconds).
For type 'printf', there can be one, two, or three optional arguments:
$format1, [$format2, [$format3 ]]Format string(s), used with sprintf(). The format string(s) must contain at most one conversion specification(%-code) which consumes a single argument. If no format strings are specified, the default value of '%e' usesscientific notation with default field sizes.
If a single format string is given ($format1), it is used for all label values.
If two format strings are given ($format1, $format2), then the first string $format1 is used to formatthe value of the label if it is greater than or equal to zero. The second string $format2 is used to format theabsolute value of the label if it is less than zero.
If three format strings are given ($format1, $format2, $format3), then the first string $format1 isused to format the value of the label if it is greater than zero. The second string $format2 is used to formatthe absolute value of the label if it is less than zero. The third string $format3 is used when the value of thelabel is zero.
For type 'custom', there is one required argument and one optional argument:
$callbackA callback function to format the label. This is either the name of a function (as a string), or a two-element arraywith an object instance and method name. (Refer to the PHP documentation for more information on the callbacktype.) The callback will be called with two, three, or four arguments: the value of the label to be formatted, thepass-through argument (see next), and the row and column of the data point (if applicable to the label type). SeeSection 3.6.5.5, “Formatting Labels: Extended 'custom' type” for more on the row and column arguments suppliedto the callback.
$callback_argA pass-through argument for the callback function. If omitted, NULL is used.
NotesSee Section 3.6, “Labels” for more information on labels, and specifically Section 3.6.5, “Formatting Labels” for moreinformation on formatting labels.
The default formatting mode is to do no special formatting of the labels. Strings will be output as-is, and numbers will beoutput using PHP's default formatting. If you need to change label formatting back to the default, use SetYLabelTypewithout arguments, or with an empty string argument.
A side effect of SetPrecisionY is to call this function SetYLabelType and set the format type mode to 'data'. Note thatSetYTimeFormat does not have a corresponding side effect on the format type.
When using a custom label formatting function, do not assume the labels are formatted in any particular order, oronly once each.
When using 2 or 3 'printf' format strings, the labels being formatted must be numeric values.
When using 2 or 3 'printf' format strings, the second one is used to format the absolute value of the label, so yougenerally must provide some indication in the format string that the value is negative.
SetYLabelType
398
ExamplesSee SetXLabelType.
HistoryThe 'printf' label format type was extended to support 2 or 3 format strings in PHPlot-6.2.0. Before that release, onlya single format string could be used.
Custom label formatting functions are passed the row and column arguments (if applicable) starting with PHPlot-5.8.0.
Through PHPlot-5.0.7, this function set the format type for both Y tick labels and Y data labels. Starting withPHPlot-5.1.0, a new function SetYDataLabelType was added to allow separate control of tick and data labels.SetYLabelType now sets the format type for Y tick labels, and the default format type for Y data labels.
New label format types 'printf' and 'custom' were added at PHPlot-5.0.6, as well as all arguments after the first. InPHPlot-5.0.5 and earlier, you must use SetYTimeFormat and SetPrecisionY to set the formatting parameters. Startingwith PHPlot-5.0.6, you have the choice of using those, or providing additional arguments to SetYLabelType. Alsoadded was the ability to add a prefix and suffix to 'data' formatted labels. In PHPlot-5.0.5 and earlier, there was anundocumented class variable data_units_text that was applied as a suffix to 'data' mode labels, for both X andY. This continues to work, but is deprecated.
Starting with PHPlot-5.0.6, you can use an empty string or no argument at all to reset to the default of no formatting.
Through PHPlot-5.0rc3, when the formatting mode is 'data' the thousands grouping separator was always a comma,and a period was used as a decimal point. Starting with 5.0.4, PHPlot attempts to get the correct values for your locale.You can set the separator characters yourself instead with SetNumberFormat.
SetYScaleType
399
SetYScaleTypeSetYScaleType — Select linear or logarithmic scale
Synopsis
$plot->SetYScaleType($st)
DescriptionSetYScaleType sets the scale type along the Y axis to be either linear (the default) or logarithmic.
Parameters$st
A string specifying the scale type: 'linear' or 'log'.
NotesNo Y value may be less than or equal to 0 with logarithmic Y scale.
Support for logarithmic scales in PHPlot is limited. One problem is that tick interval is fixed for the entire range ofdata, which is inappropriate for logarithmic scales where the data spans more than one magnitude.
The default X and Y scale types are linear.
SetYTickAnchor
400
SetYTickAnchorSetYTickAnchor — Set an anchor point for Y tick marks
Synopsis
$plot->SetYTickAnchor([$yta])
DescriptionSetYTickAnchor sets an anchor point for Y tick marks. This ensures that a tick mark will be placed at that value(if it is within the plotted data range). The effect of this function is to slide the set of tick marks along the axis untilone of them falls on the anchor. This also affects the position of the tick labels and Y grid lines. It does not changethe plotted data values, nor the range of values along the Y axis.
Parameters$yta
The desired Y anchor point, in world coordinates. If omitted or NULL, the default of not using an anchor isrestored.
NotesBy default, PHPlot will place the bottom-most tick mark at the bottom of the Y axis range. For example, if the Y rangeis -5 to 5, and the tick increment is 2, tick marks will be placed at Y=-5, -3, -1, 1, 3, and 5. Note that in this case therewould be no tick mark at the X axis position Y=0.
When using the default method of calculating and adjusting the plot range, PHPlot will select a whole multiple ofthe tick increment as the bottom of the Y plot range. Another way of looking at this is that PHPlot implicitly anchorsthe Y tick marks at 0, when it calculates the range with the default adjustment method. If you set the plot range withSetPlotAreaWorld, or change the range end adjustment method, the tick marks may not be anchored at 0 unless you useSetYTickAnchor(0). More on this can be found in Section 4.6, “Plot Range and Tick Increment Calculations”.
If a Y tick anchor is set, and its value is within the plotted range, PHPlot will adjust the bottom-most tick mark so thatthere is a tick mark at the Y tick anchor position. For example, if the Y range is -5 to 5, the tick increment is 2, andthe Y tick anchor is set to 0, ticks marks will be placed at Y=-4, -2, 0, 2, and 4.
The Y tick anchor need not be within the plotted range. If the tick anchor is outside the plotted range, the tick markswill still be adjusted so that a tick marked would be placed at the anchor if the data range was extended to include it.For example, if the Y range is -5 to 5, the tick increment is 2, and the Y tick anchor is set to 10, ticks marks will stillbe placed at Y=-4, -2, 0, 2, and 4 as in the previous example.
See Section 5.37, “Example - Setting a Y Tick Anchor” for an example of setting a Y tick anchor.
HistoryThis function did not change at PHPlot-6.0.0, however a new method of automatically calculating the plotrange was introduced which always anchors the Y tick marks at 0, when using the default settings. Therefore,SetYTickAnchor(0) is usually no longer needed to get a tick mark at Y=0. In releases before PHPlot-6.0.0,SetYTickAnchor was usually necessary to get reasonable tick marks, unless the bottom of the Y plot rangehappened to be 0, or was set to 0 or a multiple of the tick increment.

SetYTickAnchor
401
This function was added in PHPlot-5.4.0.

SetYTickCrossing
402
SetYTickCrossingSetYTickCrossing — Set crossing length of Y tick marks
Synopsis
$plot->SetYTickCrossing($yc)
DescriptionSetYTickCrossing sets the length by which the Y tick marks cross the Y axis or plot border (depending on thetick position set with SetYTickPos) pointing inwards.
Parameters$yc
Desired X tick crossing length in pixels.
NotesThe default tick crossing length is 3 pixels.
See figure under SetXTickCrossing.

SetYTickIncrement
403
SetYTickIncrementSetYTickIncrement — Set the length of the interval between Y ticks
Synopsis
$plot->SetYTickIncrement([$ti])
DescriptionSetYTickIncrement sets the length of the interval between Y tick marks (the tick increment, or tick step). Youcan use either this function or SetNumYTicks (but not both) to control the tick mark spacing.
Parameters$ti
Desired tick increment, in world coordinates. If the value is omitted or an empty string, the default behavior isrestored.
NotesIf neither SetYTickIncrement nor SetNumYTicks is used, the tick interval is automatically calculated by PHPlot.See Section 4.6.7, “Automatic Tick Increment Calculation” for details.
HistoryBefore PHPlot-6.0.0, if neither the number of ticks nor the tick increment were specified, PHPlot calculated the tickincrement as 1/10 of the X data range. Starting with PHPlot-6.0.0, a more complex algorithm is used which tries toproduce 'natural' tick increments.
Starting with PHPlot-6.0.0, if you call both SetNumYTicks and SetYTickIncrement, the tick incrementhas priority and the specified number of ticks is ignored. Before PHPlot-6.0.0, the behavior was order-dependent:whichever function was used last had priority.

SetYTickLabelPos
404
SetYTickLabelPosSetYTickLabelPos — Position the Y tick labels
Synopsis
$plot->SetYTickLabelPos($ytlp)
DescriptionSetYTickLabelPos determines where (and if) the Y tick labels are drawn. The labels can be drawn on the leftside of the plot, on the right side of the plot, in both positions, at the Y axis (even if it is in the middle of the plot),or not drawn at all.
Parameters$ytlp
A string indicating the desired position for the Y tick labels:
Position Description
plotleft Tick labels on the left side of the plot
plotright Tick labels on the right side of the plot
both Tick labels on both left and right sides of the plot
yaxis Tick labels at Y axis (even if the axis is in the middle of the plot)
none No tick labels
NotesThe default position for the Y tick labels is chosen to avoid overlapping tick and data labels. For vertical plots, thereis no conflict (because data labels are drawn along X), so the tick label position defaults to 'plotleft'. For horizontalplots, the Y tick labels will default to 'none' if the Y data labels have been enabled using SetYDataLabelPos. If neitherSetYTickLabelPos nor SetYDataLabelPos are used, PHPlot will enable just data labels if they are non-empty, andotherwise it will enable just tick labels, and position them to the left of the plot.
This applies only to tick labels. For data labels, see SetYDataLabelPos. You may want the tick marks to be in the sameposition as the tick labels. To position the tick marks, see SetYTickPos.
See SetYAxisPosition for positioning the Y axis.
SetYTickLength
405
SetYTickLengthSetYTickLength — Set outer length of Y tick marks
Synopsis
$plot->SetYTickLength($yln)
DescriptionSetYTickLength sets the length of the Y tick marks pointing outwards from the plot. For example, for tick markson a Y axis on the left side of the plot, this is the length from the axis to the left.
Parameters$yln
Desired Y tick length in pixels.
NotesThe default tick length is 5 pixels.
See figure under SetXTickCrossing.

SetYTickPos
406
SetYTickPosSetYTickPos — Position the Y tick marks
Synopsis
$plot->SetYTickPos($tp)
DescriptionSetYTickPos determines where (and if) the Y tick marks are drawn. The tick marks can be drawn on the left sideof the plot, on the right side the plot, in both positions, at the Y axis (even if it is in the middle of the plot), or notdrawn at all.
Parameters$tp
A string indicating the desired position for the Y tick marks:
Position Description
plotleft Tick marks on the left side of the plot
plotright Tick marks on the right side of the plot
both Tick marks on both left and right sides of the plot
yaxis Tick marks at Y axis (even if the axis is in the middle of the plot)
none No tick marks
NotesThe default position for the Y tick marks is on the left side of the plot.
This applies only to tick marks. You may want the tick labels to be in the same positions as the tick marks. To positionthe tick labels, see SetYTickLabelPos.
See SetYAxisPosition for positioning the Y axis.

SetYTimeFormat
407
SetYTimeFormatSetYTimeFormat — Set date/time formatting string for Y labels
Synopsis
$plot->SetYTimeFormat($ytf)
DescriptionSetYTimeFormat sets the formatting string for Y tick and data labels when 'time' formatting mode for Y labels isin effect. (Y data labels are only available with bar charts and stacked bar charts.) Use SetYLabelType to select theformatting mode for labels. The formatting string is used with the PHP strftime to format labels as date/time strings.
Note
This function is retained for compatibility, but use of SetYLabelType is preferred.
Parameters$ytf
Formatting string for Y labels, used with strftime(). For example, if the label value is 1104534000 (whichis the time_t representation of 6:00 PM on the last day of 2004), '%Y-%m-%d.%H:%M:%S' results in'2004-12-31.18:00:00', and '%d %b %Y' results in '31 Dec 2004'.
NotesThis applies to Y tick labels, and also to Y data labels unless overridden by SetYDataLabelType.
To use date/time formatting, the label values must be Unix time_t values (number of seconds since Unix epoch).
Unlike SetPrecisionY, SetYTimeFormat does not automatically enable the correct label formatting mode. You mustcall SetYLabelType('time') to use date/time formatting of labels.
The default time format is '%H:%M:%S', showing hours, minutes, and seconds (and ignoring any date information).
HistoryStarting with PHPlot-5.0.6, the time format can be set with SetYLabelType instead.
The default time format was undefined prior to PHPlot-5.0rc3.

SetYTitle
408
SetYTitleSetYTitle — Sets the Y axis title, and optionally its position
Synopsis
$plot->SetYTitle($ytitle, [$ypos])
DescriptionSetYTitle sets the text to be displayed as the Y axis title. Optionally, it also sets the position of the title and theaxis itself: on the left side of the graph (the usual place), on the right side, both, or neither.
Parameters$ytitle
The text string to use for the Y axis title. The string can contain multiple lines, separated by newlines (in PHP: "\n").
$yposOptional position for the Y axis and title. Use one of the following strings for the position:
Position Description
plotleft Y axis on the left side of the plot
plotright Y axis on the right side of the plot
both One Y axis on the left, and one on the right
none No Y axis, no Y axis title
The default is 'plotleft'.
NotesBy default, there is no Y axis title. If SetYTitle is called with an empty string as the title, the default behavior isrestored. This includes not leaving space on the graph for the title.
SetYTitleColor
409
SetYTitleColorSetYTitleColor — Set the color of the Y Title
Synopsis
$plot->SetYTitleColor($color)
DescriptionSetYTitleColor sets the color of the Y title (as set with SetYTitle).
Parameters$color
Color value to use. See Section 3.5, “Colors” for more on color values.
NotesUse this function if you want the Y title to have a different color than the main title. See Section 3.7.1, “Titles” formore about plot titles.
By default, the Y title defaults to use the same color as the main plot title. The main plot title color is set withSetTitleColor, and it defaults to black.
HistoryThis function was added in PHPlot-5.2.0. Through PHPlot-5.1.3, the main, X, and Y titles always used the same color.

StartStream
410
StartStreamStartStream — Begin a Motion-JPEG (or other type) plot stream
Synopsis
$plot->StartStream()
DescriptionStartStream is used to begin producing streaming plots. This is a series of plots that are displayed rapidly, resultingin a moving video-like sequence. StartStream outputs the initial HTTP headers for the stream, disables browser-side caching, and prepares for the plot stream.
ParametersNone
NotesThe three functions StartStream(), PrintImageFrame, and EndStream are used together to produce streamingplots. Scripts producing streaming plots must use a web server. The PHP CLI will not work, because streaming plotsrequire HTTP headers.
For more on streaming plots, see Section 4.9, “Streaming Plots”.
ExampleSee PrintImageFrame for a partial example, and Section 4.9.3, “Streaming Plots - Example” for the complete example.
HistoryThis function was added in PHPlot-5.8.0. Prior releases are not able to produce streaming plots.

TuneXAutoRange
411
TuneXAutoRangeTuneXAutoRange — Adjust tuning parameters for X axis range calculation
Synopsis
$plot->TuneXAutoRange([$zero_magnet], [$adjust_mode], [$adjust_amount])
DescriptionTuneXAutoRange is used to adjust the parameters used by PHPlot when automatically calculating the plot rangealong the X axis.
Parameters$zero_magnet
Optional value for the X axis zero magnet, which controls how far PHPlot will extend the plot range to include0 if it doesn't already include 0. This is a floating point value between 0 and 1 inclusive, where 0 disables thezero magnet, and 1 requires the range be always extended to include 0. See Section 4.6.4.1, “Range parameter:zero_magnet” for more information.
$adjust_modeOptional value for the X axis range extension mode, which determines the method PHPlot uses to extend the endof the plot range beyond the data range. This is a single character:
Mode Description
T Tick : extend the range, then to the next tickmark.
R Range : extend the range.
I Integer : extend the range, then to the nextinteger value.
See Section 4.6.4.2, “Range parameter: adjust_mode” for more information.
$adjust_amountOptional value for the X axis range extension amount. This is a factor of the overall range by which therange is extended to leave extra room for labels, plot markers, etc. See the Section 4.6.4.3, “Range parameter:adjust_amount” for more information.
NotesSpecifying NULL, or omitting trailing unused parameters, results in no change to that parameter.
PHPlot does not calculate or adjust ends of the plot range which are set with SetPlotAreaWorld. PHPlot also does notadjust the plot range for the X axis in the case where X values are implied, rather than specified, in the data array (datatype text-data, used with vertical plots).
This applies to the X axis only, where X is the independent variable for vertical plots, and the dependent variable forhorizontal plots. See also TuneYAutoRange.
See Section 4.6.3, “Automatic Range Calculation” for more information on the range calculations and parameters.
TuneXAutoRange
412
The default for the zero magnet is 6/7, which results in up to 600% range extension. The default adjustment mode isT, which forces the axis to end at a tick mark. The default adjustment amount is either 0% or 3% (0.03), dependingon the plot type and whether X is the independent or dependent variable.
ExampleIf you do not want PHPlot to extend your X axis to include zero, even if it is relatively close, set the zero magnetto 0 to disable it.
$plot->TuneXAutoRange(0);
HistoryThis function was added in PHPlot-6.0.0.

TuneYAutoRange
413
TuneYAutoRangeTuneYAutoRange — Adjust tuning parameters for Y axis range calculation
Synopsis
$plot->TuneYAutoRange([$zero_magnet], [$adjust_mode], [$adjust_amount])
DescriptionTuneYAutoRange is used to adjust the parameters used by PHPlot when automatically calculating the plot rangealong the Y axis.
Parameters$zero_magnet
Optional value for the Y axis zero magnet, which controls how far PHPlot will extend the plot range to include0 if it doesn't already include 0. This is a floating point value between 0 and 1 inclusive, where 0 disables thezero magnet, and 1 requires the range be always extended to include 0. See Section 4.6.4.1, “Range parameter:zero_magnet” for more information.
$adjust_modeOptional value for the Y axis range extension mode, which determines the method PHPlot uses to extend the endof the plot range beyond the data range. This is a single character:
Mode Description
T Tick : extend the range, then to the next tickmark.
R Range : extend the range.
I Integer : extend the range, then to the nextinteger value.
See Section 4.6.4.2, “Range parameter: adjust_mode” for more information.
$adjust_amountOptional value for the Y axis range extension amount. This is a factor of the overall range by which therange is extended to leave extra room for labels, plot markers, etc. See the Section 4.6.4.3, “Range parameter:adjust_amount” for more information.
NotesSpecifying NULL, or omitting trailing unused parameters, results in no change to that parameter.
PHPlot does not calculate or adjust ends of the plot range which are set with SetPlotAreaWorld. PHPlot also does notadjust the plot range for the Y axis in the case where Y values are implied, rather than specified, in the data array (datatype text-data-yx, used with horizontal plots).
This applies to the Y axis only, where Y is the dependent variable for vertical plots, and the independent variable forhorizontal plots. See also TuneXAutoRange.
See Section 4.6.3, “Automatic Range Calculation” for more information on the range calculations and parameters.

TuneYAutoRange
414
The default for the zero magnet is 6/7, which results in up to 600% range extension. The default adjustment mode isT, which forces the axis to end at a tick mark. The default adjustment amount is either 0% or 3% (0.03), dependingon the plot type and whether Y is the independent or dependent variable.
ExamplesIf you want a plot with 'zero suppression' (not including zero on the Y axis), you can disable the zero magnet as follows:
$plot->TuneYAutoRange(0);
This emphasizes small changes in large numbers.
If you want PHPlot to set the plot range to exactly the data range, with no extensions or adjustments, set the zeromagnet to 0 to disable it, select adjustment mode 'R' (range only), and set the adjustment amount to 0%. Your Y axiswill go from the smallest to the largest Y value in your data array, with no extra space on either side.
$plot->TuneYAutoRange(0, 'R', 0);
HistoryThis function was added in PHPlot-6.0.0.

TuneXAutoTicks
415
TuneXAutoTicksTuneXAutoTicks — Adjust tuning parameters for X axis tick increment calculation
Synopsis
$plot->TuneXAutoTicks([$min_ticks], [$tick_mode], [$tick_inc_integer])
DescriptionTuneXAutoTicks is used to adjust the parameters used by PHPlot when automatically calculating the tick incrementalong the X axis.
Parameters$min_ticks
Sets the minimum number of tick intervals along the X axis. This is an integer greater than zero. SeeSection 4.6.8.1, “Tick Increment parameter: min_ticks” for more information.
$tick_modeSelects from one of three available modes for calculating the tick increment along the X axis:
Mode Description
decimal Use a power of 10 times 1, 2, or 5
binary Use a power of 2
date Use a date/time value
See Section 4.6.8.2, “Tick Increment parameter: tick_mode” for more information.
$tick_inc_integerIf TRUE, forces PHPlot to pick a whole number (integer) tick increment. If FALSE, allows fractional tickincrements. See the Section 4.6.8.3, “Tick Increment parameter: tick_inc_integer” for more information.
NotesSpecifying NULL, or omitting trailing unused parameters, results in no change to that parameter.
If the tick increment is set with SetXTickIncrement or indirectly with SetNumXTicks, then PHPlot does not need tocalculate the tick increment, and the parameters set with TuneXAutoTicks are not used.
This applies to the X axis only, where X is the independent variable for vertical plots, and the dependent variable forhorizontal plots. See also TuneYAutoTicks.
See Section 4.6.7, “Automatic Tick Increment Calculation” for more information on the tick increment calculationsand parameters.
The default for min_ticks is 8. The maximum number of tick intervals is about 2.5 times the minimum number.
The default for tick_mode depends on the label formatting type along the X axis. If SetXLabelType('time') is usedto select date/time formatting of labels, then the default for tick_mode is 'date', otherwise it is 'decimal'.

TuneXAutoTicks
416
The default for tick_inc_integer is FALSE, meaning PHPlot may use fractional tick increments. (Note thisdoes not mean a tick increment such as 2.5 would ever be selected. PHPlot uses whole numbers above 1 and fractionalincrements between 0 and 1.)
ExampleUse a minimum of 10 tick intervals along the X axis, and do not allow tick increments less than 1:
$plot->TuneXAutoRange(10, NULL, TRUE);
HistoryThis function was added in PHPlot-6.0.0.

TuneYAutoTicks
417
TuneYAutoTicksTuneYAutoTicks — Adjust tuning parameters for Y axis tick increment calculation
Synopsis
$plot->TuneYAutoTicks([$min_ticks], [$tick_mode], [$tick_inc_integer])
DescriptionTuneYAutoTicks is used to adjust the parameters used by PHPlot when automatically calculating the tick incrementalong the Y axis.
Parameters$min_ticks
Sets the minimum number of tick intervals along the Y axis. This is an integer greater than zero. SeeSection 4.6.8.1, “Tick Increment parameter: min_ticks” for more information.
$tick_modeSelects from one of three available modes for calculating the tick increment along the Y axis:
Mode Description
decimal Use a power of 10 times 1, 2, or 5
binary Use a power of 2
date Use a date/time value
See Section 4.6.8.2, “Tick Increment parameter: tick_mode” for more information.
$tick_inc_integerIf TRUE, forces PHPlot to pick a whole number (integer) tick increment. If FALSE, allows fractional tickincrements. See the Section 4.6.8.3, “Tick Increment parameter: tick_inc_integer” for more information.
NotesSpecifying NULL, or omitting trailing unused parameters, results in no change to that parameter.
If the tick increment is set with SetYTickIncrement or indirectly with SetNumYTicks, then PHPlot does not need tocalculate the tick increment, and the parameters set with TuneYAutoTicks are not used.
This applies to the Y axis only, where Y is the dependent variable for vertical plots, and the independent variable forhorizontal plots. See also TuneXAutoTicks.
See Section 4.6.7, “Automatic Tick Increment Calculation” for more information on the tick increment calculationsand parameters.
The default for min_ticks is 8. The maximum number of tick intervals is about 2.5 times the minimum number.
The default for tick_mode depends on the label formatting type along the Y axis. If SetYLabelType('time') is usedto select date/time formatting of labels, then the default for tick_mode is 'date', otherwise it is 'decimal'.
TuneYAutoTicks
418
The default for tick_inc_integer is FALSE, meaning PHPlot may use fractional tick increments. (Note thisdoes not mean a tick increment such as 2.5 would ever be selected. PHPlot uses whole numbers above 1 and fractionalincrements between 0 and 1.)
ExampleUse a minimum of 9 tick intervals along the Y axis, and pick a power of 2 as a tick increment:
$plot->TuneYAutoRange(9, 'binary');
HistoryThis function was added in PHPlot-6.0.0.

Part III. Developer's Guide to PHPlotThis part of the PHPlot manual is about PHPlot internals, and various technical details which are ofinterest mostly to developers of PHPlot itself.

PHPlot Plot Layout
420
Chapter 7. PHPlot Plot LayoutThis figure illustrates the plot layout, starting with PHPlot-5.0.5 when the margin calculations were rewritten. Use thefollowing notes to help understand the figure.
• A vertical plot is shown. The X and Y coordinate system is the same for horizontal plots, but the roles are reversed:Y is the independent variable, and X is the dependent variable.
• The safe_margin (box with X) is a gap of 5 pixels used to separate elements.
• The main title, X titles, and Y titles are optional. If these titles are not set, the space allocated to them collapses,including the safe_margin gap. This is shown in the figure with an arrow.
• Similarly, the X tick labels, X axis data labels (for vertical plots), Y tick labels, and Y axis data labels (for horizontalplots) are optional. If these labels are not used, the space allocated to them collapses, including the safe_margin.
• For vertical plots, X axis data labels and X tick labels occupy the same space. For horizontal plots, Y axis datalabels and Y tick labels occupy the same space. Normally only one of these should be present; if both are on forsome reason they will overlay.
• The base_margin (pink box with plus sign) is the space between the image edge and the outermost graphics ortext. If there is no image border, or the image border is no wider than 2 pixels (which is always the case throughPHPlot-5.1.1), then the base_margin is set to the same as the safe_margin value (5 pixels). A wider image borderincreases the base_margin; for example an 8 pixel image border results in a base_margin of 11 pixels.
• The top, left, right, and bottom margins consist of base_margin plus whatever space is needed for titles and ticks.There is a minimum value for these margins - 2 times safe_margin plus base_margin. Even if there are no titles atall on a side, the margin on that side will be no less than this minimum margin. This keeps the axis or plot areaedge from coming too close to the image edge. The calculated plot area margins shown can be overridden by usingSetPlotAreaPixels or SetMarginsPixels.
• The main title is positioned relative to the top of the image. Starting with PHPlot-5.0.5, the X and Y titles arepositioned relative to the plot area. PHPlot-5.0.4 and earlier positioned the X and Y titles relative to the imageedges. The difference should not be visible with automatic margins, but if the margins are set larger, or the plot areasmaller, then the X and Y titles will move inwards with the newer releases.
• It is possible to position X ticks and X tick labels to xaxis, and Y ticks and Y tick labels to yaxis, so the ticksand/or labels will float to the axis positions rather than always appear on the edges of the plot area. Space will beallocated for the corresponding margin only if the axis happens to fall exactly at the data limits for that side. Thismay cause problems if the axis is close but not quite at the edge; no margin space will be allocated on that side forthe labels, and the labels may overlap the title or fall off the edge of the image.
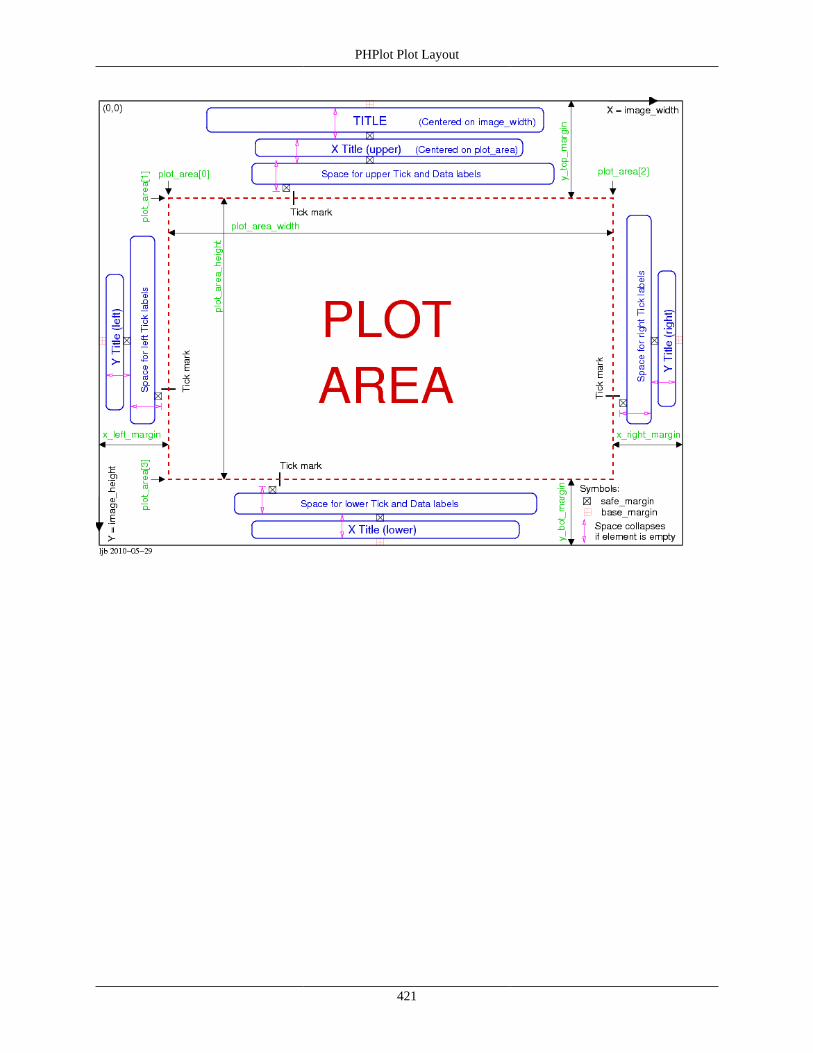
PHPlot Plot Layout
421

PHPlot Legend Layout
422
Chapter 8. PHPlot Legend LayoutThis figure illustrates the layout of the legend, as drawn by DrawLegend. Two of six possible arrangements of thecolor boxes and text are shown. See SetLegendStyle for more information.
Through PHPlot-5.2.0, the width of the color boxes was always char_w, the width of one character (or the width ofthe upper case letter "E") in the legend text font. Starting with PHPlot-5.3.0, this can be adjusted using a class variable.See Section 4.7.6, “Tuning the Legend” for more.
If point shapes are used in the legend instead of color boxes (see SetLegendUseShapes, added in PHPlot-5.4.0), thesame amount of space is still allocated, including width adjustment. But the point shape itself is always drawn at thesame size as in the plot, regardless of the width adjustment factor. If the plot area has a color background, the widthadjustment will stretch the box in that color which is drawn behind the point shape.
If line markers are used in the legend instead of color boxes (see SetLegendUseShapes, added in PHPlot-6.0.0 for lineplots), the width of the area reserved for color boxes is scaled by 4 (along with any 'tuning' adjustment). This leavesenough room to draw a line segment that can be identified visually by color and width.

PHPlot Class Internal Functions
423
Chapter 9. PHPlot Class InternalFunctions
This chapter documents PHPlot internal functions. These functions are intended to be used only byPHPlot itself.
Note
Starting with PHPlot-5.1.0, most of the internal functions are declared as protected, which limits theirvisibility to other member functions and inherited or parent classes. Some internal functions are still public,usually because they are needed for testing PHPlot. However, all functions documented in this chapter shouldbe treated as private, for use only by PHPlot. If you feel you have a need to use one of these functions fromoutside PHPlot (or an inherited class), please report this via the available PHPlot support mechanisms.
array_merge_php4($array1,$array2)This non-member function was removed at PHPlot-5.0.4.
array_pad_array(&$arr, $size, $arr2=NULL)This non-member function was removed at PHPlot-5.0.4 and replaced with the class member function pad_array.
CalcAxisPositions()Calculates the X and Y axis positions in world coordinates. These can be supplied by the user, in which case theyare only changed if they are outside the data range. If axis positions are not supplied by the user, CalcAxisPositionsapplies defaults as described in SetXAxisPosition and SetYAxisPosition. Called by DrawGraph. Note: This codewas moved out of CalcTranslation at PHPlot-5.0.5.
CalcBarWidths($stacked, $verticals)Calculates values for bars and stackedbars plot types. It calculates the width of the bars and the marginsaround and between them. An argument was added in PHPlot-5.1.2 to support horizontal plots. Arguments werechanged in PHPlot-5.3.0 to explicitly select stacked or grouped bars, and vertical or horizontal plots. This is calledby the bar chart drawing functions DrawBars, DrawStackedBars, DrawHorizBars, and DrawHorizStackedBars.(Through PHPlot-5.1.2 this was called by DrawGraph before a bars or stackedbars plot.)
CalcGridSettings()This function was removed at PHPlot-6.0.0. It applied the defaults to the X and Y grid flags. PHPlot now usesGetGridSetting instead.
CalcMargins($maximize)Calculates the size of the four margins around the plot area: x_left_margin, x_right_margin, y_top_margin, andy_bot_margin. It does this by trying to determine how much space is needed for titles, labels, and tick marks.Starting with PHPlot-5.0.5, this is only called by DrawGraph, and it also calculates position offsets for titles andlabels. It is called even in case of a user-supplied plot area (SetPlotAreaPixels or SetMarginsPixels was used).If the $maximize argument is true, then the plot area does not leave room for X or Y axis, labels, or titles; thisis used for pie charts.
Through PHPlot-5.0.6, all 4 margins are either user-defined or all 4 are automatically calculated. Starting withPHPlot-5.0.7, the 4 margins can be independently set or defaulted to automatic. CalcMargins calculates valuesfor all 4 margins, but only saves those that have not been set using either SetMarginsPixels or SetPlotAreaPixels.Note that other than the overall plot title, elements are drawn relative to the plot area, which is calculated basedon the actual margins. If the top margin is increased, for example, the plot title stays at the top of the image, buttop tick marks and labels move down against the graph.

PHPlot Class Internal Functions
424
CalcMaxDataLabelSize($which = 'x')Calculates the size of the biggest X or Y data label. For 'x' it returns the height along the Y axis of the tallestdata label. For 'y' it returns the width along the sides of the widest data label. This is used to allocate space formargins. This was added to PHPlot-5.0.5. The argument supporting Y label width was added in PHPlot-5.1.2.Called by CalcMargins.
CalcMaxTickLabelSize($which)Calculates the size of the biggest tick label. The $which argument is 'x' or 'y' to indicate which labels to work with.For 'x', it returns the height along the Y axis; for 'y' it returns the width along the X axis. This is used to allocatespace for margins. This was added to PHPlot-5.0.5. Calls CalcTicks to determine the tick value parameters. Calledby CalcMargins.
CalcPlotAreaPixels()Calculates the pixel coordinates of the plot area. This was added to PHPlot-5.0.5 by moving the parts ofthe calculations out of SetPlotAreaPixels and SetMarginsPixels. Those two functions now simply record theirarguments, and make no attempt to calculate any parameters. Called by DrawGraph, after CalcMargins is usedto calculate margins.
CalcPlotAreaWorld()Calculates the world coordinate limits of the plot area. This was added to PHPlot-5.0.5 by moving the calculationsout of SetPlotAreaWorld. Starting with PHPlot-6.0.0, it just calls CalcPlotRange twice, once for X and once forY. Called by DrawGraph, after FindDataLimits is used to examine the data array values.
CalcPlotRange($which)Calculates the plot range and tick increment. $which is 'x' or 'y', to calculate values for the X or Y axis. Specifiedvalues (e.g. with SetPlotAreaWorld or SetXTickIncrement) are used if set. Otherwise, values are calculatedheuristically. Returns an array of 3 calculated values: tick_increment, plot_min, and plot_max. This was added inPHPlot-6.0.0. Calls CalcStep if necessary to calculate the tick increment. (If either the tick increment or numberof ticks has been set, then CalcPlotRange uses those instead of calling CalcStep). Called by CalcPlotAreaWorld,once for X and once for Y.
CalcRangeInit(&$plot_limit, $implied, $data_limit)Calculates the initial values for the plot range ends. $plot_limit is one end (min or max) of a plot range. It is passedas a reference because it might be unset. Unset, NULL, or an empty string means this end of the range has notbeen set and needs to be calculated. $implied is true when the data type does not specify the value (for example,the X value in text-data data type). $data_limit is the actual data limit (min or max) at this end of the range; givenno other information this is the initial guess for the plot range limit. Returns an array of 2 elements: the initialvalue for the plot range limit, and a flag indicating if additional adjustment of that value is to be done.
This was added in PHPlot-6.0.0. Called by CalcPlotRange 4 times, once for each end of the X and Y ranges.
CalcStep($which, $range)Calculates an appropriate tick increment. $which is 'x' or 'y', and selects configuration variables for that axis.$range is the plot area range (max - min). Returns the calculated tick increment.
This function is not called if the user has set a tick increment (SetXTickIncrement, SetYTickIncrement) or thenumber of tick marks (SetNumXTicks, SetNumYTicks). This function calls either CalcStep125, CalcStepBinary,or CalcStepDatetime to calculate an appropriate value, depending on the tick increment mode. This was addedin PHPlot-6.0.0. Called by CalcPlotRange.
CalcStep125($range, $min_ticks)Calculates an appropriate tick increment in 'decimal' mode. This is the default mode. $range is the plot area range(max - min). $min_ticks is the minimum number of tick intervals to produce. Returns the calculated tick increment.The algorithm produces the largest tick increment that is a power of 10 times 1, 2, or 5, and divides the plot arearange $range into no fewer than $min_ticks intervals. This was added in PHPlot-6.0.0. Called by CalcStep.

PHPlot Class Internal Functions
425
CalcStepBinary($range, $min_ticks)Calculates an appropriate tick increment in 'binary' (power of 2) mode. $range is the plot area range (max -min). $min_ticks is the minimum number of tick intervals to produce. Returns the calculated tick increment. Thealgorithm produces the largest tick increment that is a power of 2 and divides the plot area range $range into nofewer than $min_ticks intervals. This was added in PHPlot-6.0.0. Called by CalcStep.
CalcStepDatetime($range, $min_ticks)Calculates an appropriate tick increment in 'date' mode. This is for when the values along the axis represent date/time values. $range is the plot area range (max - min), in seconds. $min_ticks is the minimum number of tickintervals to produce. Returns the calculated tick increment. The function contains a list of acceptable intervalsbetween 1 second and 1 week, and returns one of those if possible - the largest value that divides the plot arearange $range into no fewer than $min_ticks intervals. If the range is too large (would produce too many tickswith an increment of 1 week), the function falls back to using CalcStep125 with units of 1 day. This was addedin PHPlot-6.0.0. Called by CalcStep.
CalcTicks($which)Gets the tick parameters. $which is 'x' or 'y'. Returns an array of 3 values: start, end, and interval. This was addedto PHPlot-5.0.5, although still using the method of just dividing the interval by 10 if there is no user-suppliedinterval or tick count. Starting with PHPlot-5.4.0, it also accounts for a tick anchor value, by shifting the startvalue as needed. Starting in PHPlot-6.0.0, it no longer calculates the tick increment, but simply uses the valuescalculated by CalcPlotRange. Called by CalcMaxTickLabelSize, DrawYTicks, and DrawXTicks.
CalcTranslation()Calculates the parameters for transforming world to pixel coordinates. This function calculates the scale (xscale,yscale) and origin (plot_origin_x, plot_origin_y) for X and Y translations, which are used by the xtr() and ytr()functions. Starting with PHPlot-5.0.5, this is only called by DrawGraph, as nothing else uses the parameters untilthe graph is ready to be drawn.
CheckDataArray()Checks that there is a valid data array for the plot, and calculates values that depend on the data type. Called veryearly by DrawGraph. This was added in PHPlot-5.1.3, moving the checking out of DrawGraph and adding thedata_columns calculation.
CheckDataType($valid_types)Used to validate the data_type for a plot_type. This works like a specialized version of CheckOption. $valid_typescontains the valid data type(s) for the current plot_type, separated by a comma and space if more than oneis supported. If the current data_type is in the list, returns TRUE, else produces an error. This was added inPHPlot-5.1.2 to unify the way the plot drawing functions check the data type.
CheckDataValueLabels($label_control, &$dvl)Checks to see if data value labels should be drawn, based on $label_control (which is either $this->y_data_label_pos for vertical plots, or $this->x_data_label_pos for horizontal plots). ReturnsFALSE if the labels are off, else returns TRUE and sets 4 variables in the $dvl array. This array is used byDrawDataValueLabel to position the label. The array contains these keys: x_offset, y_offset : device coordinate(pixel) offsets for the label; h_align, v_align : text alignment. Called by plot type drawing functions such asDrawDots which do data value labels, other than bars and stackedbars. This was added in PHPlot-5.3.0. ThroughPHPlot-5.7.0, four separate reference arguments were used for the return values, instead of an array.
CheckLabels()Fixes up the data and tick label position and angle. This applies defaults to data label and tick label positions butavoids having them overlap unless the user deliberately positioned them that way. Also sets the default angle for Xdata labels. This is for compatibility with PHPlot-5.0.7 and earlier, when there was only one control for both typesof labels. Called by DrawGraph before calculating margins with CalcMargins. This was added in PHPlot-5.1.0.Before PHPlot-6.0.0, it also applied tick label format settings as defaults for data label formatting. Starting withPHPlot-6.0.0, this is now handled in FormatLabel instead.

PHPlot Class Internal Functions
426
CheckLabelsAllEmpty()Returns TRUE if all of the labels in the data array are empty strings. This is used by CheckLabels to determinewhether tick or axis data labels should default on if both are left off. This was added in PHPlot-5.1.2.
CheckOption($which_opt, $which_acc, $which_func)Checks the validity of an option passed to a PHPlot member function. $which_opt is the string to check, and$which_acc is a string of acceptable choices (with a comma and then a space between choices). If the stringto check is not found in the string of acceptable choices, a fatal error will be reported using PrintError. Theerror message will include $which_func which should be the name of the calling function (using the PHP__FUNCTION__ magic constant). Note that this is used to catch programming errors, not run-time or user errors.If the string to check is acceptable, it is returned down-cased and trimmed of leading and trailing spaces. Note:At PHPlot-5.0.5, this function was changed to require exactly ', ' (comma space) between acceptable choices, andreject empty strings for $which_opt and disallow partial matches.
CheckOptionArray($opt, $acc, $func)Checks the validity of an option argument passed to a PHPlot member function that can accept its argument aseither a string or an array of strings. $opt is the string or array to check, and $acc is a string of acceptable choices(with a comma and then a space between choices). If the $opt argument is supplied as a string, it is first convertedto an array with one element. Then the elements of the array are each checked for validity. If any element ofthe array of strings to check is not found in the string of acceptable choices, a fatal error will be reported usingPrintError. The error message will include $func which should be the name of the calling function (using thePHP __FUNCTION__ magic constant). Note that this is used to catch programming errors, not run-time or usererrors. If all of the array elements to check are acceptable, the array is returned with each element down-casedand trimmed of leading and trailing spaces. Note that an array is always returned, even if the opt argument is astring. This was added in PHPlot-5.1.2.
CheckPieLabels()Sets up the default pie chart label type and format. The default is percentage labels formatted as 'data' (fixed-point).The default cannot be statically defined, for compatibility with previous releases which used the Y label precision(if set), else 1 digit if SetPrecisionY was never called. Called by DrawPieChart. This was added in PHPlot-5.6.0.
CheckPlotRange($which, &$plot_min, &$plot_max, $adjust_min, $adjust_max)Ensures that the X or Y plot range is positive. This is necessary because the plot range and tick incrementcalculations, as well as the overall plotting functions, cannot handle zero or negative ranges. A bad range canhappen as a result of 'flat' or missing data (all Y values the same, for example), or if SetPlotAreaWorld is used toset one end of the data range, and the actual data is on the wrong side of that limit. (SetPlotAreaWorld itselfdefends against setting both ends of a range such that min >= max). PHPlot will never adjust user-set plot limits,but it will adjust its own calculated limits to force a positive range (even if the resulting plot may not be useful).
$which is 'x' or 'y' (this is only used for error reporting). $plot_min and $plot_max are the range limits. These arepassed by reference and may be adjusted by the function. $adjust_min and $adjust_max are flags indicating if thecorresponding $plot_min and $plot_max values were user-specified (False) or calculated (True). A flag value ofTrue means CheckPlotRange may adjust the corresponding plot range value to prevent a non-positive range.Called by CalcPlotRange. This was added in PHPlot-6.0.0.
CheckPointParams()Adjusts the point_shapes and point_sizes arrays so they have the same size, and stores the size in a class variable.This handles processing deferred from SetPointShapes and SetPointSizes until graph drawing time. It it is calledby DrawDots before using point shapes. This was added in PHPlot-5.1.0.
DecodeDataType()Decodes the data type, and sets several member variables that other functions can use to understand how to processthe data array. The variables it sets all have names starting with "datatype_" (refer to Chapter 10, PHPlot ClassMember Variables). This is called by DrawGraph. It was added in PHPlot-5.1.2 (where it returned an array of 4flags, and was called by several functions that needed to know the structure of the data array.) In PHPlot-5.1.3,
PHPlot Class Internal Functions
427
it was changed to set member variables instead. It is now called just once, and the other functions reference thevariables as needed. Starting with PHPlot-6.1.0, it uses the $datatypes array to set the flags based on the data type,so it no longer needs to 'know' the actual data type names.
DisableCaching()Sends HTTP headers to the browser to disable client-side caching. This is called by PrintImage ifSetBrowserCache was used to disable caching. It is also used by StartStream. This was added in PHPlot-5.8.0by moving code out of PrintImage.
DoCallback($reason, ...)Call a callback (hook) function. $reason is the name given to the callback, for example draw_titles (meaning:call after drawing titles). The reasons are array indexes in the $callbacks class variable. Following that are zeroor more arguments to pass to the callback, after the image resource and passthrough arguments. DoCallbackdoes nothing if there is no callback registered for the given reason, otherwise it calls the callback function. SeeSection 4.4, “Callbacks” for more information on callbacks.
Starting with PHPlot-5.1.3, DoCallback returns the value returned by the callback function, if any. If there isno callback defined for the given reason, NULL is returned. So it is possible to define a callback that returns ameaningful value (such as True/False), and still distinguish the case of where no callback has been set. However,it is often simpler to test first to see if a callback has been set, using GetCallback, before using DoCallback.
DrawArea($do_stacked = False)Draws an area plot, or a stacked area plot (if the optional argument is True). Called by DrawGraph when the plottype is area or stackedarea. Stacked area plots were added in PHPlot-5.1.1; through PHPlot-5.1.0 this function didnot have a parameter and was used only for area plots.
DrawBackground($overwrite = False)Draws the image background, either an image file or solid fill or nothing. Called by DrawGraph and DrawMessage.The optional argument $overwrite (added in PHPlot-5.7.0 for DrawMessage) forces the background to be drawn,even if it was already drawn.
DrawBar($row, $column, $x1, $y1, $x2, $y2, $data_color, $shade_color, $border_color, $shade_top = TRUE,$shade_side = TRUE)
Draws a single bar (or bar segment), with either shading or border. The $row and $column indicate which datapoint is being plotted. Four corner coordinates and 3 color indexes are provided. The first color $data_color isthe bar fill color, the second color $shade_color is the shading color, and the third color $border_color is usedfor bar borders. (These three come from GetBarColors.) The last two arguments are flags used to suppress thetop or side shading for certain cases of stacked bar segments. Called by DrawBars and DrawHorizBars to draweach bar. Called by DrawStackedBars and DrawHorizStackedBars to draw each bar segment. This was added inPHPlot-5.2.0, moving common code from those 4 functions.
Starting with PHPlot-5.7.0, the arguments were changed as shown to accommodate a new callback which providesaccess to drawing coordinates. In previous releases, the usage was DrawBar($x1, $y1, $x2, $y2,$data_color, $alt_color, $shade_top = TRUE, $shade_side = TRUE).
In PHPlot-6.0.0, a single $alt_color argument was split into separate $shade_color and $border_color arguments.This corresponds to the change in GetBarColors, and allows for bar charts with independent control over shadingand borders.
DrawBars()Draws a bar chart plot. Called by DrawGraph when the plot type is bars. If the data type indicates a horizontalbar chart, calls DrawHorizBars instead.
DrawBoxes()Draws a box plot. Called by DrawGraph when the plot type is boxes. This was added in PHPlot-6.1.0.
PHPlot Class Internal Functions
428
DrawBubbles()Draws a bubbles plot. Called by DrawGraph when the plot type is bubbles. This was added in PHPlot-5.5.0.
DrawDataLabel($which_font, $which_angle, $x_world, $y_world, $which_color, $which_text, $which_halign ='center', $which_valign = 'top', $x_adjustment=0, $y_adjustment=0)
This function was removed in PHPlot-5.1.3 and replaced by DrawDataValueLabel.
DrawDataValueLabel($x_or_y, $row, $column, $x_world, $y_world, $text, $dvl)Draws a data value label (previously called "Y data label"). These are the above-bar or in-bar labels on bar andstackedbar charts, and the labels near data points available with some other plot types.
$x_or_y is 'x' or 'y' to select the font, angle, and formatting type. The $row and $column are passed to FormatLabelfor possible use with a custom formatting function. The label is drawn at world coordinates ($x_world, $y_world)after device coordinate offset is applied (see below). $text is the label text, which gets formatted with FormatLabelbefore drawing.
The $dvl argument is an array with up to 6 variables containing positioning and related information. In $dvl,x_offset and y_offset are pixel offsets for the label; h_align and v_align specify the text alignment relative to theplotting point (see DrawText); min_width and max_width used to prevent labels from overlapping their allocatedspace. If either min_width or max_width is supplied in the $dvl array, the text is sized before drawing, and if itwon't fit in the space the label is not drawn. This is used to suppress labels that are too wide to be drawn insidetheir bars, for example. The defaults for the X and Y offsets are 0, and the default alignment is (center, center).(The $dvl argument is required, but none of its elements is required.)
This function is called by all plot drawing functions which support data value labels, if those labels are enabled.
This function was added in PHPlot-5.1.3 and replaced DrawDataLabel. Through PHPlot-5.7.0, 6 separatearguments were used instead of the $dvl array, and the $row and $column arguments were not present.
DrawDot($row, $column, $x_world, $y_world, $color)Draws a single marker point ('dot') at the given X and Y world coordinates, using the given color. The $rowand $column indicate which data point is being plotted. The $column parameter also selects the marker shapeand size, using the arrays set up with SetPointSizes() and SetPointShapes(). Called by DrawDots to plot pointmarkers. Starting with PHPlot-5.4.0, DrawDot() simply converts the coordinates to device coordinates and thencalls DrawShape. It has no knowledge of the available dot shapes.
Starting with PHPlot-5.7.0, the arguments were changed as shown to accommodate a new callback which providesaccess to drawing coordinates. In previous releases, the usage was DrawDot($x_world, $y_world,$record, $color). The old $record argument is equivalent to the new $column argument.
DrawDots($paired = False)Draws a points plot, or the points for a linepoints plot, including error plots. Called by DrawGraph when the plottype is points, and by DrawLinePoints for the points portion of a linepoints plot. $paired is true for linepointsplots. When $paired is true, DrawDots() draws the points and error bars, and DrawLines draws the lines and datalabels. (The $paired argument was added in PHPlot-5.1.3.) Starting with PHPlot-6.0.0, DrawDots() also handleserror plots, and horizontal points and linepoints plots.
DrawDotsError($paired = False)This function was removed in PHPlot-6.0.0 and merged into DrawDots.
DrawError($error_message, [$where_x], [$where_y])Starting with PHPlot-5.0.5, this function is an alias for PrintError and is retained for compatibility. The $where_xand $where_arguments are now ignored. (Previously they positioned the error message on the image, but werenever used.) Starting with PHPlot-5.7.0, this function is considered deprecated.
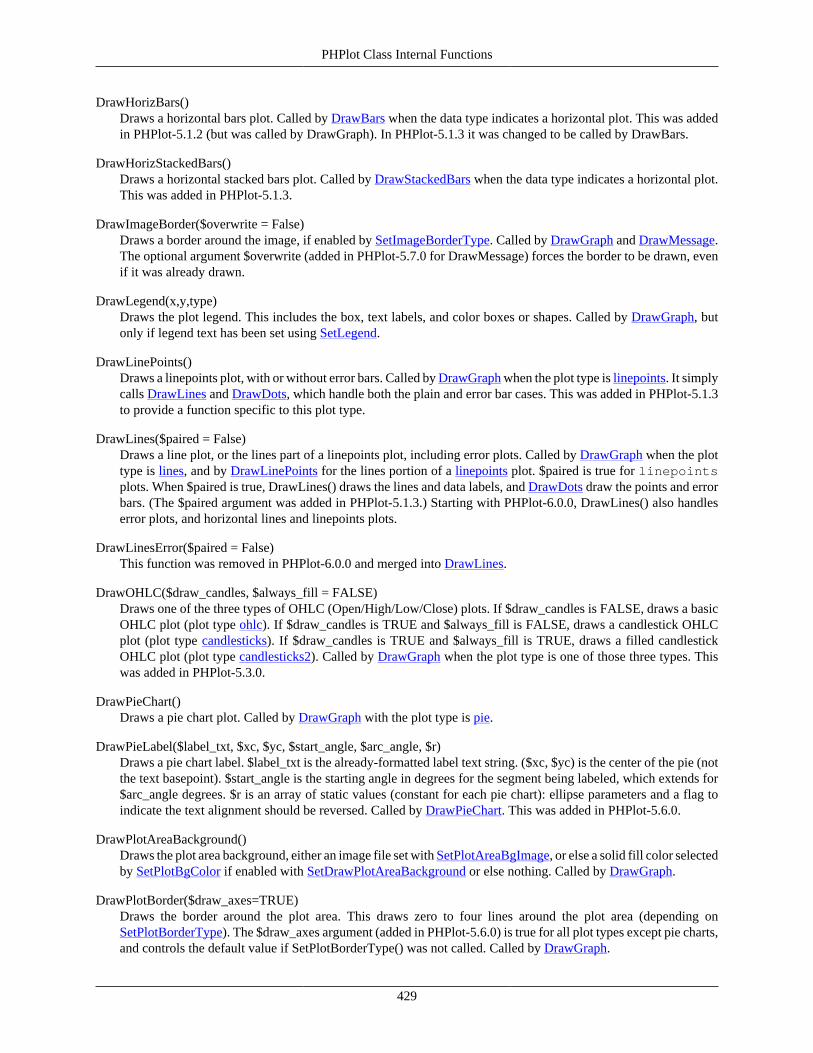
PHPlot Class Internal Functions
429
DrawHorizBars()Draws a horizontal bars plot. Called by DrawBars when the data type indicates a horizontal plot. This was addedin PHPlot-5.1.2 (but was called by DrawGraph). In PHPlot-5.1.3 it was changed to be called by DrawBars.
DrawHorizStackedBars()Draws a horizontal stacked bars plot. Called by DrawStackedBars when the data type indicates a horizontal plot.This was added in PHPlot-5.1.3.
DrawImageBorder($overwrite = False)Draws a border around the image, if enabled by SetImageBorderType. Called by DrawGraph and DrawMessage.The optional argument $overwrite (added in PHPlot-5.7.0 for DrawMessage) forces the border to be drawn, evenif it was already drawn.
DrawLegend(x,y,type)Draws the plot legend. This includes the box, text labels, and color boxes or shapes. Called by DrawGraph, butonly if legend text has been set using SetLegend.
DrawLinePoints()Draws a linepoints plot, with or without error bars. Called by DrawGraph when the plot type is linepoints. It simplycalls DrawLines and DrawDots, which handle both the plain and error bar cases. This was added in PHPlot-5.1.3to provide a function specific to this plot type.
DrawLines($paired = False)Draws a line plot, or the lines part of a linepoints plot, including error plots. Called by DrawGraph when the plottype is lines, and by DrawLinePoints for the lines portion of a linepoints plot. $paired is true for linepointsplots. When $paired is true, DrawLines() draws the lines and data labels, and DrawDots draw the points and errorbars. (The $paired argument was added in PHPlot-5.1.3.) Starting with PHPlot-6.0.0, DrawLines() also handleserror plots, and horizontal lines and linepoints plots.
DrawLinesError($paired = False)This function was removed in PHPlot-6.0.0 and merged into DrawLines.
DrawOHLC($draw_candles, $always_fill = FALSE)Draws one of the three types of OHLC (Open/High/Low/Close) plots. If $draw_candles is FALSE, draws a basicOHLC plot (plot type ohlc). If $draw_candles is TRUE and $always_fill is FALSE, draws a candlestick OHLCplot (plot type candlesticks). If $draw_candles is TRUE and $always_fill is TRUE, draws a filled candlestickOHLC plot (plot type candlesticks2). Called by DrawGraph when the plot type is one of those three types. Thiswas added in PHPlot-5.3.0.
DrawPieChart()Draws a pie chart plot. Called by DrawGraph with the plot type is pie.
DrawPieLabel($label_txt, $xc, $yc, $start_angle, $arc_angle, $r)Draws a pie chart label. $label_txt is the already-formatted label text string. ($xc, $yc) is the center of the pie (notthe text basepoint). $start_angle is the starting angle in degrees for the segment being labeled, which extends for$arc_angle degrees. $r is an array of static values (constant for each pie chart): ellipse parameters and a flag toindicate the text alignment should be reversed. Called by DrawPieChart. This was added in PHPlot-5.6.0.
DrawPlotAreaBackground()Draws the plot area background, either an image file set with SetPlotAreaBgImage, or else a solid fill color selectedby SetPlotBgColor if enabled with SetDrawPlotAreaBackground or else nothing. Called by DrawGraph.
DrawPlotBorder($draw_axes=TRUE)Draws the border around the plot area. This draws zero to four lines around the plot area (depending onSetPlotBorderType). The $draw_axes argument (added in PHPlot-5.6.0) is true for all plot types except pie charts,and controls the default value if SetPlotBorderType() was not called. Called by DrawGraph.
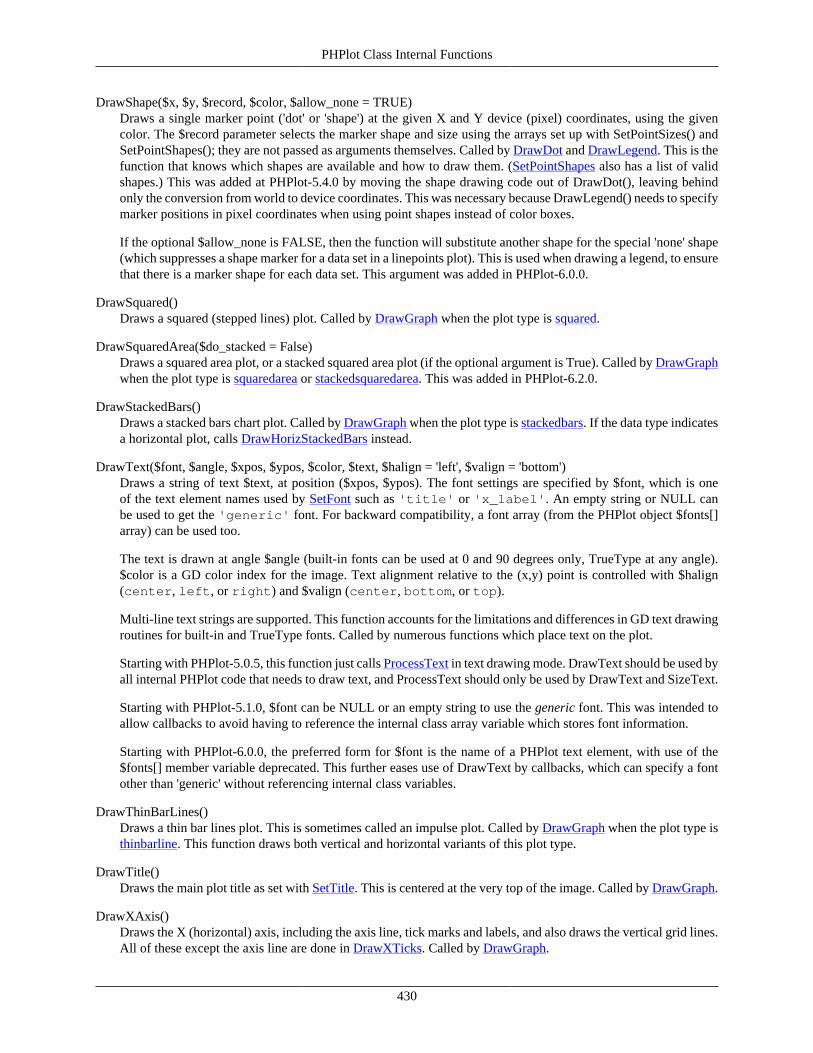
PHPlot Class Internal Functions
430
DrawShape($x, $y, $record, $color, $allow_none = TRUE)Draws a single marker point ('dot' or 'shape') at the given X and Y device (pixel) coordinates, using the givencolor. The $record parameter selects the marker shape and size using the arrays set up with SetPointSizes() andSetPointShapes(); they are not passed as arguments themselves. Called by DrawDot and DrawLegend. This is thefunction that knows which shapes are available and how to draw them. (SetPointShapes also has a list of validshapes.) This was added at PHPlot-5.4.0 by moving the shape drawing code out of DrawDot(), leaving behindonly the conversion from world to device coordinates. This was necessary because DrawLegend() needs to specifymarker positions in pixel coordinates when using point shapes instead of color boxes.
If the optional $allow_none is FALSE, then the function will substitute another shape for the special 'none' shape(which suppresses a shape marker for a data set in a linepoints plot). This is used when drawing a legend, to ensurethat there is a marker shape for each data set. This argument was added in PHPlot-6.0.0.
DrawSquared()Draws a squared (stepped lines) plot. Called by DrawGraph when the plot type is squared.
DrawSquaredArea($do_stacked = False)Draws a squared area plot, or a stacked squared area plot (if the optional argument is True). Called by DrawGraphwhen the plot type is squaredarea or stackedsquaredarea. This was added in PHPlot-6.2.0.
DrawStackedBars()Draws a stacked bars chart plot. Called by DrawGraph when the plot type is stackedbars. If the data type indicatesa horizontal plot, calls DrawHorizStackedBars instead.
DrawText($font, $angle, $xpos, $ypos, $color, $text, $halign = 'left', $valign = 'bottom')Draws a string of text $text, at position ($xpos, $ypos). The font settings are specified by $font, which is oneof the text element names used by SetFont such as 'title' or 'x_label'. An empty string or NULL canbe used to get the 'generic' font. For backward compatibility, a font array (from the PHPlot object $fonts[]array) can be used too.
The text is drawn at angle $angle (built-in fonts can be used at 0 and 90 degrees only, TrueType at any angle).$color is a GD color index for the image. Text alignment relative to the (x,y) point is controlled with $halign(center, left, or right) and $valign (center, bottom, or top).
Multi-line text strings are supported. This function accounts for the limitations and differences in GD text drawingroutines for built-in and TrueType fonts. Called by numerous functions which place text on the plot.
Starting with PHPlot-5.0.5, this function just calls ProcessText in text drawing mode. DrawText should be used byall internal PHPlot code that needs to draw text, and ProcessText should only be used by DrawText and SizeText.
Starting with PHPlot-5.1.0, $font can be NULL or an empty string to use the generic font. This was intended toallow callbacks to avoid having to reference the internal class array variable which stores font information.
Starting with PHPlot-6.0.0, the preferred form for $font is the name of a PHPlot text element, with use of the$fonts[] member variable deprecated. This further eases use of DrawText by callbacks, which can specify a fontother than 'generic' without referencing internal class variables.
DrawThinBarLines()Draws a thin bar lines plot. This is sometimes called an impulse plot. Called by DrawGraph when the plot type isthinbarline. This function draws both vertical and horizontal variants of this plot type.
DrawTitle()Draws the main plot title as set with SetTitle. This is centered at the very top of the image. Called by DrawGraph.
DrawXAxis()Draws the X (horizontal) axis, including the axis line, tick marks and labels, and also draws the vertical grid lines.All of these except the axis line are done in DrawXTicks. Called by DrawGraph.

PHPlot Class Internal Functions
431
DrawXDataLabel($xlab, $xpos, $row, $do_lines=FALSE)Draws an axis data label for an X value. The labels are above or below the plot area or both, depending on thevalue set with SetXDataLabelPos. The $row value indicates the row index in the data array for this label; it is usedto position the data label line, and for custom label formatting. If $do_lines is true, this calls DrawXDataLine todraw a line from the label to the point, if enabled and supported by the plot type.
This function is used by vertical plots. It is called by plot drawing routines for all plot types except pie: DrawArea,DrawBars, DrawDots, DrawThinBarLines, DrawLines, DrawSquared, and DrawStackedBars.
DrawXDataLine($xpos, $row)Draws X data label lines, which are vertical lines from the bottom or top of the plot to the data points. This isenabled with SetDrawXDataLabelLines. The lines are drawn from the position (above, below, or both) of the Xaxis data labels, which are set with SetXDataLabelPos. Called by DrawXDataLabel.
DrawXErrorBars($x, $y $error_plus, $error_minus, $color)Draws an error bar set for the point at world coordinates ($x, $y). $error_plus and $error_minus are the X erroramounts (in world coordinates). Both are non-negative values. Called by DrawDots and DrawLines when thedata type indicates a horizontal error plot. This was added in PHPlot-6.1.0 when horizontal error plots wereimplemented.
DrawXTick($x, $x_pixels)Draws a single X value tick mark and its label. These can appear on the bottom of the graph, top of the graph,along the X axis (even if it is in the middle somewhere), on both sides, or nowhere, as set with SetXTickPosand SetXTickLabelPos. $x is the X value of the tick, and $x_pixels is its device coordinate value. Called byDrawXTicks. This was added at PHPlot-5.0.5 by splitting the code out of DrawXTicks, for symmetry withDrawYTicks. Through PHPlot-5.7.0, $x was passed to this function already formatted with FormatLabel. Startingwith PHPlot-5.8.0, the actual tick value is passed, so DrawXTick can decide whether or not to format it.
DrawXTicks()Draws the vertical grid lines, the tick marks, and tick labels. Calls CalcTicks to calculate the tick parameters. CallsDrawXTick to draw each tick mark and its label. Called by DrawXAxis.
DrawXTitle()Draws the X axis title. There can be zero, one, or two of them depending on the position parameter specified inSetXTitle. Calls DrawText to actually draw the title(s). Called by DrawGraph.
DrawYAxis()Draws the Y (vertical) axis, including the axis line, tick marks and labels, and also draws the horizontal grid lines.All of these except the axis line are done in DrawYTicks. Called by DrawGraph.
DrawYDataLabel($ylab, $ypos, $row, $do_lines=FALSE)Draws an axis data label for a Y value. The labels are along the Y axis or side of the plot, or both, depending onthe value set with SetYDataLabelPos. The $row value indicates the row index in the data array for this label; it isused for custom label formatting. If $do_lines is true, this calls DrawYDataLine to draw a line from the label tothe point, if enabled and supported by the plot type. This function is used by horizontal plots, and was added inPHPlot-5.1.2. Called by horizontal plot drawing functions such as DrawHorizBars. The $do_lines argument wasadded in PHPlot-6.0.0 when horizontal plots supporting data label lines were first available.
DrawYDataLine($ypos, $row)Draws Y data label lines, which are horizontal lines from the left or right side of the plot to the data points. Thisis enabled with SetDrawYDataLabelLines, and is only valid with horizontal plots which support Y data labellines. The lines are drawn from the position (left, right, or both) of the Y axis data labels, which are set withSetYDataLabelPos. Called by DrawYDataLabel. This was added in PHPlot-6.0.0.
DrawYErrorBar($x_world, $y_world, $error_height, $color)This function was removed in PHPlot-6.1.0 and replaced with DrawYErrorBars.
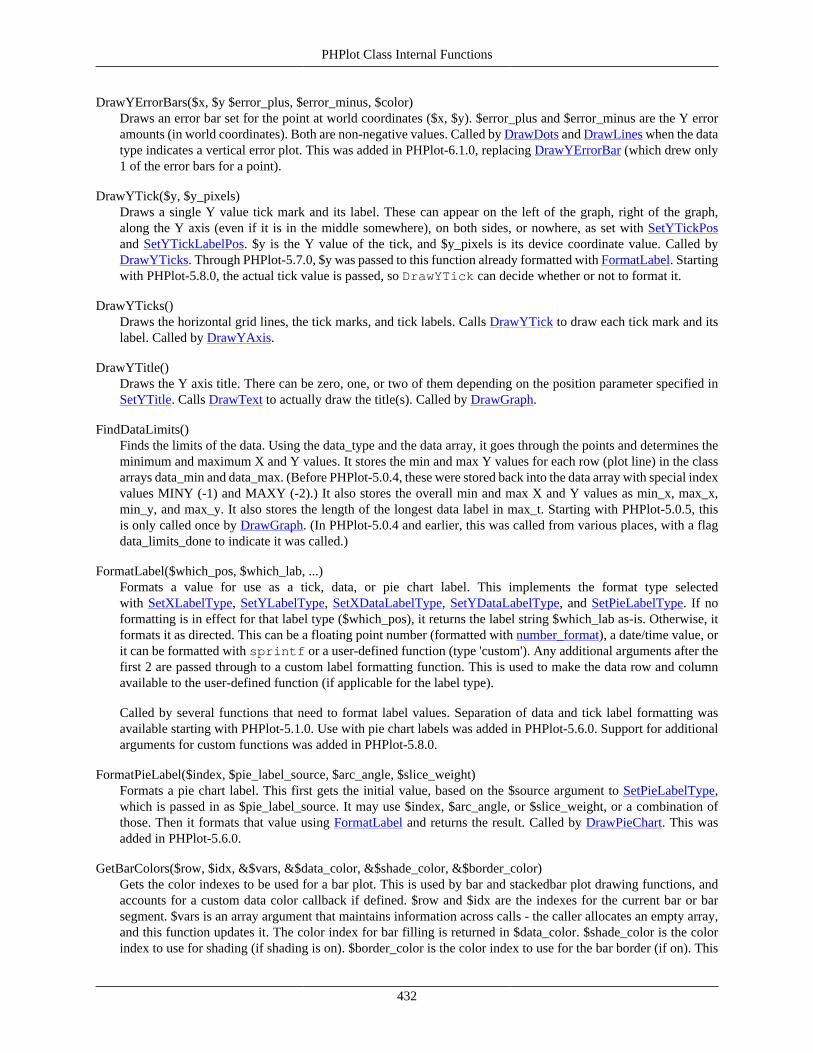
PHPlot Class Internal Functions
432
DrawYErrorBars($x, $y $error_plus, $error_minus, $color)Draws an error bar set for the point at world coordinates ($x, $y). $error_plus and $error_minus are the Y erroramounts (in world coordinates). Both are non-negative values. Called by DrawDots and DrawLines when the datatype indicates a vertical error plot. This was added in PHPlot-6.1.0, replacing DrawYErrorBar (which drew only1 of the error bars for a point).
DrawYTick($y, $y_pixels)Draws a single Y value tick mark and its label. These can appear on the left of the graph, right of the graph,along the Y axis (even if it is in the middle somewhere), on both sides, or nowhere, as set with SetYTickPosand SetYTickLabelPos. $y is the Y value of the tick, and $y_pixels is its device coordinate value. Called byDrawYTicks. Through PHPlot-5.7.0, $y was passed to this function already formatted with FormatLabel. Startingwith PHPlot-5.8.0, the actual tick value is passed, so DrawYTick can decide whether or not to format it.
DrawYTicks()Draws the horizontal grid lines, the tick marks, and tick labels. Calls DrawYTick to draw each tick mark and itslabel. Called by DrawYAxis.
DrawYTitle()Draws the Y axis title. There can be zero, one, or two of them depending on the position parameter specified inSetYTitle. Calls DrawText to actually draw the title(s). Called by DrawGraph.
FindDataLimits()Finds the limits of the data. Using the data_type and the data array, it goes through the points and determines theminimum and maximum X and Y values. It stores the min and max Y values for each row (plot line) in the classarrays data_min and data_max. (Before PHPlot-5.0.4, these were stored back into the data array with special indexvalues MINY (-1) and MAXY (-2).) It also stores the overall min and max X and Y values as min_x, max_x,min_y, and max_y. It also stores the length of the longest data label in max_t. Starting with PHPlot-5.0.5, thisis only called once by DrawGraph. (In PHPlot-5.0.4 and earlier, this was called from various places, with a flagdata_limits_done to indicate it was called.)
FormatLabel($which_pos, $which_lab, ...)Formats a value for use as a tick, data, or pie chart label. This implements the format type selectedwith SetXLabelType, SetYLabelType, SetXDataLabelType, SetYDataLabelType, and SetPieLabelType. If noformatting is in effect for that label type ($which_pos), it returns the label string $which_lab as-is. Otherwise, itformats it as directed. This can be a floating point number (formatted with number_format), a date/time value, orit can be formatted with sprintf or a user-defined function (type 'custom'). Any additional arguments after thefirst 2 are passed through to a custom label formatting function. This is used to make the data row and columnavailable to the user-defined function (if applicable for the label type).
Called by several functions that need to format label values. Separation of data and tick label formatting wasavailable starting with PHPlot-5.1.0. Use with pie chart labels was added in PHPlot-5.6.0. Support for additionalarguments for custom functions was added in PHPlot-5.8.0.
FormatPieLabel($index, $pie_label_source, $arc_angle, $slice_weight)Formats a pie chart label. This first gets the initial value, based on the $source argument to SetPieLabelType,which is passed in as $pie_label_source. It may use $index, $arc_angle, or $slice_weight, or a combination ofthose. Then it formats that value using FormatLabel and returns the result. Called by DrawPieChart. This wasadded in PHPlot-5.6.0.
GetBarColors($row, $idx, &$vars, &$data_color, &$shade_color, &$border_color)Gets the color indexes to be used for a bar plot. This is used by bar and stackedbar plot drawing functions, andaccounts for a custom data color callback if defined. $row and $idx are the indexes for the current bar or barsegment. $vars is an array argument that maintains information across calls - the caller allocates an empty array,and this function updates it. The color index for bar filling is returned in $data_color. $shade_color is the colorindex to use for shading (if shading is on). $border_color is the color index to use for the bar border (if on). This

PHPlot Class Internal Functions
433
was added in PHPlot-5.2.0, moving common code into a function. In PHPlot-6.0.0, a single $alt_color argumentwas split into separate $shade_color and $border_color arguments.
GetColorIndex(&$color, $default_color_index=0)Allocate a GD color index for a color given as a 4 component array (R,G,B,A) $color. Returns a color index to beused in GD drawing functions. The color returned is the exact color requested if it already exists in the image, orif can be allocated. For palette images, if the color map is full, no new colors can be allocated, and this functionwill return an index to the closest existing color. For truecolor images, this function always returns an index forthe exact requested color. If $color is empty or unset, returns $default_color_index instead, without allocating anew color. This was added in PHPlot-5.2.0, replacing the second half of SetIndexColor. The $default_color_indexargument was added in PHPlot-5.7.0, and the $color argument was changed to a reference (so an unset variablecan be passed without an error).
GetColorIndexArray($color_array, $max_colors)Allocates GD color indexes for each color in the array $color_array, which are given as 4 component arrays(R,G,B,A). Up to $max_colors colors will be allocated. (This is used to limit the number of allocated data colorsto the number of data sets in the plot, for example.) GetColorIndex is used to allocate each color. Returns an arrayof GD color indexes to be used in GD drawing functions. This was added in PHPlot-5.3.1.
GetDarkColorIndex($color)Allocate a GD color index for a darker shade of a color given as a 4 component array (R,G,B,A). Returns a colorindex to be used in GD drawing functions. The method used is to subtract 48 from each red, green, and bluecomponent (without letting any go negative). The alpha component is not adjusted. The color returned is the exactcolor requested if it already exists in the image, or if can be allocated, else the closest color available. This isused for shadow colors (for example, in bar charts and pie charts). This was added in PHPlot-5.2.0, replacing thesecond half of SetIndexDarkColor.
GetDarkColorIndexArray($color_array, $max_colors)Allocates GD color indexes for a darker shade of each color in the array $color_array, which are given as 4component arrays (R,G,B,A). Up to $max_colors colors will be allocated. (This is used to limit the number ofallocated dark-shade data colors to the number of data sets in the plot, for example.) GetDarkColorIndex is usedto allocate each color. Returns an array of GD color indexes to be used in GD drawing functions. This was addedin PHPlot-5.3.1.
GetDataColor($row, $idx, &$vars, &$data_color, $extra=0)Gets the color index to be used for a data element (a point or line segment, for example). This is used by multipleplot drawing functions to get the data color, accounting for a custom data color callback if defined. $row and$idx are the indexes for the data point. $vars is an array argument that maintains information across calls - thecaller allocates an empty array, and this function updates it. The color index to use is returned in $data_color.$extra contains extra information for a data color callback. This was added in PHPlot-5.2.0, moving commoncode into a function.
GetDataErrorColors($row, $idx, &$vars, &$data_color, &$error_color, $extra=0)This is an extended version of GetDataColor which is used for error bar plots. It returns two color index values:$data_color for the data element, and $error_color for the error bar. This is used by error plot drawing functions,and accounts for a custom data color callback if defined. $row and $idx are the indexes for the data point. $vars isan array argument that maintains information across calls - the caller allocates an empty array, and this functionupdates it. $extra contains extra information for a data color callback. This was added in PHPlot-5.2.0, movingcommon code into a function.
GetDefaultTTFont()Returns the default TrueType font name. If no default font has been set using SetDefaultTTFont, the first timethis is called it will go through a list of likely sans-serif fonts, trying to find one that works. The first one thatworks, or the last one if none works, will be set as the default font. This was added in PHPlot-5.1.3, replacingthe static initialization of default font.

PHPlot Class Internal Functions
434
GetGridSetting($xy)Returns a flag indicating whether to draw the grid along the axis indicated by $xy ('x' or 'y'). This implementsthe grid default which differs for horizontal and vertical plots. This was added in PHPlot-6.0.0, replacingCalcGridSettings().
GetImage($image_filename, &$width, &$height)Reads an image file from $image_filename, stores the width and height (in pixels) in the $width and $heightreference arguments, and returns a PHP GD image resource of the image. This is used by SetInputFile and tile_img.Errors go to PrintError; there is no way for the script to recover. Possible errors include an image file type whichis unsupported by PHP GD, or a corrupt image file. Note: This was added at PHPlot-5.0.4, by moving commoncode from the two calling functions.
GetImageBorderWidth()This returns the image border width, as set with SetImageBorderWidth or as defaulted. It is used by CalcMarginsto account for image border width, and by DrawImageBorder when drawing the image border. This was addedin PHPlot-5.1.2.
GetImageType(&$mime_type, &$output_f)Given the current file type (e.g. 'png'), this sets the MIME type for the image (e.g. 'image/png') and the nameof the GD output function (e.g. 'imagepng') corresponding to that type. The results are stored in the arguments,and TRUE is returned unless an error occurs. It is used by PrintImage and EncodeImage. This was added inPHPlot-5.5.0, from code moved out of PrintImage.
GetLegendPosition($width, $height)This calculates and returns the device coordinates (as a 2 element array X,Y) of the upper left corner of the legendbox. $width and $height are the size of the legend box. It accounts for the positioning mode, reference point, basepoint, and pixel offset as set with SetLegendPosition. Called by DrawLegend. This was added in PHPlot-5.4.0.
GetLegendSizeParams()This calculates a number of parameters that determine how to draw the legend, and returns an array containingthose variables and their values. Called by GetLegendSize (which only uses the 'width' and 'height' elements), andby DrawLegend. This was added in PHPlot-5.4.0.
GetLineSpacing($font)Given a font array variable, returns the proper spacing in pixels between lines of text using that font. Thisworks for both GD and TrueType fonts. See also SetLineSpacing. Used by ProcessTextGD, ProcessTextTTF, andDrawLegend. Note: This was added at PHPlot-5.0.6, with support for mixing TTF and GD fonts.
GetRangeEndAdjust($which, &$adjust)Applies a default to $adjust, the plot range end adjustment factor. $which is 'x' or 'y'. If $adjust is already set, thefunction does nothing. Otherwise, it uses the current plot type to apply a default setting to $adjust. See the noteson the adjust_type entry in Section 10.2.5, “plots[]” for more on the per-plot-type adjustment mode. This isused by CalcPlotRange. It was added at PHPlot-6.0.0.
GetTextAlignment($sin_t, $cos_t, &$h_align, &$v_align, $reverse = FALSE)Selects the best alignment for text which is at a specific angle ($sin_t, $cos_t) from a point. The result is returnedin $h_align and $v_align, suitable for use with DrawText. The alignment is chosen from 8 possible values (left/center, center/bottom, etc.) to keep the closest edge or corner of the text box at a fixed distance from the referencepoint (typically the center of a pie chart, or a plotted point), regardless of the text string size. For example, text at0 degrees is left/center aligned, and text at 90 degrees is center/bottom aligned. If $reverse is true, the alignmentis reversed; this is used for text inside an ellipse but close to the circumference. Used by CheckDataValueLabelsand DrawPieLabel. Note: This was added at PHPlot-5.6.0 by moving code out of CheckDataValueLabels.
initialize($imagecreate_function, $width, $height, $output_file, $input_file)Initialize a newly created object. This is called from the two class constructors, PHPlot and PHPlot_truecolor.$imagecreate_function is the name of the GD function used to create an image (imagecreate or

PHPlot Class Internal Functions
435
imagecreatetruecolor). The other arguments are the same as in the class constructors, except the defaultsare already applied. This was added in PHPlot-5.6.0 by moving duplicated code from the two constructors intoa shared function.
NeedDataDarkColors()Allocates darker data colors, which are used for shading. This is called by graph drawing functions such asDrawPieChart if they need to use these colors for shading. This was added in PHPlot-5.2.0.
NeedErrorBarColors()Allocates colors used for error bars. This is called by any graph drawing functions that is going to draw error bars.This was added in PHPlot-5.2.0.
number_format($number, $decimals=0)Formats a floating point number, like PHP's number_format(), inserting a decimal separator and thousands groupsseparators. Unlike the PHP function, this uses variables in the PHPlot class to select the separators. The separatorscan be set with SetNumberFormat, or by default PHPlot will attempt to get locale-specific values. For example,1234+(56/100) will be returned as "1,234.56" if the locale is "en_US", and as "1.234,56" if the locale is "de_DE".As a fall-back, if locale information is not available, '.' is used for decimal point, and ',' for thousands separator.This fall-back is equivalent to the behavior in PHPlot 5.0rc3 and earlier. This is used by FormatLabel when theformatting type is data, and also for the pie chart labels in DrawPieChart.
pad_array(&$arr, $size)Pads an array $arr with copies of itself until it reaches the given size. If $arr is a scalar, it will first be convertedto an array with one element. Then, if $arr has fewer than $size elements, elements of $arr starting from thefirst will be appended until it reaches $size elements. This only works on zero-based sequential integer indexedarrays. Called by PadArrays, SetPointShapes, and SetPointSizes. This replaced array_pad_array at PHPlot-5.0.4,however that had an unused 3rd argument, and worked on general indexed arrays.
PadArrays()Pads the style arrays (line_widths, line_styles, data_colors, etc.) so they are all large enough to contain an entryfor each data set or plot line. This uses pad_array. Called by DrawGraph before drawing anything.
PrintError($error_message)Handles a fatal error within PHPlot. Starting with PHPlot-5.0.5 this and DrawError are identical. PrintErrorattempts to draw the error message $error_message into the image, and then output the image. This method isused because PHPlot is normally expected to output an image, and text output would not be displayed properly. (Ifno image resource was available, and the SetIsInline flag is not on, PHPlot will send a 500 Internal Server Errorheader.) PrintError uses DrawMessage to actually draw the message onto the image. After this, PrintError uses thePHP trigger_error() function to signal a user error. This is normally fatal to the script, unless caught. This will alsoresult in the error message written to the error output stream, which typically ends up in a web server error log.
(Through PHPlot-5.0.4, PrintError wrote an error message to standard output and exited.)
ProcessText($draw_it, $font_id, $angle, $x, $y, $color, $text, $halign, $valign)This function acts as a bridge, or switch, between the two functions SizeText and DrawText, which handle bothGD and TTF text, and the functions which specifically handle GD text or TTF text. The arguments to this functionare the same as DrawText except for an additional first argument $draw_it. If $draw_it is true, text is drawn. Thisis used by DrawText. If $draw_it is false, only the bounding box size of the text is calculated and returned. Thisis used by SizeText. In text sizing mode, the x, y, color, halign, and valign arguments are ignored, as they are notneeded when calculating the text bounding box size. This function is only called by SizeText and DrawText, andcalls either ProcessTextTTF or ProcessTextGD.
ProcessText examines the $font_id argument and handles the variations described under DrawText. If$font_id is an array, it is assumed to be an element of the member array $fonts[], and is passed as-is to the lowerlevel functions. If it is a string that exists as an index to $fonts[], that font array is used. In all other cases, thegeneric font is used.

PHPlot Class Internal Functions
436
ProcessTextGD($draw_it, $font, $angle, $x, $y, $color, $text, $h_factor, $v_factor)Draws GD fixed-font text, or calculates the size of GD fixed-font text. This is only called by ProcessText after itdetermines that GD text is in use. If $draw_it is true, text is drawn; if $draw_it is false, only the bounding box sizeof the text is calculated and returned as a two-element array ($width, $height). Here $width is measured along theX axis, and $height along Y, regardless of the text angle. These are the size of an orthogonal bounding box thatcontains the text block. The $font argument is a PHPlot font array, which must reference a GD font. The $angle is 0or 90 degrees, as GD text only supports those values. $x, $y are the reference point of the text $text, which is drawnin color $color. The text string can contain multiple lines, with a newline character between lines. The $h_factorand $v_factor arguments are translated from the alignment arguments supplied to DrawText or SizeText: 0, 0.5,or 1.0 If $draw_it is false, for text sizing mode, the x, y, color, h_factor and v_factor arguments are ignored.
Note: This was added at PHPlot-5.0.5. It was changed at PHPlot-5.0.6 to take a single font array argument, ratherthan 3 separate arguments for font number, width, and height.
ProcessTextTTF($draw_it, $font, $angle, $x, $y, $color, $text, $h_factor, $v_factor)Draws TTF text, or calculates the size of TTF text. This is only called by ProcessText after it determines thatTTF text is in use. If $draw_it is true, text is drawn; if $draw_it is false, only the bounding box size of the textis calculated and returned as a two-element array ($width, $height). Here $width is measured along the X axis,and $height along Y, regardless of the text angle. These are the size of an orthogonal bounding box that containsthe text block. The $font argument is a PHPlot font array, which must reference a TTF font. The text is drawnat $angle degrees; unlike GD text TTF text can be drawn at any angle. $x, $y are the reference point of the text$text, which is drawn in color $color. The text string can contain multiple lines, with a newline character betweenlines. The $h_factor and $v_factor arguments are translated from the alignment arguments supplied to DrawTextor SizeText: 0, 0.5, or 1.0 If $draw_it is false, for text sizing mode, the x, y, color, h_factor and v_factor argumentsare ignored.
Note that the interpretation of the alignment for text at arbitrary angles may not be what you expect. Rotation oftext happens before alignment, and alignment and positioning use the orthogonal bounding box of the text.
Note: This was added at PHPlot-5.0.5. It was changed in PHPlot-5.0.6 to take a single font array argument, ratherthan 2 separate arguments for font filename and size.
SetBgColorIndexes()Allocates the colors for the image background and image border. Called by SetColorIndexes before drawinganything, and by DrawMessage if needed. This was added in PHPlot-5.7.0 by moving code from SetColorIndexes,so that DrawMessage can set up only the color indexes it needs.
SetColorIndexes()Allocates all the colors needed for a plot. Called by DrawGraph before drawing anything. Calls SetBgColorIndexes(starting at PHPlot-5.7.0) to set the background and border color indexes. This was added in PHPlot-5.2.0.
SetDashedStyle($which_ndxcol, $use_style = TRUE)Sets the GD line style to select a dashed line, if line styles are enabled, in preparation for drawing a dashed line.$which_ndxcol is the color index to use for the line, and $use_style is a flag indicating if a styled line is to bedrawn. Returns a GD color index to use for drawing. If $use_styles is false, indicating solid lines, the return valueis $which_ndxcol. If $use_styles is true or omitted, the return value is a GD constant used to indicate drawing astyled line, and $which_ndxcol is used to set up the line style. The return value is then used by the caller as thecolor argument in drawing functions such as imageline.
To understand how this function works, see the documentation for the PHP GD function ImageSetStyle()and also refer to SetDefaultDashedStyle. GD expects a line style to be specified as an array of pixel values, whichis awkward to deal with. PHPlot uses a shorthand notation with integer values indicating pairs of the numberof color pixels ("on" pixels), then transparent pixels ("off" pixels). SetDefaultDashedStyle() creates atemplate string with a marker for each "on" pixel, and the special GD color code for transparent pixels for each"off" pixel. This template is saved in the class variable default_dashed_style. The actual color to use for

PHPlot Class Internal Functions
437
the "on" pixels is filled in by SetDashedStyle() before the dashed style is used. The result is an array ofpixel values for ImageSetStyle().
(In PHPlot-6.1.0 and earlier, SetDefaultDashedStyle() created a string of PHP code to generatean array of pixel values in the form used by the GD function ImageSetStyle(), and saved this asdefault_dashed_style. SetDashedStyle() then evaluated the PHP code, with the correct color filledin from $which_ndxcol.)
Called by all functions that need to draw lines that can have a line style applied, including DrawXTicks andDrawYTicks (for drawing the grid lines, not the ticks), and DrawLines for drawing line plots.
The $use_style argument and return value were added in PHPlot-6.0.0. Before that, SetDashedStyleunconditionally set up the line style, and returned a boolean value.
SetDefaultFonts()Selects all the default font values and sizes. See SetFont for details of the font element names and defaultvalues. Called by the class constructor initialization function initialize to initialize fonts in the plot object, and bySetUseTTF to restore the defaults when changing from or to TrueType font usage.
SetDefaultStyles()Initializes default colors and styles for PHPlot objects. Mostly this calls the public member functions such asSetDataColors but without specifying an array of colors, which causes the member functions to select defaultvalues. Called by the class constructor initialization function initialize.
SetIndexColor($which_color, $alpha = 0)This function was removed in PHPlot-5.2.0. It parsed a color specification, and allocated a GD color index. Thefirst part is replaced by calling SetRGBColor directly, and the second part is implemented with GetColorIndexat graph drawing time.
SetIndexDarkColor($which_color, $alpha = 0)This function was removed in PHPlot-5.2.0. It parsed a color specification, and allocated a GD color index for aslightly darker shade of the color. The first part is replaced by calling SetRGBColor directly, and the second partis implemented with GetDarkColorIndex at graph drawing time.
SetInputFile($which_input_file)Sets an image file $which_input_file to be used as the background image for the graph. Also resets the graph size tothe size of the image file. Called by the class constructor initialization function initialize. Note: In earlier releases,this was considered an externally available function. After a PHPlot object was created with the constructor,SetInputFile could be used to resize it and set the background image. Although this still works, it is deprecated.SetInputFile should be considered an internal-use-only function. Users should set the background image file usingthe 4th argument of PHPlot or PHPlot_truecolor when creating an instance of the object.
SetLabelType($mode, $args)Sets the formatting used for tick, data, and pie chart labels. This implements SetXLabelType, SetYLabelType,SetXDataLabelType, SetYDataLabelType, and part of SetPieLabelType. $mode is either 'x', 'xd', 'y', 'yd', or 'p'to select the type of label (x, y for tick labels; xd, yd for data labels; p for pie chart labels). $args is an array ofarguments, with $args[0] selecting the type of formatting (for example, data). Additional array elements dependon the formatting type. For more details, see the above-referenced functions. All arguments to those functions arecombined into an array and passed to SetLabelType as $args. Separation of data and tick label formatting wasavailable starting with PHPlot-5.1.0. Support for pie chart label formatting was added in PHPlot-5.6.0.
SetRGBColor($color_asked, $alpha = 0)Converts a general color specification into a standard form as an array of 4 components: red, green, blue, andalpha, and returns the array. The 3 color components are integers in the range 0-255, and the alpha component isan integer in the range 0-127 (where 0 means opaque). The acceptable color specification forms are documented in

PHPlot Class Internal Functions
438
Section 3.5.1, “Color Parameter Forms” and Section 4.3.4, “Color Parameter Form Extensions”, and include colornames, component arrays, and strings of the form #RRGGBB and #RRGGBBAA. The alpha argument providesa default value if the color specification does not include alpha; the default 0 makes the color opaque. This is useddirectly by all functions that accept a color specification. Use of alpha in the color specification, the default alphaargument, and the 4th component in the returned array were added in PHPlot-5.1.1.
SetupAreaPlot($stacked, &$xd, &$yd)Sets up for an area plot (plot types area, stackedarea, squaredarea, and stackedsquaredarea).$stacked indicates a stacked (cumulative) plot, so the Y values in the data array are to be accumulated for eachX row.
This function calculates two arrays, $xd[] and $yd[], which are used for drawing area fills. On return, $xd[]contains the device coordinates for the X values from the data array (or implied, for text-data data type). $yd[]is returned as a 2-dimensional array of Y values in device coordinates. SetupAreaPlot adds an additionalcolumn of Y values representing the X axis, which is the base line for area fills. For stacked plots, this goes beforethe first real Y value in the array. For unstacked plots, it goes after the last real Y value in the array.
While traversing the data array, this function also draws axis data labels if they are enabled. (Doing it here avoidshaving the calling functions need to access the data array at all.)
This was added in PHPlot-6.2.0.
SizeText($font, $angle, $text)Calculates the size of a block of text. It works on both GD (fixed-font) and TTF text. $font is a text element name,empty, or a PHPlot font array (use of an array is deprecated); see DrawText for details. $angle is the text angle indegrees. $text is the text string. The text string can contain multiple lines, with a newline character between lines.This function just calls ProcessText in text sizing mode to do the work. It returns a two-element array with thetext width and height. These are the width and height of an orthogonal bounding box (box aligned with the X andY axes) which contains the rotated text block. Called by functions which need to determine text size for layingout plot elements, such as CalcMargins. This function replaced TTFBBoxSize at PHPlot-5.0.5.
tile_img($file, $xorig, $yorig, $width, $height, $mode)Tiles an image from a file onto the plot image. $file is the filename of the image to use as the tile. ($xorig, $yorig)are the origin point for the tiling, and ($width, $height) are the area to be tiled. These are used to tile just underthe plot area versus the entire image. The $mode can be centeredtile, tile, or scale. Scale mode scalesthe source image to fit the target area. Tile and centeredtile modes repeat the source image as needed to fit intothe target area; the difference is that centeredtile offsets the tile start position by half its size, which works betterfor some tiles. Called by DrawBackground and DrawPlotAreaBackground if an image file is selected for the plotarea or overall background.
truncate_array(&$array, $size)This was added in PHPlot-5.2.0 and removed in PHPlot-5.3.1, when data color processing was changed to nottruncate the color arrays.
TTFBBoxSize($size, $angle, $font, $string)This function was removed at PHPlot-5.0.5. It was replaced by SizeText.
TuneAutoRange($which, $zero_magnet, $adjust_mode, $adjust_amount)This implements TuneXAutoRange and TuneYAutoRange to store tuning parameters used by the automatic rangecalculation. $which is 'x' or 'y', and the other arguments are as described under those two public functions. Thiswas added in PHPlot-6.0.0
TuneAutoTicks($which, $min_ticks, $tick_mode, $tick_inc_integer)This implements TuneXAutoTicks and TuneYAutoTicks to store tuning parameters used by the tick incrementcalculation. $which is 'x' or 'y', and the other arguments are as described under those two public functions. Thiswas added in PHPlot-6.0.0

PHPlot Class Internal Functions
439
xtr($x_world)Translates an X world coordinate value into a pixel coordinate value. This uses the scale and translation set upby CalcTranslation. See GetDeviceXY for a public interface.
ytr($y_world)Translates a Y world coordinate value into a pixel coordinate value. This uses the scale and translation set up byCalcTranslation. See GetDeviceXY for a public interface.
__sleep()This is a PHP "magic method" that prepares a PHPlot object for serialization. It stores the PHPlot version string(for checking at wakeup time), and a flag indicating if it used a truecolor image or not. See Section 4.2, “PHPlotObject Serialization”. This was added in PHPlot-5.8.0.
__wakeup()This is a PHP "magic method" that re-creates a PHPlot object after unserialization. It checks the stored versionstring to make sure the object was serialized with the exact same PHPlot version, and then re-creates the imageresource. See Section 4.2, “PHPlot Object Serialization”. This was added in PHPlot-5.8.0.

PHPlot Class Member Variables
440
Chapter 10. PHPlot Class MemberVariables
This chapter provides information about the PHPlot class member variables and constants.
Most PHPlot class member variables are meant for internal use only, and are declared to have protected visibility(starting with PHPlot-6.0.0). This means they are not accessible from your application, unless you define a class thatextends PHPlot. All these member variables are subject to change in future releases without concern for backwardcompatibility.
One exception is the plot tuning variables, which have public visibility. Section 4.7, “Tuning Parameters” describeshow these PHPlot member variables can be used to adjust plot appearance. Setting them from your application isgenerally safe, as they have relatively small effects on plots, and are less likely to change in future releases.
A few additional member class variables have public visibility, due to past use in applications, but you should avoidusing them. This includes img, the GD image resource, and fonts, the array of font information.
10.1. List of Member VariablesThe table below lists the PHPlot class member variables.
The initial values are listed under Default Value. Variables which are declared but not initialized at the top of thePHPlot class definition have nothing in this column. They can be considered to have an initial value of NULL, whichis significant for some variables but not for others.
The Reference Function column lists the member function(s) used to set the variable, if the variable can be set by theapplication, else the member function which calculates the variable, if there is one, else the member function(s) whichuse the variable, if there are only a few.
Variables which hold color values are initialized to defaults using SetDefaultStyles when a PHPlot object is created.For the default colors, see Section 3.5.5, “Plot Element Colors”.
Variable Name: DefaultValue:
Reference Function: Description:
actual_bar_width CalcBarWidths Calculated width of bars for bar charts
bar_adjust_gap CalcBarWidths Calculated bar gap
bar_extra_space 0.5 CalcBarWidths Extra space between groups of bars(See Tuning Parameters for more)
bar_width_adjust 1 CalcBarWidths Width of bar relative to space for onebar (See Tuning Parameters for more)
bg_color SetBackgroundColor Color (R,G,B,A) for imagebackground
bgimg SetBgImage Background image filename
bgmode SetBgImage Background image tiling mode
boxes_frac_width 0.3 DrawBoxes Scale factor for box widths in boxplots. Default is 0.3, meaning withinmin and max limits the boxes will use30% of the available space for half
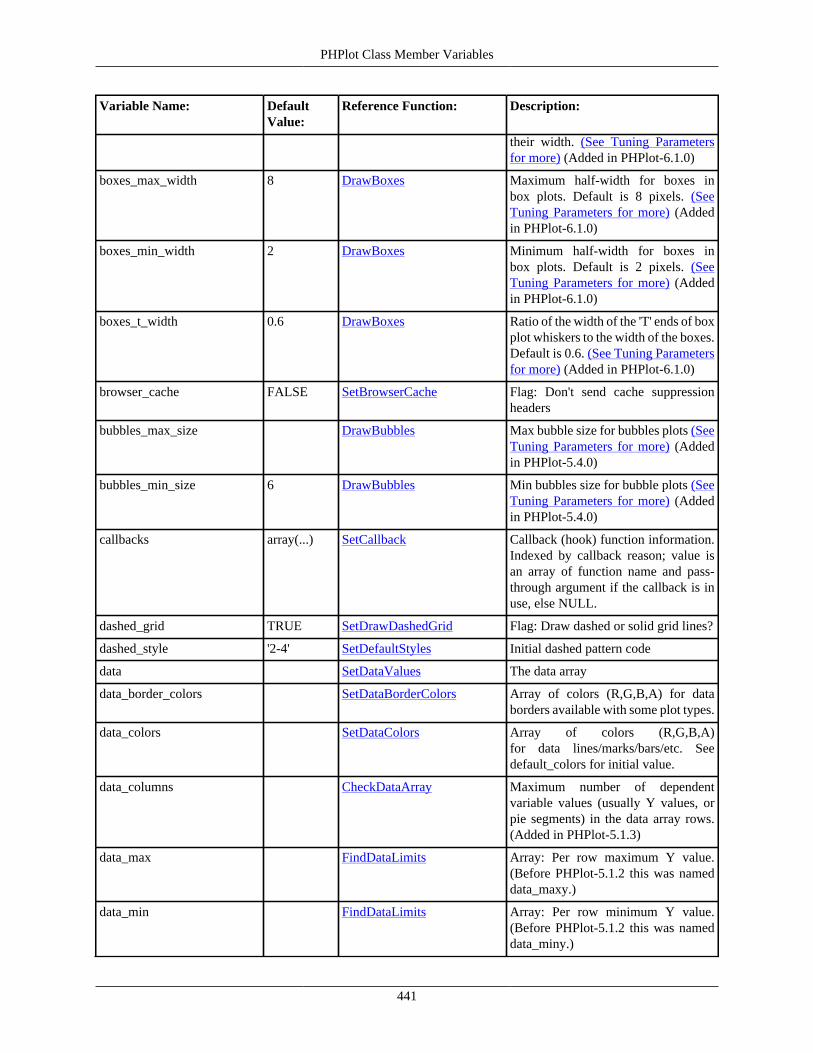
PHPlot Class Member Variables
441
Variable Name: DefaultValue:
Reference Function: Description:
their width. (See Tuning Parametersfor more) (Added in PHPlot-6.1.0)
boxes_max_width 8 DrawBoxes Maximum half-width for boxes inbox plots. Default is 8 pixels. (SeeTuning Parameters for more) (Addedin PHPlot-6.1.0)
boxes_min_width 2 DrawBoxes Minimum half-width for boxes inbox plots. Default is 2 pixels. (SeeTuning Parameters for more) (Addedin PHPlot-6.1.0)
boxes_t_width 0.6 DrawBoxes Ratio of the width of the 'T' ends of boxplot whiskers to the width of the boxes.Default is 0.6. (See Tuning Parametersfor more) (Added in PHPlot-6.1.0)
browser_cache FALSE SetBrowserCache Flag: Don't send cache suppressionheaders
bubbles_max_size DrawBubbles Max bubble size for bubbles plots (SeeTuning Parameters for more) (Addedin PHPlot-5.4.0)
bubbles_min_size 6 DrawBubbles Min bubbles size for bubble plots (SeeTuning Parameters for more) (Addedin PHPlot-5.4.0)
callbacks array(...) SetCallback Callback (hook) function information.Indexed by callback reason; value isan array of function name and pass-through argument if the callback is inuse, else NULL.
dashed_grid TRUE SetDrawDashedGrid Flag: Draw dashed or solid grid lines?
dashed_style '2-4' SetDefaultStyles Initial dashed pattern code
data SetDataValues The data array
data_border_colors SetDataBorderColors Array of colors (R,G,B,A) for databorders available with some plot types.
data_colors SetDataColors Array of colors (R,G,B,A)for data lines/marks/bars/etc. Seedefault_colors for initial value.
data_columns CheckDataArray Maximum number of dependentvariable values (usually Y values, orpie segments) in the data array rows.(Added in PHPlot-5.1.3)
data_max FindDataLimits Array: Per row maximum Y value.(Before PHPlot-5.1.2 this was nameddata_maxy.)
data_min FindDataLimits Array: Per row minimum Y value.(Before PHPlot-5.1.2 this was nameddata_miny.)

PHPlot Class Member Variables
442
Variable Name: DefaultValue:
Reference Function: Description:
data_type 'text-data' SetDataType Format of the data array
data_units_text '' FormatLabel Obsolete - suffix for 'data'-formattedlabels
data_value_label_angle 90 CheckDataValueLabels Angle (in degrees) for data value labels(See Tuning Parameters for more)
data_value_label_distance 5 CheckDataValueLabels Distance (in pixels) for data valuelabels (See Tuning Parameters formore)
datalabel_color SetDataLabelColor Color (R,G,B,A) to use for axis datalabels (Added in PHPlot-5.7.0)
datatype_error_bars DecodeDataType Flag: data type has error bars. (Addedin PHPlot-5.1.3)
datatype_implied DecodeDataType Flag: data type has implied X or Y.(Added in PHPlot-5.1.3)
datatype_pie_single DecodeDataType Flag: data type is one-column, for apie chart with one segment per row.(Added in PHPlot-5.1.3)
datatype_swapped_xy DecodeDataType Flag: data type has swapped X and Yvalues. (Added in PHPlot-5.1.3)
datatype_yz DecodeDataType Flag: data type includes Y and Z valuepairs (Added in PHPlot-5.5.0)
datatypes array(...) DecodeDataType,SetDataType
Static array of data type information(Added in PHPlot-6.1.0) (See notes formore)
datatypes_map array(...) SetDataType Static array of data type aliases (keys)and the corresponding primary name(values) (Added in PHPlot-6.1.0)
decimal_point SetNumberFormat Character to use for decimal point informatted numbers
default_colors array(...) SetDataColors,SetErrorBarColors
The default color array,used to initialize data_colorsand error_bar_colors. (Added inPHPlot-5.1.0)
default_dashed_style SetDefaultDashedStyle Template string for the dashed linepattern. (In PHPlot-6.1.0 and earlier,this was a PHP code string.)
default_ttfont SetDefaultTTFont,GetDefaultTTFont
Default TrueType font file. (ThroughPHPlot-5.1.2, there was a staticdefault 'benjamingothic.ttf'. AfterPHPlot-5.1.2, the default is dynamic.)
done array() DrawBackground,DrawImageBorder, DrawTitle
Array of flags for elements that mustbe drawn at most once. Flag isset TRUE when drawn. Indexes are:

PHPlot Class Member Variables
443
Variable Name: DefaultValue:
Reference Function: Description:
background, border, title. (Replacedseparate variables in PHPlot-5.3.1.)
draw_broken_lines FALSE SetDrawBrokenLines Flag: How to handle missing Y values
draw_data_borders SetDrawDataBorders Flag: Draw data borders, availablewith some plot types (Added inPHPlot-6.0.0)
draw_pie_borders SetDrawPieBorders Flag: Draw borders on pie chartsegments (Added in PHPlot-6.0.0)
draw_plot_area_background FALSE SetDrawPlotAreaBackground Flag: Draw the background of the plotarea
draw_x_data_label_lines FALSE SetDrawXDataLabelLines Flag: Draw X data label lines
draw_x_grid SetDrawXGrid Flag: Draw X grid lines? (True,False, or NULL meaning the defaultbehavior)
draw_y_data_label_lines FALSE SetDrawYDataLabelLines Flag: Draw Y data label lines (Addedin PHPlot-6.0.0)
draw_y_grid SetDrawYGrid Flag: Draw Y grid lines? (True,False, or NULL meaning the defaultbehavior)
dvlabel_color SetDataValueLabelColor Color (R,G,B,A) to use for data valuelabels (Added in PHPlot-5.7.0)
error_bar_colors SetErrorBarColors Array of colors (R,G,B,A) for errorbars. See default_colors for initialvalue.
error_bar_line_width 1 SetErrorBarLineWidth Thickness of error bar lines
error_bar_shape 'tee' SetErrorBarShape Shape (style) of error bars: line or tee
error_bar_size 5 SetErrorBarSize Size of error bars
file_format 'png' SetFileFormat Image format: png, gif, jpg, wbmp
fonts SetFontGD, SetFontTTF Array of font information. (See notesfor more)
grid_at_foreground FALSE DrawGraph Flag: Draw grid on top of or behind theplot (See Tuning Parameters for more)
grid_color SetGridColor Color (R,G,B,A) to use for axes, plotarea border, legend border, pie chartlines and text (not grid!)
group_frac_width 0.7 CalcBarWidths Controls fraction of bar group spaceused for bar (See Tuning Parametersfor more)
i_border SetImageBorderColor Color (R,G,B,A) for image border, ifdrawn
image_border_type 'none' SetImageBorderType Image border type

PHPlot Class Member Variables
444
Variable Name: DefaultValue:
Reference Function: Description:
image_border_width SetImageBorderWidth Width of image border inpixels. Default depends onimage_border_type. (Added inPHPlot-5.1.2)
image_height PHPlot Image height
image_width PHPlot Image width
img PHPlot Image resource
in_error PrintError Prevent recursion in error messageimage production
is_inline FALSE SetIsInline Don't send headers
label_format array(...) SetPieLabelType,SetPrecisionX, SetPrecisionY,SetXDataLabelType,SetXLabelType,SetXTimeFormat,SetYDataLabelType,SetYLabelType,SetYTimeFormat
Label format info. (See notes for more)
label_scale_position 0.5 SetLabelScalePosition Pie chart label position factor
legend SetLegend Legend text array. Each index is alegend text line.
legend_bg_color SetLegendBgColor Color (R,G,B,A) for the legendbackground (Added in PHPlot-6.0.0)
legend_colorbox_align 'right' SetLegendStyle Alignment of color boxes or shapemarkers in the legend: left, right, ornone
legend_colorbox_borders 'textcolor' SetLegendColorboxBorders Color control for colorbox borders inlegend (Added in PHPlot-6.0.0)
legend_colorbox_width 1.0 DrawLegend Adjusts width of color boxes in thelegend (See Tuning Parameters formore) (Added in PHPlot-5.3.0)
legend_pos SetLegendPosition Array holding legend positioninformation (Added in PHPlot-5.4.0)(See notes for more)
legend_reverse_order FALSE SetLegendReverse Flag: reverse the order of lines in thelegend box, bottom to top (Added inPHPlot-5.5.0)
legend_text_align 'right' SetLegendStyle Legend style setting, left or right
legend_text_color SetLegendTextColor Color (R,G,B,A) for the legend text(Added in PHPlot-6.0.0)
legend_use_shapes FALSE SetLegendUseShapes Draw color boxes (if false or unset) orshape markers (if true) in the legend(Added in PHPlot-5.4.0)

PHPlot Class Member Variables
445
Variable Name: DefaultValue:
Reference Function: Description:
light_grid_color SetLightGridColor Color (R,G,B,A) for grid lines and Xdata lines
line_spacing 4 SetLineSpacing Controls inter-line spacing of text
line_styles array(...) SetLineStyles Plot line style(s)
line_widths 1 SetLineWidths Plot line width(s)
locale_override FALSE number_format Flag to avoid importing locale info(See Tuning Parameters for more)
max_x FindDataLimits Overall max X value in the data array
max_y FindDataLimits Overall max Y value in the data array
max_z FindDataLimits Overall max Z value in the data array(for X/Y/Z data type only) (Added inPHPlot-5.5.0)
min_x FindDataLimits Overall min X value in the data array
min_y FindDataLimits Overall min Y value in the data array
min_z FindDataLimits Overall min Z value in the data array(for X/Y/Z data type only) (Added inPHPlot-5.5.0)
ndx_bg_color SetColorIndexes Color index of image background
ndx_data_border_colors SetColorIndexes Color index array for data borders
ndx_data_colors SetColorIndexes Color index array for plot data lines/marks/bars/etc.
ndx_data_dark_colors NeedDataDarkColors Color index array for plot data, darkershade
ndx_datalabel_color SetColorIndexes Color index for axis data labels (Addedin PHPlot-5.7.0)
ndx_dvlabel_color SetColorIndexes Color index for data value labels(Added in PHPlot-5.7.0)
ndx_error_bar_colors NeedErrorBarColors Color index array for error bars
ndx_grid_color SetColorIndexes Color index for axes, plot area border,legend border, pie chart lines and text
ndx_i_border SetColorIndexes Color index for image border lines
ndx_i_border_dark SetColorIndexes Color index for image border lines,darker shade
ndx_legend_bg_color SetColorIndexes Color index for the legend background(Added in PHPlot-6.0.0)
ndx_legend_text_color SetColorIndexes Color index for the legend text (Addedin PHPlot-6.0.0)
ndx_light_grid_color SetColorIndexes Color index for grid lines and X datalines

PHPlot Class Member Variables
446
Variable Name: DefaultValue:
Reference Function: Description:
ndx_pieborder_color SetColorIndexes Color index for unshaded piechart segment borders (Added inPHPlot-6.0.0)
ndx_pielabel_color SetColorIndexes Color index for pie chart data labels(Added in PHPlot-5.7.0)
ndx_plot_bg_color SetColorIndexes Color index of plot area background
ndx_text_color SetColorIndexes Color index for labels and legend text
ndx_tick_color SetColorIndexes Color index for tick marks
ndx_ticklabel_color SetColorIndexes Color index for tick labels (Added inPHPlot-5.7.0)
ndx_title_color SetColorIndexes Color index for main title
ndx_x_title_color SetColorIndexes Color index for X title (Added inPHPlot-5.2.0)
ndx_y_title_color SetColorIndexes Color index for Y title (Added inPHPlot-5.2.0)
num_data_rows SetDataValues Number of rows in the data array(number of points along X, or numberof bar groups, for example)
num_recs SetDataValues Array with number of entries in eachdata row (including label and X ifpresent)
num_x_ticks '' SetNumXTicks Forced number of X tick marks
num_y_ticks '' SetNumYTicks Forced number of Y tick marks
ohlc_frac_width 0.3 DrawOHLC Scale factor for element widths inOHLC plots. Default is 0.3, meaningwithin min and max limits the elementswill use 30% of the available spacefor half their width. (See TuningParameters for more) (Added inPHPlot-5.3.0)
ohlc_max_width 8 DrawOHLC Maximum half-width for elements inOHLC plots (candlestick bodies ortick pairs). Default is 8 pixels. (SeeTuning Parameters for more) (Addedin PHPlot-5.3.0)
ohlc_min_width 2 DrawOHLC Minimum half-width for elements inOHLC plots (candlestick bodies ortick pairs). Default is 2 pixels. (SeeTuning Parameters for more) (Addedin PHPlot-5.3.0)
output_file SetOutputFile Redirect to output file
pie_diam_factor 0.5 DrawPieChart Aspect ratio for shaded pie charts. (SeeTuning Parameters for more) (Addedin PHPlot-5.6.0)

PHPlot Class Member Variables
447
Variable Name: DefaultValue:
Reference Function: Description:
pie_direction_cw FALSE SetPieDirection Flag: If true, pie chart segments aredrawn in clockwise direction. If falseor unset, they are counter-clockwise.(Added in PHPlot-6.0.0)
pie_full_size FALSE SetPieAutoSize Flag: If true, do not include label sizeswhen calculating pie size. (Added inPHPlot-5.6.0)
pie_label_source SetPieLabelType Source of label text for pie charts(percent, value, label, or index) (Addedin PHPlot-5.6.0)
pie_min_size_factor 0.5 DrawPieChart Minimum amount of the plot areathat will be reserved for the pie (SeeTuning Parameters for more) (Addedin PHPlot-5.6.0)
pie_start_angle 0 SetPieStartAngle Starting angle in degrees for the firstsegment in a pie chart. (Added inPHPlot-6.0.0)
pieborder_color SetPieBorderColor Color (R,G,B,A) to use for unshadedpie chart segment borders (Added inPHPlot-6.0.0)
pielabel_color SetPieLabelColor Color (R,G,B,A) to use for pie chartdata labels (Added in PHPlot-5.7.0)
plot_area CalcPlotAreaPixels Array defining the calculated plot area.([0],[1]) is the top left corner, ([2],[3])is the bottom right corner.
plot_area_height CalcPlotAreaPixels Height of the plot area
plot_area_width CalcPlotAreaPixels Width of the plot area
plot_bg_color SetPlotBgColor Color (R,G,B,A) for plot areabackground
plot_border_type SetPlotBorderType Where to draw plot borders. Can bescalar or array of choices.
plot_max_x SetPlotAreaWorld,CalcPlotAreaWorld
Max X of the plot area in worldcoordinates
plot_max_y SetPlotAreaWorld,CalcPlotAreaWorld
Max Y of the plot area in worldcoordinates
plot_min_x SetPlotAreaWorld,CalcPlotAreaWorld
Min X of the plot area in worldcoordinates
plot_min_y SetPlotAreaWorld,CalcPlotAreaWorld
Min Y of the plot area in worldcoordinates
plot_origin_x CalcTranslation X device coordinate of the plot areaorigin
plot_origin_y CalcTranslation Y device coordinate of the plot areaorigin

PHPlot Class Member Variables
448
Variable Name: DefaultValue:
Reference Function: Description:
plot_type 'linepoints' SetPlotType Selected plot type
plotbgimg SetPlotAreaBgImage Plot area background image filename
plotbgmode SetPlotAreaBgImage Plot area background image tilingmode
plots array(...) DrawGraph, SetPlotType,FindDataLimits
Static array of plot type information(Added in PHPlot-5.3.0) (See notes formore)
point_counts CheckPointParams Size of point_shapes and point_sizesarrays (added in PHPlot-5.1.0)
point_shapes array(...) SetPointShapes Marker shapes for point plots
point_sizes array(6) SetPointSizes Marker sizes for point plots
print_image TRUE SetPrintImage Flag: Automatic PrintImage afterDrawGraph?
rangectl array(...) TuneXAutoRange,TuneYAutoRange,TuneAutoRange
Tuning parameters for plot rangecalculation (Added in PHPlot-6.0.0)(See notes for more)
record_bar_width CalcBarWidths Area for each bar in a bar chart
records_per_group SetDataValues Maximum of num_recs[], max numberof entries (including label and X ifpresent) for all data rows
rgb_array SetRGBArray Array mapping color names to array ofR, G, B values
safe_margin 5 Fixed extra margin used in multipleplaces (See Tuning Parameters formore)
saved_version __sleep, __wakeup Stores PHPlot version when object wasserialized
shading 5 SetShading Drop shadow size for pie and bar charts
skip_bottom_tick FALSE SetSkipBottomTick Skip bottom tick mark
skip_left_tick FALSE SetSkipLeftTick Skip left tick mark
skip_right_tick FALSE SetSkipRightTick Skip right tick mark
skip_top_tick FALSE SetSkipTopTick Skip top tick mark
stream_boundary StartStream MIME boundary sequence usedwith streaming plots (added inPHPlot-5.8.0)
stream_frame_header StartStream Boundary and MIME header, outputbefore each frame in a plot stream(added in PHPlot-5.8.0)
stream_output_f StartStream Name of the GD output function forthis image type, used with streamingplots (added in PHPlot-5.8.0)

PHPlot Class Member Variables
449
Variable Name: DefaultValue:
Reference Function: Description:
suppress_error_image FALSE SetFailureImage Flag: Don't produce an error imageon fatal error. Unset is FALSE. (Notethe flag value is the negation ofthe function argument). (Added inPHPlot-5.5.0)
suppress_x_axis FALSE SetDrawXAxis Flag: Don't draw the X axis line. Unset(by default) means FALSE. (Added inPHPlot-5.3.0)
suppress_y_axis FALSE SetDrawYAxis Flag: Don't draw the Y axis line. Unset(by default) means FALSE. (Added inPHPlot-5.3.0)
text_color SetTextColor Color (R,G,B,A) for labels and legendtext
thousands_sep SetNumberFormat Character to use to group 1000s informatted numbers
tick_color SetTickColor Color (R,G,B,A) for tick marks
tickctl array(...) TuneXAutoTicks,TuneYAutoTicks,TuneAutoTicks
Tuning parameters for tick incrementcalculation (Added in PHPlot-6.0.0)(See notes for more)
ticklabel_color SetTickLabelColor Color (R,G,B,A) to use for tick labels(Added in PHPlot-5.7.0)
title_color SetTitleColor Color (R,G,B,A) for main title (anddefault for X and Y titles)
title_offset CalcMargins Y offset of main title position (Addedin PHPlot-5.1.2)
title_txt '' SetTitle Main title text
total_records SetDataValues Total number of entries (rows timescolumns in each row) in the data array.
transparent_color SetTransparentColor Color (R,G,B,A) designated astransparent (Added in PHPlot-5.2.0)
truecolor __sleep, __wakeup Flag: True if serialized object had atruecolor image
ttf_path '.' SetTTFPath TrueType font directory
use_ttf FALSE SetUseTTF Default font type, True for TrueType,False for GD
x_axis_position SetXAxisPosition Position of X axis (in worldcoordinates)
x_axis_y_pixels CalcTranslation Device coordinate for the X axis
x_data_label_angle CheckLabels Effective X data label text angle(Added in PHPlot-5.1.0)
x_data_label_angle_u '' SetXDataLabelAngle X data label text angle (seealso x_data_label_angle) (Added inPHPlot-6.0.0)

PHPlot Class Member Variables
450
Variable Name: DefaultValue:
Reference Function: Description:
x_data_label_pos SetXDataLabelPos,CheckLabels
Position of X data labels. (Default was'plotdown', but is now applied at graphdrawing time.)
x_label_angle 0 SetXLabelAngle X tick label text angle (and default forx_data_label_angle)
x_label_axis_offset CalcMargins Label offset relative to plot area
x_label_bot_offset CalcMargins Label offset relative to plot area
x_label_top_offset CalcMargins Label offset relative to plot area
x_left_margin CalcMargins Calculated plot area margin - left side
x_right_margin CalcMargins Calculated plot area margin - right side
x_tick_anchor SetXTickAnchor X tick anchor point (Added inPHPlot-5.4.0)
x_tick_cross 3 SetXTickCrossing Length of X tick marks (inside plotarea)
x_tick_inc CalcPlotAreaWorld Effective step between X tick marks.This is equal to x_tick_inc_u ifSetXTickIncrement was used, else acalculated value.
x_tick_inc_u '' SetXTickIncrement Step between X tick marks (see alsox_tick_inc) (Added in PHPlot-6.0.0)
x_tick_label_pos SetXTickLabelPos Position of X tick labels. (Default was'plotdown', but is now applied at graphdrawing time.)
x_tick_length 5 SetXTickLength Length of X tick marks (outside plotarea)
x_tick_pos 'plotdown' SetXTickPos Position of X tick marks
x_title_bot_offset CalcMargins Title offset relative to plot area
x_title_color SetXTitleColor Color (R,G,B,A) for X title (Added inPHPlot-5.2.0)
x_title_pos 'none' SetXTitle X Axis title position
x_title_top_offset CalcMargins Title offset relative to plot area
x_title_txt '' SetXTitle X Axis title text
xscale CalcTranslation X scale factor for converting World toDevice coordinates
xscale_type 'linear' SetXScaleType Linear or log scale on X
y_axis_position SetYAxisPosition Position of Y axis (in worldcoordinates)
y_axis_x_pixels CalcTranslation Device coordinate for the Y axis
y_bot_margin CalcMargins Calculated plot area margin - bottom
y_data_label_angle 0 SetYDataLabelAngle Y data label text angle (Added inPHPlot-5.1.0)
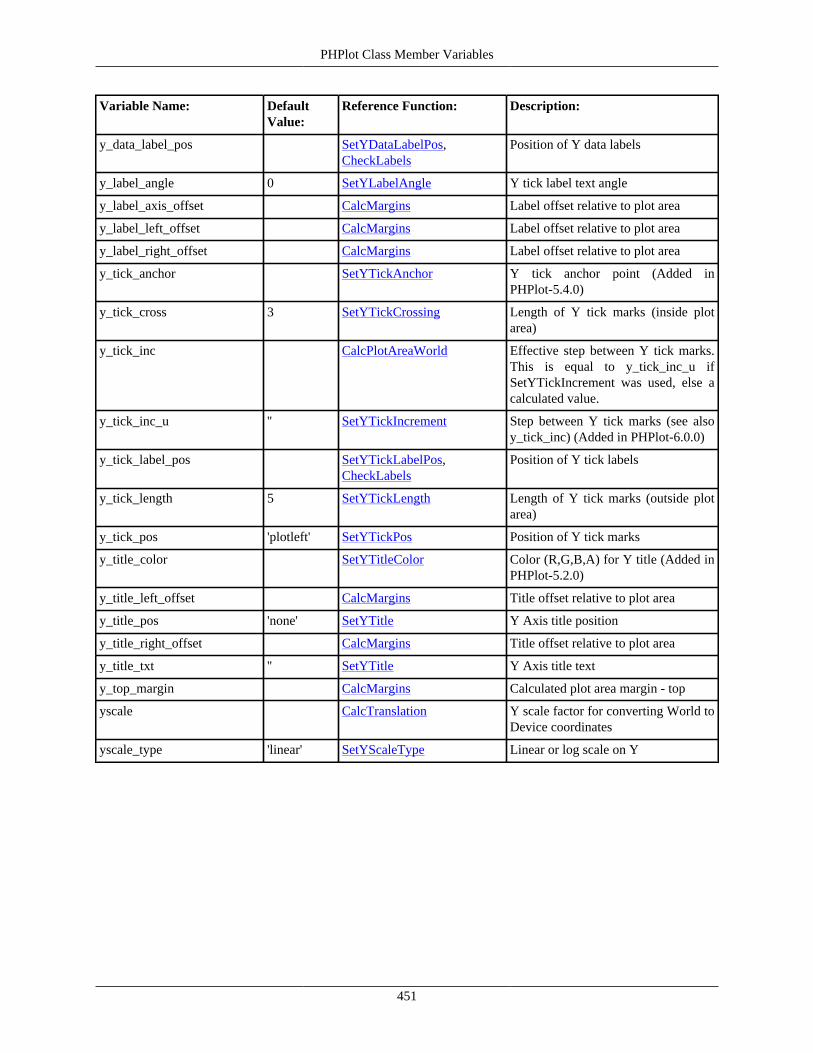
PHPlot Class Member Variables
451
Variable Name: DefaultValue:
Reference Function: Description:
y_data_label_pos SetYDataLabelPos,CheckLabels
Position of Y data labels
y_label_angle 0 SetYLabelAngle Y tick label text angle
y_label_axis_offset CalcMargins Label offset relative to plot area
y_label_left_offset CalcMargins Label offset relative to plot area
y_label_right_offset CalcMargins Label offset relative to plot area
y_tick_anchor SetYTickAnchor Y tick anchor point (Added inPHPlot-5.4.0)
y_tick_cross 3 SetYTickCrossing Length of Y tick marks (inside plotarea)
y_tick_inc CalcPlotAreaWorld Effective step between Y tick marks.This is equal to y_tick_inc_u ifSetYTickIncrement was used, else acalculated value.
y_tick_inc_u '' SetYTickIncrement Step between Y tick marks (see alsoy_tick_inc) (Added in PHPlot-6.0.0)
y_tick_label_pos SetYTickLabelPos,CheckLabels
Position of Y tick labels
y_tick_length 5 SetYTickLength Length of Y tick marks (outside plotarea)
y_tick_pos 'plotleft' SetYTickPos Position of Y tick marks
y_title_color SetYTitleColor Color (R,G,B,A) for Y title (Added inPHPlot-5.2.0)
y_title_left_offset CalcMargins Title offset relative to plot area
y_title_pos 'none' SetYTitle Y Axis title position
y_title_right_offset CalcMargins Title offset relative to plot area
y_title_txt '' SetYTitle Y Axis title text
y_top_margin CalcMargins Calculated plot area margin - top
yscale CalcTranslation Y scale factor for converting World toDevice coordinates
yscale_type 'linear' SetYScaleType Linear or log scale on Y

PHPlot Class Member Variables
452
10.2. Member Variable Notes
This section contains details on some of the PHPlot class member variables listed in the previoussection. Remember that all PHPlot class member variables are meant for internal use only.
10.2.1. datatypes[]The datatypes[] array contains information about the available data types. See Section 3.3, “PHPlot DataTypes” for more information about data types. It is used by SetDataType to validated the supplied data type, and byDecodeDataType to set the flags that describe the datatype.
The goal is to keep the names and details about the data types in this array only, and minimize other uses of the actualdata type names. However, each plot type drawing function (for example DrawLines) also 'knows' about the data typesit supports, and specifies the data type names when calling CheckDataType.
This array was added in PHPlot-6.1.0. It is a protected static member variable in the PHPlot class, so it must be accessedas self::$datatypes from inside the class (or a derived class), and not through an instance of the class. Is notaccessible from outside the class or derived classes.
The array keys are the data types (for example: 'text-data'). The values are arrays which contain information about thedata type. The second-level array keys correspond to the 'datatype' flag variables, without the 'datatype_' prefix. A keywill be present, with the value TRUE, if the flag should be set for that data type. The key will be absent if the flagshould not be set. For example: for data type text-data, the array contains one value: 'implied' => TRUE.This means that for data type text-data, the datatype_implied flag should be TRUE (indicating that this data typehas implied independent variable values), and all other flags should be FALSE. In addition to implied, the otherpossible keys are pie_single, error_bars, swapped_xy, and yz.
10.2.2. fonts[]The fonts[] array contains information about the fonts to use for text on the plot. The array keys are the elementnames (such as title or legend) as used in SetFont, SetFontGD, or SetFontTTF. The array values are arrays whichcontain information about the font to use for that element. The keys and values of the second-level arrays are:
Key Value for TTF Value for GD Font
ttf True for a TrueType font False for a GD font
font Pathname of the font file Font number: 1 through 5
size Font point size Not used
height Height in pixels of an upper-case "E"in the font
Font height in pixels
width Width in pixels of an upper-case "E"in the font
Font width in pixels
spacing Font's built-in inter-line spacing Not used
line_spacing User-requested inter-line spacingfactor.
Same as for TTF
For TrueType fonts, the height and width can vary by character. The fonts array stores a height and width value for thefont, but these are only used for sizing non-text plot elements (such as the legend color boxes). When PHPlot needs

PHPlot Class Member Variables
453
to know the drawn size of a string that will use TTF, it calculates the exact size of that specific string when drawnwith the designated font.
GD fonts have fixed character width and height, so the values stored in the fonts array can be used to calculate textstring sizes.
The spacing key stores the TrueType font's built-in inter-line spacing. Although TrueType fonts have thisinformation internally, PHP cannot access it, so PHPlot calculates it by taking the height of the string "E\nE" andsubtracting twice the height of the letter E.
The line_spacing key stores the user-specified line spacing adjustment for a text element, if any, from SetFont orone of the two related functions. It will be NULL if the spacing was not set for this element, meaning use the defaultline spacing. See SetLineSpacing for more information on how this is used.
Here is an example of part of a fonts array, for the title element:
$plot->fonts['title'] = array( 'ttf' => FALSE, // This element uses a GD font 'font' => 2, // Use GD font 2 'height' => 13, // Provided by GD 'width' => 6, // Provided by GD 'line_spacing' => NULL, // Use default line spacing)
10.2.3. label_format[]The label_format[] array contains information about how text labels should be formatted. This array has 5entries, with keys 'x', 'y', 'xd', 'yd', and 'p'. The 'x' and 'y' entries are for tick labels, and the 'xd' and 'yd' entries arefor data labels. (Note that PHPlot defaults data label formatting to match tick label formatting, but this is handledin FormatLabel.) The 'p' entry is for pie chart labels, and will only exist for pie charts. (The 'p' entry was added inPHPlot-5.6.0.)
The value of each entry in label_format is an array containing formatting information. The arrays are empty bydefault, meaning there is no special formatting. If formatting has been enabled, for example with SetXLabelType, thearrays can contain the following keys and values:
Key Used with type Value
type Formatting type: data, time, printf, or custom.
precision data The number of decimal positions to produce.
prefix data A prefix string to append to the label (for example, a currency sign).
suffix data A suffix string to append to the label (for example, a currency sign orpercent sign). This replaces data_units_text (which still works too).
time_format time The date/time format string for the PHP strftime() function.
printf_format printf The format string(s) for the PHP printf() function. This can be a singlestring, or an array of one to three strings.
custom_callback custom The function (or array with object and method name) to call to formatthe label.
custom_arg custom An additional argument to pass to the custom_callback function.
Use of multiple strings for printf_format was added in PHPlot-6.2.0.

PHPlot Class Member Variables
454
10.2.4. legend_pos[]
The legend_pos[] array contains information about positioning of the legend. This is set by SetLegendPosition,and by the functions which use it (SetLegendPixels and SetLegendWorld). This was added in PHPlot-5.4.0, replacingscalar variables legend_x_pos, legend_y_pos, and legend_xy_world.
The array keys correspond to the arguments to SetLegendPosition and are shown in the following table.
Keys Value
x, y Relative coordinates of a point on the legend box
mode One of: image, plot, title, or world
x_base, y_base Relative coordinates of a point on the image, plot, or title, or worldcoordinates
x_offset, y_offset Pixel offset to be applied last
10.2.5. plots[]
The plots[] array contains information about known plot types. It is used by FindDataLimits, DrawGraph, and otherclass functions to prepare for and draw the main portion of the plot. The goal is to contain the information about eachavailable plot type in a single place - this array. The actual names of the plot types (for example 'bars' or 'linepoints')appear only in this array. To simplify somewhat, adding a new plot type to PHPlot involves adding a new element tothe plots[] array, and adding a new function to PHPlot which draws the 'insides' of the plot.
This array was added in PHPlot-5.3.0. It is a protected static member variable in the PHPlot class, so it must be accessedas self::$plots from inside the class (or a derived class), and not through an instance of the class. Is not accessiblefrom outside the class or derived classes.
The array keys are the plot types (for example: 'bars', 'linepoints'). These must not include upper case letters. Thevalues are arrays which contain information about the plot type. The keys and values of the second-level arrays are:
Key Value
draw_method Name of the PHPlot class method (function) to call to draw the 'insides' of theplot. This is the only required entry.
draw_arg Optional argument array to pass to the draw_method function.
suppress_axes Optional flag indicating that the X axis and Y axis should not be drawn. Defaultis FALSE.
abs_vals Optional flag indicating that the plot type uses the absolute values of data. Defaultis FALSE.
sum_vals Optional flag indicating that the plot type sums up the values in each row. Defaultis FALSE.
legend_alt_marker Optional alternate marker mode for legends: box, shape, or line.
adjust_type Optional control for adjusting the end of an automatically calculated plot range(see notes below).
Only the draw_method entry is required. The named method is used to draw everything inside the plot area. (Thatis, everything except the plot titles, axis lines, tick marks and tick labels, grid lines, and legend.)

PHPlot Class Member Variables
455
The draw_arg entry can be used to pass constant arguments to the draw_method method. If present, this must bean array, and each element of the array is passed to the drawing method as a separate argument. If this is not specified,the drawing method is called with no arguments. This is generally used to overload drawing methods, so they handlemultiple similar plot types.
The suppress_axes flag indicates that X and Y axis lines should not be drawn (used with pie charts, for example).If omitted, FALSE is used, meaning the axis lines are drawn. (Before PHPlot-6.0.0 this was called draw_axes, withdefault TRUE, and FALSE for pie charts.)
The two special data processing flags abs_vals and sum_vals are used by FindDataLimits to indicate how tocompute the minimum and maximum data values. Plot types that ignore sign and take absolute values of the data setabs_vals to TRUE. Plot types that sum up the data values in each row set sum_vals to TRUE. The default ifomitted for both flags is FALSE, meaning the plot type uses the values as specified in the data array. If both abs_valsand sum_vals are TRUE, this means the plot type sums up the absolute values from the data array. (The stackedareaplot type does this.)
The optional legend_alt_marker entry indicates the use of an alternate maker shape in legends. UseSetLegendUseShapes to select either the primary mode or the alternate mode for legend shapes. The primary modeis a solid filled color box. The alternate mode varies with the plot type, according the the legend_alt_markerentry. Use 'box' for rectangular color boxes. This is the default if the legend_alt_marker key is omitted fromthe array. Effectively, this means there is no alternate marker mode for these plot types, because color boxes are theprimary mode. Use 'shape' for point shape markers, which applies to points plots and similar types which use pointshapes. Use 'line' for short line segments, which applies to line plots and similar types.
The optional adjust_type entry controls adjustments made to the end of an automatically calculated plot range.See TuneXAutoRange and TuneYAutoRange for more information. This is used to indicate when a plot type needsadditional space, perhaps for labels, between the data extrema and the edge of the plot area. If omitted, the defaultvalue 0 is used. A value of 0 means apply the adjustment for the dependent variable only. A value of 1 means applythe adjustment for both X and Y, and a value of 2 means do not apply the adjustment to either X or Y.
10.2.6. rangectl[]
The rangectl[] array contains parameters which are used to control the automatic calculation of the plot area range.
The array contains 2 arrays, indexed as 'x' and 'y' for X and Y axis parameters respectively. The keys and valuesof the second-level arrays are:
Key Default Description
zero_magnet 0.857142 (Note this is 6/7) Strength of the zero magnet
adjust_mode T End adjustment mode: R, T, or I
adjust_amount (Dynamic; seeGetRangeEndAdjust)
Amount of end adjustment, as a fraction of theplot range
Values in this array are set with TuneXAutoRange and TuneYAutoRange. For more information see Section 4.6.4,“Automatic Range Parameters”. The values are used by CalcPlotRange.
10.2.7. tickctl[]
The tickctl[] array contains parameters which are used to control the automatic calculation of tick intervals.

PHPlot Class Member Variables
456
The array contains 2 arrays, indexed as 'x' and 'y' for X and Y axis parameters respectively. The keys and valuesof the second-level arrays are:
Key Default Description
min_ticks 8 Minimum number of tick intervals
tick_mode NULL (calculated) Tick increment calculation mode: 'decimal','binary', or 'date'
tick_inc_integer FALSE If TRUE, force the tick increment to be awhole number
Values in this array are set with TuneXAutoTicks and TuneYAutoTicks. For more information see Section 4.6.8,“Automatic Tick Increment Parameters”. The values are used by CalcStep.
10.3. PHPlot Class Constants
This section provides information about constants defined in the PHPlot class. As these are PHPconstants, they are accessed without a leading $ and cannot be expanded inside string values.
PHPlot::versionThe version constant contains the PHPlot code version as a string, for example "5.4.0". (This was addedin PHPlot-5.4.0.)
PHPlot::version_idThe version_id constant contains the PHPlot code version as an integer, using the conventional formula10000*major_version + 100*minor_version + patch_version. This was added in PHPlot-6.0.0 (with value 60000)to make it possible for the test suite to check for a minimum version.

Change Log
457
Appendix A. Change Log
This is the summary change log for the PHPlot Reference Manual. (For a more detailed list ofchanges, see the ChangeLog file in the manual's Subversion repository. For changes to PHPlot itself,see the ChangeLog file inside the PHPlot distribution.)
2015-11-02Released updated version of the manual corresponding to PHPlot-6.2.0. This documents the new plot typessquaredarea and stackedsquaredarea, and extended printf custom label formatting. Numeroussmall corrections have been made throughout the manual, including changes for PHP-7, and changes based onphpdoc comments made in the PHPlot code.
2013-05-11Released updated version of the manual corresponding to PHPlot-6.1.0. This documents the new boxes plot typefor Box Plots, and the new data-data-yx-error data type for horizontal error plots.
2013-04-03Released updated version of the manual corresponding to PHPlot-6.0.0. This is a summary of the changes:
• New Section 4.10, “Image Maps for Plot Data” on creating image maps for PHPlot images. This was previouslyan experimental feature documented in a text file Imagemaps.txt included in previous PHPlot releases.New examples were added.
• New Section 4.6, “Plot Range and Tick Increment Calculations” describes the new PHPlot-6.0.0 automaticrange and tick increment calculations in detail.
• Documented new PHPlot functions (methods) in the Function Reference: SetDrawDataBorders,SetDrawPieBorders, SetDrawYDataLabelLines, SetLegendBgColor, SetLegendColorboxBorders,SetLegendTextColor, SetPieBorderColor, SetPieDirection, SetPieStartAngle, TuneXAutoRange,TuneXAutoTicks, TuneYAutoRange, and TuneYAutoTicks.
• Added small plot images to the table of plot types in Section 3.4, “PHPlot Plot Types”.
• Documented all changes to internal functions and class variables in the Developers Guide section.
2012-04-06Released updated version of the manual corresponding to PHPlot-5.8.0. Section 4.2, “PHPlot Object Serialization”and Section 4.9, “Streaming Plots” under Chapter 4, PHPlot Advanced Topics were added, documenting newfeatures. The section on label formatting was broken apart into a separate sub-section for each formatting type,and now includes documentation for the new arguments to custom formatting callback functions.
2012-02-25Released updated version of the manual to correspond to PHPlot-5.7.0. This includes documentationfor new function DrawMessage() (with example), and new label color controls SetDataLabelColor(),SetDataValueLabelColor(), SetPieLabelColor(), and SetTickLabelColor(). The table in Plot Element Colors hasbeen expanded to include default colors.
2012-01-02Released updated version of the manual to correspond to PHPlot-5.6.0. This includes new material and examplesfor pie chart label types and formats.
2011-07-30Released updated version of the manual to correspond to PHPlot-5.5.0.

Change Log
458
2011-06-09Added a new chapter at the end of Part III, Developer's Guide to PHPlot with a list of PHPlot class constants.(Since there is only one constant, this is a very short chapter.)
2011-05-27Released updated version of the manual to correspond to PHPlot-5.4.0.
2011-01-15Released updated version of the manual to correspond to PHPlot-5.3.1.
2011-01-11Added a new section in the Advanced chapter on placing multiple plots on an image, and added a new exampleof overlay plots.
2011-01-05Added a short new section in the Advanced chapter showing how to extend the PHPlot class to customize defaultsettings.
2010-12-26New sub-section in Concepts chapter, Colors section, showing which function is used to set the color for eachplot element.
2010-12-04Released updated version of the manual to correspond to PHPlot-5.3.0.
2010-12-03Document 2 new functions to control drawing of the axis lines.
2010-11-18Restructuring. Too much advanced material was ending up in the basic programming chapter "Concepts". Thereis now a new chapter "Advanced", which includes the material on Callbacks (demoted from chapter to section),plus two sections previously in "Concepts": custom data color callback, and truecolor images. Also moved theFunctions by Category chapter after Examples, not before.
Added new section "Tuning Parameters" in the Advanced chapter, to provide more information about classvariables that can be set to adjust plot appearance.
2010-11-16Documented 3 new plot types - OHLC financial plots, with examples.
2010-10-03Released updated version of the manual to correspond to PHPlot-5.2.0.
2010-09-30Changes for new color processing. Mostly internal functions and methods, but also two new public methods wereadded for controlling title colors.
2010-09-27Document new behavior of stackedbar plots with negative values.
2010-09-25Changes for new X and Y axis position defaults.
2010-09-13Documentation was added and changes made for horizontal plot types and their new data types. (This waspreviously an experimental feature, documented in a text file included in with the PHPlot release.) Three newexamples were added, showing horizontal plot types.

Change Log
459
A terminology change was necessary due to the introduction of horizontal plots and dual use of Y data labels,which are now symmetrical with X data labels. Previously, data labels referred to labels from the data array whichwere displayed along the X axis or top edge, and Y data labels referred to the Y bar value labels displayed withinthe plot area. The manual now distinguishes these by type, not axis. Axis data labels are labels from the data arraywhich are displayed along the independent variable axis, and data value labels show the value of a data pointusing the dependent variable. The general term data labels is used to refer to both types of labels. (For example,SetXDataLabelAngle applies to data labels - both axis data labels and data value labels.)
2010-09-08Changes were made throughout the manual to support production of a PDF version. The changes should haveonly a small impact on the HTML version.
2010-08-30Released updated version of the manual to correspond to PHPlot-5.1.3.
2010-08-27Rewrote and updated sections related to TrueType font handling. Starting after PHPlot-5.1.2 this works differentlyand hopefully better.
2010-08-19Removed the Extra Data Processing section in the Concepts chapter, and removed the phplot_data.php filefrom the installation steps. This file has been removed from the release. (Reference bug report 3048267.)
2010-07-29Document the new data color customization callback with a new section in the Concepts chapter and two newexamples.
2010-06-28Released updated version of the manual to correspond to PHPlot-5.1.2.
2010-06-13New section added to PHPlot Concepts chapter on using truecolor images. The reference and developerinformation were also updated, and a new example was added.
2010-05-30Documented changes to image border and plot border functions.
2010-04-18Added a new example to the examples chapter with a complete mini-application containing a web form and formhandling script.
2010-04-03Released updated version of the manual to correspond to PHPlot-5.1.1.
2010-03-25Document new Y Data Labels for stacked bar charts.
Document new plot type 'stackedarea'.
2009-12-24Released updated version of the manual to correspond to PHPlot-5.1.0.
2009-12-14Document 4 new functions and changes to existing functions related to new controls on data labels versus ticklabels.

Change Log
460
Removed function list from Getting Started chapter, because it was out of date and duplicated material in anotherchapter.
2009-12-10Added sections to the Concepts chapter about using TrueType fonts and special characters, because it didn't seemto have been documented anywhere else.
2009-11-18Added a new section to the Callbacks chapter about using a callback for annotating a plot. This goes with a newexample added to the Examples chapter.
2009-11-06Added a new chapter to Part III Developer's Guide documenting the internal member class variables. The chapteron Callbacks has been moved from Part III up into Part I.
2009-10-12Documented SetImageBorderType('none') and Set[XY]LabelType('').
2009-07-21Updated SetNumberFormat to document a new hook variable to override locale, and fixed the example underSetXLabelType on rendering a Euro symbol.
2009-06-14Released updated version of the manual to correspond to PHPlot-5.0.7.
PHPlot license is now LGPL-2.1.
Add information to SetRGBArray about using large and custom color maps.
Updates to Developer's Guide and Reference sections to document new feature allowing partial marginspecifications in SetMarginsPixels and SetPlotAreaPixels.
2009-01-21Released updated version of the manual to correspond to PHPlot-5.0.6.
2008-09-21Changes were made for the next PHPlot release, including new label formatting types and mixed GD/TTF texttypes.
2008-07-22Reference sections were changed to add a History subsection, detailing behavior in previous releases. Thisinformation was previously in the Notes subsections, but is not usually relevant to users of the current release.
2008-01-12Update copyright year to 2008.
Updates to Part III, Developer's Guide for changes in internal functions used for text handling and margin/scaleprocessing. Updated figure showing the plot layout.
Added new chapter to Developer's Guide on the callbacks feature, and added documentation of the 3 publicfunctions used with callbacks to the Function Reference. The text is based on the Callbacks file which wasincluded with PHPlot-5.0.4 (and will removed in the next release). Although this is now documented in the manual,the callbacks feature is still considered experimental.
2007-11-22Added new section to Concepts chapter on error handling.
Change Log
461
2007-10-19Released updated version of the manual to correspond to PHPlot-5.0.4, which should be released in the next fewdays.
Added documentation for new function SetLegendStyle.
Removed use of reference assignment (=&) in all inline examples, external examples, and reference material whencreating a PHPlot object. Added note to PHPlot constructor reference explaining why.
Added documentation for new function SetNumberFormat.
Added new Part III - PHPlot Developer's Guide. This includes two layout figures and a list of internal functions.This is mostly intended as reference material for maintainers of PHPlot, but may be of use to others as well. Moretext may be added to this part in the future.
Document the requirement that style arrays use zero-based sequential integer indexes only. This includes colors,point shapes/sizes, line widths, and line styles.
2006-12-01Released updated version of the manual to correspond to PHPlot-5.0rc3. Documented new Y data labels for barcharts and line/point suppression. Add a note on how to get borderless, unshaded bars (needed due to a recentbug fix).
Updates were applied to the installation section to match the README included with 5.0rc3. Minimum PHP levelcorrected to 4.3.0, and noted that PHP 5 works, as this has now been tested. Deleted note about included examplesand documentation; these have been removed from the release.
Three examples which use random data where changed to use a fixed seed, so the results are repeatable.
A new example was added, showing a bar chart with data labels.
2006-11-11Released manual dated 2006-11-11 to sourceforge.net. This is the first release of the manual on SourceForge. Itcorresponds to PHPlot-5.0rc2 with several patches applied.
2006-09-24Conversion of manual from DocBook-SGML to DocBook-XML. Reorganized, so the reference section is nowalphabetical by function name, with a new chapter for category grouping of functions.
2005-02-27Limited release of draft manual dated 2005-02-27.
2005-02-06Limited release of draft manual dated 2005-02-06.