the physician’s role in delivery system reform - … · value-based purchasing accountable care...
TRANSCRIPT

The Physician’s Role in Delivery System Reform Dr. Patrick Conway, M.D., MSc Acting Principal Deputy Administrator, CMS Chief Medical Officer and Deputy Administrator for Innovation and Quality Director, Center for Medicare and Medicaid innovation Director, Center for Clinical Standards and Quality
April 22, 2015

2
Better Care, Smarter Spending, Healthier People
In three words, our vision for improving health delivery is about better, smarter, healthier.
If we find better ways to deliver care, pay providers, and distribute information, we can receive better care, spend our dollars more wisely, and have healthier communities, a healthier economy, and a healthier country.
We understand that it’s our role and responsibility to lead … and we will.
What we won’t do – and can’t do – is go it alone. Patients, providers, government, and business all stand to benefit if we get this right, and this shared purpose calls out for deeper partnership.
So we will continue to work across sectors for the goals we share: better care, smarter spending, and healthier people.

3
Overview
Early Results
CMS Innovation Center
Delivery System Reform and Our Goals
Quality Measurement

4
CMS support of health care Delivery System Reform will result in better care, smarter spending, and healthier people
Historical state Key characteristics Producer-centered Incentives for volume Unsustainable Fragmented Care Systems and Policies Fee-For-Service
Payment Systems
Evolving future state Key characteristics Patient-centered Incentives for outcomes Sustainable Coordinated care
Systems and Policies Value-based purchasing Accountable Care Organizations Bundled payments Medical Homes Quality/cost transparency Population-based payments
Public and
private sectors

5
Improving the way providers are incentivized, the way care is delivered, and the way information is distributed will help provide better care at lower cost across the health care system.
Encourage the integration and coordination of clinical and support services
Improve population health
Promote patient engagement through shared decision making
Pay Providers
Create transparency on cost and quality information
Bring electronic health information to the point of care for meaningful use
Focus Areas Description
Deliver Care
Distribute Information
Promote value-based payment systems – Test alternative payment models – Increase linkage of Medicaid, Medicare FFS, and other payments to value
Bring proven alternative payment models to scale
Delivery System Reform requires focusing on the way we pay providers, deliver care, and distribute information
Source: Burwell SM. Setting Value-Based Payment Goals ─ HHS Efforts to Improve U.S. Health Care. NEJM 2015 Jan 26; published online first.

6
CMS has adopted a framework that categorizes payments to providers
Description
Medicare Fee-for-Service examples
Payments are based on volume of services and not linked to quality or efficiency
Category 1: Fee for Service – No Link to Value
Category 2: Fee for Service – Link to Quality
Category 3: Alternative Payment Models Built on Fee-for-Service Architecture
Category 4: Population-Based Payment
At least a portion of payments vary based on the quality or efficiency of health care delivery
Some payment is linked to the effective management of a population or an episode of care Payments still triggered by
delivery of services, but opportunities for shared savings or 2-sided risk
Payment is not directly triggered by service delivery so volume is not linked to payment Clinicians and
organizations are paid and responsible for the care of a beneficiary for a long period (e.g., ≥1 year)
Limited in Medicare fee-for-service Majority of
Medicare payments now are linked to quality
Hospital value-based purchasing Physician Value
Modifier Readmissions /
Hospital Acquired Condition Reduction Program
Accountable Care Organizations Medical homes Bundled payments Comprehensive Primary Care
initiative Comprehensive ESRD Medicare-Medicaid Financial
Alignment Initiative Fee-For-Service Model
Eligible Pioneer Accountable Care Organizations in years 3-5 Maryland hospitals
Source: Rajkumar R, Conway PH, Tavenner M. CMS ─ engaging multiple payers in payment reform. JAMA 2014; 311: 1967-8.
7
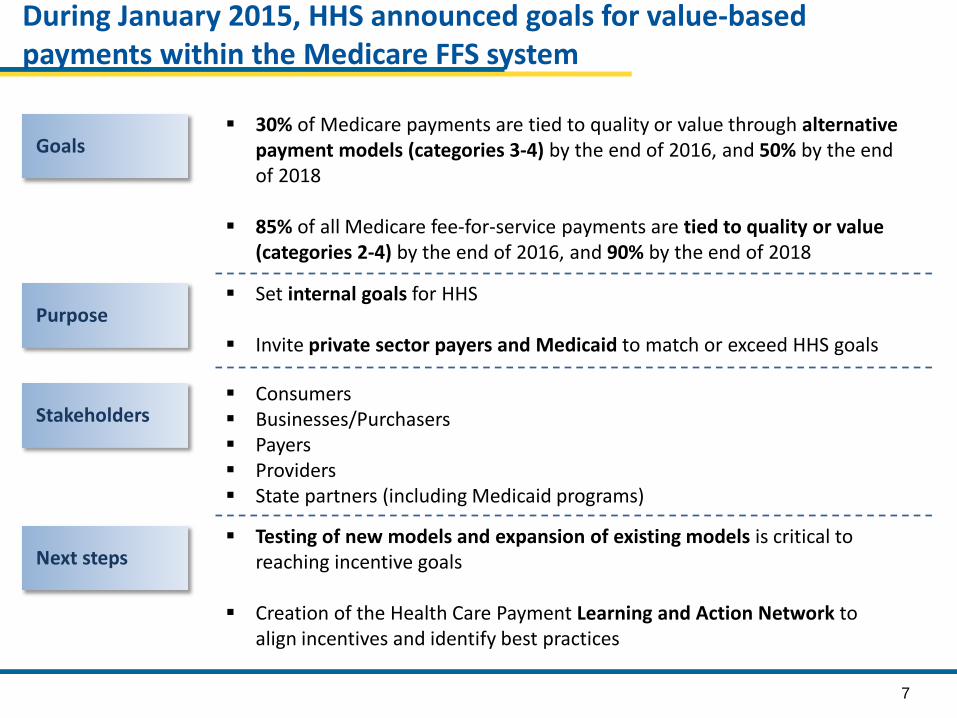
During January 2015, HHS announced goals for value-based payments within the Medicare FFS system
30% of Medicare payments are tied to quality or value through alternative payment models (categories 3-4) by the end of 2016, and 50% by the end of 2018
85% of all Medicare fee-for-service payments are tied to quality or value (categories 2-4) by the end of 2016, and 90% by the end of 2018
Goals
Purpose Set internal goals for HHS
Invite private sector payers and Medicaid to match or exceed HHS goals
Stakeholders Consumers Businesses/Purchasers Payers Providers State partners (including Medicaid programs)
Next steps Testing of new models and expansion of existing models is critical to
reaching incentive goals
Creation of the Health Care Payment Learning and Action Network to align incentives and identify best practices

8
2016
30%
85%
2018
50%
90%
Target percentage of payments in ‘FFS linked to quality’ and ‘alternative payment models’ by 2016 and 2018
2014
~20%
>80%
2011
0%
68%
Goals Historical Performance
All Medicare FFS (Categories 1-4) FFS linked to quality (Categories 2-4) Alternative payment models (Categories 3-4)

9
CMS is aligning with private sector and states to drive delivery system reform
Convening Stakeholders
Convened payers in 7 markets in Comprehensive Primary Care
Convening payers, providers, employers, consumers, and public partners through the Health Care Payment Learning and Action Network
CMS Strategies for Aligning with Private Sector and States
Incentivizing Providers
Pioneer ACOs agreements required 50% of the ACO’s business to be in value-based contracts by the end of the second program year
Partnering with States
The State Innovation Models Initiative funds testing awards and model design awards for states implementing comprehensive delivery system reform
The Maryland All-Payer Model tests the effectiveness of an all-payer rate system for hospital payments

10
Early Results
CMS Innovation Center
Delivery System Reform and Our Goals
Quality Measurement

11
Results: Per Capita Spending Growth at Historic Lows
Source: CMS Office of the Actuary
9.24%
5.99%
4.63%
7.64% 7.16%
*27.59%
1.98%
4.91% 4.15%
1.36%
2.25%
1.13% 0.35%
0%
1%
2%
3%
4%
5%
6%
7%
8%
9%
10%
11%
12%
2001 2002 2003 2004 2005 2006 2007 2008 2009 2010 2011 2012 2013
Medicare Per Capita Growth Medical CPI Growth
*Medicare Part D prescription drug benefit implementation, Jan 2006
28% 27%

12
Pioneer ACOS were designed for organizations with experience in coordinated care and ACO-like contracts
Pioneer ACOs showed improved quality outcomes Quality outperformed published benchmarks in 15/15 clinical quality measures
and 4/4 patient experience measures in year 1 and improved in year 2 Mean quality score of 85.2% in 2013 compared to 71.8% in 2012 Average performance score improved in 28 of 33 (85%) quality measures
Pioneer ACOs generated savings for 2nd year in a row $384M in program savings combined for two years† Average savings per ACO increased from $2.7 million in PY1 to $4.2 million in PY2‡
Pioneer ACOs provided higher quality and lower cost care to Medicare beneficiaries in their first two performance years
19 ACOs operating in 12 states (AZ, CA, IA, IL, MA, ME, MI, MN, NH, NY, VT, WI) reaching over 600,000 Medicare fee-for-service beneficiaries
Duration of model test: January 2012 – December 2014; 19 ACOs extended for 2 additional years
† Results from regression based analysis ‡ Results from actuarial analysis

13
CMS convenes Medicaid and commercial payers to support primary care practice transformation through enhanced, non-visit-based payments, data feedback, and learning systems
Across all 7 regions, CPC reduced Medicare Part A and B expenditures per beneficiary by $14 or 2%*
Reductions appear to be driven by initiative-wide impacts on hospitalizations, ED visits, and unplanned 30-day readmissions
Comprehensive Primary Care (CPC) is showing early positive results
7 regions (AR, OR, NJ, CO, OK, OH/KY, NY) encompassing 31 payers, nearly 500 practices, and approximately 2.5 million multi-payer patients
Duration of model test: Oct 2012 – Dec 2016
* Reductions relative to a matched comparison group and do not include the care management fees (~$20 pbpm)

14
Spotlight: Comprehensive Primary Care, SAMA Healthcare
SAMA Healthcare Services is an independent four-physician family practice located located in El Dorado, a town in rural southeast Arkansas
“A lot of the things we’re doing now are things we wanted to do in the past… We needed the front-end investment of start-up money to develop our teams and our processes”
-Practice Administrator
Services made possible by CPC investment Care management
Each Care Team consists of a doctor, a nurse practitioner, a care coordinator, and three nurses
Teams drive proactive preventive care for approximately 19,000 patients
Teams use Allscripts’ Clinical Decision Support feature to alert the team to missing screenings and lab work
Risk stratification The practice implemented the AAFP six-level risk
stratification tool Nurses mark records before the visit and
physicians confirm stratification during the patient encounter

15
Partnership for Patients contributes to quality improvements and cost savings
Ventilator-Associated Pneumonia
Early Elective Delivery
Central Line-Associated
Blood Stream Infections
Venous thromboembolic complications
Re-admissions
62.4% ↓
70.4% ↓ 12.3% ↓ 14.2% ↓ 7.3% ↓
Data shows a 17% reduction in hospital acquired conditions across all measures from 2010 – 2013 ‒ 50,000 lives saved ‒ 1.3 million patient harm events avoided ‒ $12 billion in savings
Many areas of harm dropping dramatically – patient safety improving
Leading Indicators, change from 2010 to 2013

16
Early Results
CMS Innovation Center
Delivery System Reform and Our Goals

17
The Innovation Center portfolio aligns with delivery system reform focus areas
Focus Areas CMS Innovation Center Portfolio*
Deliver Care Learning and Diffusion
‒ Partnership for Patients ‒ Transforming Clinical Practice ‒ Community-Based Care Transitions
Health Care Innovation Awards
State Innovation Models Initiative ‒ SIM Round 1 ‒ SIM Round 2 ‒ Maryland All-Payer Model
Million Hearts Initiative
Distribute Information Information to providers in CMMI models Shared decision-making required by many models
Pay Providers
Accountable Care ‒ Pioneer ACO Model ‒ Medicare Shared Savings Program (housed in Center for
Medicare) ‒ Advance Payment ACO Model ‒ Comprehensive ERSD Care Initiative
Primary Care Transformation ‒ Comprehensive Primary Care Initiative (CPC) ‒ Multi-Payer Advanced Primary Care Practice (MAPCP)
Demonstration ‒ Federally Qualified Health Center (FQHC) Advanced
Primary Care Practice Demonstration ‒ Independence at Home Demonstration ‒ Graduate Nurse Education Demonstration
Bundled Payment for Care Improvement ‒ Model 1: Retrospective Acute Care ‒ Model 2: Retrospective Acute Care Episode & Post Acute ‒ Model 3: Retrospective Post Acute Care ‒ Model 4: Prospective Acute Care ‒ Oncology Care Model
Initiatives Focused on the Medicaid ‒ Medicaid Emergency Psychiatric Demonstration ‒ Medicaid Incentives for Prevention of Chronic Diseases ‒ Strong Start Initiative ‒ Medicaid Innovation Accelerator Program
Dual Eligible (Medicare-Medicaid Enrollees) ‒ Financial Alignment Initiative ‒ Initiative to Reduce Avoidable Hospitalizations among
Nursing Facility Residents
Test and expand alternative payment models
Support providers and states to improve the delivery of care
Increase information available for effective informed decision-making by consumers and providers
* Many CMMI programs test innovations across multiple focus areas

18
Accountable Care Organizations: Participation in Medicare ACOs growing rapidly 424 ACOs have been established in the MSSP and Pioneer ACO programs 7.8 million assigned beneficiaries This includes 89 new ACOS covering 1.6 million beneficiaries assigned to the shared
saving program in 2015
ACO-Assigned Beneficiaries by County

19
The bundled payment model targets 48 conditions with a single payment for an episode of care Incentivizes providers to take accountability for both cost and quality of care Four Models
- Model 1: Retrospective acute care hospital stay only - Model 2: Retrospective acute care hospital stay plus post-acute care - Model 3: Retrospective post-acute care only - Model 4: Acute care hospital stay only
102 Awardees and 167 episode initiators in phase 2 as of January 2015
85 new awardees and 373 new episode initiators will enter phase 2 in April 2015
Bundled Payments for Care Improvement is also growing rapidly
Duration of model is scheduled for 3 years: Model 1: April 2013 to present Models 2,3,4: October 2013 to present
* Current as of January 2015

20
CMS is testing the ability of state governments to utilize policy and regulatory levers to accelerate health care transformation
Primary objectives include Improving the quality of care delivered Improving population health Increasing cost efficiency and expand value-based payment
State Innovation Model grants have been awarded in two rounds
Six round 1 model test states Eleven round 2 model test states
Twenty one round 2 model design states

21
Round 1 states are testing and Round 2 states are designing and implementing comprehensive reform plans
Round 1 States testing APMs
Arkansas
Maine
Massachusetts
Minnesota
Oregon
Vermont
Patient centered medical homes
Accountable care Episodes
Near term CMMI objectives Establish project milestones and
success metrics
Support development of states’ stakeholder engagement plans
Onboard states to Technical Assistance Solution Center and SIMergy Collaboration site
Launch State HIT Resource Center and CDC support for Population Health Plans
Round 2 States designing interventions

22
Maryland is the nation’s only all-payer hospital rate regulation system
Model will test whether effective accountability for both cost and quality can be achieved within all-payer system based upon per capita total hospital cost growth
Quality of care will be measured through Readmissions Hospital Acquired Conditions Population Health
Maryland is testing an innovative All-Payer Payment Model
Maryland has ~6 million residents*
Hospitals began moving into All-Payer Global Budgets in July 2014 - 95% of Maryland hospital revenue will be in global budgets - All 46 MD hospitals have signed agreements
Model was initiated in January 2014; Five year test period
* US census bureau estimate for 2013

23
Transforming Clinical Practice Initiative is designed to help clinicians achieve large-scale health transformation
• The model will support over 150,000 clinician practices over the next four years to improve on quality, lower costs, and enter alternative payment models
Phases of Transformation • Two network systems will be
created
1) Practice Transformation Networks: peer-based learning networks designed to coach, mentor, and assist
2) Support and Alignment Networks: provides a system for utilizing professional associations and public-private partnerships to drive improvement

24
We are focused on:
Implementation of Models
Monitoring & Optimization of Results
Evaluation and Scaling
Integrating Innovation across CMS
Portfolio analysis and launch new models to round out portfolio
Innovation Center – 2015 Looking Forward

• A new opportunity in accountable care: – More predictable financial targets; – Greater opportunities to coordinate care; – High quality standards consistent with other Medicare
programs and models. • The Model seeks to test how strong financial
incentives for ACOs can improve health outcomes and reduce expenditures for Original Medicare beneficiaries.
Next Generation ACO Model
25

• Protect Medicare FFS beneficiaries’ freedom of choice; • Create a financial model with long-term sustainability; • Use a prospectively-set benchmark that:
– Rewards quality; – Rewards both attainment of and improvement in efficiency; and – Ultimately transitions away from updating benchmarks based on
ACO’s recent expenditures; • Offer benefit enhancements that directly improve the patient
experience and support coordinated care (e.g., telehealth); • Allow beneficiaries a choice in their alignment with the ACO
– Mitigates fluctuations in aligned beneficiary populations – Respects beneficiary preferences;
• Smooth ACO cash flow and improve investment capabilities through alternative payment mechanisms (e.g. population-based payments).
Model Principles
26
Early Results
CMS Innovation Center
Delivery System Reform and Our Goals
Quality Measurement

Landscape of Quality Measurement HISTORIC • Siloed approach to quality
measurement
• No clear measure development strategy
• Process Measures with little performance variation
• Confusing and Burdensome to stakeholders
• Lack of patient voice
VISION • Align measures with the National
Quality Strategy • Develop measures meaningful to
patients and providers • Focus on outcomes, safety, patient
experience, care coordination, appropriate use, and cost
• Prioritize “cross-cutting” measures that are applicable to populations
• Align measures across CMS programs
• Expand EHR and Registry-based reporting
• Removal of measures that are no longer appropriate

Focusing on Outcomes Focusing on the end results of care and not the technical approaches that providers use to achieve the results Measure 30 day mortality rates, hospital-acquired infections, etc… Allows for local innovations to achieve high performance on outcomes

Challenges in Measuring Performance Determining indicators of outcomes that reflect national priorities Recognizing that outcomes are usually influenced by multiple factors Determining thresholds for ‘good’ performance Recognizing that Process Measures don’t always predict outcomes

Principles for Measure Development in the Future Payment Environment
• Measures should explicitly align with the CMS Quality Strategy and its goals and objectives.
• Measures should address a performance gap where there is known variation in performance, not just a measure gap.
• Patient/caregiver input is at least equally important to provider input in the development of measures.
• Focus on electronic data sources – directly from EHR and/or via registry

Principles for Measure Development (cont’d)
• Reorient and align measures around patient-centered outcomes that span across settings
• Develop measures meaningful to patients/caregivers and providers, focused on outcomes, safety, patient experience, care coordination, appropriate use, and cost.
• Monitor disparities and unintended consequences.

Critical Challenges in Measure Development
• Defining the right outcome/performance gap
• Engaging patients in the measure development process
• Advancing the science for critical measure types: PROMs, resource use, appropriate use, etc.
• Robust feasibility, reliability and validity testing
• Developing measures that reflect and assess shared accountability across settings and providers
• Reduction of provider burden and cost to reporting measures
• Length of time it takes to develop measures

Phillips RL et al: MOC, Medicare Quality Reporting, and Quality of Diabetes Care
• Compared change in performance on 12 CQMs for physicians who participated in PQRS and ABFM Performance Practice Modules (PPMs) vs. those who only did PPMs
• Results: – Each cohort improved over time – Greater improvement in performance on intermediate
outcome measures by physicians who completed both PQRS and PPMs
– Greater improvement in performance on process measures by physicians who completed PPMs only

Phillips RL et al: MOC, Medicare Quality Reporting, and Quality of Diabetes Care
• Conclusions – Participation in PPMs and PQRS is associated with
improvement on CQMs – Given the demonstrated positive impact of
participation in self-assessment through MOC and of participation in PQRS, it makes sense to align the two programs
– Alignment would allow physicians to work towards the same goals for both internal improvement and value-based incentive programs

Physician Quality Reporting Programs
36

2015 Measure Reporting Methods
• EHR Reporting for group practices and individuals
• Certified Survey Vendor Option for purposes of reporting the CG-CAHPS measures, available to group practices that register to participate in the Group Practice Reporting Option (GPRO)
• Qualified Clinical Data Registry (QCDR)
• Traditional PQRS Registry
• CMS Web Interface for group practices of 10 or more
• “G code” claims (phasing out)
37

PQRS Open Call for Measures • CMS is seeking a quality set of measures that lead to health
outcomes. • Preference will be given to outcome or intermediate outcome
measures as well as measures of patient safety and adverse events, appropriate use of diagnostics and therapeutics, care coordination and communication, patient experience and patient-reported outcomes and measures of cost and resource use.
• CMS is not accepting claims-based only reporting measures in this process.
• For detailed information on the measure submission process, access the MMS website.
38

Public Reporting by Year Targeted Date of Publication on Physician
Compare Website
Rule PQRS GPROs ACOs Patient Experience of Care Measures
Individual Eligible Professionals (EPs)
Late 2016* 2015 Physician Fee Schedule (PFS) Final Rule
All 2015 PQRS GPRO measures collected via the Web Interface, Registry, and EHR Minimum
sample size of 20 patients.
All 2015 measures reported by ACOs regardless of reporting mechanism Minimum
sample size of 20 patients.
2015 CAHPS for PQRS and CAHPS for ACOs Group practices of 2 or
more EPs and ACOs reporting via a CMS-approved certified survey vendor.
All 2015 PQRS measures collected via an EHR, Registry, or Claims
2015 QCDR measures Individual EP-
level. PQRS and Non-
PQRS measures. No first year
measures. 2015 Individual PQRS measures in support of Million Hearts.
39

40
Eliminate patient harm
Focus on better care, smarter spending, and healthier people within the population you serve
Engage in accountable care and other alternative payment contracts that move away from fee-for-service to model based on achieving better outcomes at lower cost
Invest in the quality infrastructure necessary to improve
Focus on data and performance transparency
Test new innovations and scale successes rapidly
Relentlessly pursue improved health outcomes
What can you do to help our system achieve the goals of Better Care, Smarter Spending, and Healthier People?

41
Contact Information
Dr. Patrick Conway, M.D., M.Sc. CMS Acting Principal Deputy Administrator and
CMS Chief Medical Officer 410-786-6841
41