the physics, dosimetry and microdosimetry …etheses.bham.ac.uk/4000/1/ghani13phd.pdf · the...
TRANSCRIPT
THE PHYSICS, DOSIMETRY AND MICRODOSIMETRY OF BORON NEUTRON CAPTURE THERAPY
by
ZAMIR GHANI
A thesis submitted to the University of Birmingham for the degree of DOCTOR OF PHILOSOPHY
School of Physics and Astronomy College of Engineering and Physical Sciences The University of Birmingham 2012 March 2012
University of Birmingham Research Archive
e-theses repository This unpublished thesis/dissertation is copyright of the author and/or third parties. The intellectual property rights of the author or third parties in respect of this work are as defined by The Copyright Designs and Patents Act 1988 or as modified by any successor legislation. Any use made of information contained in this thesis/dissertation must be in accordance with that legislation and must be properly acknowledged. Further distribution or reproduction in any format is prohibited without the permission of the copyright holder.
Abstract
There is a critical need to establish a clinically relevant, cell radiobiology based procedure to
benchmark clinical and pre-clinical Boron Neutron Capture Therapy (BNCT) facilities. This
data can be used to transfer safe working tolerance doses from nuclear reactor based clinical
studies using differing beam characteristiscs and applied, by way of established radiobiology
techniques, to developing accelerator based facilities.
A validated experimental and numerical procedure is described detailing macroscopic and
microscopic dose calculations forming the basis of a protocol for the pre-clinical biological
characterisation of the University of Birmingham’s BNCT facility.
Fundamental reference dosimetric measurements have been carried out at the University of
Birmingham’s accelerator based NCT facility and the Massachusetts Institute of Technology
(MIT) research reactor to characterise macroscopic and microscopic doses and derive
correction factors for the irradiation of V79 cells incubated in boric acid and irradiated as
monolayers. On and off-axis thermal neutron, fast neutron and photon doses have been
measured and calculated with standard macroscopic dosimetry techniques (foils and ion
chambers) from which normalised MCNPX calculations are used to derive perturbation
factors and off-axis corrections for cell flask irradiations.
Microdosimetric correction factors are calculated for the boron dose component using Monte
Carlo methods to simulate lithium ion and alpha particle tracks in semi-stochastic geometries
representative of cell monolayer irradiations, incubated in a medium with 50ppm boric acid.
Further simulations of recoil protons from nitrogen capture reactions allow for the calculation
of correction factors for the non-uniform distribution of the nitrogen dose at the cellular level.

ACKNOWLEDGEMENTS
I would like to thank Prof. Stuart Green for offering me the opportunity to take part in this
extraordinary study. It has quickly become one of the most important things in my life, next
to my family.
My warmest thanks are extended to my supervisors Prof. Stuart Green and Dr. Cecile
Wojnecki for their unwavering support, care and attention throughout my time at the
University. It is evident to me that I would never have been able to complete this work
without their help, due diligence and kindness.
To my friends; fellow students; colleagues, past and present, it has been an honour working
alongside you. Ben, Dan and Francesca, your company, support and advice has been
indispensable. My thanks are also extended to Arif and Adam.
This project would not have been possible without the support of Professor Cruickshank, Dr.
Detta and Dr. Ngoga and the skill of John and Greg. Last but not least, I would like to thank
Dr. Michael Wilson, Dr. Richard Hugtenburg and Prof. David Parker for an inspirational
Masters course that led me to this point in my life.
Contents Chapter 1:
INTRODUCTION ............................................................................................................................... 1
1.1 Physical Dose Delivery ..................................................................................................................... 2
1.2 Scope of the current work ................................................................................................................. 4
1.3 Additional work carried out during the research period include: ...................................................... 5
Chapter 2:
NEUTRON GENERATION, SOURCE MODELING AND THE BIRMINGHAM B S A .............. 8
2.1 Neutron Generation ........................................................................................................................... 8
2.2 Classical Kinematics ......................................................................................................................... 9
2.3 Near Threshold kinematics [Lee’s Method] .................................................................................... 13
2.4 Comparison of the existing source definition and that calculated with Lee’s method .................... 17
2.5 Beam Shaping Assembly (BSA); Materials and Cross sections ..................................................... 21
2.5.1 The Birmingham Facility ............................................................................................................. 21
2.6 An Improved Beam Shaping Assembly .......................................................................................... 24
2.6.1 Beam Figures of Merit (FOM) ..................................................................................................... 28
2.6.2 Conclusion .................................................................................................................................... 29
Chapter 3:
Beam Monitoring and Calibration ..................................................................................................... 31
3.1.1 Beam Monitors ............................................................................................................................. 31
3.1.2 Fission chamber Modelling & Simulation ................................................................................... 33
3.1.3 Neutronic Coupling ...................................................................................................................... 35
3.1.4 Experimental validation ............................................................................................................... 40
3.2 Beam Calibration ............................................................................................................................ 41
3.3 Yield Variations .............................................................................................................................. 46
3.4 Neutron Yields / ENDFB VII / SRIM ............................................................................................. 48
CHAPTER 4:
EPITHERMAL NEUTRON BEAM DOSIMETRY – FOIL ACTIVATIONS ................................ 50
4.1 Foil Dosimetry ................................................................................................................................ 50
4.2 HpGe Efficiency Calibration and Cascade summing ...................................................................... 51
4.3 Foil Correction factors .................................................................................................................... 55
4.3.1 Corrections for yield fluctuations ( ........................................................................................ 56
4.3.2 Correction for gamma self-absorption ( ................................................................................. 61
4.3.3 Neutron self-shielding effects and correction factors for foil activation measurements ( ...... 62
4.4 Thermal Neutron dose calculations from foil activations ............................................................... 70
Chapter 5:
NEUTRON INTERACTIONS AND DOSE COMPONENTS ......................................................... 75
5.1 Biologically Weighted Dose ........................................................................................................... 77
5.2 Tissue Equivalent Proportional counter measurements and analysis .............................................. 81
5.2.1 DOSE SEPARATION AND KERMA CORRECTION .............................................................. 83
5.2.2 Monitor Unit (MU)....................................................................................................................... 88
5.2.3 Normalisation ............................................................................................................................... 89
Chapter 6:
DOSIMETRY FOR CELL IRRADIATIONS AT MIT .................................................................... 90
6.1 The MIT Beam ................................................................................................................................ 90
6.2 Dosimetry via the cadmium difference method .............................................................................. 92
6.3 Beam Linearity and scalability ........................................................................................................ 94
6.4 Measured dose comparison ............................................................................................................. 96
6.5. Flask dose corrections .................................................................................................................... 99
Chapter 7:
MICRODOSIMETRIC CONSIDERATIONS IN APPLYING BNCT TO CELL RADIOBIOLOGY ......................................................................................................................................................... 103
7.1. Overview ...................................................................................................................................... 103
7.1.1 Stochastic events ........................................................................................................................ 105
7.1.2 NON charged particle equilibrium ............................................................................................. 107
7.1.3 The Boron dose .......................................................................................................................... 108
7.2 A Monte Carlo simulation ............................................................................................................. 113
7.2.1 Code Tracking Validation .......................................................................................................... 122
7.2.2 Modified Sampling/variance reduction ...................................................................................... 125
7.2.3 Results ........................................................................................................................................ 126
7.3. Experimental validation ............................................................................................................... 130
7.4 Conclusion ..................................................................................................................................... 132
Chapter 8:
THERMAL NEUTRON DOSE ...................................................................................................... 134
8.1 METHOD ...................................................................................................................................... 137
8. 2 Simulation Results 14N(n,p)14C .................................................................................................... 143
8.3 Conclusion ..................................................................................................................................... 148
Chapter 9:
CELL SURVIVAL .......................................................................................................................... 150
9.1 Birmingham Cell Survival Results ................................................................................................ 150
9.2 Modelling Cell Survival ................................................................................................................ 152
Chapter 10:
SUMMARY AND CONCLUSION ................................................................................................ 156
10.1 Foil self shielding correction factors ........................................................................................... 157
10.2 Cell Dosimetry ............................................................................................................................ 159
REFERENCES .................................................................................................................................... 164
APPENDIX A: Conference Proceedings and Publications
APPENDIX B: Design study to further optimise the Birmingham orthogonal accelerator epithermal
neutron beam
1
Chapter 1
INTRODUCTION
Brain tumours and tumours of the central nervous system form 2% of cancers in the UK. With
Grade IV Glioblastoma multiforme (GBM) having amongst the poorest prognosis, few
patients surviving more than a year.
It was proposed soon after the discovery of the neutron, by Chadwick in 1932, that neutrons
could be used as a means of treatment for deep-seated tumours.1 It was believed that this
could be done whilst sparing large doses to healthy tissue, provided that a pharmaceutical of
sufficiently high neutron capture cross section could be delivered to the target of interest.
Trials in the 1950s and 60s proved unfruitful, primarily due to the poor localised delivery of
the boronated compound and poor, very thermal, beam spectra. This led to larger than
acceptable doses being administered to healthy brain tissue. However, with the development
of Sulfhydryl Borane Na2B12H11SH (BSH) and Boronophenylalanine (BPA) the possibilities
of improved targeted therapy for Glioblastomas became viable once again.
BNCT amongst targeted cancer therapies is unique in its nature and deployment. The
localisation and time dependence of boron loading and its variable uptake in not only tumour
cells but also healthy tissue leads to a great deal of heterogeneity on both macroscopic and
microscopic estimates of boron distribution and physical dose delivered by a complex mixed
field of radiations.
In order to assess the feasibility, or even to plan clinically relevant treatments using boron
loading agents, a diverse set of disciplines is required to understand the critical needs and
effects of such a treatment. Fields including physics, nuclear engineering, biochemistry,
neuroscience, neurosurgery and radiation biology have to come together to fully plan for and
comprehend the outcomes of such a complex therapy.
1 Gordon Locher - 1936
2
The drug most apt, showing the highest intracellular selectivity and preferential uptake
between tumour and healthy tissue is Boronphenyalanine (BPA). This pharmaceutical
consists of boron, the vital target of neutron capture therapy, compounded or bonded with
phenylalanine, an essential amino acid required for normal metabolic function. Phenylalanine
transport and metabolism is known to be raised in high grade brain tumour patients and thus
serves as the ideal Trojan horse to carry a seemingly innocent, inert and non-toxic element,
which is virtually indistinguishable in its transport from its analogue amino acid, into the local
environment of a greedy and ravaging malignant tumour mass or even a single neoplastic
proliferating cell. Thus, priming it for irradiation and resulting localised cell death favourably
biased towards tumour cells.
Concentrations of BPA have been experimentally determined to be ~ 15 µg/g in healthy brain
tissue to 52.5 µg/g in tumour tissue. Clinical trials currently underway at the Queen Elizabeth
University Hospital Birmingham show the possibilites of even higher uptake ratios and add
stronger than ever support for this treatment modality.
1.1 Physical Dose Delivery
In the course of a typical BNCT treatment of GBM brain tumours, BPA is administered to the
patient intravenously or through the carotid artery, entering the circulatory system and in so
doing passes by the blood brain barrier. The blood brain barrier being a set of tightly packed
endothelial cells which separate brain matter from the circulatory system and the rest of the
body. This barrier serves to selectively transport useful biochemicals necessary for brain
function and repair whilst rejecting almost everything else. It is common for GBM patients to
have leaky blood brain barriers in and around the location of the malignancy, thus a suitably
loaded compound can be actively transported as well as passively ‘leaked’ across the brain’s
extremely resistant protective barrier.
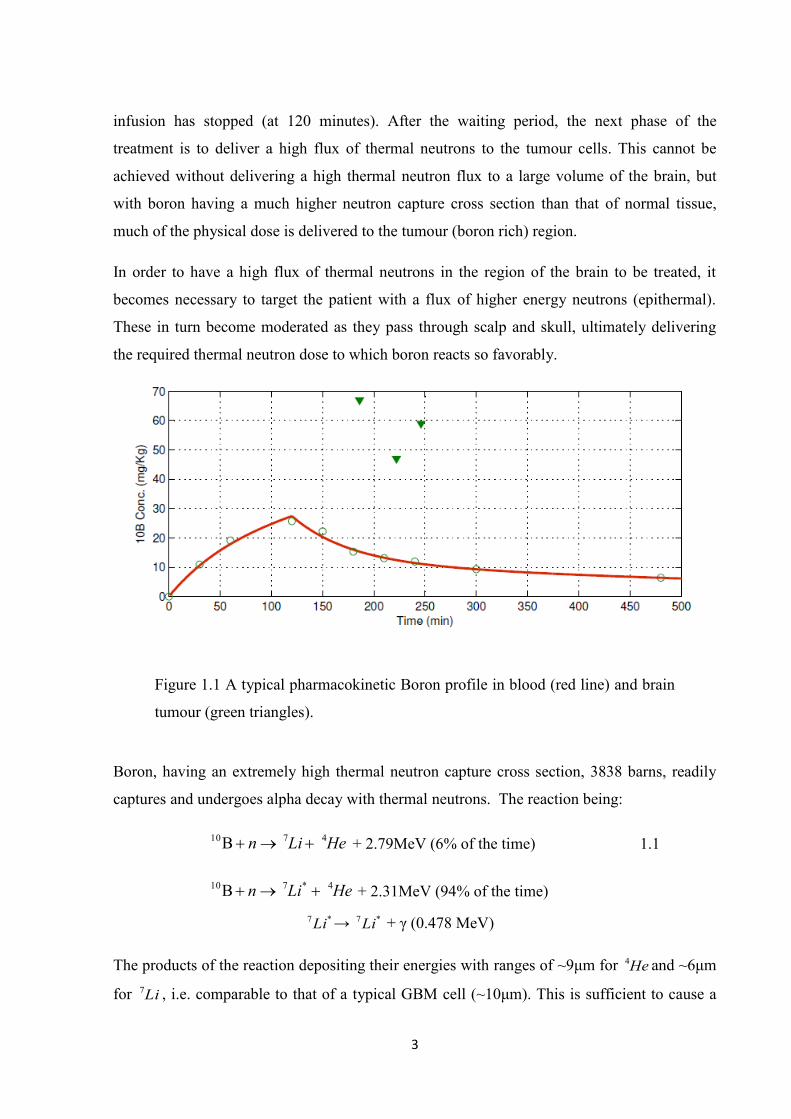
Once preferential uptake of the pharmaceutical has taken place a waiting period follows, post
infusion, for the drug levels in blood and healthy tissue to diminish whilst remaining high in
tumour tissue. Figure 1.1 shows a typical, clinically measured, BPA mediated drug profile in
blood and brain, clearly showing the levels of boron in tumour remain high long after BPA
3
infusion has stopped (at 120 minutes). After the waiting period, the next phase of the
treatment is to deliver a high flux of thermal neutrons to the tumour cells. This cannot be
achieved without delivering a high thermal neutron flux to a large volume of the brain, but
with boron having a much higher neutron capture cross section than that of normal tissue,
much of the physical dose is delivered to the tumour (boron rich) region.
In order to have a high flux of thermal neutrons in the region of the brain to be treated, it
becomes necessary to target the patient with a flux of higher energy neutrons (epithermal).
These in turn become moderated as they pass through scalp and skull, ultimately delivering
the required thermal neutron dose to which boron reacts so favorably.
Figure 1.1 A typical pharmacokinetic Boron profile in blood (red line) and brain
tumour (green triangles).
Boron, having an extremely high thermal neutron capture cross section, 3838 barns, readily
captures and undergoes alpha decay with thermal neutrons. The reaction being:
HeLin 4710 + 2.79MeV (6% of the time) 1.1
HeLin 4*710 + 2.31MeV (94% of the time)
*7Li → *7Li + γ (0.478 MeV)
The products of the reaction depositing their energies with ranges of ~9μm for He4 and ~6μm
for Li7 , i.e. comparable to that of a typical GBM cell (~10μm). This is sufficient to cause a
4
lethal dose in most cases by virtue of a double stranded DNA break. Other dose components
and microdosimetric effects will be described later in the thesis.
Before treatment planning can be embarked upon, a necessary step is to study and understand
the lethality of the complex mixed radiation field to tumour and more importantly healthy
tissue cells, which both encounter this mixed field at varying rates and mixes during therapy.
1.2 Scope of the current work
The objectives of the current study were to carry out fundamental reference dosimetric
measurements and calculate macroscopic and microscopic correction factors for cell survival
experiments in order to aid the development of a cell-based radiobiology protocol to provide
essential data on the safety and efficacy of epithermal neutron beams for BNCT in advance of
clinical trials.
To provide the macroscopic and microscopic dosimetry for the first of a validated protocol for
the pre-clinical biological characterisation of BNCT facilities of varying dose rate and beam
characteristics, by carrying out measurements at the Birmingham epithermal facility and the
variable dose rate MITR-II research reactor at the Massachusetts Institute of Technology.
The broader intent of the research being to establish a clinically relevant, cell radiobiology
based procedure for all BNCT facilities to be able to benchmark their beams against.
In order to fulfill this objective, work was carried out to analyse and refine dosimetric
practices in the only functioning, at the time of this work, accelerator delivered epithermal
neutron beam in the world.
The presence of the foils in the neutron flux which they are trying to measure causes ‘flux
depression’ and ‘self shielding’ i.e. the measured flux is perturbed as measurements are being
made. Correction factors for flux depression and self shielding for solid gold and manganese
foils have been meticulously calculated and measured for the Birmingham facility and are the
subject of a poster presented at the international Conference on Neutron Capture Therapy
[Appendix A: ‘Neutron self-shielding effects and correction factors for foil activation
5
measurements used in BNCT dosimetry’]. The results of the measured correction factors
showing extremely good agreement with simulations done with MCNPX.
Various beam monitors are used to monitor and quantify the patient dose; a Keithley
electrometer is used to measure the integrated proton current onto the target, a Geiger counter
to monitor the gamma ray field, and two fission chambers, a primary and a secondary, to
monitor the thermal neutron flux near the beam exit port. The change in trend of neutron
yields as measured by the Keithley electrometer and fission chambers over several years,
clearly shows a drift in the calibration voltage and also hints at movement in the monitor
chambers and beam collimation issues. The subject of which was presented at ICNCT13 in
the form of a poster [Appendix A: ‘BNCT beam monitoring, characterisation and dosimetry’]
addressing the stability of the monitor chambers and to relocate them to a more stable, lower
count rate environment.
A dedicated transport code capable of simulating stochastic cell geometries, with variable
boron loading was developed to calculate correction factors) for microscopic dose
inhomogeneities in boron and nitrogen distributions.
Some of the work done over the past years has been summarised and reported in the form of
three posters presented at the International conference on Neutron Capture Therapy
[ICNCT13, October 2008], and two oral presentation given at ICNCT14, November 2010, the
abstracts of which can be found in Appendix A.
1.3 Additional work carried out during the research period includes:
1. Compared (calculated) in air beam characteristics with other facilities [C-BENS
(Japan) / MIT (USA)].
2. Corrected foil measurements for yield variability and current drifts during irradiations.
3. Modeled a thermal pile irradiation facility and validate MCNP calculations in an
epithermal and thermal beam simultaneously with foil measurements.
6
4. Routinely carried out proton beam energy calibrations and calculate, the spread in the
proton energy impinging on the thin natural lithium target.
5. Collaborated with visiting research groups for SPECT imaging and ion chamber inter-
comparison.[Appendix A]
6. Assessed the possibility of employing a lead reflector over the existing graphite
reflector and look again at Lithium filters as a means of shifting the depth dose curve.
[Appendix B]
7. Calculated the impact of impurities in lead on build-up in activity in the beam shaping
assembly following extensive irradiation.
8. Carried out radiation inventory calculations on all components in the beam shaping
assembly using MCNPX and FISPACT.
9. Calculated yield losses due to ion implantation in target. [i.e. LiH targets of varying
ratios].
10. Calculated the feasibility of Accelerator based Tc generator, project carried forward
by The University of Manchester.
11. Calculated organ doses to a voxelised human phantom – VIP man, in the exisiting
Birmingham facility and study possible improvements in treatment room shielding.
[Appendix A]
12. Wrote a dedicated transport code capable of simulating stochastic cell geometries,
with variable boron loading- readily biased for LAT transporter expression, scoring
doses and survival from ion traversals.
13. Implemented the GSI Local effect model in Matlab for further analysis of preclinical
data and to optimise a mixed regimen of BNCT and radiotherapy.
14. Assisted in in-vitro boron uptake study with preloading and transport markers.
15. Assisted in the CRUK funded pharmacokinetic drug study underway at the Queen
Elizabeth, University hospital, Birmingham – tumour sample collection and
imprinting for sims analysis. [Appendix A]
7
16. Modelled the time course levels of Boron in blood from patient trials using Simulink
and Matlab to create generic open two compartmental, pharmacokinetic, models to
help analyse patient outcome and serve as a boron/blood model for future treatments.
[Appendix A]
17. Addressed and calculated corrections for cell density in addressing mass spectrometry
results of boron levels in tumour and brain around tumour samples. [Appendix A]
18. Carried out preliminary analysis of the Boron levels in extra cellular fluid (in brain)
through different means of drug delivery and blood brain barrier disruption.
[Appendix A]
19. Analysed imaging data for LAT transport and sought correlation with boron uptake in
tumour samples. [Appendix A]
20. Assisted in analysing Boron distributions in tumour/brain around tumour from SIMS
images. [Appendix A]
21. Assisted in the supervision of Masters student projects, neutron radiography, room
shielding, proportional counter measurements in neutron and proton beams/data
analysis, Fluka / MCNP BSA simulations and foil irradiations.
8
Chapter 2
NEUTRON GENERATION, SOURCE MODELLING AND
THE BIRMINGHAM BEAM SHAPING ASSEMBLY
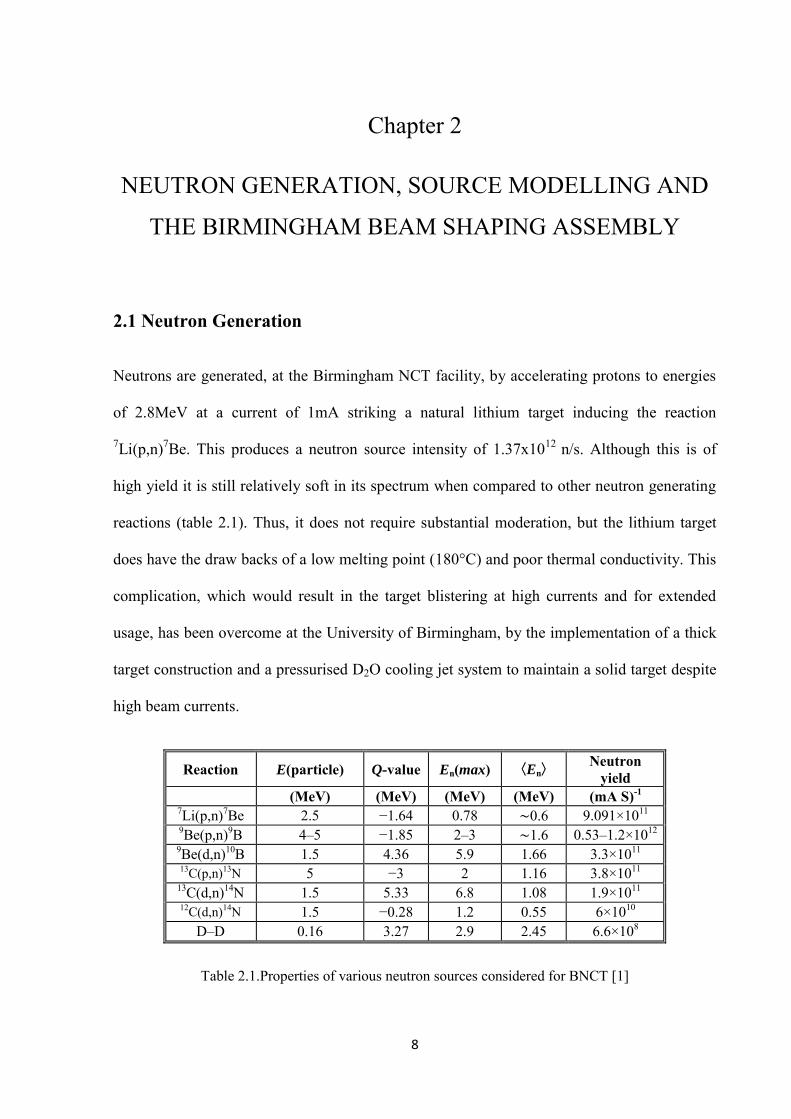
2.1 Neutron Generation
Neutrons are generated, at the Birmingham NCT facility, by accelerating protons to energies
of 2.8MeV at a current of 1mA striking a natural lithium target inducing the reaction
7Li(p,n)7Be. This produces a neutron source intensity of 1.37x10¹² n/s. Although this is of
high yield it is still relatively soft in its spectrum when compared to other neutron generating
reactions (table 2.1). Thus, it does not require substantial moderation, but the lithium target
does have the draw backs of a low melting point (180°C) and poor thermal conductivity. This
complication, which would result in the target blistering at high currents and for extended
usage, has been overcome at the University of Birmingham, by the implementation of a thick
target construction and a pressurised D2O cooling jet system to maintain a solid target despite
high beam currents.
Reaction E(particle) Q-value En(max) 〈En〉 Neutron yield
(MeV) (MeV) (MeV) (MeV) (mA S)-1 7Li(p,n)7Be 2.5 −1.64 0.78 ∼0.6 9.091×10¹¹ 9Be(p,n)9B 4–5 −1.85 2–3 ∼1.6 0.53–1.2×10¹²
9Be(d,n)10B 1.5 4.36 5.9 1.66 3.3×10¹¹ 13C(p,n)13N 5 −3 2 1.16 3.8×10¹¹
13C(d,n)14N 1.5 5.33 6.8 1.08 1.9×10¹¹ 12C(d,n)14N 1.5 −0.28 1.2 0.55 6×10¹⁰
D–D 0.16 3.27 2.9 2.45 6.6×10⁸
Table 2.1.Properties of various neutron sources considered for BNCT [1]
9
An undesired product of the 7Li(p,n)7Be reaction are the gamma rays [2]:
.478%35.10.3.53,..478*,478.
.*431.
77
77
7
raykeVaproducedecaysofOnlydoflifehalfawithLitocaptureelectronbydecaysBeiiikeVLippLireactionscatteringthebyproducedarerayskeVii
stategrounditstodecayingBebyproducedarerayskeVi
These gamma rays require attenuating and this is achieved by having a cylindrical annulus of
lead shielding surrounding the target and backing plate in the direction of the patient.
For 2.8MeV proton irradiation, neutrons emitted from the 7Li(p,n)7Be reaction have a
maximum energy of 1.2MeV and in order to be of therapeutic value, they need to be slowed
down to ~ 10keV (i.e. epithermal). Hence, there is a need for moderating material to be placed
between the target and the beam exit port, in order to maximize dose rate and achieve
workable epithermal yields. We need to confine to the best of our ability, these neutrons, and
channel them towards the beam exit port. Thus the moderator is surrounded by a ‘reflector’
material in all but the beam exit direction.
2.2 Classical Kinematics
Much research has gone into designing and optimizing the exisiting University of Brmingham
facility. The results of published research led to the current build of the pre-clinical facility
[2][3]. Amongst its unique design concepts was that a vertical beam of protons of 2.8MeV
striking a natural lithium target used to produce a horizontally extracted beam of neutrons.
This ‘beam’ of neutrons is moderated by 25cm of FluentalTM to produce an extremely good
spectrum at the beam exit port for treatment of deep seated head tumours.
10
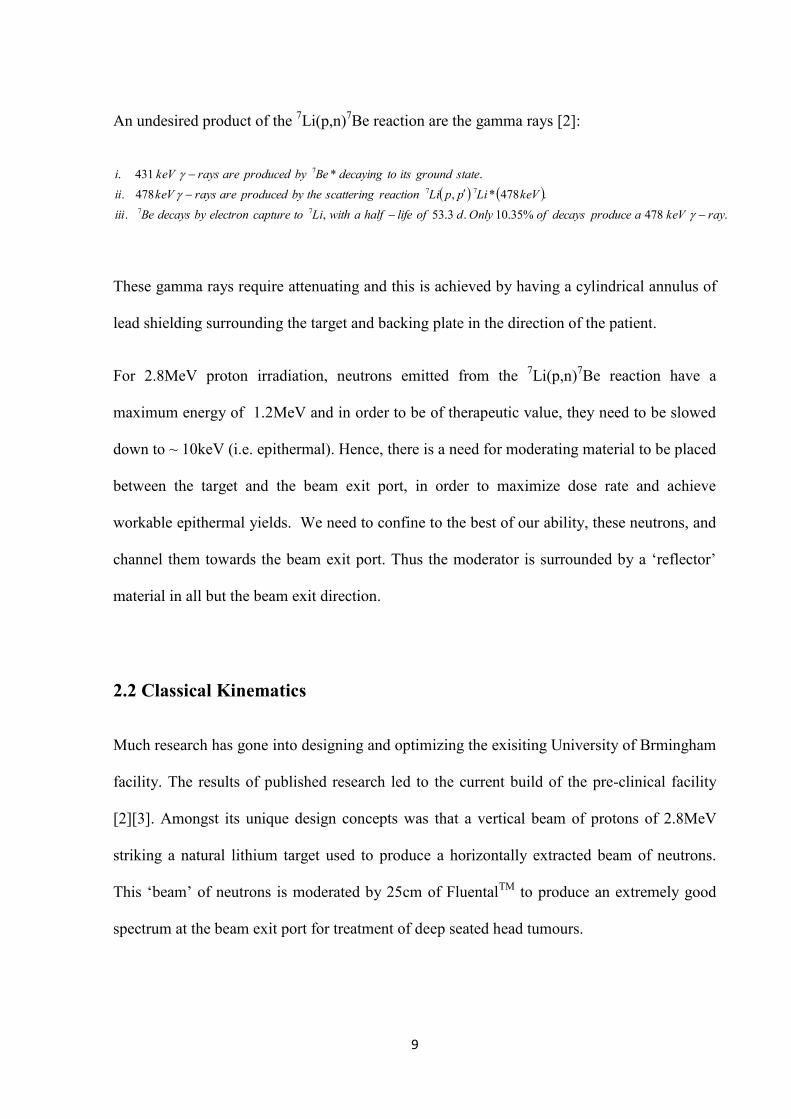
From classical kinematics it is possible to determine the neutron energies and spatial
distribution from the target as a function of incoming proton energy:
Figure 2.1. Schematic diagram for the Li(p,n)Be nuclear reaction with a proton incident
upon a lithium target nucleus at rest in the laboratory coordinate.
In the non-relativistic limit, the kinetic energy is given by T=1/2mv2=p2/2m
The inelastic scatter of two bodies in the lab frame, as depicted in figure 2.1, when conserving
linear momentum and energy, is governed by the kinematics equation:
0cos2
)1()1( 2/12/1 QTTm
mm
mm
Tmm
T npBe
np
Be
nn
Be
pp
(2.1)
Where,
pm , Lim , nm and Bem : are the masses of p, Li, neutron and Be respectively.
pT , nT : are the kinetic energies of the proton and neutron respectively.
Q : the Q-value of the reaction
initial final
p Li
Be
n
mp, vp mLi, vLi
mn, vn
mBe, vBe
11
: the angle of the outgoing product (neutron) with respect to the direction of the incident
particle.
Treating the equation as quadratic in 2/11T and solving for Tp (the proton kinetic energy) when
θ ranges from 0≤ θ ≤ 180° at 1° intervals and En from 0≤ En ≤ 1400keV at 1keV steps results
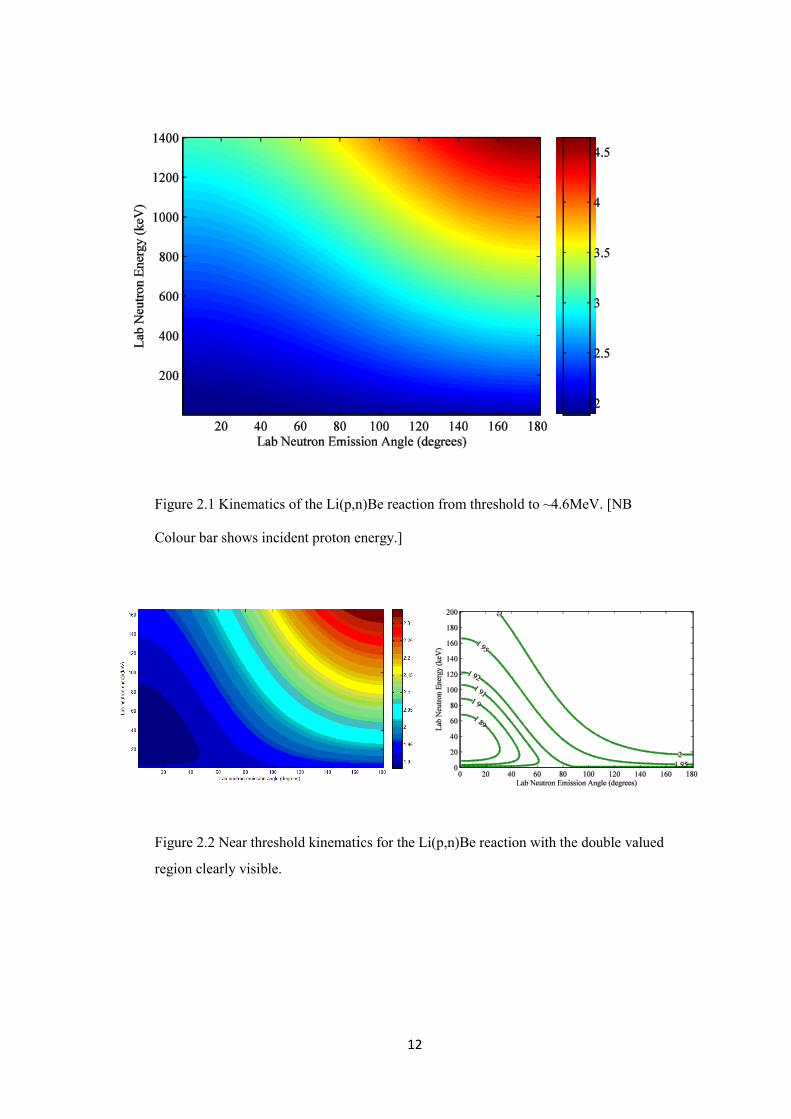
in the the (θ, En) graph shown in figure 2.2. The contours in figure 2.2 provide insight into the
double valued region near threshold (threshold=1.881MeV) where at any near threshold
proton energy (<1.92MeV, see eqn 2.1), two neutron energies can be observed at any
given/permissible angle of emission, with the angle of emission being limited to the forward
direction.
The double valued energy limit being:
MeV
Emmmmmm
mmmmE th
nppnBeBe
pnBeBep
92.1
)()(*
(2.2)
Not only do protons striking the target yield neutrons at the incoming proton energy, as
protons slow down in the target, provided their energy is greater than threshold, they can also
undergo the (p,n) nuclear reaction with a probability related to the cross section, σ(Ep), of the
interaction.
Thus, a spectrum of neutron energies is observed at any given scattering angle and any
transport calculations do indeed require a quite detailed neutron energy and spatial
distribution histograms to properly predict realistic physical outcomes of computational
experiments.
12
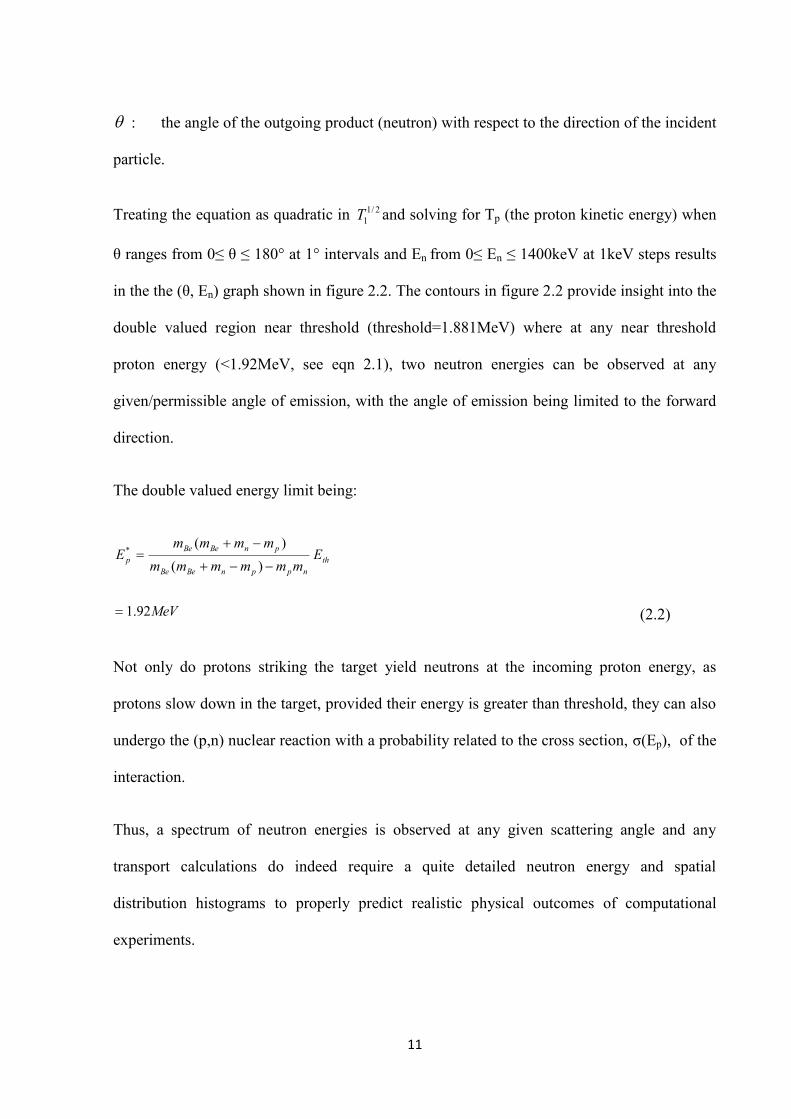
Figure 2.1 Kinematics of the Li(p,n)Be reaction from threshold to ~4.6MeV. [NB
Colour bar shows incident proton energy.]
Figure 2.2 Near threshold kinematics for the Li(p,n)Be reaction with the double valued
region clearly visible.
13
2.3 Near Threshold kinematics [Lee’s Method]
In order to derive the energy and spatial neutron distribution as required by the radiation
transport code MCNPX it was thought appropriate to follow the well known and established
methodology of Lee and Xou [4]. In which a detailed method is discussed to overcome near
threshold infinities in the Jacobians used to calculate thick target neutron yields in the energy
regime below 1.95MeV. The method employs a work around that takes the product of
Jacobians that are well behaved and do not result in anomalous regions in (θ, En) space.
Liskien and Paulsen have gathered detailed ‘recommended’ cross section data above
1.95MeV in the form of Legendre polynomials but don’t attempt to provide any such data
near threshold. Lee suggests a theoretical analytic function which he uses to interpolate
reaction cross sections near threshold and is in good agreement with available experimental
data.
The data provided by Liskien and Paulsen in the form of Legendre polynomials (eqn 2.3) is
rather sparse and given in the centre of mass frame. To establish a reasonable degree of
certainty in interpolating these values a cubic spline interpolant function was used in Matlab
to interpolate values after having recalculated them in the lab frame (adopted in the rest of the
calculation). The Matlab ‘interp2’ function interpolates between the 2-d polynomial function
expanded from the Legendre coefficients, to find values of the intermediate points required on
the (θ, En) grid space.
3
0
0 ).'(cos0'
)'(' i
ipipnpn pEA
dd
dd
(2.3)
Where,
14
)'('
dd pn is the cross section as a function of the centre of mass angle,
iA are the coefficients of the Legendre polynomials,
'(cosip ) the Legendre polynomials as a function of centre of mass scattering angle.
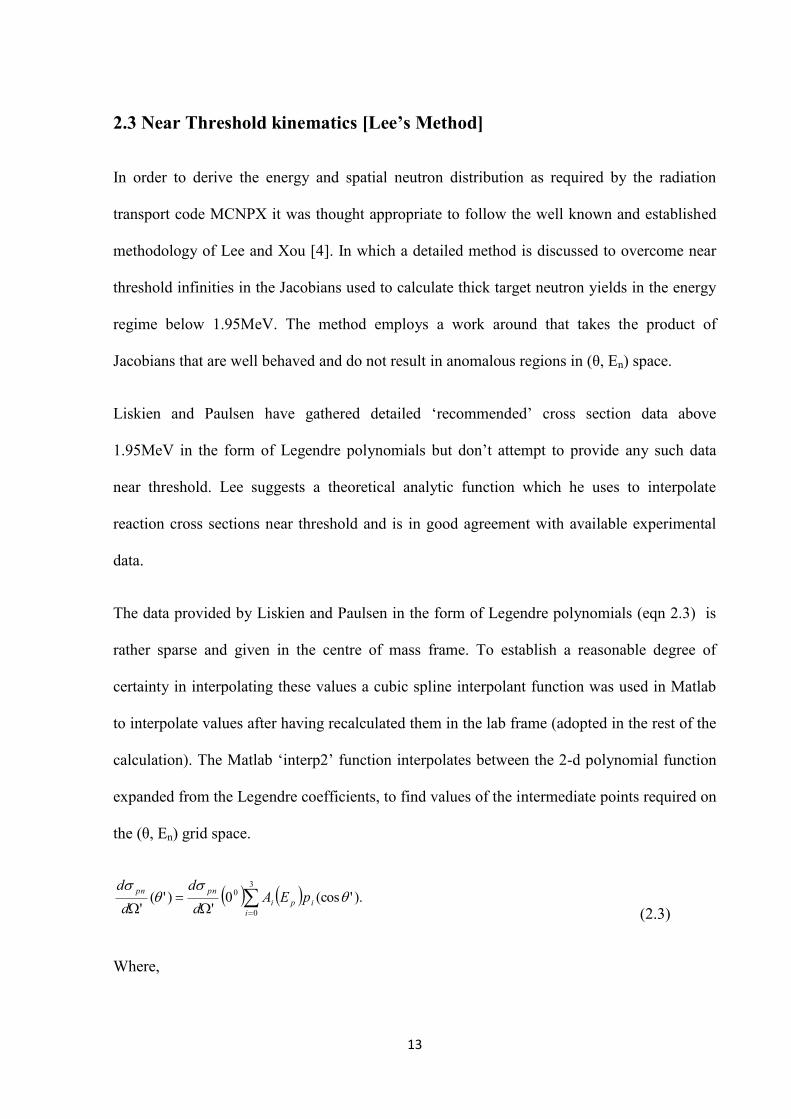
Figure 2.3 Interpolating data between 2-D grid points.
Interpolation using the Matlab built in function ‘interp2’ and using the cubic spline
interpolation method, ‘looks up the elements of XI in X, YI in Y, and, based upon their
location, returns values ZI interpolated within the elements of Z’ [35], as can bee seen in
figure 2.3.
A considerable difference is seen when using linear interpolating functions as opposed to
cubic spline interpolating functions, where linear functions calculate spectra having large
plateau regions as opposed to smooth and continuous curves.
Extensive work has been done to implement Lee’s method in computational form, whereby
neutron energy spectra and angular distributions can be readily calculated for any given
proton energy.
15
Lee’s approach can be summarized in two succinct equations; one relating to near threshold
double differential cross section calculations requiring an analytical form for the cross section
(eqn. 2.4) and another equation beyond threshold (>1.95MeV) which uses the tabulated
Legendre polynomials of recommended cross sections (eqn. 2.5).
')()(coscos'
'
2
dd
EmmmmEmmEmm
dEdE
dd
dd pn
thpnBeBepnp
pnBe
n
ppn
(2.4)
])()(cos[)1()(/cos'
' 2
20
thpnBeBepnp
pnBeBenpnBe
n
ppn
EmmmmEmmxmmmmmmmmAC
dEdE
dd
dd
(2.5)
Where:
222 sin/1 (2.6)
)()( thp
p
pnBeBe
np
EEE
mmmmmm
(2.7)
Formulas 2.4 and 2.5 are evaluated over the relevant grid points and then divided by the mass
stopping powers obtained from the transport code SRIM [5], the result multiplied by the
constant, eff
li
eANf 07 , leading to the double differential Yield in (θ, En) space (eqn. 2.8).
)/()/)(/)('/(
),( 072
dxdEdEdEdddd
eANf
EdEdYd
p
nppn
eff
lin
n
(2.8)
16
Where,
lif7 : Li-7 atomic fraction in natural lithium metal
0N : Avogadro’s number
e : electronic charge
effA : atomic weight of natural lithium metal
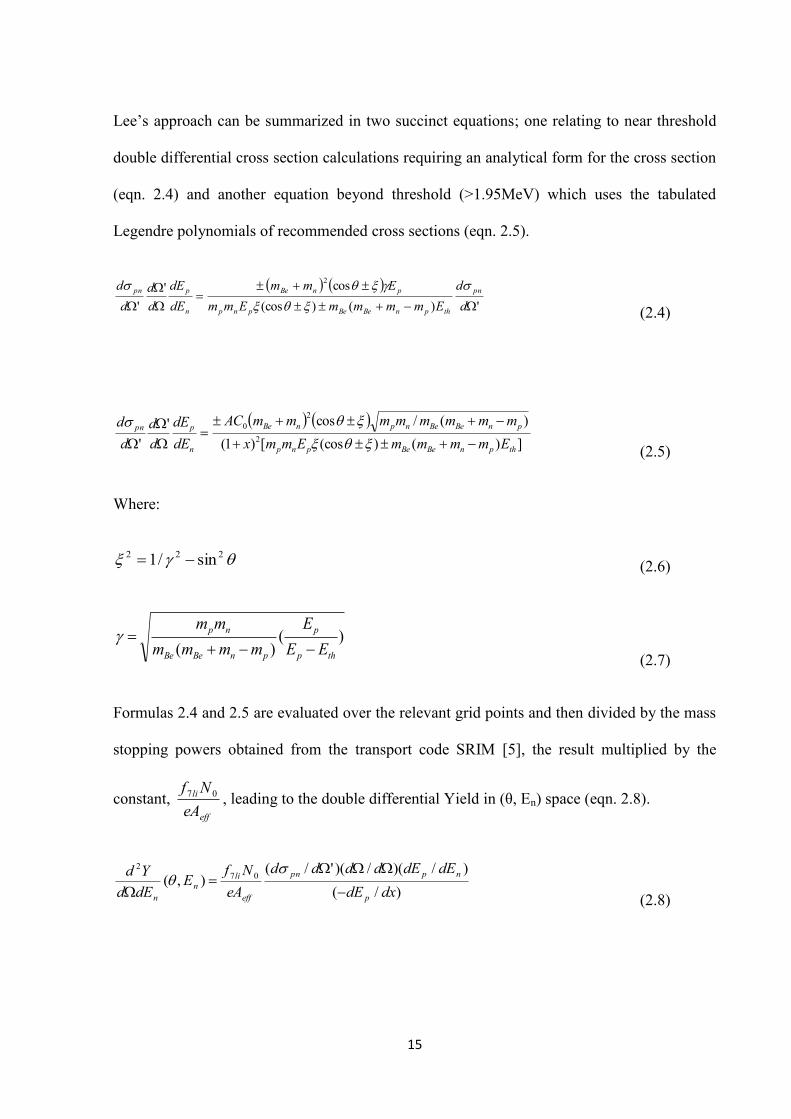
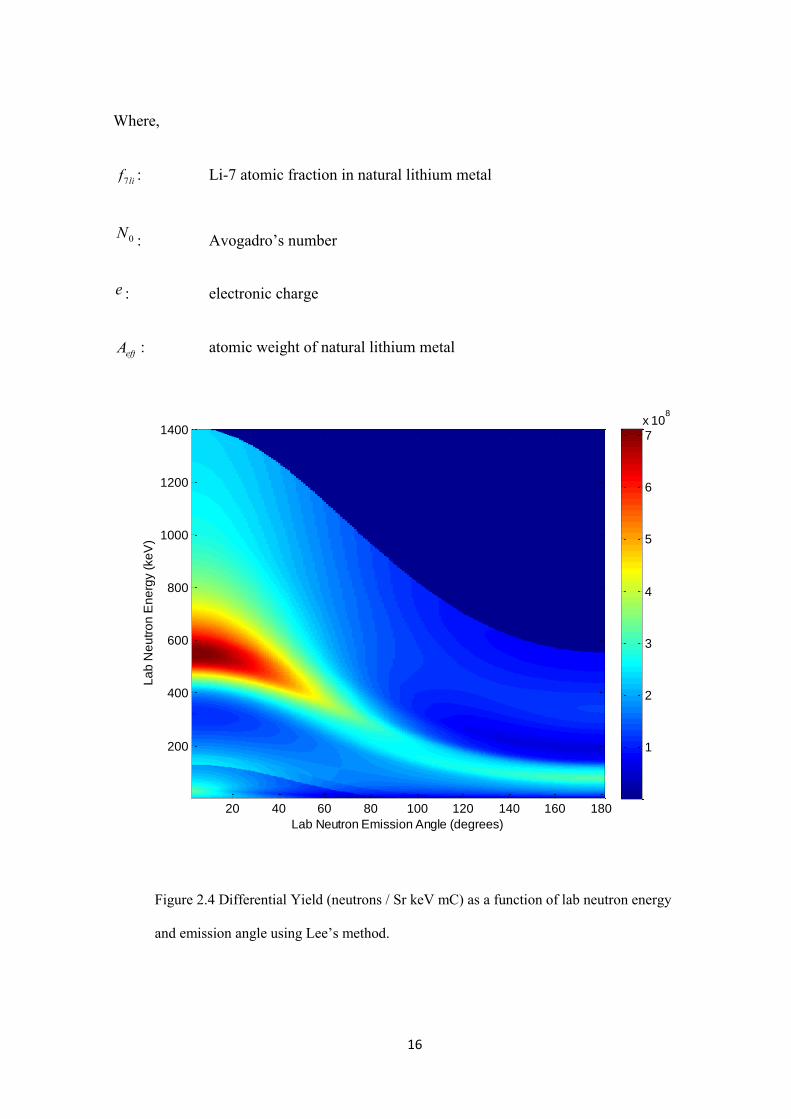
Figure 2.4 Differential Yield (neutrons / Sr keV mC) as a function of lab neutron energy
and emission angle using Lee’s method.
Lab Neutron Emission Angle (degrees)
La
b N
eu
tro
n E
ne
rgy (
ke
V)
20 40 60 80 100 120 140 160 180
200
400
600
800
1000
1200
1400
1
2
3
4
5
6
7
x 108
17
As can be seen from the above differential yield plot (figure 2.4), there exists in the interval
between 1.925MeV and 1.95 MeV proton energy (below 200keV neutron energy), a region
which falls beyond the ‘known’ theoretical resonance bound and the region where extensive
and recommended experimental data (fitted to Legendre polynomials) from Liskien and
Paulsen lies. Following the approach of Lee and others this region has been interpolated in a
best fit manner with a smoothing spline.
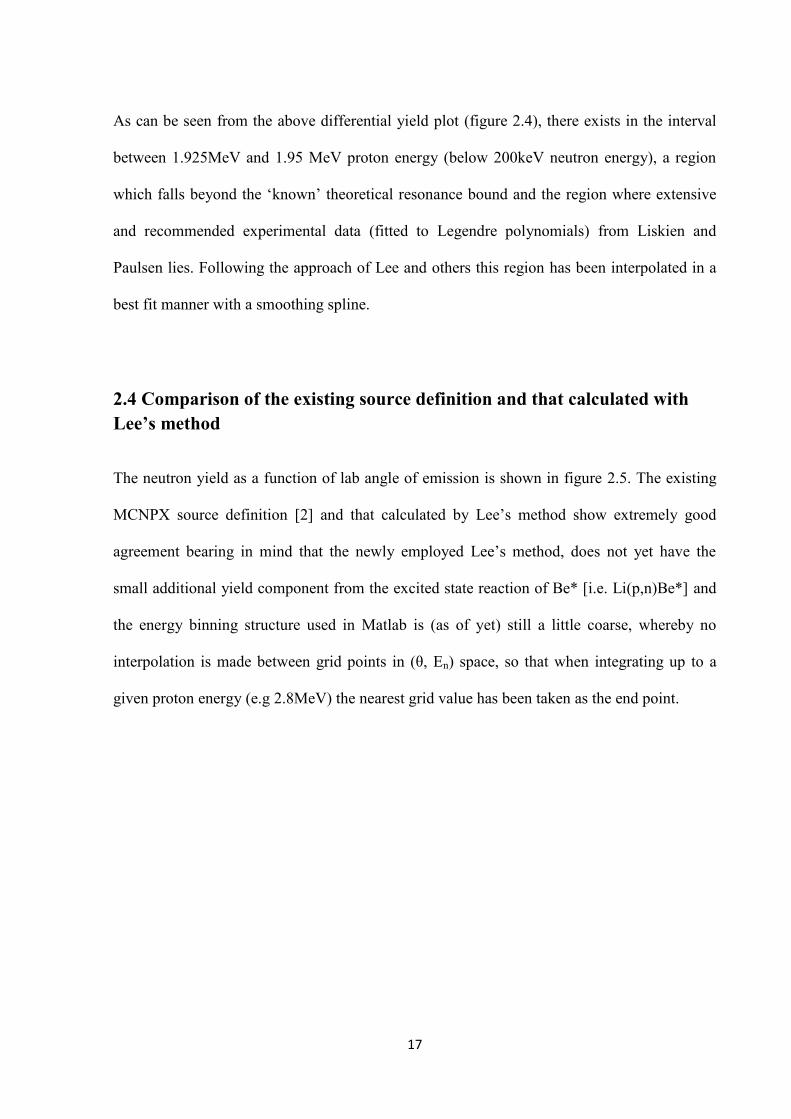
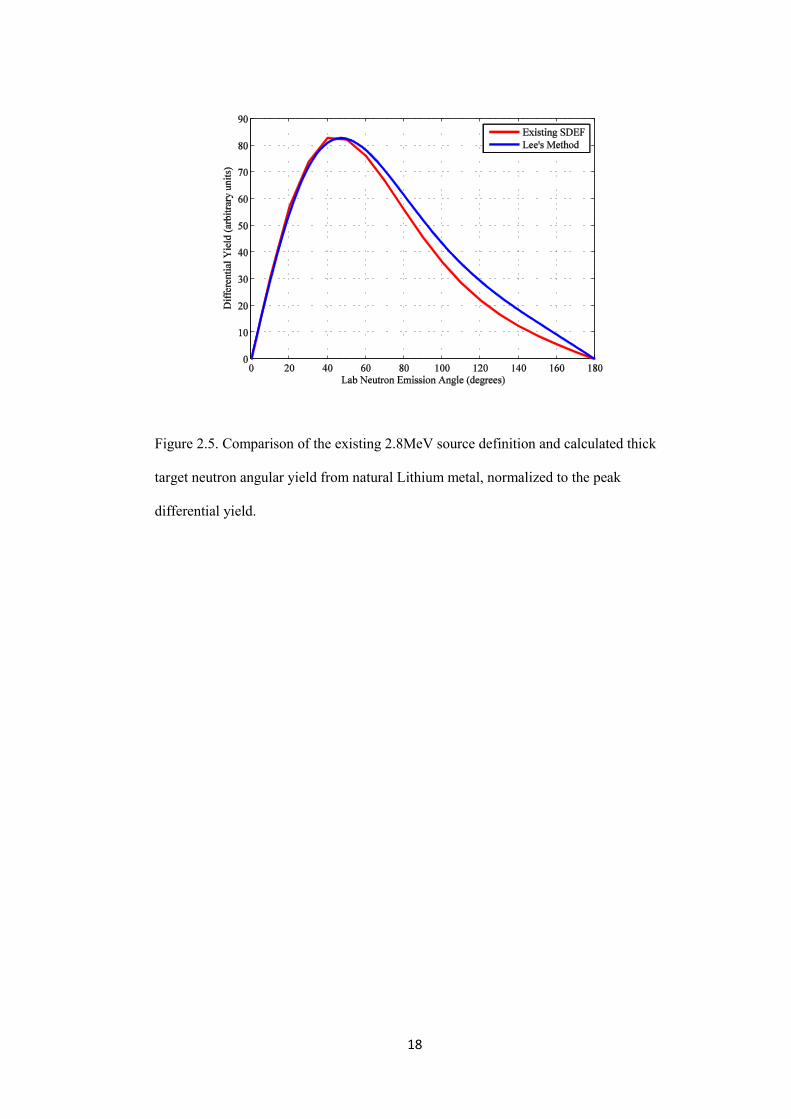
2.4 Comparison of the existing source definition and that calculated with Lee’s method
The neutron yield as a function of lab angle of emission is shown in figure 2.5. The existing
MCNPX source definition [2] and that calculated by Lee’s method show extremely good
agreement bearing in mind that the newly employed Lee’s method, does not yet have the
small additional yield component from the excited state reaction of Be* [i.e. Li(p,n)Be*] and
the energy binning structure used in Matlab is (as of yet) still a little coarse, whereby no
interpolation is made between grid points in (θ, En) space, so that when integrating up to a
given proton energy (e.g 2.8MeV) the nearest grid value has been taken as the end point.
18
Figure 2.5. Comparison of the existing 2.8MeV source definition and calculated thick
target neutron angular yield from natural Lithium metal, normalized to the peak
differential yield.
19
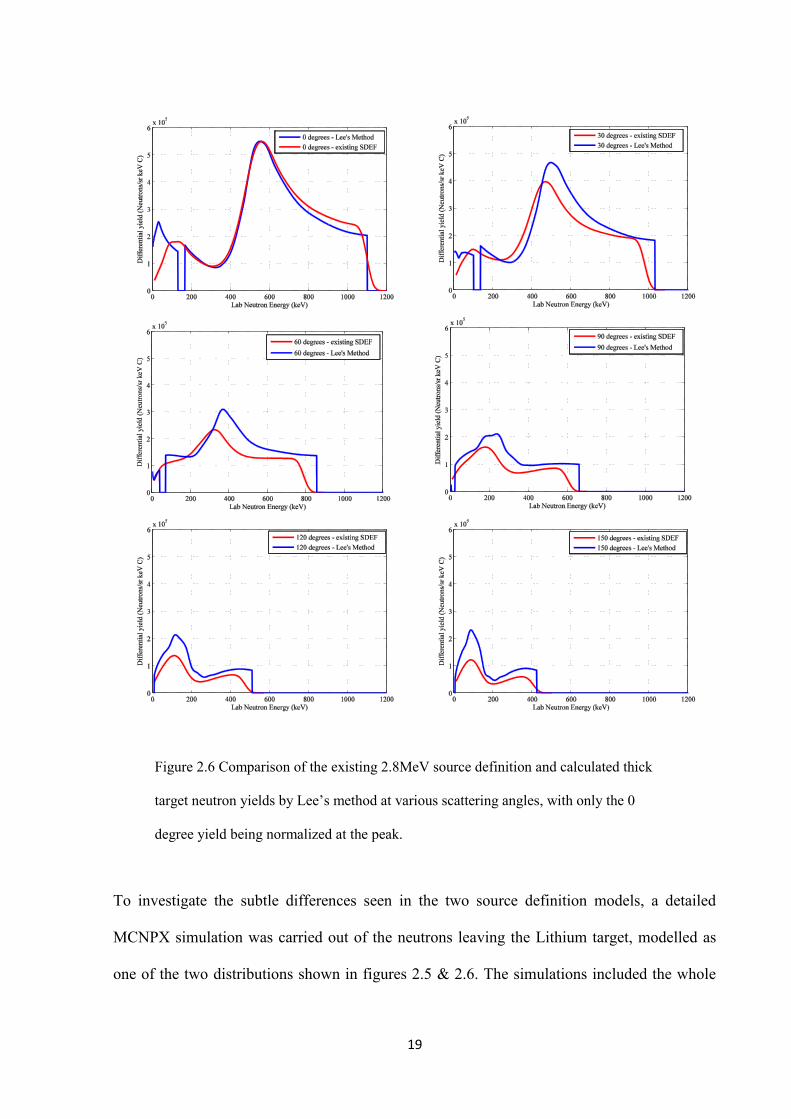
Figure 2.6 Comparison of the existing 2.8MeV source definition and calculated thick
target neutron yields by Lee’s method at various scattering angles, with only the 0
degree yield being normalized at the peak.
To investigate the subtle differences seen in the two source definition models, a detailed
MCNPX simulation was carried out of the neutrons leaving the Lithium target, modelled as
one of the two distributions shown in figures 2.5 & 2.6. The simulations included the whole
20
beam shaping assembly and were run in neutron and photon mode. Track length estimates of
flux were recorded in a simulated large water tank at the beam exit port from which photon
and neutron doses were calculated at various depths. Despite the differences between the
angular distribution of the differential yield of Allen & Beynon and Lee, the Monte Carlo
simulations show no difference in doses recorded in the water tank to within the statistical
uncertainties of the tally.
This is most likely due to the large number of interactions the average neutrons see in
reaching the phantom by which time the neutron beam is very diffuse and highly scattered.
Thus by the time the particles reach the beam exit port any subtle differences in energy and
angular distribution between the two models are lost, bearing in mind that both models share a
common neutron yield of 1.37x10¹² n/s.
21
2.5 Beam Shaping Assembly (BSA); Materials and Cross sections
2.5.1 The Birmingham Facility
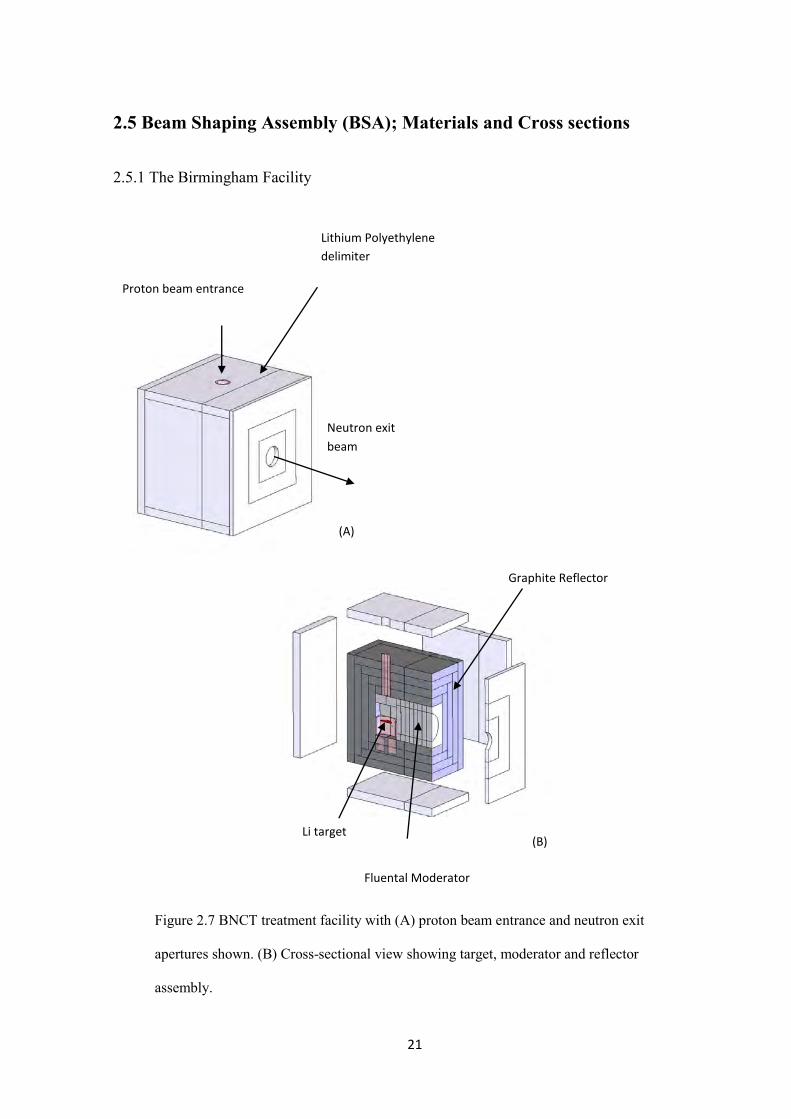
Figure 2.7 BNCT treatment facility with (A) proton beam entrance and neutron exit
apertures shown. (B) Cross-sectional view showing target, moderator and reflector
assembly.
Neutron exit
beam
Proton beam entrance
Lithium Polyethylene
delimiter
(A)
(B) Li target
Fluental Moderator
Graphite Reflector
22
Figure 2.7 shows the current Birmingham facility with FluentalTM moderator and graphite
reflector materials. FluentalTM is a patented composite, which has been used for many years in
the Finnish, reactor based, clinical BNCT facility as a moderator material. It comprises of
69% AlF, 30% Al, and 1% LiF. It has relatively high inelastic scattering cross-sections for its
first and second excited states (above 100keV). These high cross-sections are efficient in
losing large amounts of energy, thus having the ability to rapidly moderate the beam to less
than 100keV.
Below 100keV elastic scattering dominates, and it then becomes important for the moderating
material not to cause the lower energy neutrons to lose too much energy in any single
collision, nor to retain too much energy. The former causing neutrons energies to fall below
those required and the latter requiring greater lengths of moderator.
As we have a broad spectrum of neutron energies from our accelerator driven charge stripping
reaction, the material of choice has to posses a combination of properties, they being:
High inelastic scattering cross section between our maximum neutron energy
(1.2MeV) down to the elastic scattering energies (~100keV)
High elastic scattering cross sections down to epithermal energies
Low epithermal and low fast neutron absorption cross sections.
23
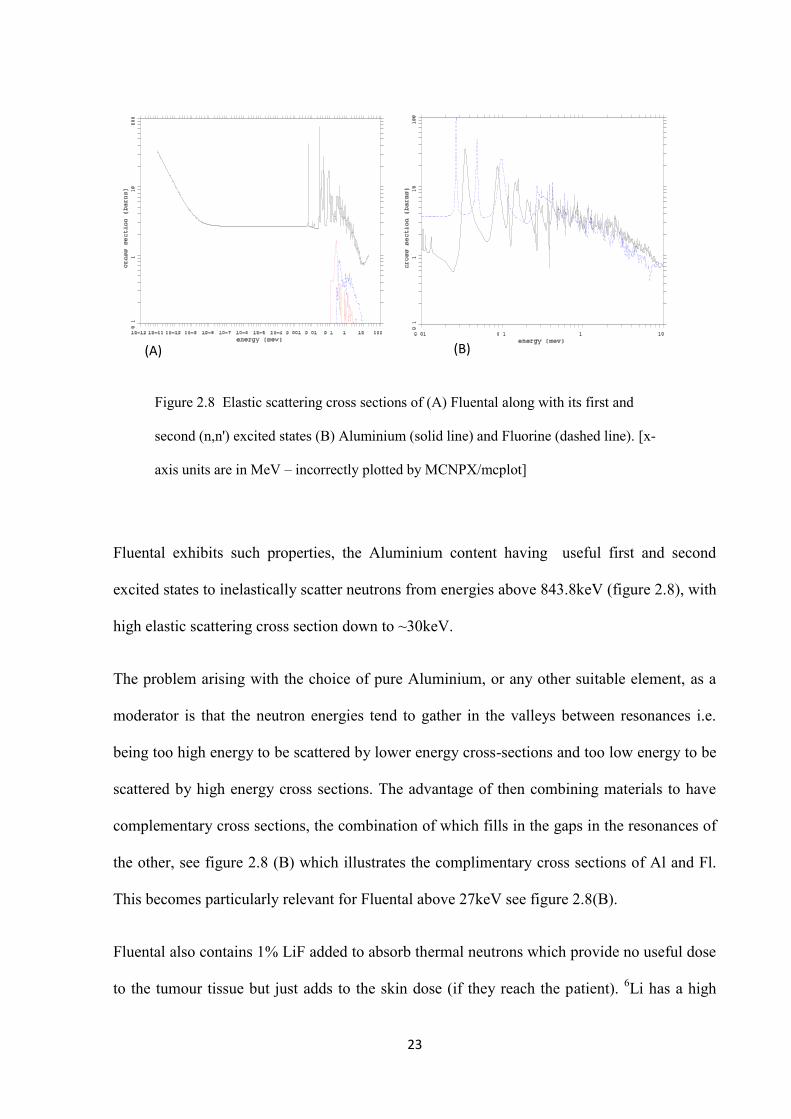
Figure 2.8 Elastic scattering cross sections of (A) Fluental along with its first and
second (n,n') excited states (B) Aluminium (solid line) and Fluorine (dashed line). [x-
axis units are in MeV – incorrectly plotted by MCNPX/mcplot]
Fluental exhibits such properties, the Aluminium content having useful first and second
excited states to inelastically scatter neutrons from energies above 843.8keV (figure 2.8), with
high elastic scattering cross section down to ~30keV.
The problem arising with the choice of pure Aluminium, or any other suitable element, as a
moderator is that the neutron energies tend to gather in the valleys between resonances i.e.
being too high energy to be scattered by lower energy cross-sections and too low energy to be
scattered by high energy cross sections. The advantage of then combining materials to have
complementary cross sections, the combination of which fills in the gaps in the resonances of
the other, see figure 2.8 (B) which illustrates the complimentary cross sections of Al and Fl.
This becomes particularly relevant for Fluental above 27keV see figure 2.8(B).
Fluental also contains 1% LiF added to absorb thermal neutrons which provide no useful dose
to the tumour tissue but just adds to the skin dose (if they reach the patient). 6Li has a high
(A) (B)
24
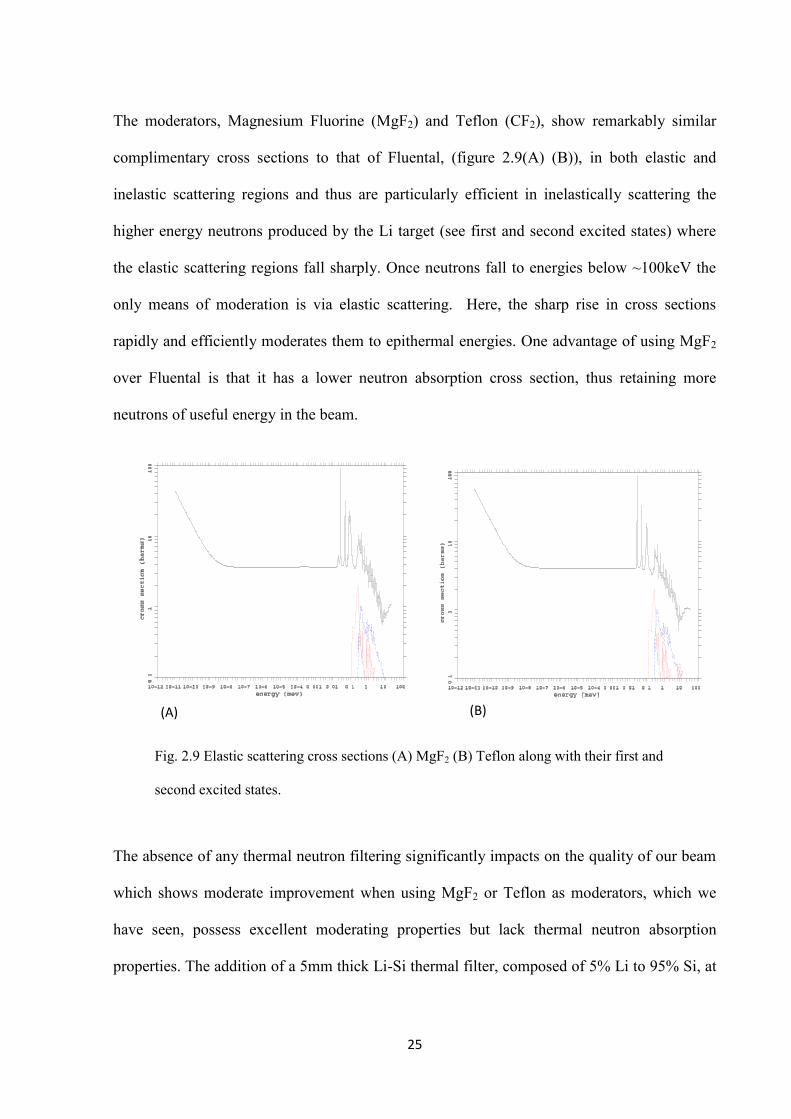
thermal neutron capture cross section (see fig. 2.10). This not only serves to reduce the
thermal neutron contamination but also reduces the gamma contamination which is caused by
thermal neutron capture by 27Al to produce 27Al(n,γ)28Al, with gamma rays of 7.73MeV. The
28Al decays with a half-life of 2.24 minutes producing further 1.799MeV Gamma rays.
The thermal neutron capture in Li does not produce the same unwanted gamma effect as in
Al. The neutron capture results in 6Li(n,α)3H, the products of the reaction being alpha
particles and tritium, which are not as penetrating as photons hence requiring relatively little
shielding.
2.6 An Improved Beam Shaping Assembly
Extensive re-modelling work has been carried out using the Monte Carlo transport code
MCNPX. Results of simulations were presented in the form of a poster at ICNCT 13,
[Appendix B]. A brief outline and summary of which follows.
The current Birmingham facility has a 25.1cm FLUENTAL™ moderator between the target
and beam exit port, which provides an extremely good beam profile in phantom. The aims of
this study were to compare the merits of FLUENTAL™ to MgF2 and Teflon moderators, and
to assess the effects of Graphite and Lead reflectors on designing and building an optimal
facility.
Published findings indicate that MgF2 might serve as a better moderating material in
accelerator driven systems over other materials more commonly used [6]. Various moderator
and reflector materials have been assessed for their impact on improved therapeutic depth
dose profiles.
25
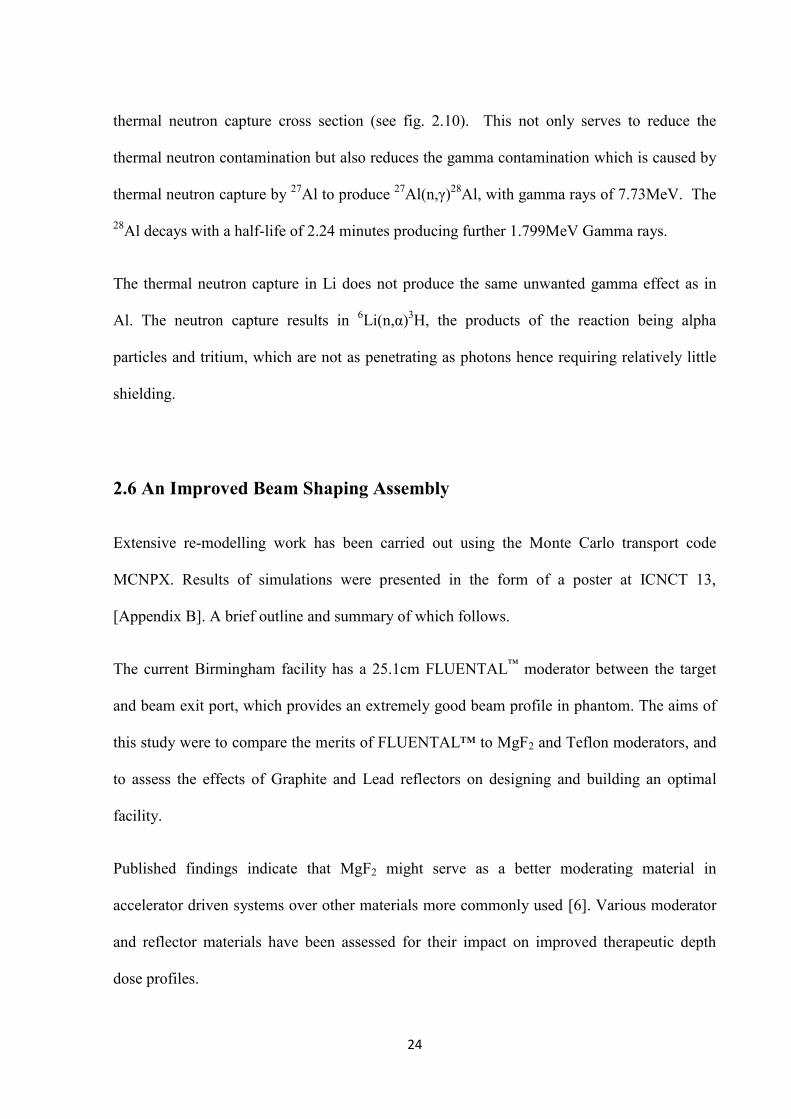
The moderators, Magnesium Fluorine (MgF2) and Teflon (CF2), show remarkably similar
complimentary cross sections to that of Fluental, (figure 2.9(A) (B)), in both elastic and
inelastic scattering regions and thus are particularly efficient in inelastically scattering the
higher energy neutrons produced by the Li target (see first and second excited states) where
the elastic scattering regions fall sharply. Once neutrons fall to energies below ~100keV the
only means of moderation is via elastic scattering. Here, the sharp rise in cross sections
rapidly and efficiently moderates them to epithermal energies. One advantage of using MgF2
over Fluental is that it has a lower neutron absorption cross section, thus retaining more
neutrons of useful energy in the beam.
Fig. 2.9 Elastic scattering cross sections (A) MgF2 (B) Teflon along with their first and
second excited states.
The absence of any thermal neutron filtering significantly impacts on the quality of our beam
which shows moderate improvement when using MgF2 or Teflon as moderators, which we
have seen, possess excellent moderating properties but lack thermal neutron absorption
properties. The addition of a 5mm thick Li-Si thermal filter, composed of 5% Li to 95% Si, at
(A) (B)
26
the beam’s exit port significantly shifts depth dose curves in favour of an improved ‘quality’
beam, in terms of penetration, for both these materials and, surprisingly, even Fluental. Thus
showing the need for a good thermal neutron filter.
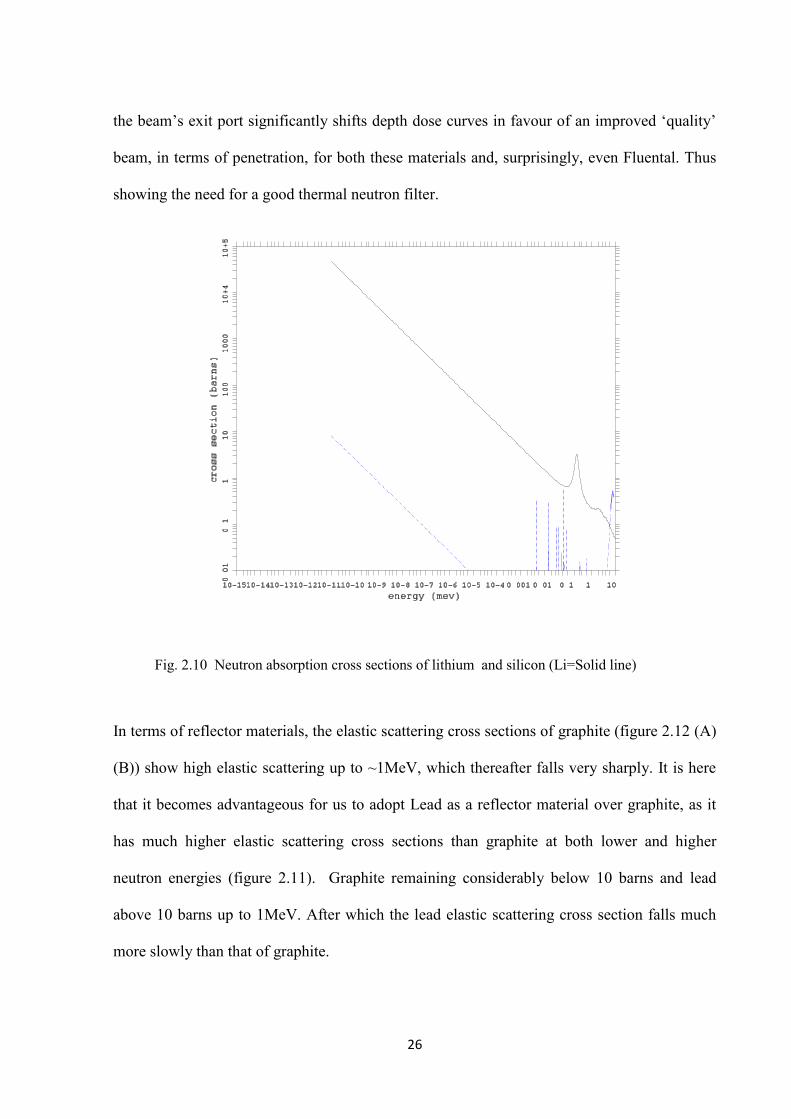
Fig. 2.10 Neutron absorption cross sections of lithium and silicon (Li=Solid line)
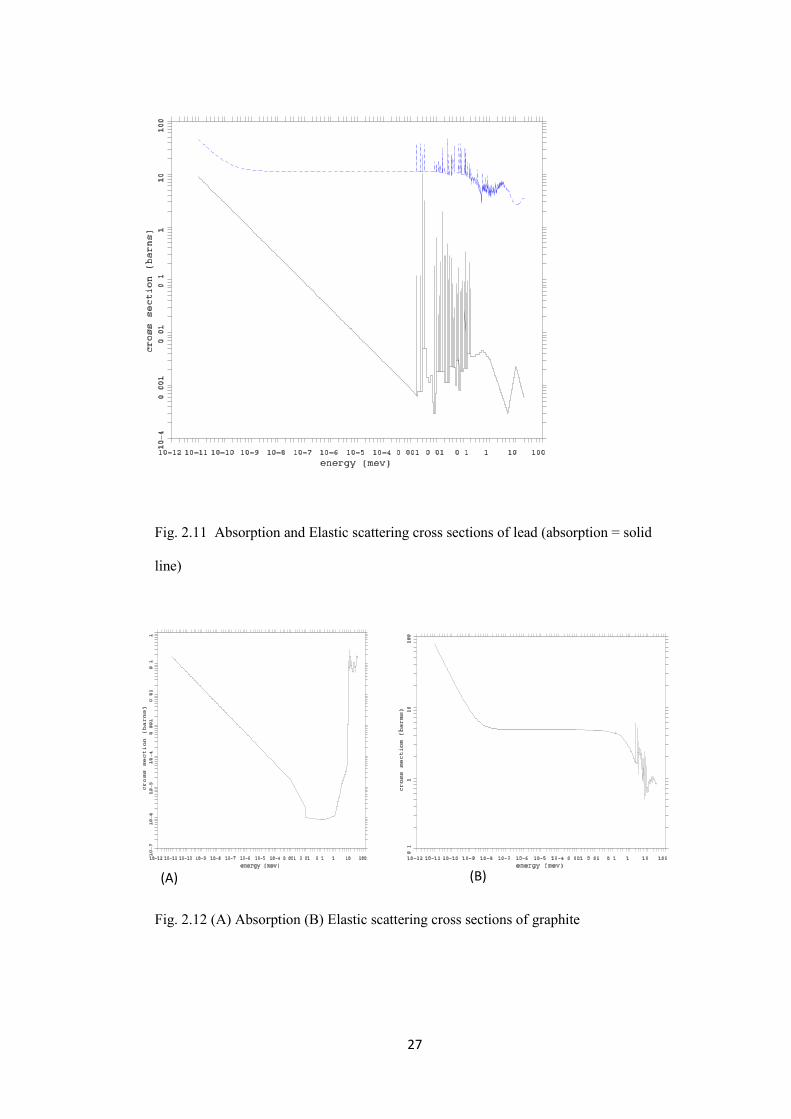
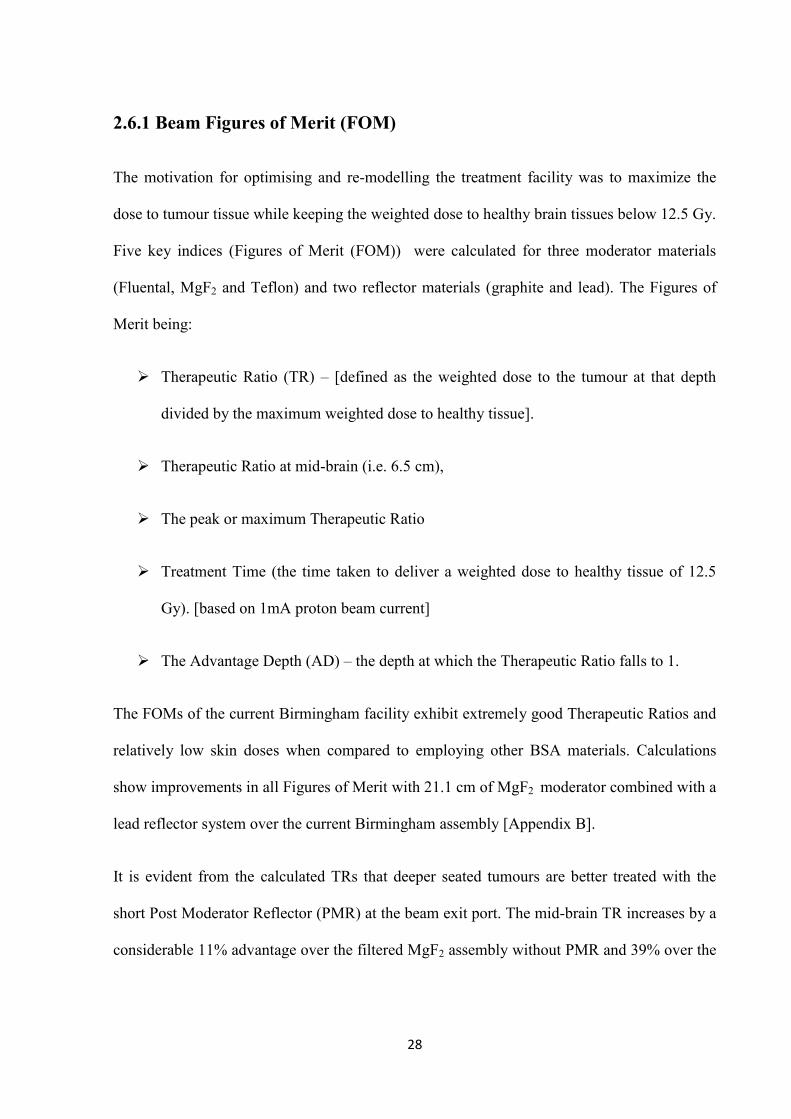
In terms of reflector materials, the elastic scattering cross sections of graphite (figure 2.12 (A)
(B)) show high elastic scattering up to ~1MeV, which thereafter falls very sharply. It is here
that it becomes advantageous for us to adopt Lead as a reflector material over graphite, as it
has much higher elastic scattering cross sections than graphite at both lower and higher
neutron energies (figure 2.11). Graphite remaining considerably below 10 barns and lead
above 10 barns up to 1MeV. After which the lead elastic scattering cross section falls much
more slowly than that of graphite.
27
Fig. 2.11 Absorption and Elastic scattering cross sections of lead (absorption = solid
line)
Fig. 2.12 (A) Absorption (B) Elastic scattering cross sections of graphite
(A) (B)
28
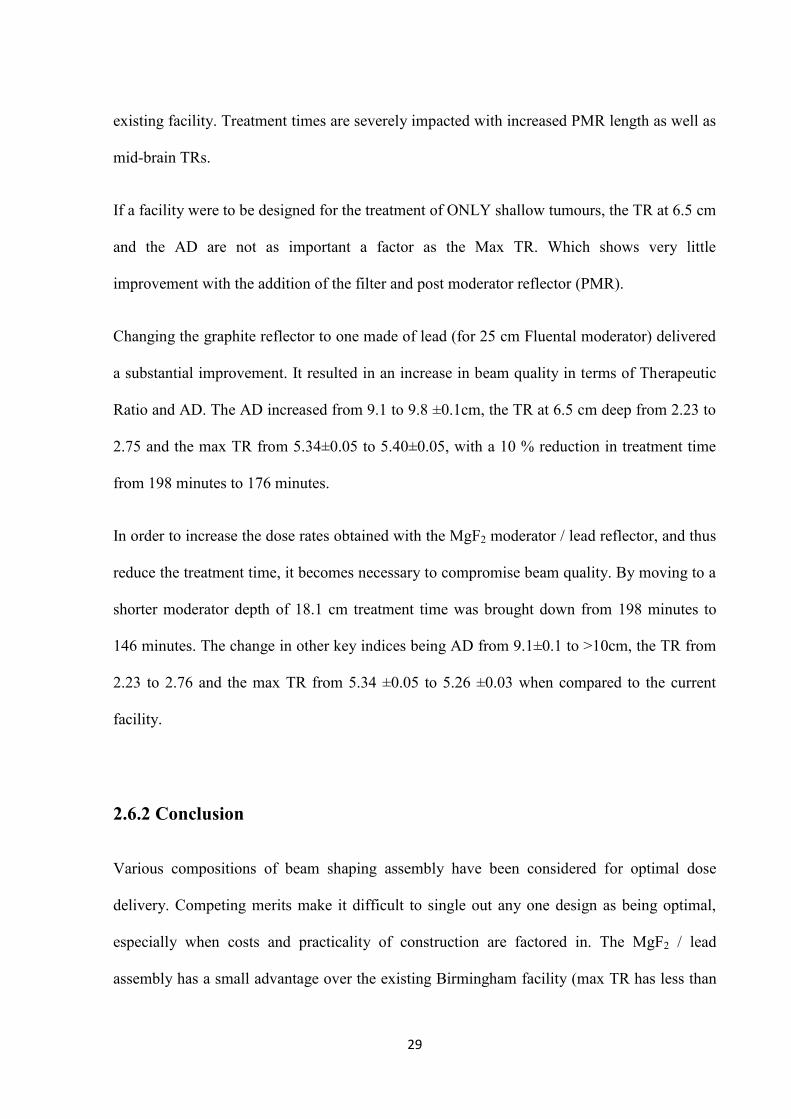
2.6.1 Beam Figures of Merit (FOM)
The motivation for optimising and re-modelling the treatment facility was to maximize the
dose to tumour tissue while keeping the weighted dose to healthy brain tissues below 12.5 Gy.
Five key indices (Figures of Merit (FOM)) were calculated for three moderator materials
(Fluental, MgF2 and Teflon) and two reflector materials (graphite and lead). The Figures of
Merit being:
Therapeutic Ratio (TR) – [defined as the weighted dose to the tumour at that depth
divided by the maximum weighted dose to healthy tissue].
Therapeutic Ratio at mid-brain (i.e. 6.5 cm),
The peak or maximum Therapeutic Ratio
Treatment Time (the time taken to deliver a weighted dose to healthy tissue of 12.5
Gy). [based on 1mA proton beam current]
The Advantage Depth (AD) – the depth at which the Therapeutic Ratio falls to 1.
The FOMs of the current Birmingham facility exhibit extremely good Therapeutic Ratios and
relatively low skin doses when compared to employing other BSA materials. Calculations
show improvements in all Figures of Merit with 21.1 cm of MgF2 moderator combined with a
lead reflector system over the current Birmingham assembly [Appendix B].
It is evident from the calculated TRs that deeper seated tumours are better treated with the
short Post Moderator Reflector (PMR) at the beam exit port. The mid-brain TR increases by a
considerable 11% advantage over the filtered MgF2 assembly without PMR and 39% over the
29
existing facility. Treatment times are severely impacted with increased PMR length as well as
mid-brain TRs.
If a facility were to be designed for the treatment of ONLY shallow tumours, the TR at 6.5 cm
and the AD are not as important a factor as the Max TR. Which shows very little
improvement with the addition of the filter and post moderator reflector (PMR).
Changing the graphite reflector to one made of lead (for 25 cm Fluental moderator) delivered
a substantial improvement. It resulted in an increase in beam quality in terms of Therapeutic
Ratio and AD. The AD increased from 9.1 to 9.8 ±0.1cm, the TR at 6.5 cm deep from 2.23 to
2.75 and the max TR from 5.34±0.05 to 5.40±0.05, with a 10 % reduction in treatment time
from 198 minutes to 176 minutes.
In order to increase the dose rates obtained with the MgF2 moderator / lead reflector, and thus
reduce the treatment time, it becomes necessary to compromise beam quality. By moving to a
shorter moderator depth of 18.1 cm treatment time was brought down from 198 minutes to
146 minutes. The change in other key indices being AD from 9.1±0.1 to >10cm, the TR from
2.23 to 2.76 and the max TR from 5.34 ±0.05 to 5.26 ±0.03 when compared to the current
facility.
2.6.2 Conclusion
Various compositions of beam shaping assembly have been considered for optimal dose
delivery. Competing merits make it difficult to single out any one design as being optimal,
especially when costs and practicality of construction are factored in. The MgF2 / lead
assembly has a small advantage over the existing Birmingham facility (max TR has less than
30
a 2% advantage) and shorter treatment time, but exhibits a higher skin dose. In light of this
study it is evident that replacing the current graphite reflector with one made of lead and to
add an optional lithium filter to treat deeper seated tumours is the optimal way forward for the
Birmingham facility.
31
Chapter 3
Beam Monitoring and Calibration
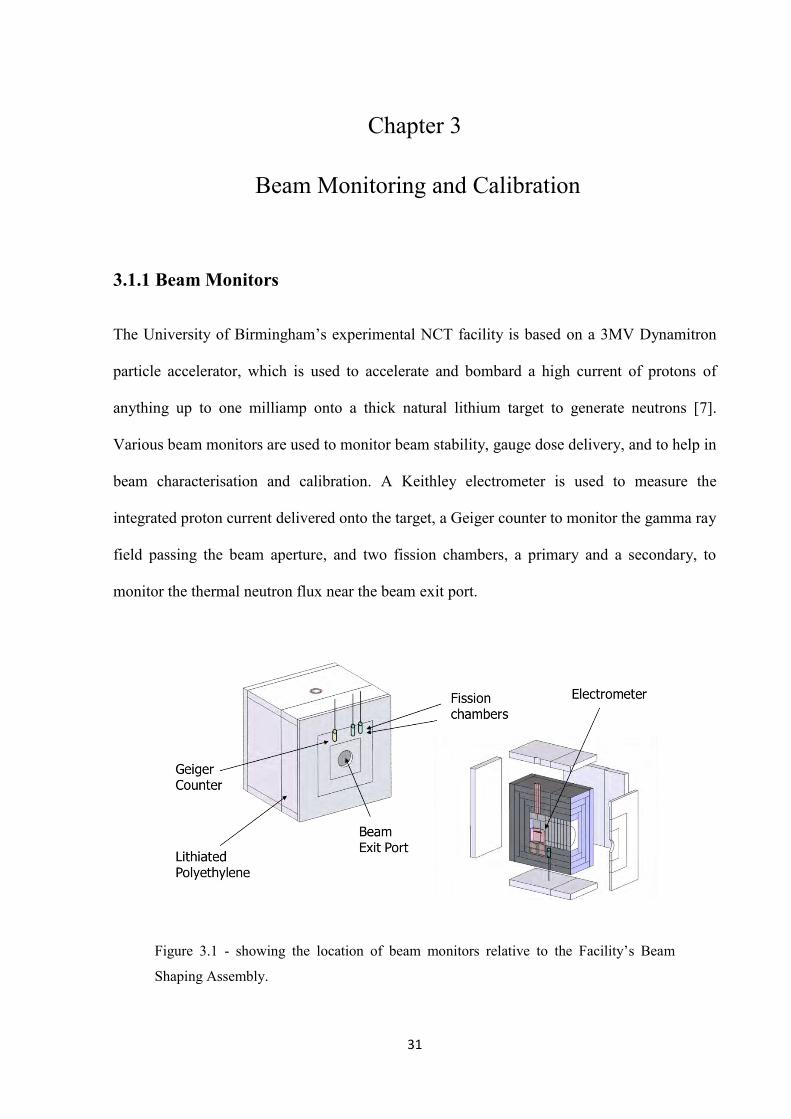
3.1.1 Beam Monitors
The University of Birmingham’s experimental NCT facility is based on a 3MV Dynamitron
particle accelerator, which is used to accelerate and bombard a high current of protons of
anything up to one milliamp onto a thick natural lithium target to generate neutrons [7].
Various beam monitors are used to monitor beam stability, gauge dose delivery, and to help in
beam characterisation and calibration. A Keithley electrometer is used to measure the
integrated proton current delivered onto the target, a Geiger counter to monitor the gamma ray
field passing the beam aperture, and two fission chambers, a primary and a secondary, to
monitor the thermal neutron flux near the beam exit port.
Figure 3.1 - showing the location of beam monitors relative to the Facility’s Beam
Shaping Assembly.
32
Computational and experimental work has been carried out at the treatment facility to relocate
two neutron monitor chambers (235U fission chambers - Centronic Ltd., FC05A/500/u235).
IEC requirements for monitoring radiotherapy beams require the counters to be in the
‘treatment’ beam. In placing the monitor chambers within the treatment beam, the problem
arises of neutrons backscattering from patient or phantom affecting the counts at these
detectors, which can only be practically located within the 25 mm layer of lithium
polyethylene shielding surrounding the exit port of the treatment facility. The revised monitor
position was chosen after detailed consideration of sensitivity to backscattered radiation and
detector count-rate.
The fission chambers were originally positioned such that they were separated from the
patient / phantom by 20 mm of Li-polyethylene , the chambers being located in the back of
the 25 mm Li-polyethylene beam delimiter, adjacent to the graphite neutron reflector. It was
found that the original chamber positions were susceptible to movement. Even though this
movement might only be slight, the chambers were located close enough to a boundary
between two surfaces (the graphite reflector and the Li-polyethylene delimiter) such that they
could easily move into high flux regions (out of the shielding). It was decided to relocate the
chambers away from the boundary into a more reliable position.
Future plans for the NCT facility include the upgrade of the ion source to yield higher proton
currents in order to produce a higher neutron flux at the beam exit port. This could cause
unacceptable dead time losses in the fission chambers. A further aim of the relocation of the
fission chambers is to reduce the count rate seen by the chambers by a factor greater than 2.
The simulations also aimed at maintaining the neutronic coupling levels to less than or equal
to 5%. The coupling being the effect of ‘multiple’ back-scattered neutrons from patient /
33
phantom positioned at the beam exit port, which cause the chambers to record higher count
rates than those recorded for a free beam.
Thus the goals were to locate the chambers such that:
the chamber positions are stable
the count rate is reduced to less than half its current rate (i.e to ~approx 4000 cps at 1
mA proton current)
the neutronic Coupling Ratios are maintained below 5%
3.1.2 Fission chamber Modelling & Simulation
To investigate these requirements, detailed Monte Carlo simulations were carried out to
quantify the degree of neutronic coupling using the radiation transport code MCNPX 2.6.
Mesh tallies, employing voxelised track length estimators of flux, were used over the entirety
of the shielding /delimiter surrounding the beam exit port. The simulation consisted of the
entire beam shaping assembly, heavy water cooling system and outer shielding with a 12cm
diameter beam exit aperture, as shown in figure 3.1.
Simulations were carried out in full electron, photon and neutron physics modes. ENDF/B-
VII, continuous energy nuclear and atomic data was used, along with LA150U photo-nuclear
data libraries. Thermal (S(alpha, Beta)) treatment was envoked for the graphite reflector,
water (in the phantom), the polyethylene phantom and the Li-polyethylene delimeter.
The Centronic pulse fission chambers used in the facility (FC05A/500/U235) are coated with
500 μgcm-2 of UO2, have an active length of 0.2˝ (5.1 mm), an outside diameter 0.25˝ (6.4
34
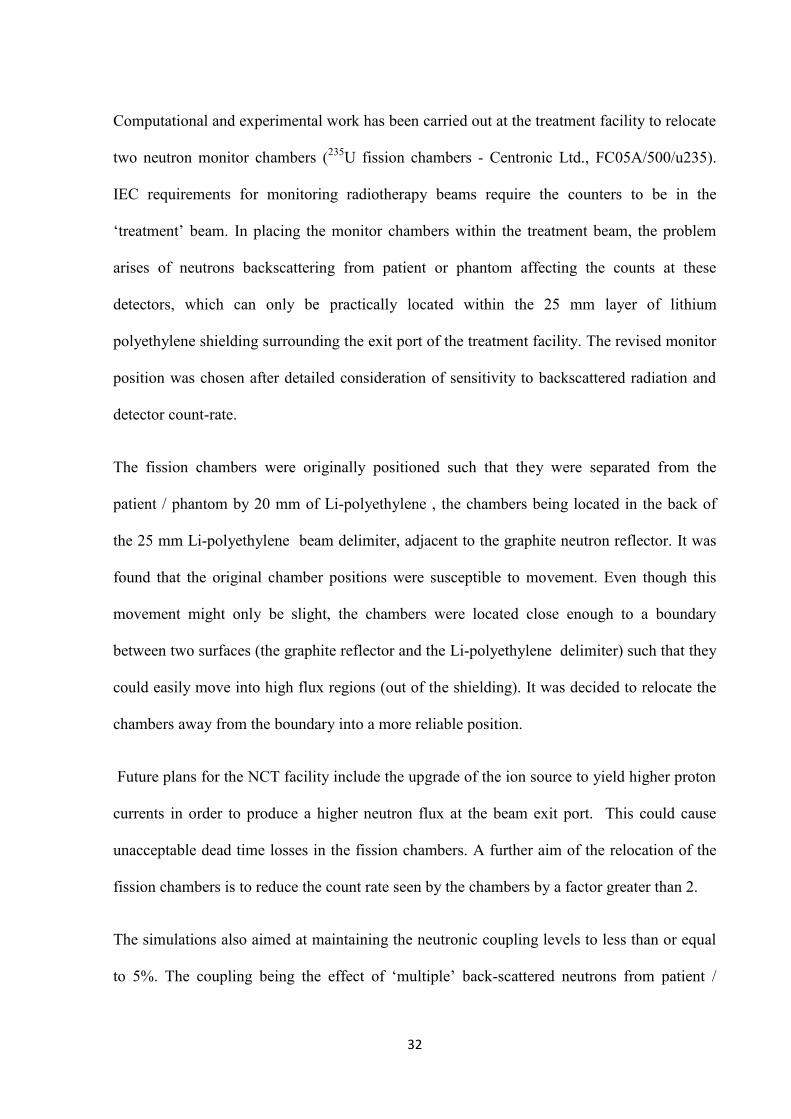
mm) and a neutron sensitivity of 2.1e-4cps/nv. The incoming neutrons cause fission in the
UO2 to yield high energy fission fragments which cause ionisation in the active detector
volume resulting in measureable pulses from the chamber. The rate of pulse output is
proportional to the rate of fission reactions and consequently to the neutron flux. [see
schematic diagram fig 3.2]
Figure 3.2 A schematic diagram of a fission chamber [37].
The neutron spectrum at the beam exit port is shaped to have its maximum intensity in the
epithermal region and thus there is a need to model the chamber sensitivity to a spectrum of
neutron energies when simulating any possible response to the movement and repositioning of
these chambers. This is readily done by multiplying the eventwise calculated track length
estimate of neutron fluence with the 235U total fission cross-section (i.e. the active detector
material) This is done in MCNPX using the tally multiplier card to obtain a reaction rate in
the chambers at any given position relative to their old reference position. Thus the MCNPX
mesh tally was used to divide the 25 mm lithium polyethylene layer into small voxels of 1 cm
35
x 1 cm x 0.5 cm. Transport calculations were optimised by using weight windows and tallies
were resolved to better than 1% statistical uncertainty.
3.1.3 Neutronic Coupling
The neutronic Coupling Ratio (CR) was used as a measure of increase in neutron flux due to
the presence of phantom / patient at the beam exit port and can be defined as:
(3.1)
Simulations were carried out with and without the presence of a standard large water tank
phantom (40 x 40 x 20 cm3), external to the beam shaping assembly and abutting the beam
exit port each voxel thus recording a measure of the count rate as seen by a typical fission
chamber.
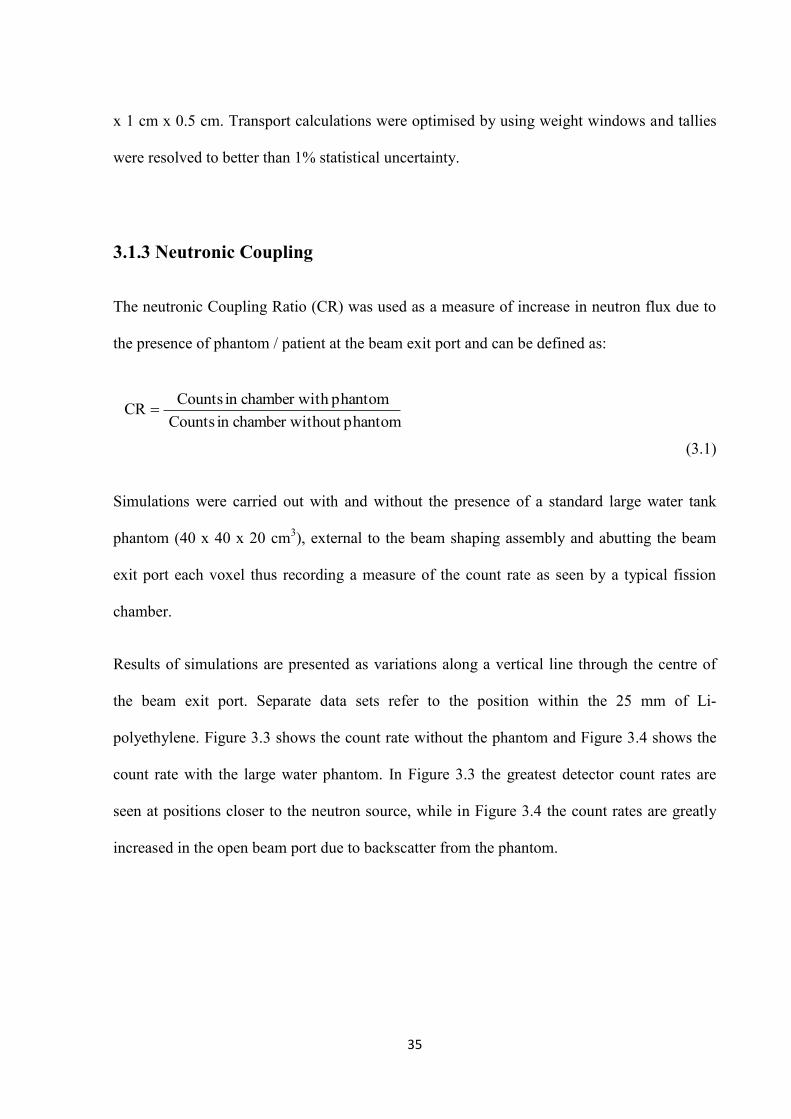
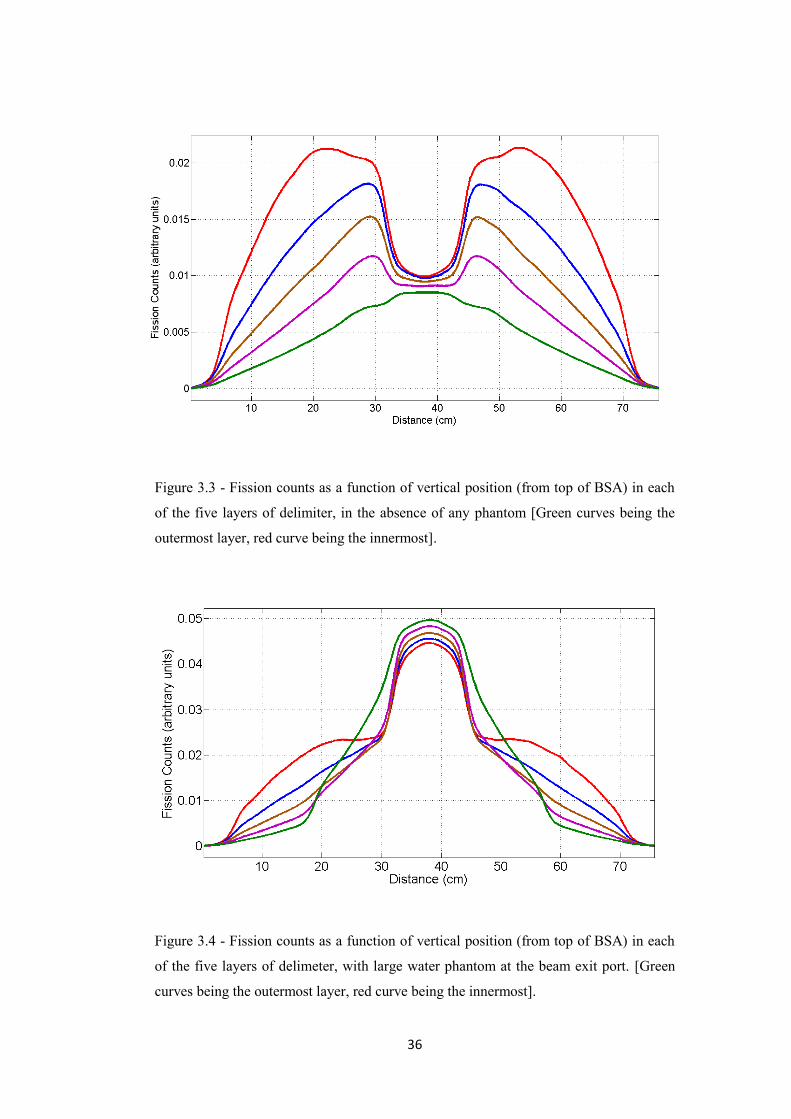
Results of simulations are presented as variations along a vertical line through the centre of
the beam exit port. Separate data sets refer to the position within the 25 mm of Li-
polyethylene. Figure 3.3 shows the count rate without the phantom and Figure 3.4 shows the
count rate with the large water phantom. In Figure 3.3 the greatest detector count rates are
seen at positions closer to the neutron source, while in Figure 3.4 the count rates are greatly
increased in the open beam port due to backscatter from the phantom.
phantomthout chamber wiin Counts phantomth chamber wiin CountsCR
36
Figure 3.3 - Fission counts as a function of vertical position (from top of BSA) in each
of the five layers of delimiter, in the absence of any phantom [Green curves being the
outermost layer, red curve being the innermost].
Figure 3.4 - Fission counts as a function of vertical position (from top of BSA) in each
of the five layers of delimeter, with large water phantom at the beam exit port. [Green
curves being the outermost layer, red curve being the innermost].
37
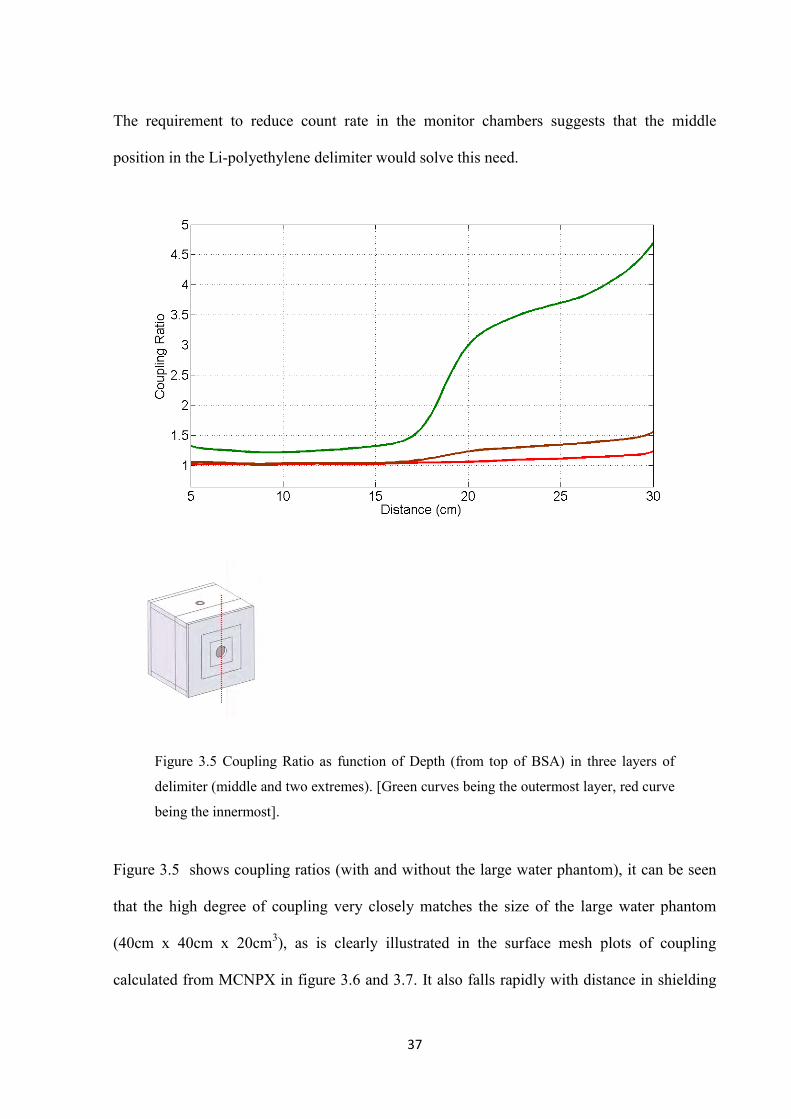
The requirement to reduce count rate in the monitor chambers suggests that the middle
position in the Li-polyethylene delimiter would solve this need.
Figure 3.5 Coupling Ratio as function of Depth (from top of BSA) in three layers of
delimiter (middle and two extremes). [Green curves being the outermost layer, red curve
being the innermost].
Figure 3.5 shows coupling ratios (with and without the large water phantom), it can be seen
that the high degree of coupling very closely matches the size of the large water phantom
(40cm x 40cm x 20cm3), as is clearly illustrated in the surface mesh plots of coupling
calculated from MCNPX in figure 3.6 and 3.7. It also falls rapidly with distance in shielding
38
both at the front surface and around the beam port. A reference fission chamber used to sit
~15cm from the top of the Li-polyethylene delimeter, where there was very little measured
neutronic coupling (~1.02) and were it to be repositioned in the centre of the Li-polyethylene,
simulations show it would still be of the same order as the very back of the delimeter.
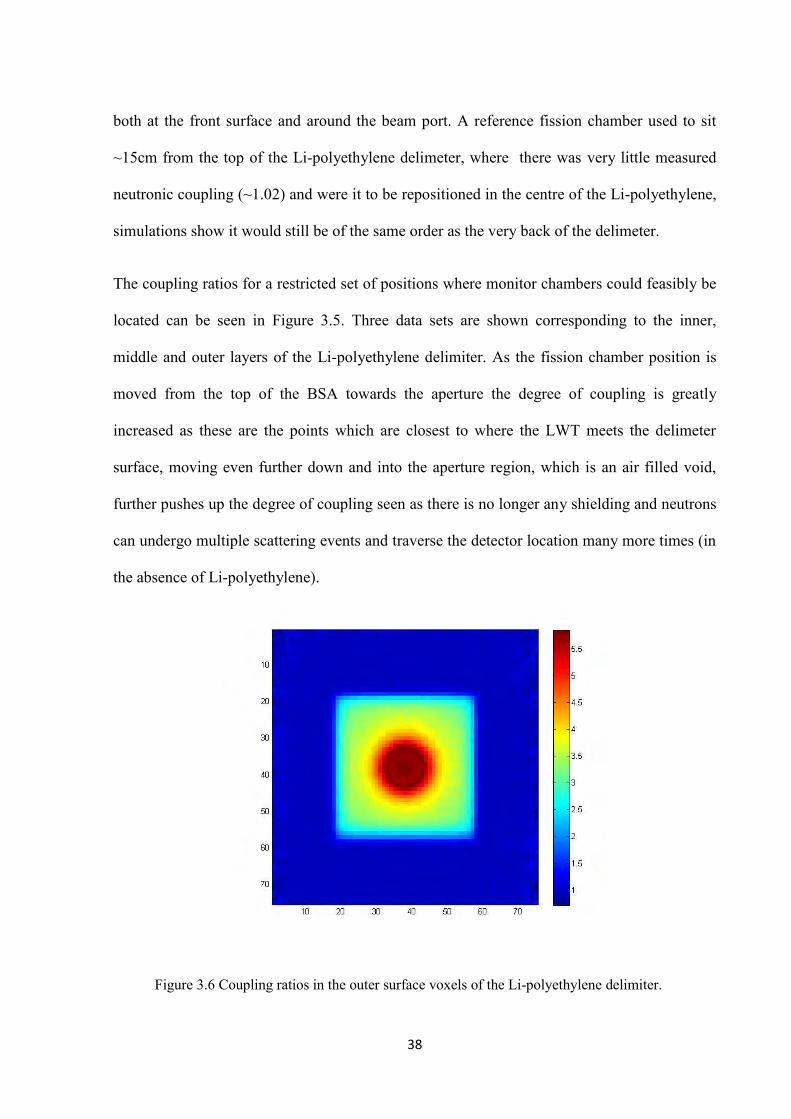
The coupling ratios for a restricted set of positions where monitor chambers could feasibly be
located can be seen in Figure 3.5. Three data sets are shown corresponding to the inner,
middle and outer layers of the Li-polyethylene delimiter. As the fission chamber position is
moved from the top of the BSA towards the aperture the degree of coupling is greatly
increased as these are the points which are closest to where the LWT meets the delimeter
surface, moving even further down and into the aperture region, which is an air filled void,
further pushes up the degree of coupling seen as there is no longer any shielding and neutrons
can undergo multiple scattering events and traverse the detector location many more times (in
the absence of Li-polyethylene).
Figure 3.6 Coupling ratios in the outer surface voxels of the Li-polyethylene delimiter.
39
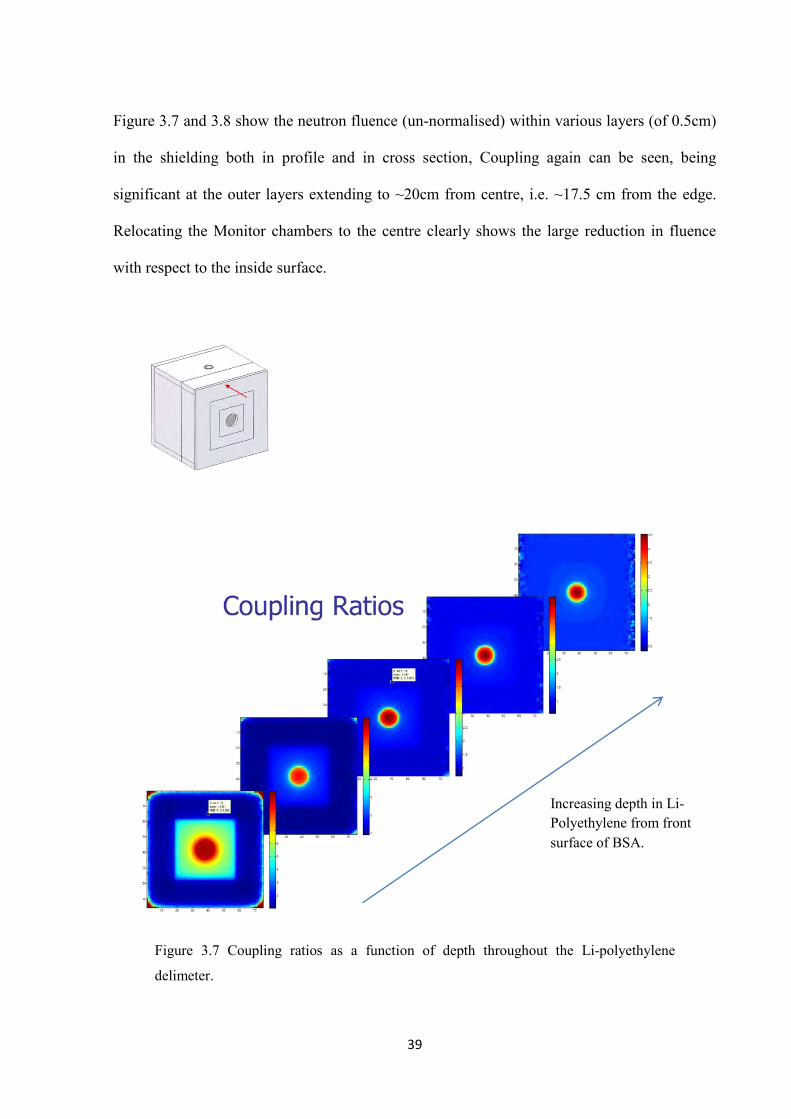
Figure 3.7 and 3.8 show the neutron fluence (un-normalised) within various layers (of 0.5cm)
in the shielding both in profile and in cross section, Coupling again can be seen, being
significant at the outer layers extending to ~20cm from centre, i.e. ~17.5 cm from the edge.
Relocating the Monitor chambers to the centre clearly shows the large reduction in fluence
with respect to the inside surface.
Figure 3.7 Coupling ratios as a function of depth throughout the Li-polyethylene
delimeter.
Increasing depth in Li-Polyethylene from front surface of BSA.
40
The requirement for CR of less than 5% (1.05 on Figure 3.5) suggests that the chamber be
located no closer to the phantom than the centre of the delimiter and no further from the top of
the BSA than 15cm.
3.1.4 Experimental validation
The original monitor chamber position was separated from the patient / phantom by 20 mm of
Li-polyethylene, as chambers were located in the back of the 25 mm Li-polyethylene beam
delimiter, adjacent to the graphite neutron reflector. Experimental coupling with the chambers
in this position was measured to be 2.3 ± 0.2% in the presence and absence of the LWT, and
the corresponding MCNP simulated prediction being 2.6 ± 1%.
Changing the monitor position to be centered within the Li-polyethylene delimiter, separated
from the patient / phantom by 12 mm Li-polyethylene (instead of 20 mm) was predicted by
MCNP to reduce the count-rate by a factor of 2.5 ± 0.1. This was verified experimentally to
be a factor of 2.4 ± 0.1, producing typical detector count-rates at 1 mA proton current of
approximately 4000 cps. This change of position was predicted to increase the phantom
coupling to 3.9%, which has been verified experimentally to be less than 4%.
Note that this coupling is anticipated to be negligible (<1%) for other smaller phantoms and
for actual patients, but experimental validation was sought with the largest phantom which
provides the greatest degree of coupling.
41
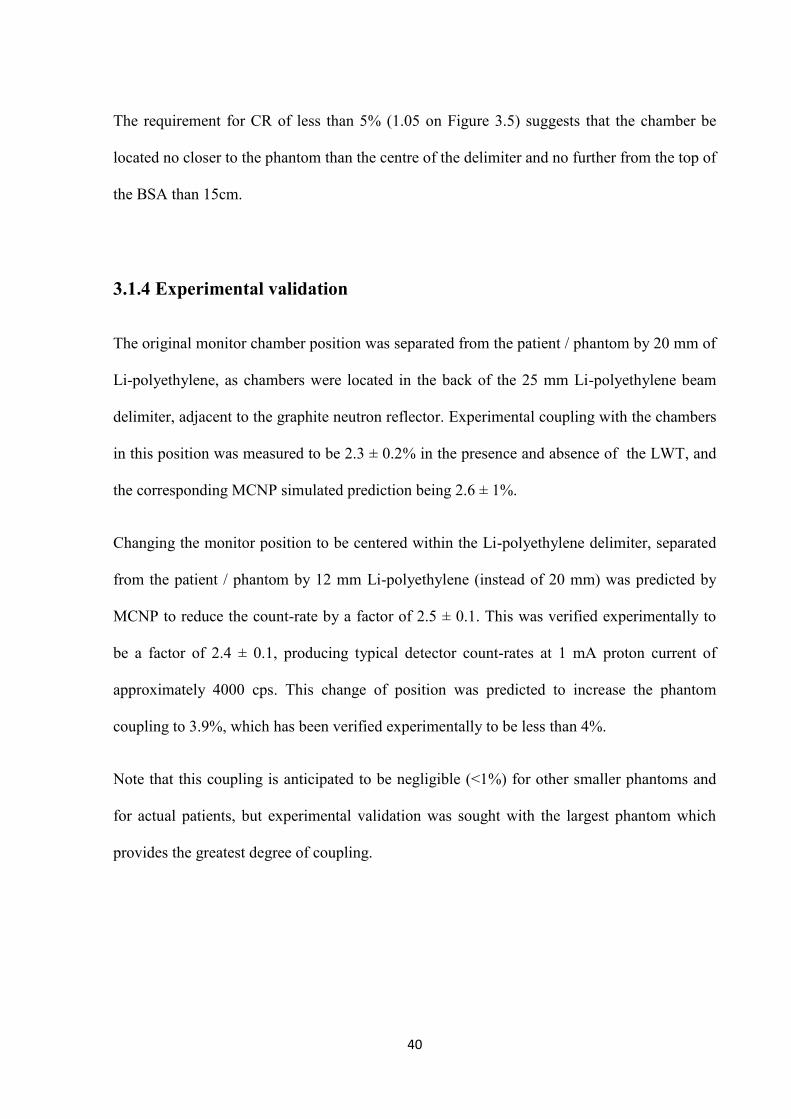
Figure 3.8 Simulated Coupling Ratio (left) and fission counts (right) as function of
Depth (from top of BSA) in the five layers of delimiter.
3.2 Beam Calibration
‘The nominal machine output voltage is determined during standard operation by the voltage
drop across 10 G resistor exposed to the accelerating potential, as read on a 1.5 k shunt
resistor by a digital volt-meter (DVM). Procedure for setting a given machine voltage requires
the operators to increase the voltage of the transmitted 130 kHz R.F. signal until the DVM
reading matches the reading predicted from previous calibration.’ [41]
Aluminium targets are commonly used for calibrating low energy accelerator beams. The
singular stable isotope of the metal, aluminium-27, has 22 low energy (p, γ) resonances, some
of which are used as threshold energy calibration points. Specific well resolved single
resonances, with very narrow resonance widths, can also serve to gauge the energy resolution
of the incoming proton beam.
42
The need for a 2.8MeV proton beam requires that the Dynamitron accelerator be accurately
calibrated and the DVM setting to be stable. The calibration is carried out using some of the
aforementioned thresholds in the Al(p,γ)Si reaction as well as the Li(p,n)Be threshold reaction
at 1880.6 keV. The Li(p,n)Be threshold being measured with fission counters, the Al(p,γ)Si
thresholds being measured, in a modified beam line with a thick aluminium target and
scintillation detector (NaI).
In order to carry out the calibration a beam line is drawn from the accelerator at the end of
which is fixed an aluminium target, on the external surface is positioned a NaI detector and
associated electronics. The voltage of the transmitted R.F. is gradually increased by the
operator (as monitored by the DVM) and the integrated gamma ray counts in the detector
gathered, as 13Al(p,γ)14Si resonance thresholds are crossed noticeable steps are seen in the
yield data collected. Mass 2 protons are used to probe higher energy DVM calibration points
as half the total energy per nucleon is imparted in the reaction, thus a 1388keV resonance can
be used as calibration for a 2776keV accelerator potential using mass 2 protons.
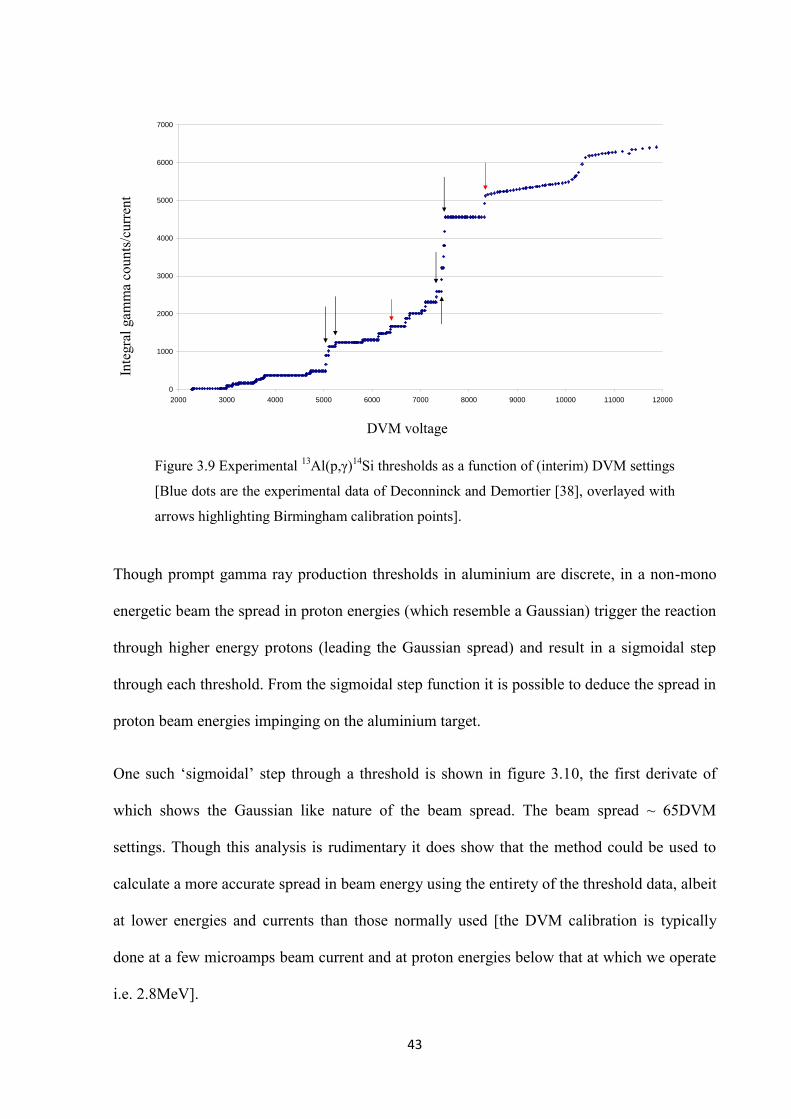
Figure 3.9 shows the experimental 13Al(p,γ)14Si thresholds as measured by Deconninck and
Demortier [38], the experimental data has been re-plotted against Birmingham DVM settings
to aid in the search for thresholds during calibration. The overlayed blue arrows show the
thresholds used for a typical full beam calibration, the red arrows being additional points
suggested and used by the author for the last full beam calibration. The full experimental
DVM calibration is very time consuming and thus a more regular interim measure of DVM
settings carried out by searching for the 1880.6 keV Li(p,n)Be threshold can serve as a
stability check on the overall behaviour and drift in the calibration voltage.
43
Figure 3.9 Experimental 13Al(p,γ)14Si thresholds as a function of (interim) DVM settings
[Blue dots are the experimental data of Deconninck and Demortier [38], overlayed with
arrows highlighting Birmingham calibration points].
Though prompt gamma ray production thresholds in aluminium are discrete, in a non-mono
energetic beam the spread in proton energies (which resemble a Gaussian) trigger the reaction
through higher energy protons (leading the Gaussian spread) and result in a sigmoidal step
through each threshold. From the sigmoidal step function it is possible to deduce the spread in
proton beam energies impinging on the aluminium target.
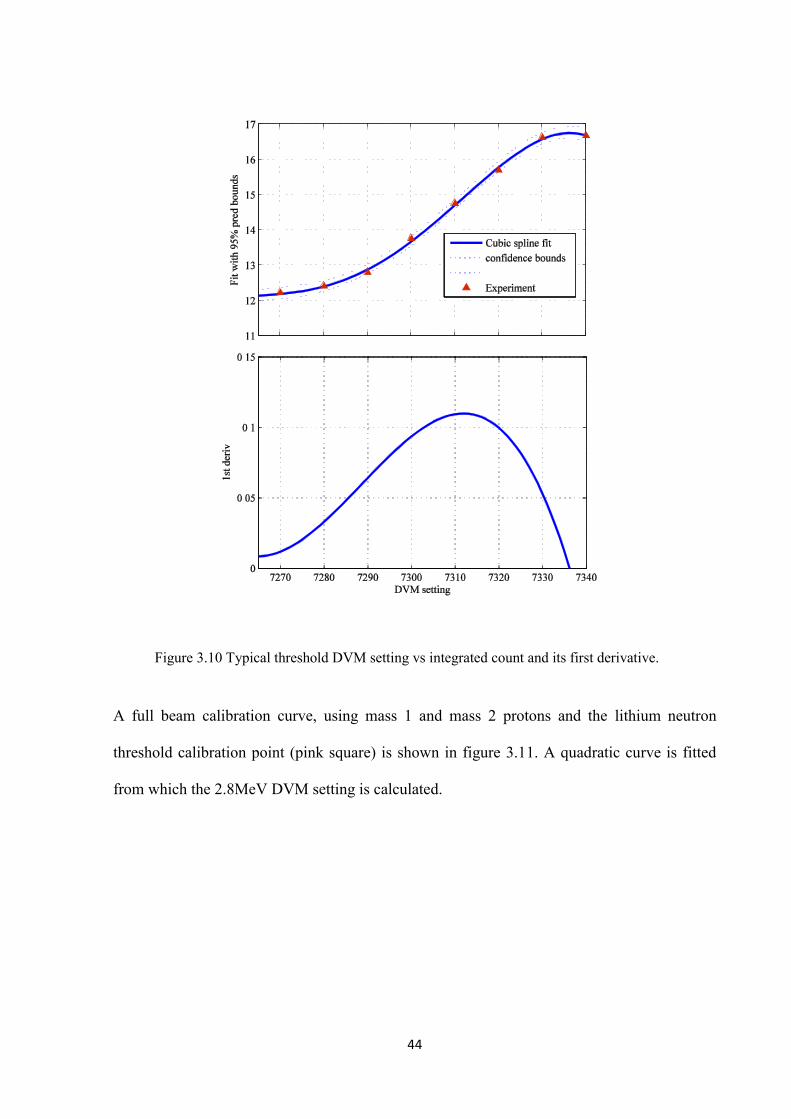
One such ‘sigmoidal’ step through a threshold is shown in figure 3.10, the first derivate of
which shows the Gaussian like nature of the beam spread. The beam spread ~ 65DVM
settings. Though this analysis is rudimentary it does show that the method could be used to
calculate a more accurate spread in beam energy using the entirety of the threshold data, albeit
at lower energies and currents than those normally used [the DVM calibration is typically
done at a few microamps beam current and at proton energies below that at which we operate
i.e. 2.8MeV].
interim DVM
0
1000
2000
3000
4000
5000
6000
7000
2000 3000 4000 5000 6000 7000 8000 9000 10000 11000 12000
DVM voltage
Inte
gral
gam
ma
coun
ts/c
urre
nt
44
Figure 3.10 Typical threshold DVM setting vs integrated count and its first derivative.
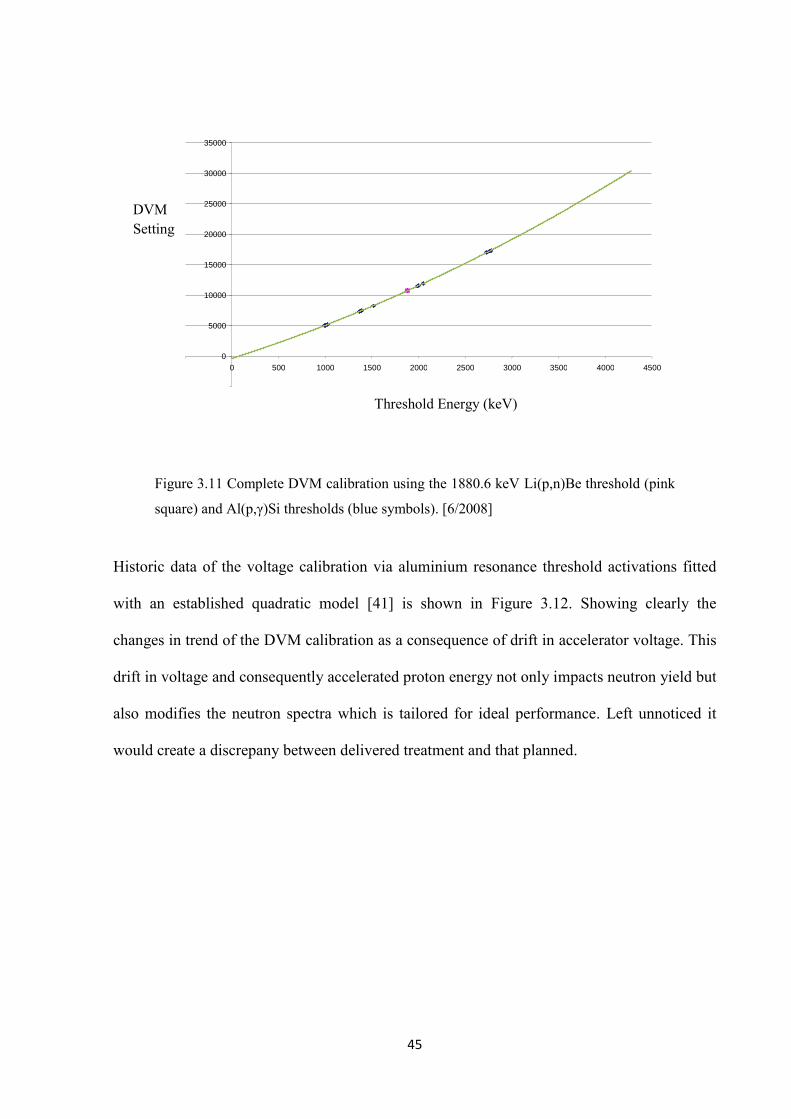
A full beam calibration curve, using mass 1 and mass 2 protons and the lithium neutron
threshold calibration point (pink square) is shown in figure 3.11. A quadratic curve is fitted
from which the 2.8MeV DVM setting is calculated.
45
Figure 3.11 Complete DVM calibration using the 1880.6 keV Li(p,n)Be threshold (pink
square) and Al(p,γ)Si thresholds (blue symbols). [6/2008]
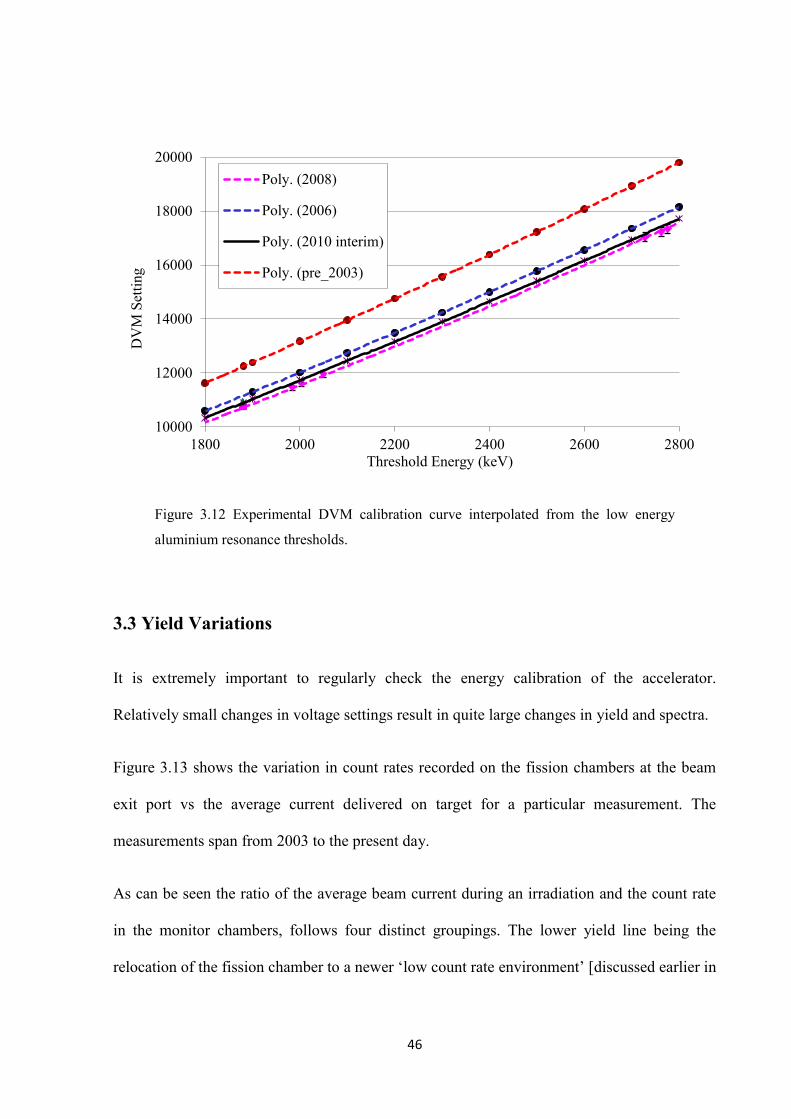
Historic data of the voltage calibration via aluminium resonance threshold activations fitted
with an established quadratic model [41] is shown in Figure 3.12. Showing clearly the
changes in trend of the DVM calibration as a consequence of drift in accelerator voltage. This
drift in voltage and consequently accelerated proton energy not only impacts neutron yield but
also modifies the neutron spectra which is tailored for ideal performance. Left unnoticed it
would create a discrepany between delivered treatment and that planned.
0
5000
10000
15000
20000
25000
30000
35000
0 500 1000 1500 2000 2500 3000 3500 4000 4500
Threshold Energy (keV)
DVM Setting
46
Figure 3.12 Experimental DVM calibration curve interpolated from the low energy
aluminium resonance thresholds.
3.3 Yield Variations
It is extremely important to regularly check the energy calibration of the accelerator.
Relatively small changes in voltage settings result in quite large changes in yield and spectra.
Figure 3.13 shows the variation in count rates recorded on the fission chambers at the beam
exit port vs the average current delivered on target for a particular measurement. The
measurements span from 2003 to the present day.
As can be seen the ratio of the average beam current during an irradiation and the count rate
in the monitor chambers, follows four distinct groupings. The lower yield line being the
relocation of the fission chamber to a newer ‘low count rate environment’ [discussed earlier in
10000
12000
14000
16000
18000
20000
1800 2000 2200 2400 2600 2800
DV
M S
ettin
g
Threshold Energy (keV)
Poly. (2008)
Poly. (2006)
Poly. (2010 interim)
Poly. (pre_2003)
47
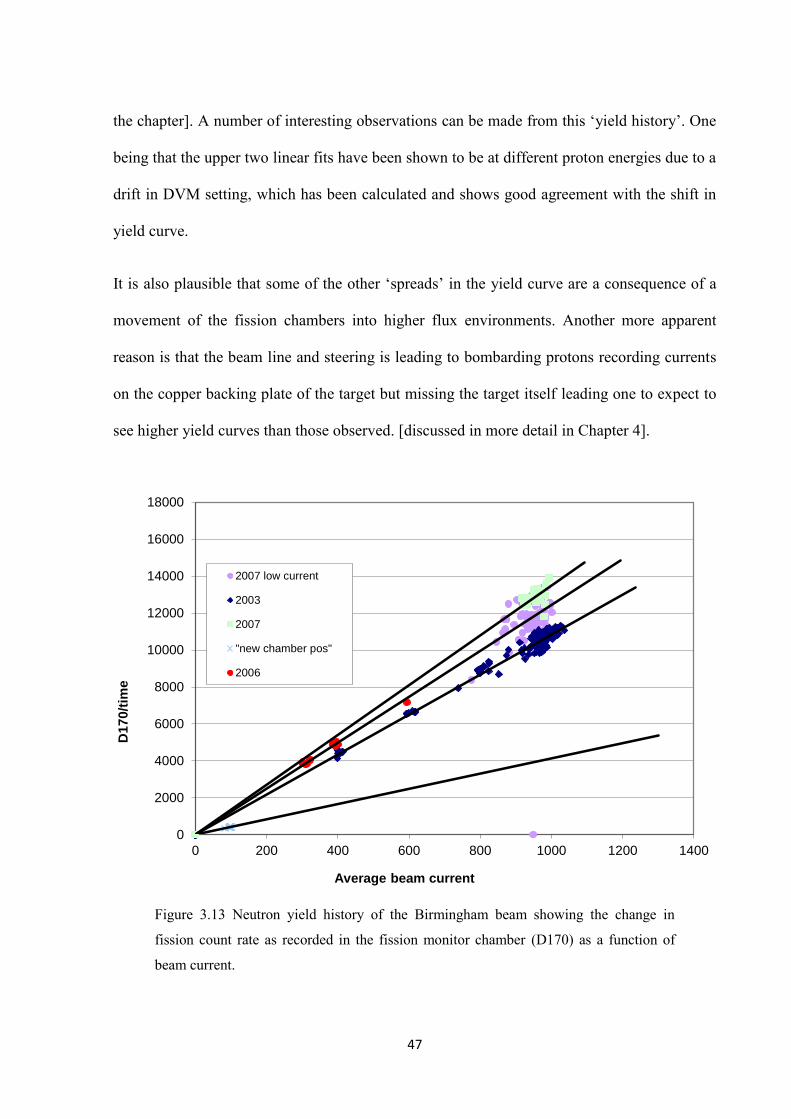
the chapter]. A number of interesting observations can be made from this ‘yield history’. One
being that the upper two linear fits have been shown to be at different proton energies due to a
drift in DVM setting, which has been calculated and shows good agreement with the shift in
yield curve.
It is also plausible that some of the other ‘spreads’ in the yield curve are a consequence of a
movement of the fission chambers into higher flux environments. Another more apparent
reason is that the beam line and steering is leading to bombarding protons recording currents
on the copper backing plate of the target but missing the target itself leading one to expect to
see higher yield curves than those observed. [discussed in more detail in Chapter 4].
Figure 3.13 Neutron yield history of the Birmingham beam showing the change in
fission count rate as recorded in the fission monitor chamber (D170) as a function of
beam current.
0
2000
4000
6000
8000
10000
12000
14000
16000
18000
0 200 400 600 800 1000 1200 1400
D170/t
ime
Average beam current
2007 low current
2003
2007
"new chamber pos"
2006
48
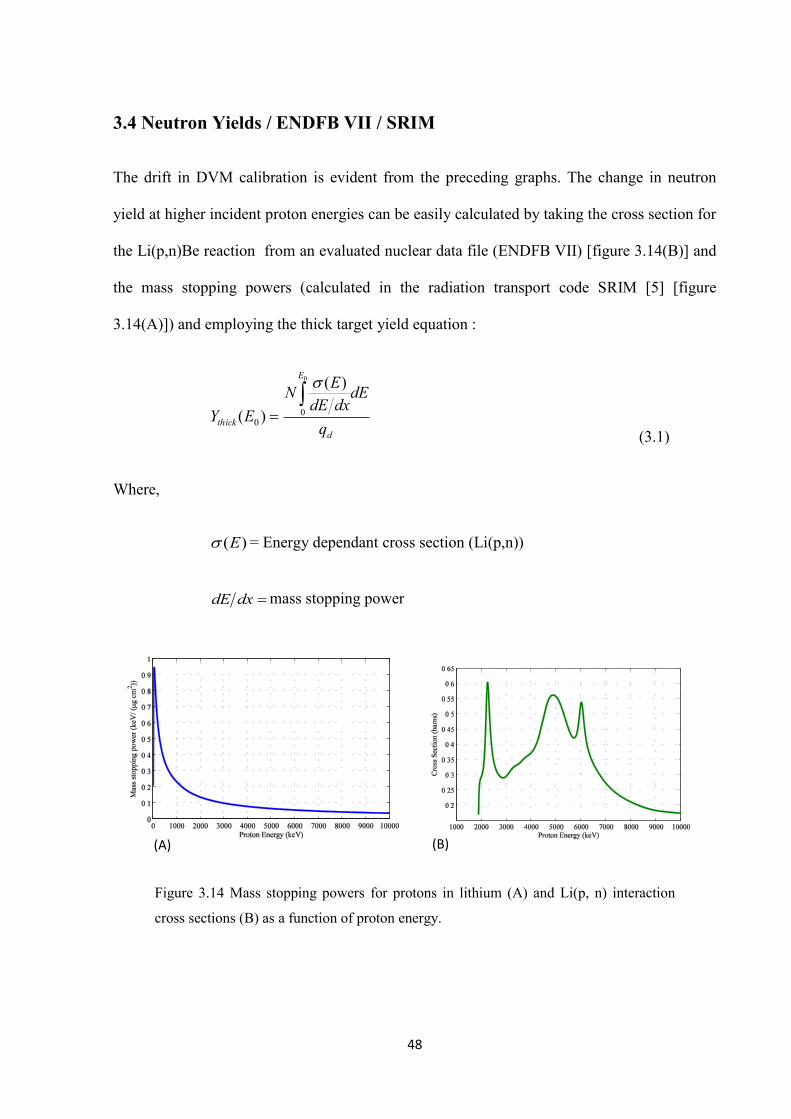
3.4 Neutron Yields / ENDFB VII / SRIM
The drift in DVM calibration is evident from the preceding graphs. The change in neutron
yield at higher incident proton energies can be easily calculated by taking the cross section for
the Li(p,n)Be reaction from an evaluated nuclear data file (ENDFB VII) [figure 3.14(B)] and
the mass stopping powers (calculated in the radiation transport code SRIM [5] [figure
3.14(A)]) and employing the thick target yield equation :
d
E
thick q
dEdxdEEN
EY
0
00
)(
)(
(3.1)
Where,
)(E = Energy dependant cross section (Li(p,n))
dxdE mass stopping power
Figure 3.14 Mass stopping powers for protons in lithium (A) and Li(p, n) interaction
cross sections (B) as a function of proton energy.
(A) (B)
49
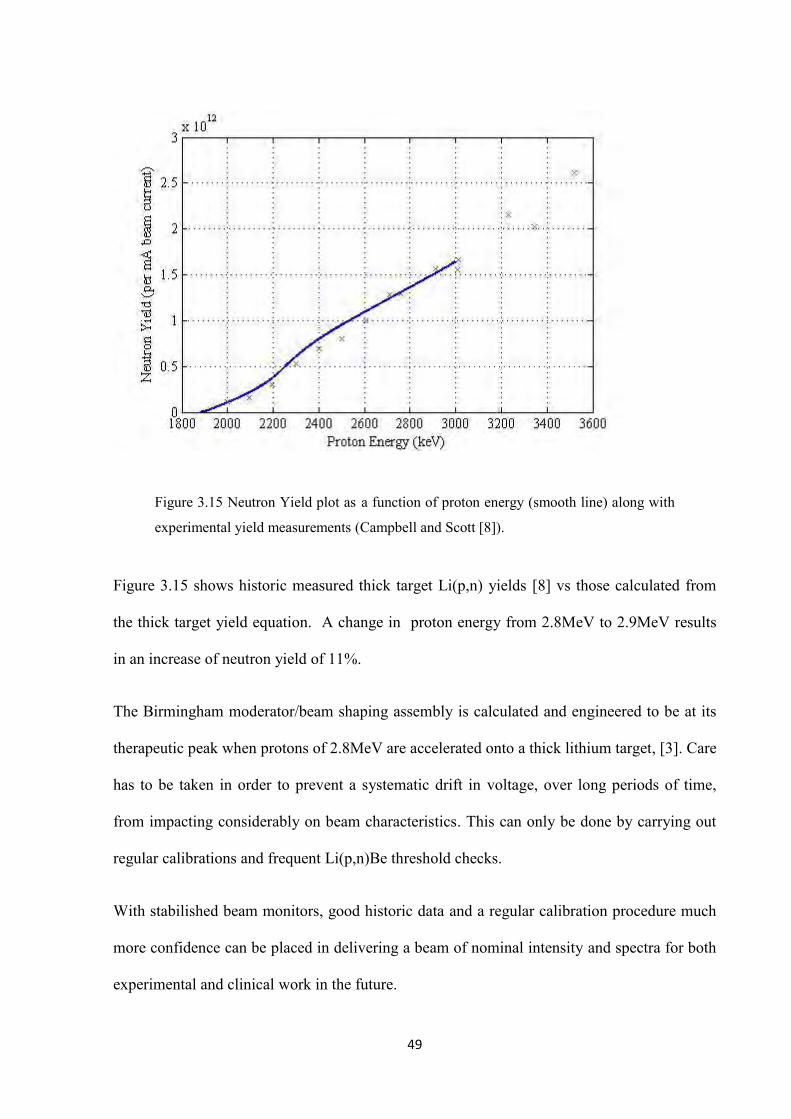
Figure 3.15 Neutron Yield plot as a function of proton energy (smooth line) along with
experimental yield measurements (Campbell and Scott [8]).
Figure 3.15 shows historic measured thick target Li(p,n) yields [8] vs those calculated from
the thick target yield equation. A change in proton energy from 2.8MeV to 2.9MeV results
in an increase of neutron yield of 11%.
The Birmingham moderator/beam shaping assembly is calculated and engineered to be at its
therapeutic peak when protons of 2.8MeV are accelerated onto a thick lithium target, [3]. Care
has to be taken in order to prevent a systematic drift in voltage, over long periods of time,
from impacting considerably on beam characteristics. This can only be done by carrying out
regular calibrations and frequent Li(p,n)Be threshold checks.
With stabilished beam monitors, good historic data and a regular calibration procedure much
more confidence can be placed in delivering a beam of nominal intensity and spectra for both
experimental and clinical work in the future.
50
CHAPTER 4
EPITHERMAL NEUTRON BEAM DOSIMETRY – FOIL
ACTIVATIONS
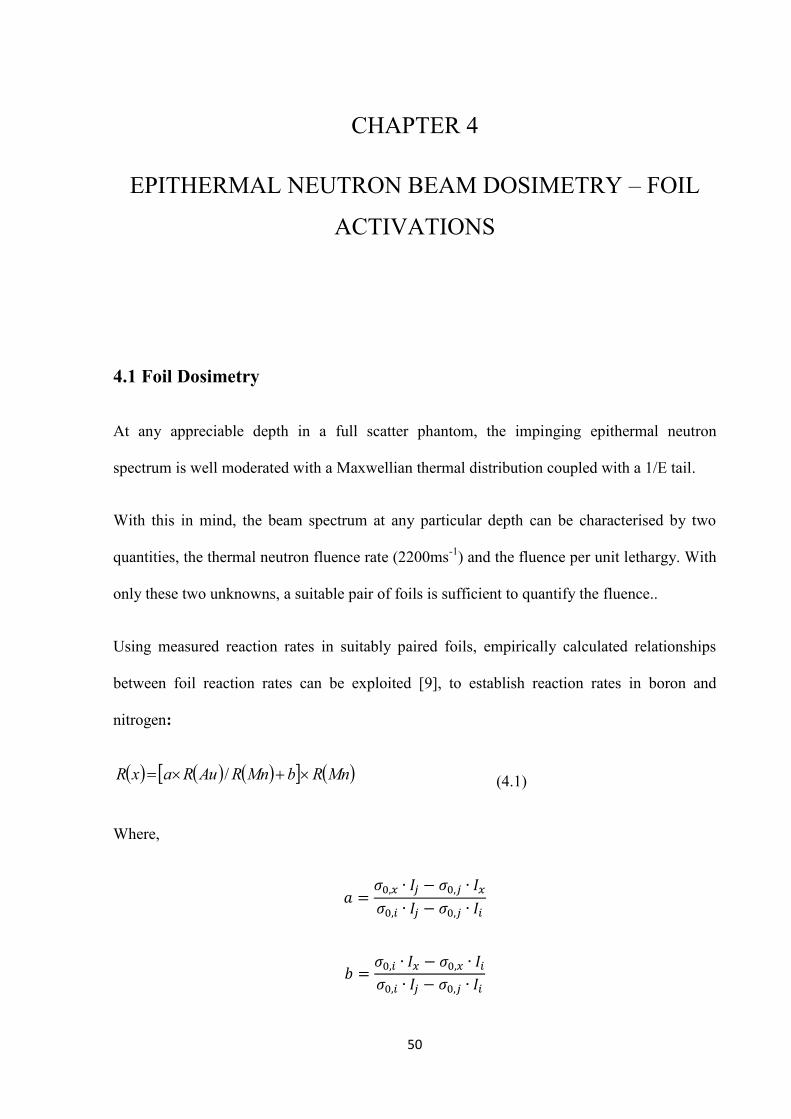
4.1 Foil Dosimetry
At any appreciable depth in a full scatter phantom, the impinging epithermal neutron
spectrum is well moderated with a Maxwellian thermal distribution coupled with a 1/E tail.
With this in mind, the beam spectrum at any particular depth can be characterised by two
quantities, the thermal neutron fluence rate (2200ms-1) and the fluence per unit lethargy. With
only these two unknowns, a suitable pair of foils is sufficient to quantify the fluence..
Using measured reaction rates in suitably paired foils, empirically calculated relationships
between foil reaction rates can be exploited [9], to establish reaction rates in boron and
nitrogen:
MnRbMnRAuRaxR / (4.1)
Where,
51
I is the resonance integral and is defined as ∫
,
Indices i and j refer to the foil pair being used and x, the material for which the reaction rate is
sought.
Various combinations of foil are commonly used in clinical BNCT facilities: manganese and
gold dilute foils in aluminium alloy are used by the clinical facility based at the Fir1 reactor
VTT, Finland. These are chosen because of the manganese foil having a nearly 1/v
absorption cross-section and the gold foil having a large resonance peak and its resonance
integral is large compared to its thermal cross section.
Manganese and gold foil pairs are the subject of the remainder of the chapter and are the foils
of choice in the Birmingham facility to determine doses in phantom. Two sets of foils are
discussed, solid (i.e. non dilute) and dilute. For the non-dilute metal foils, the experimentally
determined reaction rates require correction for flux depression caused by self-shielding and
gamma self absorbtion before applying the spectral indices method above.
4.2 HpGe Efficiency Calibration and Cascade summing
All past reference foil activation measurements carried out at the University of Birmingham’s
BNCT facility to quantify the dose delivered in phantom [7] have been measured on a
calibrated High-Purity Germanium Detector (HpGe) at distances of 10cm to 15cm with active
non-dilute foils which are far enough from the active detector volume to limit the contribution
of true coincidence events and minimize the effects of pulse pile-up. The activity induced in
the newly acquired dilute foils (MnAl, 1.00 ±0.02% by weight Mn and AuAl, 1.00 ±0.01% by
weight Au) is far less, per given irradiation, than that of the non-dilute foils due to the lower
52
number of target atoms present in the foil. With lower activities it becomes extremely time
consuming to counts foils at large distances from the detector surface with good statistics and
this combined with the short half life of Mn makes the attempt to do so prohibitively difficult.
A thorough investigation was carried out on the effects of calibration source size, distance and
detector efficiency using reference standard radionuclide point sources, including Co-60, Cs-
137, Ba-133 and Eu-152, as a function of distance from the detector surface. As well as point
sources a dilute, voluminous, mixed nuclide, [Nycomed Amersham plc, QCD1], traceable
gamma-ray reference source containing 9 radionuclides spanning gamma ray energies
88.03keV (Cadmium-109) to 1333keV (Cobalt-60) was used. This mixed source is sealed
between two plastic films and spans an area equivalent to the older Birmingham solid foils
and served as a good measure of point source detector efficiency calibration and volume
source detector efficiency calibration as a function of distance.
The results of the exercise showed that point source calibration and volume source
calibrations agreed at large distances from the detector surface (>10cm) but as the sources
approached closer to the detector a noticeable difference is seen in efficiency calibration
curves and in order to avoid point/volume efficiency calibration errors, calibration and
standard foil counting ought to be done at an extremely well positioned, reproduceable
reference distance ~15cm from the detector surface.
Photopeak efficiency curves, at this new reference distance, were plotted in Matlab with
weighted least squares fits, weighted by the individual estimated standard deviations of the
reference radionuclide, fitted against an analytic model of HpGe efficiency as a function of
energy of the form
53
( )
(4.2)
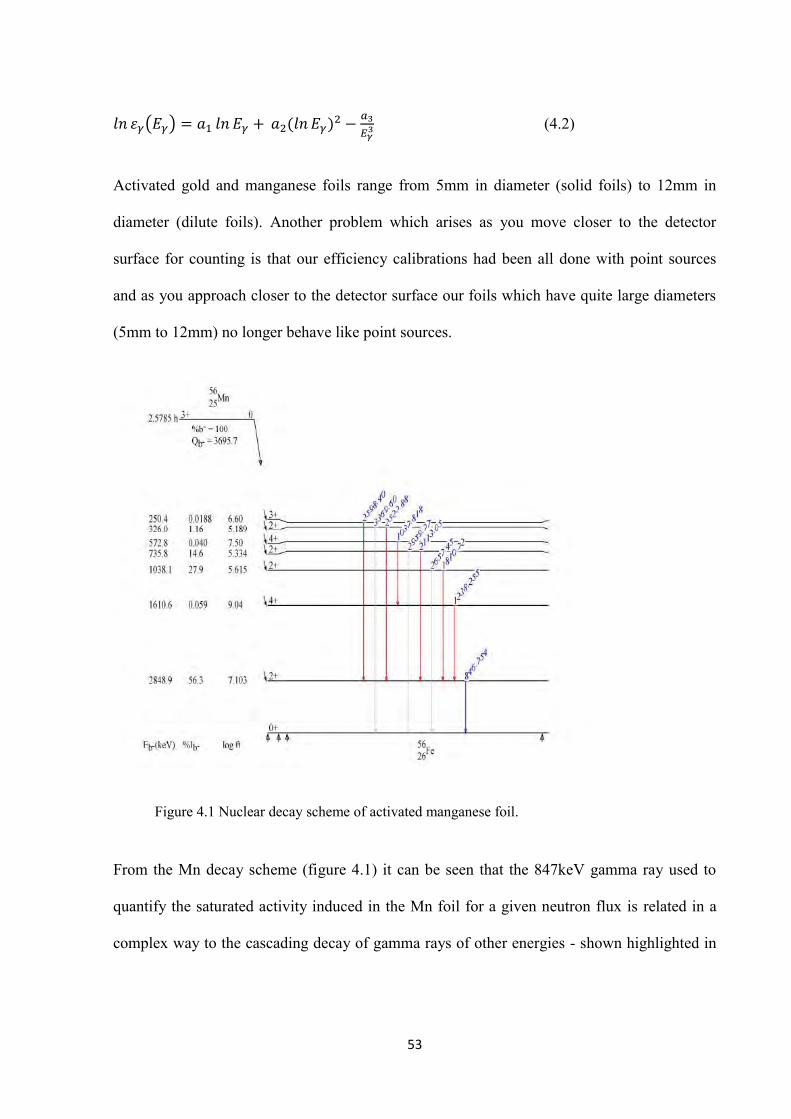
Activated gold and manganese foils range from 5mm in diameter (solid foils) to 12mm in
diameter (dilute foils). Another problem which arises as you move closer to the detector
surface for counting is that our efficiency calibrations had been all done with point sources
and as you approach closer to the detector surface our foils which have quite large diameters
(5mm to 12mm) no longer behave like point sources.
Figure 4.1 Nuclear decay scheme of activated manganese foil.
From the Mn decay scheme (figure 4.1) it can be seen that the 847keV gamma ray used to
quantify the saturated activity induced in the Mn foil for a given neutron flux is related in a
complex way to the cascading decay of gamma rays of other energies - shown highlighted in
54
red on the decay scheme. These cascading effects are often referred to as ‘true coincidence’ or
‘cascade summing’ events in the literature.
The fact that these cascading nuclear decays occur on the pico and femto second timescale,
which is within the resolving time of a typical HPGe detector, is of concern when measuring
weakly active foils close to the detector surface. If these coincident events together enter the
detector active volume at the same time they no longer show up as unique full energy peak
lines in a spectra but a summed total. Hence these combinatorial events are often referred to
as cascade summing or true coincidence summing events as opposed to random coincidence
events. Cascade summing does not occur in gold foils at the reference 411keV photo – peak.
True coincidence events, which relates wholly on the geometry of the problem, decrease with
increasing distance from the active volume because of the diminishing solid angle into which
both coincident photons have to traverse in order to cause the summative effect in the
detector.
Thus it is necessary, with dilute foils of weak activity, to address the problem of counting the
foils at a more practical distance i.e. closer to the detector, and factoring in of coincident
events into the counting process is necessary.
A simple method was employed to correct for the increased summing effect and increased
geometrical problems caused by non-point size objects as they move ever closer to the
detector surface.
The correction for cascade summing and geometric effects relies on the assumption that point
and volume sources behave alike at large distances from the detector surface and that cascade
summing is negligible at these distances. Knowing the efficiency and relative efficiency thus
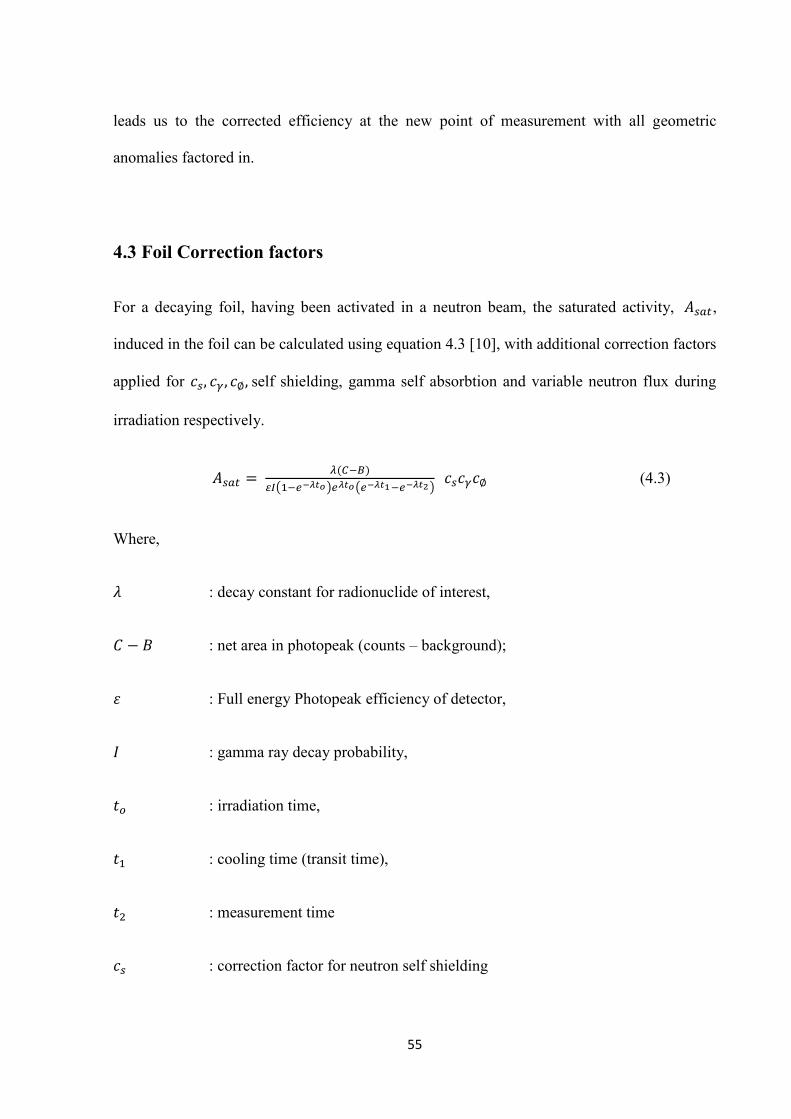
55
leads us to the corrected efficiency at the new point of measurement with all geometric
anomalies factored in.
4.3 Foil Correction factors
For a decaying foil, having been activated in a neutron beam, the saturated activity, ,
induced in the foil can be calculated using equation 4.3 [10], with additional correction factors
applied for self shielding, gamma self absorbtion and variable neutron flux during
irradiation respectively.
( ) ( ) (4.3)
Where,
: decay constant for radionuclide of interest,
: net area in photopeak (counts – background);
: Full energy Photopeak efficiency of detector,
: gamma ray decay probability,
: irradiation time,
: cooling time (transit time),
: measurement time
: correction factor for neutron self shielding
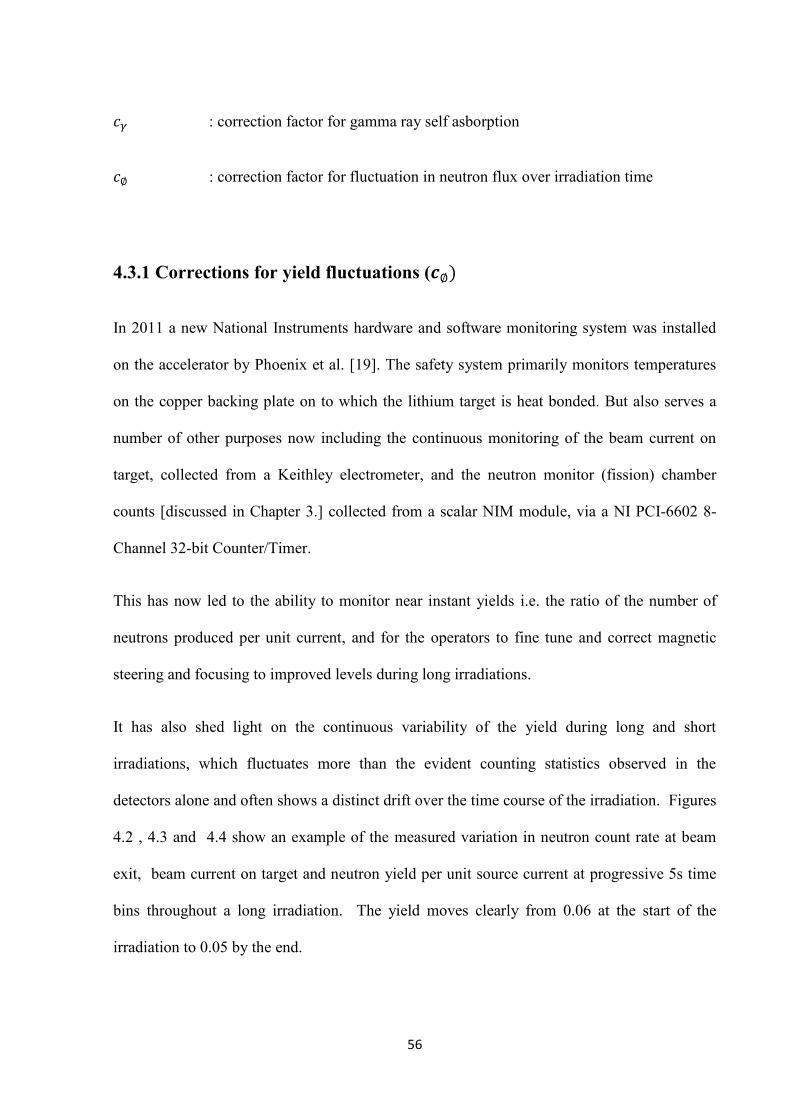
56
: correction factor for gamma ray self asborption
: correction factor for fluctuation in neutron flux over irradiation time
4.3.1 Corrections for yield fluctuations (
In 2011 a new National Instruments hardware and software monitoring system was installed
on the accelerator by Phoenix et al. [19]. The safety system primarily monitors temperatures
on the copper backing plate on to which the lithium target is heat bonded. But also serves a
number of other purposes now including the continuous monitoring of the beam current on
target, collected from a Keithley electrometer, and the neutron monitor (fission) chamber
counts [discussed in Chapter 3.] collected from a scalar NIM module, via a NI PCI-6602 8-
Channel 32-bit Counter/Timer.
This has now led to the ability to monitor near instant yields i.e. the ratio of the number of
neutrons produced per unit current, and for the operators to fine tune and correct magnetic
steering and focusing to improved levels during long irradiations.
It has also shed light on the continuous variability of the yield during long and short
irradiations, which fluctuates more than the evident counting statistics observed in the
detectors alone and often shows a distinct drift over the time course of the irradiation. Figures
4.2 , 4.3 and 4.4 show an example of the measured variation in neutron count rate at beam
exit, beam current on target and neutron yield per unit source current at progressive 5s time
bins throughout a long irradiation. The yield moves clearly from 0.06 at the start of the
irradiation to 0.05 by the end.
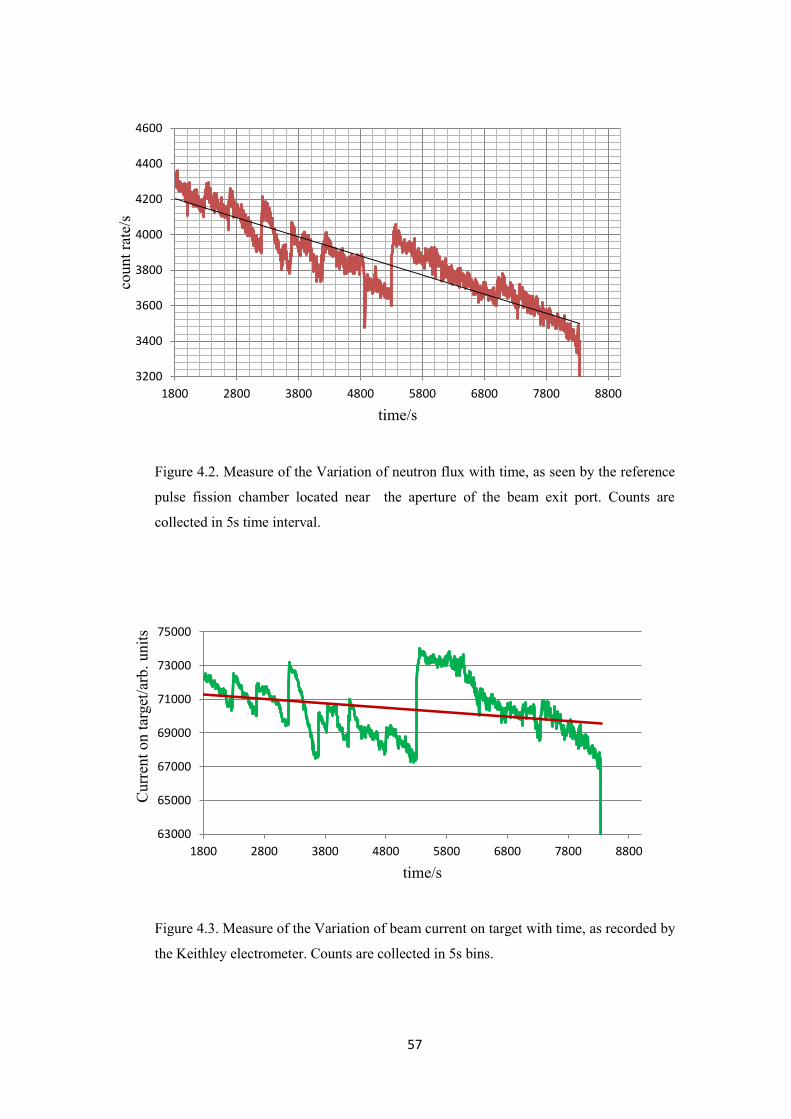
57
Figure 4.2. Measure of the Variation of neutron flux with time, as seen by the reference
pulse fission chamber located near the aperture of the beam exit port. Counts are
collected in 5s time interval.
Figure 4.3. Measure of the Variation of beam current on target with time, as recorded by
the Keithley electrometer. Counts are collected in 5s bins.
3200
3400
3600
3800
4000
4200
4400
4600
1800 2800 3800 4800 5800 6800 7800 8800
coun
t rat
e/s
time/s
63000
65000
67000
69000
71000
73000
75000
1800 2800 3800 4800 5800 6800 7800 8800
Cur
rent
on
targ
et/a
rb. u
nits
time/s
58
Figure 4.4. Measure of the Variation of neutron yield with time. Counts are collected in
5s bins.
It has been long thought that the normalisation factor between full Monte Carlo simulations of
thermal dose in the large water tank [LWT] and measured foil activations derived thermal
doses, was likely due to the imperfect collimation of the proton beam line [7]. Leading to a
fraction of protons missing their target yet still recording a current on the copper backing plate
from which the beam current is monitored.
This has become ever more evident during the last change in target, figure 4.5 (a) shows the
replaced target with distinctive scorch marks on the copper backing outside of the target area,
figure 4.5(b) shows the same target with demarcated target area, filled black circle, with a
white circle demarking the estimated beam rastor size, some of which misses the target yet
hits the scorched zone on the backing plate.
An estimate of the loss of beam on target can be made from the ratio of arc angle off target to
that on target, which seems to be ~70%. This estimate depends on how often the rastered
0.045
0.05
0.055
0.06
0.065
1800 2800 3800 4800 5800 6800 7800 8800
Neu
tron
yiel
d/ar
b. u
nits
time/s
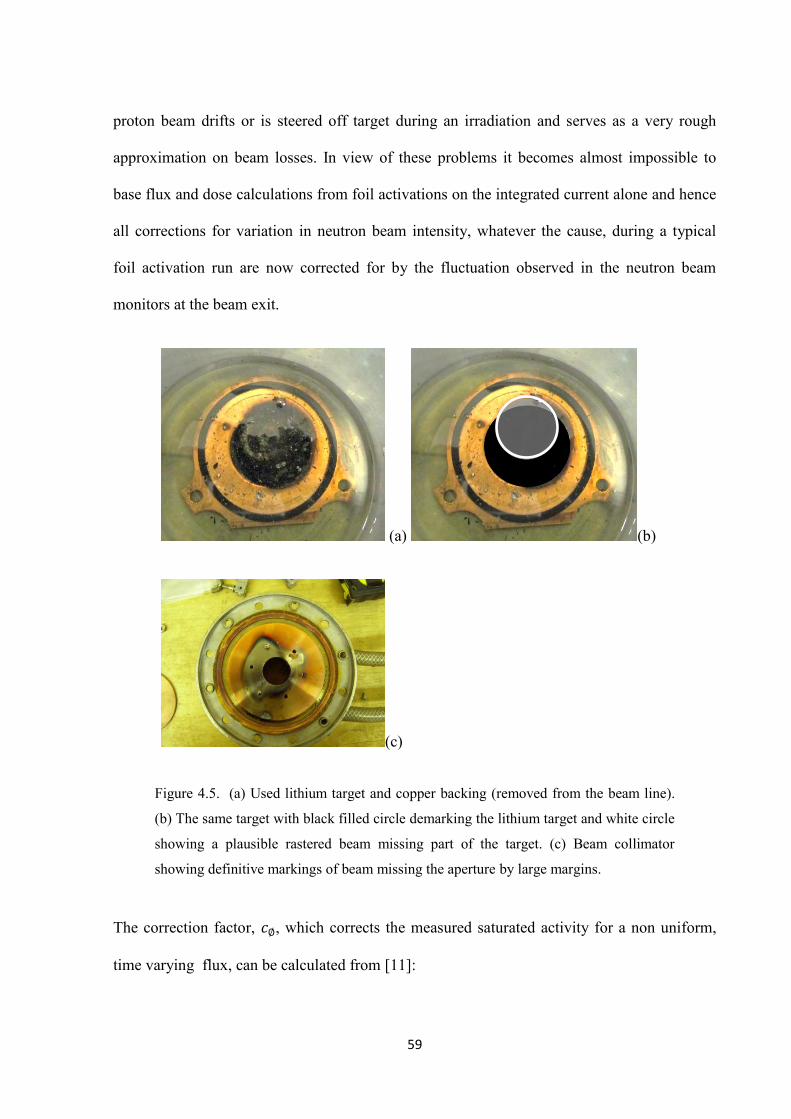
59
proton beam drifts or is steered off target during an irradiation and serves as a very rough
approximation on beam losses. In view of these problems it becomes almost impossible to
base flux and dose calculations from foil activations on the integrated current alone and hence
all corrections for variation in neutron beam intensity, whatever the cause, during a typical
foil activation run are now corrected for by the fluctuation observed in the neutron beam
monitors at the beam exit.
(a) (b)
(c)
Figure 4.5. (a) Used lithium target and copper backing (removed from the beam line).
(b) The same target with black filled circle demarking the lithium target and white circle
showing a plausible rastered beam missing part of the target. (c) Beam collimator
showing definitive markings of beam missing the aperture by large margins.
The correction factor, , which corrects the measured saturated activity for a non uniform,
time varying flux, can be calculated from [11]:
60
∑ ( ) (4.4)
c’ and c being the gamma ray counts measured as a consequence of a uniform and non-
uniform irradiation respectively.
{∑ ( ) } (4.5a)
(4.5b)
Where,
c’ : number of gamma rays emitted under an irradiation of constant flux
: cross section,
:number of total time bins,
: fraction of flux at time bin j in the fission monitor chamber,
: decay constant,
: bin width of measurements,
: gamma emission probability,
: detector efficiency,
: number density of atoms
In typical circumstances, during long foil irradiations, this correction factor is less than 1%
unless there is a systematic large drift in neutron flux, as recorded in the fission chambers,
61
from the beginning to the end of the irradiation. Large fluctuations in flux without significant
drift over the irradiation period tend to balance out.
4.3.2 Correction for gamma self-absorption (
Gamma self absorption coefficient can be calculated using [12] mass attenuation coefficients
for gold and the known thickness of the foil. Gold has a mass attenuation coefficient of 0.218
g/cm2 at photon energies of 400keV, the density of gold is 19.29 g/cm3 and the approximate
foil thicknesses is 130µm for the Birmingham solid gold foils. This results in a self absorption
correction of:
(
)
(4.6)
exp(-0.218*0.0065*19.29)=0.973
Rogus [36] calculated similar self absorption factors at MIT for foils of 0.0051cm thick and
using lead mass attenuation coefficients, resulting in a 411keV self absorption coefficient of
0.989.
Experimentally calculated Reaction Rates require correcting for flux depression and self
shielding caused by the non homogeneous distribution of neutron flux across the foil and self
shielding factors resulting from photon interactions and attenuation.
Defining the self shielding factors in the foils as the ratio of the reaction rates per atom in the
detectors to the same reaction rates in an infinitely thin detectors. These factors were
determined by means of MCNP calculations and were verified experimentally to be in
62
excellent agreement with simulated results. The correction factors for flux depression and self
shielding as well as their impact on the derived thermal neutron dose (in tissue) follow.
4.3.3 Neutron self-shielding effects and correction factors for foil activation measurements (
Monte Carlo simulations were carried out using MCNPX to quantify the degree of self
shielding caused by non-dilute foils. Simulations directly compare self shielding effects in
dilute and non-dilute foils. The simulations tallied the track length estimate of flux in both
dilute and non-dilute foils at various depths in the LWT. These tallies were multiplied by the
neutron energy dependant (n,γ) capture cross-sections of the Mn and Au foils respectively.
The ratio of the dilute to non-dilute saturation activities is the derived correction factor to be
applied to non-dilute foils. Separate calculations were performed to determine the correction
factors from dilute foils to water.
Saturation activity in the foils change rapidly with depth (as shown in figures 4.6. and 4.7.). It
was therefore deemed necessary to put an upper and lower bound on the simulated results
caused by the ±1 mm positional uncertainty on the non-dilute foils. A cubic spline was fitted
to the MCNP simulated data for the dilute foil saturation activities vs depth (not shown).
Activities 1 mm either side of the assumed measured foil position were then determined.
Experimental work has been carried out to assess the validity of these calculated correction
factors in the standard LWT. Non-dilute foils were used as follows:
o Mn/Ni (88 % Mn by wt.) of approx 7 mm diameter and 35 mg mass.
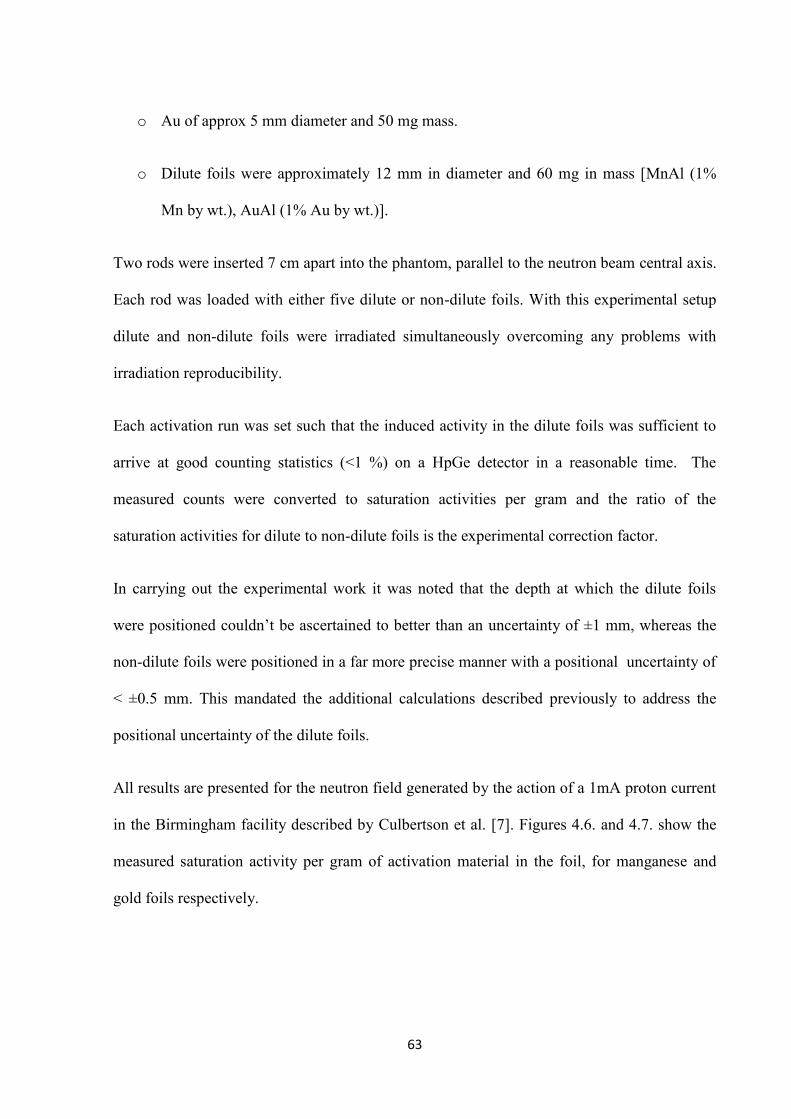
63
o Au of approx 5 mm diameter and 50 mg mass.
o Dilute foils were approximately 12 mm in diameter and 60 mg in mass [MnAl (1%
Mn by wt.), AuAl (1% Au by wt.)].
Two rods were inserted 7 cm apart into the phantom, parallel to the neutron beam central axis.
Each rod was loaded with either five dilute or non-dilute foils. With this experimental setup
dilute and non-dilute foils were irradiated simultaneously overcoming any problems with
irradiation reproducibility.
Each activation run was set such that the induced activity in the dilute foils was sufficient to
arrive at good counting statistics (<1 %) on a HpGe detector in a reasonable time. The
measured counts were converted to saturation activities per gram and the ratio of the
saturation activities for dilute to non-dilute foils is the experimental correction factor.
In carrying out the experimental work it was noted that the depth at which the dilute foils
were positioned couldn’t be ascertained to better than an uncertainty of ±1 mm, whereas the
non-dilute foils were positioned in a far more precise manner with a positional uncertainty of
< ±0.5 mm. This mandated the additional calculations described previously to address the
positional uncertainty of the dilute foils.
All results are presented for the neutron field generated by the action of a 1mA proton current
in the Birmingham facility described by Culbertson et al. [7]. Figures 4.6. and 4.7. show the
measured saturation activity per gram of activation material in the foil, for manganese and
gold foils respectively.
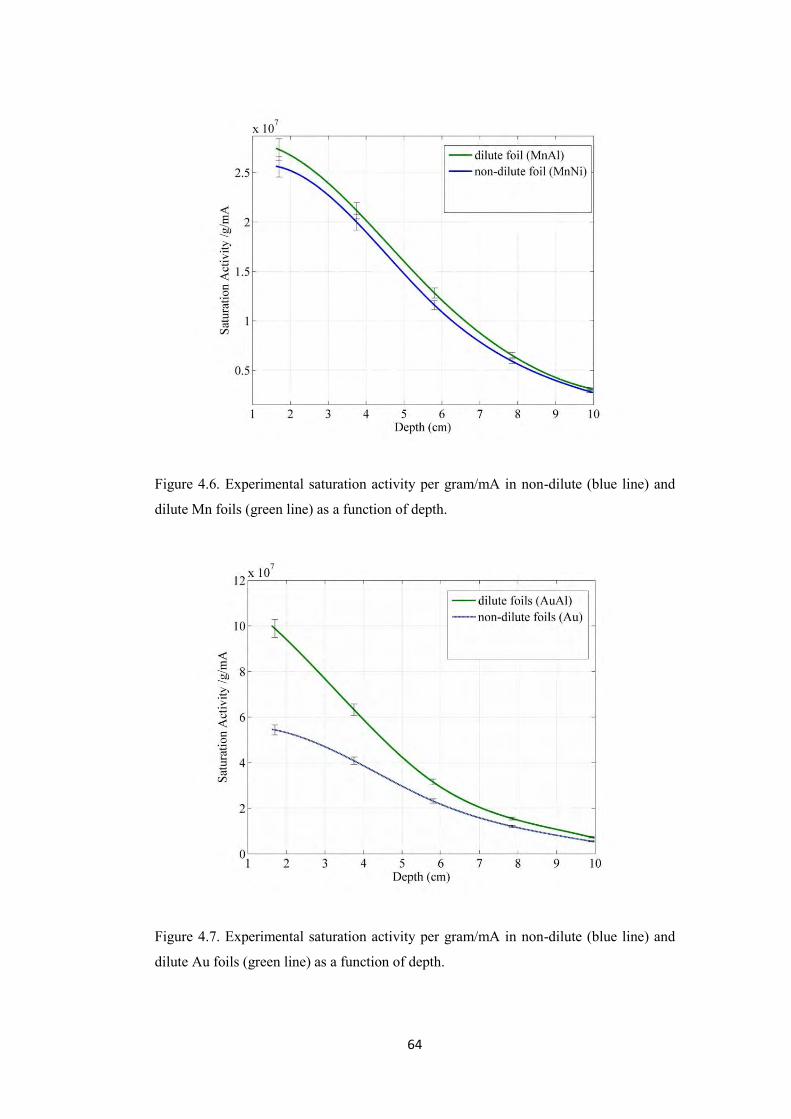
64
Figure 4.6. Experimental saturation activity per gram/mA in non-dilute (blue line) and
dilute Mn foils (green line) as a function of depth.
Figure 4.7. Experimental saturation activity per gram/mA in non-dilute (blue line) and
dilute Au foils (green line) as a function of depth.
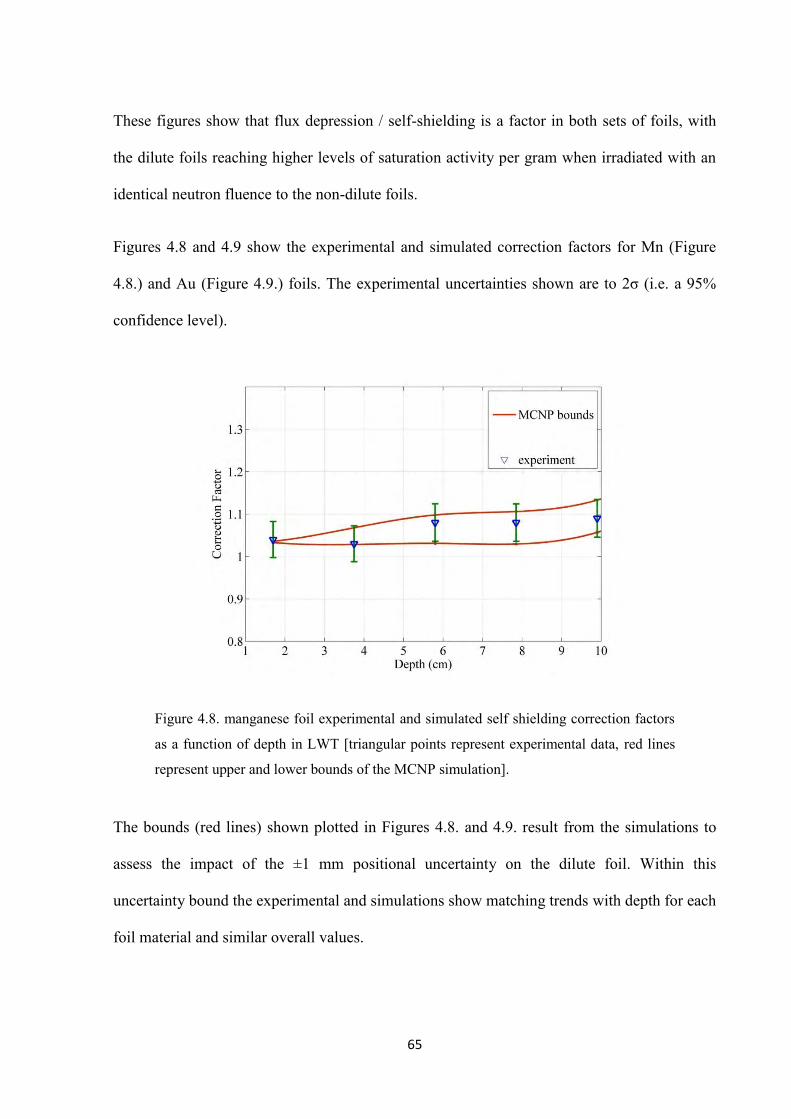
65
These figures show that flux depression / self-shielding is a factor in both sets of foils, with
the dilute foils reaching higher levels of saturation activity per gram when irradiated with an
identical neutron fluence to the non-dilute foils.
Figures 4.8 and 4.9 show the experimental and simulated correction factors for Mn (Figure
4.8.) and Au (Figure 4.9.) foils. The experimental uncertainties shown are to 2σ (i.e. a 95%
confidence level).
Figure 4.8. manganese foil experimental and simulated self shielding correction factors
as a function of depth in LWT [triangular points represent experimental data, red lines
represent upper and lower bounds of the MCNP simulation].
The bounds (red lines) shown plotted in Figures 4.8. and 4.9. result from the simulations to
assess the impact of the ±1 mm positional uncertainty on the dilute foil. Within this
uncertainty bound the experimental and simulations show matching trends with depth for each
foil material and similar overall values.
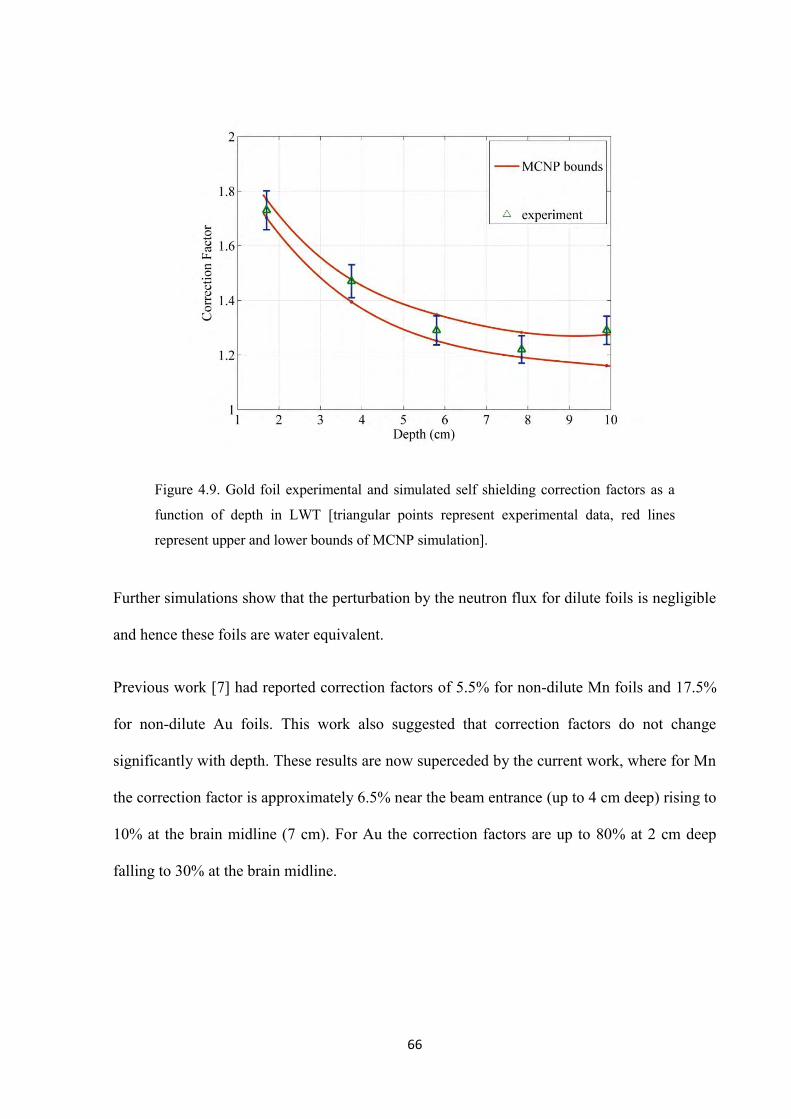
66
Figure 4.9. Gold foil experimental and simulated self shielding correction factors as a
function of depth in LWT [triangular points represent experimental data, red lines
represent upper and lower bounds of MCNP simulation].
Further simulations show that the perturbation by the neutron flux for dilute foils is negligible
and hence these foils are water equivalent.
Previous work [7] had reported correction factors of 5.5% for non-dilute Mn foils and 17.5%
for non-dilute Au foils. This work also suggested that correction factors do not change
significantly with depth. These results are now superceded by the current work, where for Mn
the correction factor is approximately 6.5% near the beam entrance (up to 4 cm deep) rising to
10% at the brain midline (7 cm). For Au the correction factors are up to 80% at 2 cm deep
falling to 30% at the brain midline.
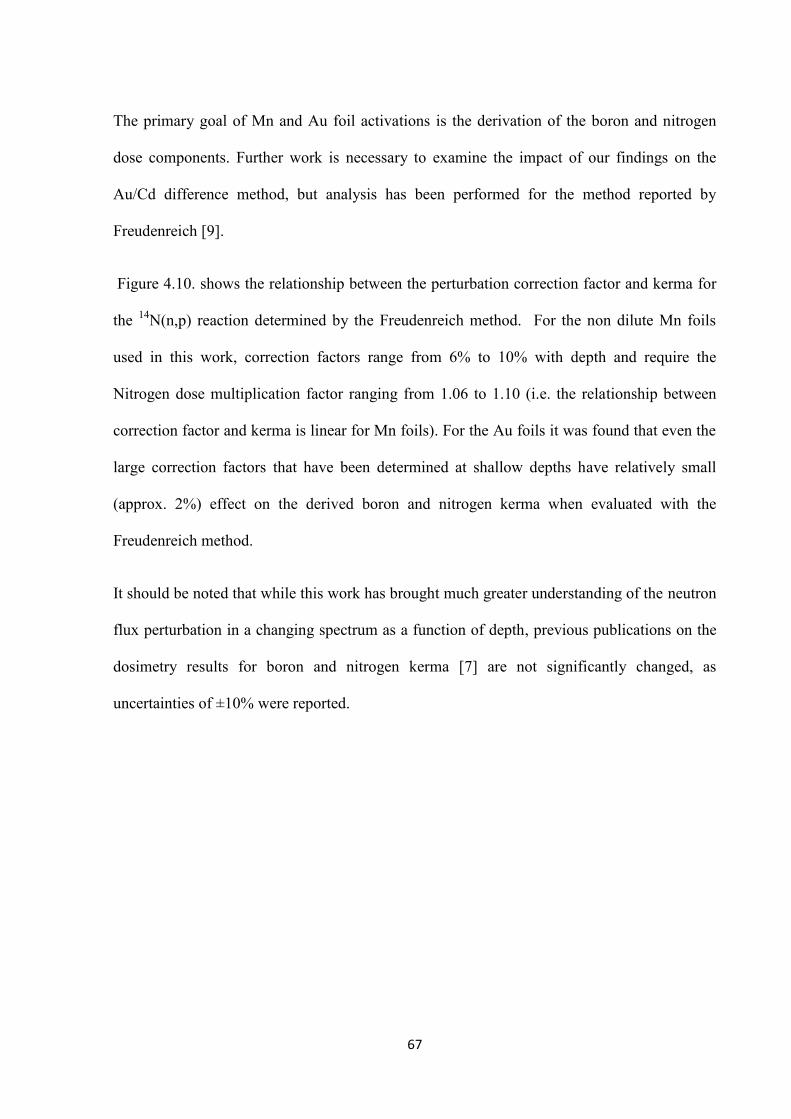
67
The primary goal of Mn and Au foil activations is the derivation of the boron and nitrogen
dose components. Further work is necessary to examine the impact of our findings on the
Au/Cd difference method, but analysis has been performed for the method reported by
Freudenreich [9].
Figure 4.10. shows the relationship between the perturbation correction factor and kerma for
the 14N(n,p) reaction determined by the Freudenreich method. For the non dilute Mn foils
used in this work, correction factors range from 6% to 10% with depth and require the
Nitrogen dose multiplication factor ranging from 1.06 to 1.10 (i.e. the relationship between
correction factor and kerma is linear for Mn foils). For the Au foils it was found that even the
large correction factors that have been determined at shallow depths have relatively small
(approx. 2%) effect on the derived boron and nitrogen kerma when evaluated with the
Freudenreich method.
It should be noted that while this work has brought much greater understanding of the neutron
flux perturbation in a changing spectrum as a function of depth, previous publications on the
dosimetry results for boron and nitrogen kerma [7] are not significantly changed, as
uncertainties of ±10% were reported.
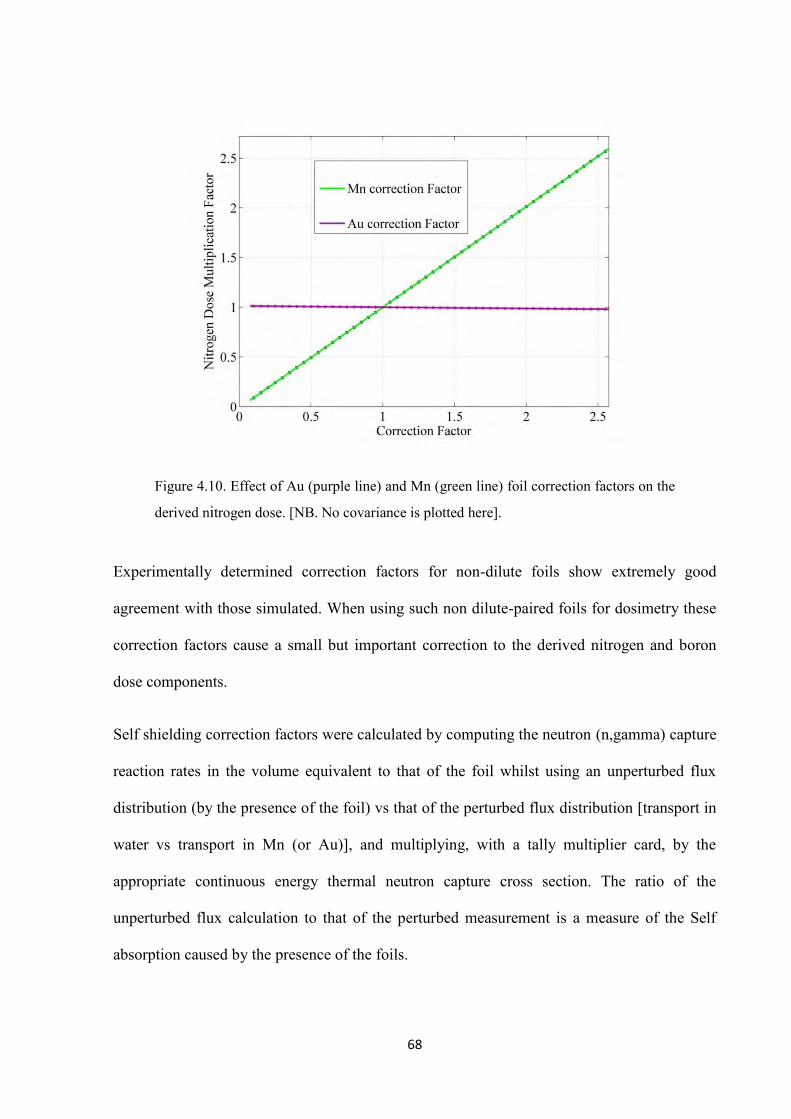
68
Figure 4.10. Effect of Au (purple line) and Mn (green line) foil correction factors on the
derived nitrogen dose. [NB. No covariance is plotted here].
Experimentally determined correction factors for non-dilute foils show extremely good
agreement with those simulated. When using such non dilute-paired foils for dosimetry these
correction factors cause a small but important correction to the derived nitrogen and boron
dose components.
Self shielding correction factors were calculated by computing the neutron (n,gamma) capture
reaction rates in the volume equivalent to that of the foil whilst using an unperturbed flux
distribution (by the presence of the foil) vs that of the perturbed flux distribution [transport in
water vs transport in Mn (or Au)], and multiplying, with a tally multiplier card, by the
appropriate continuous energy thermal neutron capture cross section. The ratio of the
unperturbed flux calculation to that of the perturbed measurement is a measure of the Self
absorption caused by the presence of the foils.
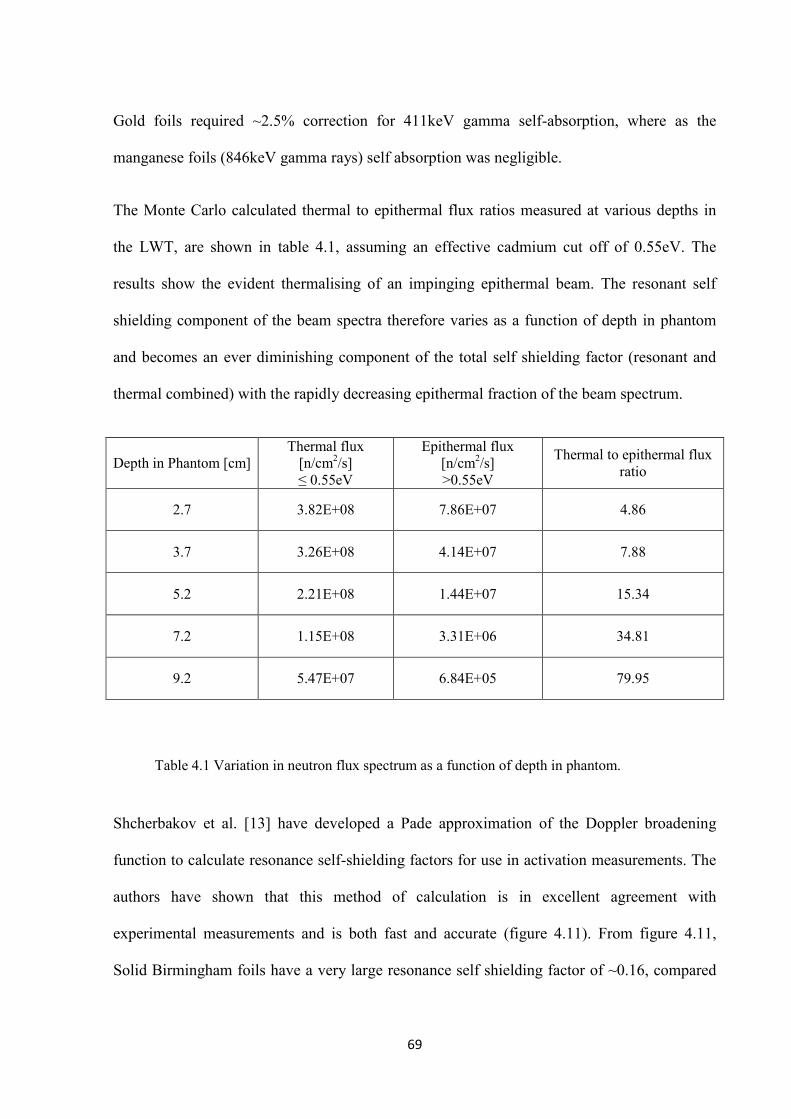
69
Gold foils required ~2.5% correction for 411keV gamma self-absorption, where as the
manganese foils (846keV gamma rays) self absorption was negligible.
The Monte Carlo calculated thermal to epithermal flux ratios measured at various depths in
the LWT, are shown in table 4.1, assuming an effective cadmium cut off of 0.55eV. The
results show the evident thermalising of an impinging epithermal beam. The resonant self
shielding component of the beam spectra therefore varies as a function of depth in phantom
and becomes an ever diminishing component of the total self shielding factor (resonant and
thermal combined) with the rapidly decreasing epithermal fraction of the beam spectrum.
Depth in Phantom [cm] Thermal flux
[n/cm2/s] ≤ 0.55eV
Epithermal flux [n/cm2/s] >0.55eV
Thermal to epithermal flux ratio
2.7 3.82E+08 7.86E+07 4.86
3.7 3.26E+08 4.14E+07 7.88
5.2 2.21E+08 1.44E+07 15.34
7.2 1.15E+08 3.31E+06 34.81
9.2 5.47E+07 6.84E+05 79.95
Table 4.1 Variation in neutron flux spectrum as a function of depth in phantom.
Shcherbakov et al. [13] have developed a Pade approximation of the Doppler broadening
function to calculate resonance self-shielding factors for use in activation measurements. The
authors have shown that this method of calculation is in excellent agreement with
experimental measurements and is both fast and accurate (figure 4.11). From figure 4.11,
Solid Birmingham foils have a very large resonance self shielding factor of ~0.16, compared
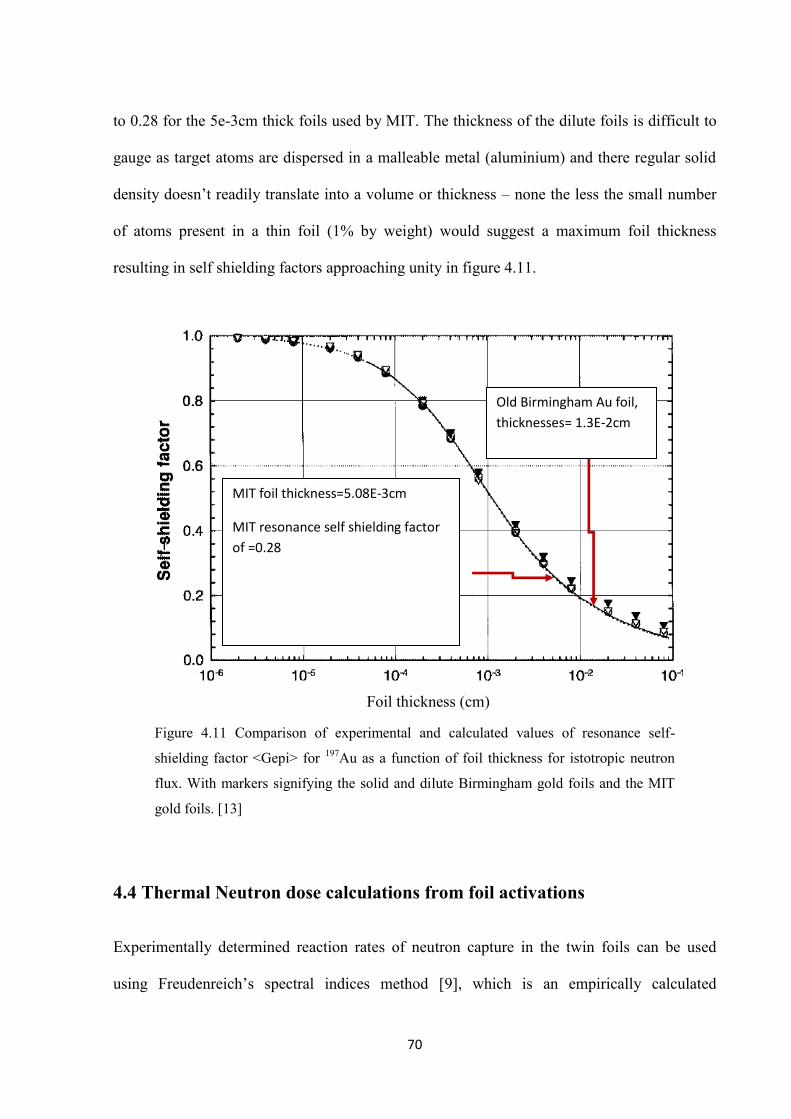
70
to 0.28 for the 5e-3cm thick foils used by MIT. The thickness of the dilute foils is difficult to
gauge as target atoms are dispersed in a malleable metal (aluminium) and there regular solid
density doesn’t readily translate into a volume or thickness – none the less the small number
of atoms present in a thin foil (1% by weight) would suggest a maximum foil thickness
resulting in self shielding factors approaching unity in figure 4.11.
Figure 4.11 Comparison of experimental and calculated values of resonance self-
shielding factor <Gepi> for 197Au as a function of foil thickness for istotropic neutron
flux. With markers signifying the solid and dilute Birmingham gold foils and the MIT
gold foils. [13]
4.4 Thermal Neutron dose calculations from foil activations
Experimentally determined reaction rates of neutron capture in the twin foils can be used
using Freudenreich’s spectral indices method [9], which is an empirically calculated
Old Birmingham Au foil,
thicknesses= 1.3E-2cm
MIT foil thickness=5.08E-3cm
MIT resonance self shielding factor
of =0.28
Foil thickness (cm)
71
relationship, to establish reaction rates in other elements of interest including nitrogen and
boron, from which their thermal neutron capture Kinetic Energy Released Per Unit Mass
[KERMA] and hence dose can be deduced.
Activating foils via the (n,γ) capture reaction is commonplace in BNCT dosimetry to
determine thermal neutron fluxes and doses. Various combinations of foil are commonly used
in clinical BNCT facilities: manganese and gold dilute foils in aluminium alloy are used by
the clinical facility based at the Fir1 reactor VTT, Finland. These are chosen because of the
manganese foil having a nearly 1/v absorption cross-section and the gold foil having a large
resonance peak and its resonance integral is large compared to its thermal cross section.
AMUMM
FENRKERMA
MnRMnRAuRNR
14
414 140.0/1005.5
(4.7),(4.8)
Where,
R is the reaction rate calculated from the empirical relationships
E is the average energy released per reaction i.e.
JNforMeVandBforMeV 131410 106.1*62.031.2
F is the fraction by weight of the isotope which is 1*10-6 for 1 μg/g 10B, and
1x10⁻² for 1% 14N
M is the atomic mass of the isotope (10 for 10B, and 14 for 14N)
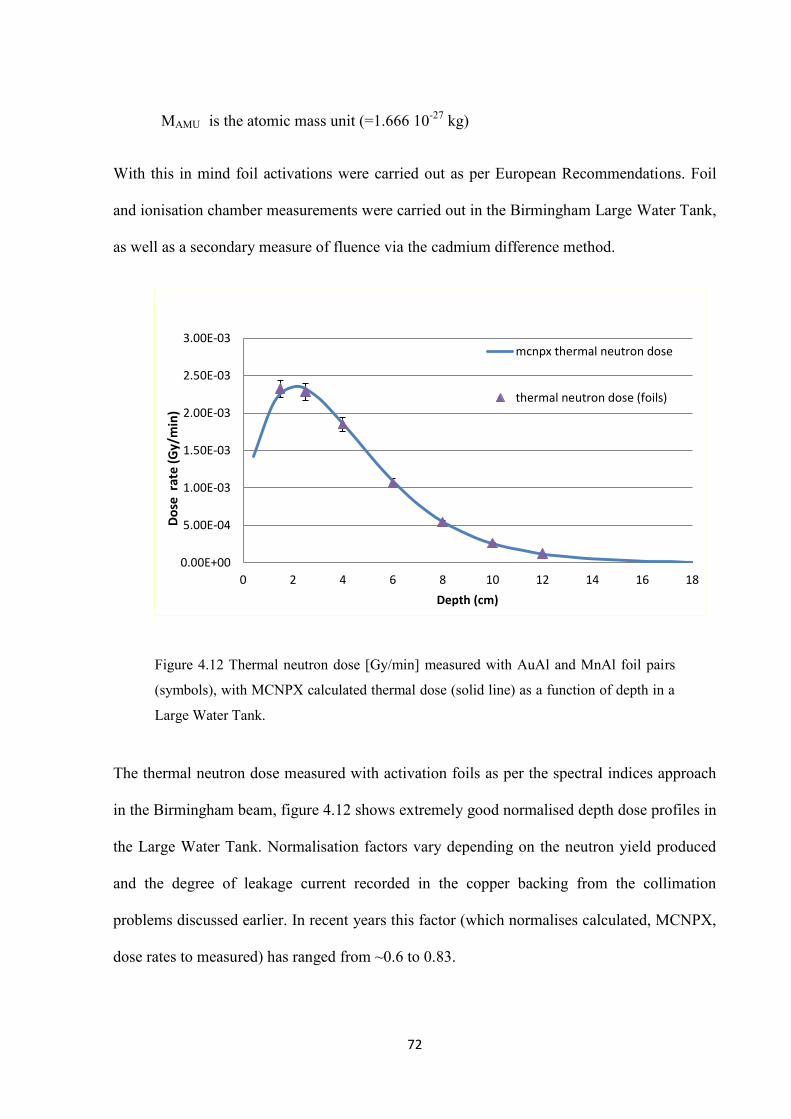
72
MAMU is the atomic mass unit (=1.666 10-27 kg)
With this in mind foil activations were carried out as per European Recommendations. Foil
and ionisation chamber measurements were carried out in the Birmingham Large Water Tank,
as well as a secondary measure of fluence via the cadmium difference method.
Figure 4.12 Thermal neutron dose [Gy/min] measured with AuAl and MnAl foil pairs
(symbols), with MCNPX calculated thermal dose (solid line) as a function of depth in a
Large Water Tank.
The thermal neutron dose measured with activation foils as per the spectral indices approach
in the Birmingham beam, figure 4.12 shows extremely good normalised depth dose profiles in
the Large Water Tank. Normalisation factors vary depending on the neutron yield produced
and the degree of leakage current recorded in the copper backing from the collimation
problems discussed earlier. In recent years this factor (which normalises calculated, MCNPX,
dose rates to measured) has ranged from ~0.6 to 0.83.
0.00E+00
5.00E-04
1.00E-03
1.50E-03
2.00E-03
2.50E-03
3.00E-03
0 2 4 6 8 10 12 14 16 18
Do
se r
ate
(Gy/
min
)
Depth (cm)
mcnpx thermal neutron dose
thermal neutron dose (foils)
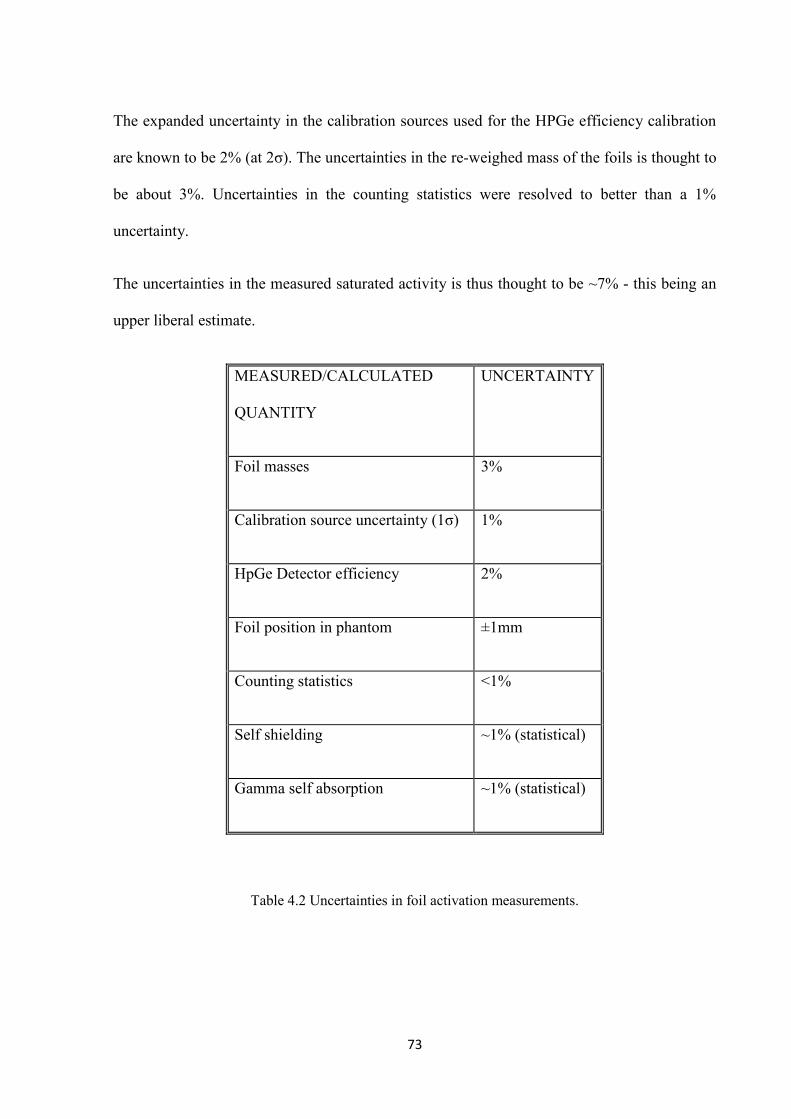
73
The expanded uncertainty in the calibration sources used for the HPGe efficiency calibration
are known to be 2% (at 2σ). The uncertainties in the re-weighed mass of the foils is thought to
be about 3%. Uncertainties in the counting statistics were resolved to better than a 1%
uncertainty.
The uncertainties in the measured saturated activity is thus thought to be ~7% - this being an
upper liberal estimate.
MEASURED/CALCULATED
QUANTITY
UNCERTAINTY
Foil masses 3%
Calibration source uncertainty (1σ) 1%
HpGe Detector efficiency 2%
Foil position in phantom ±1mm
Counting statistics <1%
Self shielding ~1% (statistical)
Gamma self absorption ~1% (statistical)
Table 4.2 Uncertainties in foil activation measurements.

74
In order to minimise the effects of changing beam characteristics between dosimetry
measurements and cell irradiations ‘local’ foil dosimetry measurements were carried out in
close proximity, often on the same day, as cell irradiations until beam collimation issues can
be fixed.
75
Chapter 5
NEUTRON INTERACTIONS AND DOSE COMPONENTS
The dominant interactions resulting from a broad spectrum of low energy, overwhelmingly
thermal neutrons interacting with organic matter (such as human brain tissue) arise primarily
in the abundant elements: carbon, hydrogen, nitrogen, oxygen and chlorine, via thermal
neutron capture reactions resulting in the release of an even more diverse set of particles
including, protons, gamma rays and recoiling carbon ions.
The major sub-components of the dose produced by an epithermal neutron beam impinging
on boron loaded tissue consist of:
Boron Dose to tissue (15 µg/g of 10Boron) 10B(n,α)7Li
Hydrogen Dose (Proton recoil) 1H(n,n')1p. The fast neutron dose or hydrogen dose HD
is mainly due to the proton recoil reactions for high energy neutrons in tissue.
Protons, produced by pnnH ,1 reaction, deposit their energy locally. This dose
component is highest at the skin surface and decreases rapidly with depth.
Thermal neutron dose or nitrogen dose ND is due to the thermal neutron capture by
nitrogen nuclei: CpnN 1414 , . Dose results from locally deposited energy from the
energetic proton (580 keV) and the recoiling C14 nucleus. Thermal neutron capture in
nitrogen constitutes 96.4% of the total thermal neutron dose in Brain tissue – thus the
terms thermal dose and nitrogen dose are often used interchangeably.
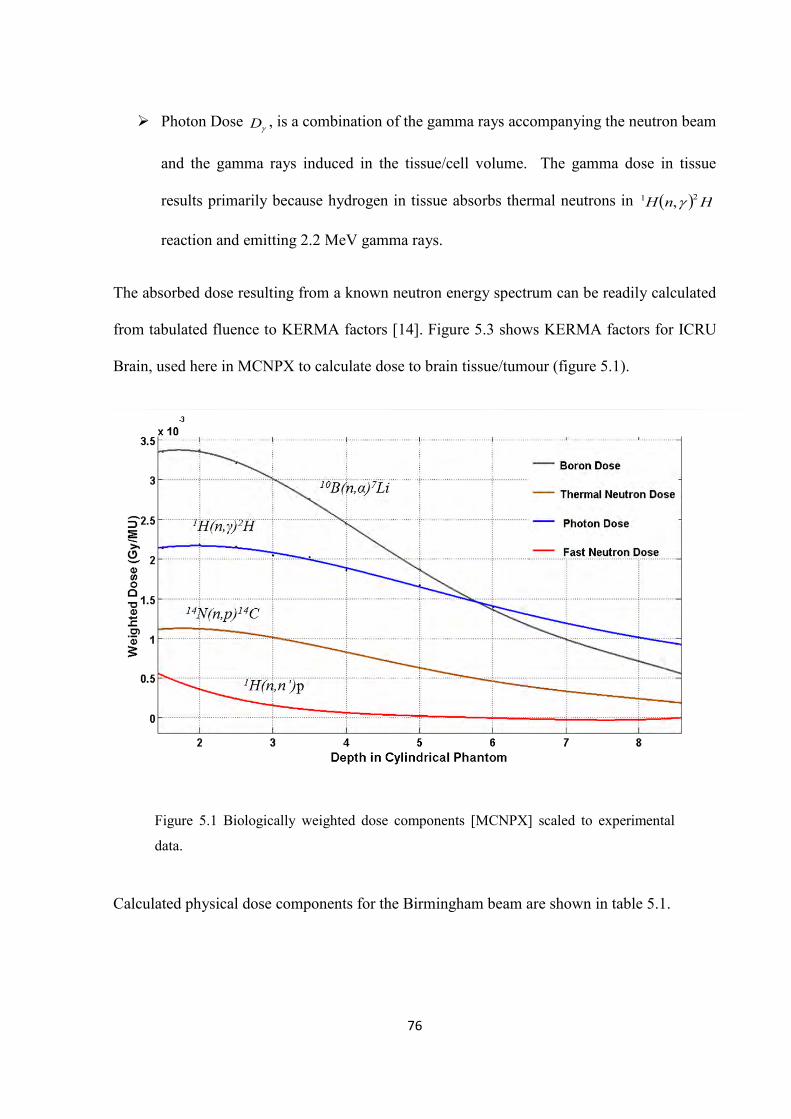
76
Photon Dose D , is a combination of the gamma rays accompanying the neutron beam
and the gamma rays induced in the tissue/cell volume. The gamma dose in tissue
results primarily because hydrogen in tissue absorbs thermal neutrons in HnH 21 ,
reaction and emitting 2.2 MeV gamma rays.
The absorbed dose resulting from a known neutron energy spectrum can be readily calculated
from tabulated fluence to KERMA factors [14]. Figure 5.3 shows KERMA factors for ICRU
Brain, used here in MCNPX to calculate dose to brain tissue/tumour (figure 5.1).
Figure 5.1 Biologically weighted dose components [MCNPX] scaled to experimental
data.
Calculated physical dose components for the Birmingham beam are shown in table 5.1.
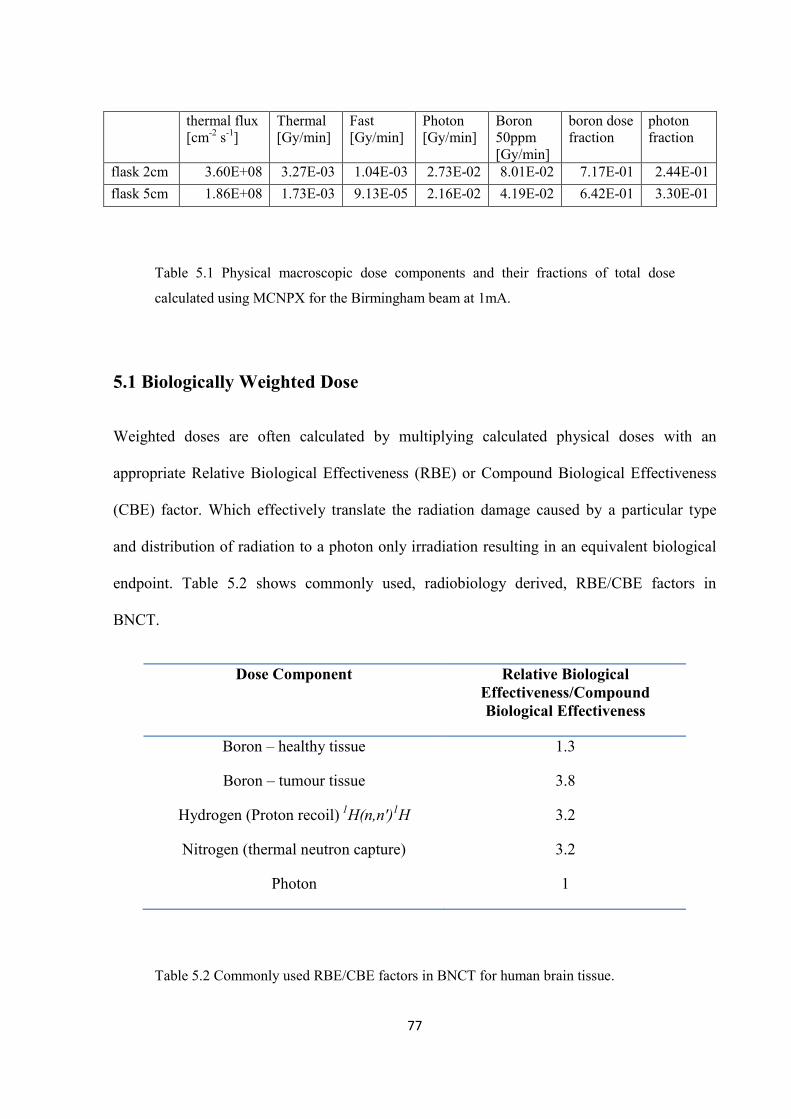
77
thermal flux [cm-2 s-1]
Thermal [Gy/min]
Fast [Gy/min]
Photon [Gy/min]
Boron 50ppm [Gy/min]
boron dose fraction
photon fraction
flask 2cm 3.60E+08 3.27E-03 1.04E-03 2.73E-02 8.01E-02 7.17E-01 2.44E-01 flask 5cm 1.86E+08 1.73E-03 9.13E-05 2.16E-02 4.19E-02 6.42E-01 3.30E-01
Table 5.1 Physical macroscopic dose components and their fractions of total dose
calculated using MCNPX for the Birmingham beam at 1mA.
5.1 Biologically Weighted Dose
Weighted doses are often calculated by multiplying calculated physical doses with an
appropriate Relative Biological Effectiveness (RBE) or Compound Biological Effectiveness
(CBE) factor. Which effectively translate the radiation damage caused by a particular type
and distribution of radiation to a photon only irradiation resulting in an equivalent biological
endpoint. Table 5.2 shows commonly used, radiobiology derived, RBE/CBE factors in
BNCT.
Dose Component Relative Biological Effectiveness/Compound Biological Effectiveness
Boron – healthy tissue 1.3
Boron – tumour tissue 3.8
Hydrogen (Proton recoil) 1H(n,n')1H 3.2
Nitrogen (thermal neutron capture) 3.2
Photon 1
Table 5.2 Commonly used RBE/CBE factors in BNCT for human brain tissue.
78
The four most significant weighted dose rate components summed give a total tissue or
tumour weighted dose rate:
DRBEzDRBEzDCBEzDD HHNNtisBBtistotal ,,
Where
tistotalD , = Biologically weighted Dose rate to Healthy Tissue at that point
zDB = Boron Dose rate in tissue at (z)
tisBCBE , = Compound Biological Effectiveness of Boron in tissue.
zDN = Nitrogen Dose rate
NRBE = Relative Biological Effectiveness of Nitrogen
zDH = Hydrogen Dose rate
HRBE = Relative Biological Effectiveness of Hydrogen
D = Photon Dose rate
tumBCBE , = Compound Biological Effectiveness of Boron in tumour
The summed and weighted biologically relevant doses to brain tumour and healthy tissue are
shown plotted in Fig 5.2. The tumour dose being far greater than the tissue dose.
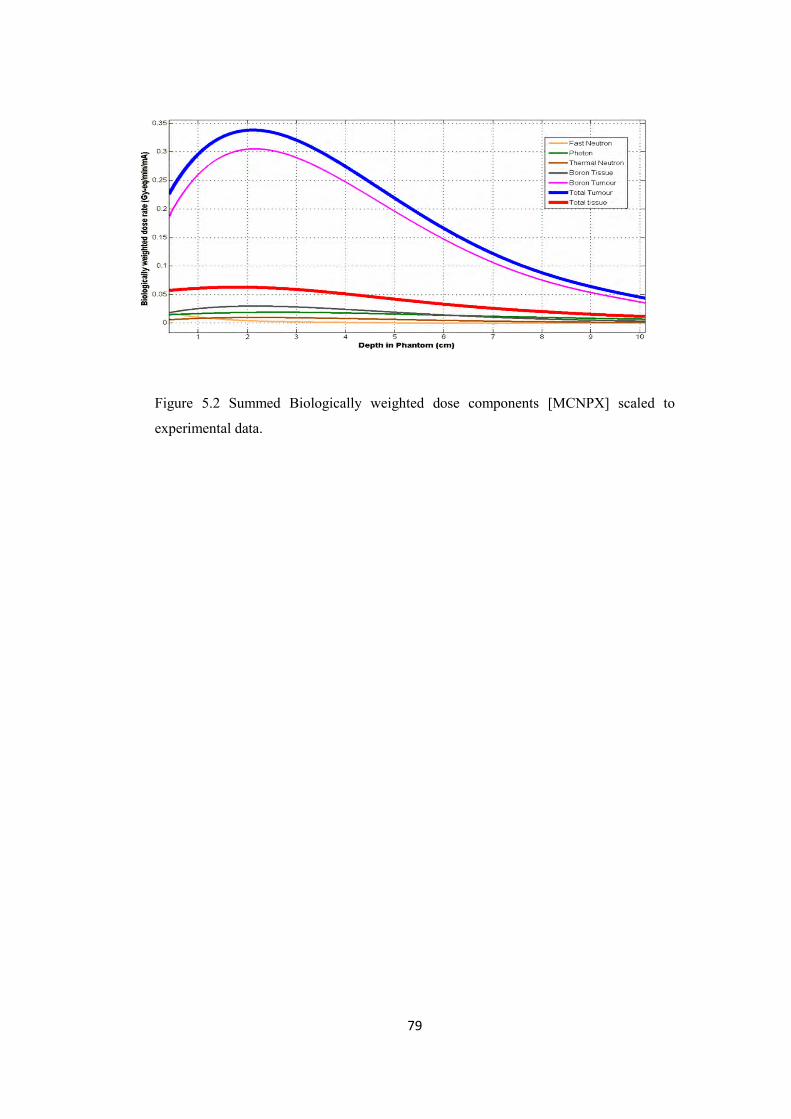
79
Figure 5.2 Summed Biologically weighted dose components [MCNPX] scaled to
experimental data.
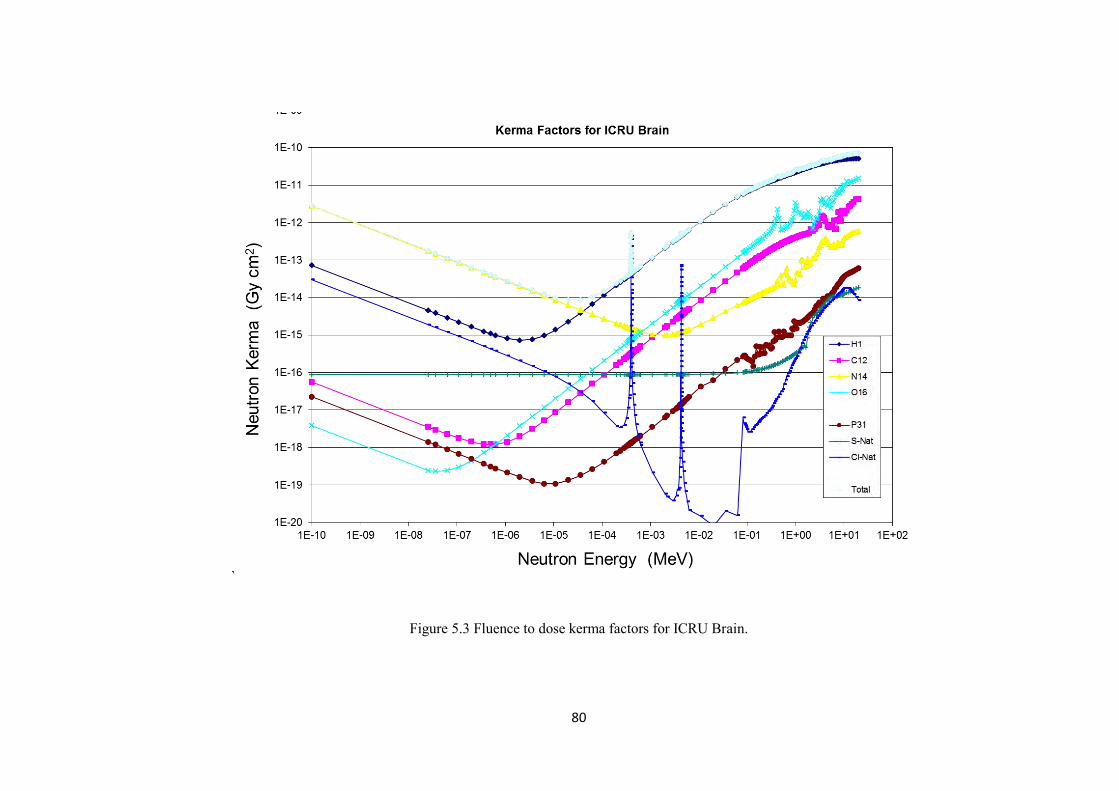
80
`
Figure 5.3 Fluence to dose kerma factors for ICRU Brain.
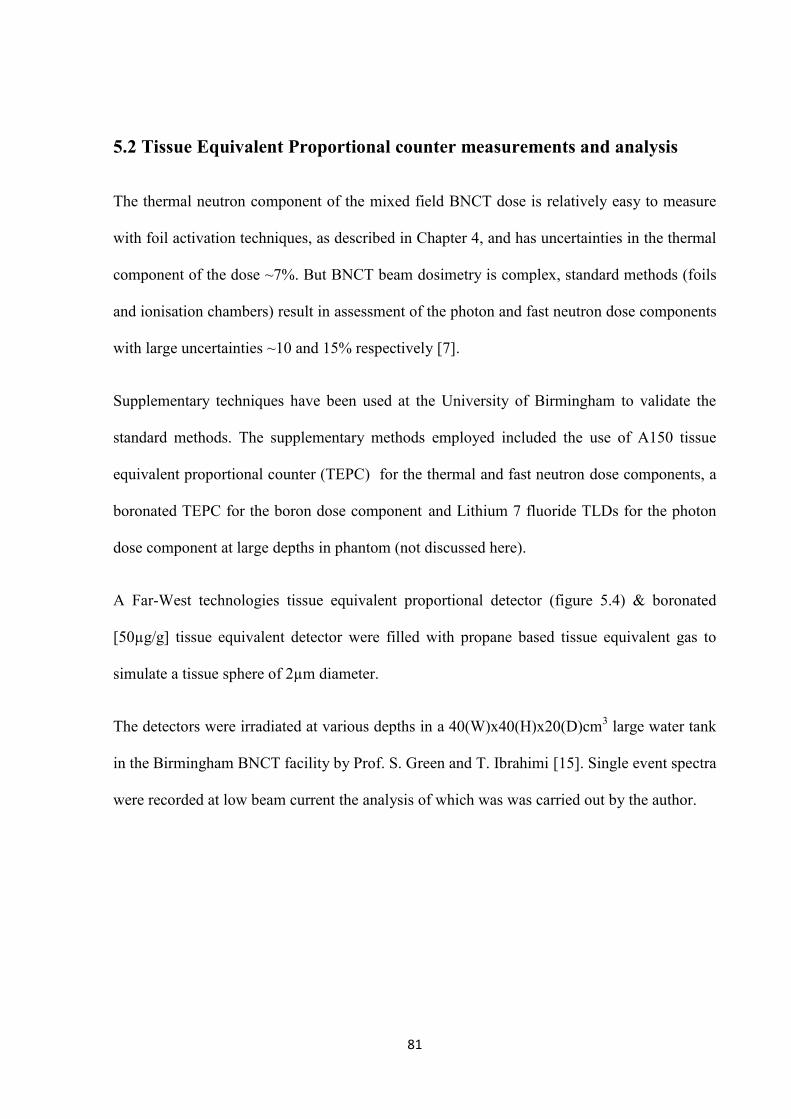
81
5.2 Tissue Equivalent Proportional counter measurements and analysis
The thermal neutron component of the mixed field BNCT dose is relatively easy to measure
with foil activation techniques, as described in Chapter 4, and has uncertainties in the thermal
component of the dose ~7%. But BNCT beam dosimetry is complex, standard methods (foils
and ionisation chambers) result in assessment of the photon and fast neutron dose components
with large uncertainties ~10 and 15% respectively [7].
Supplementary techniques have been used at the University of Birmingham to validate the
standard methods. The supplementary methods employed included the use of A150 tissue
equivalent proportional counter (TEPC) for the thermal and fast neutron dose components, a
boronated TEPC for the boron dose component and Lithium 7 fluoride TLDs for the photon
dose component at large depths in phantom (not discussed here).
A Far-West technologies tissue equivalent proportional detector (figure 5.4) & boronated
[50µg/g] tissue equivalent detector were filled with propane based tissue equivalent gas to
simulate a tissue sphere of 2µm diameter.
The detectors were irradiated at various depths in a 40(W)x40(H)x20(D)cm3 large water tank
in the Birmingham BNCT facility by Prof. S. Green and T. Ibrahimi [15]. Single event spectra
were recorded at low beam current the analysis of which was was carried out by the author.
82
Figure 5.4 Schematic and picture of the Birmingham TEPC.
Benchmarking in-house software is extremely important when the results of such efforts can
potentially impact beam shaping design and treatment planning calculations. With this in
mind the pulse height distributions from proportinal counter measurements were analysed in
Excel with spreadsheets benchmarked against NIST traceable Cf-252 source data
measurements made by the US - Pacific Northwest National Laboratory (PNNL).
Results were processed in the Birmingham dosimetry spreadsheet and compared to results
from the PNNL TEPC pulse-height analysis software Version 2.00R, using the same proton
drop points and neutron start channels. The Birmingham spreadsheets and data processing
show excellent agreement with the US national laboratory’s derived photon and neutron dose
rates, frequency mean and dose mean lineal energies, all derived parameters differing by less
than 1%.
83
Lineal energy calibration is based on a distinct spectral feature, namely the proton edge,
which is due to the fact that the maximum energy that any proton can deposit is
approximately 95 keV/µm. The use of the proton edge feature provides a calibration, which is
independent of any external standards, and as such can provide valuable comparison to the
paired ionisation chamber technique [22].
For the Birmingham mixed field, neutron and gamma in phantom measurment, a proton drop
point (edge) of 140keV/µm was taken from the PhD work of G. Taylor [16], which showed
the stability of the edge at various neutron energies from 1 to 19MeV. For the boronated
proportional counter an alpha ‘edge’ of of 372keV/µm was taken with a drop point at the
midpoint of the falling edge due to its lower sensitivity to resolution effects [16].
5.2.1 DOSE SEPARATION AND KERMA CORRECTION
Monte Carlo simulations were carried out to determine the fraction of the total neutron dose,
in the absence of boron, which contributes to the total (thermal + fast) neutron dose measured
by the proportional counters and to see if it was separable into its component fractions by
Monte Carlo calculations.
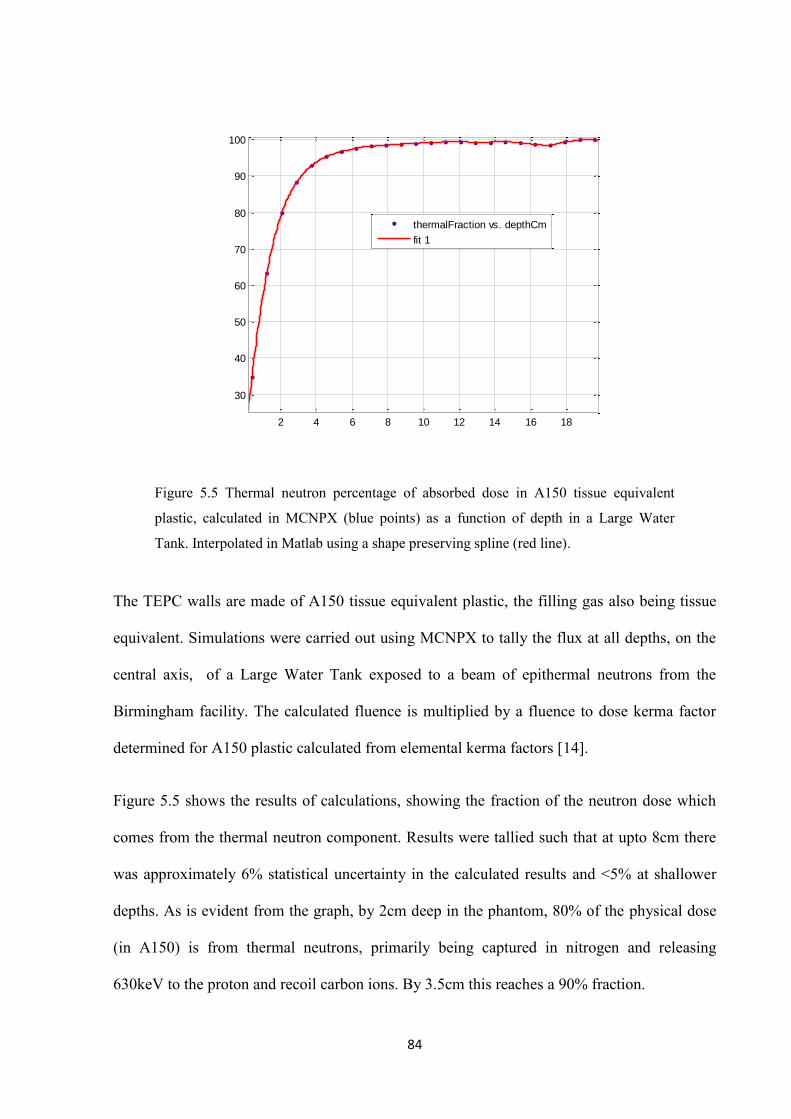
84
Figure 5.5 Thermal neutron percentage of absorbed dose in A150 tissue equivalent
plastic, calculated in MCNPX (blue points) as a function of depth in a Large Water
Tank. Interpolated in Matlab using a shape preserving spline (red line).
The TEPC walls are made of A150 tissue equivalent plastic, the filling gas also being tissue
equivalent. Simulations were carried out using MCNPX to tally the flux at all depths, on the
central axis, of a Large Water Tank exposed to a beam of epithermal neutrons from the
Birmingham facility. The calculated fluence is multiplied by a fluence to dose kerma factor
determined for A150 plastic calculated from elemental kerma factors [14].
Figure 5.5 shows the results of calculations, showing the fraction of the neutron dose which
comes from the thermal neutron component. Results were tallied such that at upto 8cm there
was approximately 6% statistical uncertainty in the calculated results and <5% at shallower
depths. As is evident from the graph, by 2cm deep in the phantom, 80% of the physical dose
(in A150) is from thermal neutrons, primarily being captured in nitrogen and releasing
630keV to the proton and recoil carbon ions. By 3.5cm this reaches a 90% fraction.
2 4 6 8 10 12 14 16 18
30
40
50
60
70
80
90
100
thermalFraction vs. depthCm
fit 1
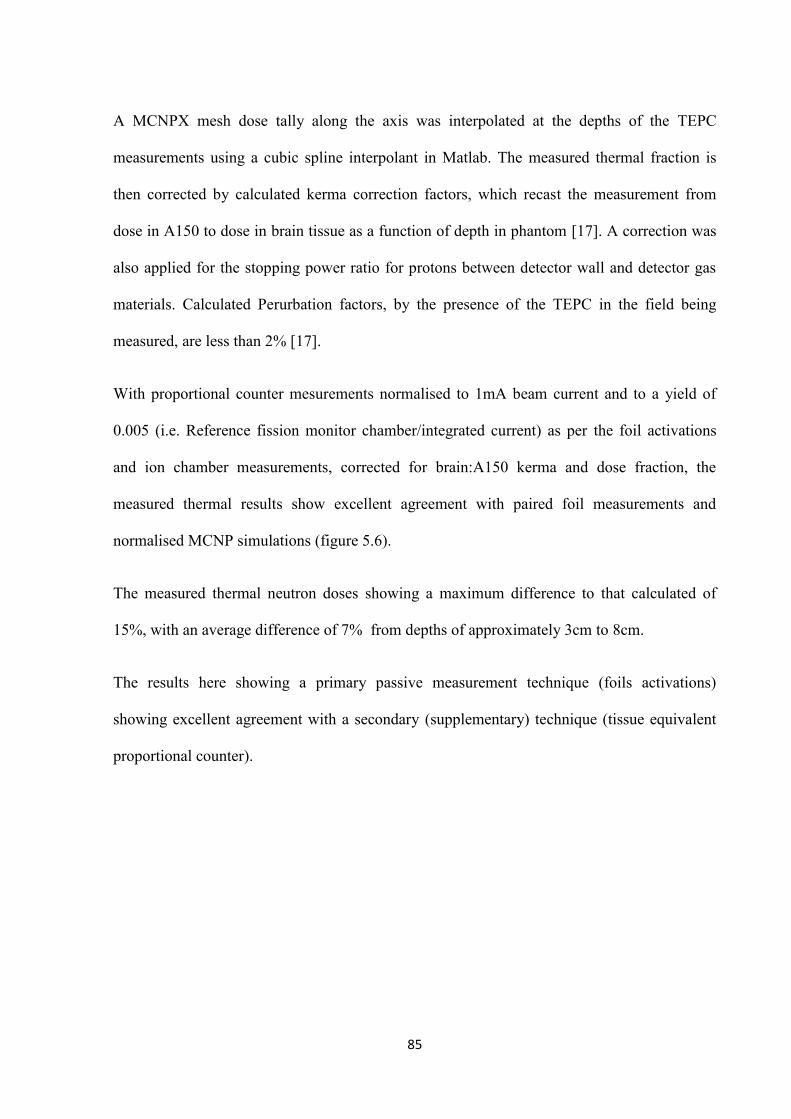
85
A MCNPX mesh dose tally along the axis was interpolated at the depths of the TEPC
measurements using a cubic spline interpolant in Matlab. The measured thermal fraction is
then corrected by calculated kerma correction factors, which recast the measurement from
dose in A150 to dose in brain tissue as a function of depth in phantom [17]. A correction was
also applied for the stopping power ratio for protons between detector wall and detector gas
materials. Calculated Perurbation factors, by the presence of the TEPC in the field being
measured, are less than 2% [17].
With proportional counter mesurements normalised to 1mA beam current and to a yield of
0.005 (i.e. Reference fission monitor chamber/integrated current) as per the foil activations
and ion chamber measurements, corrected for brain:A150 kerma and dose fraction, the
measured thermal results show excellent agreement with paired foil measurements and
normalised MCNP simulations (figure 5.6).
The measured thermal neutron doses showing a maximum difference to that calculated of
15%, with an average difference of 7% from depths of approximately 3cm to 8cm.
The results here showing a primary passive measurement technique (foils activations)
showing excellent agreement with a secondary (supplementary) technique (tissue equivalent
proportional counter).
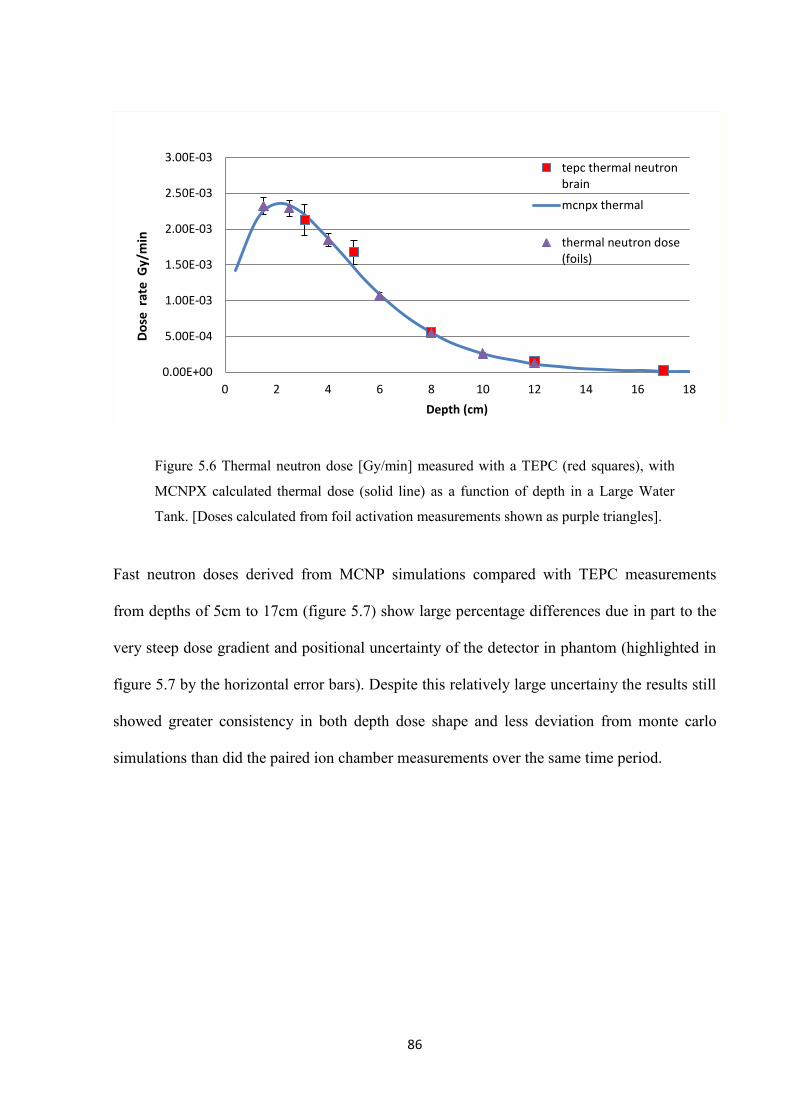
86
Figure 5.6 Thermal neutron dose [Gy/min] measured with a TEPC (red squares), with
MCNPX calculated thermal dose (solid line) as a function of depth in a Large Water
Tank. [Doses calculated from foil activation measurements shown as purple triangles].
Fast neutron doses derived from MCNP simulations compared with TEPC measurements
from depths of 5cm to 17cm (figure 5.7) show large percentage differences due in part to the
very steep dose gradient and positional uncertainty of the detector in phantom (highlighted in
figure 5.7 by the horizontal error bars). Despite this relatively large uncertainy the results still
showed greater consistency in both depth dose shape and less deviation from monte carlo
simulations than did the paired ion chamber measurements over the same time period.
0.00E+00
5.00E-04
1.00E-03
1.50E-03
2.00E-03
2.50E-03
3.00E-03
0 2 4 6 8 10 12 14 16 18
Do
se r
ate
Gy/
min
Depth (cm)
tepc thermal neutronbrain
mcnpx thermal
thermal neutron dose(foils)
87
Figure 5.7 Fast neutron dose rate [Gy/min] measured with a TEPC (red squares), with
MCNPX calculated fast dose rate (solid line) as a function of depth in a Large Water
Tank.
The results of the Boronated TEPC measurements (figure 5.8) show the characteristic
underestimate of dose component as has been noted by many BNCT groups around the world
[42] and is most likely due to a combination of factors, including boron grain size, surface
distribution of the grains in A150 and self shielding effects within the grain.
0.00E+00
1.00E-05
2.00E-05
3.00E-05
4.00E-05
5.00E-05
6.00E-05
7.00E-05
8.00E-05
4 6 8 10 12 14 16 18
Do
se r
ate
Gy/
min
Depth (cm)
mcnpxthermal
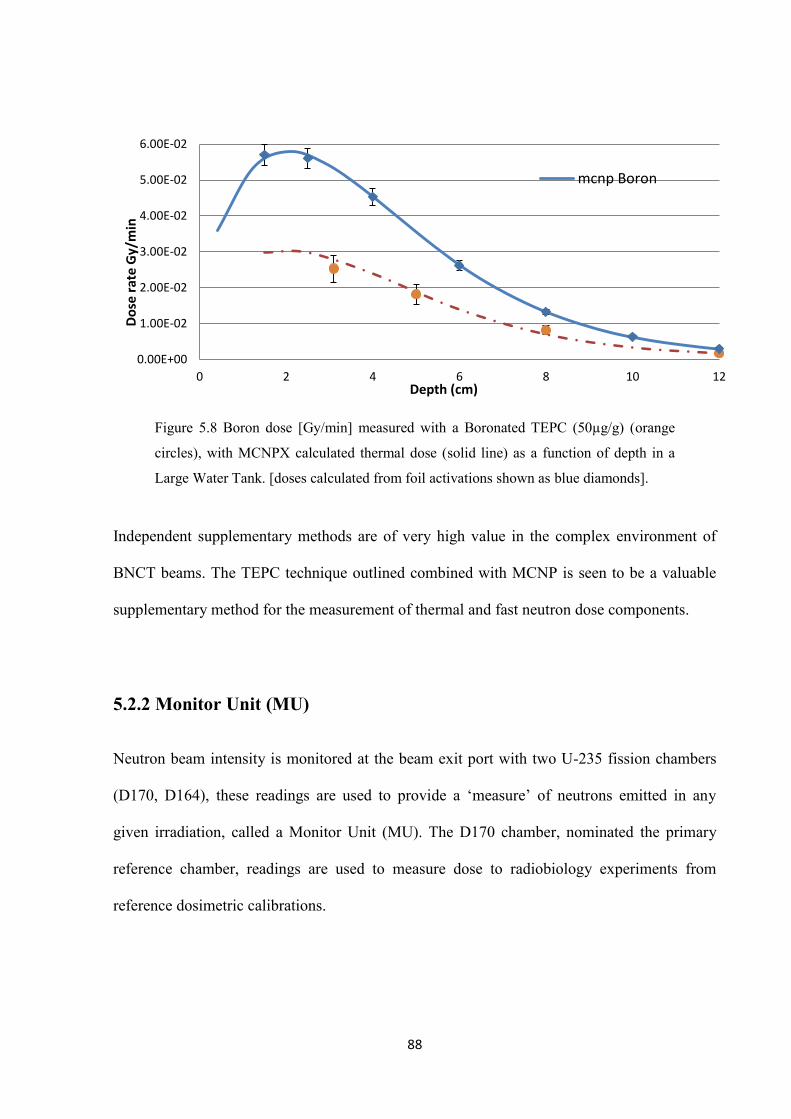
88
Figure 5.8 Boron dose [Gy/min] measured with a Boronated TEPC (50µg/g) (orange
circles), with MCNPX calculated thermal dose (solid line) as a function of depth in a
Large Water Tank. [doses calculated from foil activations shown as blue diamonds].
Independent supplementary methods are of very high value in the complex environment of
BNCT beams. The TEPC technique outlined combined with MCNP is seen to be a valuable
supplementary method for the measurement of thermal and fast neutron dose components.
5.2.2 Monitor Unit (MU)
Neutron beam intensity is monitored at the beam exit port with two U-235 fission chambers
(D170, D164), these readings are used to provide a ‘measure’ of neutrons emitted in any
given irradiation, called a Monitor Unit (MU). The D170 chamber, nominated the primary
reference chamber, readings are used to measure dose to radiobiology experiments from
reference dosimetric calibrations.
0.00E+00
1.00E-02
2.00E-02
3.00E-02
4.00E-02
5.00E-02
6.00E-02
0 2 4 6 8 10 12
Do
se r
ate
Gy/
min
Depth (cm)
mcnp Boron
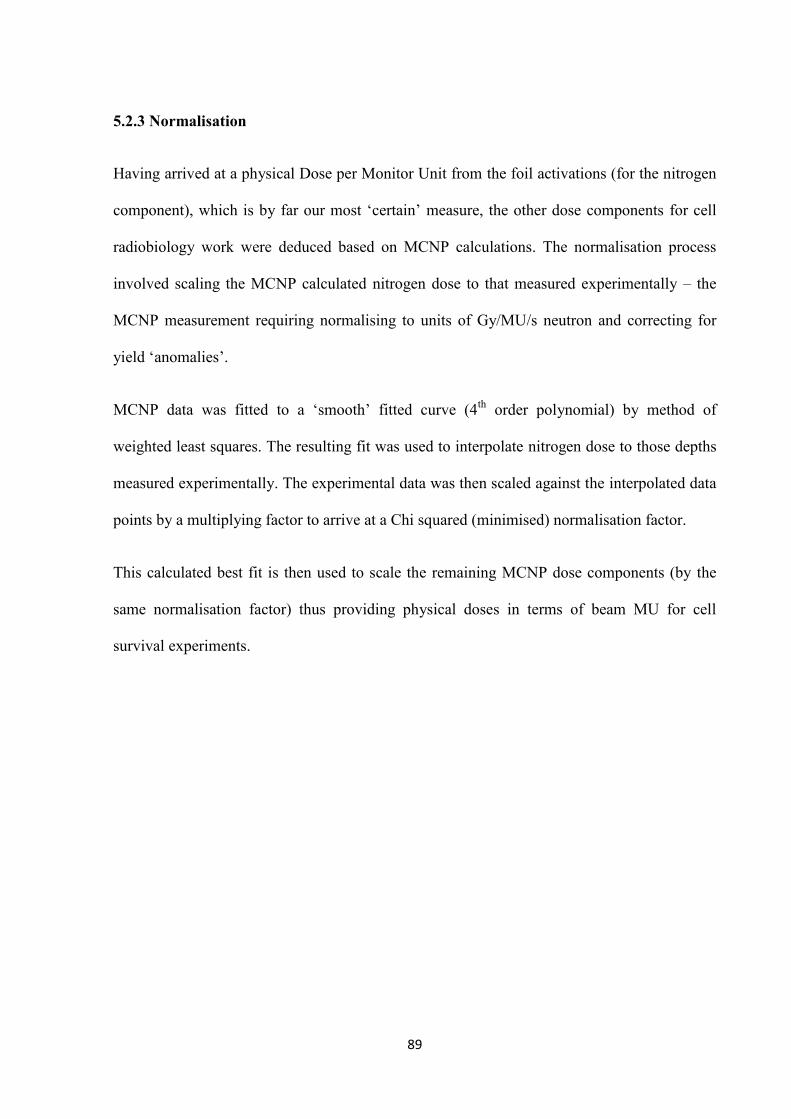
89
5.2.3 Normalisation
Having arrived at a physical Dose per Monitor Unit from the foil activations (for the nitrogen
component), which is by far our most ‘certain’ measure, the other dose components for cell
radiobiology work were deduced based on MCNP calculations. The normalisation process
involved scaling the MCNP calculated nitrogen dose to that measured experimentally – the
MCNP measurement requiring normalising to units of Gy/MU/s neutron and correcting for
yield ‘anomalies’.
MCNP data was fitted to a ‘smooth’ fitted curve (4th order polynomial) by method of
weighted least squares. The resulting fit was used to interpolate nitrogen dose to those depths
measured experimentally. The experimental data was then scaled against the interpolated data
points by a multiplying factor to arrive at a Chi squared (minimised) normalisation factor.
This calculated best fit is then used to scale the remaining MCNP dose components (by the
same normalisation factor) thus providing physical doses in terms of beam MU for cell
survival experiments.
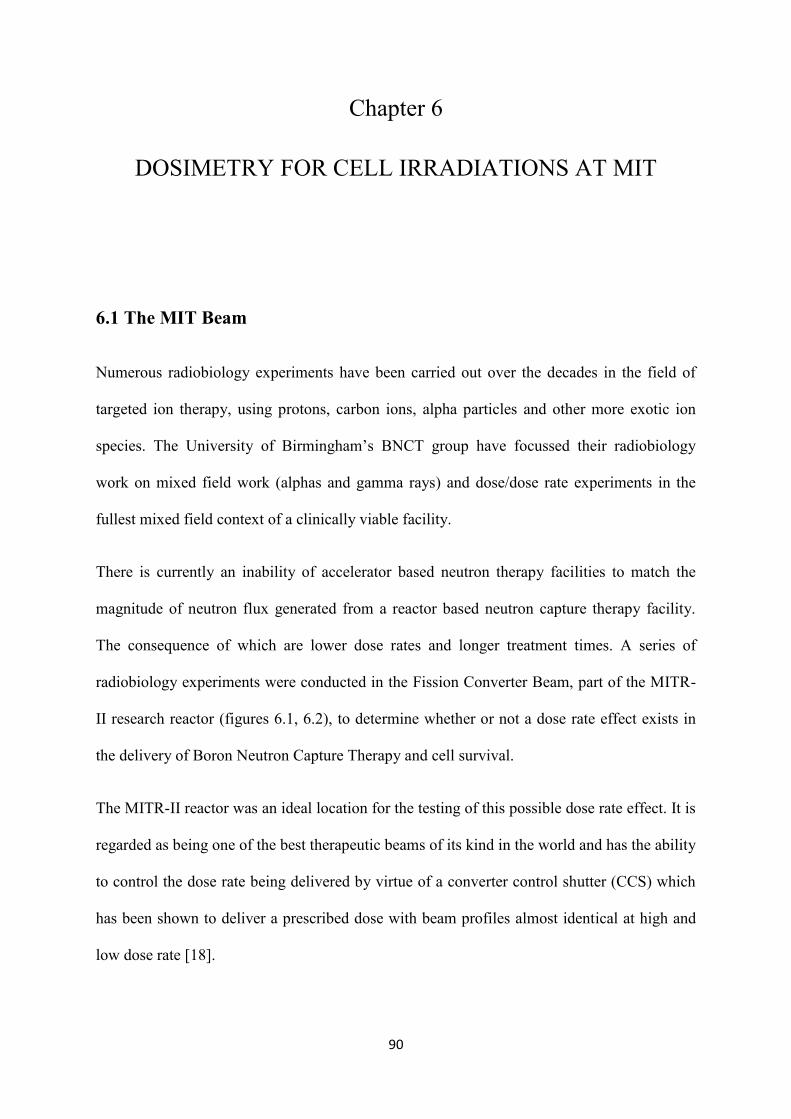
90
Chapter 6
DOSIMETRY FOR CELL IRRADIATIONS AT MIT
6.1 The MIT Beam
Numerous radiobiology experiments have been carried out over the decades in the field of
targeted ion therapy, using protons, carbon ions, alpha particles and other more exotic ion
species. The University of Birmingham’s BNCT group have focussed their radiobiology
work on mixed field work (alphas and gamma rays) and dose/dose rate experiments in the
fullest mixed field context of a clinically viable facility.
There is currently an inability of accelerator based neutron therapy facilities to match the
magnitude of neutron flux generated from a reactor based neutron capture therapy facility.
The consequence of which are lower dose rates and longer treatment times. A series of
radiobiology experiments were conducted in the Fission Converter Beam, part of the MITR-
II research reactor (figures 6.1, 6.2), to determine whether or not a dose rate effect exists in
the delivery of Boron Neutron Capture Therapy and cell survival.
The MITR-II reactor was an ideal location for the testing of this possible dose rate effect. It is
regarded as being one of the best therapeutic beams of its kind in the world and has the ability
to control the dose rate being delivered by virtue of a converter control shutter (CCS) which
has been shown to deliver a prescribed dose with beam profiles almost identical at high and
low dose rate [18].
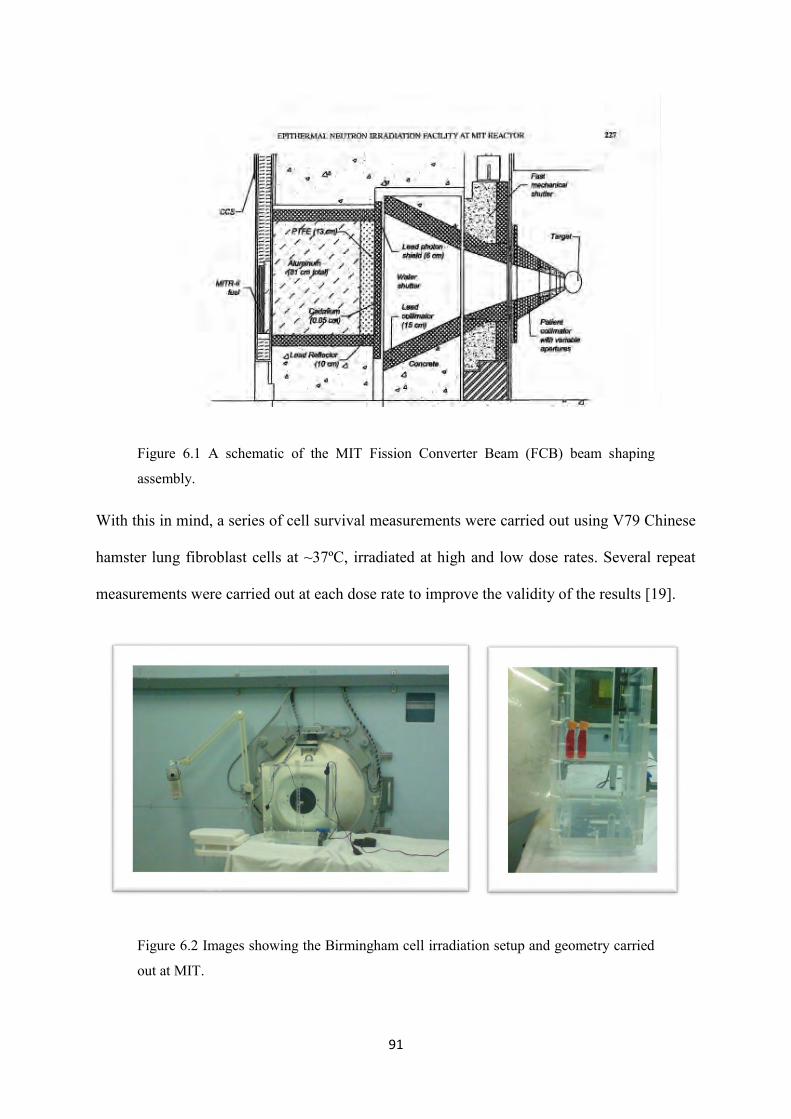
91
Figure 6.1 A schematic of the MIT Fission Converter Beam (FCB) beam shaping
assembly.
With this in mind, a series of cell survival measurements were carried out using V79 Chinese
hamster lung fibroblast cells at ~37ºC, irradiated at high and low dose rates. Several repeat
measurements were carried out at each dose rate to improve the validity of the results [19].
Figure 6.2 Images showing the Birmingham cell irradiation setup and geometry carried
out at MIT.
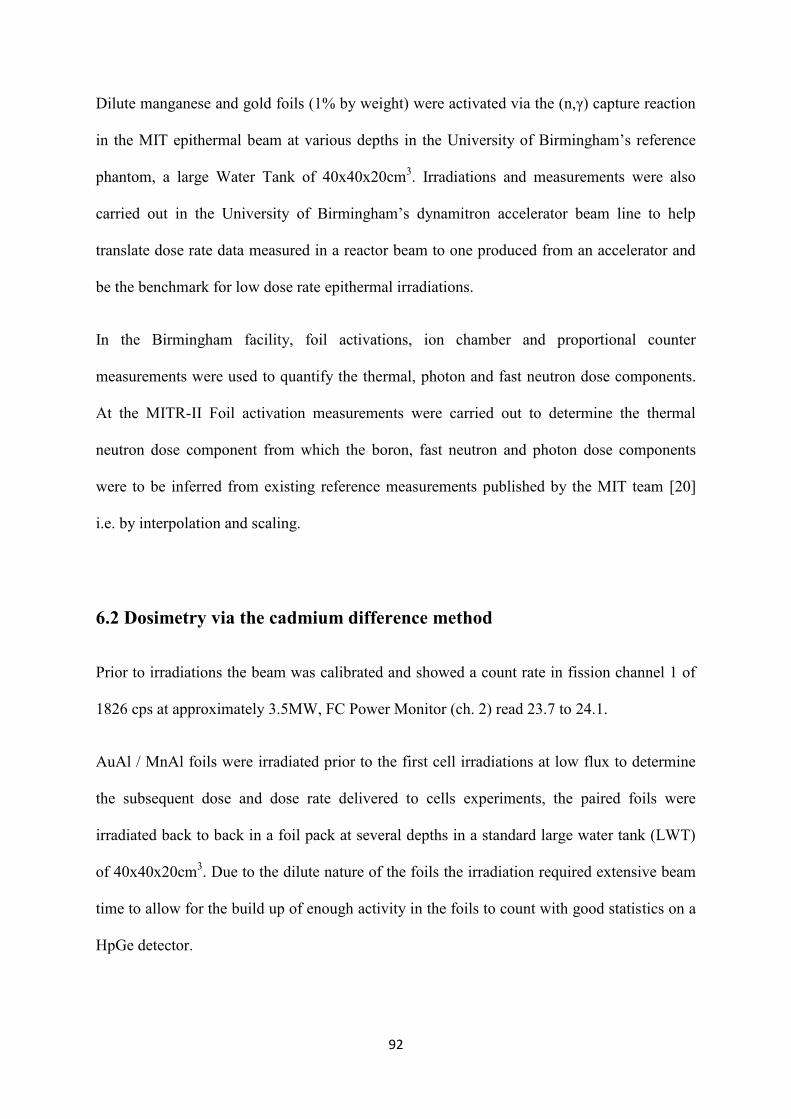
92
Dilute manganese and gold foils (1% by weight) were activated via the (n,γ) capture reaction
in the MIT epithermal beam at various depths in the University of Birmingham’s reference
phantom, a large Water Tank of 40x40x20cm3. Irradiations and measurements were also
carried out in the University of Birmingham’s dynamitron accelerator beam line to help
translate dose rate data measured in a reactor beam to one produced from an accelerator and
be the benchmark for low dose rate epithermal irradiations.
In the Birmingham facility, foil activations, ion chamber and proportional counter
measurements were used to quantify the thermal, photon and fast neutron dose components.
At the MITR-II Foil activation measurements were carried out to determine the thermal
neutron dose component from which the boron, fast neutron and photon dose components
were to be inferred from existing reference measurements published by the MIT team [20]
i.e. by interpolation and scaling.
6.2 Dosimetry via the cadmium difference method
Prior to irradiations the beam was calibrated and showed a count rate in fission channel 1 of
1826 cps at approximately 3.5MW, FC Power Monitor (ch. 2) read 23.7 to 24.1.
AuAl / MnAl foils were irradiated prior to the first cell irradiations at low flux to determine
the subsequent dose and dose rate delivered to cells experiments, the paired foils were
irradiated back to back in a foil pack at several depths in a standard large water tank (LWT)
of 40x40x20cm3. Due to the dilute nature of the foils the irradiation required extensive beam
time to allow for the build up of enough activity in the foils to count with good statistics on a
HpGe detector.
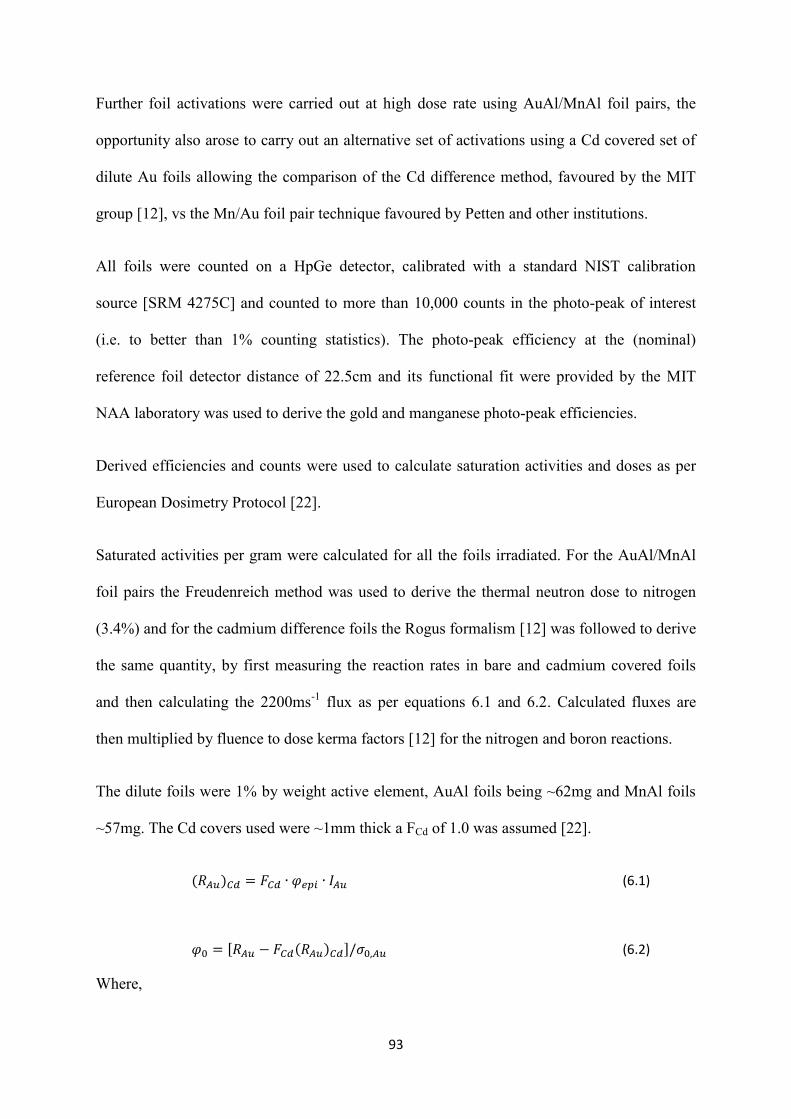
93
Further foil activations were carried out at high dose rate using AuAl/MnAl foil pairs, the
opportunity also arose to carry out an alternative set of activations using a Cd covered set of
dilute Au foils allowing the comparison of the Cd difference method, favoured by the MIT
group [12], vs the Mn/Au foil pair technique favoured by Petten and other institutions.
All foils were counted on a HpGe detector, calibrated with a standard NIST calibration
source [SRM 4275C] and counted to more than 10,000 counts in the photo-peak of interest
(i.e. to better than 1% counting statistics). The photo-peak efficiency at the (nominal)
reference foil detector distance of 22.5cm and its functional fit were provided by the MIT
NAA laboratory was used to derive the gold and manganese photo-peak efficiencies.
Derived efficiencies and counts were used to calculate saturation activities and doses as per
European Dosimetry Protocol [22].
Saturated activities per gram were calculated for all the foils irradiated. For the AuAl/MnAl
foil pairs the Freudenreich method was used to derive the thermal neutron dose to nitrogen
(3.4%) and for the cadmium difference foils the Rogus formalism [12] was followed to derive
the same quantity, by first measuring the reaction rates in bare and cadmium covered foils
and then calculating the 2200ms-1 flux as per equations 6.1 and 6.2. Calculated fluxes are
then multiplied by fluence to dose kerma factors [12] for the nitrogen and boron reactions.
The dilute foils were 1% by weight active element, AuAl foils being ~62mg and MnAl foils
~57mg. The Cd covers used were ~1mm thick a FCd of 1.0 was assumed [22].
(6.1)
[ ] (6.2)
Where,
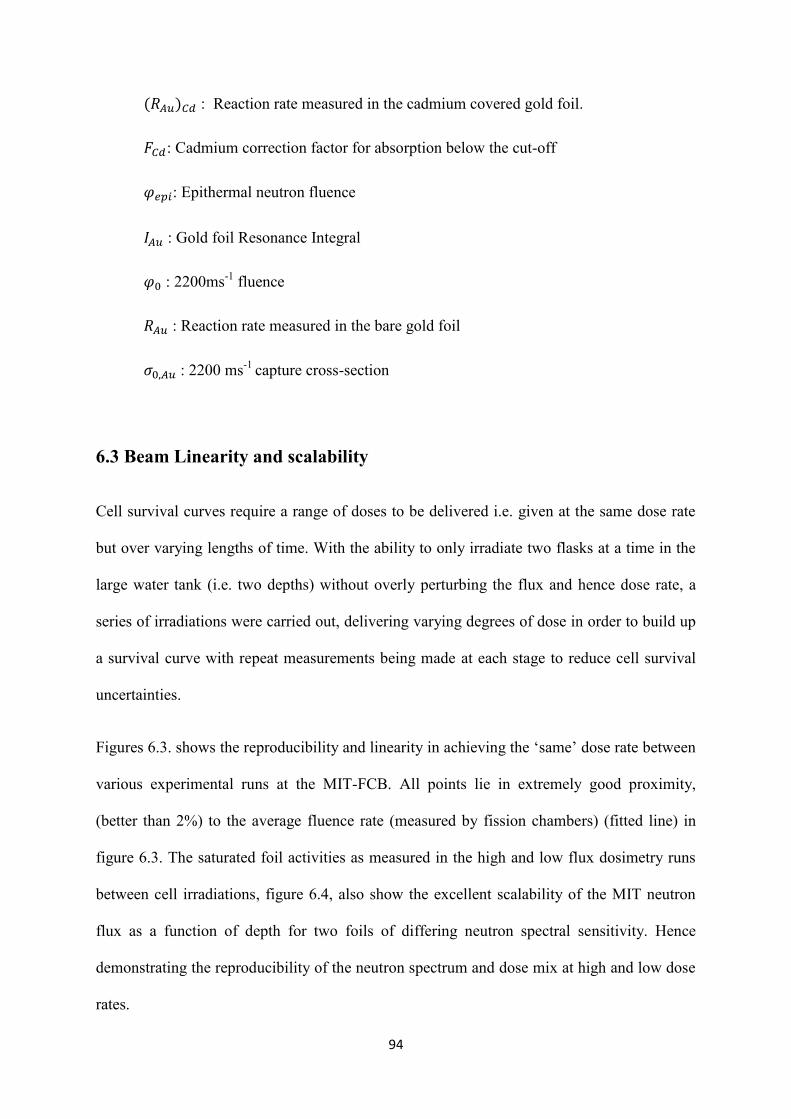
94
: Reaction rate measured in the cadmium covered gold foil.
: Cadmium correction factor for absorption below the cut-off
: Epithermal neutron fluence
: Gold foil Resonance Integral
: 2200ms-1 fluence
: Reaction rate measured in the bare gold foil
: 2200 ms-1 capture cross-section
6.3 Beam Linearity and scalability
Cell survival curves require a range of doses to be delivered i.e. given at the same dose rate
but over varying lengths of time. With the ability to only irradiate two flasks at a time in the
large water tank (i.e. two depths) without overly perturbing the flux and hence dose rate, a
series of irradiations were carried out, delivering varying degrees of dose in order to build up
a survival curve with repeat measurements being made at each stage to reduce cell survival
uncertainties.
Figures 6.3. shows the reproducibility and linearity in achieving the ‘same’ dose rate between
various experimental runs at the MIT-FCB. All points lie in extremely good proximity,
(better than 2%) to the average fluence rate (measured by fission chambers) (fitted line) in
figure 6.3. The saturated foil activities as measured in the high and low flux dosimetry runs
between cell irradiations, figure 6.4, also show the excellent scalability of the MIT neutron
flux as a function of depth for two foils of differing neutron spectral sensitivity. Hence
demonstrating the reproducibility of the neutron spectrum and dose mix at high and low dose
rates.
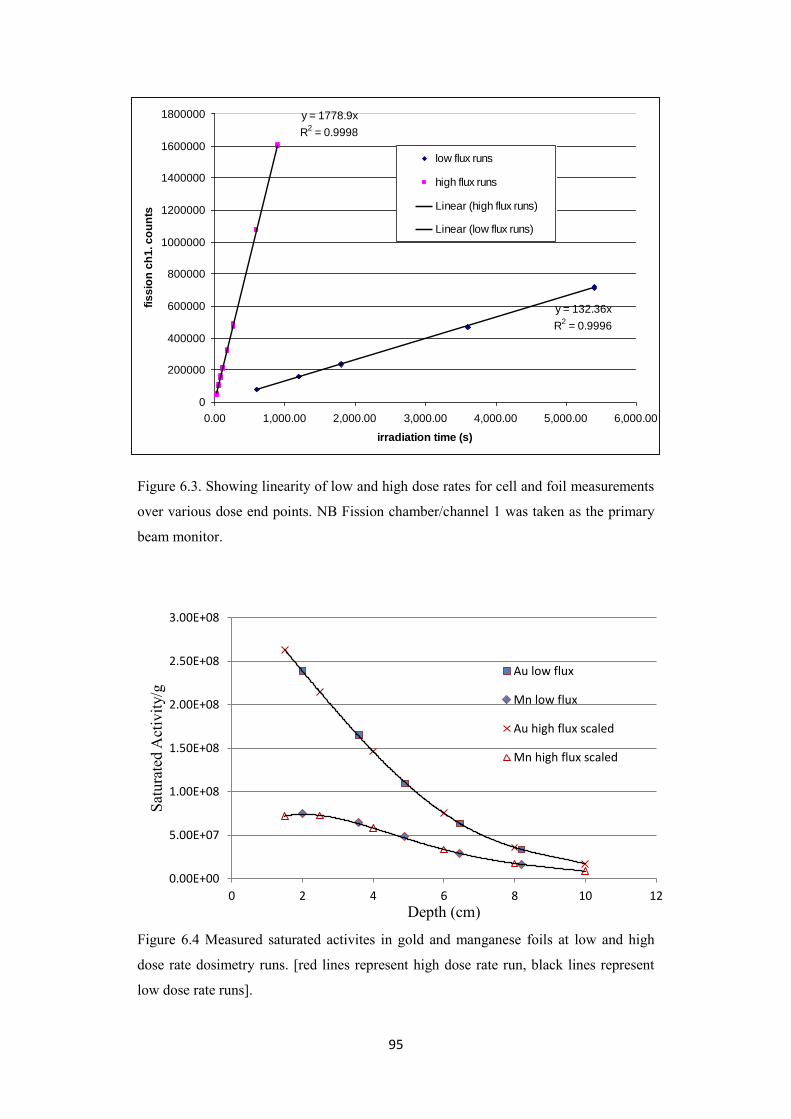
95
Figure 6.3. Showing linearity of low and high dose rates for cell and foil measurements
over various dose end points. NB Fission chamber/channel 1 was taken as the primary
beam monitor.
Figure 6.4 Measured saturated activites in gold and manganese foils at low and high
dose rate dosimetry runs. [red lines represent high dose rate run, black lines represent
low dose rate runs].
y = 1778.9x
R2 = 0.9998
y = 132.36x
R2 = 0.9996
0
200000
400000
600000
800000
1000000
1200000
1400000
1600000
1800000
0.00 1,000.00 2,000.00 3,000.00 4,000.00 5,000.00 6,000.00
irradiation time (s)
fis
sio
n c
h1
. c
ou
nts
low flux runs
high flux runs
Linear (high flux runs)
Linear (low flux runs)
0.00E+00
5.00E+07
1.00E+08
1.50E+08
2.00E+08
2.50E+08
3.00E+08
0 2 4 6 8 10 12
Satu
rate
d A
ctiv
ity/g
Depth (cm)
Au low flux
Mn low flux
Au high flux scaled
Mn high flux scaled

96
A total of 38 irradiations were carried out at the MIT research reactor. Four of these being
conventional dosimetry runs measuring depth dose curves using foil activations, with:
1. Six AuAl/MnAl foil pairs at low dose rate.
2. Six AuAl foils at high dose rate.
3. Six MnAl foils at high dose rate.
4. Five Cd covered AuAl foils at high dose rate.
Two sets of measurements were carried out to assess the effects of boronated medium in the
flasks and to what extent it perturbs the dose to the second of the irradiated flasks:
1. Four dilute foil pairs, attached to the front and back of each flask, with Boronated
medium.
2. Four dilute foil pairs, attached to the front and back of each flask, without
Boronated medium.
The remainder of the irradiations were used for cell survival experiments to build survival
curves at high and low dose rate. MIT reference measurements were provided for comparison
and scaling [20]. These were conducted in a large water tank, 40x40x45cm3 (inner
dimensions), which is deeper than the phantom used in the current measurements and of
greater wall thickness (1cm wall thickness as opposed to our 0.5cm entrance window).
6.4 Measured dose comparison
The measured thermal neutron dose to 3.4% nitrogen [as per MIT’s reference dosimetry
report] in the beam using both the Freudenreich method and the Cd difference method can be
seen in figure 6.5. The two methods share common measured data for the AuAl (dilute foil)
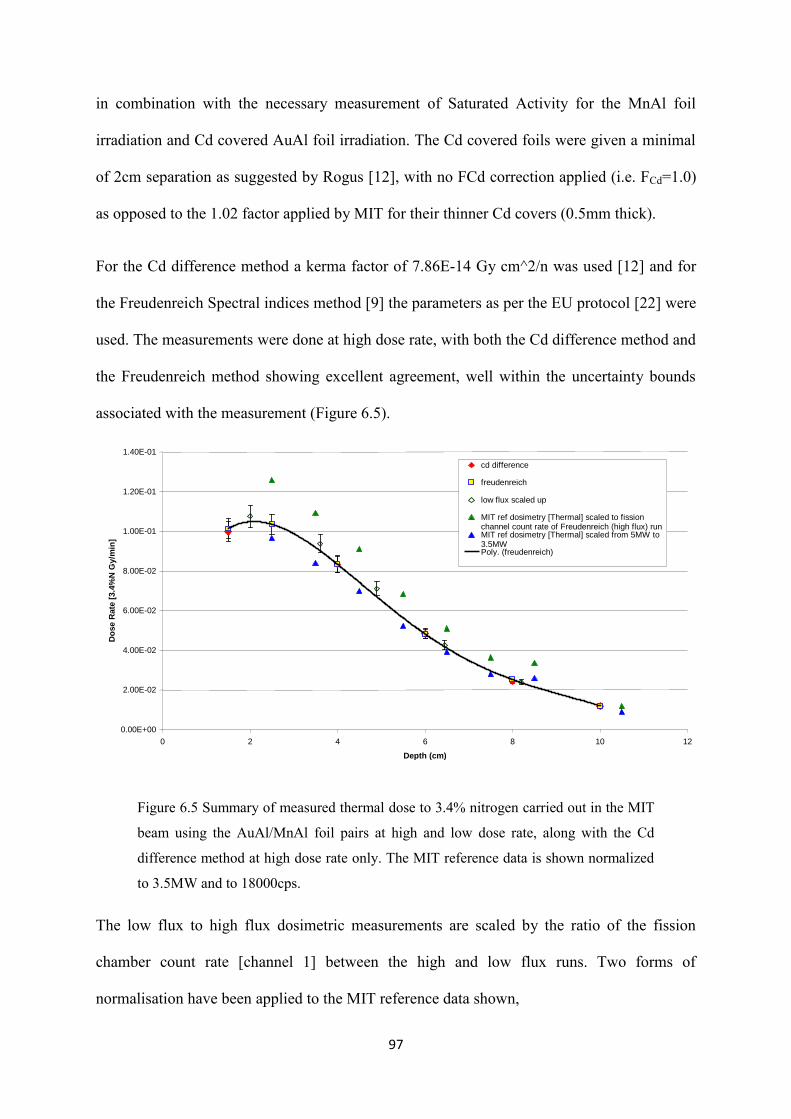
97
in combination with the necessary measurement of Saturated Activity for the MnAl foil
irradiation and Cd covered AuAl foil irradiation. The Cd covered foils were given a minimal
of 2cm separation as suggested by Rogus [12], with no FCd correction applied (i.e. FCd=1.0)
as opposed to the 1.02 factor applied by MIT for their thinner Cd covers (0.5mm thick).
For the Cd difference method a kerma factor of 7.86E-14 Gy cm^2/n was used [12] and for
the Freudenreich Spectral indices method [9] the parameters as per the EU protocol [22] were
used. The measurements were done at high dose rate, with both the Cd difference method and
the Freudenreich method showing excellent agreement, well within the uncertainty bounds
associated with the measurement (Figure 6.5).
Figure 6.5 Summary of measured thermal dose to 3.4% nitrogen carried out in the MIT
beam using the AuAl/MnAl foil pairs at high and low dose rate, along with the Cd
difference method at high dose rate only. The MIT reference data is shown normalized
to 3.5MW and to 18000cps.
The low flux to high flux dosimetric measurements are scaled by the ratio of the fission
chamber count rate [channel 1] between the high and low flux runs. Two forms of
normalisation have been applied to the MIT reference data shown,
MIT Dosimetry Summary
3.4%N
0.00E+00
2.00E-02
4.00E-02
6.00E-02
8.00E-02
1.00E-01
1.20E-01
1.40E-01
0 2 4 6 8 10 12
Depth (cm)
Do
se R
ate
[3.4
%N
Gy/m
in]
cd difference
freudenreich
low flux scaled up
MIT ref dosimetry [Thermal] scaled to fissionchannel count rate of Freudenreich (high flux) runMIT ref dosimetry [Thermal] scaled from 5MW to3.5MWPoly. (freudenreich)
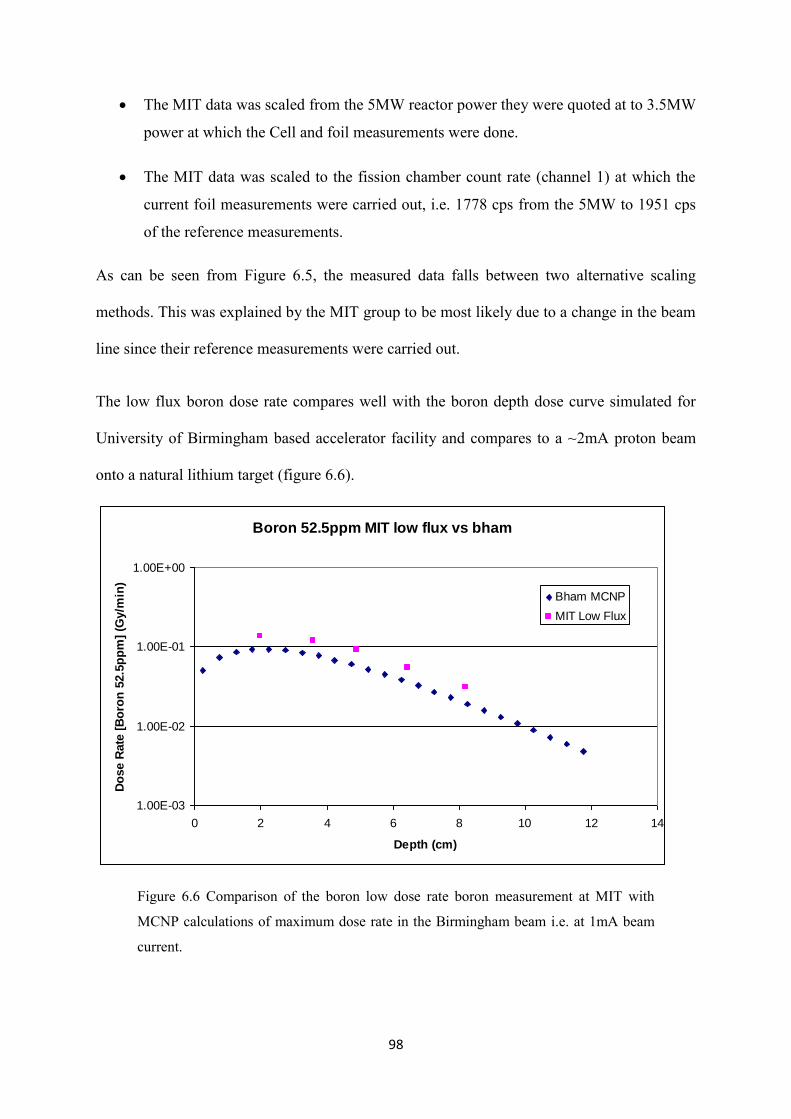
98
The MIT data was scaled from the 5MW reactor power they were quoted at to 3.5MW
power at which the Cell and foil measurements were done.
The MIT data was scaled to the fission chamber count rate (channel 1) at which the
current foil measurements were carried out, i.e. 1778 cps from the 5MW to 1951 cps
of the reference measurements.
As can be seen from Figure 6.5, the measured data falls between two alternative scaling
methods. This was explained by the MIT group to be most likely due to a change in the beam
line since their reference measurements were carried out.
The low flux boron dose rate compares well with the boron depth dose curve simulated for
University of Birmingham based accelerator facility and compares to a ~2mA proton beam
onto a natural lithium target (figure 6.6).
Figure 6.6 Comparison of the boron low dose rate boron measurement at MIT with
MCNP calculations of maximum dose rate in the Birmingham beam i.e. at 1mA beam
current.
Boron 52.5ppm MIT low flux vs bham
1.00E-03
1.00E-02
1.00E-01
1.00E+00
0 2 4 6 8 10 12 14
Depth (cm)
Do
se R
ate
[B
oro
n 5
2.5
pp
m]
(Gy/m
in)
Bham MCNP
MIT Low Flux
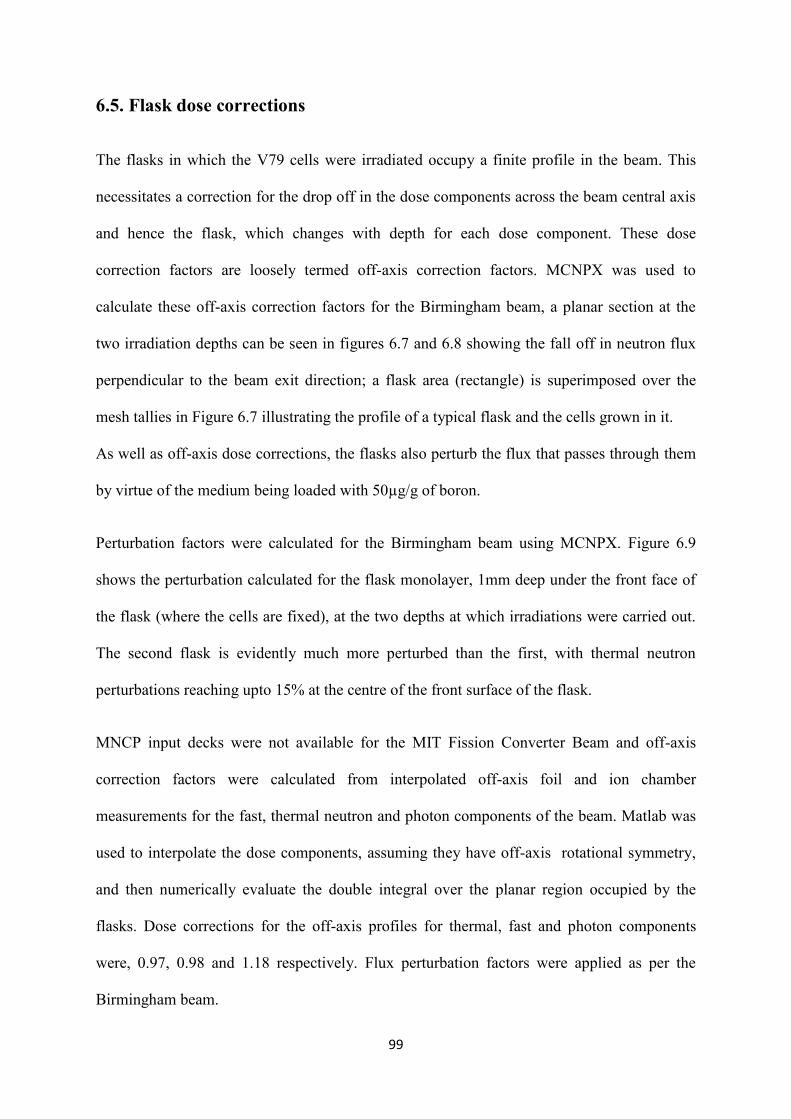
99
6.5. Flask dose corrections
The flasks in which the V79 cells were irradiated occupy a finite profile in the beam. This
necessitates a correction for the drop off in the dose components across the beam central axis
and hence the flask, which changes with depth for each dose component. These dose
correction factors are loosely termed off-axis correction factors. MCNPX was used to
calculate these off-axis correction factors for the Birmingham beam, a planar section at the
two irradiation depths can be seen in figures 6.7 and 6.8 showing the fall off in neutron flux
perpendicular to the beam exit direction; a flask area (rectangle) is superimposed over the
mesh tallies in Figure 6.7 illustrating the profile of a typical flask and the cells grown in it.
As well as off-axis dose corrections, the flasks also perturb the flux that passes through them
by virtue of the medium being loaded with 50µg/g of boron.
Perturbation factors were calculated for the Birmingham beam using MCNPX. Figure 6.9
shows the perturbation calculated for the flask monolayer, 1mm deep under the front face of
the flask (where the cells are fixed), at the two depths at which irradiations were carried out.
The second flask is evidently much more perturbed than the first, with thermal neutron
perturbations reaching upto 15% at the centre of the front surface of the flask.
MNCP input decks were not available for the MIT Fission Converter Beam and off-axis
correction factors were calculated from interpolated off-axis foil and ion chamber
measurements for the fast, thermal neutron and photon components of the beam. Matlab was
used to interpolate the dose components, assuming they have off-axis rotational symmetry,
and then numerically evaluate the double integral over the planar region occupied by the
flasks. Dose corrections for the off-axis profiles for thermal, fast and photon components
were, 0.97, 0.98 and 1.18 respectively. Flux perturbation factors were applied as per the
Birmingham beam.
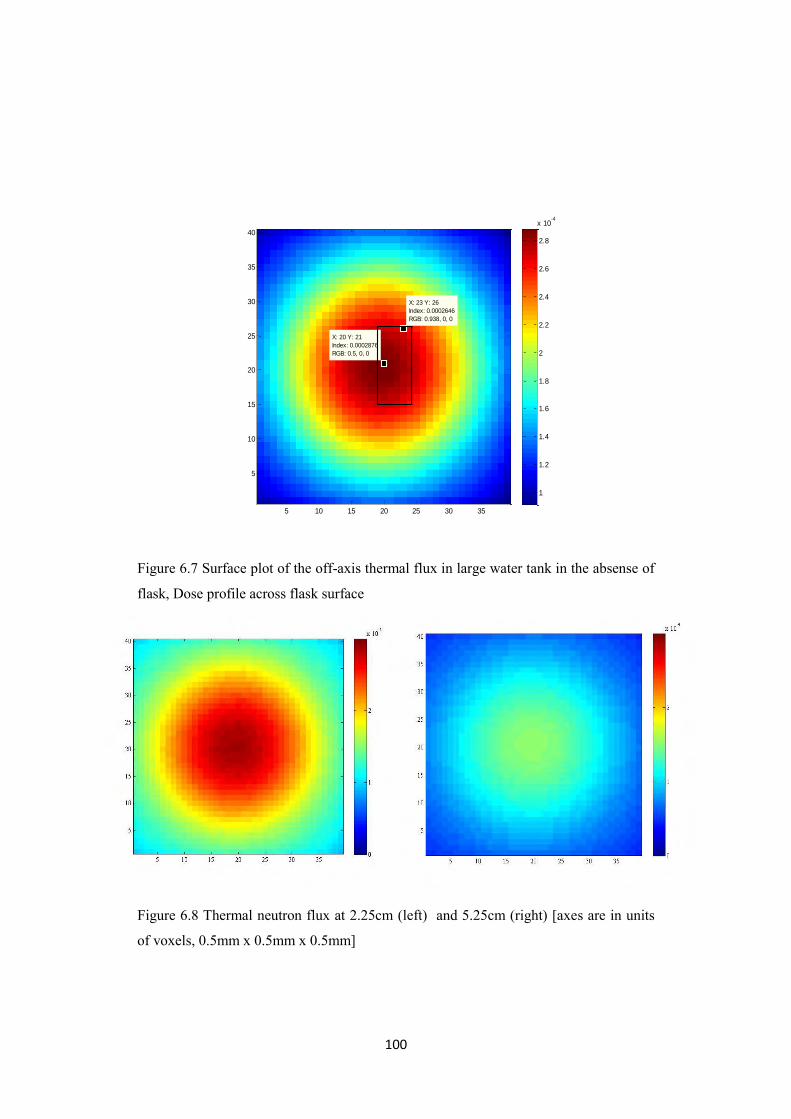
100
Figure 6.7 Surface plot of the off-axis thermal flux in large water tank in the absense of
flask, Dose profile across flask surface
Figure 6.8 Thermal neutron flux at 2.25cm (left) and 5.25cm (right) [axes are in units
of voxels, 0.5mm x 0.5mm x 0.5mm]
X: 20 Y: 21
Index: 0.0002876
RGB: 0.5, 0, 0
X: 23 Y: 26
Index: 0.0002646
RGB: 0.938, 0, 0
5 10 15 20 25 30 35
5
10
15
20
25
30
35
40
1
1.2
1.4
1.6
1.8
2
2.2
2.4
2.6
2.8
x 10-4
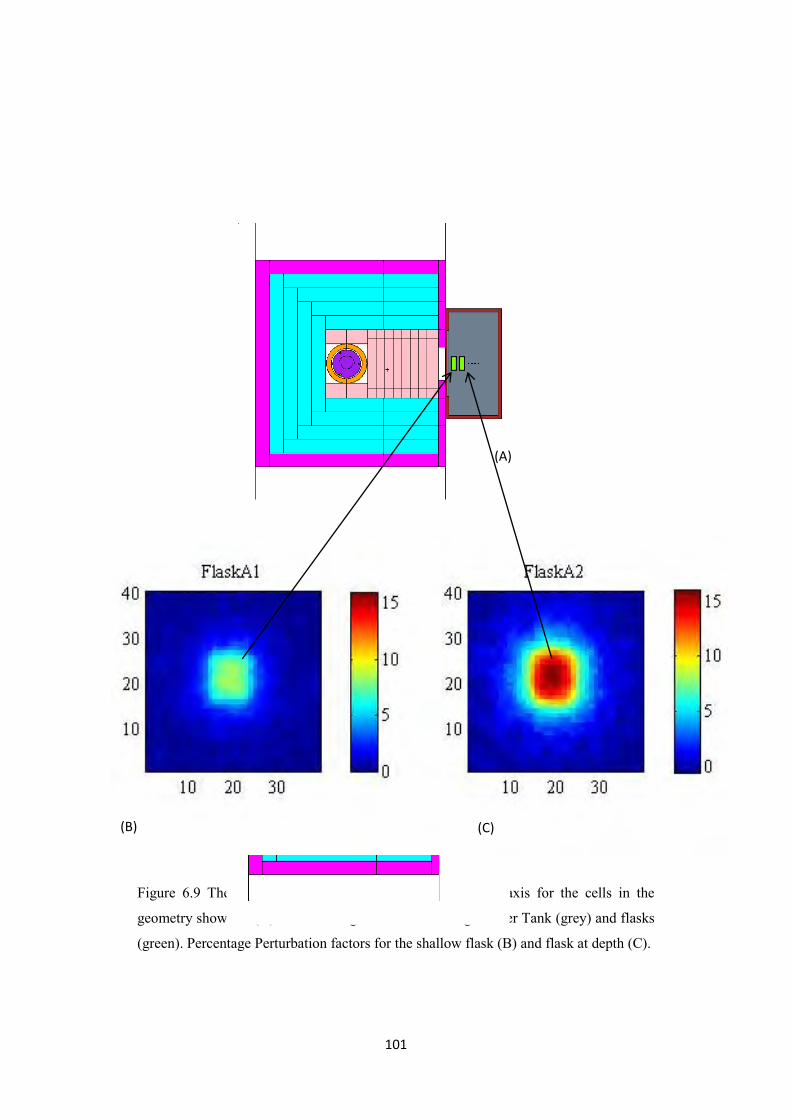
101
Figure 6.9 Thermal flux perturbation factors calculated off-axis for the cells in the
geometry shown in (A) with Birmingham BSA and Large Water Tank (grey) and flasks
(green). Percentage Perturbation factors for the shallow flask (B) and flask at depth (C).
(A)
(B) (C)
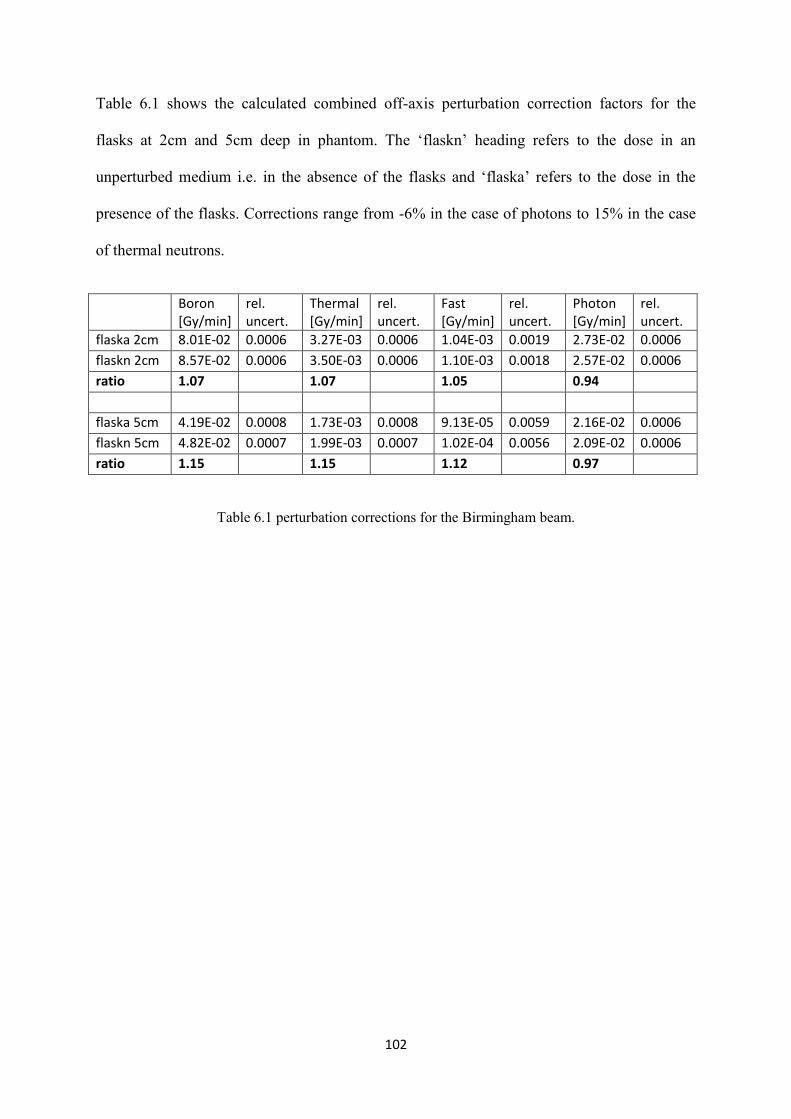
102
Table 6.1 shows the calculated combined off-axis perturbation correction factors for the
flasks at 2cm and 5cm deep in phantom. The ‘flaskn’ heading refers to the dose in an
unperturbed medium i.e. in the absence of the flasks and ‘flaska’ refers to the dose in the
presence of the flasks. Corrections range from -6% in the case of photons to 15% in the case
of thermal neutrons.
Boron [Gy/min]
rel. uncert.
Thermal [Gy/min]
rel. uncert.
Fast [Gy/min]
rel. uncert.
Photon [Gy/min]
rel. uncert.
flaska 2cm 8.01E-02 0.0006 3.27E-03 0.0006 1.04E-03 0.0019 2.73E-02 0.0006
flaskn 2cm 8.57E-02 0.0006 3.50E-03 0.0006 1.10E-03 0.0018 2.57E-02 0.0006
ratio 1.07 1.07 1.05 0.94
flaska 5cm 4.19E-02 0.0008 1.73E-03 0.0008 9.13E-05 0.0059 2.16E-02 0.0006
flaskn 5cm 4.82E-02 0.0007 1.99E-03 0.0007 1.02E-04 0.0056 2.09E-02 0.0006
ratio 1.15 1.15 1.12 0.97
Table 6.1 perturbation corrections for the Birmingham beam.
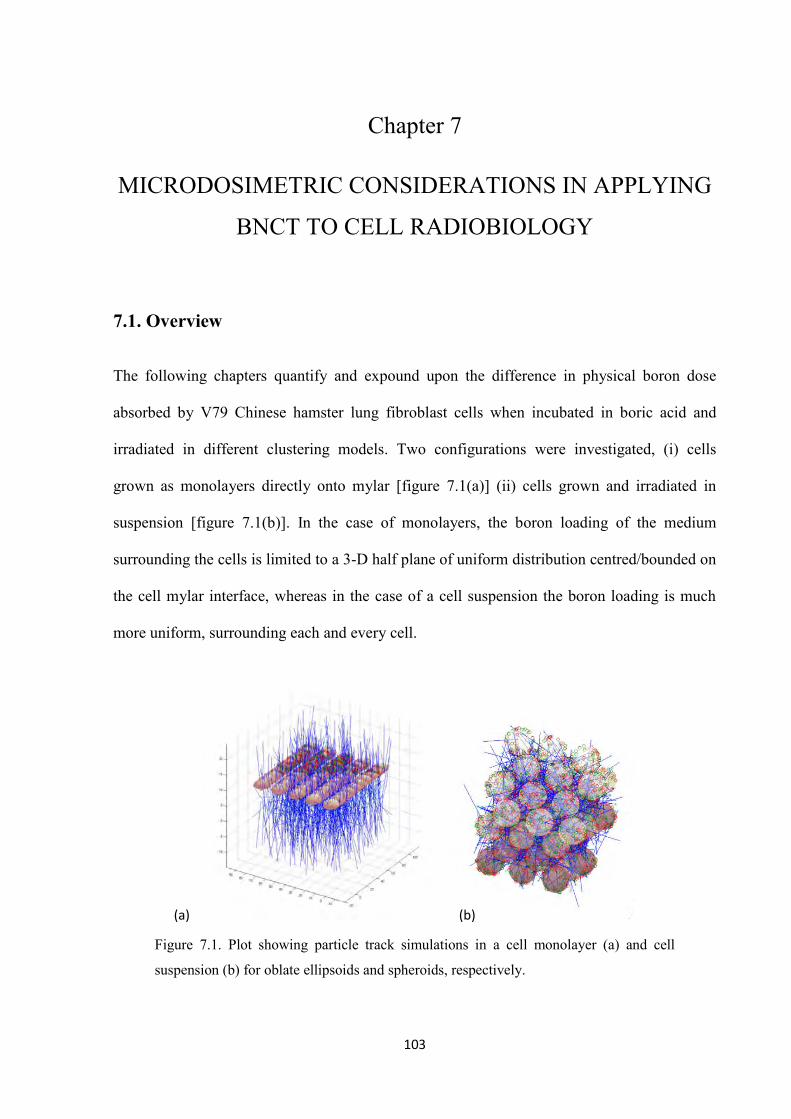
103
Chapter 7
MICRODOSIMETRIC CONSIDERATIONS IN APPLYING
BNCT TO CELL RADIOBIOLOGY
7.1. Overview
The following chapters quantify and expound upon the difference in physical boron dose
absorbed by V79 Chinese hamster lung fibroblast cells when incubated in boric acid and
irradiated in different clustering models. Two configurations were investigated, (i) cells
grown as monolayers directly onto mylar [figure 7.1(a)] (ii) cells grown and irradiated in
suspension [figure 7.1(b)]. In the case of monolayers, the boron loading of the medium
surrounding the cells is limited to a 3-D half plane of uniform distribution centred/bounded on
the cell mylar interface, whereas in the case of a cell suspension the boron loading is much
more uniform, surrounding each and every cell.
Figure 7.1. Plot showing particle track simulations in a cell monolayer (a) and cell
suspension (b) for oblate ellipsoids and spheroids, respectively.
(a) (b)
104
Monte Carlo methods were employed to simulate lithium ions and alpha particle tracks in
semi-stochastic geometries representative of cell monolayer and suspension irradiations,
incubated in a medium with 50µg/g boric acid.
Monolayers of cells were generated with realistic morphologies. Cell nuclear sizes were
randomly sampled from frequency/area spread functions from confocal imaging work. Cell
suspensions were simulated such that cell bodies were taken to be spheres tightly packed in a
hexagonal cubic centred array with spherical nuclei of 4µm radius.
Particle tracks were simulated as line segments with variable Linear Energy Transfer (LET)
representative of the physical ions. Using the calculated chord lengths and track averaged
LETs of the particle, for any given traversal of the cell nucleus, the equivalent „specific lethal
dose‟ [23] was found from track segment irradiations. This was then used to calculate the
probability of the cell surviving any given passage. The product of all cell passages allow the
probability of single cell survival to be calculated and averaging over the population allows
population survival curves to be determined.
Calculations were carried out for both monolayers and suspensions over a range of doses
leading to markedly different survival curves. For the same given macroscopic fluence of
alpha particles and lithium ions, monolayer cells see a reduction in dose compared to the
identical cell line grown in suspension. This is due to two main factors, one being the
inhomogeneity caused by growing the cells on the medium boundary (the mylar base/wall) –
which has no boron beyond it, the other being the observable difference in cell morphology
between suspended and monolayer cells and their nuclei.
Experiments were carried out to confirm these findings; monolayer cells were grown on
modified dishes to deliver a more uniform boron distribution. The results of irradiating cells,
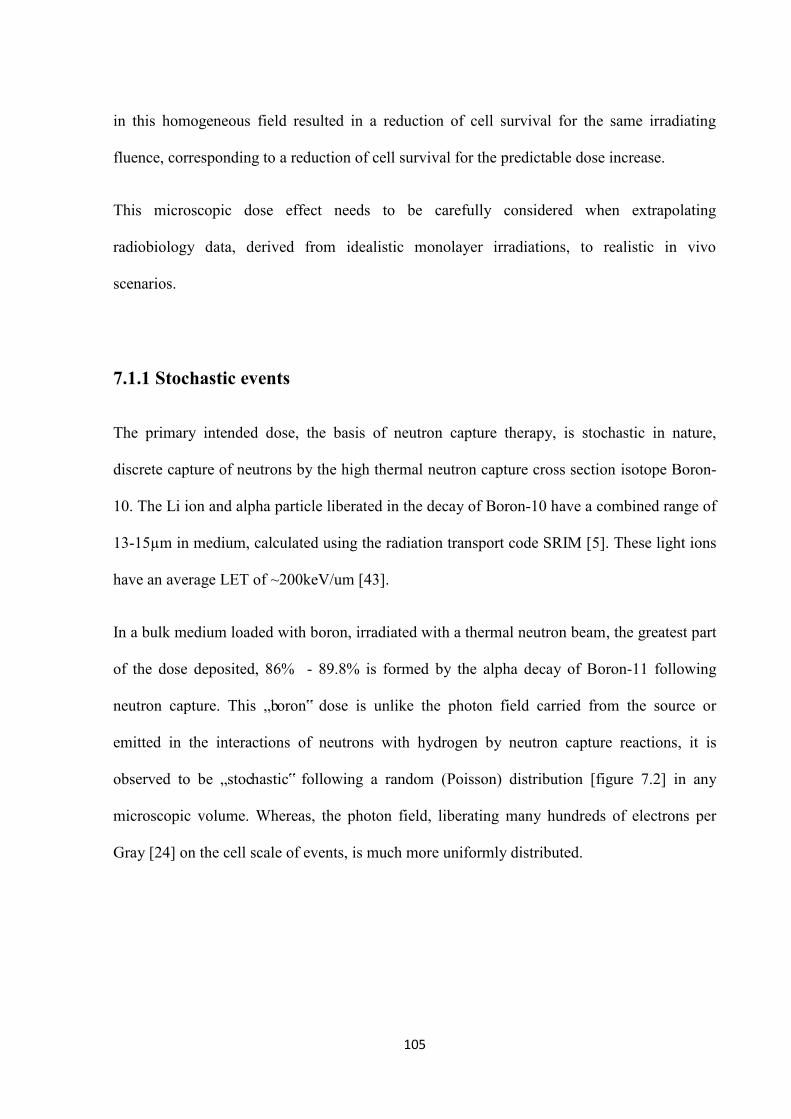
105
in this homogeneous field resulted in a reduction of cell survival for the same irradiating
fluence, corresponding to a reduction of cell survival for the predictable dose increase.
This microscopic dose effect needs to be carefully considered when extrapolating
radiobiology data, derived from idealistic monolayer irradiations, to realistic in vivo
scenarios.
7.1.1 Stochastic events
The primary intended dose, the basis of neutron capture therapy, is stochastic in nature,
discrete capture of neutrons by the high thermal neutron capture cross section isotope Boron-
10. The Li ion and alpha particle liberated in the decay of Boron-10 have a combined range of
13-15µm in medium, calculated using the radiation transport code SRIM [5]. These light ions
have an average LET of ~200keV/um [43].
In a bulk medium loaded with boron, irradiated with a thermal neutron beam, the greatest part
of the dose deposited, 86% - 89.8% is formed by the alpha decay of Boron-11 following
neutron capture. This „boron‟ dose is unlike the photon field carried from the source or
emitted in the interactions of neutrons with hydrogen by neutron capture reactions, it is
observed to be „stochastic‟ following a random (Poisson) distribution [figure 7.2] in any
microscopic volume. Whereas, the photon field, liberating many hundreds of electrons per
Gray [24] on the cell scale of events, is much more uniformly distributed.
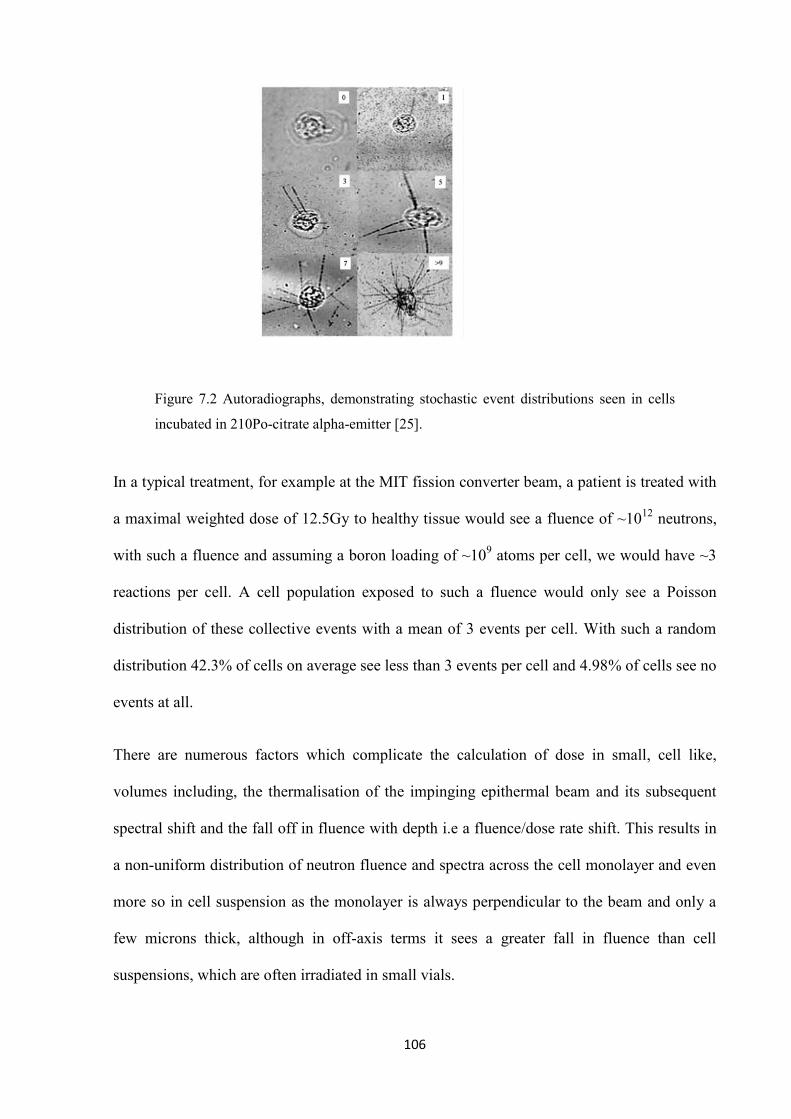
106
Figure 7.2 Autoradiographs, demonstrating stochastic event distributions seen in cells
incubated in 210Po-citrate alpha-emitter [25].
In a typical treatment, for example at the MIT fission converter beam, a patient is treated with
a maximal weighted dose of 12.5Gy to healthy tissue would see a fluence of ~1012 neutrons,
with such a fluence and assuming a boron loading of ~109 atoms per cell, we would have ~3
reactions per cell. A cell population exposed to such a fluence would only see a Poisson
distribution of these collective events with a mean of 3 events per cell. With such a random
distribution 42.3% of cells on average see less than 3 events per cell and 4.98% of cells see no
events at all.
There are numerous factors which complicate the calculation of dose in small, cell like,
volumes including, the thermalisation of the impinging epithermal beam and its subsequent
spectral shift and the fall off in fluence with depth i.e a fluence/dose rate shift. This results in
a non-uniform distribution of neutron fluence and spectra across the cell monolayer and even
more so in cell suspension as the monolayer is always perpendicular to the beam and only a
few microns thick, although in off-axis terms it sees a greater fall in fluence than cell
suspensions, which are often irradiated in small vials.
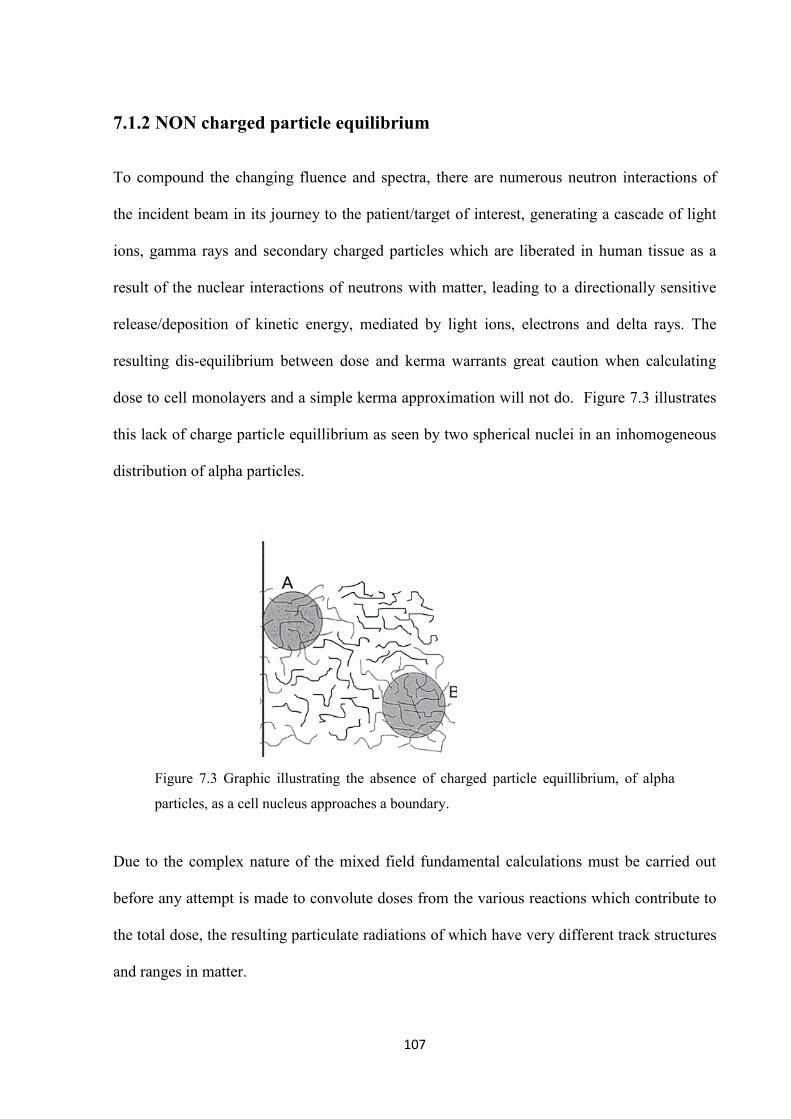
107
7.1.2 NON charged particle equilibrium
To compound the changing fluence and spectra, there are numerous neutron interactions of
the incident beam in its journey to the patient/target of interest, generating a cascade of light
ions, gamma rays and secondary charged particles which are liberated in human tissue as a
result of the nuclear interactions of neutrons with matter, leading to a directionally sensitive
release/deposition of kinetic energy, mediated by light ions, electrons and delta rays. The
resulting dis-equilibrium between dose and kerma warrants great caution when calculating
dose to cell monolayers and a simple kerma approximation will not do. Figure 7.3 illustrates
this lack of charge particle equillibrium as seen by two spherical nuclei in an inhomogeneous
distribution of alpha particles.
Figure 7.3 Graphic illustrating the absence of charged particle equillibrium, of alpha
particles, as a cell nucleus approaches a boundary.
Due to the complex nature of the mixed field fundamental calculations must be carried out
before any attempt is made to convolute doses from the various reactions which contribute to
the total dose, the resulting particulate radiations of which have very different track structures
and ranges in matter.
108
Also, of great importance is the case in which monolayer cells are grown on flask surfaces,
immersed in boronated medium and irradiated from a collimated beam in a fixed,
reproducible geometry.
The two major dose inhomogeneities seen in the mixed field of a BNCT beam when applied
to boron loaded cell monolayers as opposed to cell clusters/spheroids/suspensions are the
boron dose and the thermal neutron dose resulting from the interaction with the high cross
section common elements in the body, nitrogen and hydrogen.
Cells are typically grown on a thin Mylar film on the polyethylene flask wall and on the other
interface is medium containing in our case boric acid [19]. Using tabulated elemental kerma
factors one can calculate the relative kerma factors for each material of interest and when
multiplied by measured (neutron) particle fluences can yield macroscopic estimates of dose.
But these kerma factors alone are not sufficient to calculate the dose distribution seen by the
cells in inhomogeneous target material distributions.
The primary cause for the dose inhomogeneity and the non-charged particle equilibrium is the
non-uniform distribution of these elements across the cell monolayer and its two adjoining
interfaces. The remainder of this chapter will discuss the boron dose in more detail and
chapter 8 the nitrogen dose.
7.1.3 The boron dose
Of critical importance in calculating localised dose delivery and cell death, is the loci of boron
atoms and as to whether there is a predictable/measureable bio distribution of the boron
carrying pharmaceutical between nuclear, cellular and extra cellular biological compartments.
109
Capala et al. [4] employed an oil filtration method to rapidly and reliably determine the boron
concentration ratio between cells (intracellular) and their growth medium in a variety of boron
loaded drugs and cells so as to distinguish promising pharmaceutical drugs in vitro. They
found that GS-9L rat gliosarcoma cells incubated in boric acid had a linear (proportional)
relationship between boron concentration in medium and boron concentration in cells, and
was in fact equal (unity) over the entire range of boric acid concentrations used, [10 to
75µg/g]. Thus allowing the authors to ascertain intracellular and extracellular boron levels
based on the gradient of the curve. Ratios of 0.96±0.8 and 1.5±0.11 were observed for U-
343MGa human malignant glioma and B16 mouse melanoma respectively, i.e. a ratio of
1.8±0.16. The same tumorigenic Cell lines acquired BPA in very different uptake ratios
primarily due to active transport of the essential amino acid, phenylalanine, as opposed to the
passive diffusion in the case of boric acid. Accumulation ratios (relative to boric acid uptake)
were 3.2±0.39, 1.3±0.07 and 1.6± 0.22 respectively.
Chung [26], developed an in vitro assay to determine the radiobiological effectiveness of
novel pharmaceutical for the delivery of boron to tumour cells of interest. Thus developing a
method for „compound screening‟, which allowed a model, which by virtue of cell
survival/CBE, can be used to differentiate those compounds which have promising
intracellular uptake ratios from those that have not. Squamous cell carcinoma, Murine
SCCVII, cells (murine models of head and neck cancer) were incubated with porphyrins
(BOPP) and liposomal boron carriers but neither showed any, in vitro, therapeutic advantage
over BPA.
The experimental radiobiological methods employed by Chung. are similar to the irradiations
carried out at MIT and Birmingham by Phoenix [19], but using a different cell line. Briefly,
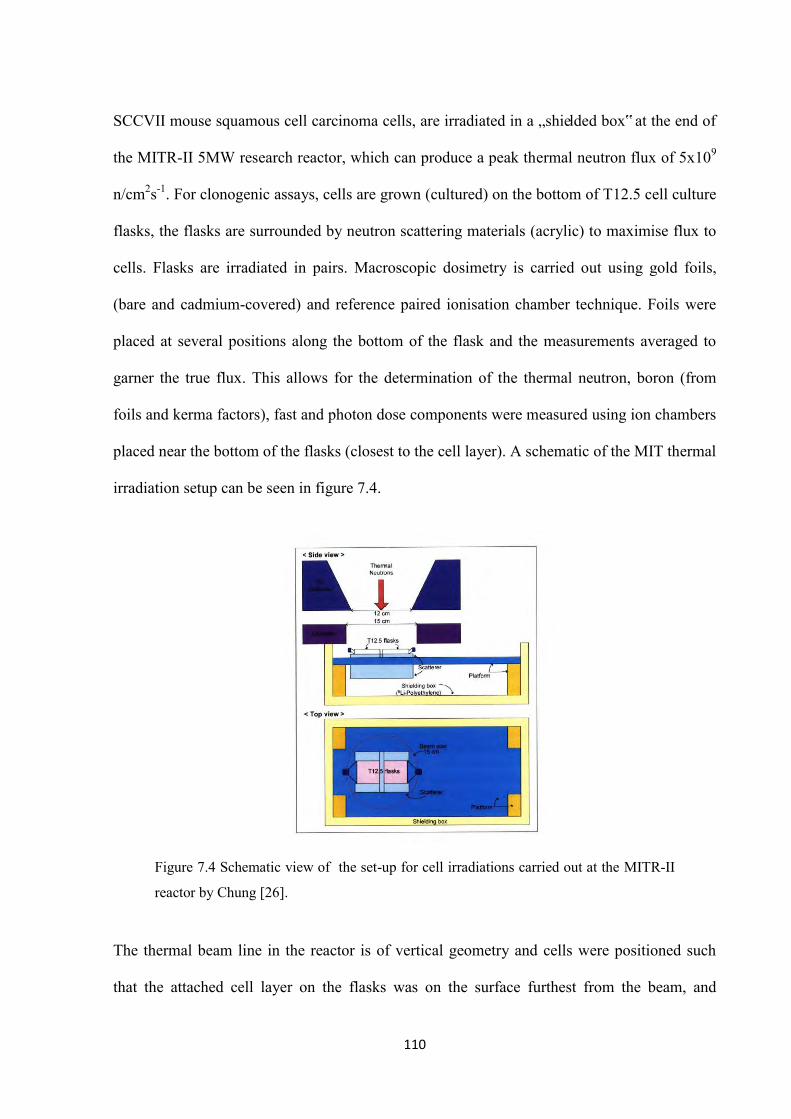
110
SCCVII mouse squamous cell carcinoma cells, are irradiated in a „shielded box‟ at the end of
the MITR-II 5MW research reactor, which can produce a peak thermal neutron flux of 5x10⁹
n/cm2s-1. For clonogenic assays, cells are grown (cultured) on the bottom of T12.5 cell culture
flasks, the flasks are surrounded by neutron scattering materials (acrylic) to maximise flux to
cells. Flasks are irradiated in pairs. Macroscopic dosimetry is carried out using gold foils,
(bare and cadmium-covered) and reference paired ionisation chamber technique. Foils were
placed at several positions along the bottom of the flask and the measurements averaged to
garner the true flux. This allows for the determination of the thermal neutron, boron (from
foils and kerma factors), fast and photon dose components were measured using ion chambers
placed near the bottom of the flasks (closest to the cell layer). A schematic of the MIT thermal
irradiation setup can be seen in figure 7.4.
Figure 7.4 Schematic view of the set-up for cell irradiations carried out at the MITR-II
reactor by Chung [26].
The thermal beam line in the reactor is of vertical geometry and cells were positioned such
that the attached cell layer on the flasks was on the surface furthest from the beam, and
111
minimal growth medium and thus pharmaceutical was required to incubate/nourish the cells
(1ml of medium).
Fission counters are used to monitor the beam during any given cell irradiation, these
monitors allowed dose to be delivered to the irradiation facility with a precision of 1% with
dosimetric uncertainties of 5% for thermal neutrons and photons and 7% for boron.
A comprehensive uncertainty analysis was conducted by Chung, leading to an uncertainty in
CBE of 10-20%. The reported methodology does not however fully account for the dose
inhomogeneity at the cell/flask interface, which must have led to large systematic
uncertainties in dose quantification – specifically relating to the Boron dose component,
which inevitably puts a greater uncertainty in the CBE factors if they are not explicitly
calculated.
Davis et al [43] addressed the problematic dosimetry and derived RBEs from earlier, pre
1970s, works which failed to address the concept of absorbed fraction and inhomogeneity in
boron distribution. His work, carried out on the MITR beam, specifically addressed the
calculation of accurate absorbed doses in HeLa cells grown in monolayers. HeLa cells were
grown in Falcon plastic flasks, incubated with various concentrations of boron and irradiated
in the MITR reactor. Colony assays were grown and survival calculated.
Work was carried out to determine boron uptake (from boric acid). Before irradiations, the
medium containing the boron was removed from the flasks, for only the period of irradiation,
and was then returned to the flasks to complete the survival assay. The removal of medium
thus allowed the authors to confine the dose to the cells and cell nucleus from the component
due to boron that was contained in the medium surrounding every cell.
112
Reference dosimetric methods used to quantify the macroscopic dose components were gold
foils, tissue equivalent ion chambers, TLD-700 lithium fluoride thermoluminescent powder
and silicon diode.
The concept of absorbed dose fraction from work with internal emitters was extrapolated to
calculate absorbed doses from the 10B reaction. In the work of Davis et al. [43], the absorbed
dose fraction for boron distributed intracellularly was calculated to be 0.5 i.e. a nominal figure
between the 0.611, calculated for spheres, and 0.35 calculated for cylindrical discs. This
allowed the author to separate the 10B dose from the other components and hence calculate
RBE values for the densely ionising lithium / alpha reaction, being 3.7+-0.2. The author did
not try to calculate the absorbed dose fraction for uniform distributions.
Boron distribution inhomogeneities in BNCT are often accounted for by radiobiological
weighting factors, called the Compound Biological Effectiveness (CBE). The CBE is a
product of the boron Relative Biological Effectiveness (RBE) and a factor which accounts for
the boron micro-distribution. For boric acid the distribution is uniform, thus the CBE often
used in presenting weighted doses is 2.3 [27]. This quantity doesn‟t convey any information
about the geometrical inhomogeneities encountered in monolayer irradiations.
Calculating the correct physical dose is absolutely essential in assessing damage to critical
biological structures and their survival probabilities during cell irradiations. It is the only
meaningful way that data can be used to make inference to human studies. It is also the
essence of the fundamental radiobiology work, underpinning translational studies in
introducing this novel treatment modality into clinical radiotherapy.
Thus, much effort has been expended in this thesis to studying dose distributions in the
presence of inhomogeneous boundary conditions in cell culture irradiations. In doing so, the
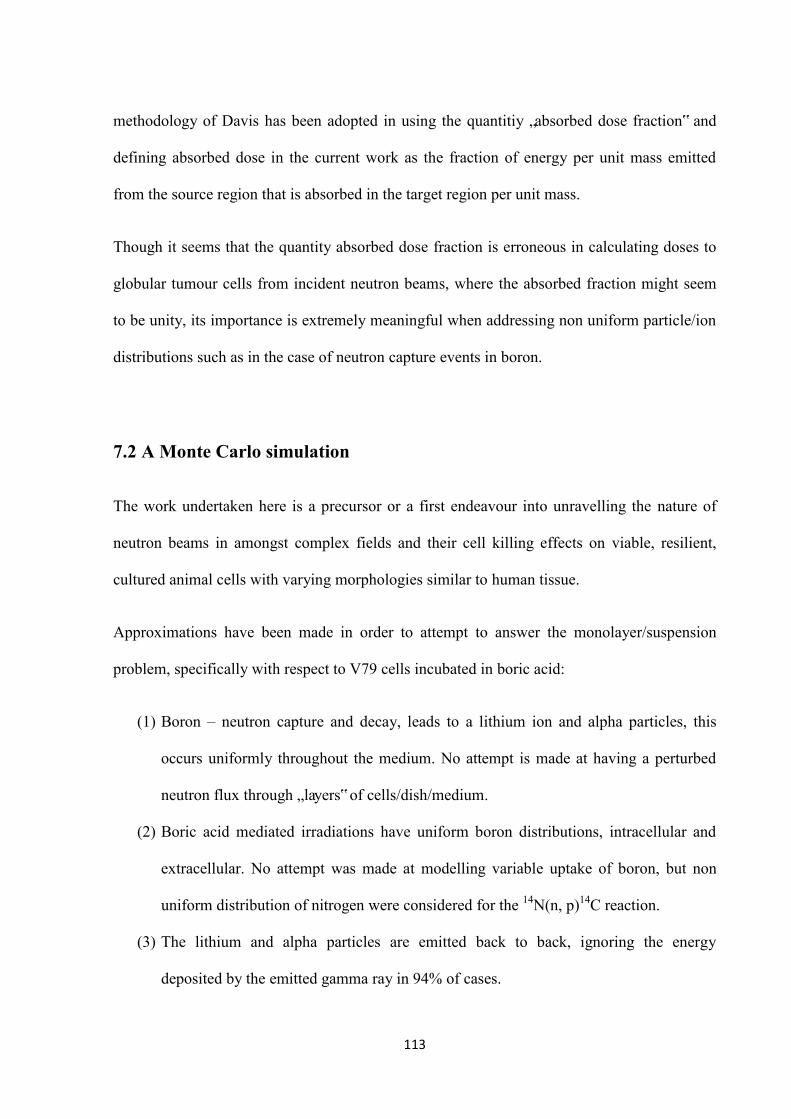
113
methodology of Davis has been adopted in using the quantitiy „absorbed dose fraction‟ and
defining absorbed dose in the current work as the fraction of energy per unit mass emitted
from the source region that is absorbed in the target region per unit mass.
Though it seems that the quantity absorbed dose fraction is erroneous in calculating doses to
globular tumour cells from incident neutron beams, where the absorbed fraction might seem
to be unity, its importance is extremely meaningful when addressing non uniform particle/ion
distributions such as in the case of neutron capture events in boron.
7.2 A Monte Carlo simulation
The work undertaken here is a precursor or a first endeavour into unravelling the nature of
neutron beams in amongst complex fields and their cell killing effects on viable, resilient,
cultured animal cells with varying morphologies similar to human tissue.
Approximations have been made in order to attempt to answer the monolayer/suspension
problem, specifically with respect to V79 cells incubated in boric acid:
(1) Boron – neutron capture and decay, leads to a lithium ion and alpha particles, this
occurs uniformly throughout the medium. No attempt is made at having a perturbed
neutron flux through „layers‟ of cells/dish/medium.
(2) Boric acid mediated irradiations have uniform boron distributions, intracellular and
extracellular. No attempt was made at modelling variable uptake of boron, but non
uniform distribution of nitrogen were considered for the 14N(n, p)14C reaction.
(3) The lithium and alpha particles are emitted back to back, ignoring the energy
deposited by the emitted gamma ray in 94% of cases.
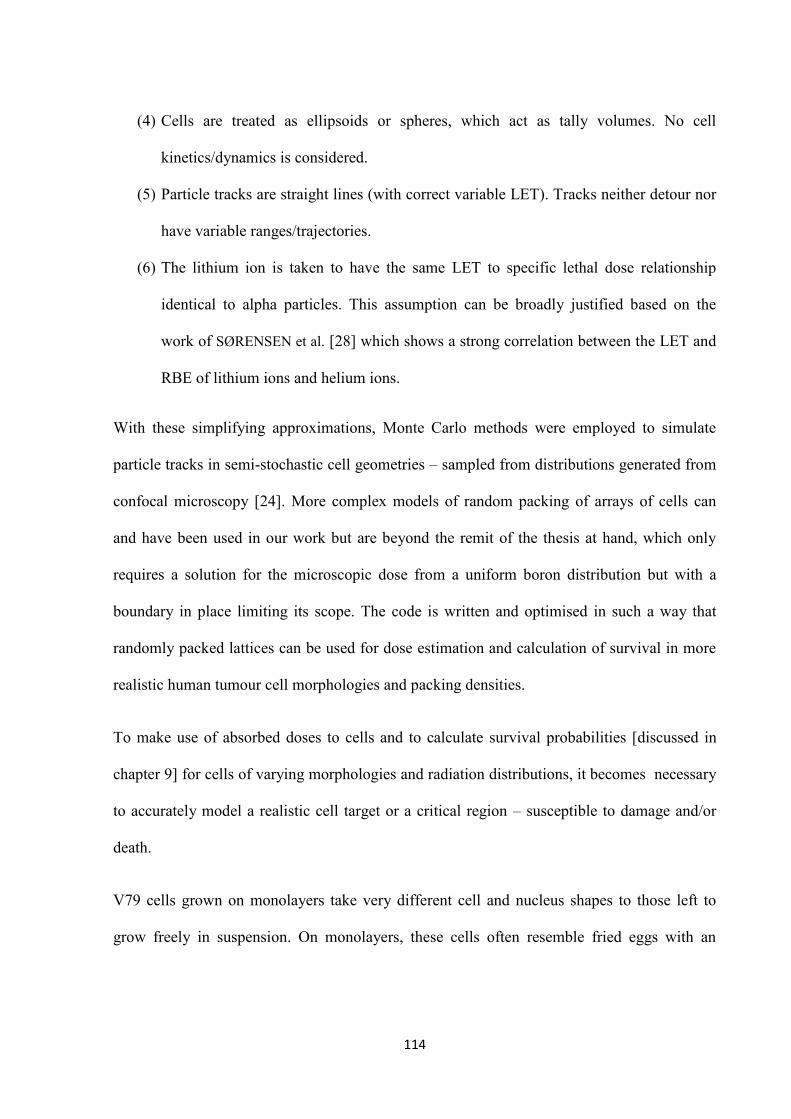
114
(4) Cells are treated as ellipsoids or spheres, which act as tally volumes. No cell
kinetics/dynamics is considered.
(5) Particle tracks are straight lines (with correct variable LET). Tracks neither detour nor
have variable ranges/trajectories.
(6) The lithium ion is taken to have the same LET to specific lethal dose relationship
identical to alpha particles. This assumption can be broadly justified based on the
work of SØRENSEN et al. [28] which shows a strong correlation between the LET and
RBE of lithium ions and helium ions.
With these simplifying approximations, Monte Carlo methods were employed to simulate
particle tracks in semi-stochastic cell geometries – sampled from distributions generated from
confocal microscopy [24]. More complex models of random packing of arrays of cells can
and have been used in our work but are beyond the remit of the thesis at hand, which only
requires a solution for the microscopic dose from a uniform boron distribution but with a
boundary in place limiting its scope. The code is written and optimised in such a way that
randomly packed lattices can be used for dose estimation and calculation of survival in more
realistic human tumour cell morphologies and packing densities.
To make use of absorbed doses to cells and to calculate survival probabilities [discussed in
chapter 9] for cells of varying morphologies and radiation distributions, it becomes necessary
to accurately model a realistic cell target or a critical region – susceptible to damage and/or
death.
V79 cells grown on monolayers take very different cell and nucleus shapes to those left to
grow freely in suspension. On monolayers, these cells often resemble fried eggs with an
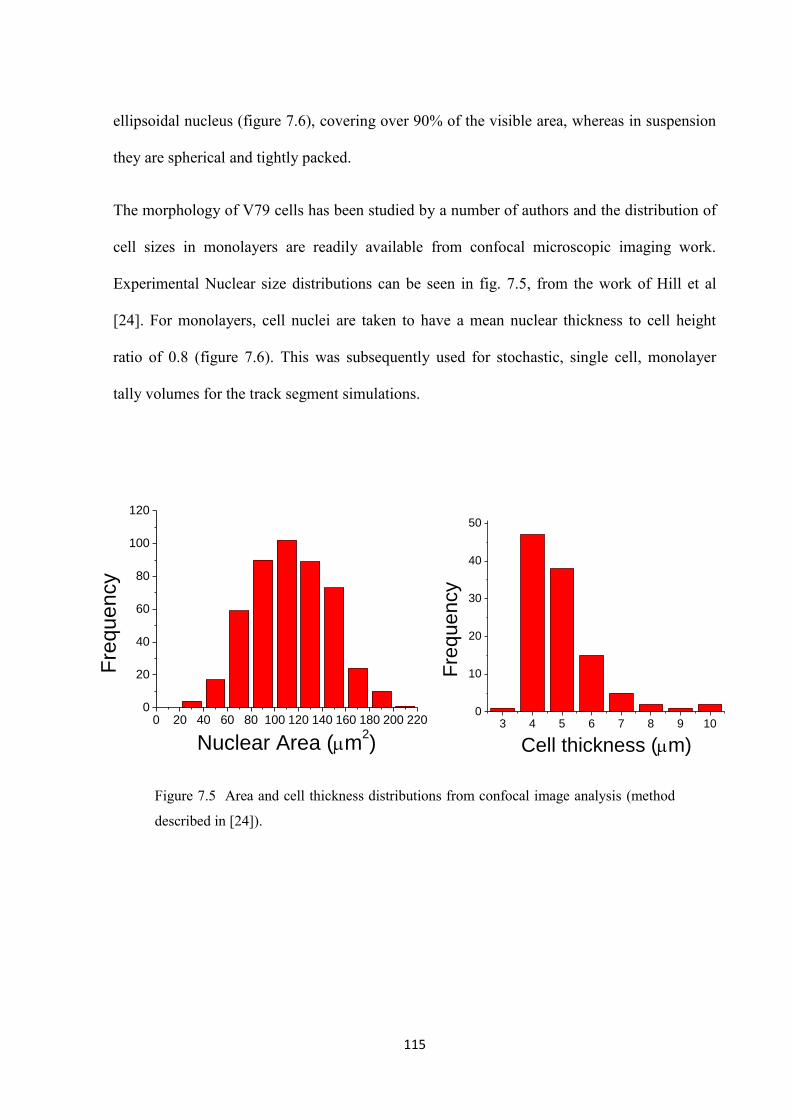
115
ellipsoidal nucleus (figure 7.6), covering over 90% of the visible area, whereas in suspension
they are spherical and tightly packed.
The morphology of V79 cells has been studied by a number of authors and the distribution of
cell sizes in monolayers are readily available from confocal microscopic imaging work.
Experimental Nuclear size distributions can be seen in fig. 7.5, from the work of Hill et al
[24]. For monolayers, cell nuclei are taken to have a mean nuclear thickness to cell height
ratio of 0.8 (figure 7.6). This was subsequently used for stochastic, single cell, monolayer
tally volumes for the track segment simulations.
Figure 7.5 Area and cell thickness distributions from confocal image analysis (method
described in [24]).
0 20 40 60 80 100 120 140 160 180 200 2200
20
40
60
80
100
120
Fre
qu
en
cy
Nuclear Area (m2)
3 4 5 6 7 8 9 100
10
20
30
40
50
Fre
que
ncy
Cell thickness (m)
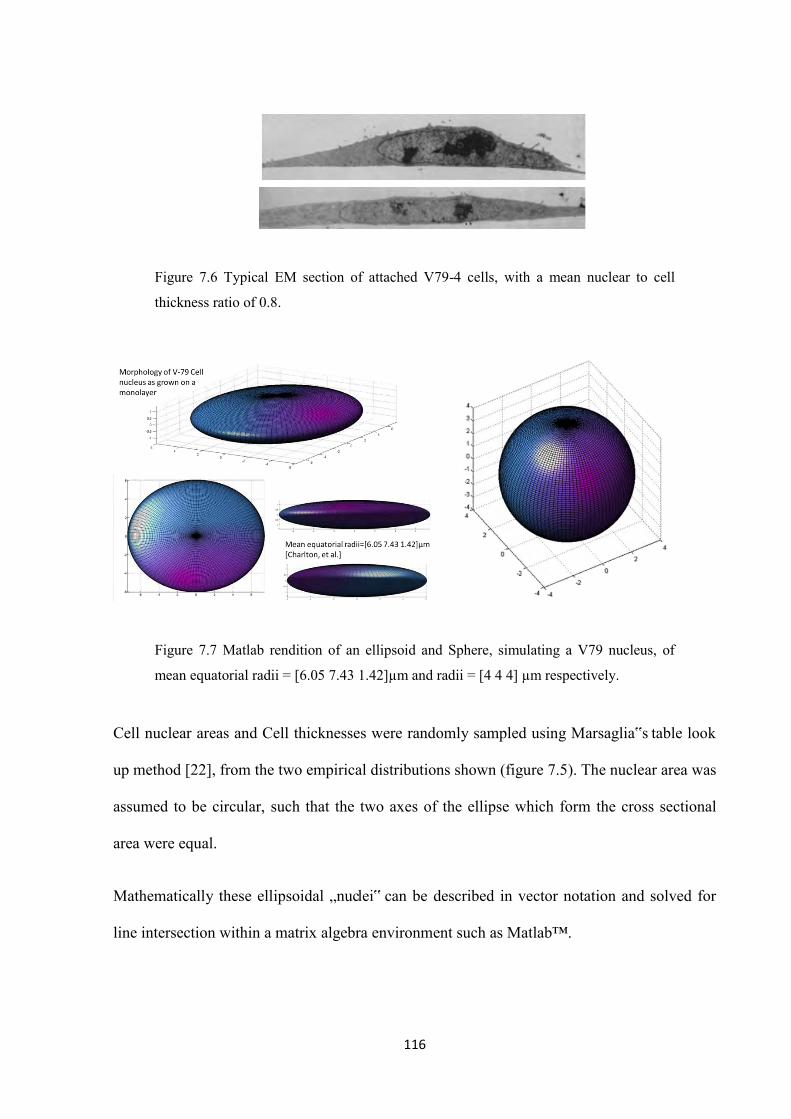
116
Figure 7.6 Typical EM section of attached V79-4 cells, with a mean nuclear to cell
thickness ratio of 0.8.
Figure 7.7 Matlab rendition of an ellipsoid and Sphere, simulating a V79 nucleus, of
mean equatorial radii = [6.05 7.43 1.42]µm and radii = [4 4 4] µm respectively.
Cell nuclear areas and Cell thicknesses were randomly sampled using Marsaglia‟s table look
up method [22], from the two empirical distributions shown (figure 7.5). The nuclear area was
assumed to be circular, such that the two axes of the ellipse which form the cross sectional
area were equal.
Mathematically these ellipsoidal „nuclei‟ can be described in vector notation and solved for
line intersection within a matrix algebra environment such as Matlab™.
117
The equation of an ellipse in vector notation can be written as:
( ) ( ) 1
Where ( ) is the location of the centre of the ellipse and H is a positive definite symmetric
matrix and a vector. The eigenvectors of H define the principal directions of the
ellipsoid and the inverse of the square root of the eigenvalues are the corresponding equatorial
radii. i.e.
[
]
MATLAB >> 1./sqrt(eig(H)) = [6.05 7.43 1.42] i.e. the equatorial radii from Charlton
et al.
Thermal neutron capture in boron leads to alpha decay with the emission of two densely
ionising particles, a lithium ion and an alpha particle, in one of two modes of decay observed.
This reaction has a Q value of 2.79MeV, shared between the decay products, which in 94% of
decays occur from an excited state from which the disintegration is accompanied by a 478keV
gamma ray, which can be used for imaging in a therapeutic, BNCT radiotherapy setting (see
Appendix A [Minsky et al.]).
As the cross-section of boron peaks at very low (thermal) neutron energies, ~<0.5eV, the
initial neutron energy contributes very little to the final kinematic makeup of the emitted ions
which carry a combined kinetic energy of 2.79MeV or 2.31MeV in its two decay modes
(figure 7.8). Thus both particles can be considered to be „emitted‟ back to back with this
shared kinetic energy inversely proportional to their masses.
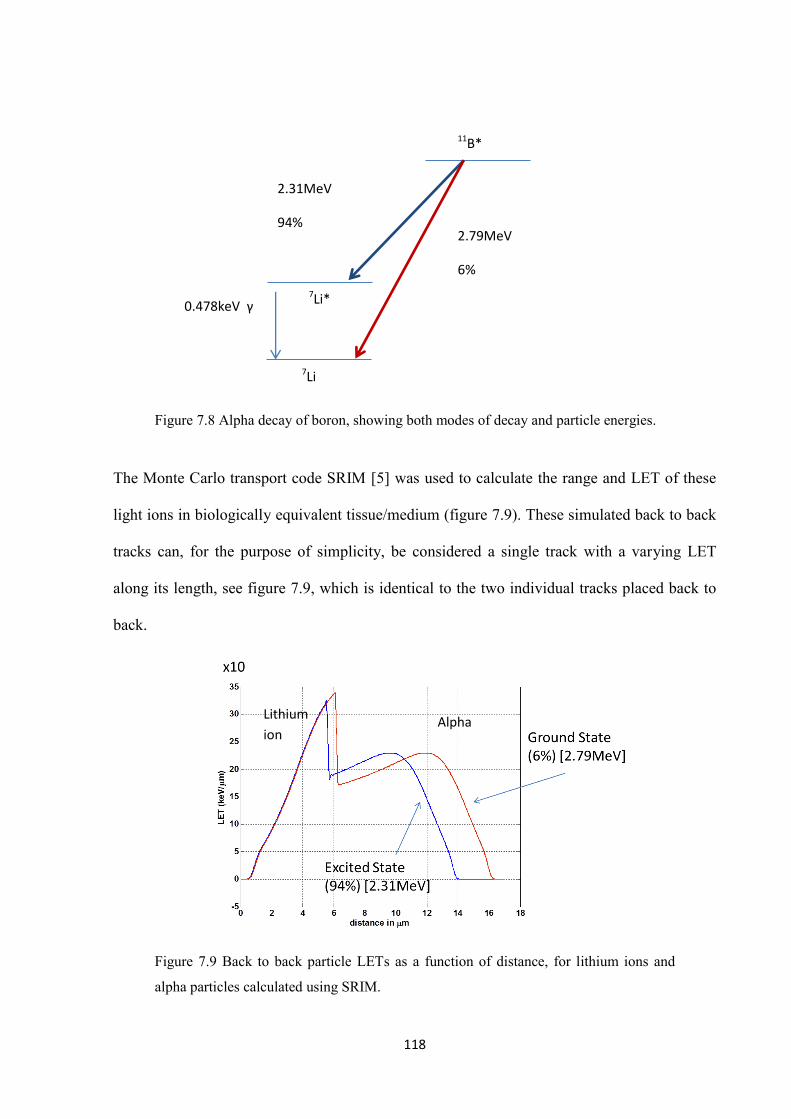
118
Figure 7.8 Alpha decay of boron, showing both modes of decay and particle energies.
The Monte Carlo transport code SRIM [5] was used to calculate the range and LET of these
light ions in biologically equivalent tissue/medium (figure 7.9). These simulated back to back
tracks can, for the purpose of simplicity, be considered a single track with a varying LET
along its length, see figure 7.9, which is identical to the two individual tracks placed back to
back.
Figure 7.9 Back to back particle LETs as a function of distance, for lithium ions and
alpha particles calculated using SRIM.
11B*
7Li*
7Li
0.478keV γ
2.79MeV
6%
2.31MeV
94%
Alpha Lithium
ion
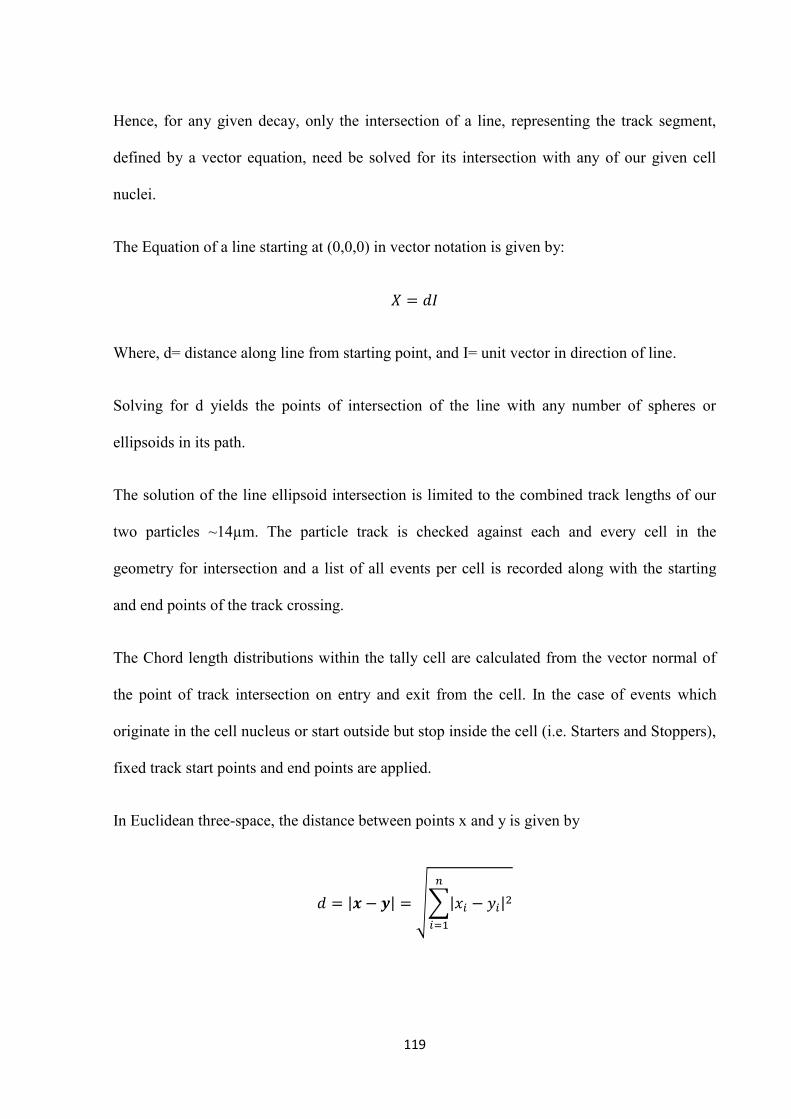
119
Hence, for any given decay, only the intersection of a line, representing the track segment,
defined by a vector equation, need be solved for its intersection with any of our given cell
nuclei.
The Equation of a line starting at (0,0,0) in vector notation is given by:
Where, d= distance along line from starting point, and I= unit vector in direction of line.
Solving for d yields the points of intersection of the line with any number of spheres or
ellipsoids in its path.
The solution of the line ellipsoid intersection is limited to the combined track lengths of our
two particles ~14µm. The particle track is checked against each and every cell in the
geometry for intersection and a list of all events per cell is recorded along with the starting
and end points of the track crossing.
The Chord length distributions within the tally cell are calculated from the vector normal of
the point of track intersection on entry and exit from the cell. In the case of events which
originate in the cell nucleus or start outside but stop inside the cell (i.e. Starters and Stoppers),
fixed track start points and end points are applied.
In Euclidean three-space, the distance between points x and y is given by
| | √∑| |
120
An integral lookup up function is used to rapidly ascertain energy deposited in any cell
traversal. The lookup function consists of the integral of the LET/stopping power distribution
of the two particles over their combined range. The difference between the entrance and exit
„lookup‟ is equal to the energy deposited.
From the energy deposited the specific energy (imparted) can be calculated:
Where is the energy deposited and the mass of the sampled nucleus
Another parameter recorded during a particle traversal of the nucleus is the average LET i.e.
the lineal energy ( ), of the traversal, which is taken to be the energy deposited ( ) divided
by the track length of the event ( ) and not the average chord length as per conventional
microdosimetric measurements.
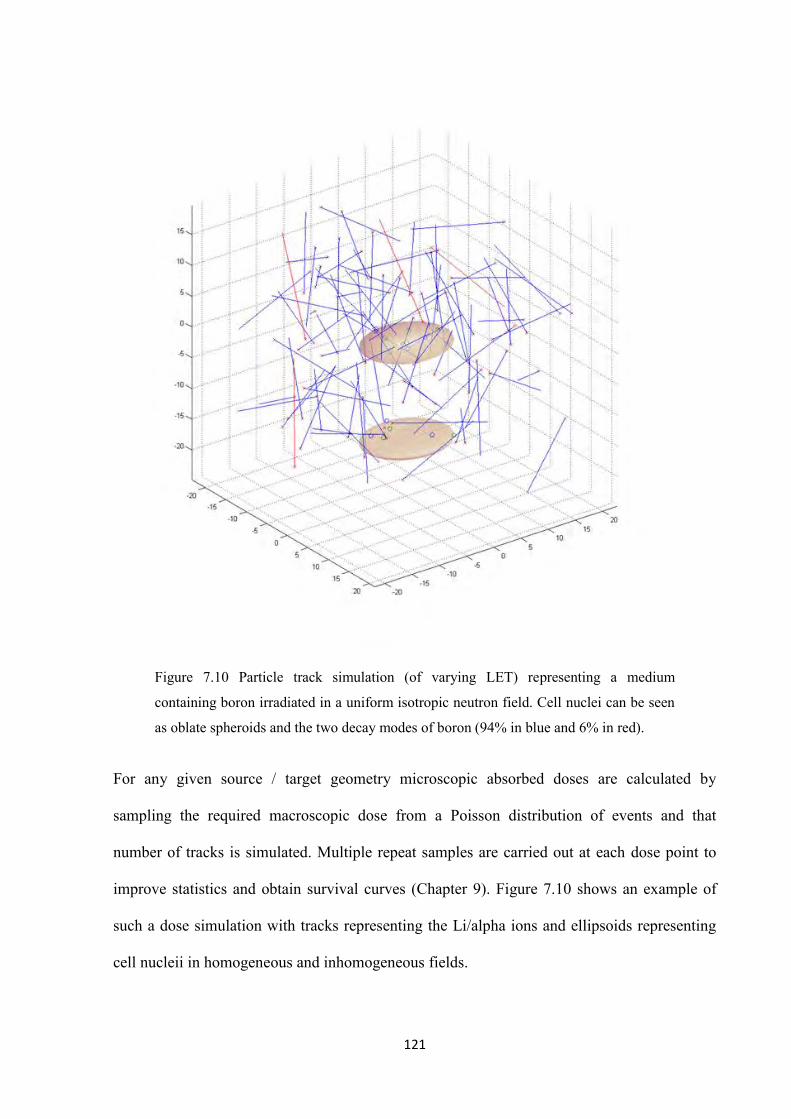
121
Figure 7.10 Particle track simulation (of varying LET) representing a medium
containing boron irradiated in a uniform isotropic neutron field. Cell nuclei can be seen
as oblate spheroids and the two decay modes of boron (94% in blue and 6% in red).
For any given source / target geometry microscopic absorbed doses are calculated by
sampling the required macroscopic dose from a Poisson distribution of events and that
number of tracks is simulated. Multiple repeat samples are carried out at each dose point to
improve statistics and obtain survival curves (Chapter 9). Figure 7.10 shows an example of
such a dose simulation with tracks representing the Li/alpha ions and ellipsoids representing
cell nucleii in homogeneous and inhomogeneous fields.
122
7.2.1 Code Tracking Validation
A useful analytic check of the tracking/intersection algorithm is to randomly sample tracks
(lines) from a uniform isotropic distribution about a single cell. i.e. checking for µ-
randomness (mean free path randomness).
Mean free path randomness is defined as: “A chord of a convex body is defined by a point in
Euclidian space and a direction. The point and the direction are from independent uniform
distributions. This randomness results if the convex body is exposed to a uniform isotropic
field of straight infinite tracks.” [29]
The probability density function for chord length distributions sampled in a sphere under
conditions of µ-randomness i.e. such that the field of lines is isotropic and its intensity is
independent of direction, is given by:
( )
Where, x, is a chord length and d the diameter of the sphere. The mean value of the chord
lengths in the sphere is given by:
⟨ ⟩
In order to generate these uniform isotropic field lines and check the tracking algorithms in
the source code, a sphere of unit radius is created at the origin. On the surface of the sphere a
singular point is chosen from which all test rays originate. A single test point suffices as our
convex surface is spherically symmetrical. Randomly sampling many points over its surface
is a redundant and unnecessary action.
123
Tracks are generated about this point relative to the surface normal, such that events are
uniformly and isotropically distributed in µ-randomness [30].
The direction cosines (u,v,w) of these tracks to the surface normal are given by:
( )
Where is a random number between 0,1
and ,
This is done by choosing a line segment whose origin is randomly distributed in space from a
normal distribution and creating a random direction vector to project that line both forward
and backwards from the point of origin of the line.
The vector equations of the line segment and the sphere are then solved to yield intersection
points. The traversals lead to chord lengths, whose collection over many such events results in
a chord length distribution. Figure 7.11 (B) shows the computed chord length distributions for
a sphere of radius 10, which within statistical uncertainty fits in excellent agreement with the
analytic distribution (figure 7.11(A)). The mean chord length of the computed distribution
equalled 6.67 which is again in agreement with the analytic 2/3d i.e. 6 2/3.
Kellerer [31] derived mathematical proof that the chord length distributions in an oblate
spheroid are given by the analytical functions:
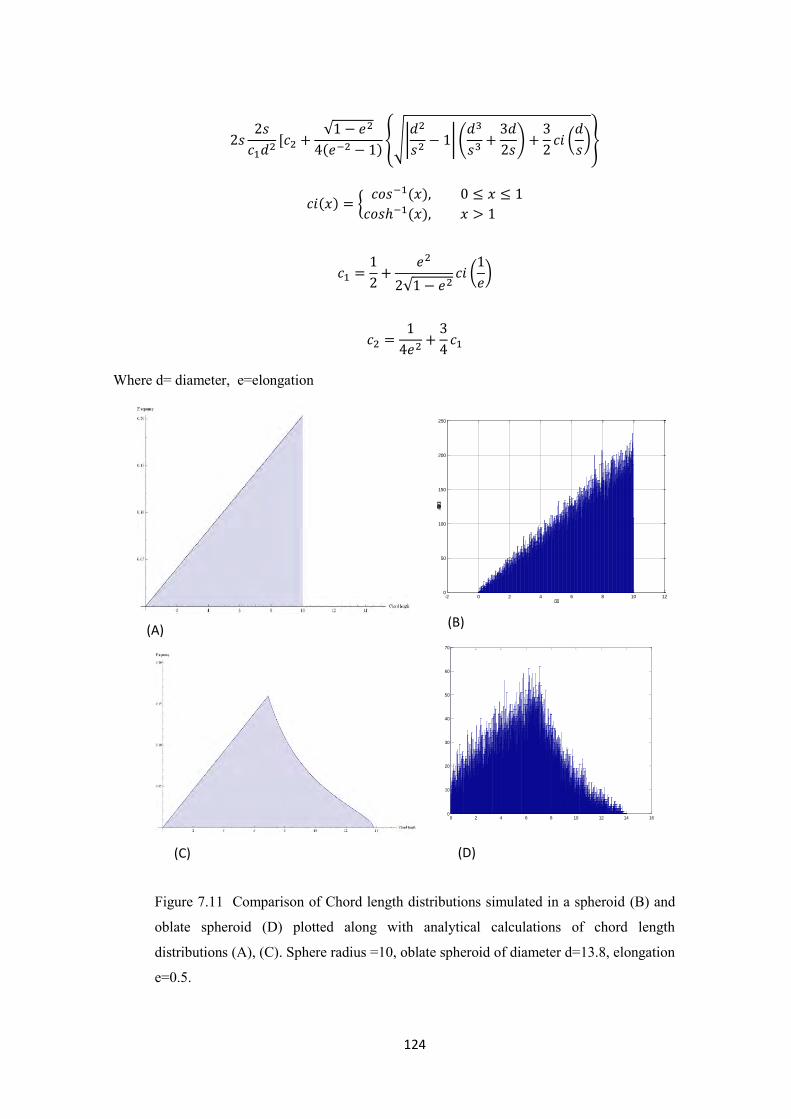
124
√
( ){√|
| (
)
(
)}
( ) { ( )
( )
√ (
)
Where d= diameter, e=elongation
Figure 7.11 Comparison of Chord length distributions simulated in a spheroid (B) and
oblate spheroid (D) plotted along with analytical calculations of chord length
distributions (A), (C). Sphere radius =10, oblate spheroid of diameter d=13.8, elongation
e=0.5.
-2 0 2 4 6 8 10 120
50
100
150
200
250
0 2 4 6 8 10 12 14 160
10
20
30
40
50
60
70
(A) (B)
(C) (D)
125
Figure 7.11(D) Show the calculated chord length distribution for an oblate spheroid with an
elongation of 0.5 and diameter 13.8, again the results are in good agreement with the analytic
calculations shown in figure 7.11(C).
Having established and analytically checked the fundamentals of the working code, namely
the sampling distribution and the chord length distribution are in agreement with analytic
calculations. It becomes relatively easy to translate from line intersections and chord lengths
to single event microscopic doses.
7.2.2 Modified Sampling/variance reduction
The non analogue sampling of the lower probability branch of the 11B decay can drastically
improve the variance reduction and statistical uncertainty of the final dose thus minimising
computational time and increasing the Figure Of Merit (FOM), often defined in Monte Carlo
codes as being inverseley proportional to the time and inverseley proportional to the square of
the relative error.
This has been implemented by increasing the frequency of the 6% decay mode to 50% of
events and assigning these particles an adjusted weight, equal to the ratio of the analogue to
non-analogue biased event frequencies. The final tally contributions from particles is then
adjusted by their weights, which compensates for the bias and keeps the tally „fair‟ i.e. gives
a correct particle density in any region of phase space.
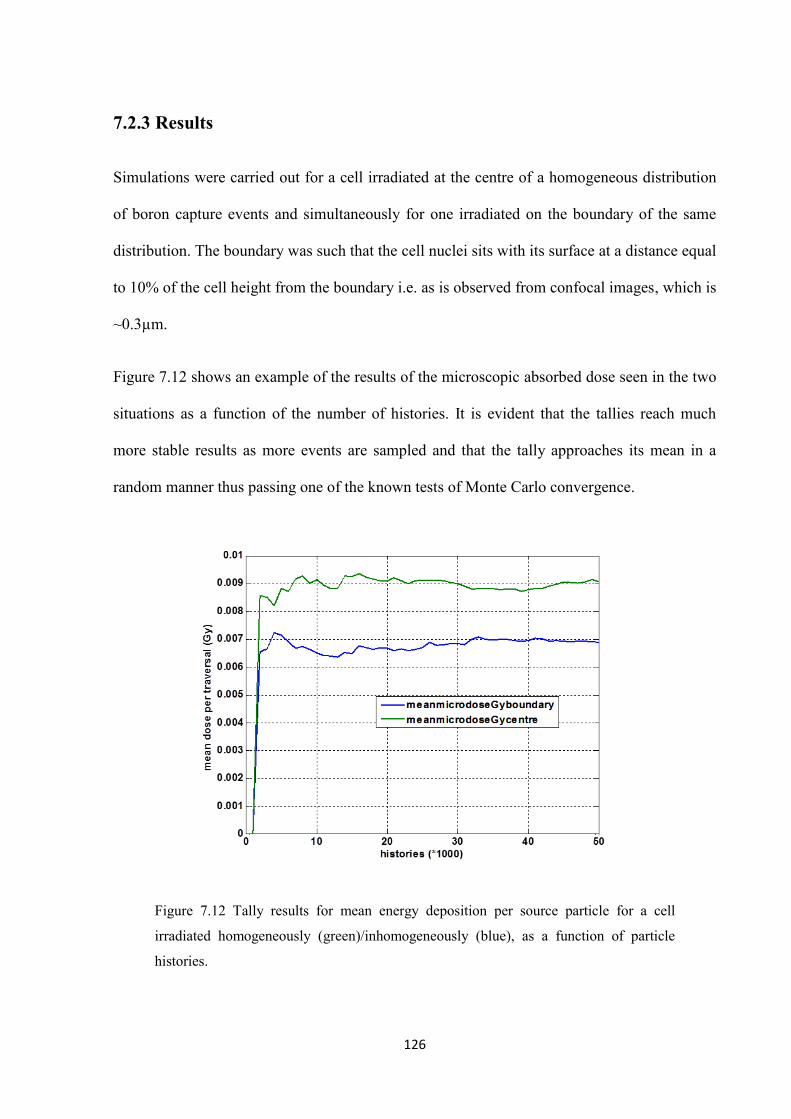
126
7.2.3 Results
Simulations were carried out for a cell irradiated at the centre of a homogeneous distribution
of boron capture events and simultaneously for one irradiated on the boundary of the same
distribution. The boundary was such that the cell nuclei sits with its surface at a distance equal
to 10% of the cell height from the boundary i.e. as is observed from confocal images, which is
~0.3µm.
Figure 7.12 shows an example of the results of the microscopic absorbed dose seen in the two
situations as a function of the number of histories. It is evident that the tallies reach much
more stable results as more events are sampled and that the tally approaches its mean in a
random manner thus passing one of the known tests of Monte Carlo convergence.
Figure 7.12 Tally results for mean energy deposition per source particle for a cell
irradiated homogeneously (green)/inhomogeneously (blue), as a function of particle
histories.
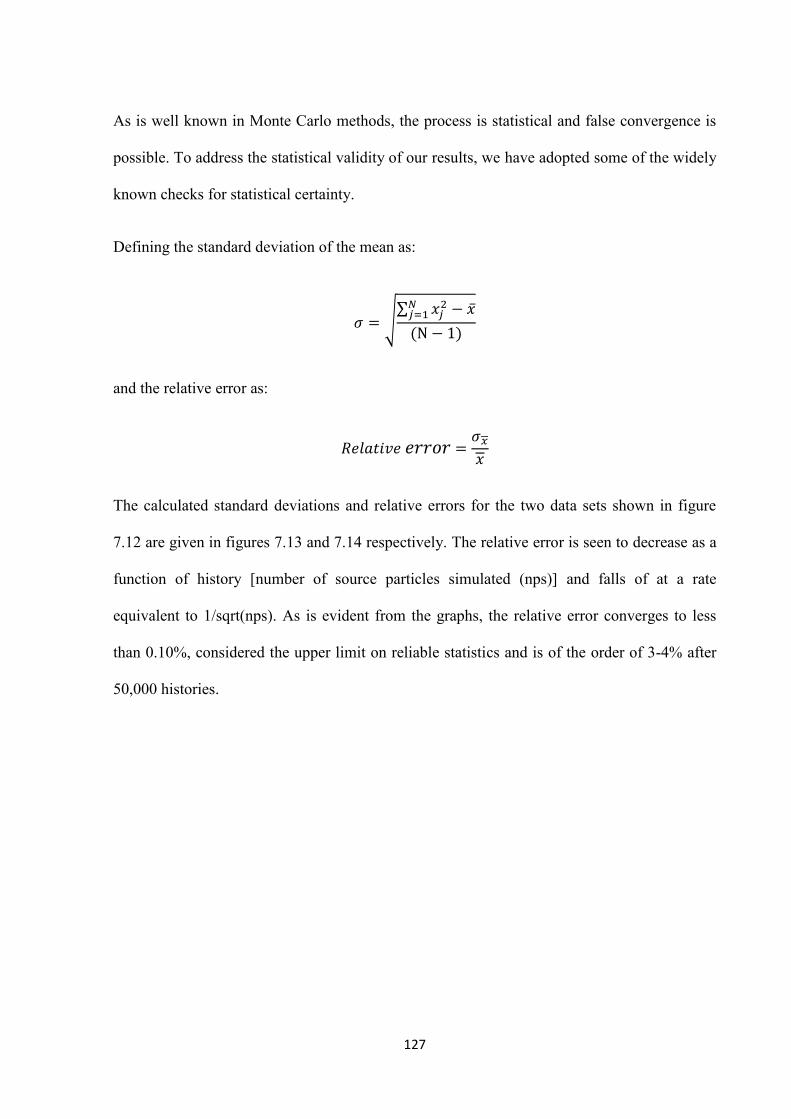
127
As is well known in Monte Carlo methods, the process is statistical and false convergence is
possible. To address the statistical validity of our results, we have adopted some of the widely
known checks for statistical certainty.
Defining the standard deviation of the mean as:
√∑
( )
and the relative error as:
The calculated standard deviations and relative errors for the two data sets shown in figure
7.12 are given in figures 7.13 and 7.14 respectively. The relative error is seen to decrease as a
function of history [number of source particles simulated (nps)] and falls of at a rate
equivalent to 1/sqrt(nps). As is evident from the graphs, the relative error converges to less
than 0.10%, considered the upper limit on reliable statistics and is of the order of 3-4% after
50,000 histories.
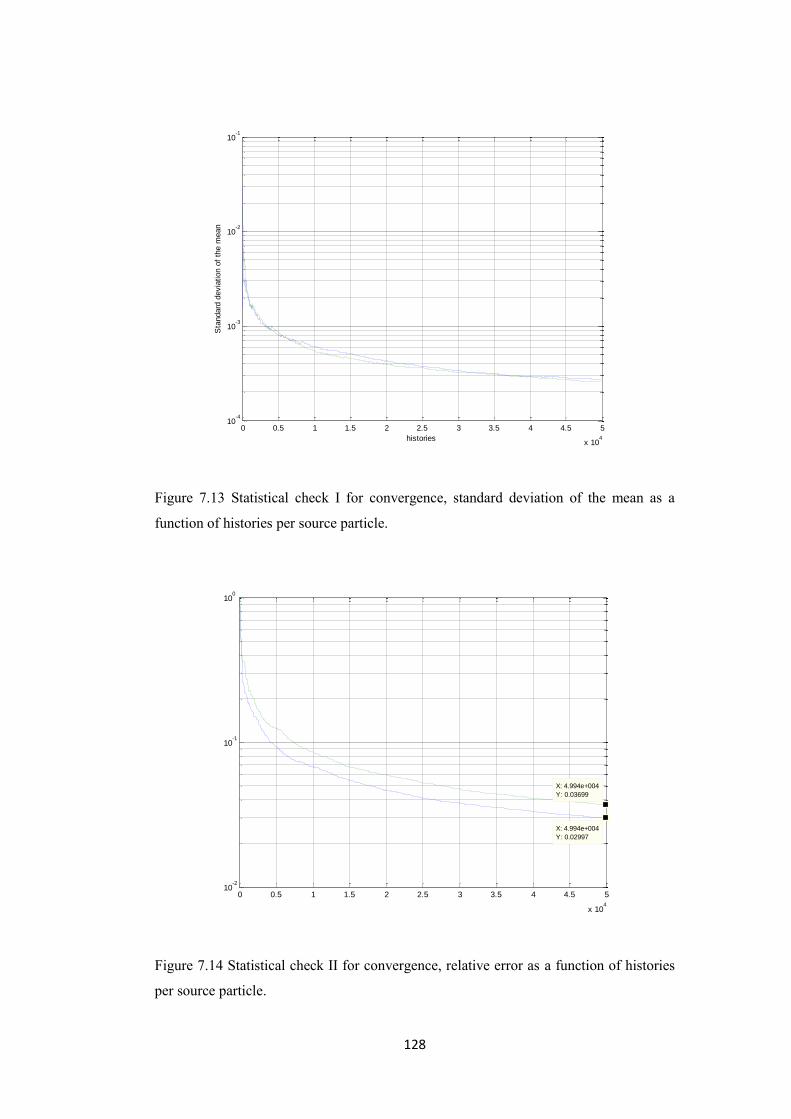
128
Figure 7.13 Statistical check I for convergence, standard deviation of the mean as a
function of histories per source particle.
Figure 7.14 Statistical check II for convergence, relative error as a function of histories
per source particle.
0 0.5 1 1.5 2 2.5 3 3.5 4 4.5 5
x 104
10-4
10-3
10-2
10-1
histories
Sta
ndard
devia
tion o
f th
e m
ean
0 0.5 1 1.5 2 2.5 3 3.5 4 4.5 5
x 104
10-2
10-1
100
X: 4.994e+004
Y: 0.03699
X: 4.994e+004
Y: 0.02997
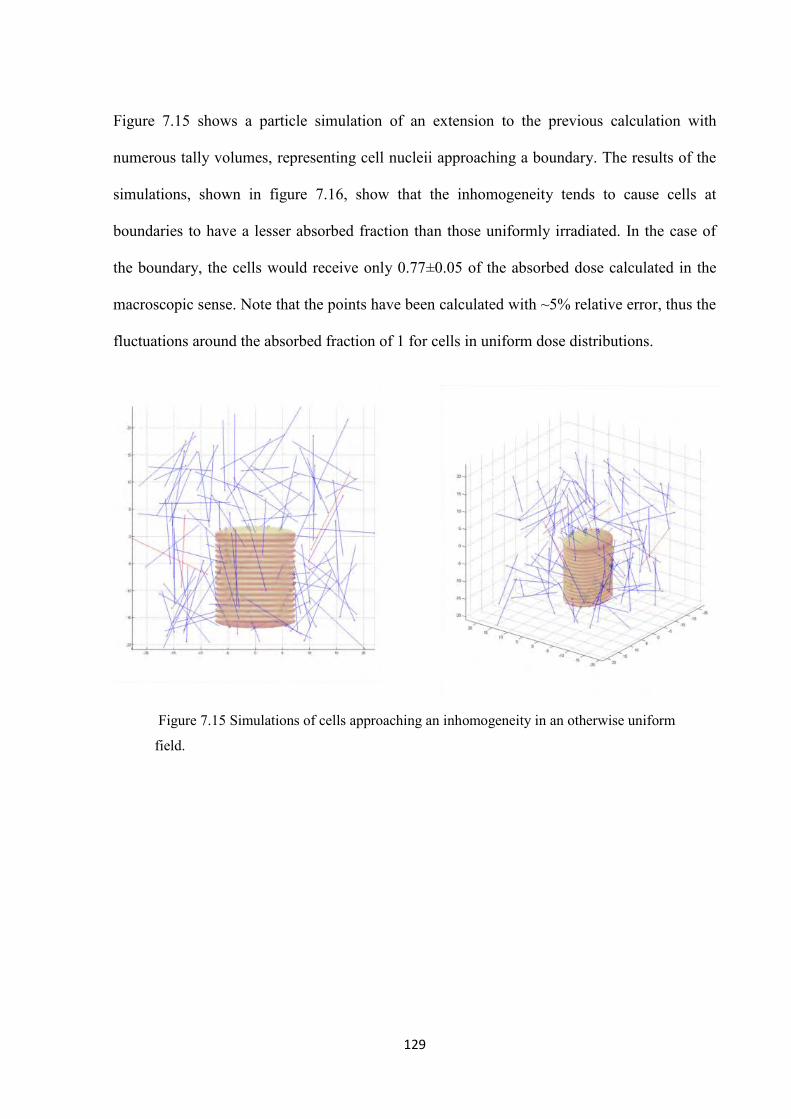
129
Figure 7.15 shows a particle simulation of an extension to the previous calculation with
numerous tally volumes, representing cell nucleii approaching a boundary. The results of the
simulations, shown in figure 7.16, show that the inhomogeneity tends to cause cells at
boundaries to have a lesser absorbed fraction than those uniformly irradiated. In the case of
the boundary, the cells would receive only 0.77±0.05 of the absorbed dose calculated in the
macroscopic sense. Note that the points have been calculated with ~5% relative error, thus the
fluctuations around the absorbed fraction of 1 for cells in uniform dose distributions.
Figure 7.15 Simulations of cells approaching an inhomogeneity in an otherwise uniform
field.
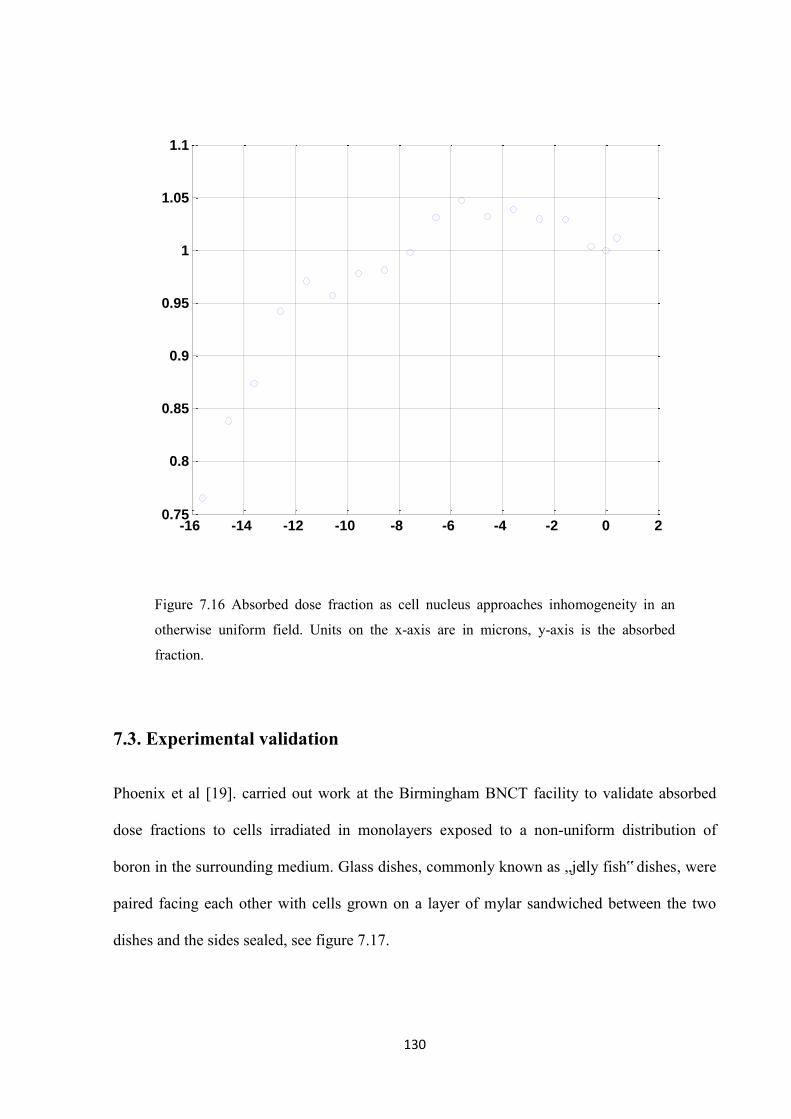
130
Figure 7.16 Absorbed dose fraction as cell nucleus approaches inhomogeneity in an
otherwise uniform field. Units on the x-axis are in microns, y-axis is the absorbed
fraction.
7.3. Experimental validation
Phoenix et al [19]. carried out work at the Birmingham BNCT facility to validate absorbed
dose fractions to cells irradiated in monolayers exposed to a non-uniform distribution of
boron in the surrounding medium. Glass dishes, commonly known as „jelly fish‟ dishes, were
paired facing each other with cells grown on a layer of mylar sandwiched between the two
dishes and the sides sealed, see figure 7.17.
-16 -14 -12 -10 -8 -6 -4 -2 0 20.75
0.8
0.85
0.9
0.95
1
1.05
1.1
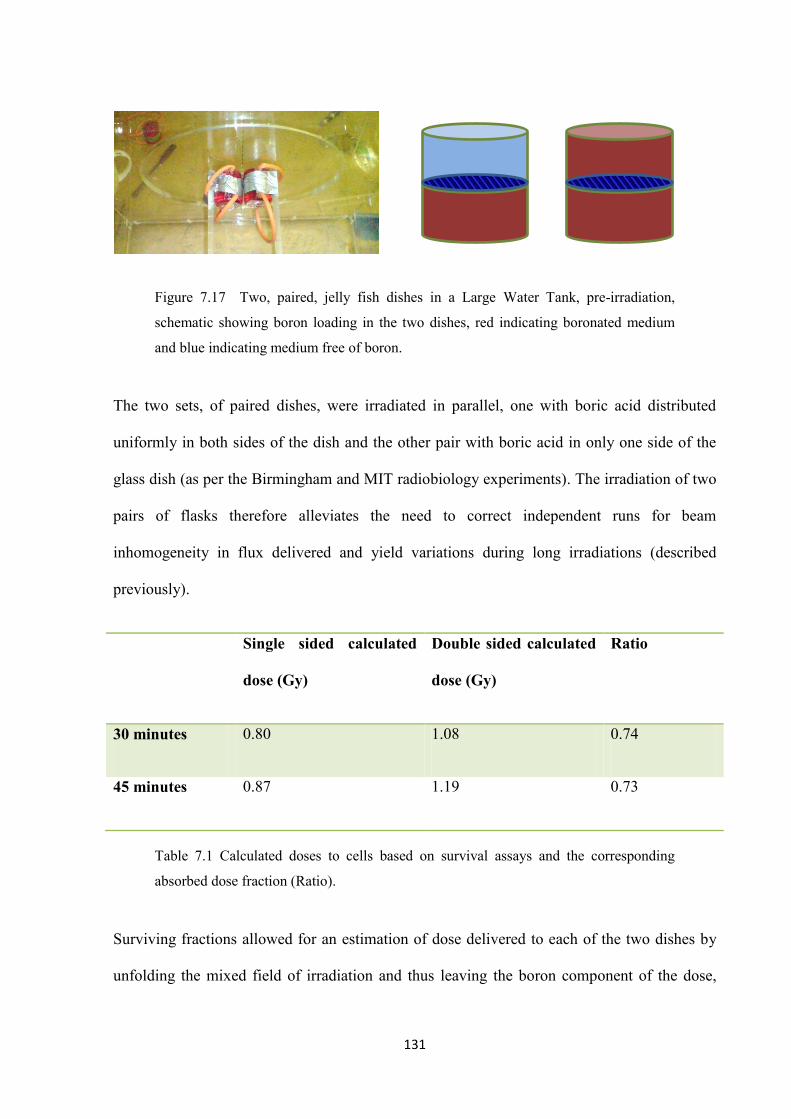
131
Figure 7.17 Two, paired, jelly fish dishes in a Large Water Tank, pre-irradiation,
schematic showing boron loading in the two dishes, red indicating boronated medium
and blue indicating medium free of boron.
The two sets, of paired dishes, were irradiated in parallel, one with boric acid distributed
uniformly in both sides of the dish and the other pair with boric acid in only one side of the
glass dish (as per the Birmingham and MIT radiobiology experiments). The irradiation of two
pairs of flasks therefore alleviates the need to correct independent runs for beam
inhomogeneity in flux delivered and yield variations during long irradiations (described
previously).
Single sided calculated
dose (Gy)
Double sided calculated
dose (Gy)
Ratio
30 minutes 0.80 1.08 0.74
45 minutes 0.87 1.19 0.73
Table 7.1 Calculated doses to cells based on survival assays and the corresponding
absorbed dose fraction (Ratio).
Surviving fractions allowed for an estimation of dose delivered to each of the two dishes by
unfolding the mixed field of irradiation and thus leaving the boron component of the dose,
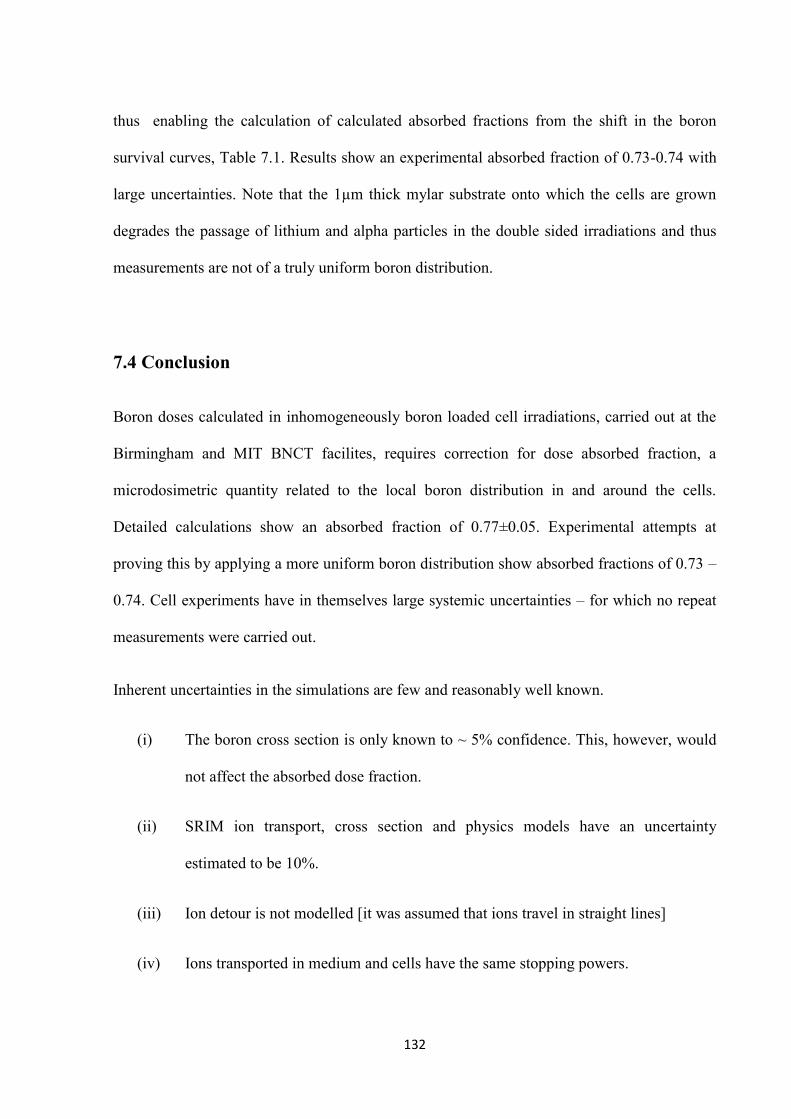
132
thus enabling the calculation of calculated absorbed fractions from the shift in the boron
survival curves, Table 7.1. Results show an experimental absorbed fraction of 0.73-0.74 with
large uncertainties. Note that the 1µm thick mylar substrate onto which the cells are grown
degrades the passage of lithium and alpha particles in the double sided irradiations and thus
measurements are not of a truly uniform boron distribution.
7.4 Conclusion
Boron doses calculated in inhomogeneously boron loaded cell irradiations, carried out at the
Birmingham and MIT BNCT facilites, requires correction for dose absorbed fraction, a
microdosimetric quantity related to the local boron distribution in and around the cells.
Detailed calculations show an absorbed fraction of 0.77±0.05. Experimental attempts at
proving this by applying a more uniform boron distribution show absorbed fractions of 0.73 –
0.74. Cell experiments have in themselves large systemic uncertainties – for which no repeat
measurements were carried out.
Inherent uncertainties in the simulations are few and reasonably well known.
(i) The boron cross section is only known to ~ 5% confidence. This, however, would
not affect the absorbed dose fraction.
(ii) SRIM ion transport, cross section and physics models have an uncertainty
estimated to be 10%.
(iii) Ion detour is not modelled [it was assumed that ions travel in straight lines]
(iv) Ions transported in medium and cells have the same stopping powers.
133
(v) Neutron fluence across the cell population was treated as uniform and in reality
will vary across the flask surface.
(vi) Boron uniformity in cell nucleus and cytoplasm has not been proven.
Chapter 9 uses the results of these simulations to create survival curves from LET
distributions recorded in the simulations carried out in determining absorbed fraction.
134
Chapter 8
THERMAL NEUTRON DOSE
The „thermal neutron‟ dose is one of the four major components of dose in BNCT, the others
being the Boron, Fast neutron and Photon. The thermal component in itself refers to any
particulate dose resulting from the capture of thermal neutrons in matter. Nitrogen has a
relatively high natural abundance amongst elements in the human body; it is 3.3% by weight
in muscle tissue and 2.2% by weight in brain.
Gabel et al. [27] in trying to determine the RBE of V79 Chinese Hamster Cells to capture
reactions in boron and nitrogen has accurately measured the nitrogen content of V79 cells by
counting the number of cells grown in suspension. The cells were then centrifuged and the
supernatant fraction removed by suction. The dried and weighed sediment was analysed and
his results show that V79 cells have 1.7% by weight nitrogen in wet cells.
The capture of thermal neutrons in nitrogen, 14N(n,p)14C, has a reaction Q-value of 625.87keV
(±0.004)[2] and results in a recoil proton carrying 580keV of the energy, the carbon ion
carrying 42keV. The recoil proton and carbon ion have ranges in water of ~10µm and 0.23
µm respectively, the proton range being comparable to the lithium/alpha range but with wider
lateral straggling.
Gabel et al. [27] further estimated the true nitrogen dose deposited in cells irradiated in single
cell suspensions at the cold neutron source at Institute Laue_Langevin (ILL) and the Medical
135
Research Reactor at Brookhaven National Laboratory (BNL) to be 85% and 65%
respectively, with nitrogen content in the cell growth medium differing between the two
experimental set ups, being 0.9% and 0% by weight respectively. From the absorbed doses
and survival measurements, RBE‟s of 2.3 and 1.9 were calculated for 10B(n,α)7Li and
14N(n,p)14C respectively.
White [32] has grossly approximated the decrease in the thermal dose component of the
MITRII Epithermal beam, in the absence of boron, for a Chinese Hamster Ovary [CHO] cell
line grown as a monolayer in T25 flasks to be 50% due the difference in nitrogen component
of the medium, flask and cell line as well as including geometrical factors. Arriving at this
value, she assumed nitrogen content of CHO to be the same as that of tissue, the content of
nitrogen in medium to be 0.014% by mass and none in the T-25 flasks. (I) The protons from
the thermal capture in nitrogen, originating in a cell, were thought to leave any cells before
depositing most of their energy. (II) Capture in the flask walls would be dominated by
hydrogen and carbon, both of which emit gamma rays – measured by ion chamber dosimetry.
(III) the dose components from thermal neutron capture were approximated by kerma factors,
8.54e-13cGy/cm2 in medium, and 3.3E-13cGy/cm2 in the flask walls compared to 1.79E-11
cGy/cm2 for ICRU 46 adult whole brain. This led to an estimate of a CHO cell kerma factor
of half that of brain i.e. 50% absorbed fraction [in this particular radiation geometry and
absence of boron].
Mason et al.[33], has carried out a detailed comparison and analysis of the beam quality, in
terms of high and low LET dose components at various depths, for two European NCT
facilites, the Birmingham accelerator based, pre-clinical, facility and the Studsvik nuclear
reactor based, fully clinical, facility. Their relative effectiveness on clonogenic assays of V79
136
cell kill was determined in the absence of cell repair mechanisms by maintaining the cells at
low temperature (4 degrees C). The cells were irradiated in vials as opposed to flasks and
were thus in „suspension‟. She, like the previous authors, also estimated the absorbed dose
fraction, as the microdosimetric analysis was beyond the scope of her study. She reports a
nitrogen content, in Dulbecco‟s Modified Eagles Medium (DMEM) and 10% foetal calf
serum with 1% Glutamine and 1% penicillin of 0.3%, and uses the 1.7% determined by Gabel
et al. [27] as the V79 cell nitrogen content. In calculating her true absorbed nitrogen dose she
averages down the 1.7% N in cells to 1.1% by weight i.e. an absorbed fraction of 65%.
In the case of the present study, to quantify the dose, both macroscopic and microscopic, to
cells irradiated in a monolayer at both the MITRII Fission Converter Beam (FCB) and at the
University of Birmingham‟s 2.8MeV Dynamitron particle accelerator: The V79 cells were
grown as monolayers and incubated in a medium containing boric (H3BO3) acid. Boric acid
contains no nitrogen, neither the Mylar film onto which the V79 cells attach nor the
polyethylene T25 flasks, on which the cells are plated and irradiated contain any nitrogen.
The medium in which the cells are irradiated, in the presence of 50ppm boric acid, contains
0.012% by weight nitrogen, the added 10% by weight bovine foetal calf serum – contains
approximately 1% by weight nitrogen [39]. Thus the only major nitrogen component of the
nitrogen-thermal neutron dose is the cells themselves (1.7% by weight nitrogen) and the
aggregate medium, ~0.11% by weight nitrogen.
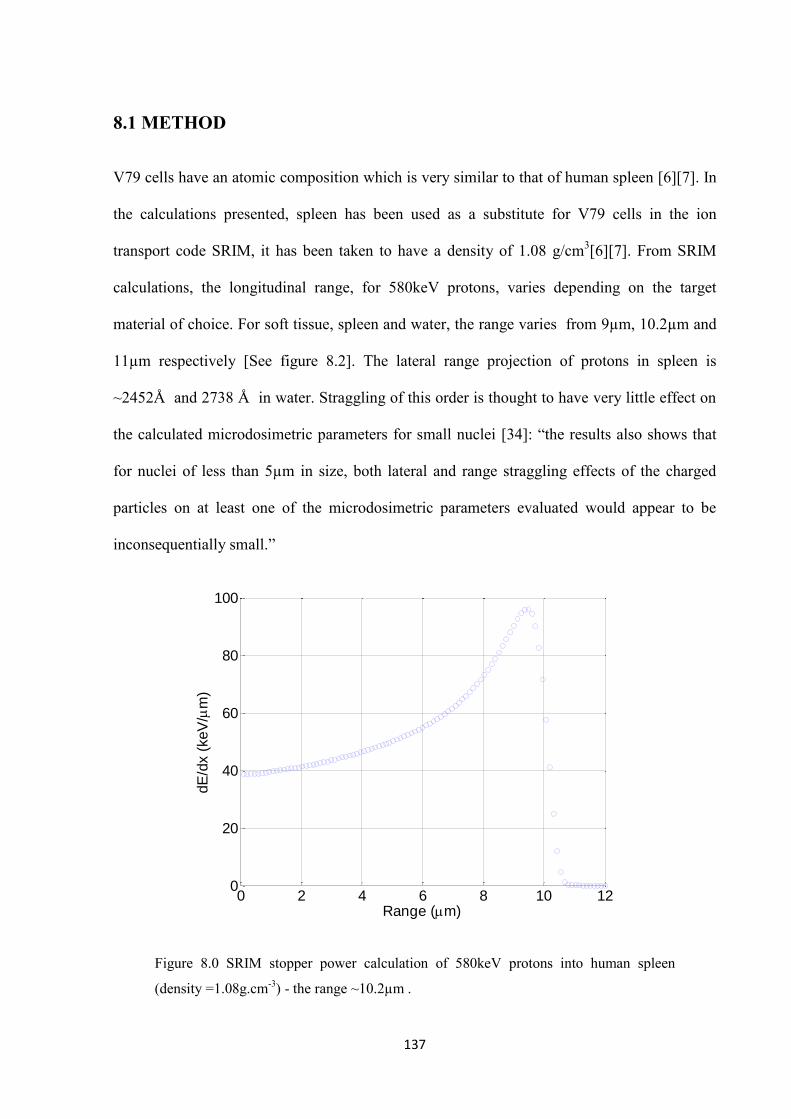
137
8.1 METHOD
V79 cells have an atomic composition which is very similar to that of human spleen [6][7]. In
the calculations presented, spleen has been used as a substitute for V79 cells in the ion
transport code SRIM, it has been taken to have a density of 1.08 g/cm3[6][7]. From SRIM
calculations, the longitudinal range, for 580keV protons, varies depending on the target
material of choice. For soft tissue, spleen and water, the range varies from 9µm, 10.2µm and
11µm respectively [See figure 8.2]. The lateral range projection of protons in spleen is
~2452Å and 2738 Å in water. Straggling of this order is thought to have very little effect on
the calculated microdosimetric parameters for small nuclei [34]: “the results also shows that
for nuclei of less than 5µm in size, both lateral and range straggling effects of the charged
particles on at least one of the microdosimetric parameters evaluated would appear to be
inconsequentially small.”
Figure 8.0 SRIM stopper power calculation of 580keV protons into human spleen
(density =1.08g.cm-3) - the range ~10.2µm .
0 2 4 6 8 10 120
20
40
60
80
100
Range (m)
dE
/dx (
keV
/m
)
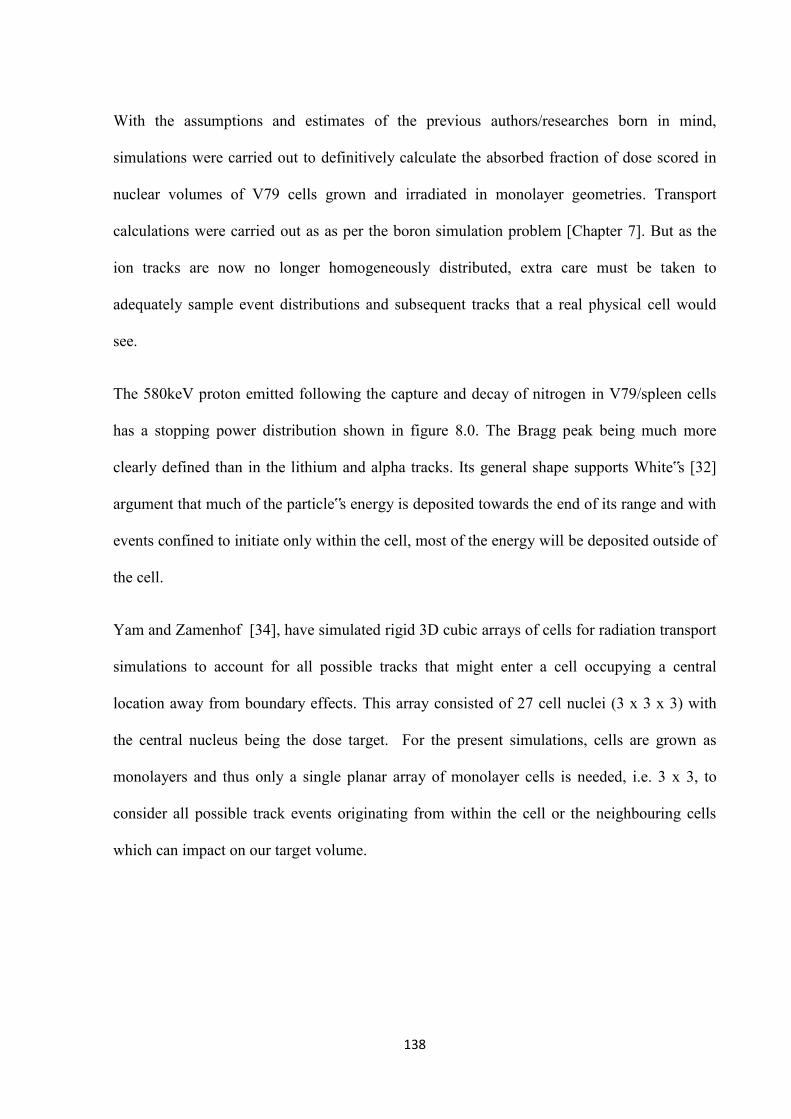
138
With the assumptions and estimates of the previous authors/researches born in mind,
simulations were carried out to definitively calculate the absorbed fraction of dose scored in
nuclear volumes of V79 cells grown and irradiated in monolayer geometries. Transport
calculations were carried out as as per the boron simulation problem [Chapter 7]. But as the
ion tracks are now no longer homogeneously distributed, extra care must be taken to
adequately sample event distributions and subsequent tracks that a real physical cell would
see.
The 580keV proton emitted following the capture and decay of nitrogen in V79/spleen cells
has a stopping power distribution shown in figure 8.0. The Bragg peak being much more
clearly defined than in the lithium and alpha tracks. Its general shape supports White‟s [32]
argument that much of the particle‟s energy is deposited towards the end of its range and with
events confined to initiate only within the cell, most of the energy will be deposited outside of
the cell.
Yam and Zamenhof [34], have simulated rigid 3D cubic arrays of cells for radiation transport
simulations to account for all possible tracks that might enter a cell occupying a central
location away from boundary effects. This array consisted of 27 cell nuclei (3 x 3 x 3) with
the central nucleus being the dose target. For the present simulations, cells are grown as
monolayers and thus only a single planar array of monolayer cells is needed, i.e. 3 x 3, to
consider all possible track events originating from within the cell or the neighbouring cells
which can impact on our target volume.
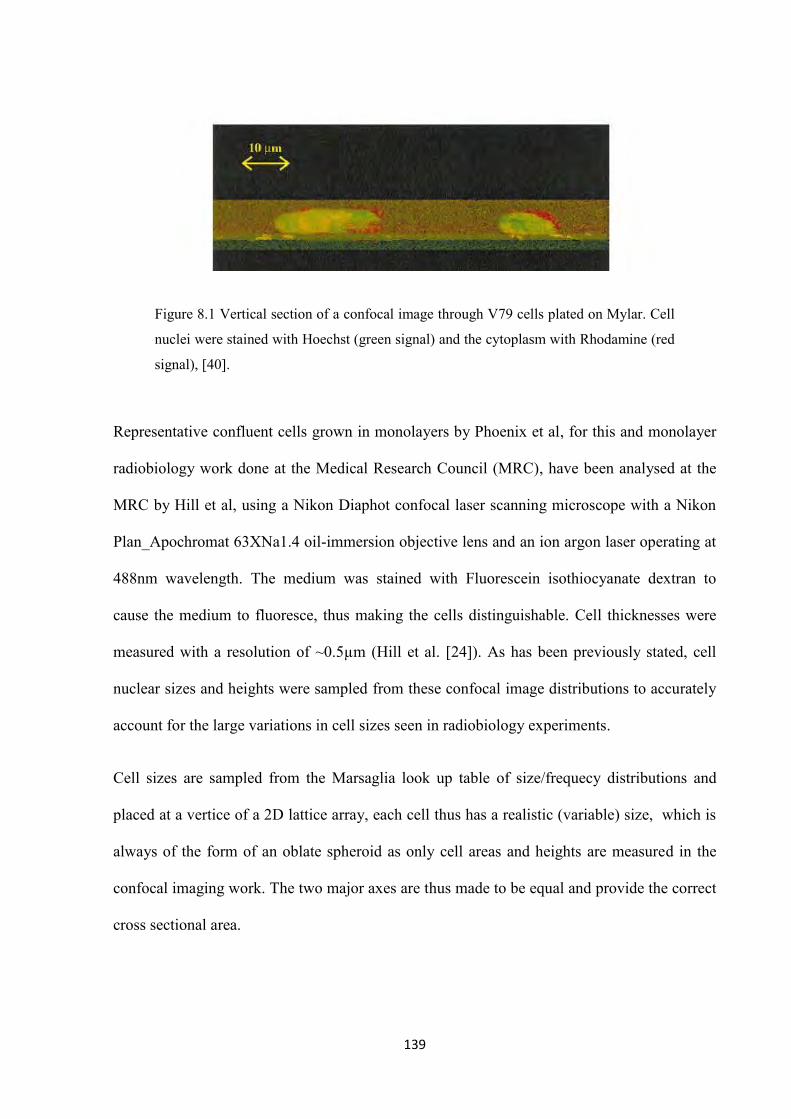
139
Figure 8.1 Vertical section of a confocal image through V79 cells plated on Mylar. Cell
nuclei were stained with Hoechst (green signal) and the cytoplasm with Rhodamine (red
signal), [40].
Representative confluent cells grown in monolayers by Phoenix et al, for this and monolayer
radiobiology work done at the Medical Research Council (MRC), have been analysed at the
MRC by Hill et al, using a Nikon Diaphot confocal laser scanning microscope with a Nikon
Plan_Apochromat 63XNa1.4 oil-immersion objective lens and an ion argon laser operating at
488nm wavelength. The medium was stained with Fluorescein isothiocyanate dextran to
cause the medium to fluoresce, thus making the cells distinguishable. Cell thicknesses were
measured with a resolution of ~0.5µm (Hill et al. [24]). As has been previously stated, cell
nuclear sizes and heights were sampled from these confocal image distributions to accurately
account for the large variations in cell sizes seen in radiobiology experiments.
Cell sizes are sampled from the Marsaglia look up table of size/frequecy distributions and
placed at a vertice of a 2D lattice array, each cell thus has a realistic (variable) size, which is
always of the form of an oblate spheroid as only cell areas and heights are measured in the
confocal imaging work. The two major axes are thus made to be equal and provide the correct
cross sectional area.
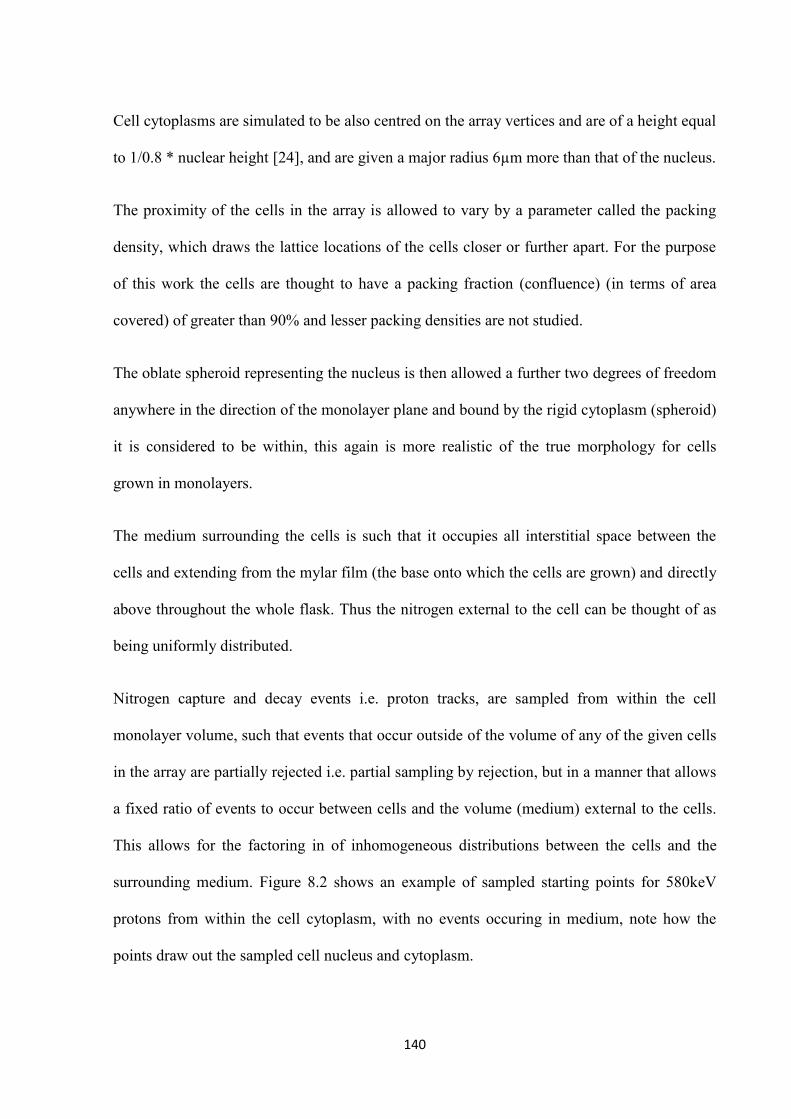
140
Cell cytoplasms are simulated to be also centred on the array vertices and are of a height equal
to 1/0.8 * nuclear height [24], and are given a major radius 6µm more than that of the nucleus.
The proximity of the cells in the array is allowed to vary by a parameter called the packing
density, which draws the lattice locations of the cells closer or further apart. For the purpose
of this work the cells are thought to have a packing fraction (confluence) (in terms of area
covered) of greater than 90% and lesser packing densities are not studied.
The oblate spheroid representing the nucleus is then allowed a further two degrees of freedom
anywhere in the direction of the monolayer plane and bound by the rigid cytoplasm (spheroid)
it is considered to be within, this again is more realistic of the true morphology for cells
grown in monolayers.
The medium surrounding the cells is such that it occupies all interstitial space between the
cells and extending from the mylar film (the base onto which the cells are grown) and directly
above throughout the whole flask. Thus the nitrogen external to the cell can be thought of as
being uniformly distributed.
Nitrogen capture and decay events i.e. proton tracks, are sampled from within the cell
monolayer volume, such that events that occur outside of the volume of any of the given cells
in the array are partially rejected i.e. partial sampling by rejection, but in a manner that allows
a fixed ratio of events to occur between cells and the volume (medium) external to the cells.
This allows for the factoring in of inhomogeneous distributions between the cells and the
surrounding medium. Figure 8.2 shows an example of sampled starting points for 580keV
protons from within the cell cytoplasm, with no events occuring in medium, note how the
points draw out the sampled cell nucleus and cytoplasm.
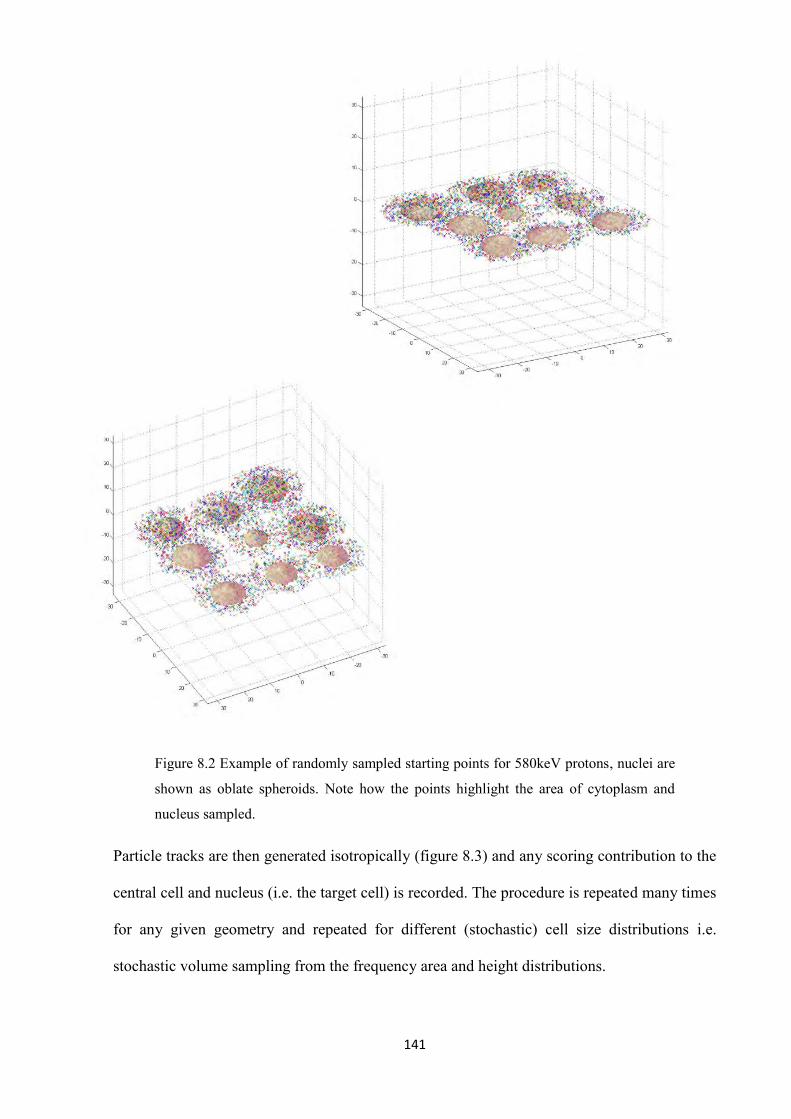
141
Figure 8.2 Example of randomly sampled starting points for 580keV protons, nuclei are
shown as oblate spheroids. Note how the points highlight the area of cytoplasm and
nucleus sampled.
Particle tracks are then generated isotropically (figure 8.3) and any scoring contribution to the
central cell and nucleus (i.e. the target cell) is recorded. The procedure is repeated many times
for any given geometry and repeated for different (stochastic) cell size distributions i.e.
stochastic volume sampling from the frequency area and height distributions.
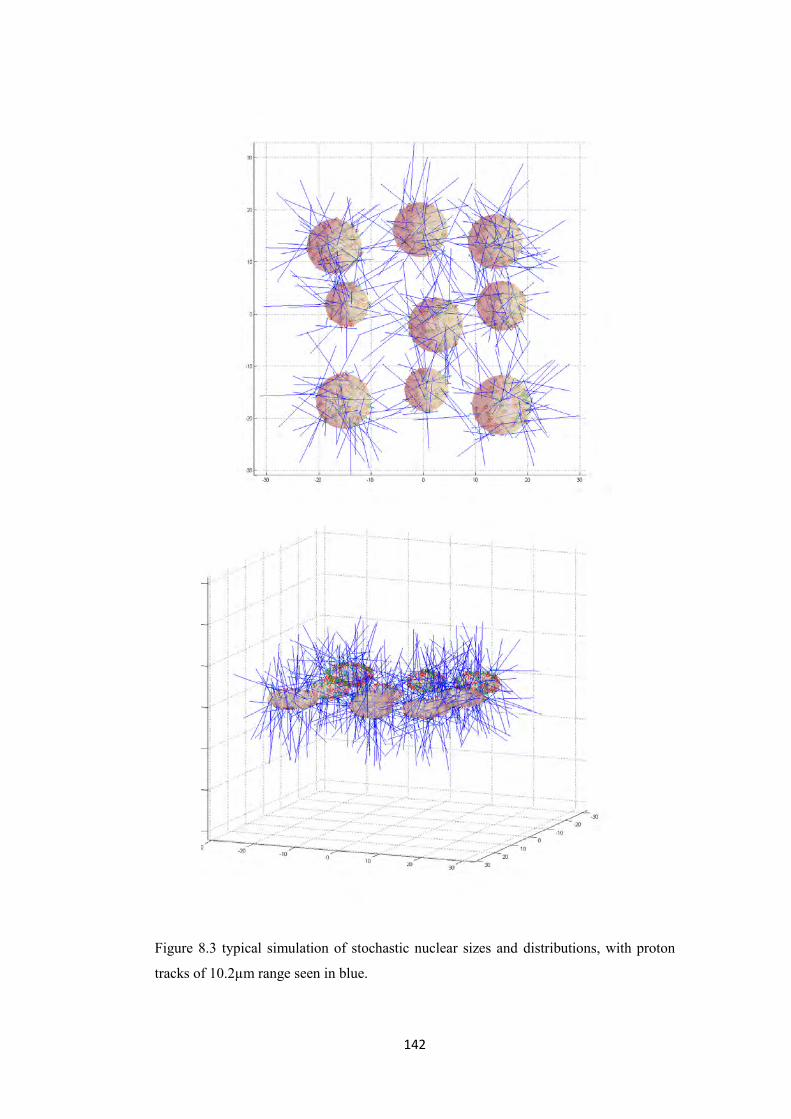
142
Figure 8.3 typical simulation of stochastic nuclear sizes and distributions, with proton
tracks of 10.2µm range seen in blue.
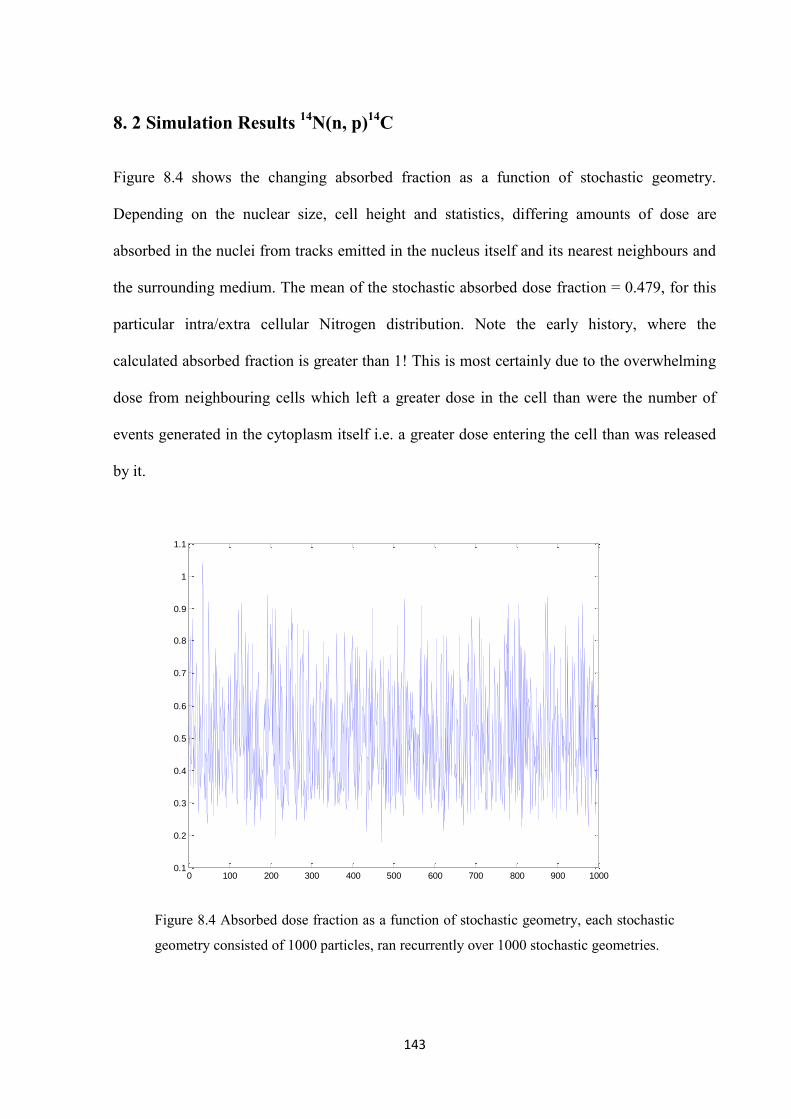
143
8. 2 Simulation Results 14N(n, p)14C
Figure 8.4 shows the changing absorbed fraction as a function of stochastic geometry.
Depending on the nuclear size, cell height and statistics, differing amounts of dose are
absorbed in the nuclei from tracks emitted in the nucleus itself and its nearest neighbours and
the surrounding medium. The mean of the stochastic absorbed dose fraction = 0.479, for this
particular intra/extra cellular Nitrogen distribution. Note the early history, where the
calculated absorbed fraction is greater than 1! This is most certainly due to the overwhelming
dose from neighbouring cells which left a greater dose in the cell than were the number of
events generated in the cytoplasm itself i.e. a greater dose entering the cell than was released
by it.
Figure 8.4 Absorbed dose fraction as a function of stochastic geometry, each stochastic
geometry consisted of 1000 particles, ran recurrently over 1000 stochastic geometries.
0 100 200 300 400 500 600 700 800 900 10000.1
0.2
0.3
0.4
0.5
0.6
0.7
0.8
0.9
1
1.1
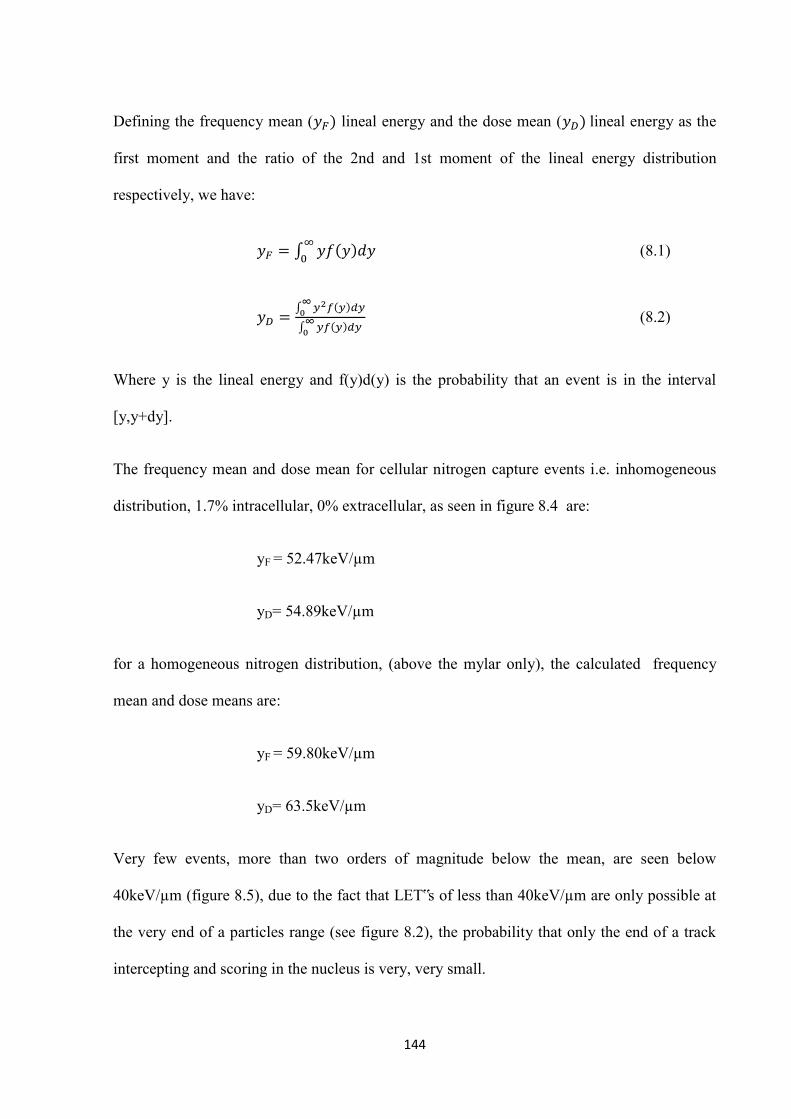
144
Defining the frequency mean ( lineal energy and the dose mean ( lineal energy as the
first moment and the ratio of the 2nd and 1st moment of the lineal energy distribution
respectively, we have:
∫ (
(8.1)
∫ (
∫ (
(8.2)
Where y is the lineal energy and f(y)d(y) is the probability that an event is in the interval
[y,y+dy].
The frequency mean and dose mean for cellular nitrogen capture events i.e. inhomogeneous
distribution, 1.7% intracellular, 0% extracellular, as seen in figure 8.4 are:
yF = 52.47keV/µm
yD= 54.89keV/µm
for a homogeneous nitrogen distribution, (above the mylar only), the calculated frequency
mean and dose means are:
yF = 59.80keV/µm
yD= 63.5keV/µm
Very few events, more than two orders of magnitude below the mean, are seen below
40keV/µm (figure 8.5), due to the fact that LET‟s of less than 40keV/µm are only possible at
the very end of a particles range (see figure 8.2), the probability that only the end of a track
intercepting and scoring in the nucleus is very, very small.
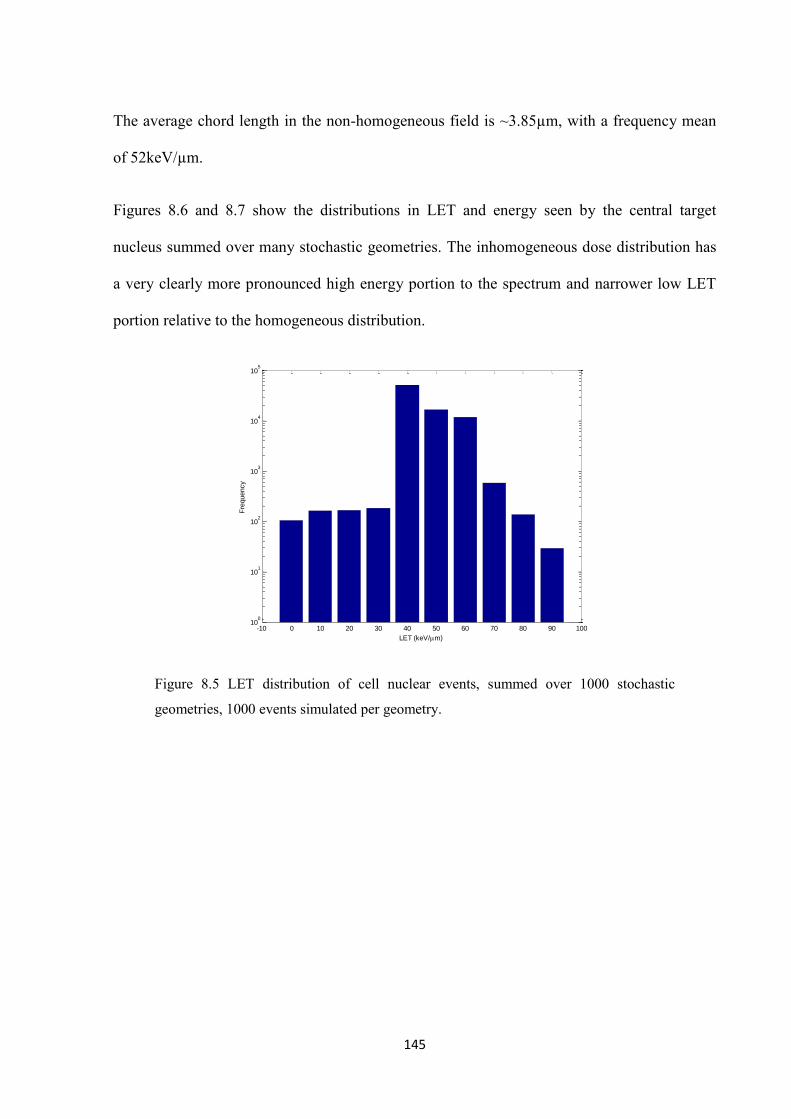
145
The average chord length in the non-homogeneous field is ~3.85µm, with a frequency mean
of 52keV/µm.
Figures 8.6 and 8.7 show the distributions in LET and energy seen by the central target
nucleus summed over many stochastic geometries. The inhomogeneous dose distribution has
a very clearly more pronounced high energy portion to the spectrum and narrower low LET
portion relative to the homogeneous distribution.
Figure 8.5 LET distribution of cell nuclear events, summed over 1000 stochastic
geometries, 1000 events simulated per geometry.
-10 0 10 20 30 40 50 60 70 80 90 10010
0
101
102
103
104
105
LET (keV/m)
Fre
quency
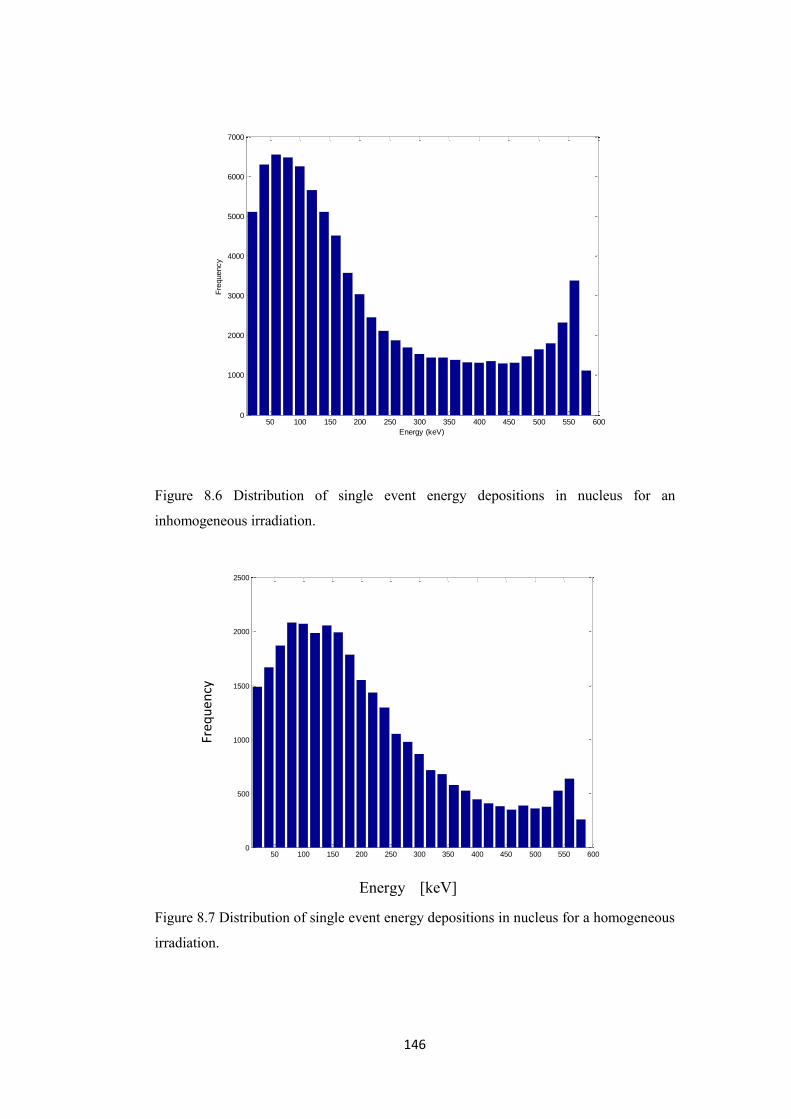
146
Figure 8.6 Distribution of single event energy depositions in nucleus for an
inhomogeneous irradiation.
Figure 8.7 Distribution of single event energy depositions in nucleus for a homogeneous
irradiation.
50 100 150 200 250 300 350 400 450 500 550 6000
1000
2000
3000
4000
5000
6000
7000
Energy (keV)
Fre
quency
50 100 150 200 250 300 350 400 450 500 550 6000
500
1000
1500
2000
2500
Energy [keV]
Freq
uen
cy
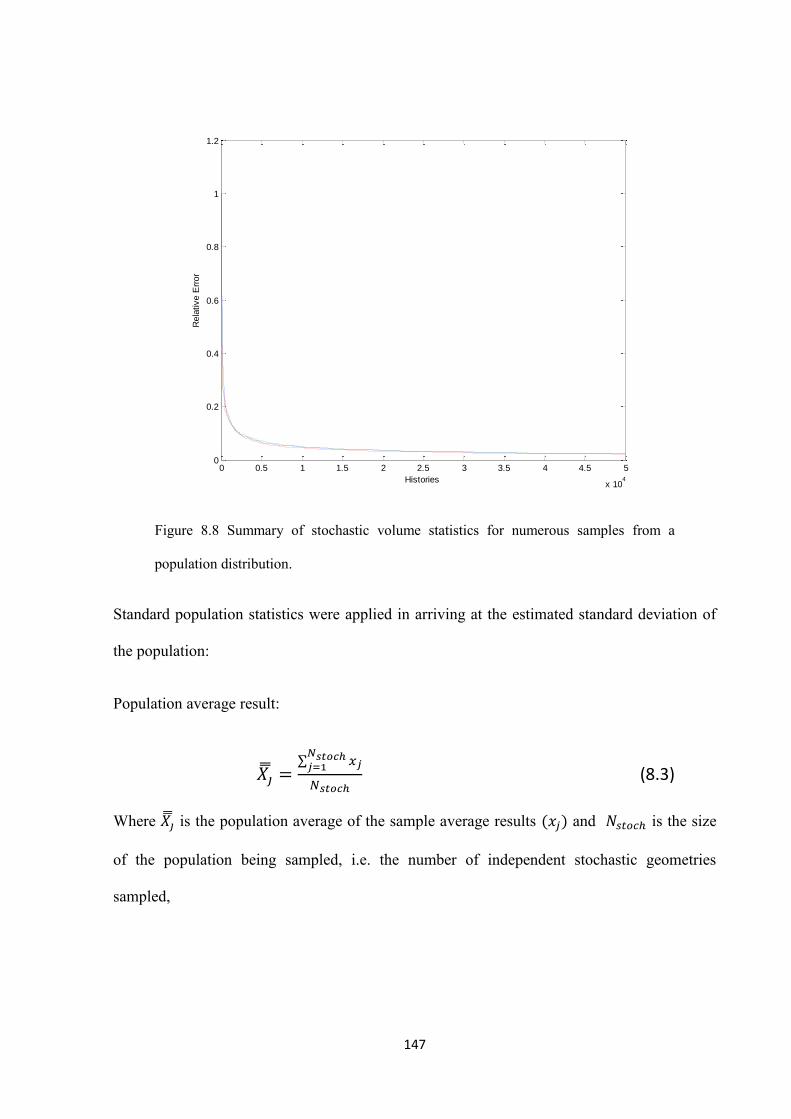
147
Figure 8.8 Summary of stochastic volume statistics for numerous samples from a
population distribution.
Standard population statistics were applied in arriving at the estimated standard deviation of
the population:
Population average result:
∑
(8.3)
Where is the population average of the sample average results ( and is the size
of the population being sampled, i.e. the number of independent stochastic geometries
sampled,
0 0.5 1 1.5 2 2.5 3 3.5 4 4.5 5
x 104
0
0.2
0.4
0.6
0.8
1
1.2
Histories
Rela
tive E
rror
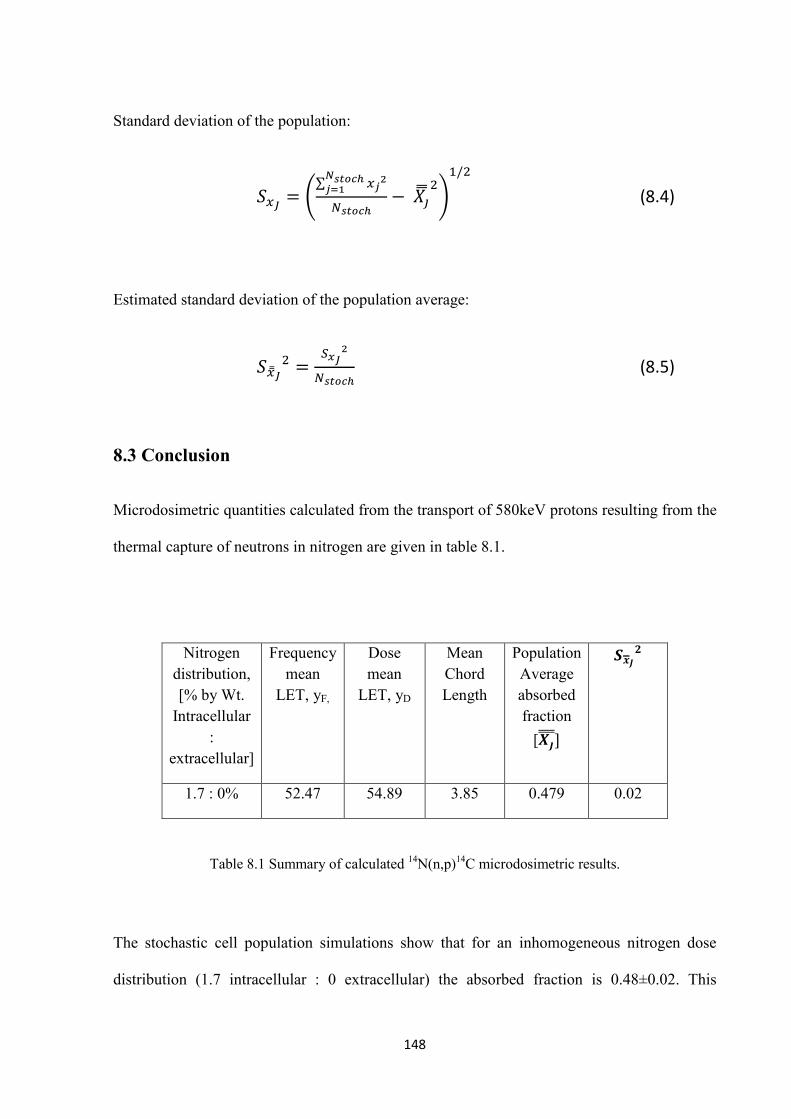
148
Standard deviation of the population:
(
∑
)
(8.4)
Estimated standard deviation of the population average:
(8.5)
8.3 Conclusion
Microdosimetric quantities calculated from the transport of 580keV protons resulting from the
thermal capture of neutrons in nitrogen are given in table 8.1.
Nitrogen distribution, [% by Wt.
Intracellular :
extracellular]
Frequency mean
LET, yF,
Dose mean
LET, yD
Mean Chord Length
Population Average absorbed fraction
[
1.7 : 0% 52.47 54.89 3.85 0.479 0.02
Table 8.1 Summary of calculated 14N(n,p)14C microdosimetric results.
The stochastic cell population simulations show that for an inhomogeneous nitrogen dose
distribution (1.7 intracellular : 0 extracellular) the absorbed fraction is 0.48±0.02. This
149
confirms the guess-estimate by White et al. [32] for similar monolayer experiments at MIT (in
the absence of boron), who based their dosimetry on an absorbed fraction of 0.5.
These results don‟t readily apply to the absorbed fraction estimated by Mason et al. [33], as
no cell suspension simulations were carried out for this dose component.
The absorbed fractions as calculated in Chapters 8 and 9, combined with the macroscopic
dosimetry measurements and MCNP calculations (normalised to measurements) now
correctly feed into the cell radiobiology work carried out by the Birmingham group for all the
mixed field dose components aforementioned. The results of which can be seen in the
following chapter.
150
Chapter 9
CELL SURVIVAL
9.1 Birmingham Cell Survival Results
An extensive radiobiological programme has been conducted by the University of
Birmingham BNCT group and collaborating institutions. One of the prime objectives of
this collective work remained the production of a validated protocol for the pre-clinical
biological characterisation of the University of Birmingham BNCT facility and for this to
be established internationally and utilised at all BNCT facilities.
The aim of this study was to quantify the doses, both macroscopic and microscopic,
observed during the irradiations of cell monolayers at the University of Birmingham’s
2.8MeV Dynamitron particle accelerator and at the MIT research reactor. V79 cells,
incubated in 50ppm boric acid were irradiated at 2 depths in the LWT at 37˚C using
standard radiobiology methods. Cell dosimetry was carried out using paired (dilute) gold
and manganese foils along with Mg/Ar and TE ion chambers to calculate boron, thermal
neutron, fast neutron and photon doses, at several depths in a standard large water tank
(LWT). In the case of the Birmingham facility the Monte Carlo code MCNPX was used to
calculate off-axis correction factors to the central depth dose curve for the Birmingham
beam and perturbation factors caused by the presence of the boronated medium.
The combined outcome of cell survival experiments and the dosimetry methods, along
with correction factors previously described, result in the survival curve, shown in figure
9.1, for the complete mixed field of the Birmingham epithermal beam. The cell survival
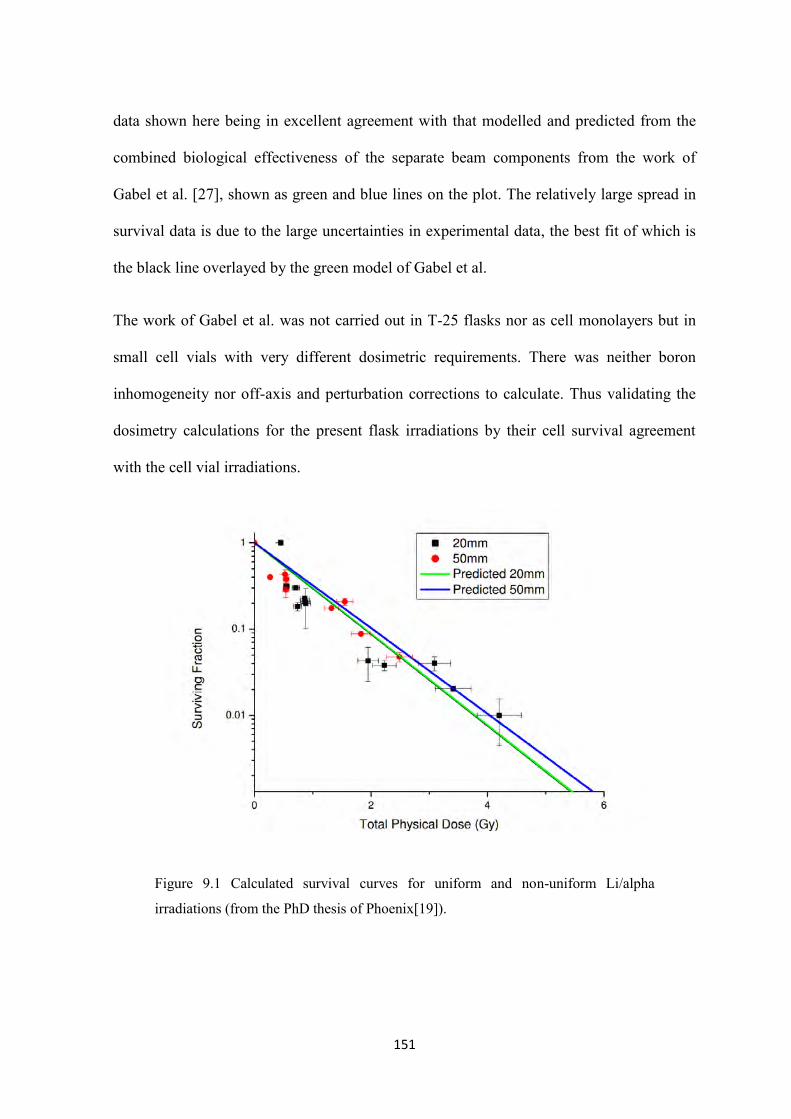
151
data shown here being in excellent agreement with that modelled and predicted from the
combined biological effectiveness of the separate beam components from the work of
Gabel et al. [27], shown as green and blue lines on the plot. The relatively large spread in
survival data is due to the large uncertainties in experimental data, the best fit of which is
the black line overlayed by the green model of Gabel et al.
The work of Gabel et al. was not carried out in T-25 flasks nor as cell monolayers but in
small cell vials with very different dosimetric requirements. There was neither boron
inhomogeneity nor off-axis and perturbation corrections to calculate. Thus validating the
dosimetry calculations for the present flask irradiations by their cell survival agreement
with the cell vial irradiations.
Figure 9.1 Calculated survival curves for uniform and non-uniform Li/alpha
irradiations (from the PhD thesis of Phoenix[19]).
152
9.2 Modelling Cell Survival
Charlton et al. [23] have put forward a very useful foundation on which to embark on
calculating the effects of inhomogeneities in more complex irradiation fields and compute
survival curves on the basis of track segment irradiations to cell monolayers. This novel
method allowed Charlton to accurately predict survival curves for the irradiation of V79
monolayers and suspensions from a uniform distribution of bizmuth-212 (an alpha particle
emitter).
He introduces a parameter, specific lethal dose (D0), which functions as a measure of cell
kill. The fraction of cells surviving traversal by ionising particles of given LET is exp(-
D/D0), where D is the dose deposited, by rearranging for D0 we have:
(9.1)
Where,
D37 is the mean lethal dose for monolayer irradiations (track segment geometries) and d is
the average dose deposited in the track segment irradiation of the cell per passage.
The previous Monte Carlo methods described in Chapter 8 were employed to simulate
lithium ions and alpha particle tracks in semi-stochastic geometries representative of cell
monolayers and suspension irradiations, incubated in a medium with 50µg/g boric acid.
The microdosimetric single event results have been used to feed into Charlton’s model and
calculate survival curves.
Using the calculated chord lengths and track averaged LETs of the particles from
simulations, for any given traversal of the cell nucleus, the equivalent specific lethal dose
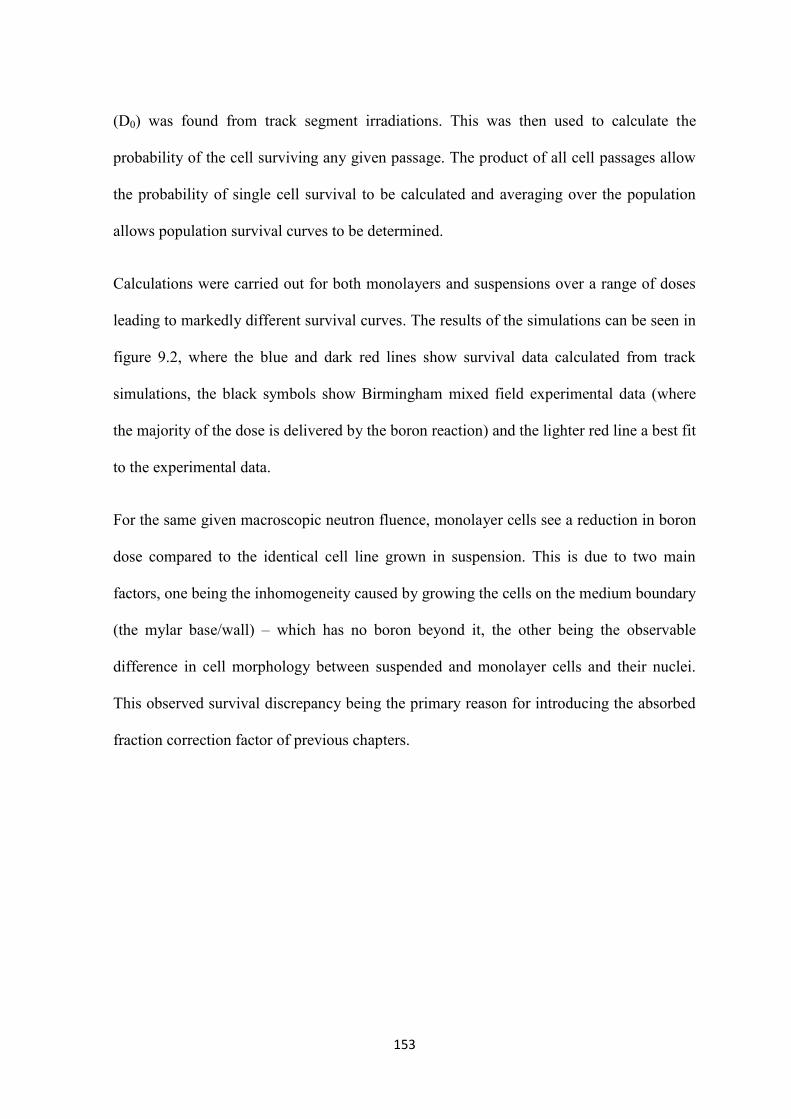
153
(D0) was found from track segment irradiations. This was then used to calculate the
probability of the cell surviving any given passage. The product of all cell passages allow
the probability of single cell survival to be calculated and averaging over the population
allows population survival curves to be determined.
Calculations were carried out for both monolayers and suspensions over a range of doses
leading to markedly different survival curves. The results of the simulations can be seen in
figure 9.2, where the blue and dark red lines show survival data calculated from track
simulations, the black symbols show Birmingham mixed field experimental data (where
the majority of the dose is delivered by the boron reaction) and the lighter red line a best fit
to the experimental data.
For the same given macroscopic neutron fluence, monolayer cells see a reduction in boron
dose compared to the identical cell line grown in suspension. This is due to two main
factors, one being the inhomogeneity caused by growing the cells on the medium boundary
(the mylar base/wall) – which has no boron beyond it, the other being the observable
difference in cell morphology between suspended and monolayer cells and their nuclei.
This observed survival discrepancy being the primary reason for introducing the absorbed
fraction correction factor of previous chapters.
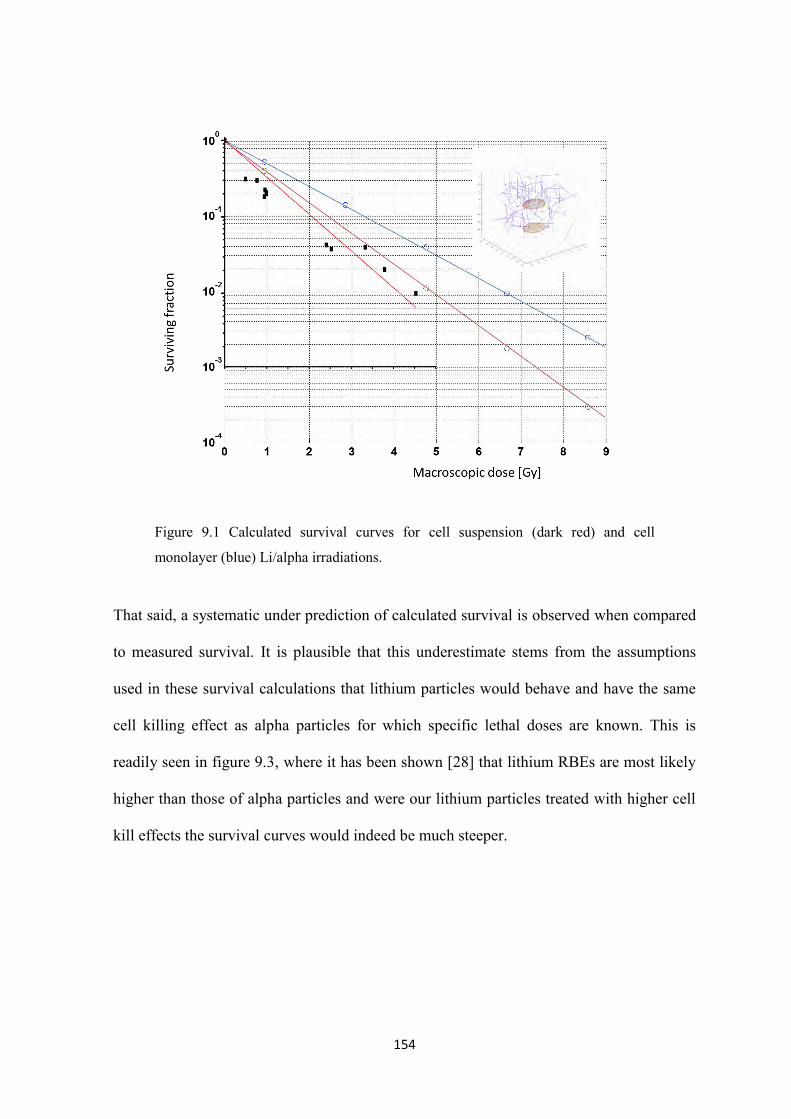
154
Figure 9.1 Calculated survival curves for cell suspension (dark red) and cell
monolayer (blue) Li/alpha irradiations.
That said, a systematic under prediction of calculated survival is observed when compared
to measured survival. It is plausible that this underestimate stems from the assumptions
used in these survival calculations that lithium particles would behave and have the same
cell killing effect as alpha particles for which specific lethal doses are known. This is
readily seen in figure 9.3, where it has been shown [28] that lithium RBEs are most likely
higher than those of alpha particles and were our lithium particles treated with higher cell
kill effects the survival curves would indeed be much steeper.
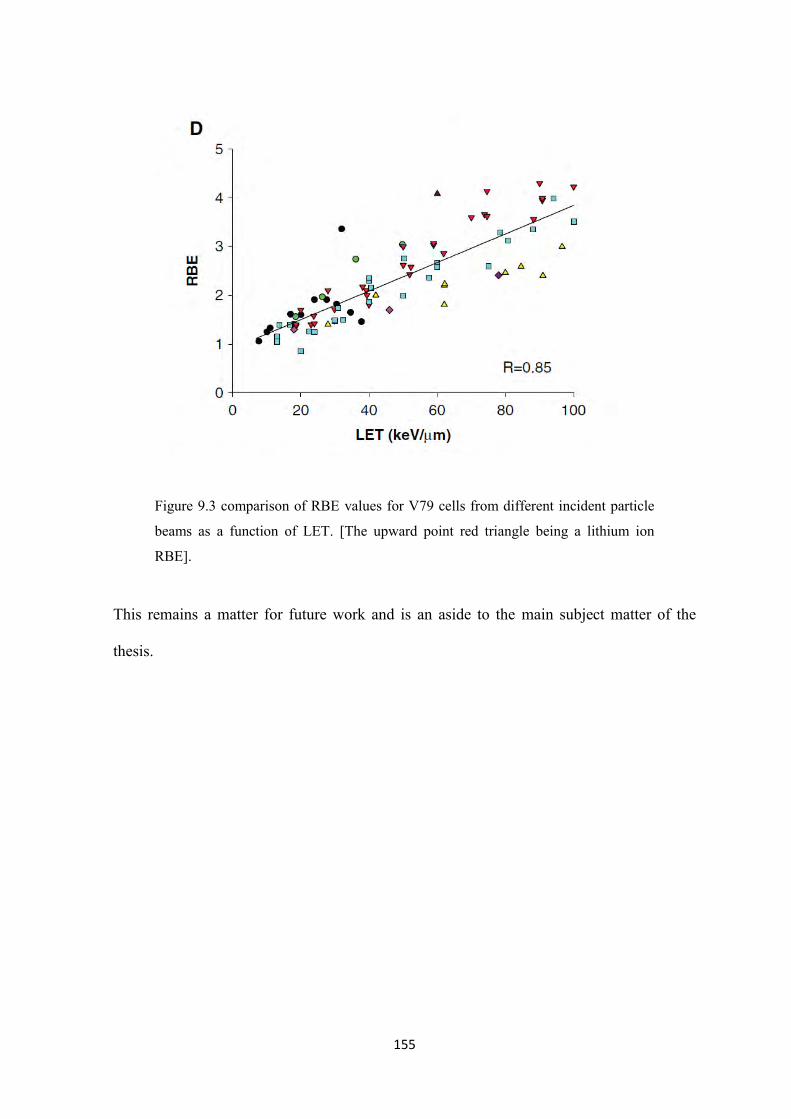
155
Figure 9.3 comparison of RBE values for V79 cells from different incident particle
beams as a function of LET. [The upward point red triangle being a lithium ion
RBE].
This remains a matter for future work and is an aside to the main subject matter of the
thesis.
156
Chapter 10
SUMMARY AND CONCLUSION
The aims of the current study were to carry out fundamental reference dosimetric
measurements and calculate macroscopic and microscopic correction factors for cell survival
experiments in order to aid the development of a cell-based radiobiology protocol to provide
essential data on the safety and efficacy of epithermal neutron beams for BNCT in advance of
clinical trials.
In order to achieve stable and reproduceable beam measurements and delivery, work was
carried out at the University of Birminghams BNCT facility to relocate two neutron monitor
chambers (235U fission chambers - Centronic Ltd.). The revised monitor positions were
chosen following detailed consideration of sensitivity to backscattered radiation and detector
count-rate. Detailed design calculations were reported utilising MCNPX and experimental
validation of final detector count rates and neutronic coupling presented.
The original monitor chamber position was separated from the patient/phantom by 20 mm of
Li-polyethylene, as chambers were located in the back of the 25 mm Li-polyethylene beam
delimiter, adjacent to the graphite neutron reflector. Experimental coupling with the
chambers in this position was measured to be 2.3 ± 0.2% with the LWT, and the
corresponding MCNPX simulated prediction being 2.6 ± 1%.
Changing the monitor position to be centered within the Li-polyethylene delimiter, separated
from the patient/phantom by 12 mm Li-polyethylene (instead of 20 mm) was predicted by
MCNPX to reduce the count-rate by a factor of 2.5 ± 0.1. This was verified experimentally to
157
be a factor of 2.4 ± 0.1, producing typical detector count-rates at 1 mA proton current of
approximately 4000 cps. This change of position was predicted to increase the phantom
coupling to 3.9%, which has been verified experimentally to be less than 4%.
With stabilished beam monitors, good historic data and a regular calibration procedure much
more confidence can be placed in the nominal intensity and spectra of the beam for both
experimental and clinical work conducted.
10.1 Foil self shielding correction factors
Self-shielding correction factors for metal foils used to determine boron and nitrogen kerma
by activation analysis have been evaluated by simulation in MCNPX. Correction factors were
calculated for two types of foil, one set being non-dilute (solid/metallic) foils of Au and
Mn/Ni, the other being dilute foils of 1% Mn or Au in Al. The non-dilute gold foils exhibit
the largest flux depression, perturbing the flux by as much as 80% at shallow depths and 30%
at depths approaching 10 cm. The non-dilute Mn/Ni foils cause a 5-10% perturbation at
various depths along the central axis of the phantom. Experimental data is presented to
validate these simulation results. Further simulations show that the dilute foils, both MnAl
and AuAl, perturb the field by less than 1%.
Previous work (Culbertson et al. [7]) had reported correction factors of 5.5% for non-dilute
Mn foils and 17.5% for non-dilute Au foils. This work also suggested that correction factors
do not change significantly with depth. These results are now superceded by the current
work, where for Mn the correction factor is approximately 6.5% near the beam entrance (up
to 4 cm deep) rising to 10% at the brain midline (7 cm). For Au the correction factors are up
to 80% at 2 cm deep falling to 30% at the brain midline. Experimentally determined
158
correction factors for non-dilute foils show extremely good agreement with those simulated.
When using such non-dilute paired foils for dosimetry these correction factors cause a small
but important correction to the derived nitrogen and boron dose components. Further
simulations show that the perturbation by the neutron flux for dilute foils is negligible and
hence these foils are water equivalent.
Dilute foils containing 1% by mass of gold and manganese in aluminium were used to derive
boron and nitrogen dose components on the central axis beam of a Large Water Tank (LWT).
following the spectral indices method [9].
A normalisation factor of 0.83 is used to scale calculations to measurements and is applied to
all calculated dose components. Paired magnesium and A150 tissue equivalent ionisation
chambers (Exradin M2 and T2) were used with argon and methane-based tissue equivalent
gas respectively to determine fast neutron and photon dose components.
BNCT beam dosimetry is complex and standard methods (foils and ionisation chambers) lead
to assessment of photon and fast neutron dose components with large uncertainties. In such
situations it is essential to use supplementary techniques to validate the standard methods.
The chosen supplementary method applied was the A150 tissue equivalent proportional
counter (TEPC), for the thermal and fast neutron components. The thermal neutron doses
derived from the Freudenreich spectral indices method were compared with those derived
from the TEPC from depths of approximately 3cm to 8cm. The maximum difference
measured was 15%, with an average difference of 7%.
159
10.2 Cell Dosimetry
Cell radiobiology experiments have been carried out to perform dose response studies over a
range of doses, 10B concentrations, dose rates and depths found in clinical practice in both
accelerator and reactor driven systems.
An extensive radiobiological programme has been conducted by the University of
Birmingham BNCT group and collaborating institutions. One of the prime objectives of this
collective work remains the production of a validated protocol for the pre-clinical biological
characterisation of BNCT facilities and for this to be established internationally and utilised
at all BNCT facilities.
The aim of this study was to quantify the doses, both macroscopic and microscopic, observed
during the irradiations of cell monolayers at the University of Birmingham’s 2.8MeV
Dynamitron particle accelerator and at the MIT research reactor.
Calculating the correct physical dose is absolutely essential in assessing damage to critical
biological structures and their survival probabilities during cell irradiations. It is the core of
the fundamental radiobiology work and underpins translational studies in differing beams.
Cells are typically grown as densely packed monolayers on the beam facing wall of a T-25
Falcon (polyethylene) flask, covering an area equal to 6cm by 5cm, perpendicular to the
beam direction and at depths of 2cm and 5cm. The flasks contain a cell growth medium in
addition to 50µg/g of 10B (in the form of boric acid).
There are numerous factors which complicate the calculation of dose in small, cell like,
volumes including, the thermalisation of the impinging epithermal beam and its subsequent
spectral and dose rate shift. This results in a non-uniform distribution of neutron fluence and
spectra across the cell monolayer.

160
Two sets of major corrections need to be applied to dose calculations based on beam specific,
on-axis depth dose curves (derived from fluence to dose kerma factors):
1. Macroscopic Corrections
The flasks in which the V79 cells are irradiated occupy a finite profile in the
phantom. This necessitates the correction for the drop off in the dose components
perpendicular to the beam central axis. These dose correction factors are loosely
termed off-axis correction factors.
Perturbation of neutron flux by the presence of the boronated medium.
2. Microscopic Corrections
Two large micro-dose corrections are needed in the mixed field of a BNCT beam
impinging on boron loaded cell monolayers. These are:
The boron dose
The thermal neutron dose – due to neutron capture in nitrogen.
The primary cause for these microscopic inhomogeneities and the resultant non-charged
particle equilibrium is the non-uniform distribution of these elements across the cell
monolayer and its neighbouring environment.
These correction factors have been calculated for the Birmingham beam and applied to the
Birmingham dose rate experiments carried out at MIT, which serve as a dosimetric
methodology for future radiobiology work in other beams.
Paired (dilute) gold and manganese foils along with Mg/Ar and TE ion chambers
measurements have been used to calculate boron, thermal neutron, fast neutron and photon
161
doses, at several depths in a standard large water tank (LWT). In the case of the Birmingham
facility the Monte Carlo code MCNPX was used to calculate off-axis correction factors to the
central depth dose curve for the Birmingham beam. Integrating the dose (normalised to
experimental measurements) over the flask area and dividing by the central axis depth dose
serves as an off-axis dose correction at the two depths. The maximum off-axis correction is
for the thermal and boron dose components at 2cm and is calculated to be 3.5%.
As well as off-axis dose corrections, the flasks also perturb the flux that passes through them
by virtue of the medium being loaded with 50µg/g of boron. Perturbation factors were
calculated for the Birmingham beam using MCNPX. The perturbation calculated for the flask
monolayer, 1mm deep under the front face of the flask (where the cells are fixed), at the two
depths at which irradiations were carried out. The second flask is evidently much more
perturbed than the first, with thermal neutron perturbations reaching up to 15% at the centre
of the front surface of the flask.
The location and micro-distribution of the boron atoms and their decay is of critical
importance in assessing local dose delivered to the cell nucleus. In the case of the present
study using boric acid mediated cell irradiations, the boron is believed to be uniformly
distributed throughout the cells and the medium in which they are grown i.e. within the
flasks. However, as the cells are grown on the flask wall the cells see a large local
inhomogeneity in source distribution at one face of the monolayer plane.
Cells grown in monolayers take on a very different morphology to cells grown in suspension
and take the form of closely packed oblate spheroids. In order to factor in this known cell
morphology coupled with an inhomogeneous boron source distribution Monte Carlo methods
were employed to simulate particle tracks in semi-stochastic cell geometries – sampled from
distributions generated from confocal microscopy images. The Monte Carlo transport code
162
SRIM was used to calculate the range and LET of these light ions in biologically equivalent
tissue/medium. These simulated back to back tracks can, for the purpose of simplicity, be
considered a single track with a varying LET along its length, which is identical to the two
individual tracks placed back to back.
Mathematically these ellipsoidal ‘nuclei’ were described in vector notation and solved for
line intersection using Matlab™ - in a vectorised matrix algebra environment.
Results of simulations show boron doses calculated in inhomogeneously boron loaded cell
irradiations, carried out at MIT and Birmingham BNCT facilities, require corrections for dose
absorbed fraction, a microdosimetric quantity related to the local boron distribution in and
around the cells. Detailed calculations show an absorbed fraction of 0.77±0.05.
Work was carried out at the Birmingham BNCT facility to validate the absorbed dose
fractions to cells irradiated in monolayers and exposed to a non-uniform distribution of boron
in the surrounding medium. Glass dishes, commonly known as ‘jelly fish’ dishes, were paired
back to back with cells grown on a layer of mylar sandwiched between the two dishes and the
sides sealed. Experiments show absorbed fractions of 0.73 – 0.74. Cell experiments have in
themselves large systematic uncertainties – and in this case no repeat measurements were
carried out.
The capture of thermal neutrons in nitrogen, 14N(n,p)14C, results in a recoil proton carrying
580keV of the energy and a carbon ion carrying 42keV. The recoil proton and carbon ion
have ranges in water of ~10µm and 0.23µm respectively, the proton range being comparable
to the lithium/alpha range but with wider lateral straggling.
In the case of the present study, boric acid contains no nitrogen, neither the polyethylene T25
flasks, on which the cells are plated and irradiated contain any nitrogen. The medium in
163
which the cells are irradiated, in the presence of 50ppm boric acid, contains 0.012% by
weight nitrogen, the added 10% by weight bovine foetal calf serum – contains approximately
1% by weight nitrogen. Thus the only major nitrogen component of the nitrogen-thermal
neutron dose is the cells themselves (1.7% by weight nitrogen) and the aggregate medium,
~0.11% by weight nitrogen.
A 3 x 3 cell monolayer array was used to simulate observed nitrogen distributions in the V79
cells and extracellular space. Cells sizes are sampled as in the boron case, but have additional
degrees of freedom factoring in the packing density between cells and lateral freedom taking
into account the variable location of the nucleus within the cell.
The results of stochastic cell simulations show that for an inhomogeneous nitrogen dose
distribution the population absorbed fraction to the nucleus is 0.48±0.02.
As a final point, a dosimetric procedure is described in order to aid the development of a cell-
based radiobiology protocol to provide essential data on the safety and efficacy of epithermal
neutron beams for BNCT in advance of clinical trials.
For the same given macroscopic fluence, monolayer cells see a reduction by a factor of
0.77±0.05 in boron dose compared to the identical cell line grown in suspension. The thermal
neutron nitrogen dose is reduced by a factor of 0.48± 0.02 compared to a uniform nitrogen
distribution.
Survival curves plotted with all the dose correction factors applied show excellent agreement
with the biological effect models reported in the literature.
164
References
[1] Durisi, E., Zanini, A., Manfredotti, C., et al. (2007) Design of an epithermal column for
BNCT based on D-D fusion neutron facility. Nuclear Instruments and Methods in Physics
Research Section A: Accelerators, Spectrometers, Detectors and Associated Equipment, 574:
(2): 363-369.
[2] Allen, D.A. and Beynon, T.D. (1995) A design study for an accelerator-based epithermal
neutron beam for BNCT. Physics in Medicine and Biology, 40: (5): 807.
[3] D. A. Allen and T. D. Beynon, „What is the best proton energy for accelerator-based BNCT using
the 7Li(p,n)7Be reaction?‟, Medical Physics, 2000, Vol. 27, No. 5.
[ 4 ] C. L. Lee and X.-L. Zhou, „A Monte Carlo dosimetry-based evaluation of the 7Li.p,n.7Be
reaction near threshold for accelerator boron neutron capture therapy‟, Med. Phys., January 2000, vol.
27, Issue 1.
[5] J. F. Ziegler. SRIM-2003. Nuclear Instruments and Methods in Physics Research Section
B: Beam Interactions with Materials and Atoms, 219-220:1027-1036, 2004. doi: DOI:
10.1016/j.nimb.2004.01.208.
[6] M. V. Bokhovko, W. T. Chu, I. A. Gulidov, O. E. Kononov, V. N. Kononov, V. V. Korobeynikov,
D. W. Nigg, A. N. Soloviev and A. S. Sysoev, „Optimization of an accelerator-based epithermal
neutron source for neutron capture therapy‟, Applied radiation and isotopes, 2004, 61, p.1009-1013.
[7] Culbertson, C. N., Green, S., Mason, A. J., Picton, D., Baugh, G., Hugtenburg, R. P., Yin,
Z., Scott, M. C., and Nelson, J. M., In-phantom characterisation studies at the Birmingham
Accelerator-Generated epithermal Neutron Source (BAGINS) BNCT facility, Applied
radiation and isotopes, 2004, 61, p.733-738.
[8] Campbell J and Scott M. C., Scientific and Industrial Applications of Small Accelerators,
4th Conf., Denton,TX, 1976
[9] Freudenreich, W.E., Empirical relations between reaction rates of monitors activated in
BNCT beams, NRG report 21425/03.55288, Petten, 2003.
165
[11] Negoita, CC, 2004, “Measurement of Neutron Flux Spectra in a Tungsten Benchmark
by Neutron Foil Activation Method”, PhD thesis, Universität Dresden.
[12] Rogus, R. D., O. K. Harling, et al. (1994). "Mixed field dosimetry of epithermal neutron
beams for boron neutron capture therapy at the MITR-II research reactor." Medical Physics,
21(10): 1611-25.
[13] Shcherbakov, O. and Harada, H. (2002) Resonance Self-Shielding Corrections for
Activation Cross Section Measurements. Journal of Nuclear Science and Technology, 39:
(5): 548-553.
[14] Goorley, J.T., Kiger Iii, W.S. and Zamenhof, R.G. (2002) Reference dosimetry
calculations for neutron capture therapy with comparison of analytical and voxel models.
Medical Physics, 29: (2): 145-156.
[15] Turki Ibrahimi, MSc University of Birmingham, Microdosimetry in a BNCT Beam,
2012.
[16] Taylor, GC, 1990, “The Prediction and Measurements of Microdosimetric Spectra
relating to Neutron Cancer Therapy”, PhD thesis, University of Birmingham.
[17] Helen Howard, MSc University of Birmingham, Microdosimetry in BNCT, 2003.
[18] K.J. Riley, P.J. Binns and O.K. Harling, “Performance characteristics of the MIT fission
converter based epithermal neutron beam,” Phys. Med. Biol. 48 pp. 943-958, 2003.
[19] Ben Phoenix, 2012, 'Dose Effects in Boron Neutron Capture Therapy', PhD thesis,
University of Birmingham.
[20] ] K.J. Riley and P.J. Binns, „Dosimetry Measurements in the FCB for Treatment
Planning Validation,‟ MIT Nuclear Reactor Laboratory Technical Report, 2002.
[21] Glenn F. Knoll, Radiation Detection and Measurement, Third Edition, J. Wiley (January
5, 2000).
[22] EU Dosimetry protocol. Petten, 2003. Recommendations for the Dosimetry of Boron
Neutron Capture Therapy (BNCT), 21425/03.55339/C.
166
[23] Charlton, D. E., A. I. Kassis, et al. (1994). "A Comparison of Experimental and
Calculated Survival Curves for V79 Cells Grown as Monolayers or in Suspension Exposed to
Alpha Irradiation from 212Bi Distributed in the Growth Medium." Radiation Protection
Dosimetry 52(1-4): 311-315.
[24] Hill, M. A., M. D. Vecchia, et al. (1998). "Production and dosimetry of copper L
ultrasoft x-rays for biological and biochemical investigations." Physics in Medicine and
Biology, 43(2): 351.
[25] Neti, P. V. S. V. and R. W. Howell (2006). "Log Normal Distribution of Cellular
Uptake of Radioactivity: Implications for Biologic Responses to Radiopharmaceuticals."
Journal of Nuclear Medicine, 47(6): 1049-1058.
[26] Chung, Y 2008, “Radiobiological Evaluation of New Boron Delivery Agents for Boron
Neutron Capture Therapy”, PhD thesis, Massachusetts Institute of Technology.
[27] Detlef Gabel, Ralph G. Fairchild, Börje Larsson and Hans G. Börner. “The Relative
Biological Effectiveness in V79 Chinese Hamster Cells of the Neutron Capture Reactions in
Boron and Nitrogen.” Radiation Research, Vol. 98, No. 2 (May, 1984), pp. 307-316
[28] Sorensen, B. S., J. Overgaard, et al. (2011), "In vitro RBE-LET dependence for multiple
particle types." Acta Oncologica, 50(6): 757-762.
[29] ICRU report #36,. Microdosimetry (International Commission on Radiation Units and
Measurments, Bethesda, MD, 1983).
[30] Eckerman KF, Ryman JC, Taner AC, Kerr GD. Traversal of cells by radiation and
absorbed fraction estimates for electrons and alpha particles. In: Schlafke-Stelson AT,
Watson EE, eds. Proceedings of the Fourth International Radiopharmaceutical Dosimetry
Symposium. Oak Ridge, Tennessee; Oak Ridge Associated Universities; 1985:67–81.
[31] M. Kellerer, "Chord length distributions and related quantities for spheroids," Radiat.
Res.,vol. 98, pp. 425-437, 1984.
[32] White, SM 2001, “Biological Dosimetry of Neutron Beams for Neutron Capture
Therapies”, PhD thesis, Massachusetts Institute of Technology.
167
[33] Mason, A. J., V. Giusti, et al. (2011) "Interaction between the biological effects of high-
and low-LET radiation dose components in a mixed field exposure." International Journal of
Radiation Biology, 87(12): 1162-1172.
[34] Yam, C. S. and R. G. Zamenhof (2000). "Computational validation of the stereology
principle applied to the microdosimetry of boron neutron capture therapy." Medical Physics,
27(3): 549-557.
[35] MATLAB version 6.5.1. Natick, Massachusetts: The MathWorks Inc., 2003.
[36] Rogus, RD. 1994, “Design and Dosimetry of Epithermal Neutron Beams for Clinical
Trials of Boron Neuton Capture Therapy at The MITR-II Reactor”, PhD thesis,
Massachusetts Institute of Technology.
[37] arXiv:nucl-ex/0202004v1
[38] Deconninck, G. and Demortier, G. (1972). “Quantitative analysis of aluminium by
prompt nuclear reactions,” Journal of Radioanalytical and Nuclear Chemistry, 12(2): 189-
208.
[39] “Surface Characterization and Corrosion Behaviour of Ti Based Alloys in Fetal Bovine
Serum,” U.P.B. Sci. Bull., Series B, Vol. 71, Iss. 4, (2009) ISSN 1454-2331.
[40] Schettino, G., M. Folkard, et al. (2003). "Low-Dose Studies of Bystander Cell Killing
with Targeted Soft X Rays." Radiation Research 160(5): 505-511.
[41] Culbertson et al. (2003) “Energy Calibration of the 3 MV Dynamitron Accelerator at
Birmingham.” Proceedings of international workshop on Neutron capture therapy : state of
the art, and 3rd Young members neutron capture therapy meeting : Pisa (Italy).
[42] Burmeister, J., Riley, K., Coderre, J.A., et al. (2003) “Microdosimetric intercomparison
of BNCT beams at BNL and MIT.” Medical Physics, 30: (8): 2131-2139.
[43] Michael A. Davis, John B. Little, K. M. M. S. Ayyangar and A. R. Reddy. “Relative
Biological Effectiveness of the 10B(n,alpha)7Li Reaction in HeLa Cells.” Radiation
Research, Vol. 43, No. 3 (Sep., 1970), pp. 534-553.
Appendix A: Conference Proceedings and Publications
1. Neutron self-shielding effects and correction factors for foil activation measurements used in
BNCT dosimetry
Z. Ghania, S. Greena,b, C. Wojneckia,b
a School of Physics and Astronomy, University of Birmingham, United Kingdom
b Department of Medical Physics, University Hospital Birmingham, United Kingdom
Abstract
Self-shielding correction factors for metal foils used to determine B and N kerma by activation
analysis have been evaluated by simulation in MCNPX. Correction factors were calculated for two
types of foil, one set being non-dilute (solid/metallic) foils of Au and Mn/Ni, the other being dilute
foils of 1 % Mn or Au in Al. The non-dilute gold foils exhibit the largest flux depression, perturbing
the flux by as much as 80 % at shallow depths and 30 % at depths approaching 10 cm. The non-dilute
Mn/Ni foils cause a 5-10 % perturbation at various depths along the central axis of the phantom.
Experimental data is presented to validate these simulation results. Further simulations show that
the dilute foils, both MnAl and AuAl, perturb the field by less than 1 %.
2. BNCT beam monitoring, characterisation and dosimetry
Z. Ghania, S. Greena,b, C. Wojneckia,b, R. P. Hugtenburgc
a School of Physics and Astronomy, University of Birmingham, United Kingdom
b Department of Medical Physics, University Hospital Birmingham, United Kingdom
c School of Medicine, University of Swansea, United Kingdom
Abstract
Work has been recently carried out at the University of Birmingham Neutron Capture Therapy
facility to relocate two neutron monitor chambers (235U fission chambers - Centronic Ltd.). IEC
requirements for monitoring radiotherapy beams require the chamber to be in the ‘treatment’
beam. The problem then arises of neutrons backscattering from patient or phantom affecting the
counts at these detectors which are to be located within a 25 mm layer of Lithium polyethylene
shielding surrounding the exit port of the treatment facility. The revised monitor position was
chosen after detailed consideration of sensitivity to backscattered radiation and detector count-rate.
Detailed design calculations with MCNPX are reported and experimental validation of final detector
count rates and neutronic coupling presented.
3. Design study to further optimise the Birmingham orthogonal accelerator epithermal neutron
beam
Z. Ghani1, S. Green2, C. Wojnecki2
1 School of Physics and Astronomy, University of Birmingham, United Kingdom
2 Department of Medical Physics, University Hospital Birmingham, United Kingdom
Abstract
A detailed study has been carried out on comparing various moderator and reflector materials in
order to quantify any improvements that can be made to the current Birmingham facility.
The motivation for optimising and re-modelling the treatment facility was to maximize the dose to
tumour tissue while keeping the weighted dose to healthy brain tissues below 12.5 Gy. Five key
indices were calculated for three moderator materials (Fluental, MgF2 and Teflon) and two reflector
materials (Graphite and Lead):
1. Treatment Time 2. Therapeutic Ratio (TR) at 6.5cm into the brain 3. Max TR is the ratio of Maximum Tumour Dose to Maximum Tissue Dose 4. Advantage Depth (AD) and 5. Skin dose
Changing the graphite reflector to one made of lead (for 25 cm Fluental moderator) delivered a
substantial improvement. It resulted in an increase in beam quality in terms of Therapeutic Ratio and
AD. The AD increased from 9.1 to 9.8 ±0.1cm, the TR at 6.5 cm deep from 2.23 to 2.75 and the max
TR from 5.34±0.05 to 5.40±0.05, with a 10 % reduction in treatment time from 198 minutes to 176
minutes.
In order to increase the dose rates obtained with the MgF2 moderator / lead reflector, and thus
reduce the treatment time, it becomes necessary to compromise beam quality. By moving to a
shorter moderator depth of 18.1 cm treatment time was brought down from 258 minutes to 146
minutes. The change in other key indices being AD from 9.1±0.1 to >10cm, the TR from 2.23 to 2.76
and the max TR from 5.34 ±0.05 to 5.26 ±0.03 when compared to the current facility.
Further calculations will be presented to show that the addition of a Li-Si filter does not affect our
choice of the optimum length of moderator and reflector, and to quantify the effect of an additional
patient collimator on beam performance indices.
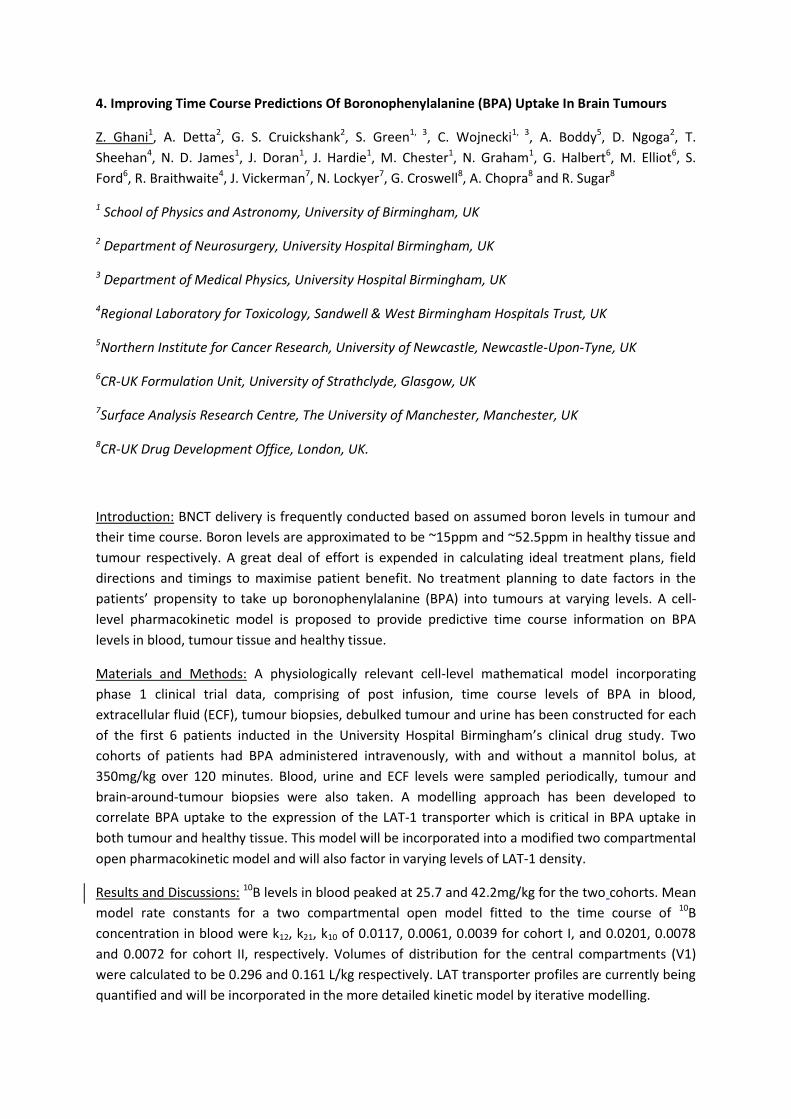
4. Improving Time Course Predictions Of Boronophenylalanine (BPA) Uptake In Brain Tumours
Z. Ghani1, A. Detta2, G. S. Cruickshank2, S. Green1, 3, C. Wojnecki1, 3, A. Boddy5, D. Ngoga2, T.
Sheehan4, N. D. James1, J. Doran1, J. Hardie1, M. Chester1, N. Graham1, G. Halbert6, M. Elliot6, S.
Ford6, R. Braithwaite4, J. Vickerman7, N. Lockyer7, G. Croswell8, A. Chopra8 and R. Sugar8
1 School of Physics and Astronomy, University of Birmingham, UK
2 Department of Neurosurgery, University Hospital Birmingham, UK
3 Department of Medical Physics, University Hospital Birmingham, UK
4Regional Laboratory for Toxicology, Sandwell & West Birmingham Hospitals Trust, UK
5Northern Institute for Cancer Research, University of Newcastle, Newcastle-Upon-Tyne, UK
6CR-UK Formulation Unit, University of Strathclyde, Glasgow, UK
7Surface Analysis Research Centre, The University of Manchester, Manchester, UK
8CR-UK Drug Development Office, London, UK.
Introduction: BNCT delivery is frequently conducted based on assumed boron levels in tumour and
their time course. Boron levels are approximated to be ~15ppm and ~52.5ppm in healthy tissue and
tumour respectively. A great deal of effort is expended in calculating ideal treatment plans, field
directions and timings to maximise patient benefit. No treatment planning to date factors in the
patients’ propensity to take up boronophenylalanine (BPA) into tumours at varying levels. A cell-
level pharmacokinetic model is proposed to provide predictive time course information on BPA
levels in blood, tumour tissue and healthy tissue.
Materials and Methods: A physiologically relevant cell-level mathematical model incorporating
phase 1 clinical trial data, comprising of post infusion, time course levels of BPA in blood,
extracellular fluid (ECF), tumour biopsies, debulked tumour and urine has been constructed for each
of the first 6 patients inducted in the University Hospital Birmingham’s clinical drug study. Two
cohorts of patients had BPA administered intravenously, with and without a mannitol bolus, at
350mg/kg over 120 minutes. Blood, urine and ECF levels were sampled periodically, tumour and
brain-around-tumour biopsies were also taken. A modelling approach has been developed to
correlate BPA uptake to the expression of the LAT-1 transporter which is critical in BPA uptake in
both tumour and healthy tissue. This model will be incorporated into a modified two compartmental
open pharmacokinetic model and will also factor in varying levels of LAT-1 density.
Results and Discussions: 10B levels in blood peaked at 25.7 and 42.2mg/kg for the two cohorts. Mean
model rate constants for a two compartmental open model fitted to the time course of 10B
concentration in blood were k12, k21, k10 of 0.0117, 0.0061, 0.0039 for cohort I, and 0.0201, 0.0078
and 0.0072 for cohort II, respectively. Volumes of distribution for the central compartments (V1)
were calculated to be 0.296 and 0.161 L/kg respectively. LAT transporter profiles are currently being
quantified and will be incorporated in the more detailed kinetic model by iterative modelling.
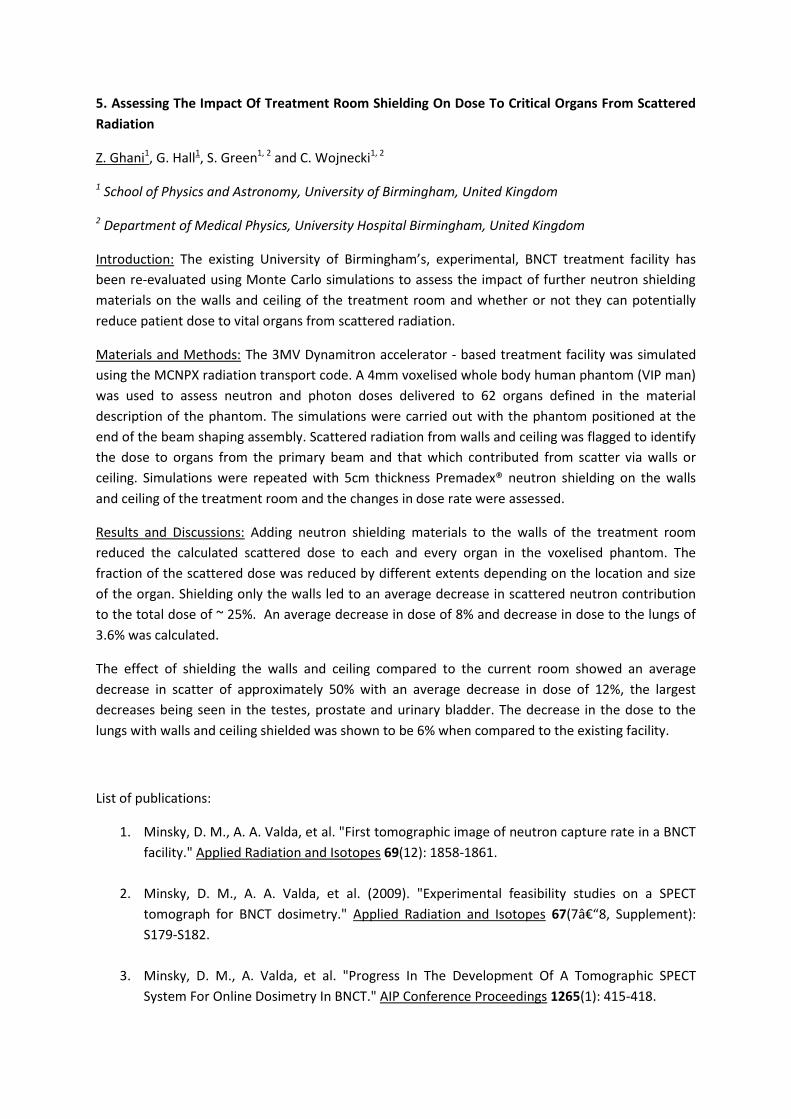
5. Assessing The Impact Of Treatment Room Shielding On Dose To Critical Organs From Scattered
Radiation
Z. Ghani1, G. Hall1, S. Green1, 2 and C. Wojnecki1, 2
1 School of Physics and Astronomy, University of Birmingham, United Kingdom
2 Department of Medical Physics, University Hospital Birmingham, United Kingdom
Introduction: The existing University of Birmingham’s, experimental, BNCT treatment facility has
been re-evaluated using Monte Carlo simulations to assess the impact of further neutron shielding
materials on the walls and ceiling of the treatment room and whether or not they can potentially
reduce patient dose to vital organs from scattered radiation.
Materials and Methods: The 3MV Dynamitron accelerator - based treatment facility was simulated
using the MCNPX radiation transport code. A 4mm voxelised whole body human phantom (VIP man)
was used to assess neutron and photon doses delivered to 62 organs defined in the material
description of the phantom. The simulations were carried out with the phantom positioned at the
end of the beam shaping assembly. Scattered radiation from walls and ceiling was flagged to identify
the dose to organs from the primary beam and that which contributed from scatter via walls or
ceiling. Simulations were repeated with 5cm thickness Premadex® neutron shielding on the walls
and ceiling of the treatment room and the changes in dose rate were assessed.
Results and Discussions: Adding neutron shielding materials to the walls of the treatment room
reduced the calculated scattered dose to each and every organ in the voxelised phantom. The
fraction of the scattered dose was reduced by different extents depending on the location and size
of the organ. Shielding only the walls led to an average decrease in scattered neutron contribution
to the total dose of ~ 25%. An average decrease in dose of 8% and decrease in dose to the lungs of
3.6% was calculated.
The effect of shielding the walls and ceiling compared to the current room showed an average
decrease in scatter of approximately 50% with an average decrease in dose of 12%, the largest
decreases being seen in the testes, prostate and urinary bladder. The decrease in the dose to the
lungs with walls and ceiling shielded was shown to be 6% when compared to the existing facility.
List of publications:
1. Minsky, D. M., A. A. Valda, et al. "First tomographic image of neutron capture rate in a BNCT
facility." Applied Radiation and Isotopes 69(12): 1858-1861.
2. Minsky, D. M., A. A. Valda, et al. (2009). "Experimental feasibility studies on a SPECT
tomograph for BNCT dosimetry." Applied Radiation and Isotopes 67(7–8, Supplement):
S179-S182.
3. Minsky, D. M., A. Valda, et al. "Progress In The Development Of A Tomographic SPECT
System For Online Dosimetry In BNCT." AIP Conference Proceedings 1265(1): 415-418.
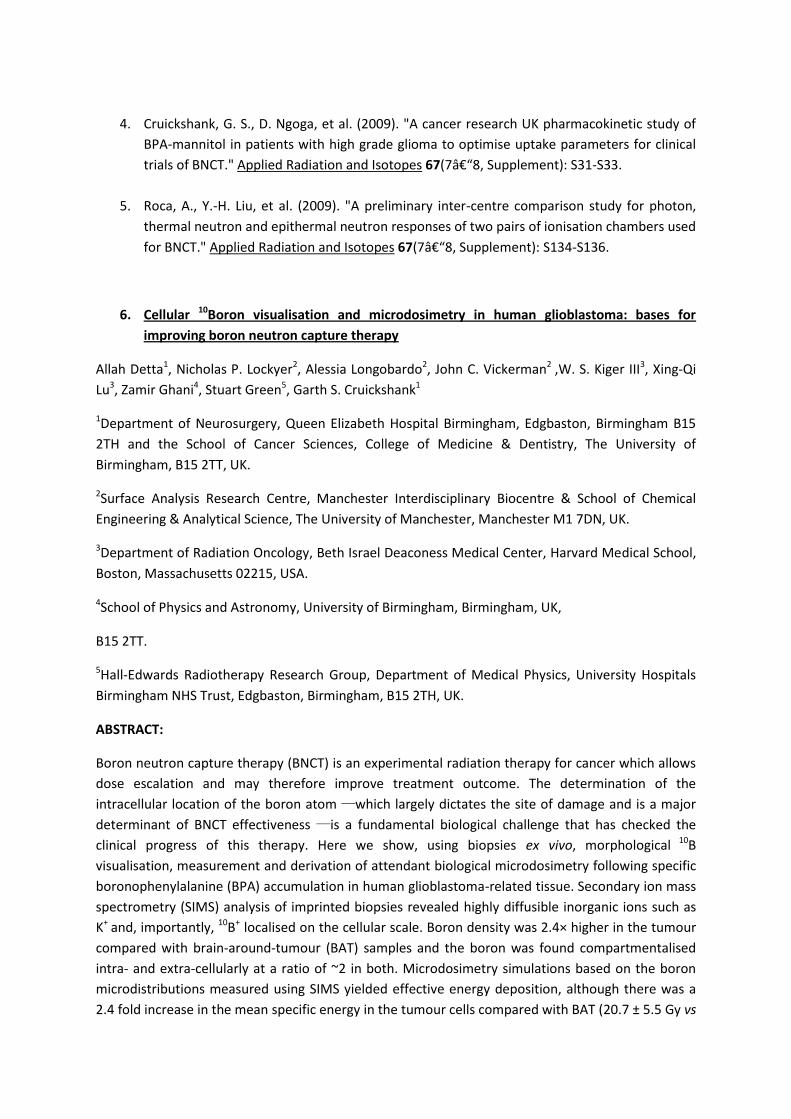
4. Cruickshank, G. S., D. Ngoga, et al. (2009). "A cancer research UK pharmacokinetic study of
BPA-mannitol in patients with high grade glioma to optimise uptake parameters for clinical
trials of BNCT." Applied Radiation and Isotopes 67(7–8, Supplement): S31-S33.
5. Roca, A., Y.-H. Liu, et al. (2009). "A preliminary inter-centre comparison study for photon,
thermal neutron and epithermal neutron responses of two pairs of ionisation chambers used
for BNCT." Applied Radiation and Isotopes 67(7–8, Supplement): S134-S136.
6. Cellular 10Boron visualisation and microdosimetry in human glioblastoma: bases for
improving boron neutron capture therapy
Allah Detta1, Nicholas P. Lockyer2, Alessia Longobardo2, John C. Vickerman2 ,W. S. Kiger III3, Xing-Qi
Lu3, Zamir Ghani4, Stuart Green5, Garth S. Cruickshank1
1Department of Neurosurgery, Queen Elizabeth Hospital Birmingham, Edgbaston, Birmingham B15
2TH and the School of Cancer Sciences, College of Medicine & Dentistry, The University of
Birmingham, B15 2TT, UK.
2Surface Analysis Research Centre, Manchester Interdisciplinary Biocentre & School of Chemical
Engineering & Analytical Science, The University of Manchester, Manchester M1 7DN, UK.
3Department of Radiation Oncology, Beth Israel Deaconess Medical Center, Harvard Medical School,
Boston, Massachusetts 02215, USA.
4School of Physics and Astronomy, University of Birmingham, Birmingham, UK,
B15 2TT.
5Hall-Edwards Radiotherapy Research Group, Department of Medical Physics, University Hospitals
Birmingham NHS Trust, Edgbaston, Birmingham, B15 2TH, UK.
ABSTRACT:
Boron neutron capture therapy (BNCT) is an experimental radiation therapy for cancer which allows
dose escalation and may therefore improve treatment outcome. The determination of the
intracellular location of the boron atom ___which largely dictates the site of damage and is a major
determinant of BNCT effectiveness ___is a fundamental biological challenge that has checked the
clinical progress of this therapy. Here we show, using biopsies ex vivo, morphological 10B
visualisation, measurement and derivation of attendant biological microdosimetry following specific
boronophenylalanine (BPA) accumulation in human glioblastoma-related tissue. Secondary ion mass
spectrometry (SIMS) analysis of imprinted biopsies revealed highly diffusible inorganic ions such as
K+ and, importantly, 10B+ localised on the cellular scale. Boron density was 2.4× higher in the tumour
compared with brain-around-tumour (BAT) samples and the boron was found compartmentalised
intra- and extra-cellularly at a ratio of ~2 in both. Microdosimetry simulations based on the boron
microdistributions measured using SIMS yielded effective energy deposition, although there was a
2.4 fold increase in the mean specific energy in the tumour cells compared with BAT (20.7 ± 5.5 Gy vs
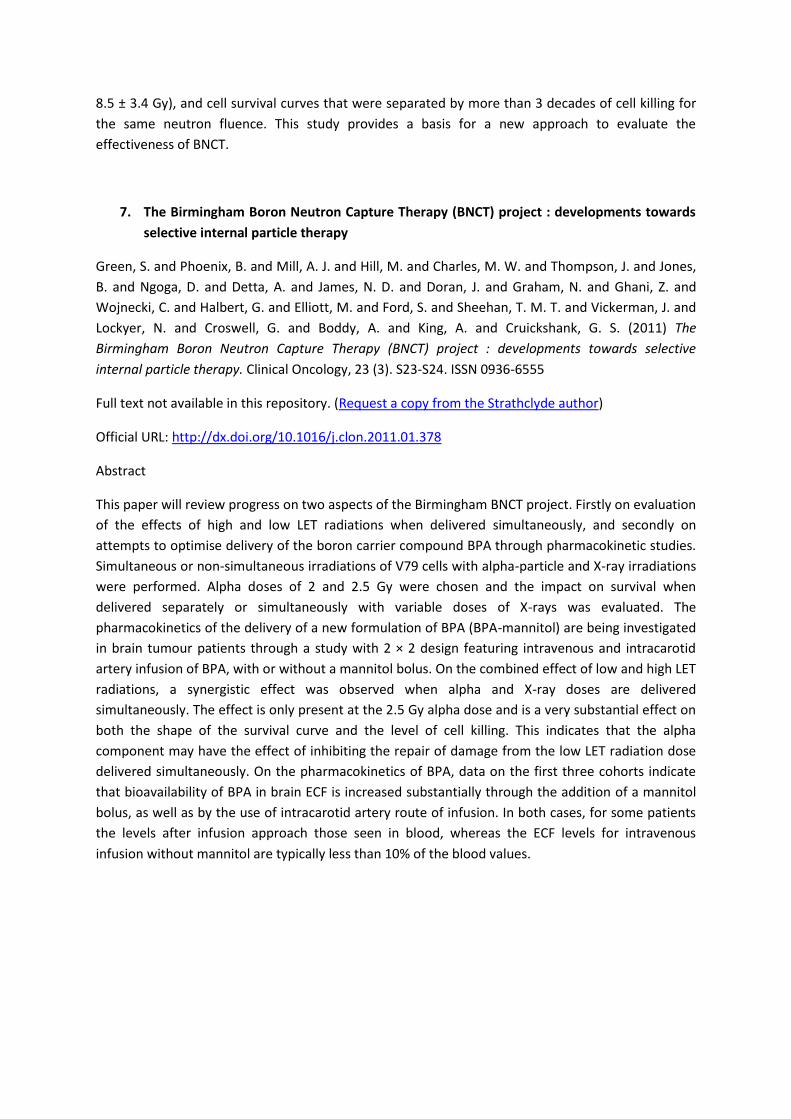
8.5 ± 3.4 Gy), and cell survival curves that were separated by more than 3 decades of cell killing for
the same neutron fluence. This study provides a basis for a new approach to evaluate the
effectiveness of BNCT.
7. The Birmingham Boron Neutron Capture Therapy (BNCT) project : developments towards
selective internal particle therapy
Green, S. and Phoenix, B. and Mill, A. J. and Hill, M. and Charles, M. W. and Thompson, J. and Jones,
B. and Ngoga, D. and Detta, A. and James, N. D. and Doran, J. and Graham, N. and Ghani, Z. and
Wojnecki, C. and Halbert, G. and Elliott, M. and Ford, S. and Sheehan, T. M. T. and Vickerman, J. and
Lockyer, N. and Croswell, G. and Boddy, A. and King, A. and Cruickshank, G. S. (2011) The
Birmingham Boron Neutron Capture Therapy (BNCT) project : developments towards selective
internal particle therapy. Clinical Oncology, 23 (3). S23-S24. ISSN 0936-6555
Full text not available in this repository. (Request a copy from the Strathclyde author)
Official URL: http://dx.doi.org/10.1016/j.clon.2011.01.378
Abstract
This paper will review progress on two aspects of the Birmingham BNCT project. Firstly on evaluation
of the effects of high and low LET radiations when delivered simultaneously, and secondly on
attempts to optimise delivery of the boron carrier compound BPA through pharmacokinetic studies.
Simultaneous or non-simultaneous irradiations of V79 cells with alpha-particle and X-ray irradiations
were performed. Alpha doses of 2 and 2.5 Gy were chosen and the impact on survival when
delivered separately or simultaneously with variable doses of X-rays was evaluated. The
pharmacokinetics of the delivery of a new formulation of BPA (BPA-mannitol) are being investigated
in brain tumour patients through a study with 2 × 2 design featuring intravenous and intracarotid
artery infusion of BPA, with or without a mannitol bolus. On the combined effect of low and high LET
radiations, a synergistic effect was observed when alpha and X-ray doses are delivered
simultaneously. The effect is only present at the 2.5 Gy alpha dose and is a very substantial effect on
both the shape of the survival curve and the level of cell killing. This indicates that the alpha
component may have the effect of inhibiting the repair of damage from the low LET radiation dose
delivered simultaneously. On the pharmacokinetics of BPA, data on the first three cohorts indicate
that bioavailability of BPA in brain ECF is increased substantially through the addition of a mannitol
bolus, as well as by the use of intracarotid artery route of infusion. In both cases, for some patients
the levels after infusion approach those seen in blood, whereas the ECF levels for intravenous
infusion without mannitol are typically less than 10% of the blood values.

Appendix B:
Design study to further optimise the Birmingham orthogonal accelerator
epithermal neutron beam
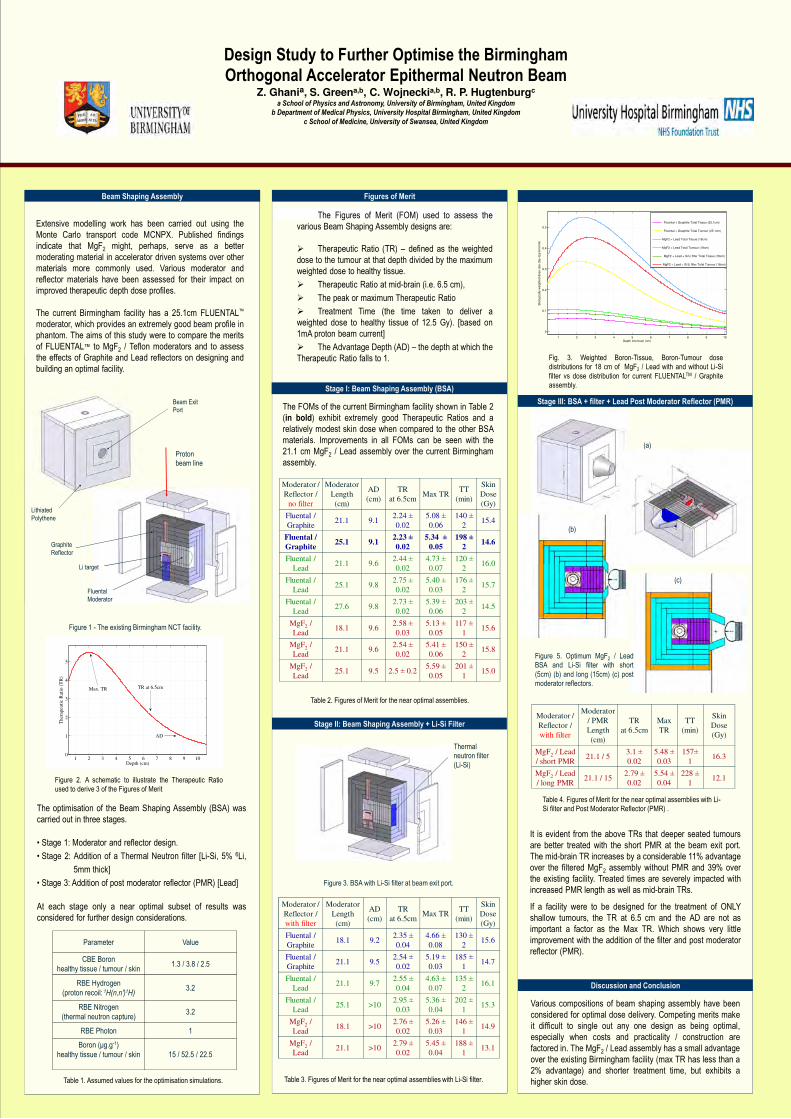
Design Study to Further Optimise the Birmingham
Orthogonal Accelerator Epithermal Neutron BeamZ. Ghania, S. Greena,b, C. Wojneckia,b, R. P. Hugtenburgc
a School of Physics and Astronomy, University of Birmingham, United Kingdom
b Department of Medical Physics, University Hospital Birmingham, United Kingdom
c School of Medicine, University of Swansea, United Kingdom
Beam Exit
Port
Lithiated
Polythene
Graphite
Reflector
Li target
Figures of MeritBeam Shaping Assembly
Discussion and Conclusion
Figure 1 - The existing Birmingham NCT facility.
Fluental
Moderator
1 2 3 4 5 6 7 8 9 10
0
0.1
0.2
0.3
0.4
0.5
Depth into brain (cm)
Bio
log
ica
lly w
eig
hte
d d
ose
ra
te (
Gy−
Eq
/min
/mA
)
data 1
Fluental + Graphite Total Tissue (25.1cm)
data3
Fluental + Graphite Total Tumour (25.1cm)
data5
MgF2 + Lead Total Tissue (18cm)
data7
MgF2 + Lead Total Tumour (18cm)
data9
MgF2 + Lead + Si/Li filter Total Tissue (18cm)
data11
MgF2 + Lead + Si/Li filter Total Tumour (18cm)
Parameter Value
CBE Boron
healthy tissue / tumour / skin 1.3 / 3.8 / 2.5
RBE Hydrogen
(proton recoil: 1H(n,n')1H)3.2
RBE Nitrogen
(thermal neutron capture)3.2
RBE Photon 1
Boron (µg.g-1)
healthy tissue / tumour / skin 15 / 52.5 / 22.5
The Figures of Merit (FOM) used to assess the
various Beam Shaping Assembly designs are:
� Therapeutic Ratio (TR) – defined as the weighted
dose to the tumour at that depth divided by the maximum
weighted dose to healthy tissue.
� Therapeutic Ratio at mid-brain (i.e. 6.5 cm),
� The peak or maximum Therapeutic Ratio
� Treatment Time (the time taken to deliver a
weighted dose to healthy tissue of 12.5 Gy). [based on
1mA proton beam current]
� The Advantage Depth (AD) – the depth at which the
Therapeutic Ratio falls to 1.
Various compositions of beam shaping assembly have been
considered for optimal dose delivery. Competing merits make
it difficult to single out any one design as being optimal,
especially when costs and practicality / construction are
factored in. The MgF2 / Lead assembly has a small advantage
over the existing Birmingham facility (max TR has less than a
2% advantage) and shorter treatment time, but exhibits a
higher skin dose.
Fig. 3. Weighted Boron-Tissue, Boron-Tumour dose
distributions for 18 cm of MgF2 / Lead with and without Li-Si
filter vs dose distribution for current FLUENTALTM / Graphite
assembly.
Extensive modelling work has been carried out using the
Monte Carlo transport code MCNPX. Published findings
indicate that MgF2 might, perhaps, serve as a better
moderating material in accelerator driven systems over other
materials more commonly used. Various moderator and
reflector materials have been assessed for their impact on
improved therapeutic depth dose profiles.
The current Birmingham facility has a 25.1cm FLUENTAL™
moderator, which provides an extremely good beam profile in
phantom. The aims of this study were to compare the merits
of FLUENTAL™ to MgF2 / Teflon moderators and to assess
the effects of Graphite and Lead reflectors on designing and
building an optimal facility.
Moderator /
Reflector /
no filter
Moderator
Length
(cm)
AD
(cm)
TR
at 6.5cmMax TR
TT
(min)
Skin
Dose
(Gy)
Fluental /
Graphite 21.1 9.1
2.24 ±
0.02
5.08 ±
0.06
140 ±
215.4
Fluental /
Graphite 25.1 9.1
2.23 ±
0.02
5.34 ±
0.05
198 ±
214.6
Fluental /
Lead21.1 9.6
2.44 ±
0.02
4.73 ±
0.07
120 ±
216.0
Fluental /
Lead25.1 9.8
2.75 ±
0.02
5.40 ±
0.03
176 ±
215.7
Fluental /
Lead27.6 9.8
2.73 ±
0.02
5.39 ±
0.06
203 ±
214.5
MgF2 /
Lead 18.1 9.6
2.58 ±
0.03
5.13 ±
0.05
117 ±
115.6
MgF2 /
Lead21.1 9.6
2.54 ±
0.02
5.41 ±
0.06
150 ±
215.8
MgF2 /
Lead25.1 9.5 2.5 ± 0.2
5.59 ±
0.05
201 ±
115.0
Moderator /
Reflector /
with filter
Moderator
Length
(cm)
AD
(cm)
TR
at 6.5cmMax TR
TT
(min)
Skin
Dose
(Gy)
Fluental /
Graphite 18.1 9.2
2.35 ±
0.04
4.66 ±
0.08
130 ±
215.6
Fluental /
Graphite 21.1 9.5
2.54 ±
0.02
5.19 ±
0.03
185 ±
114.7
Fluental /
Lead21.1 9.7
2.55 ±
0.04
4.63 ±
0.07
135 ±
216.1
Fluental /
Lead 25.1 >10
2.95 ±
0.03
5.36 ±
0.04
202 ±
115.3
MgF2 /
Lead18.1 >10
2.76 ±
0.02
5.26 ±
0.03
146 ±
114.9
MgF2 /
Lead21.1 >10
2.79 ±
0.02
5.45 ±
0.04
188 ±
113.1
1 2 3 4 5 6 7 8 9 100
1
2
3
4
5
Depth (cm)
Ther
apeu
tic
Rat
io (
TR
)
TR at 6.5cmMax. TR
AD
Proton
beam line
Figure 2. A schematic to illustrate the Therapeutic Ratio
used to derive 3 of the Figures of Merit
Moderator /
Reflector /
with filter
Moderator
/ PMR
Length
(cm)
TR
at 6.5cm
Max
TR
TT
(min)
Skin
Dose
(Gy)
MgF2 / Lead
/ short PMR21.1 / 5
3.1 ±
0.02
5.48 ±
0.03
157±
116.3
MgF2 / Lead
/ long PMR21.1 / 15
2.79 ±
0.02
5.54 ±
0.04
228 ±
112.1
It is evident from the above TRs that deeper seated tumours
are better treated with the short PMR at the beam exit port.
The mid-brain TR increases by a considerable 11% advantage
over the filtered MgF2 assembly without PMR and 39% over
the existing facility. Treated times are severely impacted with
increased PMR length as well as mid-brain TRs.
If a facility were to be designed for the treatment of ONLY
shallow tumours, the TR at 6.5 cm and the AD are not as
important a factor as the Max TR. Which shows very little
improvement with the addition of the filter and post moderator
reflector (PMR).
Table 3. Figures of Merit for the near optimal assemblies with Li-Si filter.
Table 2. Figures of Merit for the near optimal assemblies.
Table 1. Assumed values for the optimisation simulations.
The FOMs of the current Birmingham facility shown in Table 2
(in bold) exhibit extremely good Therapeutic Ratios and a
relatively modest skin dose when compared to the other BSA
materials. Improvements in all FOMs can be seen with the
21.1 cm MgF2 / Lead assembly over the current Birmingham
assembly.
The optimisation of the Beam Shaping Assembly (BSA) was
carried out in three stages.
• Stage 1: Moderator and reflector design.
• Stage 2: Addition of a Thermal Neutron filter [Li-Si, 5% 6Li,
5mm thick]
• Stage 3: Addition of post moderator reflector (PMR) [Lead]
At each stage only a near optimal subset of results was
considered for further design considerations.
Stage I: Beam Shaping Assembly (BSA)
Stage II: Beam Shaping Assembly + Li-Si Filter
Stage III: BSA + filter + Lead Post Moderator Reflector (PMR)
Thermal
neutron filter
(Li-Si)
Figure 3. BSA with Li-Si filter at beam exit port.
Figure 5. Optimum MgF2 / Lead
BSA and Li-Si filter with short
(5cm) (b) and long (15cm) (c) post
moderator reflectors.
(a)
(b)
(c)
Table 4. Figures of Merit for the near optimal assemblies with Li-
Si filter and Post Moderator Reflector (PMR) .