the policy response guide to ocean acidification · the policy response guide to ocean...
TRANSCRIPT

Scripps Institution of Oceanography University of California San Diego
The Policy Response Guide to Ocean Acidification
M.A.S. Capstone Project Climate Science & Policy
Gabriel Arce
June 2016

Contents
Executive Summary ......................................................................................................................... i
I. Introduction ................................................................................................................................. 1
II. Clean Water Act Background .................................................................................................... 3
III. CBD vs. EPA ............................................................................................................................ 5
IV. EPA Water Quality Criteria ...................................................................................................... 6
V. California 303(d) list and pH ..................................................................................................... 7
VI. Scientific background ............................................................................................................... 8
VII. TMDL program and pH data in San Diego ........................................................................... 10
VIII. Acknowledgements and recommendations .......................................................................... 11
IX. References ............................................................................................................................... 12
i
Executive Summary Over the last two decades ocean acidification has emerged as one of the largest threats to marine
organisms and ecosystems. This phenomena is a related to increasing carbon dioxide emissions,
and therefore the subject has gained attention in climate change discussions and frameworks. So
far most research efforts on ocean acidification have focused on understanding its biological
implications on organisms and fisheries, and management and policy solutions to ocean
acidification are not well developed. In the last few years the ocean acidification issue has emerged
as a top priority within various Federal and international programs.
The Clean Water Act (CWA) is the nation’s most important legal mechanism to protect water
quality. Among the tools that the CWA uses to control water pollution are the national water
quality criteria. Section 303(d) of the Clean Water Act requires states to establish water quality
standards that serve as basis for regulation of water pollution. To address ocean acidification
under the CWA, the pollution parameter that needs to be considered is the pH of a marine water
body. In the state of California the water quality control plan lists all beneficial uses of water and
determines specific water pH criteria for specific uses.
Ocean acidification is expected to progressively impact marine ecosystems, biodiversity,
fisheries, and societies at scales ranging from local to regional to global. This document reviews
and proposes frameworks to address ocean acidification under section 303(d) of the Clean Water
Act, and also recommends relevant tools to mitigate the impacts of ocean acidification. This
policy memorandum presents scientific information on ocean acidification and suggests more
suitable and up to date monitoring solutions to better understand and address pH impairment and
ocean acidification in California’s coastal waters.
1
MEMORANDUM SUBJECT: The Policy Response Guide to Ocean Acidification FROM: Gabriel Arce M.A.S. Climate Science & Policy, Scripps Institution of Oceanography TO: California Regional Water Quality Control Board, San Diego Region 9
Abstract The purpose of this memorandum is to provide information to assist the Regional and State Water Boards in developing and implementing strategic plans and actions related to Ocean Acidification (OA) and associated impacts. This document reviews and proposes frameworks to address OA under section 303(d) of the Clean Water Act, and also recommends relevant tools to mitigate the impacts of OA. The focus of this memorandum is to present relevant information on water quality and pH criteria, natural and regional variability of the carbonate system, impacts of ocean acidification and mitigation strategies that will contribute to the elaboration of future actions on this issue. The memorandum recognizes the relevance of marine habitat and life impacts associated with OA and describes how the Regional and State Water Boards can use existing policy tools to respond to this issue. The memorandum also provides information regarding alternative actions for mitigating ocean acidification in regional level, by analyzing human activities in coastal environments that might alter the natural state of ocean pH and addressing them with more efficient policy tools. This document should provide guidelines to policy makers regarding OA and it is not intended to provide an emergency response plan.
I. Introduction The global oceans are one of the largest carbon reservoirs in our planet, playing a major role in the carbon dioxide cycle. The ocean is responsible for absorbing one-quarter of global carbon dioxide (CO2) released into the atmosphere by anthropogenic activities1. Increasing emissions can lead to a larger oceanic uptake of CO2 and this process can cause disruptions in the ocean carbonate system. The pH of natural waters is a measure of acid-base equilibrium achieved by various dissolved compounds and gases. The principal system regulating pH in natural waters is the carbonate system. Most carbon dioxide released into the atmosphere as a result of the burning of fossil fuels will eventually be absorbed by the ocean2. When carbon dioxide dissolves in the ocean it lowers the pH, making the ocean more acidic3. The decrease of pH in oceanic waters is known as Ocean Acidification, and this phenomenon was also referred to as “The Other CO2 problem”1.

2
Ocean acidification due to anthropogenic CO2 emissions is a dominant driver of long-term changes in pH in the open ocean, raising concern for the future of calcifying organisms, many of which are present in coastal habitats4. Ocean acidification is expected to progressively impact marine ecosystems, biodiversity, fisheries, and societies at scales ranging from local to regional to global through the twenty-first century and beyond5. Coastal environments have unique features and processes that can lead to variability of pH in different magnitudes and time scales, and despite the effect of global ocean acidification driven by increasing CO2 concentrations, there are other anthropogenic factors that can affect ocean chemistry in smaller scales.
Figure 1: Time series of atmospheric CO2 at Mauna Loa (in parts per million volume, ppmv) (red), surface ocean pH (cyan), and pCO2 (μatm) (tan) at Ocean Station ALOHA in the subtropical North Pacific Ocean. The increasing CO2 concentrations are associated with decreasing pH values (modified from Doney, 2009)
In the last few years the ocean acidification issue has emerged as a top priority within various Federal and international programs. President Barack Obama created an Interagency Ocean Policy Task Force on June 12, 2009, to better meet our Nation’s stewardship responsibilities for the oceans, coasts and Great Lakes6. U.S. federal environmental laws, state laws, and local ordinances provide multiple layers of protection for coastal waters by controlling emissions, runoff, and land-use patterns through zoning and permitting, implementing measures that reduce residential and agricultural runoff, for example, can minimize beach and river contamination and algal blooms, while reducing pollutants that acidify the local coastal ocean7.
The Clean Water Act (CWA) is the nation’s most important legal mechanism to protect water quality. Among the tools that the CWA uses to control water pollution are the national water quality criteria. States use the criteria in adopting water quality standards and developing pollution controls. New information on ocean acidification, however, has rendered the existing water quality criteria for pH outdated and inadequate. Under the Clean Water Act, EPA has a

3
duty to periodically update water quality criteria to reflect the latest scientific knowledge. The main requisite for establishing adequate water quality criteria is the measurement and monitoring of water quality parameters.
This policy memorandum presents scientific information on ocean acidification and suggests more suitable and up to date monitoring solutions to better understand and address pH impairment and ocean acidification in California’s coastal waters. Three main topics are covered in this document: (i) Review of the legal framework related to this issue, focusing on sections 101(a) and 303(d) of the Federal Water Pollution Control Act, what can be done in state and federal levels to address the issue; (ii) Review and analysis of scientific literature regarding Ocean Acidification, understand what is the scientific consensus on this topic, what is the solid knowledge and what questions remain unanswered in this field. (iii) Establish a connection between the scientific knowledge and the legal framework, and determine the gaps in knowledge that need to be filled for efficient policy making on Ocean Acidification.
II. Clean Water Act Background The Federal Water Pollution Control Act (Clean Water Act) passed in 1972 represents an important milestone for surface water quality protection. The statute employs various regulatory and non-regulatory tools to sharply reduce direct pollutant discharges into waterways, establish ambient water quality standards, finance municipal wastewater treatment facilities, and manage polluted runoff. These tools are employed to achieve the broader goal of restoring and maintaining the chemical, physical, and biological integrity of the nation’s waters so that they can support “the protection and propagation of fish, shellfish, and wildlife and recreation in and on the water.”8. To achieve these goals, Section 303(d) of the Clean Water Act requires states to establish water quality standards that serve as basis for regulation of water pollution9,10. These standards set out water quality for each water body by designating uses and setting criteria necessary to protect the beneficial uses of water10. All waters must have designations for how they’re used, and numeric and/or narrative criteria that support those uses. Antidegradation policies and implementation methods are also required, to ensure that high quality is not unnecessarily degraded and that all waters meet their minimum water quality criteria. Then water bodies are monitored to determine whether the Water Quality Standards (WQS) are met8.
The CWA is responsible for guaranteeing “water quality which provides for the protection and propagation of fish, shellfish and wildlife and provides for recreation”11. The Environmental Protection Agency (EPA) is required to promulgate rules necessary “to restore and maintain the chemical, physical, and biological integrity of the Nation’s waters.”11. Section 304 of the Clean Water Act establishes national water quality criteria for pH and mandates that EPA revise national water quality criteria “from time to time” to reflect “latest scientific knowledge”12. Under Section 303(d) of the CWA, States, Territories, and authorized Tribes are required to develop lists of
4
impaired waters and develop Total Maximum Daily Loads (TMDLs) for the pollutant(s) causing the impairment. CWA Section 303(d) and supporting regulations (40 CFR 130.2 and 130.7) establish the Impaired Waters Listing and TMDL Program. Total Maximum Daily Load (TMDL) is a numerical calculation of the loading capacity of a water body to assimilate a certain pollutant and still attain all water quality standards. The TMDL is the sum of the individual wasteload allocations for point sources, load allocations for nonpoint sources and natural background, and a margin of safety. TMDLs can be expressed in terms of mass per time, toxicity, or other appropriate measures that relate to a state’s water quality standards13.
The Impaired Waters Listing and TMDL Program is primarily a State-driven process with EPA oversight14. In the State of California, the State Water Resources Control Board (SWRCB) and local Regional Water Quality Control Boards (RWQCBs) have assumed the responsibility of implementing US EPA’s Total Maximum Daily Load program and other programs under the CWA such as the Impaired Waters Program and the Antidegradation Policy. Section 13001 of the California Water Code identifies the SWRCB and all RWQCBs as the principal state agencies responsible for the coordination and control of water quality13.
The Regional Water Boards are responsible for listing impaired water bodies according to water quality criteria. After the impaired water list is developed, EPA provides oversight and must either approve, disapprove, or partially disapprove the impaired water list. Once a water body is listed as impaired pursuant to the Clean Water Act Section 303(d) the state has the authority and duty to control pollutants from all sources that are causing the impairment9. If the water body is not meeting Water Quality Standards, a strategy for meeting these standards is needed. Key elements of a strategy include: (1) a Total Maximum Daily Load (TMDL); and (2) a TMDL implementation plan. TMDLs determine what level of pollutant load would be consistent with meeting WQS. TMDLs also allocate acceptable loads among sources of the relevant pollutants8.
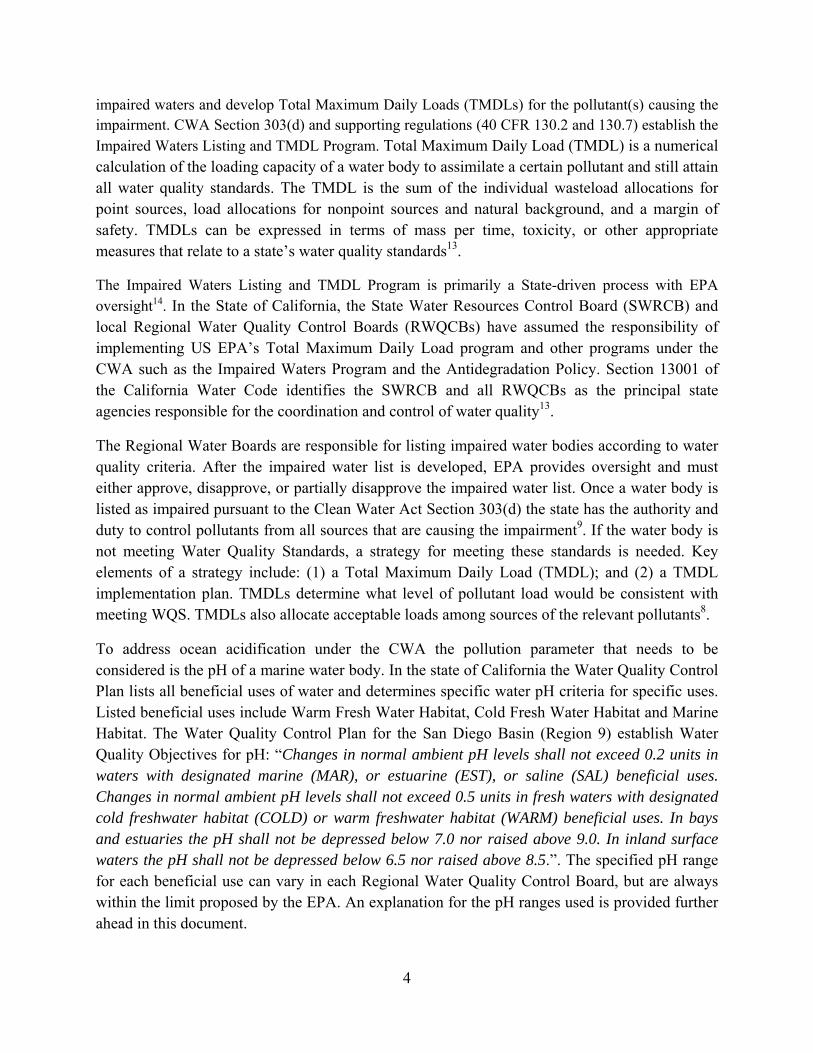
To address ocean acidification under the CWA the pollution parameter that needs to be considered is the pH of a marine water body. In the state of California the Water Quality Control Plan lists all beneficial uses of water and determines specific water pH criteria for specific uses. Listed beneficial uses include Warm Fresh Water Habitat, Cold Fresh Water Habitat and Marine Habitat. The Water Quality Control Plan for the San Diego Basin (Region 9) establish Water Quality Objectives for pH: “Changes in normal ambient pH levels shall not exceed 0.2 units in waters with designated marine (MAR), or estuarine (EST), or saline (SAL) beneficial uses. Changes in normal ambient pH levels shall not exceed 0.5 units in fresh waters with designated cold freshwater habitat (COLD) or warm freshwater habitat (WARM) beneficial uses. In bays and estuaries the pH shall not be depressed below 7.0 nor raised above 9.0. In inland surface waters the pH shall not be depressed below 6.5 nor raised above 8.5.”. The specified pH range for each beneficial use can vary in each Regional Water Quality Control Board, but are always within the limit proposed by the EPA. An explanation for the pH ranges used is provided further ahead in this document.

5
III. CBD vs. EPA The most emblematic case regarding Ocean Acidification and the Clean Water Act is probably CBD vs. EPA. The Center for Biological Diversity (CBD) petitioned against the EPA arguing that EPA’s water quality criteria for pH is significantly outdated relative to the current science and that EPA is required by CWA § 304 to review the new evidence and evaluate a change in the water quality standard for pH15. In Center for Biological Diversity vs. EPA16, the CBD challenged Washington State’s failure to designate coastal waters as “impaired” because of a decline in pH by 0.2 units from natural levels, as required under the federal Clean Water Act9. The complaint was filed in United States District Court for the Western District of Washington and mentions a decline in wild and hatchery shellfish production related to the increasing acidity of marine waters. The document also claims that the Pacific Northwest’s coastal waters are particularly vulnerable to ocean acidification and acidified waters are already reaching surface waters along the Washington and Oregon coasts16.
The Center for Biological Diversity is a nonprofit corporation dedicated to the preservation of biodiversity, native species, and ecosystems. The corporation focuses on the protection of marine species and their ocean habitats, including significant efforts to ensure the conservation of imperiled marine species. In 2007, the CBD submitted a request to Washington’s Department of Ecology that it list all state marine waters for pH impairments due to ocean acidification on the 2008 list of impaired waters16. Washington denied CBD’s request, and in response to EPA’s approval of Washington’s list, the CBD sued EPA in May 2009. The parties settled, and EPA agreed to a public process for determining how ocean acidification should be addressed under Section 303(d) of the CWA, and to make such a determination by November 15, 2010. EPA consequently published a Federal Register notice, accepted public comment, and determined that waters impaired by ocean acidification should be identified on the list as required by Section 303(d) of the Clean Water Act14.
With respect to Washington, EPA concluded that the information submitted by CBD did not provide sufficient ambient water quality data, nor could such data be reasonably extrapolated, to demonstrate that the State’s water quality standards were not met for pollutants associated with OA or conditions attributable to OA17. Washington’s water quality criteria for pH provide that pH levels should be within the range of 7.0-8.5, with an anthropogenic (human-caused) variation within that range of less than 0.2 units (for extraordinary marine quality waters) or less than 0.5 units (for excellent marine quality waters). All of the pH data in the record are within the acceptable range, and CBD does not contend otherwise. CBD relies entirely on a single study that documented a decrease in pH levels of greater than 0.2 units, but still within the acceptable range in the pH water quality criteria. Washington reviewed all of the documents submitted by CBD, prepared a detailed response to CBD’s specific assertions, and concluded that none of the referenced studies demonstrated non-attainment of the pH criteria18.

6
IV. EPA Water Quality Criteria The national recommended Quality Criteria for Water was published by the EPA in 1976 and in 1986. These publications are known as the "Red Book" and the "Gold Book" respectively. The criteria in these documents are still current where a more recent criterion has not been published. In 1986, the “Gold Book” summarized water quality criteria in effect with no change to the pH criteria for oceans. Since then EPA has periodically updated water quality criteria under Section 304(a)(1) to accurately reflect the latest scientific information, however, the pH criterion above remains in effect today. The following criteria are defined for pH:
CRITERIA: pH Range
5 - 9 Domestic water supplies (welfare) 6.5 - 9.0 Freshwater aquatic life 6.5 - 8.5 Marine aquatic life (bur not more than 0.2 units outside
of normally occurring range.) Table 1: Water quality criteria for pH, as determined by the EPA Gold Book.19
The established pH values for aquatic life are mostly based on a review of the effects of pH on freshwater fish published by the European Inland Fisheries Advisory Commission20. This report was focused on freshwater fisheries and therefore determined specific pH ranges and associated effects on fish for each range. The EPA Gold Book also explains the different range used for marine aquatic life.
pH Range Effect on Fish 5.0 - 6.0 Unlikely to be harmful to any species unless either the
concentration of free CO2 is greater than 20 ppm, or the water contains iron salts which are precipitated as ferric hydroxide, the toxicity of which is not known.
6.0 – 6.5 Unlikely to be harmful to fish unless free carbon dioxide is present in excess of 100 ppm.
6.5 – 9.0 Harmless to fish, although the toxicity of other poisons may be affected by changes within this range.
Table 2: pH ranges and effect on fish, as published in the EPA Gold Book.20
The chemistry of marine waters differs from that of fresh water because of the large concentration of salts present. In addition to alkalinity based on the carbonate system, there is also alkalinity from other weak acid salts such as borate. Because of the buffering system present in seawater, the naturally occurring variability of pH is less than in fresh water21.

7
Normal pH values in seawater are 8.0 to 8.2 at the surface, decreasing to 7.7 to 7.8 with increasing depth22. The National Academy of Sciences Committee's review indicated that plankton and benthic invertebrates are probably more sensitive than fish to changes in pH and that mature forms and larvae of oysters are adversely affected at the extremes of the pH range of 6.5 to 9.0 units19,21. The EPA Book also makes a good distinction between open ocean and coastal ocean environments and therefore explain the pH criteria used: “…in shallow, biologically active waters in tropical or subtropical areas, large diurnal pH changes occur naturally because of photosynthesis. pH values may range from 9.5 in the daytime to 7.3 in the early morning before dawn. Apparently, these communities are adapted to such variations or intolerant species are able to avoid extremes by moving out of the area. For open ocean waters where the depth is substantially greater than the euphotic zone, the pH should not be changed more than 0.2 units outside of the naturally occurring variation or in any case outside the range of 6.5 to 8.5. For shallow, highly productive coastal and estuarine areas where naturally occurring variations approach the lethal limits for some species, changes in pH should be avoided, but in any case not exceed the limits established for fresh water, i.e., pH of 6.5 to 9.0. As with freshwater criteria, rapid pH fluctuations that are caused by waste discharges should be avoided.”19
The EPA Gold Book also establishes criteria for alkalinity in marine waters. Alkalinity is the sum total of components in the water that tend to elevate the pH of the water above a value of about 4.5 units. When combined, pH and alkalinity values provide useful information about the carbonate system in marine waters, including concentration of carbonate species. The NAS Report recommends that adequate amounts of alkalinity be maintained to buffer the pH within tolerable limits for marine waters. The implementation of updated alkalinity criteria for marine waters would be extremely useful for addressing coastal ocean acidification. V. California 303(d) list and pH The State and Regional Water Boards assess water quality data for California's waters every two years to determine if they contain pollutants at levels that exceed protective water quality criteria and standards. This biennial assessment is required under Section 303(d) of the Federal Clean Water Act. The most recent California 303(d) list was published in 2012 and contains 126 pH impaired water bodies. The document contains six water bodies in coastal environments impaired by pH, Moss Landing Harbor and Elkhorn Slough are listed for pH impairment in the marine habitat beneficial use and Malibu Lagoon is listed for estuarine habitat beneficial use (See Appendix A). Data used for the impairment decisions is available for the public, although some of the datasets are incomplete. The Moss Landing Harbor in the Monterey Bay region presents the most comprehensive dataset for marine pH when compared to other water bodies in the list. The decision to list the water bodies for marine habitat pH impairment include samples exceeding upper (basic) pH levels, or pH sample above 8.5 units, but the listing is still an important step in the ocean acidification policy in the state of California.

8
VI. Scientific background The ocean absorbs one-quarter of global carbon dioxide (CO2) released into the atmosphere by anthropogenic activities1. Ocean uptake of anthropogenic CO2 is leading to a decline in the pH of the world’s surface oceans3,23,24. This process, driven by rapidly increasing anthropogenic CO2, is commonly referred to as “ocean acidification” (OA) is resulting in a decline in carbonate (CO3
2−) concentrations and, hence, the saturation state (Ω) of calcium carbonate (CaCO3) minerals in seawater. Values of represent the saturation state of the carbonate species, with 1 being equal to the saturation horizon, or the equilibrium of the system, values greater than one represent a state where precipitation of calcium carbonate will occur, and values smaller than 1 represent an undersaturated state where dissolution of carbonate occurs. The carbonate saturation state and are the two main variables used for understanding changes the carbonate system and quantify ocean acidification. The partial pressure of dissolved carbon dioxide is also very important for estimating the atmospheric contribution to the carbonate chemistry in the ocean. The chemical basis of the seawater carbonate system is the reaction of with water to form carbonic acid (H2CO3) and other carbonate species25.
Ocean acidification can be viewed as a decrease of the chemical bases in seawater that results in increasing protons (H+) and reduction of pH. It also decreases the concentration and saturation states of calcium carbonate, calcite and aragonite. Such changes in seawater chemistry have complex direct and indirect impacts on marine organisms and ecosystems10. The process of ocean acidification is well documented in field data, and the rate will accelerate over this century unless future CO2 emissions are reduced dramatically. The potential for marine organisms to adapt to increasing CO2 and broader implications for ocean ecosystems are not well known; both are high priorities for future research. Although ocean pH has varied in the geological past, paleo-events may be only imperfect analogs to current conditions1. The observed rate of change of global ocean pH since 1750 is faster than any during the last 55 million years26. While the resultant changes in carbonate chemistry are well understood, the biological impacts of increasing acidification on marine organisms, ecosystems and biogeochemistry are all less clear27, though it is widely believed that increasing acidity significantly affect marine organisms28.
The rapid increase in the capacity of humans to impact the key processes regulating the functioning of the biosphere into the Anthropocene18 has extended to a capacity to impact marine pH. Human activities can act on marine pH through impacts propagated through the atmosphere, freshwater discharges and direct impacts on ecosystem components (Table 3). Accordingly, there are three main vectors of anthropogenic impacts on marine pH: (1) emissions of CO2, and other gases affecting marine pH, to the atmosphere; (2) perturbation of watershed processes affecting the inputs of nutrients, organic and inorganic carbon, acids and carbonate alkalinity to the ocean; and (3) impacts on ecosystem structure. These drivers add to the processes operating prior to the human perturbation to regulate marine pH in the Anthropocene4.

9
Driver Pre-disturbance Anthropogenic disturbance Air–sea exchange Air–sea CO2 exchange Ocean uptake of anthropogenic CO2 Deposition of anthropogenic acids and bases Watershed processes
Weathering Mining
Volcanic activity Acid sulphate soil disturbance Ecosystem processes Changes in land use Climatic variability Agricultural practices Melting and thermokarst processes Hydrological perturbations Anthropogenic climate change Ecosystem processes
Community metabolism Eutrophication
Mixing and water residence time Habitat loss Anthropogenic climate change
Table 3: Summary of processes driving changes in surface water pH in marine ecosystems.4
Considering all that anthropogenic disturbance factors that affect pH in coastal ecosystems it is possible to see that carbon dioxide emissions uptake only represent a minor contribution to coastal environments. There are also a wide range of natural factors that drive changes in ocean chemistry and can be attenuated by anthropogenic disturbance. In contrast to open ocean studies, each coastal area is influenced by local processes, including hydrodynamics, freshwater input and biogenic processes that have to be taken into account when analyzing pH variability.
This new concept of anthropogenic impacts on seawater pH accommodates the broad range of mechanisms involved in the anthropogenic forcing of pH in coastal ecosystems, including changes in land use, nutrient inputs, ecosystem structure and net metabolism, and emissions of gases to the atmosphere affecting the carbon system and associated pH. The new paradigm is applicable across marine systems, from open-ocean and ocean-dominated coastal systems, where OA by anthropogenic CO2 is the dominant mechanism of anthropogenic impacts on marine pH, to coastal ecosystems where a range of natural and anthropogenic processes may operate to affect pH4. A clear distinction between pelagic and coastal environments has to be made when studying this subject and this approach is also necessary when it comes to the development of policies regarding this issue.
Different oceanographic and biogeochemical processes occur in the coastal ocean when compared to open oceanic water masses. The uptake of carbon dioxide in the open ocean is the main factor influencing the carbonate system in surface waters, but in coastal environments there are other factors that can affect the ocean water chemistry. The coastal ocean consists of several distinct but tightly connected ecosystems that include rivers, estuaries, tidal wetlands and the continental shelf. Carbon cycling in the coastal waters that connect terrestrial with oceanic systems is acknowledged to be a major component of global carbon cycles and budgets29-31.

10
Although data on the natural variation in the seawater CO2 system are emerging, nearly all high-resolution (e.g. hourly) time series are based on CO2 partial pressure sensors, with comparatively few pH time series found in the literature. The absence of information regarding natural pH dynamics is a critical data gap for the biological and ecological arm of the multidisciplinary investigation of ocean acidification. A 2011 paper by UC Santa Barbara professor Grechen Hofmann and colleagues documented the variability in ocean pH around the world, and included several sites in California. To better illustrate the pH dynamics in different ecosystems, the paper analyzed pH data from 15 sensors deployed in different locations including open ocean and coastal ocean sites. Overall, the patterns of pH recorded at each of the 15 deployment sites were strikingly different32. Figure 1 in Appendix B presents the temporal pattern of pH variation at each of these sites. The studied time series presents very useful data on pH variability in different environments and shows how necessary it is to have continuous monitoring of pH in both coastal and open ocean stations. VII. TMDL program and pH data in San Diego
The City of San Diego monitors several parameters in water bodies as required by the State Water Resources Control Board. Water samples are taken in different stations along the coast of San Diego and parameters including pH, dissolved oxygen and turbidity are sampled in conformity with section 303(d) regulations. Datasets for pH and oxygen were provided by the City of San Diego Transportation & Storm Water Department. Data used for this analysis include a three year time series in four different stations in La Jolla, and pH results are displayed on Figure 2 (See Appendix C for more information). In the datasets it is possible to see a high temporal and spatial variability for pH values, and differences of more than 0.4 units are observed in Stations EH320 and FM080 in samples that were taken in the same period of the day, correlation for pH between the two stations is very low. The dissolved oxygen data presents values with less spatial variability, with high correlation between the same two stations.
Data collected in the Scripps TMDL Program allows for a better visualization of the dynamics and variability of pH in coastal ocean settings. It is not possible to determine a trend or behavior in the datasets and it is also difficult to enumerate the sources contributing to pH variations. The analyzed pH data is of extreme relevance for understanding coastal variations of pH and dissolved oxygen in San Diego. The three year time series may be the longest recorded pH data for this location and it useful for addressing ocean acidification. The sampling interval of the data is clear evidence that continuous monitoring of pH together with other oceanographic parameters is needed in order to understand the natural variations of pH and the carbonate system and therefore use available regulations to list coastal water bodies as impaired.

11
Figure 2: Time series of pH values measured along the coast of San Diego. There is a high variability of pH in the stations and differences as high as 1 pH unit are observed for measurements taken at the same date in the TMDL program stations. The weekly interval between measurements is not adequate to understand coastal pH trends.
VIII. Acknowledgements and recommendations
Concern around the ocean acidification issue evolved just recently and still many questions are being addressed by the scientific community. The processes regarding the chemistry of the carbonate system have been well elucidated so far, but little is known about the natural variability of the system and there are very few studied pH proxies where compared to carbon dioxide concentration proxies. In addition there are several challenges associated with the study of pH variability in coastal regions and also it is still hard to pinpoint the anthropogenic contribution to ocean acidification. The Clean Water Act represents a powerful legal mechanism to address ocean acidification, and the 303(d) impaired water body listings are very important in the understanding of disturbances to marine environments. Currently the 303(d) List in California does not directly deal with ocean acidification, but all the policy frameworks to address this issue are already exists and with minor changes and improvements could become useful tools to prevent ocean acidification in California.
After reviewing the policy framework and available data for the State of California, this memorandum recommends improvements in coastal pH measurements, with continuous measurements, sensor deployment in existing TMDL Program stations in San Diego. Time series of pH are required in order to define what the natural ambient pH level is and therefore enforce EPA regulations for water body impairing. The Clean Water Act also lists alkalinity as a pollutant and inclusion of alkalinity measurements in the TMDL program would improve the understanding of the carbonate system and seawater and ocean acidification in general.

12
IX. References
1. Doney, S.C., Fabry, V.J. Feely, R.A. Kleypas, J.A. (2009). Ocean acidification: The other CO2 problem. Annual Review of Marine Science 1:169–192, http://dx.doi.org/10.1146/annurev. marine.010908.163834.
2. Houghton, J. T. (2001). Climate Change 2001: The Scientific Basis (Contribution of Working Group I to the Third Assessment Report of the IPCC, Cambridge, Cambridge Univ. Press,
3. Caldeira, K. Wickett, M. E. (2003). Anthropogenic carbon and ocean pH, Nature, 425(365–368).
4. Duarte, C. M. et al (2013). Is ocean acidification an open-ocean syndrome? Understanding anthropogenic impacts on seawater pH. Estuar Coast 36(221–236)
5. Alin, S.R. et al (2015). Characterizing the natural system: Toward sustained, integrated coastal ocean acidification observing networks to facilitate resource management and decision support. Oceanography 28(2):92–107, http://dx.doi.org/ 10.5670/oceanog.2015.34.
6. White House Memo, June 12, 2009, online at http://www.whitehouse.gov/sites/ default/files/page/files/2009ocean_mem_rel.pdf
7. Kelly, R.P. et al (2011). Mitigating Local Causes of Ocean Acidification with Existing Laws. Science 332: 1036-1037.
8. United States Environmental Protection Agency (USEPA). Introduction to the Clean Water Act. https://cfpub.epa.gov/watertrain/pdf/modules/IntrotoCWA.pdf
9. 33 U.S. Code § 1313(d).
10. 40 Code of Federal Regulations § 103.3.
11. 33 U.S. Code § 1251 (a)(2).
12. 33 U.S.C § 1314 (a)(1).
13. SWRCB (State Water Resources Control Board). 2005. A process for addressing impaired waters in California. State Water Resources Control Board, Division of Water Quality, Sacramento, CA
13
14. United States Environmental Protection Agency (USEPA). Clean Water Act Section 303(d): Notice of Call for Public Comment on 303(d) Program and Ocean Acidification. Federal Register /Vol. 75, No. 54
15. Climate Change and the Clean Water Act - Environmental Group Petitions EPA to Address Ocean Water Quality, Environmental Liability Enforcement & Penalties Reporter, March 2008
16. CBD vs. EPA, No. 2:09-cv-00670-JCC (W.D. Wash. 2009).
17. United States Environmental Protection Agency (USEPA). (2012). Approval Letter, Encl. 2, Approval of Washington State 2010 303(d) List. https://www3.epa.gov/region10/pdf/water/303d/ washington/final_WA_2010_approval_letter.pdf
18. United States Environmental Protection Agency (USEPA). (2012). Enclosure 2: EPA Review of Ecology’s Analysis of Ocean Acidification Data and Information. Letter dated June 12, 2012 from Ecology to CBD [WA-000066, 67].
19. United States Environmental Protection Agency (USEPA). (1986). Quality Criteria for Water (Gold Book). EPA 440/5-86-001. Office of Water, Regulations and Standards. Washington, D.C. http://www.epa.gov/waterscience/criteria/goldbook.pdf
20. European Inland Fisheries Advisory Committee. (1969). Water quality criteria for European freshwater fish - extreme pH values and inland fisheries. Prepared by EIFAC Working Party on Water Quality Criteria for European Freshwater Fish. Water Research 3:583.
21. National Academy of Sciences, National Academy of Engineering. (1974). Water quality Criteria. 1972. U.S. Government Printing Office, Washington, D.C.
22. Capurro, L.R..A. (1970). Oceanography for practicing engineers. New York. NY: Barnes and Noble, Inc.
23. Orr, J.C. et al. (2005). Anthropogenic ocean acidification over the twenty-first century and its impact on calcifying organisms. Nature 437: 681–686.
24. Caldeira, K., Wickett, M.E. (2005). Ocean model predictions of chemistry changes from carbon dioxide emissions to the atmosphere and ocean. Journal of Geophysical Research 110(1–12).
25. Zeebe, R., and D. Wolf-Gladrow. (2001). CO2 in Seawater: Equilibrium, Kinetics, Isotopes. Elsevier Oceanography Series, 65, 346 pp.
14
26. Pearson, P. N., and M. R. Palmer (2000), Atmospheric carbon dioxide concentrations over the last 60 million years, Nature 406(695–699). doi:10.1038/35021000.
27. Intergovernmental Panel on Climate Change (IPCC) (2007), Climate Change 2007: Climate Change Impacts, Adaptation and Vulnerability. Contribution of Working Group II to the Fourth Assessment Report of the Intergovernmental Panel on Climate Change, edited by M. L. Parry et al., Cambridge, U.K.: Cambridge Univ. Press.
28. Bernie, D., J. Lowe, T. Tyrrell, and O. Legge .(2010). Influence of mitigation policy on ocean acidification, Geophysical Research Letters, 37, L15704, doi:10.1029/2010GL043181.
29. Cole, J. J. et al. (2007). Plumbing the global carbon cycle: integrating inland waters into the terrestrial carbon budget. Ecosystems 10(172–185).
30. Cai, W.J. (2011). Estuarine and coastal ocean carbon paradox: CO2 sinks or sites of terrestrial carbon incineration? Annu. Rev. Mar. Sci. 3(123–145).
31. Regnier, P. et al. (2013). Anthropogenic perturbation of the carbon fluxes from land to ocean. Nature Geosciences 6(597–607).
32. Hofmann G. E, Smith et al. (2011) High-Frequency Dynamics of Ocean pH: A Multi-Ecosystem Comparison. PLoS ONE 6(12): e28983. doi:10.1371/journal.pone.0028983.

Appendix A
Decisions on pH impairment for Moss Landing Harbor published on the Final California 2012 Integrated Report (303(d) List/305(b) Report). The Report contains useful information and data used for listing the impaired water bodies for pH and can serve as a guideline for addressing Ocean Acidification under the Clean Water Act. (Source: California State Water Resources Control Board)
DECISION ID 15055 Region 3 Moss Landing Harbor Pollutant: pH Final Listing Decision: List on 303(d) list (TMDL required list) Last Listing Cycle's Final Listing Decision:
New Decision
Revision Status Revised Sources: Source Unknown Expected TMDL Completion Date:
2021
Impairment from Pollutant or Pollution:
Pollutant
Conclusion: This pollutant is being considered for placement on the section 303(d) list under sections 2.1 and 3.2 of the Listing Policy. Five lines of evidence are available in the administrative record to assess this pollutant. Based on section 3.2 the site exceeded numeric objectives for conventional pollutants. According to the binomial distribution, waters shall be placed on the section 303(d) list if the number of measured exceedances supports rejection of the null hypothesis as presented in Table 3.2. Based on the readily available data and information, the weight of evidence indicates that there is sufficient justification in favor of placing this water segment-pollutant combination on the section 303(d) list in the Water Quality Limited Segments category. This conclusion is based on the staff findings that: 1. The data used satisfies the data quality requirements of section 6.1.4 of the Policy. 2. The data used satisfies the data quantity requirements of section 6.1.5 of the Policy. 3. Thirty-three of the 163 samples exceed both the Cold Freshwater Habitat and Marine Habitat water quality objectives. In addition, 51 of the 163 samples exceed the numeric objectives for Non-Contact Recreation and Water Contact Recreation. Each of these exceeds the allowable frequency listed in Table 3.2 of the Listing Policy. 4. Pursuant to section 3.11 of the Listing Policy, no additional data and information are available indicating that standards are not met.
RWQCB Board Staff Recommendation:
After review of the available data and information, RWQCB staff concludes that the water body-pollutant combination should be placed on the section 303(d) list because applicable water quality standards are exceeded and a pollutant

contributes to or causes the problem. SWRCB Board Staff Recommendation:
After review of this Regional Board decision, SWRCB staff recommend the decision be approved by the State Board.
USEPA Decision: Line of Evidence (LOE) for Decision ID 26925, pH Region 3 Moss Landing Harbor
LOE ID: 15174 Pollutant: pH LOE Subgroup: Pollutant-Water Matrix: Water Fraction: None Beneficial Use: Marine Habitat Aquatic Life Use: Marine Habitat Number of Samples: 163 Number of Exceedances: 33 Data and Information Type: PHYSICAL/CHEMICAL MONITORING Data Used to Assess Water Quality:
Central Coast Regional Board Staff assessed National Estuarine Research Reserve Monitoring Program (R3_ESNERR) data for Moss Landing Harbor to determine beneficial use support and results are as follows: 33 of 163 samples exceed the criterion for pH.
Data Reference: Final Data File used for assessment: ESNERR (Elkhorn Slough National Reserve) Field Data from 2006
Final Data File used for assessment: ESNERR (Elkhorn Slough National Reserve) Water Quality Data from 2006
Final Data File used for assessment: ESNERR (Elkhorn Slough National Reserve) Water Quality Data from 94-04
SWAMP Data: Non-SWAMP Water Quality Objective/Criterion: The Water Quality Control Plan, Central Coast Basin, Section II.A.2.
Objectives for All Inland Surface Waters, Enclosed Bays, and Estuaries, II.A.2.a states the following for Marine Habitat beneficial uses: The pH value shall not be depressed below 7.0 or raised above 8.5. Changes in normal ambient pH levels shall not exceed 0.2 units.
Objective/Criterion Reference: Water Quality Control Plan (Basin Plan) - Central Coast Region (Region 3)
Spatial Representation: Data for this line of evidence for Moss Landing Harbor was collected at 1 monitoring site [ 306MORMLN - Moss Landing Road, North]
Temporal Representation: Data was collected over the time period 3/5/1991-10/10/2006. Environmental Conditions: Staff is not aware of any special conditions that might effect
interpretation of the data. QAPP Information: QAPP was adopted for work conducted since 2005. Prior to 2005 no
QAPP was in place and data entry was completed by volunteers. Multiple errors were identified in data and were flagged by RB staff (in communication with Elkhorn Slough Program staff) prior to assessment of data.

Appendix B
Plots illustrating the variability of pH in different marine environments, data was collected using continuous monitoring sensors. (Hofmann, 2011)

Appendix C
Data collected in the Scripps TMDL Program, including datasets for pH and dissolved oxygen values. Results are from the following stations:
% Station: EH-300 % Beach: Ravina - s.Nicholson Pt (Horseshoes) % Location: La Jolla beaches % Position: 32.83938 N, -117.28176 E % Station: EH-310 % Beach: Children's Pool % Location: La Jolla beaches % Position: 32.84750 N, -117.27820 E % Station: EH-320 % Beach: Vallecitos % Location: La Jolla Shores % Position: 32.85600 N, -117.25740 E % Station: FM-080 % Beach: Ave De La Playa % Location: La Jolla Shores % Position: 32.85420 N, -117.25900 E
Figure 1: map showing the locations of TMDL Program stations.
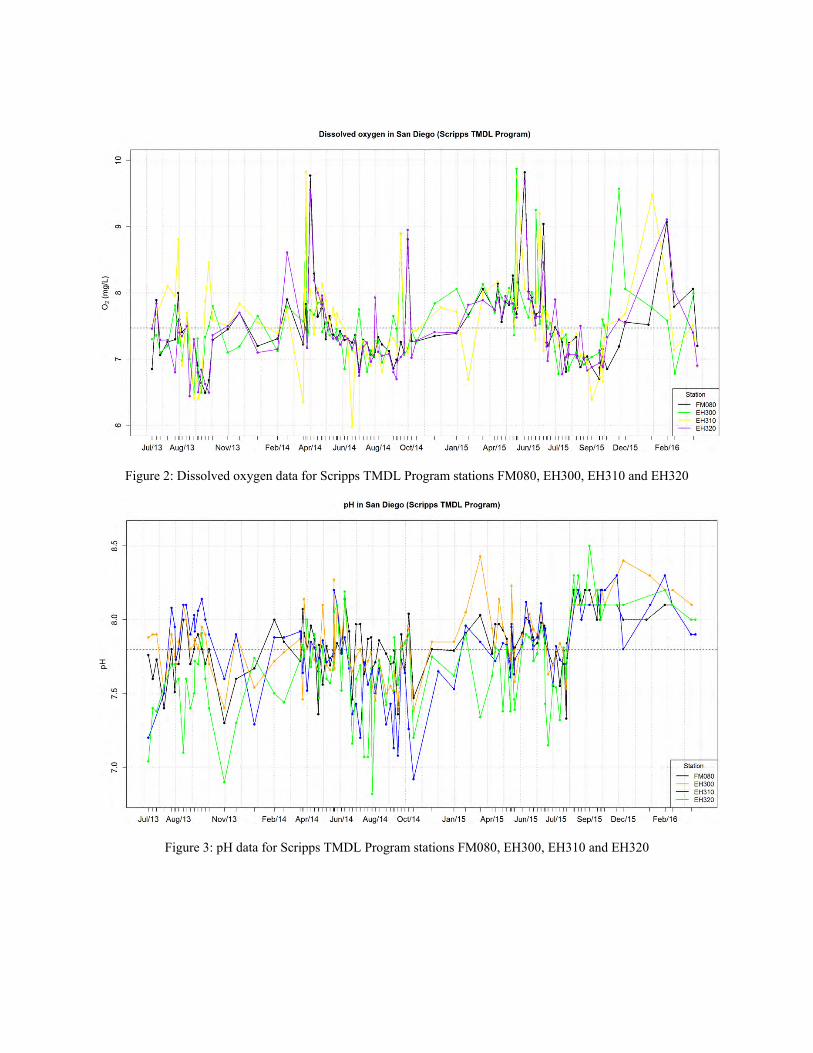
Figure 2: Dissolved oxygen data for Scripps TMDL Program stations FM080, EH300, EH310 and EH320
Figure 3: pH data for Scripps TMDL Program stations FM080, EH300, EH310 and EH320

Figure 4: Dissolved oxygen and pH correlation for stations FM080 and EH320. The oxygen data presents high correlation between stations, and the pH plot shows a low correlation for the stations. pH values present higher temporal and spatial variation than oxygen, and continuous monitoring would be more adequate to study pH variations.