the policy response to macroeconomic … policy response to macroeconomic and fiscal imbalances in...
TRANSCRIPT

THE POLICY RESPONSE TO MACROECONOMIC AND FISCAL IMBALANCES IN ITALY IN THE LAST FIFTEEN YEARS
Antonio Bassanetti,* Matteo Bugamelli,* Sandro Momigliano,* Roberto Sabbatini* and Francesco Zollino*
This paper reviews the main macroeconomic trends and the debate on policy priorities in Italy since the onset of EMU. It argues that, in the decade up to the outbreak of the global crisis (1998-2007), in Italy the reform process came to a virtual standstill and fiscal policy was inconsistent with the commitments taken at the European level. The paper suggests that the lack of resolute policy reactions to the serious institutional dysfunctions and macroeconomic imbalances was due to both the fragmentation of the political constituency and to a variety of favourable contingent factors masking the difficulties of the productive system and overshadowing the need to pursue structural reforms. Had Italy been better positioned in terms of both public finances and structural features in 2007, the adverse effects of the global and sovereign crises would have been partially avoided.
Introduction
Developments since the global crisis have brought to light a number of structural weaknesses of the Italian economy, which, though already identified, had by and large not been tackled in the first decade of European Monetary Union (EMU).
This paper reviews the main macroeconomic trends and the debate on policy priorities in Italy since the late 1990s, to shed light on the reasons why the pace of structural reform was so slow in Italy. It also provides a broad assessment of the costs associated with that inadequate pace, particularly the strains caused by the sovereign debt crisis in the euro area.
Section 1 briefly reviews the debate on the main policy issues at the start of the EMU. There was widespread awareness in Italy that membership of the currency union was not a risk-free strategy, and that substantial efforts were needed, among other, to improve weak productivity growth and significantly reduce the high public debt-to-GDP ratio.
Section 2 describes the disappointing performance of the Italian economy in the decade 1998-2007, the growing macroeconomic imbalances and the gap between fiscal outturns and both the targets consistent with European rules and official commitments.
The aim of Section 3 is twofold. In the first part, we examine the reasons why, notwithstanding the serious macroeconomic imbalances, the reforms that Italy needed were either not introduced or proved largely ineffective. It is argued that, together with more traditional explanations referring to the fragmentation of the political constituency, in the decade following the inception of EMU several factors masked the difficulties of the productive system and made the need to pursue structural reforms less pressing. In the second part of the section, we present simulations of the impact of fiscal policy on economic growth in the decade post-EMU (pre-crisis ————— * Bank of Italy, Economic Research and International Relations Department; A. Bassanetti is currently at the IMF.
We thank Silvia Giacomelli for helping us with the description of the structural reforms implemented in 2011-12; Davide Fantino, Massimiliano Pisani and Alessandro Notarpietro for carrying out the simulations described in section 3.1; Marco Magnani, Stefano Siviero and Stefania Zotteri for their insightful comments on a preliminary version; Renzo Pin and Marco Chiurato for the editorial assistance; participants to the workshop “Macroeconomic imbalances and fiscal policy in Italy in the last 15 years” (Perugia, 4-5 April 2013) for their useful comments. The paper is based on data available up to March 2013.
The views expressed in the articles are those of the authors and do not involve the responsibility of the Bank of Italy.
2 Antonio Bassanetti, Matteo Bugamelli, Sandro Momigliano, Roberto Sabbatini and Francesco Zollino
decade); that impact is appraised by means of a counterfactual scenario in which European commitments are broadly respected.
Section 4 examines the macroeconomic and fiscal developments since 2008 and the structural reforms undertaken in recent years (mostly in 2012). It is argued that the lack of prudent fiscal policies and decisive structural reforms in the first decade of EMU led to sizeable welfare losses during the crisis. Some losses came from the limited room for manoeuvre to carry out countercyclical fiscal policies in 2009. However, the largest costs stemmed from the sovereign debt crisis, in which Italy was involved because of its structural weaknesses. The crisis had a large direct negative impact on economic activity through the credit channel. A more indirect effect came from the need to speed up and frontload the process of fiscal consolidation in the course of the sovereign crisis. This avoided more dramatic developments, but in the short run contributed to strengthening the consequences of the 2012 recession.
Section 5 summarises the main findings and concludes with a few policy remarks.
1 Policy issues and priorities at the start of EMU
EMU was introduced against a background of momentous changes in the world economy. The growing worldwide integration of real and financial markets (the so-called “globalization”) and the shift in the technological paradigm with the large-scale adoption of information and communication technologies (ICT)1 interplayed with the process of European integration. Broadly speaking, all those developments resulted in a steady increase in competitive pressure.
The more competitive external environment had adverse effects on Italy’s growth, as the Italian economy experienced increasing difficulties of adjustment (Brandolini and Bugamelli, 2009; Boeri et al., 2005). Already in the 1990s, especially following the currency crisis of 1992, efforts had been made to address key macroeconomic imbalances;2 they were largely motivated by the aim to meet the criteria required by the Maastricth Treaty to join the EMU.3 Measures had been taken to consolidate the public finances and change industrial relations in the hope of fostering labour market flexibility and productivity growth, in addition to eradicate inflation.4 The reforms included the privatization of formerly public companies and the anti-trust and banking laws (Bianco et al., 2012). However, although those policy actions partly enhanced the ability of Italian industry to seize the opportunities stemming from the changing international division of labour (Confindustria, 1997) and enabled Italy to join the EMU, they did not prevent the trend of Italian productivity to fall below the European average since the mid-1990s.
EMU membership significantly altered the room for manoeuvre of domestic economic policies. On the one hand, it offered the benefits of monetary and exchange rate stability and lower interest rates; on the other, it constrained fiscal policies and ruled out devaluations as a tool to restore competitiveness.
————— 1 The widespread adoption of ICT aided integration by offering greater scope for the provision of distance services (Blinder, 2005)
and reducing transport and communication costs (OECD, 2007a; WTO, 2008). Globalization fostered a reorganization of production worldwide by encouraging firms to locate phases of production in different countries in order either to exploit lower factor costs or to boost their ability to penetrate the new (emerging) markets.
2 For a discussion of these imbalances in an historical perspective, see Crafts and Magnani (2013). 3 The Maastricht criteria for admission in the EMU were (i) an inflation rate no more than 1.5 percentage points above the average of
the three countries with the lowest inflation rates; (ii) nominal long-term interest rates not exceeding by more than 2 percentage points those of the three countries with the lowest inflation rates; (iii) no exchange rate realignment for at least two years; and (iv) a government budget deficit not exceeding 3 per cent of GDP and a gross debt-to-GDP ratio not above 60 per cent or “sufficiently diminishing and approaching the reference value at a satisfactory pace”.
4 For a discussion, see Balassone et al. (2002) and Brandolini et al. (2007).
The Policy Response to Macroeconomic and Fiscal Imbalances in Italy in the Last Fifteen Years 3
The economic debate at the end of the 1990s showed an increasing awareness of the challenges for Italy associated with the adoption of the single currency. The Governor’s Concluding Remarks on 1998 (May 1999) argued that (the) “Adoption of the single European currency sets a lasting seal on monetary stability. It can be a source of growth, employment and sound public finances if economic policies and the behaviour of the two sides of industry are compatible. Otherwise, it will lead to a loss of competitiveness, a weakening of the industrial fabric and an increase in unemployment.” (p. 31). In its Economic Survey of Italy, the OECD (2000) listed a set of areas in need of a vast reform programme. In particular, it wrote that “Notwithstanding the progress [made in the energy sector], the results achieved so far with regard to product market competition have been scattered. The private non-financial service sector is marked by a considerable degree of fragmentation and market inefficiencies, deriving from the presence of strong barriers, often arising from mutually reinforcing national and local regulations”.5 While important structural issues were common to other European countries, they were more varied and intense for the Italian economy, as extensively argued in Visco (1996).
Since the inception of the EMU, the Bank of Italy stressed that a wide range of policy interventions were still needed for the Italian economy to fully exploit the benefits of having joined the euro area.
Concerning the factors directly relevant for firms’ competitiveness, in Banca d’Italia (2002) the following points were emphasized (p. 39):
• Italy’s economic infrastructure is still significantly underdeveloped compared with the other major European countries. Besides sustaining economic growth in the short term, a substantial increase in the volume of resources allocated to public investment is indispensable to attenuate the logistical constraints on the expansion of trade and improve the provision of services essential to firms’ growth. It is also necessary to eliminate the geographical disparities in the infrastructural endowment which – quite apart from considerations of fairness – threaten to engender systemic inefficiencies and make the whole of Italy less attractive for private investment.
• The process of redrawing the boundaries of public ownership and restructuring markets has encountered obstacles and delays. (…) Reform of regulation, tariffs, ownership structures and market boundaries in local public services remains of vital importance for the productive system, as does the resumption of liberalization in professional business services, retail trade, telecommunications, and energy generation and distribution.6
• The persistence of this phenomenon [small size of Italian firms in all branches of production] and the widening gap vis-à-vis the other European countries, even if compensated for by Italy’s characteristic industrial districts, indicate that various cultural, institutional and economic factors impede the growth of firms. The consequences of a fragmented productive structure are seen in the opportunities that go unexploited because of a sub-optimal scale of production and in Italian firms’ low propensity for innovation and, to a lesser extent, internationalization.
Attention focused also on the need to enhance the skills of the workforce to provide the flexibility and competences required to seize the opportunities offered by the new technologies and to maintain a high level of efficiency in the changing global economy. “…[in Italy] graduates in engineering and other scientific disciplines account for a smaller share of the total than in any
————— 5 The OECD (2000) also wrote: “Indeed, the fact that inflation in Italy is persistently above the EU average may point to a lack of
contestability in certain markets” and “Future growth prospects are highly dependent upon creating the conditions in which smaller firms can expand (…) The [current] system may perpetuate Italy’s trade specialisation in traditional, low R&D-intensive products…Unless their productive activities are highly specialised, small companies may encounter difficulties in exploiting economies of scale”.
6 In its recommendations to Italy, the OECD (2007b) suggested strengthening the liberalisation effort, in the light of increasing evidence that competition-restraining regulations may hamper TFP growth, and particularly the divesture programmes in the sectors of media, transportation and public utilities.
4 Antonio Bassanetti, Matteo Bugamelli, Sandro Momigliano, Roberto Sabbatini and Francesco Zollino
other leading industrial country. Investment in secondary and university education is indispensable if the technical and scientific training of the younger generation is to be improved with a view to reorganizing production processes in industry and especially in services.” (The Governor’s Concluding Remarks, 2003, p. 17).
Similar priorities were also addressed by a number of contributors to the public debate concerning the alleged “decline” of the Italian economy. In particular, Faini (2004) and Faini and Sapir (2005) claimed that neither the euro nor China’s entry into the WTO could be blamed for the unsatisfactory performance of the Italian economy; rather “the low supply of skilled labor nurtures an obsolete product specialization model. In turn, a size and sectoral structure biased toward small firms and traditional products depresses the demand for education, thus perpetuating the pattern of specialization”.
Subsequent empirical analyses confirmed that the factors identified at the beginning of the decade were the main ingredients for fostering competitiveness and growth, adding new elements to the debate. In particular, the Report on Trends in the Italian Productive System (Brandolini and Bugamelli, 2009)7 showed that the performance of the Italian productive system was negatively affected by the small average size of firms, the inadequate endowment of economic infrastructures (see also Banca d’Italia, 2011a) and the insufficient degree of competition in some non-tradable sectors (see also Bianco et al., 2012). The Report also stressed the key role of factors such as corporate governance, the tax system, the financial structure of Italian firms and specialized financial intermediaries in promoting economic growth and competitiveness.
Further analyses addressed the relationship between economic development and the weaknesses of the Italian civil justice system (Giacomelli and Menon, 2013). Investments in human capital and in the education system and their returns in terms of economic performance also received considerable attention; these investments are deemed complementary to those in ICT as they determine how far and how fast the introduction of new technologies at the firm level becomes fully beneficial to the user industries (Cipollone and Visco, 2007; Visco, 2009; OECD, 2009; Cipollone et al., 2012).
Regarding public finances, Balassone et al. (2002) pointed out the need to make close-to-balance budgets a permanent feature of Italian fiscal policy, while shifting the focus of budgetary policy from short-term deficit control to the traditional functions of stabilization, allocation and distribution. In this view it was recognized the importance of: i) designing a set of fiscal rules for local governments consistent with the increasingly decentralized public activities; ii) improving the quality of public services while maintaining tight expenditure control; and iii) reducing the high tax burden. The study also indicated that the pension reforms had to be completed in order to fully eliminate the increase in the expenditure-to-GDP ratio that was projected for the following decades and to reduce the negative spillovers on the labour market and on employment. This assessment was largely shared by the OECD (2007b) in its Economic Survey of Italy.
2 The “lost decade”: 1998-2007
In the period following the introduction of the euro, the performance of the Italian economy was disappointing, both from a historical perspective and compared with the main European countries, and Italy’s public finances experienced a phase of steady deterioration; nevertheless, policy actions largely failed to tackle the structural problems of the country.
————— 7 The Report collected the results of empirical studies carried out in the decade, reorganized in a unitary framework various analyses
of Italy’s growth deficit and derived indications for economic policy.

The Policy Response to Macroeconomic and Fiscal Imbalances in Italy in the Last Fifteen Years 5
2.1 Macroeconomic developments
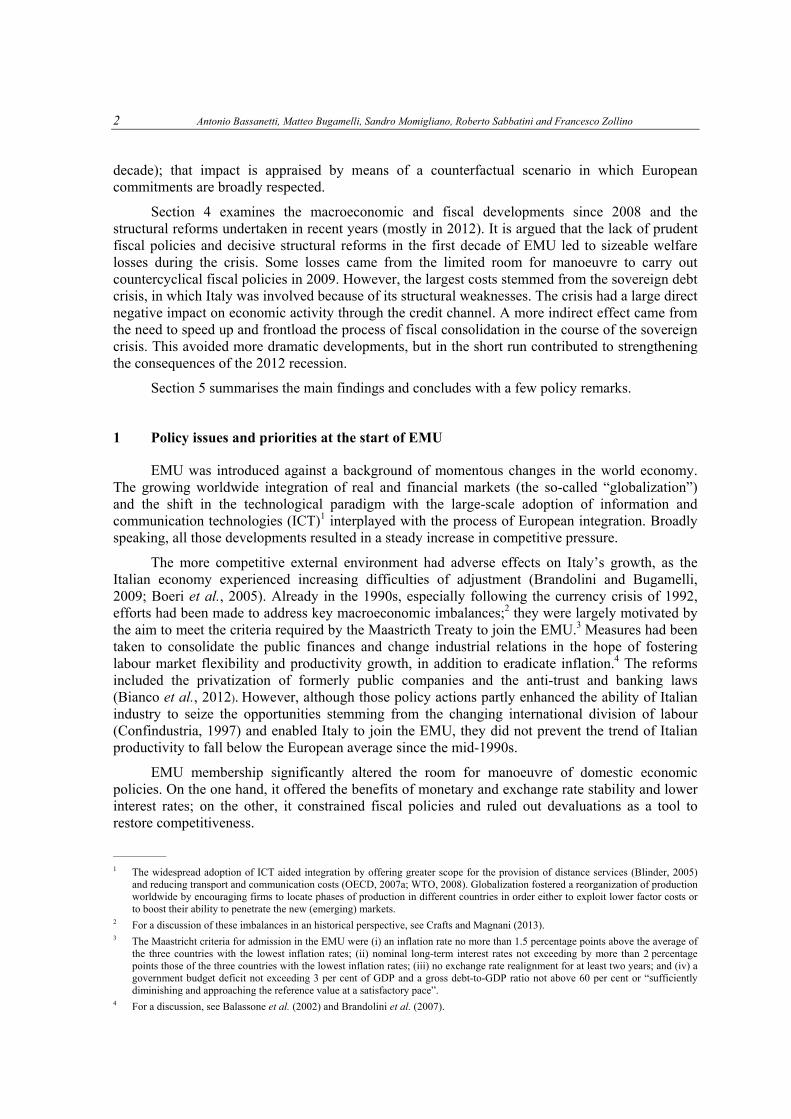
Between 1998 and 2007, the growth of Italy’s GDP averaged 1.5 per cent per year, against 2.3 in the euro area as a whole (Table 1). The annual growth rate of per capita GDP in Italy was half that of the previous 5 years and lagged behind the main advanced economies (Figure 1).
The weakness of the Italian economy was rather generalized across sectors, although it was particularly intense in manufacturing, more specifically in the production of transport equipment and in the traditional sectors where the country used to have a comparative advantage (textiles and clothing, leather products and footwear, and furniture; Accetturo et al., 2013). In 2007, Italian industrial production was only 5 per cent higher than in 1998, with a cumulative growth gap of 14 and 22 percentage points compared with the euro area and Germany respectively. Only the energy sector recorded positive rates of change throughout the period. The rates of increase in the value added of the construction sector and, to a lesser extent, of services were also high compared with industry in those years (2.5 and 1.4 per cent per year respectively).
The difficulties of the Italian industry in the new global competitive environment may be better grasped by focusing on two factors: stagnant productivity and loss of competitiveness in international markets. The first allows us to characterize these weaknesses more precisely and to narrow the scope of our analysis to the determinants of productive efficiency. The second suggests that the lack of growth is not merely a reflection of sluggish domestic demand, but should also be attributed to supply side flaws.
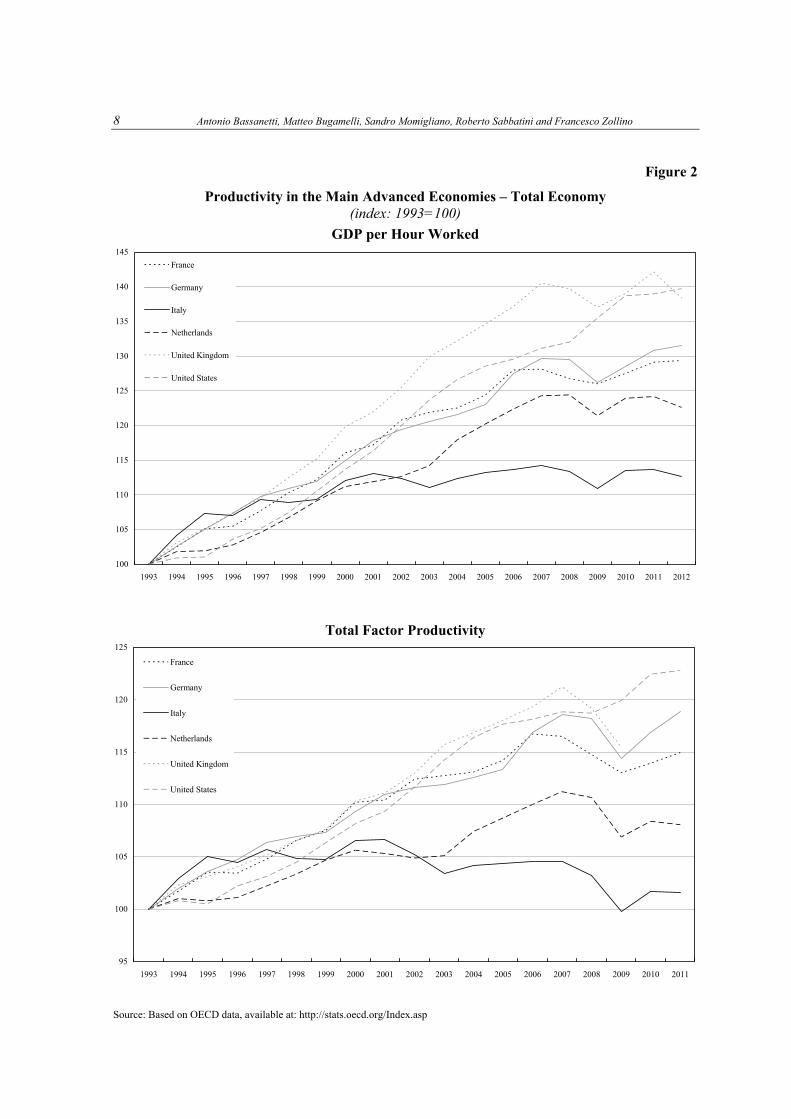
The dismal performance of productivity in Italy compared with the other main advanced economies is evident. The upper graph of Figure 2 shows the trends of labour productivity (GDP per hour worked) from 1993 to 2011 for France, Germany, Italy, United Kingdom and United States: Italy remained roughly in line with the other countries until 1997-8; from then onwards, it followed a lonely path of stagnation. In the period 1998-2007 labour productivity growth in the total economy averaged only 0.4 per cent per year, as opposed to 1.7 and 1.9 per cent in France and Germany.
A growth accounting exercise shows that in Italy the contribution of capital intensity to labour productivity has been positive, albeit less so than in the past, as a result of the shift towards relatively more labour-intensive techniques driven by greater flexibility in the use of labour. By contrast, the dynamics of total factor productivity (TFP; see the lower graph of Figure 2) suggest that the overall efficiency did not improve.
According to the most recent estimates of the OECD, between 1998 and 2007 TFP in Italy declined on average by 0.3 per cent per year, while it expanded by 0.8 and 1.2 per cent in France and Germany (Table 1). The fall in Italy was more pronounced in the industrial sector than in private services (Bassanetti and Zollino, 2008). Despite the high degree of approximation that surrounds the measurement and interpretation of TFP, which is calculated as a residual, its dynamics clearly suggest the presence of structural weaknesses of the productive system and the need to analyse the factors affecting the technical and organizational progress.
Notwithstanding the low rate of growth of GDP, total employment grew by almost 15 per cent, or by around 3 million units, in the decade. The corresponding increase in the employment rate (6.9 percentage points) was the highest among the four largest European economies;8 at the same time the unemployment rate declined progressively from about 11 to 6 per cent. The very positive performance of the Italian labour market was mostly due to the increased flexibility introduced in the 1990s; nevertheless, the widespread use of temporary
————— 8 In the same period, employment rates increased by 5.3, 4.3 and 1.3 percentage points respectively in Germany, France and the
United Kingdom.

6 Antonio Bassanetti, Matteo Bugamelli, Sandro Momigliano, Roberto Sabbatini and Francesco Zollino
Table 1
The Italian Economy 1991-2012 (average yearly growth rate in the periods)
1997 1998-2007 2008-2012
Italy
GDP 1.9 1.5 –1.4
Unit labour costs in total economy (1) 3.0 1.7 2.0
Total factor productivity (OECD) (2) 1.3 –0.3 –1.0
Competitiveness (1) (3) –0.9 6.6 –3.2
Inflation (HICP) 1.9 2.3 3.0
Germany
GDP 1.7 1.7 0.7
Unit labour costs in total economy (1) –1.3 –0.4 2.0
Total factor productivity (OECD) (2) 1.5 1.2 –0.6
Competitiveness (1) (3) –6.1 –1.2 –5.7
Inflation (HICP) 1.5 1.5 2.2
France
GDP 2.2 2.3 0.0
Unit labour costs in total economy (1) 0.0 1.6 2.2
Total factor productivity (OECD) (2) 1.4 0.8 –1.6
Competitiveness (1) (3) –5.1 1.9 –4.4
Inflation (HICP) 1.3 1.7 2.4
Euro Area
GDP 2.6 2.3 –0.3
Unit labour costs in total economy (4) n.a. 1.3 1.9
Total factor productivity (OECD) n.a. n.a. n.a.
Competitiveness (1) (3) –7.6 6.0 –7.1
Inflation (HICP) 1.6 2.0 2.6
Sources: Based on Istat, Eurostat, Bank of Italy and OECD data. (1) 2008-11. (2) 2008-10. (3) Cumulative change in the index of overall competitiveness based on producer prices; a positive value indicates a loss of competitiveness; 2008-11. (4) 2001-07 and 2008-11.
The Policy Response to Macroeconomic and Fiscal Imbalances in Italy in the Last Fifteen Years 7
Figure 1
GDP Per Capita in Main European Countries (index number: GDP per capita in US =100;
1990 prices; international dollars; purchasing power parity) Source: based on Eurostat data.
contracts might have had a negative impact on productivity growth owing to lower human capital accumulation, itself a result of shorter and unstable job matches (Lotti and Viviano, 2012).
The relatively poor performance of productivity led to a worsening of Italy’s price competitiveness. Examining producer prices of manufactures, between 1998 and 2007 the deterioration of Italian competitiveness amounted, in cumulative terms, to 6.6 per cent, against a loss of about 2 per cent in France and a moderate gain in Germany (Figure 3 and Table 1).9
The surplus on the current account of Italy’s balance of payments, which had peaked at about 4-5 per cent of GDP in the mid-1990s thanks to the depreciation of the currency and the weakness of domestic demand, was rapidly dissipated; in 2007 the current account recorded a deficit of about 1 per cent of GDP (Figure 4). This trend largely mirrored developments in merchandise trade, whose deterioration was led by the increasing deficit in the energy component; on the contrary, the trade of non-energy goods continued to record a rather stable surplus (about 3 per cent of GDP; see Cappariello et al., 2012).
————— 9 An alternative measure of competitiveness is based on unit labour costs (ULC) which, however, offer a partial and misleading
description as they fail to take into account any information on mark-ups and other sources of costs (Giordano and Zollino, 2013). In the years before the global recession, the average rise in the ULC-based indicator reached 2.6 per cent per year (up from 1.1 during the 1990s), compared with 1.9 in France; on the contrary, Germany experienced a decrease in ULC (–0.7 per cent) thanks in part to the significant moderation of labour costs.
50
55
60
65
70
75
80
1990 1991 1992 1993 1994 1995 1996 1997 1998 1999 2000 2001 2002 2003 2004 2005 2006 2007 2008 2009 2010 2011 2012
France
Germany
Italy
Spain
United Kingdom
8 Antonio Bassanetti, Matteo Bugamelli, Sandro Momigliano, Roberto Sabbatini and Francesco Zollino
Figure 2
Productivity in the Main Advanced Economies – Total Economy (index: 1993=100)
GDP per Hour Worked
Total Factor Productivity
Source: Based on OECD data, available at: http://stats.oecd.org/Index.asp
95
100
105
110
115
120
125
1993 1994 1995 1996 1997 1998 1999 2000 2001 2002 2003 2004 2005 2006 2007 2008 2009 2010 2011
France
Germany
Italy
Netherlands
United Kingdom
United States
100
105
110
115
120
125
130
135
140
145
1993 1994 1995 1996 1997 1998 1999 2000 2001 2002 2003 2004 2005 2006 2007 2008 2009 2010 2011 2012
France
Germany
Italy
Netherlands
United Kingdom
United States

The Policy Response to Macroeconomic and Fiscal Imbalances in Italy in the Last Fifteen Years 9
Figure 3
Price Competition in the Main Euro-area Countries (PPI-based Indicators) (indices: 2000=100)
Source: Banca d’Italia. An increase indicates a loss of competitiveness.
Figure 4
Italy’s Current Account Balance (percent of GDP)(1)
Source: Banca d’Italia and Istat. (1) For 2012, average of the first three quarters.
–5
–4
–3
–2
–1
0
1
2
3
4
5
6
1993 1994 1995 1996 1997 1998 1999 2000 2001 2002 2003 2004 2005 2006 2007 2008 2009 2010 2011 2012
goods services income current transfers current account goods net of energy
2012201120102009200820072006200520042003200220012000199919981997199619951994199319921991199090
100
110
120
130
Italy Germany France

10 Antonio Bassanetti, Matteo Bugamelli, Sandro Momigliano, Roberto Sabbatini and Francesco Zollino
Figure 5
World Export Market Shares (Goods) (index 1999=100)
Volumes
Values Source: Based on IMF data and National statistics.
50
60
70
80
90
100
110
120
1999 2000 2001 2002 2003 2004 2005 2006 2007 2008 2009 2010 2011 2012
Germany France Italy
50
60
70
80
90
100
110
120
1999 2000 2001 2002 2003 2004 2005 2006 2007 2008 2009 2010 2011 2012
Germany France Italy

The Policy Response to Macroeconomic and Fiscal Imbalances in Italy in the Last Fifteen Years 11
Table 2
World Export Market Shares (percentages)
Value Volume (1) Year
Italy Germany France Euro area (2) Italy Germany France Euro area (2)
1996-2000 4.2 9.2 5.2 30.8 4.5 8.8 4.8 30.1
2001-05 3.8 9.6 4.7 30.2 3.9 9.5 4.6 30.2
2006-10 3.3 9.3 3.8 27.5 3.3 9.7 3.9 28.1
2005 3.6 9.4 4.3 28.9 3.6 9.4 4.3 28.9
2006 3.5 9.4 4.0 28.2 3.5 9.7 4.1 28.9
2007 3.6 9.7 3.9 28.7 3.5 9.9 3.9 28.8
2008 3.4 9.3 3.8 27.6 3.4 9.9 3.8 28.3
2009 3.3 9.4 3.8 27.6 3.1 9.4 3.7 27.3
2010 2.9 8.6 3.4 25.2 3.1 9.5 3.7 27.1
2011 2.9 8.5 3.2 24.6 3.1 9.7 3.6 27.4
Sources: based on ECB, National Statistical Institutes and World Economic Outlook (WEO) data. (1) At constant prices and exchange rates, 2005. (2) Intra euro area trade is included.
The performance of Italian exports can be better assessed by considering the trend of their
share in world trade in goods (Figure 5 and Table 2). Estimated to average about 4.5 per cent in the second half of the 1990s, it has been declining since 1999, falling to 3 per cent by 2011. This trend was similar to that in France, but certainly worse than in Germany, whose exports have performed exceptionally well in the last ten years.10 The loss of competitiveness of Italian industry has affected its performance not only in foreign markets, but also in the domestic one, in particular in traditional sectors like textiles, clothing, shoes and leather products. Between 1999 and 2007, import penetration increased more rapidly than in France and German (Bassanetti et al., 2012a).
In the years leading up to the global crisis, the health of the Italian economy showed moderate signs of improvement: TFP stopped declining in the middle of the last decade; tentative positive signals for export and GDP growth emerged, even if modest compared with Italy’s main partners.
2.2 Fiscal developments
After 1997, Italy’s public finances entered a phase of rapid and continuous deterioration, partly masked by the decline in interest payments, the “dividend” of participation in EMU. The primary surplus, which stood at 6.6 per cent of GDP in 1997, was virtually nil in 2005. In 2006-7, ————— 10 The disadvantage of Italy and France with respect to Germany is mainly due to the poorer ability to penetrate new dynamic
emerging markets (mostly Asian ones, in particular China). In the case of Italy, this can be reconnected to the predominance of small firms that are incapable of paying the fixed costs required to enter such markets (Barba Navaretti et al., 2011).

12 Antonio Bassanetti, Matteo Bugamelli, Sandro Momigliano, Roberto Sabbatini and Francesco Zollino
following the opening in 2005 of the Excessive Deficit procedure for Italy, fiscal policy turned restrictive again and in 2007 the primary surplus reached 3.4 per cent of GDP, benefiting from the cyclical upturn.
It has been pointed out that the decrease in the primary balance, particularly in the initial years of EMU, can be better understood taking into account the legacy of the fiscal consolidation of the 1990s (Marino et al., 2008). In the initial years 1998-2005, more than half of the fall in the primary surplus was due to the reduction in revenue (which had increased sharply in the pre-EMU consolidation years); moreover, the growth in the expenditure-to-GDP ratio was concentrated in the areas on which the adjustment process of the 1990s relied most heavily, namely healthcare and capital expenditure, and where savings were achieved largely with spending ceilings and not with structural reforms.
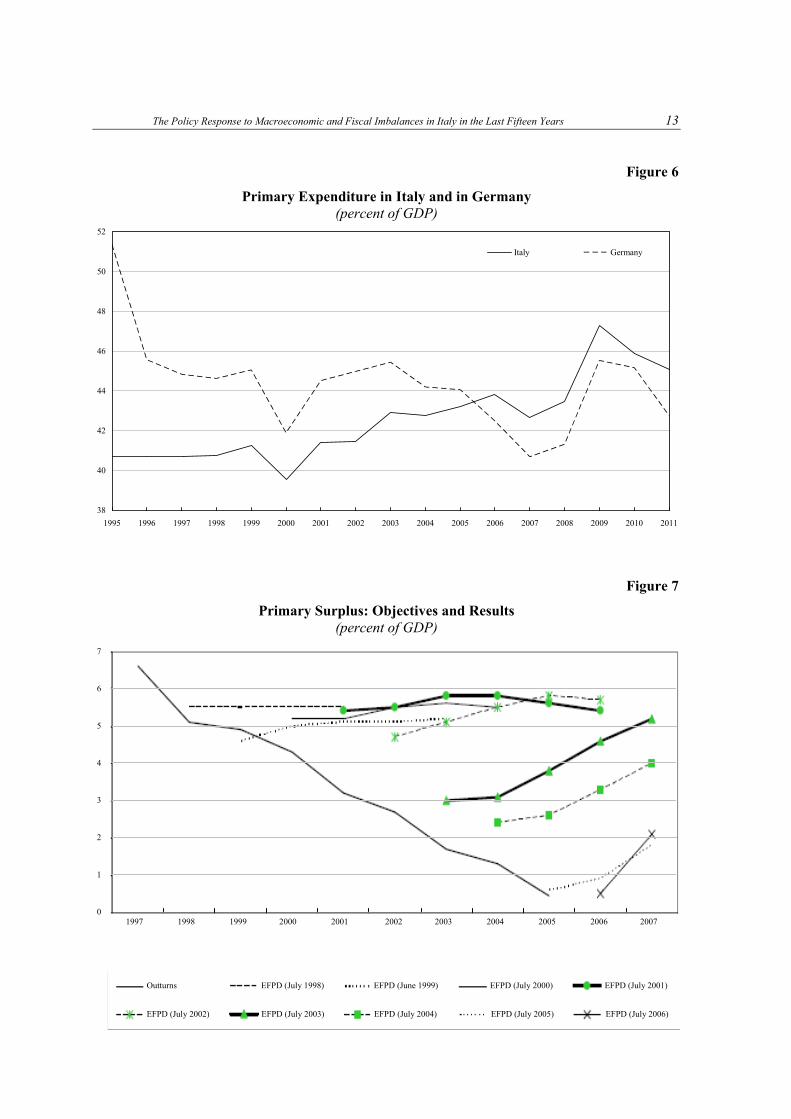
As the adjustment in the years 2006-7 was predominantly revenue-based, more than two-thirds of the deterioration in the primary balance in the decade 1998-07 is accounted for by the increase in primary expenditure as a share of GDP. The fast growth of primary expenditure in the decade contrasts starkly with the experience of Germany, where expenditure dynamics were extremely subdued throughout the decade. Figure 6 compares the primary expenditure ratio in the two countries. While in 1997 that ratio was 4.1 percentage points higher in Germany than in Italy, at the end of the decade it became higher in Italy by 2.1 percentage points.
Over the same period, the Italian public debt declined by 14.2 percentage points, to 103.3 per cent of GDP. Given the very high starting level, the modest reduction in the debt ratio did not meet the Treaty provision that it be “sufficiently diminishing and approaching the reference value at a satisfactory pace”. Moreover, approximately two-thirds of the reduction stemmed from extraordinary operations (including sales of assets and the conversion in 2002 of the bonds assigned to the Bank of Italy in 1994 to replace the overdraft on the Treasury’s current account with the Bank), which left the public sector net wealth unchanged (Momigliano and Rizza, 2007).
The decline in the primary surplus over the years 1998-2005 contrasts with the objectives set out in the medium-term official fiscal plans (Economic and Financial Planning Documents, EFPD) for those years: in all the plans published between 1998 and 2002, the primary surplus was targeted to remain constant at around 5 per cent of GDP and from 2003 it was set to gradually reach the same objective (Figure 7). It also contrasts with the provision embedded in the preventive arm of the Stability and Growth Pact to bring the budget close to balance in the medium term.
Balassone et al. (2011) examine the reasons for the large deviations of fiscal outturns from plans over the period (and in the previous decade). They point to three main factors. First, insufficient control of expenditure, as most slippage came from spending overruns. Second, various weaknesses in the institutional framework, among which the lack of mechanisms to ensure that slippages in one year were promptly compensated for in the subsequent years. Third, government macroeconomic forecasts proved rather optimistic, though other forecasters also tended to overestimate growth.11
2.3 The policy response
Notwithstanding the unsatisfactory performance of the Italian economy, during the “lost decade” policy actions in Italy largely failed to tackle the country’s structural problems.
————— 11 The cumulative growth forecast over t+1 and t+2 in the Economic and Financial Planning Documents presented by the government
in the years 1998-2005 was, on average, 0.9 percentage points higher than in the European Commission autumn forecasts, which, in turn, was 1.3 points higher than the outturns.
The Policy Response to Macroeconomic and Fiscal Imbalances in Italy in the Last Fifteen Years 13
Figure 6
Primary Expenditure in Italy and in Germany (percent of GDP)
Figure 7
Primary Surplus: Objectives and Results (percent of GDP)
7
6
5
4
3
2
1
0 1997 1998 1999 2000 2001 2002 2003 2004 2005 2006 2007
Outturns EFPD (July 1998) EFPD (June 1999) EFPD (July 2000) EFPD (July 2001)
EFPD (July 2002) EFPD (July 2003) EFPD (July 2004) EFPD (July 2005) EFPD (July 2006)
38
40
42
44
46
48
50
52
1995 1996 1997 1998 1999 2000 2001 2002 2003 2004 2005 2006 2007 2008 2009 2010 2011
Italy Germany

14 Antonio Bassanetti, Matteo Bugamelli, Sandro Momigliano, Roberto Sabbatini and Francesco Zollino
In the area of education, despite a steady increase Italy continued to lag behind its main European partners in terms of human capital accumulation, both in quantitative and qualitative terms. In the early 2000s, the proportion of the Italian population aged 25 to 64 with post-secondary education was 12 per cent, less than half the average figure for the OECD countries. Graduates in engineering and other scientific disciplines accounted for a smaller share of the total than in any other leading industrial country. More generally, the Italian education system was characterized by a difficult transition from high school to university; high university drop-out rates; and large geographical discrepancies in students’ achievements. The educational system was progressively less able to provide the skills required in a quickly changing environment. At the upper secondary level, inefficient allocation mechanisms of teachers were compounded by increasingly weak standards. Comprehensive reforms, albeit hotly debated, remained pending for a long time; the evolution of the Italian educational system was the result of a patchwork of partial changes, sometimes reversed and whose targets were not fully spelled out, lacking regular monitoring and an evaluation of the actual effects (Bertola and Sestito, 2012; Cipollone et al., 2012).
Concerning the labour market, as mentioned above, its positive performance in the decade reflected major changes in the institutional framework, largely introduced in the 1990s, which contributed to wage growth moderation.12 Further actions increased the degree of flexibility in labour utilization but were not part of a comprehensive labour market reform. Law 196/1997 (which entered into force in 1998) abolished the ban on agency work, promoted the spread of part-time work and apprenticeship, and liberalized private employment services. Law 30/2003 introduced new flexible contracts (job on call, work-sharing, staff leasing), further liberalizing the use of apprenticeship contracts and increasing the flexibility of part-time work.
These reforms were effective in promoting flexible forms of employment (Brandolini and Bugamelli, 2009): fixed-term work made up about two-fifths of the 2.65 million additional salaried jobs created between 1998 and 2007. However, the increase of labour flexibility was the result of widespread use of atypical contracts, while employment protection on open-ended ones was not modified. As a consequence, workers on temporary contracts had to bear the brunt of the adjustment during economic downturns.
The welfare system was not modified to accommodate the greater flexibility: the coverage of ordinary unemployment benefit schemes remained low both in terms of replacement rates and duration, with workers on atypical contracts often failing to meet the entitlement criteria (Bobbio et al., 2011). As a consequence, workers more likely to experience job losses were also less protected by income stabilizers. The lack of effectiveness of active labour market policies at local level, and the poor integration between these and the centrally-operated income support schemes also prevented smooth transitions into and out of employment, efficient job matching, and the rigorous application of conditionality criteria which should force unemployed workers to actively look for a job when receiving unemployment benefits.
Lower social security contributions for some categories of atypical contracts – such as quasi-employees13 and apprentices – and, in general, greater job instability exposed the workers to the risk of not contributing enough to their pension funds, thus building up a long-term problem of inadequate pension entitlements.
————— 12 The reform of the collective bargaining system that took place in 1992-3 had abolished the wage indexation mechanism, by which a
substantial fraction of past inflation was transferred to wages, and introduced a forward-looking mechanism in which pay rises were set according to the government’s expected inflation rate, thus preventing wage-price spirals (see Brandolini et al., 2007).
13 “Quasi-employees” (para-subordinati) are defined as formally self-employed workers actually working for a single contractor at his premises and during pre-determined hours.

The Policy Response to Macroeconomic and Fiscal Imbalances in Italy in the Last Fifteen Years 15
All in all, the lack of a comprehensive reform tackling the growing labour market duality and the fragmentation of unemployment benefits contributed to a build up of structural problems that were partially addressed only by the recent Law 92/2012.
As for the “doing business environment”, lack of competition in various sectors, stifling regulations, high administrative burdens and inadequate contract enforcement remained important negative features of Italy throughout the decade (Bianco, Giacomelli and Rodano, 2012). Despite the measures taken, the overall reform effort in these area was largely inadequate.
In particular, in a number of sectors the level of competition failed to increase significantly (Bianco, Giacomelli and Rodano, 2012). This lack of improvement was caused by an inadequate regulatory design and by the frequent changes in legislation, together with often insufficiently independent regulatory authorities. Some progress was made in the regulation of retail and professional services with the removal of a few barriers; however, the reform was largely incomplete, so that regulation in professional services remained far more stringent than in the leading European economies. In local public services, partly because of the uncertainty of the national legislative framework, the transformation that started in the mid-1990s did not produce any effective modernization. In particular, southern regions clearly lag behind the others in terms of both management and quality of the services supplied.
Despite repeated corrective measures, the working of the civil justice system remained, and remains, inadequate. The excessive length of proceedings hinders the effective resolution of disputes, with serious repercussions for the efficient functioning of the markets. The problems stem primarily from shortcomings in the management of resources, whose amount is not lower than in the other European countries, and from excessive litigation (Banca d’Italia, 2007).
No major steps forward were made in reducing the administrative burdens for firms, or simplifying the procedures for starting business activities. In 2005 the European Commission estimated the costs of administrative burdens at 4.6 per cent of GDP in Italy, compared with the EU average of 3.5 per cent.
In the area of public finances, the decade 1998-2007 witnessed further – but not conclusive – reforms to the pension system. In particular, requirements for seniority pensions were gradually tightened, though new rules did still allow workers to retire relatively early compared with other European countries. The large problem posed by the excessive length of the transition to the new rules introduced by the 1992-5 reforms, far less generous to retirees than the previous system, was not tackled (Fornero, 2008).14 Overall, the actions taken in this area had the effect of delaying – but not significantly lowering – the expected increase in the pension expenditure to GDP ratio in the decades to come (Morcaldo, 2007).
In the health sector, expenditure overruns remained frequent at the beginning of the decade (in particular, in the Centre and South of the country) and the central government repeatedly transferred ex post additional resources to finance deficits (on this “soft budget constraint” see Caroppo and Turati, 2007, and references therein, and Bordignon and Turati, 2009). In 2006 a strong link between spending and financing responsibilities was established with the introduction of automatic mechanisms that raised local taxation and increased central control over the regional decision process in the event of spending overruns. However, significant spending gaps between regions, not ascribable to the characteristics of the population, persisted. Overall, the actions taken helped to keep spending dynamics under control, but the challenge of increasing efficiency in the weak-performance regions remained.
————— 14 Until 2015 (2033), initial pensions at retirement will be entirely (partially) calculated on the basis of the system in place before the
reforms.

16 Antonio Bassanetti, Matteo Bugamelli, Sandro Momigliano, Roberto Sabbatini and Francesco Zollino
A constitutional reform in 2001 conferred some pronounced federalist features on Italy’s institutional system: the matters falling within central government legislative power were explicitly listed and all unmentioned functions were left to the sole jurisdiction of the Regions. However, it was not until 2009 that a framework law laid down the fundamental principles of Italian fiscal federalism and the constitutional change was actually implemented. The reform created substantial institutional uncertainty, as testified by the surge in controversies opposing different layers of government brought to the Constitutional Court.
Concerning revenues, most of the 1998-2007 decade was characterized by a reduction of the tax burden. Nevertheless, in 2006-7 the process was reversed and eventually the 2007 tax burden (at 42.7 per cent of GDP) was only 0.7 percentage points lower than that of 1997. Then, as now, the Italian system featured a high fiscal burden on labour.
3 Why were no reforms introduced?
As argued in the previous section, notwithstanding the serious and documented dysfunctions in several areas, the much-needed reforms were either not introduced or were largely ineffective.
A comprehensive explanation of the difficulties involved in undertaking radical reforms in Italy in recent decades is put forward in Craft and Magnani (2013). The authors identify the main culprit as a long-standing feature of Italian society, i.e., the existence and severity of conflicts between opposing groups and parties, and the associated lack of a policy vision that went beyond them to look at the country as a whole.15 They conjecture that the lack of political leadership and the stronger influence of interest groups also had a negative influence on the effectiveness of the public administration and the quality of public services, both essential elements for growth.16 Moreover, they argue that Italian firms were unable to react to the new challenges partly because of the closed corporate governance structures centred on family-controlled and pyramidal groups. Indeed, it is a widely shared view that there is a historically-rooted relative lack of large private firms in Italy compared with other major European countries (Amatori, Bugamelli and Colli, 2013); this, in turn, creates a greater need for supply-side policy reforms than elsewhere.17
In addition to the limited contendibility of firms, it can be argued that the persistence of blocks of vested interests was aided by a persistently scarce social mobility. As for education achievements, in the early 2000s the probability of obtaining a university degree was still much greater for students with graduate parents than for those whose parents had only completed lower secondary school (Checchi and Zollino, 2001). Social stratification and lack of meritocracy ranked high in Italy also with regard to occupations and earnings (Schizzerotto and Marzadaro, 2008; OECD, 2010).
In the following we argue that several factors masked the difficulties of the productive system: the greater availability of low cost of credit to Italian households, as well as the rapid increase in their wealth, which sustained consumption; the growth in employment, which presumably mitigated the perceived urgency of reforms; the good performance of the construction sector and the relatively relaxed fiscal policy, which supported economic activity; the concomitant ————— 15 The demise of ideologies, after the fall of the Berlin Wall, paradoxically worsened the situation, as many consolidated interest
groups emerged and proliferated, each seeking to gain rents at the expense of the others. 16 The relationship between political institutions and the working of the economy has a sound tradition in economic literature (Persson
and Tabellini, 2004); the evidence for Italy suggests that easy solutions in terms of institutional engineering do not exist. An example is provided by the first-past-the-post voting system introduced in 1993, in force until 2005, which was not successful in guaranteeing the stability and effectiveness of governments.
17 The importance of state-owned enterprises between the 1930s and the 1990s – a unique case in Western Europe – indirectly reflects this fact.

The Policy Response to Macroeconomic and Fiscal Imbalances in Italy in the Last Fifteen Years 17
slow growth in Germany, which alleviated concerns about the performance of Italian economy (“two in distress make sorrow less”); and the lack of concern on the part of the financial markets over the structural deficiencies of the Italian economy and the continuing high public debt, not substituted by effective European rules. We discuss these factors in detail below.
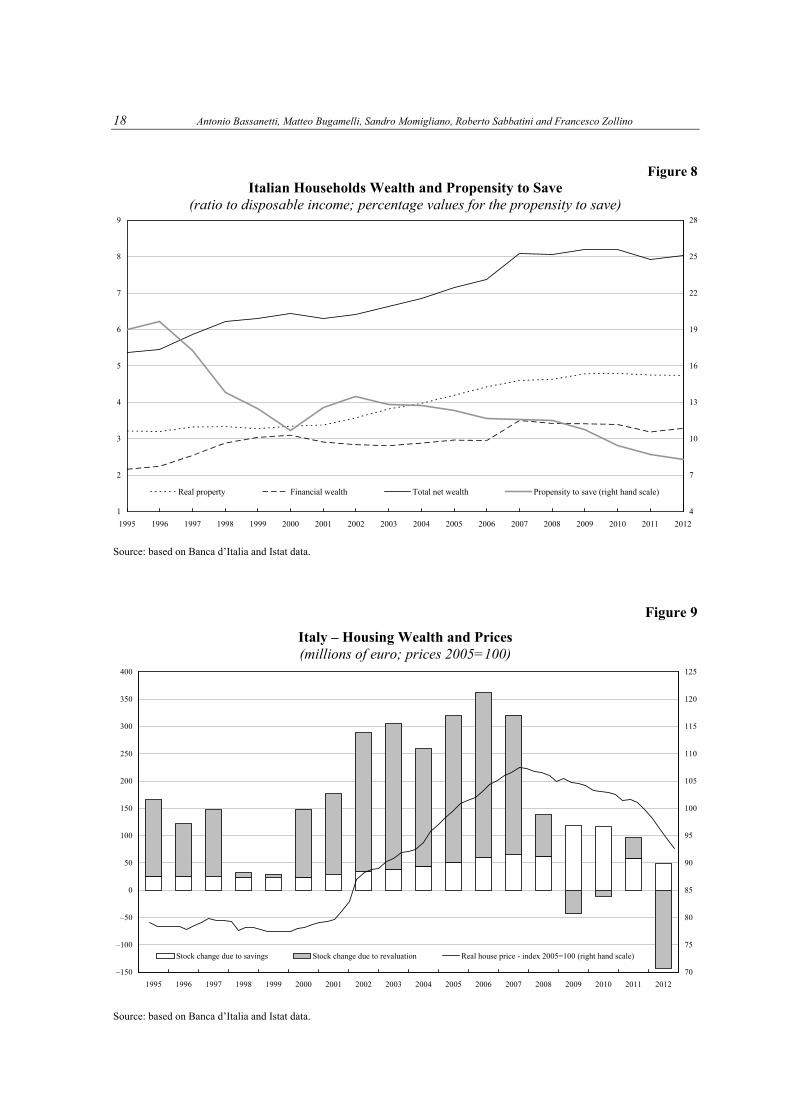
The start of EMU brought Italian households a swift decline in the cost of borrowing and further integration in capital markets. Between 1998 and 2007, the stock of consumer credit more than doubled, reaching 12 per cent of total household expenditure in 2007. This marked an important break with respect to the past, when the imperfection of capital markets had long contributed to high saving levels (Bassanetti et al., 2012b). At the same time, the total stock of mortgages rose from about 5 to 32 per cent of total consumption. The propensity to save, which was still slightly above 18 per cent of households’ disposable income in 1997, stood at around 13 per cent in the mid-2000s (Figure 8). As a consequence, consumption expenditure in the decade increased notwithstanding the virtual stagnation of per capita disposable income.
In 1998-2007, the value of the Italian households’ wealth progressively rose from 6.2 to 7.4 times disposable income, among the highest ratios of the advanced economies. The positive trend was largely concentrated in real property, whose value increased in the period from 3.3 to 4.4 times disposable income. In turn, the largest contribution came from dwelling re-evaluation, spurred by buoyant housing markets (Figure 9): between 1999 and 2007, house prices surged cumulatively by 36 per cent in real terms.18
The higher wealth-to-income ratio could have, on one side, further reduced the need for savings at the aggregate level, and on the other contributed to a broad perception of improved welfare, considering that house ownership rates progressively increased, reaching almost 75 per cent in 2008. According to recent estimates of the propensity to consume out of housing wealth in Italy (Bassanetti and Zollino, 2010), this would have provided a significant support to private consumption, leading to a positive contribution to GDP of around 0.1 percentage points per year.
Moreover, the increasing demand for housing, together with the fiscal incentives to promote the renovation of old buildings in force since late 1990s, prompted a cyclical upturn in construction activity at the inception of EMU, inverting the declining trend of the previous decade. Between 1999 and 2007, the volume of residential investments grew on average by 3.4 per cent per year. The prolonged expansion of the building sector made the slowdown of the Italian economy somewhat less severe, as it contributed 0.3 percentage points per year to GDP growth.
It can be estimated that fiscal policy (assessed against a counterfactual simulation in which European rules were broadly respected) also had an average positive impact on growth of about 0.2 percentage points per year over the decade (see Section 3.1 below), against the background, until recently, of lack of feedback from fiscal outcomes to the cost of financing. As mentioned above, the primary surplus declined sharply despite the commitment taken at the ECOFIN Council in March 1998 to hold it equal to or above 5 per cent of GDP.19 Notwithstanding the fall in interest payments resulting from lower borrowing rates, net borrowing exceeded the 3 per cent threshold for six years in a row between 2001 and 2006.20 It is worth remembering in this connection that European rules not only prohibit any overshooting of that threshold, but also require a balanced budget to be reached and maintained in the medium term.
————— 18 The sharp rise in house prices during the period mostly mirrored the development of fundamentals, including greater credit
availability and population growth, with no evidence of misalignments (Nobili and Zollino, 2012). 19 Corriere della Sera, March 22, 1998. 20 The Excessive Deficit Procedure only started for Italy in 2005 because the excess deficit in the initial years emerged only some time
afterwards, on the basis of statistical revisions.
18 Antonio Bassanetti, Matteo Bugamelli, Sandro Momigliano, Roberto Sabbatini and Francesco Zollino
Figure 8 Italian Households Wealth and Propensity to Save
(ratio to disposable income; percentage values for the propensity to save)
Source: based on Banca d’Italia and Istat data.
Figure 9
Italy – Housing Wealth and Prices (millions of euro; prices 2005=100)
Source: based on Banca d’Italia and Istat data.
1
2
3
4
5
6
7
8
9
1995 1996 1997 1998 1999 2000 2001 2002 2003 2004 2005 2006 2007 2008 2009 2010 2011 2012
4
7
10
13
16
19
22
25
28
Real property Financial wealth Total net wealth Propensity to save (right hand scale)
–150
–100
–50
0
50
100
150
200
250
300
350
400
1995 1996 1997 1998 1999 2000 2001 2002 2003 2004 2005 2006 2007 2008 2009 2010 2011 2012
70
75
80
85
90
95
100
105
110
115
120
125
Stock change due to savings Stock change due to revaluation Real house price - index 2005=100 (right hand scale)

The Policy Response to Macroeconomic and Fiscal Imbalances in Italy in the Last Fifteen Years 19
Figure 10
GDP in Italy and Germany (levels; 1997=100)
Source: Eurostat.
Between 1998 and 2007 the overall effect of contingent factors, primarily the upturn in
construction and the somewhat relaxed fiscal policy, was to support economic growth by 0.6 percentage points per year; without this stimulus GDP growth would have been below 1 per cent.
The steady improvements in labour market conditions probably helped to conceal the urgent need for reforms from policy-makers and the general public, overshadowing the increasing disparities across classes of workers, with a possibly negative impact on human capital accumulation and activity growth in a medium-term perspective.
Germany has traditionally been viewed as a sort of benchmark for Italy because of the size of the industrial sector and the export vocation common to the two economies. From the launch of monetary union to the eve of the global crisis, average GDP growth in Germany was broadly in line with that recorded in Italy and much lower than the euro-area average (Sabbatini and Zollino, 2010; Figure 10). However, the driving forces underlying such relatively low growth in the two countries were rather different. In Germany the subdued growth largely reflected the measures taken to correct the fiscal imbalances generated by national unification and the efforts to modernize the economy through the introduction of deep structural reforms; the resulting sluggishness in domestic demand was partly mitigated by the robust expansion of exports, at much higher rates than in the euro area as a whole. The reform process undertaken in Germany in those years put the country in a more favourable position to react to the global crisis.
Moreover, since Germany is the largest foreign destination market of Italian products and its productive system is strongly integrated with that of Italy, sluggish domestic demand in Germany seemed to provide a reasonable explanation for the relatively slow growth of Italian exports.
At the start of EMU, financial market pressure to correct macroeconomic and fiscal imbalances – the so-called “market discipline” – lost strength. For Italy and other EMU members,
95
100
105
110
115
120
125
1997 1998 1999 2000 2001 2002 2003 2004 2005 2006 2007 2008 2009 2010 2011 2012 2013
Italy Germany

20 Antonio Bassanetti, Matteo Bugamelli, Sandro Momigliano, Roberto Sabbatini and Francesco Zollino
financial markets seemed to ignore fundamentals (Giordano et al., 2013); in the case of Italy, in particular, they appeared not to take notice of the persistently dismal outlook for economic growth and the sluggish reduction of the debt from the very high level reached in the mid-1990s. The yield spread between Italian ten-year government bonds and German Bunds barely moved during the mild recession of the early-2000s and never exceeded 50 basis points until Spring 2008.
At the same time, the European fiscal rules, which were designed precisely to address this failure of the markets (already in 1989 the Delors Committee acknowledged that “constraints imposed by market forces might either be too slow and weak or too sudden and disruptive”), proved ineffective not only for Italy. Particularly significant for a high debt country like Italy was the lack of enforcement of the debt rule. Moreover, the absence of adequate incentive mechanisms (based on penalties and rewards) in the preventive arm of the SGP did not encourage countries to build up adequate buffers in good times.
Finally, one additional factor may have weighed on the (un-)willingness to undertake the necessary reforms. There was a widespread and unwarranted belief among Italian households that the introduction of the euro in January 2002 was the cause of a substantial loss of purchasing power and of the perceived increasing risk of impoverishment (Del Giovane and Sabbatini, 2008). This belief contributed to a misperception of the gravity of the structural problems of the Italian economy.
3.1 The effects of fiscal policy on growth in the decade 1998-2007
To make an approximate quantitative assessment of the boost to economic activity coming from fiscal policy in the decade 1998-2007 we design a mechanical counterfactual simulation in which public finances broadly comply with European rules while the other features of the economy remain unchanged.
In the simulation, carried out using the quarterly econometric model of the Bank of Italy (BIQM),21 we assume a permanent fiscal adjustment in the years 2001-3 equal ex ante to 1 per cent of GDP each year.22 The correction is evenly split between revenue and expenditure, largely undoing some major reductions (increases) in specific components of revenue (expenditure) that occurred during those years.23
In the simulation, the average fiscal stance in the decade can be described as slightly expansionary: the tax burden remains broadly constant between 1997 and 2007, while there is still a sizeable increase in the ratio to GDP of primary spending (a result which stays if the historical values of GDP are used in the ratio, instead of the simulated ones).
————— 21 The long-term properties of BIQM (see Busetti, Locarno and Monteforte, 2005) are consistent with a neoclassical model postulating
exogenous growth, in which full employment of factors is accompanied by a constant rate of inflation, hence by constant relative prices. The levels of output and of employment of capital and labour are consistent with the parameters of the aggregate production function and with relative factor costs. The steady-state growth path of the model, stemming from technical progress and the accumulation of real and financial wealth, interacts with the dynamics of the adjustment process to determine short-term characteristics. The adjustment processes essentially reflect three factors: the stickiness of prices and wages, which prevents their immediate adaptation to the situation of full resource utilization; the non-malleability of installed physical capital, which hampers the short-term changes of the relative composition of productive factors; and the possibility that expectations and outcomes may not coincide. In the short run (and to some extent also in the medium term), therefore, given these rigidities, the characteristics of the model fit the Keynesian framework in which the level of output is determined by the trend in aggregate demand, in a situation of oversupply in both the goods and the labour market.
22 We impose that the adjustment starts in 2001 because the primary surplus remains close to 5 per cent of GDP until 2000. 23 In particular, we increase indirect taxes in 2001 (offsetting their fall of 0.5 percentage points of GDP in that year) and direct taxes in
2002 (excluding their dip by 0.9 percentage points of GDP); as for expenditure, we permanently reduce both purchases of goods and personnel costs by 0.1 percentage points of GDP every year of the 2001-03 period; the remaining adjustment is on monetary transfers.
The Policy Response to Macroeconomic and Fiscal Imbalances in Italy in the Last Fifteen Years 21
We assume unchanged historical values for the (nominal) exchange rate and nominal short-term interest rates. These assumptions are broadly justified by the presence of the monetary union and by the fact that in the course of the decade sovereign risk premiums failed to react to national macroeconomic and public finance conditions.
As a consequence of the fiscal correction in 2001-3, the deficit does not exceed 3 per cent of GDP in any year of the simulation period, although in 2005 it comes close to the threshold (2.3 per cent). At the end of the period, the two commitments taken by Italy with the Stability and Growth Pact and at the ECOFIN Council in March 1998 are both met: a balanced budget (more exactly, a surplus of 0.3 per cent of GDP) is achieved and the primary surplus again reaches approximately 5 per cent of GDP. The Italian public debt also declines at almost double the rate seen at any time in the past and reaches 93.3 per cent of GDP in 2007; the reduction of more than 2 percentage points per year would have been broadly consistent with the “satisfactory pace” towards the reference value of the debt ratio required by the Treaty on the Functioning of the European Union.
The simulation points to sizeable output costs of the fiscal correction: in 2007 real GDP would have been 2.6 per cent below its historical value (Table 3).24 The negative impact on internal demand is stronger, with a cumulative effect of about 4.3 per cent for private consumption and 3.3 per cent for investment. In 2007 the current account of the balance of payments would have been approximately balanced, against a historical deficit close to 1 per cent of GDP. The more subdued dynamics of output explain why, at the end of the decade, the primary surplus turns out to be only 1.6 percentage points of GDP higher than in the past (5.0 against 3.4 per cent) after the permanent correction of 3 points of GDP: the ex ante effects are approximately halved by the feedback to the budget from the economy. On the other hand, there are savings on interest expenditure due to the lower debt level; overall, net borrowing is 1.9 points below the historical outturn.
Carrying out the same counterfactual simulation with the DSGE model also currently used for policy evaluation at the Bank of Italy,25 the output costs of the assumed fiscal correction are slightly smaller, at 1.6 per cent of GDP in 2007.26 Largely as a consequence of this difference, in 2007 the primary surplus is 2.3 percentage points of GDP above the level it actually reached (instead of 1.6 points), while net borrowing is lower by 2.7 points (1.9): a surplus of approximately 1 per cent of GDP is achieved. Finally, the debt ratio falls more rapidly, to below 90 per cent of GDP in 2007.
4 The double-dip recession: 2008-13
The encouraging signals of structural adjustment in the Italian economy present since the middle of the last decade, and attributable mostly to the reactions of some firms to the new
————— 24 Given the consumption-smoothing behaviour of the households incorporated in the model, there are lagged effects on output of the
consolidation which exceed the horizon of the simulation. Cumulatively, they can be quantified at approximately 0.3-0.4 percentage points.
25 This is a three-country model of Italy, the rest of the euro area and the rest of the world. The first two regions share the same monetary policy and currency. On top of the usual New Keynesian features, the model of each region has been augmented with tradable and non-tradable goods, non-Ricardian consumers and a very detailed fiscal sector. In particular, the model features distortionary taxes (on labour income, capital income and consumption), public expenditure and public debt (Forni, Gerali and Pisani, 2010; Locarno, Notarpietro and Pisani, 2013).
26 The values of fiscal multipliers in the BIQM and in the DSGE currently used at the Bank of Italy vary depending on the budget item, the time horizon and the persistence of the shock. In the BIQM and in the case of purchases of goods and services, the multiplier slightly exceeds 1 in the first years of the shock; in the case of monetary transfers, taxes and social contributions, the multipliers tend to be close to 0.2 in the first year and increase over time. These values are broadly consistent with the estimate in the October 2008 IMF World Economic Outlook of an average multiplier of 0.5 within three years for changes in primary balance.

22 Antonio Bassanetti, Matteo Bugamelli, Sandro Momigliano, Roberto Sabbatini and Francesco Zollino
Table 3
If Fiscal Policy Had Been Broadly Compliant with European Rules: A Counterfactual Simulation with the BIQM
(deviations from baseline)
Item 2001 2002 2003 2004 2005 2006 2007 2008
Net borrowing (ratio to GDP)
Historical data 3.1 3.1 3.6 3.5 4.4 3.4 1.6 2.7
Deviation from baseline –1.0 –1.8 –2.6 –2.3 –2.2 –2.1 –1.9 –1.9
Primary balance (ratio to GDP)
Historical data 3.1 2.5 1.5 1.2 0.2 1.2 3.4 2.5
Deviation from baseline 1.0 1.7 2.5 2.1 1.9 1.85 1.6 1.5
Public debt (ratio to GDP)
Historical data 108.3 105.4 104.1 103.7 105.7 106.3 103.3 106.1
Deviation from baseline –1.2 –2.5 –4.2 –5.9 –7.4 –8.7 –10.0 –11.3
GDP growth (percent)
Historical data 1.9 0.5 0.0 1.7 0.9 2.2 1.7 –1.2
Deviation from baseline –0.3 –0.5 –0.6 –0.4 –0.4 –0.3 –0.2 –0.1
GDP nominal growth (percent)
Historical data 4.8 3.7 3.1 4.2 2.8 3.9 4.1 1.3
Deviation from baseline 0.2 –0.5 –0.8 –0.6 –0.5 –0.4 –0.4 –0.4
Private consumption growth (percent)
Historical data 0.7 0.1 0.9 0.8 1.2 1.3 1.1 –0.8
Deviation from baseline –0.4 –0.6 –0.9 –0.8 –0.7 –0.5 –0.4 –0.3
Private investments growth (percent)
Historical data 2.4 3.3 –1.0 1.2 1.9 3.7 1.3 –3.8
Deviation from baseline –0.2 –0.5 –0.6 –0.7 –0.6 –0.5 –0.4 –0.3
BOP current account surplus (ratio to GDP)
Historical data 0.3 –0.4 –0.8 –0.3 –0.9 –1.5 –1.3 –2.9
Deviation from baseline 0.2 0.4 0.6 0.8 0.9 1.0 1.1 1.0
Unemployment rate (percent)
Historical data 9.0 8.5 8.4 8.0 7.7 6.8 6.1 6.7
Deviation from baseline 0.0 0.0 0.1 0.2 0.2 0.2 0.3 0.4
The Policy Response to Macroeconomic and Fiscal Imbalances in Italy in the Last Fifteen Years 23
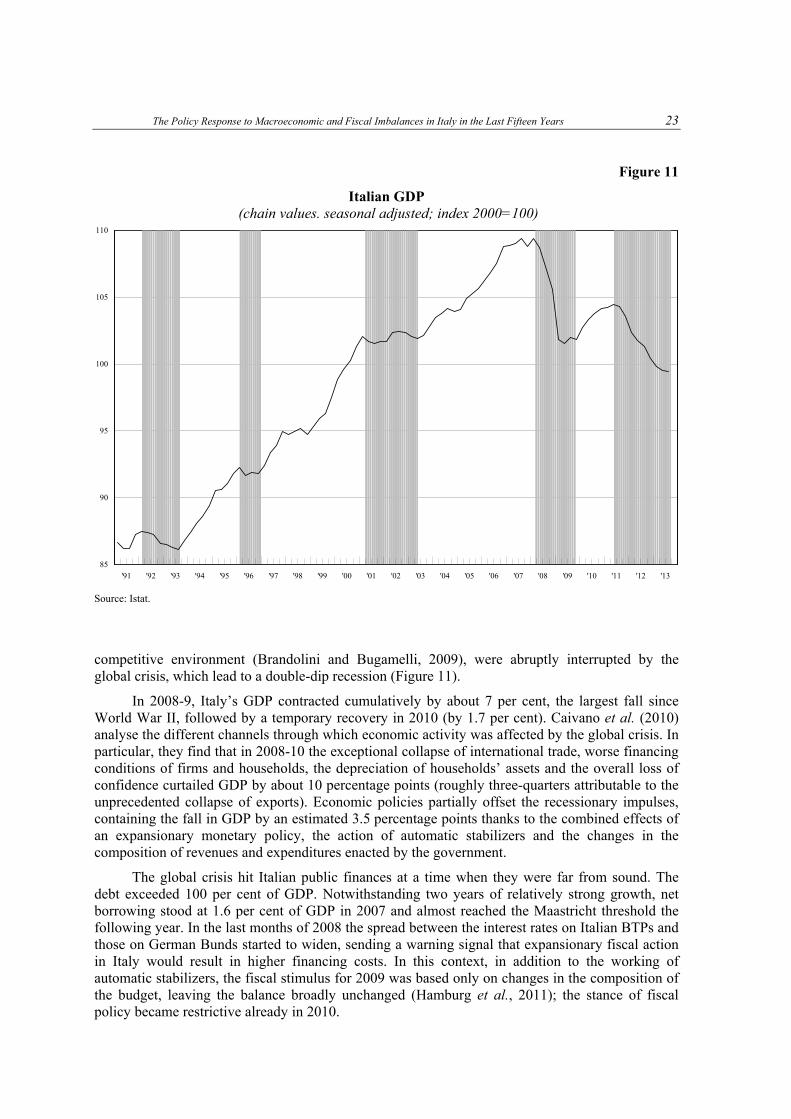
Figure 11
Italian GDP (chain values. seasonal adjusted; index 2000=100)
Source: Istat.
competitive environment (Brandolini and Bugamelli, 2009), were abruptly interrupted by the global crisis, which lead to a double-dip recession (Figure 11).
In 2008-9, Italy’s GDP contracted cumulatively by about 7 per cent, the largest fall since World War II, followed by a temporary recovery in 2010 (by 1.7 per cent). Caivano et al. (2010) analyse the different channels through which economic activity was affected by the global crisis. In particular, they find that in 2008-10 the exceptional collapse of international trade, worse financing conditions of firms and households, the depreciation of households’ assets and the overall loss of confidence curtailed GDP by about 10 percentage points (roughly three-quarters attributable to the unprecedented collapse of exports). Economic policies partially offset the recessionary impulses, containing the fall in GDP by an estimated 3.5 percentage points thanks to the combined effects of an expansionary monetary policy, the action of automatic stabilizers and the changes in the composition of revenues and expenditures enacted by the government.
The global crisis hit Italian public finances at a time when they were far from sound. The debt exceeded 100 per cent of GDP. Notwithstanding two years of relatively strong growth, net borrowing stood at 1.6 per cent of GDP in 2007 and almost reached the Maastricht threshold the following year. In the last months of 2008 the spread between the interest rates on Italian BTPs and those on German Bunds started to widen, sending a warning signal that expansionary fiscal action in Italy would result in higher financing costs. In this context, in addition to the working of automatic stabilizers, the fiscal stimulus for 2009 was based only on changes in the composition of the budget, leaving the balance broadly unchanged (Hamburg et al., 2011); the stance of fiscal policy became restrictive already in 2010.
'91 '92 '93 '94 '95 '96 '97 '98 '99 '00 '01 '02 '03 '04 '05 '06 '07 '08 '09 '10 '11 '12 '13
85
90
95
100
105
110

24 Antonio Bassanetti, Matteo Bugamelli, Sandro Momigliano, Roberto Sabbatini and Francesco Zollino
Starting in the Summer of 2011, the abrupt and unexpected worsening of the outlook for the world economy heightened investors’ risk aversion and accentuated fears over the soundness of heavily indebted borrowers. In Europe, fears about the sustainability of sovereign debt were triggered not only by the worsening outlook for growth but also by the hesitant policy reaction of the countries in greatest difficulty, as well as by the shortcomings of EU governance in managing systemic risks. Increasing attention was drawn to the worsening of Greece’s financial situation and the fears caused by the announcement of private sector involvement in reducing the country’s public debt. Doubts mounted regarding the ability of the European Financial Stability Facility (EFSF) to cope effectively with a deepening of the crisis. The incomplete construction of the Union’s institutions due to the lack of agreement among national authorities and the slowness of the decision-making process also impacted on the market’s judgement.27 The risk premiums on government securities, measured as the yield spread over German Bunds, increased in particular in countries with high public or private debt and uncertain growth prospects, such as Italy, Spain and, to a lesser extent, Belgium.
In investors’ assessments, Italy was penalized by its high public debt and slow growth, which largely reflected the steady loss of competitiveness. These problems overshadowed the numerous strengths of the Italian economy, such as the prudent conduct of fiscal policy since the start of the global crisis, the solid financial situation of households and firms, the low level of foreign debt, the absence of imbalances in the real estate sector, and the soundness of the banking system (Banca d’Italia, 2011b).
The sovereign debt crisis forced the Italian government to enact – in three rapid steps – a massive fiscal adjustment in the second half of 2011. On top of two packages introduced in July and August, in December a further consolidation was approved, aiming to reassure the financial markets. Overall, the correction amounted to about 3.0 per cent of GDP for 2012, 4.7 per cent for 2013 and 4.9 per cent for 2014. The December package included a far-reaching pension reform, which set more stringent requirements for retirement, thereby immediately strengthening the financial sustainability of the system. The measures virtually completed the lengthy process of adjusting the system to the changed socio-demographic situation and economic growth prospects that had started in the early 1990s. The extension of the contribution-based system to all workers reduced disparity of treatment and linked benefits received more closely to the contributions paid, thereby reducing distortions in the supply of labour. The increases in revenue focused on levies on assets and consumption. Stepping-up taxation of real estate was consistent with government decentralization, as it tightened the link between taxes paid and public services.28
The adverse effects of the sovereign crisis hitting Italy brought the moderate recovery of the economy that had started early in 2010 to a sudden stop. The deterioration of financing conditions (both the increase in the cost of credit and its reduced availability), the impact of the measures enacted to consolidate public finances and the rising economic uncertainty severely curbed domestic demand, which contracted by 7.7 per cent between the third quarter of 2011 and the fourth quarter of 2012. Over the same period, GDP accumulated a loss of 3.7 per cent, implying a fall of over 8 per cent since its peak in early-2008. The most recent forecasts point to a further fall in 2013 (–1.7 per cent according to private analysts’ projections collected in September by Consensus Economics).
Notwithstanding the downturn, the outlook for public finance in Italy has improved considerably thanks to the fiscal correction. In 2012, net borrowing fell to the 3 per cent threshold,
————— 27 See Franco and Zollino (2013) for a review of the evolution of EU governance. 28 The entry into force of the municipal tax (IMP) was brought forward from 2014 to 2012 and the related tax base was significantly
modified by including owner-occupied houses and applying higher adjustment factors to upwardly-revised cadastral income, especially for residential buildings.

The Policy Response to Macroeconomic and Fiscal Imbalances in Italy in the Last Fifteen Years 25
Table 4
Italian Public Finances Aggregates (percentages)
Item 2011 2012 2013 (1)
Primary surplus/GDP 1.2 2.5 2.4
Net borrowing/GDP 3.8 3.0 3.0
Debt/GDP 120.8 127.0 132.9
GDP growth rate 0.4 –2.4 –1.7
Sources: for the final figures, Istat (Consolidated general government account and Gross domestic product) and Banca d’Italia (General government debt). (1) Fiscal targets included in the Update to the Economic and Finance Document published by the Italian government in September 2013; they include the planned payment of general government trade debt.
Table 5
Value Added and Labour Productivity by Sector (percent; annual averages)
Per
cen
tage
of
Tot
al G
ross
V
alu
e A
dd
ed, 2
011
(1)
Gross Value Added (2) Productivity (3)
2000-7 2000-9 2010 2011 2000-7 2000-9 2010 2011
Industry excluding construction
18.6 0.8 –9.2 7.0 1.2 0.8 –3.9 10.4 0.5
of which:
- manufacturing 15.9 0.8 –10.3 7.0 0.6 0.8 –4.7 10.8 –0.2
- supply of electricity gas, steam and air conditioning
1.5 1.8 –0.6 6.9 3.8 4.3 1.6 8.6 5.6
Construction 6.0 2.5 –5.6 –3.0 –3.5 –0.4 –4.9 –0.8 –0.4
Services 73.4 1.4 –1.6 1.4 0.8 0.1 –1.1 1.6 0.3
Total 100.0 1.3 –3.4 2.1 0.6 0.2 –1.9 3.1 0.4
Source: Based on Istat data (national accounts). (1) At base prices, current value. (2) At base prices, chain-linking value. (3) Value added at base prices per standard labour unit; chain-linking value.

26 Antonio Bassanetti, Matteo Bugamelli, Sandro Momigliano, Roberto Sabbatini and Francesco Zollino
fulfilling Italy’s European commitments (Table 4). The primary surplus was 2.5 per cent of GDP (against 1.2 per cent in 2011); it is expected remain broadly stable in 2013.
Overall, the tax burden continued to increase over the period 2008-12 as consolidation measures involved significant action on the revenue side. At present, the tax burden is high both historically and by international comparison: in 2012 it reached 44.0 per cent of GDP, 2.9 percentage points higher than the value for other euro-area countries (European Commission, 2013). In 2011 the fiscal burden on employee income was higher than that of other euro-area countries by more than 5 percentage points (in the case of an unmarried employee; 8 percentage points in the case of a married employee with two dependent children). The 2012 statutory rate on business income exceeded by about 5 percentage points the euro-area average (Eurostat, 2012).
4.1 The reform process
The fiscal consolidation packages were accompanied by a vast programme of structural reforms aimed at fostering growth and productivity.
Starting in the second half of 2011, measures were approved to overhaul the main labour market institutions, to strengthen the education system and private and public research, development and innovation, to foster competition in key services sectors (such as professional services, energy, gas, retail trade and public transportation), to simplify bureaucratic procedures and controls for firms, to improve the efficiency of the judiciary system and to reduce tax evasion.
The wide-ranging labour market reform moved in two major directions: (a) re-establishing a socially efficient balance between differently flexible types of labour contract by reducing employment protection on the open-end contract and curbing abuses in the recourse to other, more flexible arrangements; (b) revising the systems of unemployment insurance and wage supplementation fund to make them better suited to an increasingly dynamic labour market.
As for the education system, provisions for a national evaluation system were introduced which, among other things, envisaged for the first time a self-assessment by each school as well as an evaluation of the school managers’ performance.
Renewed attention was given to the need to support research, development and innovation by both the private sector and the universities. A specific law was dedicated to improving conditions for the development and financing of innovative start-up firms.
A set of liberalizations in crucial service sectors (professional services, gas and retail among others) was approved. The measures included strengthening the powers of the antitrust authority, creating an independent authority in charge of regulating access to network infrastructures, and setting tariffs as well as quality standards in the transport sector. The procedure to set up a business activity was streamlined and unnecessary authorizations and ex ante controls were eliminated.
Significant cuts in administrative burdens for firms relating to environmental, labour, public procurement and privacy regulations were provided for.
A wide set of measures was adopted to improve the working of the civil courts and to speed up judicial proceedings. They included the reorganization of judicial districts; the creation of specialized courts dealing with company law disputes; the introduction of compulsory conciliation procedures; and plans to reduce the courts’ backlogs.
The economic impact of these reforms is hard to evaluate as they enhance potential output growth in the medium term and the boost to actual growth may take some time to emerge. According to simulations run by the OECD (2013a), full implementation of the measures already approved would stimulate GDP growth by about 5 percentage points in a ten-year horizon; the order of magnitude
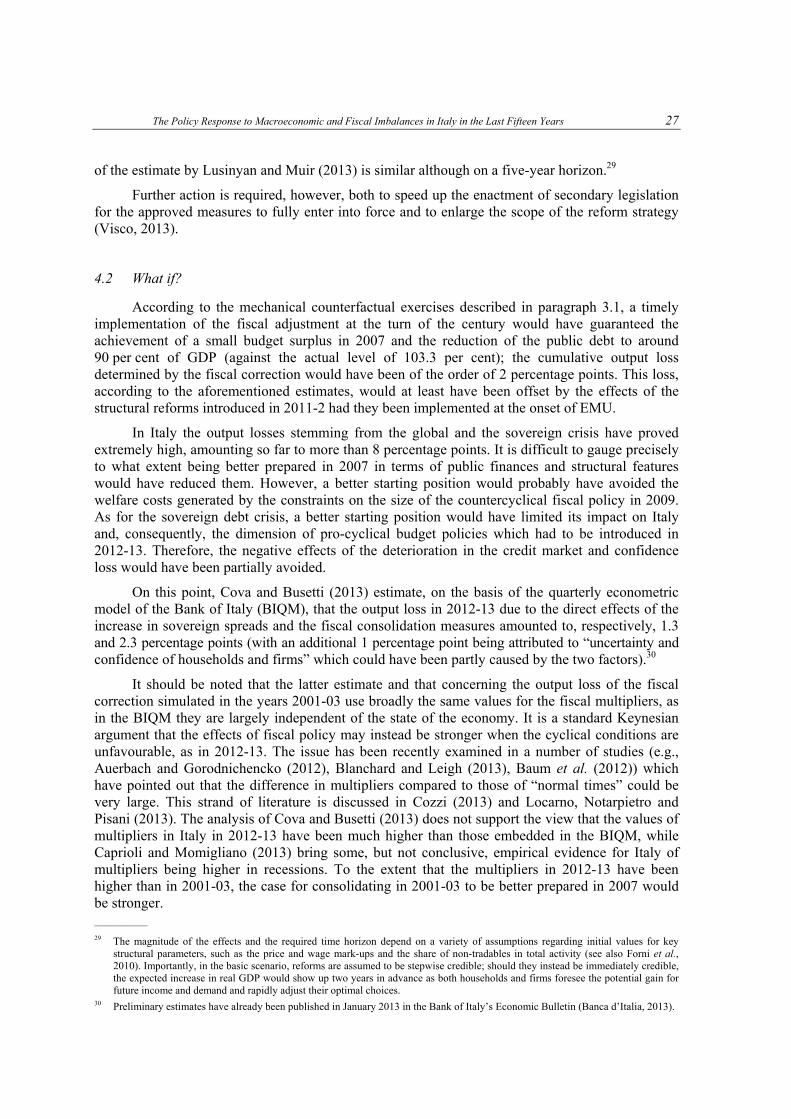
The Policy Response to Macroeconomic and Fiscal Imbalances in Italy in the Last Fifteen Years 27
of the estimate by Lusinyan and Muir (2013) is similar although on a five-year horizon.29
Further action is required, however, both to speed up the enactment of secondary legislation for the approved measures to fully enter into force and to enlarge the scope of the reform strategy (Visco, 2013).
4.2 What if?
According to the mechanical counterfactual exercises described in paragraph 3.1, a timely implementation of the fiscal adjustment at the turn of the century would have guaranteed the achievement of a small budget surplus in 2007 and the reduction of the public debt to around 90 per cent of GDP (against the actual level of 103.3 per cent); the cumulative output loss determined by the fiscal correction would have been of the order of 2 percentage points. This loss, according to the aforementioned estimates, would at least have been offset by the effects of the structural reforms introduced in 2011-2 had they been implemented at the onset of EMU.
In Italy the output losses stemming from the global and the sovereign crisis have proved extremely high, amounting so far to more than 8 percentage points. It is difficult to gauge precisely to what extent being better prepared in 2007 in terms of public finances and structural features would have reduced them. However, a better starting position would probably have avoided the welfare costs generated by the constraints on the size of the countercyclical fiscal policy in 2009. As for the sovereign debt crisis, a better starting position would have limited its impact on Italy and, consequently, the dimension of pro-cyclical budget policies which had to be introduced in 2012-13. Therefore, the negative effects of the deterioration in the credit market and confidence loss would have been partially avoided.
On this point, Cova and Busetti (2013) estimate, on the basis of the quarterly econometric model of the Bank of Italy (BIQM), that the output loss in 2012-13 due to the direct effects of the increase in sovereign spreads and the fiscal consolidation measures amounted to, respectively, 1.3 and 2.3 percentage points (with an additional 1 percentage point being attributed to “uncertainty and confidence of households and firms” which could have been partly caused by the two factors).30
It should be noted that the latter estimate and that concerning the output loss of the fiscal correction simulated in the years 2001-03 use broadly the same values for the fiscal multipliers, as in the BIQM they are largely independent of the state of the economy. It is a standard Keynesian argument that the effects of fiscal policy may instead be stronger when the cyclical conditions are unfavourable, as in 2012-13. The issue has been recently examined in a number of studies (e.g., Auerbach and Gorodnichencko (2012), Blanchard and Leigh (2013), Baum et al. (2012)) which have pointed out that the difference in multipliers compared to those of “normal times” could be very large. This strand of literature is discussed in Cozzi (2013) and Locarno, Notarpietro and Pisani (2013). The analysis of Cova and Busetti (2013) does not support the view that the values of multipliers in Italy in 2012-13 have been much higher than those embedded in the BIQM, while Caprioli and Momigliano (2013) bring some, but not conclusive, empirical evidence for Italy of multipliers being higher in recessions. To the extent that the multipliers in 2012-13 have been higher than in 2001-03, the case for consolidating in 2001-03 to be better prepared in 2007 would be stronger.
————— 29 The magnitude of the effects and the required time horizon depend on a variety of assumptions regarding initial values for key
structural parameters, such as the price and wage mark-ups and the share of non-tradables in total activity (see also Forni et al., 2010). Importantly, in the basic scenario, reforms are assumed to be stepwise credible; should they instead be immediately credible, the expected increase in real GDP would show up two years in advance as both households and firms foresee the potential gain for future income and demand and rapidly adjust their optimal choices.
30 Preliminary estimates have already been published in January 2013 in the Bank of Italy’s Economic Bulletin (Banca d’Italia, 2013).
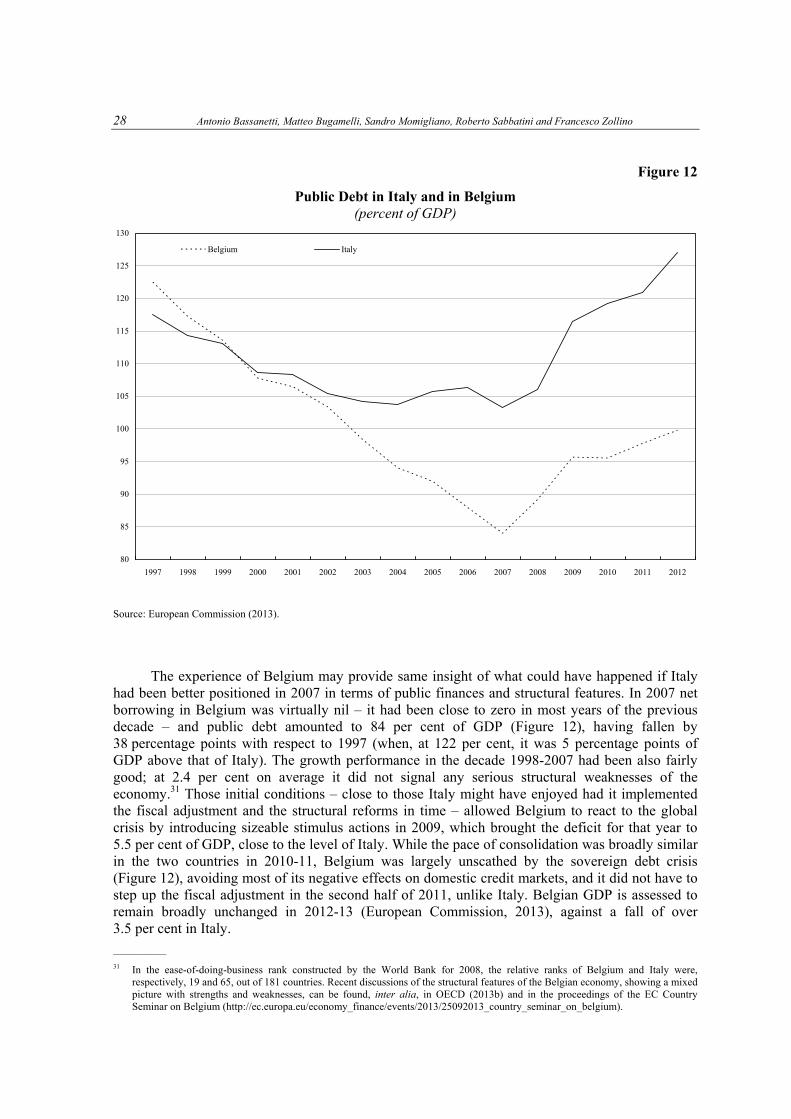
28 Antonio Bassanetti, Matteo Bugamelli, Sandro Momigliano, Roberto Sabbatini and Francesco Zollino
Figure 12
Public Debt in Italy and in Belgium (percent of GDP)
Source: European Commission (2013).
The experience of Belgium may provide same insight of what could have happened if Italy
had been better positioned in 2007 in terms of public finances and structural features. In 2007 net borrowing in Belgium was virtually nil – it had been close to zero in most years of the previous decade – and public debt amounted to 84 per cent of GDP (Figure 12), having fallen by 38 percentage points with respect to 1997 (when, at 122 per cent, it was 5 percentage points of GDP above that of Italy). The growth performance in the decade 1998-2007 had been also fairly good; at 2.4 per cent on average it did not signal any serious structural weaknesses of the economy.31 Those initial conditions – close to those Italy might have enjoyed had it implemented the fiscal adjustment and the structural reforms in time – allowed Belgium to react to the global crisis by introducing sizeable stimulus actions in 2009, which brought the deficit for that year to 5.5 per cent of GDP, close to the level of Italy. While the pace of consolidation was broadly similar in the two countries in 2010-11, Belgium was largely unscathed by the sovereign debt crisis (Figure 12), avoiding most of its negative effects on domestic credit markets, and it did not have to step up the fiscal adjustment in the second half of 2011, unlike Italy. Belgian GDP is assessed to remain broadly unchanged in 2012-13 (European Commission, 2013), against a fall of over 3.5 per cent in Italy.
————— 31 In the ease-of-doing-business rank constructed by the World Bank for 2008, the relative ranks of Belgium and Italy were,
respectively, 19 and 65, out of 181 countries. Recent discussions of the structural features of the Belgian economy, showing a mixed picture with strengths and weaknesses, can be found, inter alia, in OECD (2013b) and in the proceedings of the EC Country Seminar on Belgium (http://ec.europa.eu/economy_finance/events/2013/25092013_country_seminar_on_belgium).
80
85
90
95
100
105
110
115
120
125
130
1997 1998 1999 2000 2001 2002 2003 2004 2005 2006 2007 2008 2009 2010 2011 2012
Belgium Italy
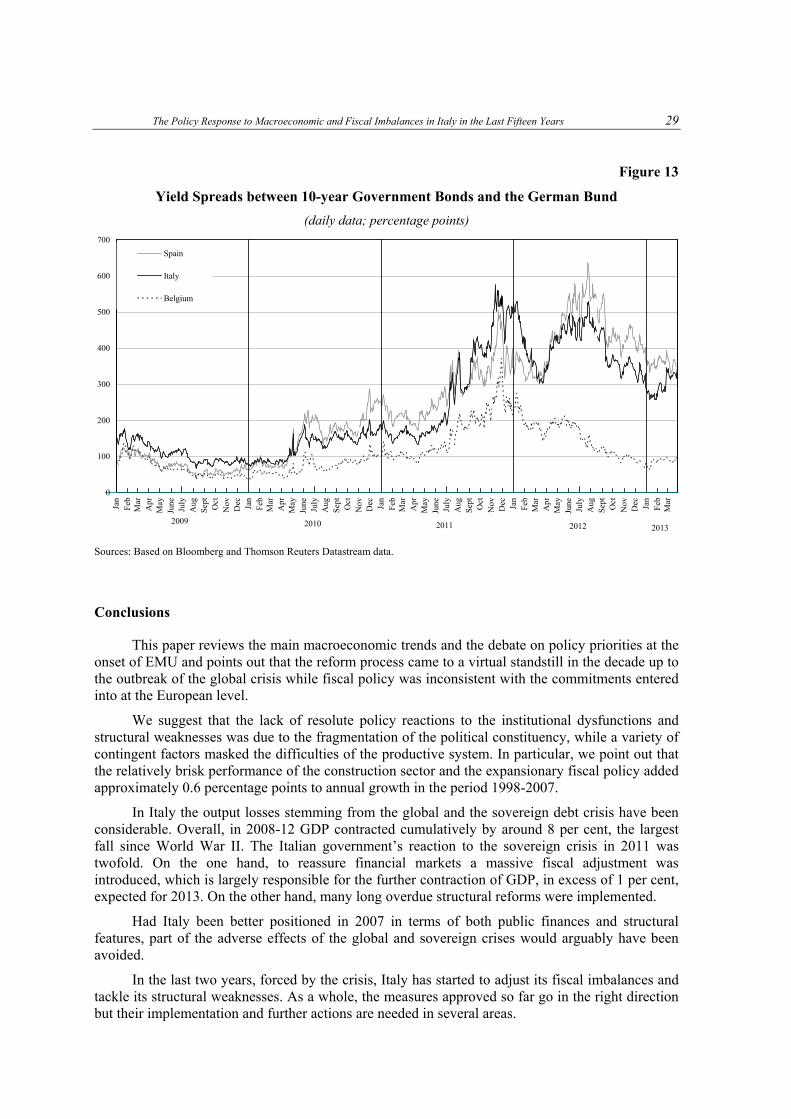
The Policy Response to Macroeconomic and Fiscal Imbalances in Italy in the Last Fifteen Years 29
Figure 13
Yield Spreads between 10-year Government Bonds and the German Bund
(daily data; percentage points)
Sources: Based on Bloomberg and Thomson Reuters Datastream data.
Conclusions
This paper reviews the main macroeconomic trends and the debate on policy priorities at the onset of EMU and points out that the reform process came to a virtual standstill in the decade up to the outbreak of the global crisis while fiscal policy was inconsistent with the commitments entered into at the European level.
We suggest that the lack of resolute policy reactions to the institutional dysfunctions and structural weaknesses was due to the fragmentation of the political constituency, while a variety of contingent factors masked the difficulties of the productive system. In particular, we point out that the relatively brisk performance of the construction sector and the expansionary fiscal policy added approximately 0.6 percentage points to annual growth in the period 1998-2007.
In Italy the output losses stemming from the global and the sovereign debt crisis have been considerable. Overall, in 2008-12 GDP contracted cumulatively by around 8 per cent, the largest fall since World War II. The Italian government’s reaction to the sovereign crisis in 2011 was twofold. On the one hand, to reassure financial markets a massive fiscal adjustment was introduced, which is largely responsible for the further contraction of GDP, in excess of 1 per cent, expected for 2013. On the other hand, many long overdue structural reforms were implemented.
Had Italy been better positioned in 2007 in terms of both public finances and structural features, part of the adverse effects of the global and sovereign crises would arguably have been avoided.
In the last two years, forced by the crisis, Italy has started to adjust its fiscal imbalances and tackle its structural weaknesses. As a whole, the measures approved so far go in the right direction but their implementation and further actions are needed in several areas.
Apr
May
July
Mar
Sept
Feb Oct
Aug
JuneJan
Nov
Dec Jan
Feb
Mar
Apr
May
June
July
Aug
Sept
Oct
Nov
Dec Jan
Feb
Mar
Apr
May
June
July
Aug
Sept
Oct
Nov
Dec Jan
Feb
Mar
Apr
May
June
July
Aug
Sept
Oct
Nov
Dec
FebJan
Mar
20132012201120102009
0
100
200
300
400
500
600
700
Spain
Italy
Belgium

30 Antonio Bassanetti, Matteo Bugamelli, Sandro Momigliano, Roberto Sabbatini and Francesco Zollino
REFERENCES
Accetturo, A., A. Bassanetti., M. Bugamelli, I. Faiella, P. Finaldi Russo, D. Franco, S. Giacomelli and M. Omiccioli (2013), “Il sistema industriale italiano tra globalizzazione e crisi”, Banca d’Italia, Questioni di Economia e Finanza, No. 193, July.
Amatori, F., M. Bugamelli e A. Colli (2013), “Italian Firms in History: Size, Technology and Entrepreneurship”, in G. Toniolo (ed.), Oxford Handbook of the Italian Economy Since Unification, Oxford University Press.
Auerbach, A.J. and Y. Gorodnichenko (2012), “Measuring the Output Responses to Fiscal Policy”, American Economic Journal: Economic Policy, Vol. 4, pp. 1-27.
Balassone, F, D. Franco, D. Monacelli and S. Momigliano (2002), “Italy: Fiscal Consolidation and Its Legacy”, in Banca d’Italia (ed.), The Impact of Fiscal Policy, proceedings of Banca d’Italia’s workshop held in Perugia, 21-23 March.
Balassone, F., S. Momigliano and P. Rizza (2011), “Italy: Medium-term Fiscal Planning and Frequent Government Changes”, in P. Mauro (ed.), Chipping Away at Public Debt, International Monetary Fund, John Wiley & Sons.
Banca d’Italia (2002), Annual Report, May.
————— (2007), Annual Report, May.
————— (2011a), Le infrastrutture in Italia: dotazione, programmazione, realizzazione, Banca d’Italia, April.
————— (2011b), Financial Stability Report, November.
————— (2013), Economic Bulletin, January.
Baum, A., M. Poplawski-Ribeiro and A. Weber (2012), “Fiscal Multipliers and the State of the Economy”, IMF, Working Paper, No. 12/286, December.
Bertola, G. and P. Sestito (2012), “Human Capital”, in G. Toniolo (ed.), Oxford Handbook of the Italian Economy Since Unification.
Bianco, M., S. Giacomelli and G. Rodano (2012), “Concorrenza e regolamentazione in Italia”, Banca d’Italia, Questioni di Economia e Finanza, No. 123, April.
Blanchard, O.J. and D. Leigh (2013), “Growth Forecast Errors and Fiscal Multipliers”, IMF, Working Paper, No. 13/1, January.
Blinder, A. (2005), “Fear of Offshoring”, CEPS, Working Paper, No. 119.
Bobbio, E., A. Brandolini, F. Colonna, F. D’Amuri, A. Rosolia, R. Torrini and R. Zizza (2011), “Partecipazione al lavoro e inclusione sociale: aspetti critici e possibili interventi”, paper presented at the workshop Europa 2020: Quali riforme strutturali per l’Italia?, Banca d’Italia, 21 April.
Boeri, T., R. Faini, A. Ichino, G. Pisauro and C. Scarpa (2005) Oltre il declino, Il Mulino, Bologna.
Bordignon, M. and G. Turati (2009), “Bailing Out Expectations and Public Health Expenditure”, Journal of Health Economics, Elsevier, Vol. 28, No. 2, pp. 305-21.
Brandolini, A. and M. Bugamelli (eds.) (2009), “Reports on Trends in the Italian Productive System”, Banca d’Italia, Questioni di economia e finanza, No. 45, April.
Brandolini, A., P. Casadio, P. Cipollone, M. Magnani, A. Rosolia and R. Torrini (2007), “Employment Growth in Italy in the 1990s: Institutional Arrangements and Market Forces”,

The Policy Response to Macroeconomic and Fiscal Imbalances in Italy in the Last Fifteen Years 31
in N. Acocella and R. Leoni (eds.), Social Pacts, Employment and Growth. A Reappraisal of Ezio Tarantelli’s Thought, pp. 31-68, Heidelberg, Physica Verlag.
Busetti, F. and P. Cova (2013), “L’impatto macroeconomico della crisi del debito sovrano: un’analisi contro fattuale per l’economia italiana”, Banca d’Italia, Questioni di Economia e Finanza, forthcoming.
Busetti, F., A. Locarno and L. Monteforte (2005), “The Bank of Italy’s Quarterly Model”, in G. Fagan and J. Morgan (eds.), Econometric Models of the Euro-area Central Banks, Edward Elgar, Cheltenham (UK).
Caivano, M., L. Rodano and S. Siviero (2010), “La trasmissione della crisi finanziaria globale all’economia italiana. Un’indagine contro-fattuale, 2008-2010”, Banca d’Italia, Questioni di Economia e Finanza, No. 64, April.
Cappariello, R., G. Ortolani and V. Pellegrini (2012), “Le nuove statistiche di bilancia dei pagamenti e posizione verso l’estero dell’Italia: metodologie e risultati”, Banca d’Italia, Questioni di Economia e Finanza, No. 138, October.
Caprioli, F. and S. Momigliano (2013), The macroeconomic effects of expenditure shocks during good and bad times, proceedings of Banca d’Italia’s workshop The Sovereign Debt Crisis and the Euro Area, held in Rome on February 15; available at http://www.bancaditalia.it/ studiricerche/convegni/atti/sovereign_debt/
Caroppo, M.S. and G. Turati (2007), “I sistemi sanitari regionali in Italia. Riflessioni in una prospettiva di lungo periodo”, Vita e pensiero.
Checchi, D. and F. Zollino (2001), “Struttura del sistema scolastico e selezione sociale”, Rivista di Politica Economica, pp. 43-84, July-August.
Cipollone, P., P. Montanaro and P. Sestito (2012), “Il capitale umano per la crescita economica: possibili percorsi di miglioramento del sistema d’istruzione in Italia”, Banca d’Italia, Questioni di Economia e Finanza, No. 122, April.
Cipollone, P. and I. Visco (2007), “Il merito nella società della conoscenza”, Il Mulino, No. 1, pp. 21-34.
Cozzi, T. (2013), “La crisi e i moltiplicatori fiscali”, Moneta e credito, Vol. 66, No. 262, pp. 129-51.
Crafts, N. and M. Magnani (2013), “The Golden Age and the Second Globalization in Italy”, in G. Toniolo (ed.), Oxford Handbook of the Italian Economy Since Unification, Oxford University Press.
Del Giovane, P. and R. Sabbatini (2008), The Euro, Inflativo and Consumers’ Perceptions, Springer-Verlag, Berlin.
European Commission (2013), Winter Forecasts, February,
Eurostat (2012), Taxation Trends in the European Union, Luxembourg.
Faini, R. (2004), “Fu vero declino? L’Italia degli anni novanta”, in G. Toniolo and V. Visco (eds.), Il declino economico dell’Italia. Cause e rimedi, Milano, Bruno Mondadori.
Faini, R. and A. Sapir (2005), “Un modello obsoleto? Crescita e specializzazione dell’economia italiana”, in T. Boeri, R. Faini, A. Ichino, G. Pisauro and C. Scarpa (eds.), Oltre il declino, Bologna, Il Mulino.
Fornero, E. (2018), “Stop and go nel processo italiano di riforma del sistema previdenziale”, in S. Pirrone (ed.), Flessibilità e sicurezze, Il Mulino, AREL.

32 Antonio Bassanetti, Matteo Bugamelli, Sandro Momigliano, Roberto Sabbatini and Francesco Zollino
Forni, L., A. Gerali and M. Pisani (2010), “The Macroeconomics of Fiscal Consolidations in a Monetary Union: The Case of Italy”, Banca d’Italia, Temi di Discussione, No. 747.
Franco, D. and F. Zollino (2013), “Macroeconomic Imbalances in Europe: Institutional Progresses and Remaining Challenges”, Applied Economics, forthcoming.
Galli, G.P., D. Terlizzese and I. Visco (1989), “Un modello trimestrale per la previsione e la politica economica: le proprietà di breve e di lungo periodo del modello della Banca d’Italia”, Politica Economica, Vol. 5, No.1, pp. 3-52.
Giacomelli, S. and C. Menon (2013), “Firm Size and Judicial Efficiency: Evidence from the Neighbour’s Court”, Banca d’Italia, Temi di Discussione, No. 898, January.
Giordano, C. and F. Zollino (2013), “Going Beyond the Mystery of Italy’s Price Competitiveness Indicators”, Voxeu, 18 July.
Giordano, R., M. Pericoli and P. Tommasino (2013), “Pure or Wake-up-call Contagion? Another Look at the EMU Sovereign Debt Crisis”, International Finance, forthcoming.
Hamburg, B., S. Momigliano, B. Manzke and S. Siviero (2010), “The Reaction of Fiscal Policy to the Crisis in Italy and Germany: Are They Really Polar Cases in the European Context?”, in Banca d’Italia (ed.), Fiscal Policy: Lessons from the Crisis, proceedings of Banca d’Italia’s workshop held in Perugia, 25-27 March.
Locarno, A., A. Notarpietro and M. Pisani (2013), “Fiscal Multipliers, Monetary Policy and Sovereign Risk: A Structural Model-based Assessment”, Banca d’Italia, mimeo.
Lotti, F. and E. Viviano (2012), “Why Hiring Temporary Workers”, Banca d’Italia, mimeo.
Lusinyan, L. and D. Muir (2013), “Assessing the Macroeconomic Impact of Structural Reforms: The Case of Italy”, IMF, Working Paper, No. WP/13/22, January.
Marino, M.R., S. Momigliano and P. Rizza (2008), “A Structural Analysis of Italy’s Fiscal Policies after Joining the Monetary Union: Are We learning from Our Past?”, Public Finance and Management, Vol. 8, No. 3, pp. 451-501.
Momigliano, S. and P. Rizza (2007), “Temporary Measures in Italy: Buying or Losing Time?”, in Magyar Nemzeti Bank (ed.), Temporary Measures and Off-budget Activities.
Morcaldo, G. (2007), “Pensioni: necessità di una riforma”, available at: http://www.bancaditalia.it/ interventi/ altri_int/2007/morcaldo_pensioni.pdf
Nobili, A. and F. Zollino (2012), A Structural Model for the Housing and Credit Markets in Italy, Banca d’Italia, mimeo.
OECD (2000), Economic Survey of Italy, Paris.
————— (2007a), Staying Competitive in the Global Economy: Moving Up the Value Chain, Paris.
————— (2007b), Economic Survey of Italy, Paris.
————— (2009), Economic Survey of Italy, Paris.
————— (2010), Going for Growth, Paris.
————— (2013a), Economic surveys Italy, Paris.
————— (2013b), Economic surveys Belgium, Paris.
Persson, T. and G. Tabellini (2004), “Constitutional Rules and Fiscal Policy Outcomes”, American Economic Review, pp. 25-45, March.

The Policy Response to Macroeconomic and Fiscal Imbalances in Italy in the Last Fifteen Years 33
Sabbatini, R. and F. Zollino (2010), “Macroeconomic Trends and Reforms in Germany”, PSL Quarterly Review, Vol. 63, No. 254, pp. 235-63.
Schizzerotto, A. and S. Marzadoro (2008), “Social Mobility in Italy since the Beginning of the Twentieth Century”, Rivista di Politica Economica, pp. 5-40.
Visco, I. (1996), “La competitività delle imprese italiane nella prospettiva economica dell’Unione Europea”, Il Mulino, Vol. 45, No. 5, pp. 930-39.
————— (2009), Investire in conoscenza – Per la crescita economica, Il Mulino, Bologna, Ch. 3.
————— (2013), Concluding Remarks, Banca d’Italia, Annual Report on 2012, May.
WTO (2008), World Trade Report 2008, Trade in a Globalizing World, World Trade Organization, Geneva.
